Article

Numerical and Experimental Analysis of Internal Flow Characteristics of Four-Way Opposing Diaphragm Pump

1
National Research Center of Pumps, Jiangsu University, Zhenjiang 212013, China
2
Shenzhen Angel Drinking Water Industrial Group Corporation, Shenzhen 518108, China
3
College of Navigation, Jiujiang Polytechnic University of Science and Technology, Jiujiang 332000, China
*
Author to whom correspondence should be addressed.
Water 2025, 17(21), 3094; https://doi.org/10.3390/w17213094
Submission received: 24 September 2025 / Revised: 11 October 2025 / Accepted: 27 October 2025 / Published: 29 October 2025
(This article belongs to the Special Issue Hydrodynamics Science Experiments and Simulations, 2nd Edition)

Abstract

This study investigates the steady-state behavior of a four-way opposed diaphragm pump. Simulations and experimental results confirm that peak stress locations align with observed damage sites. During the return stroke, diaphragm flipping induces tension at the flow-fixed interface edges, creating stress concentrations that contribute to fatigue and failure. Particle image velocimetry (PIV) shows that, under constant flow, increased voltage enhances umbrella valve opening, accelerates movement, broadens flow distribution, and disrupts symmetry. At 90°, valve-edge velocity exhibits sharp, high-amplitude oscillations and a narrow, elongated return region. Vortices near the valve port interfere with fluid motion, causing pressure fluctuations and potential sealing issues or increased opening resistance. Higher flow rates intensify vortex strength and shift their position, generating diaphragm pressure differentials that alter flow direction and velocity, reducing stability and inducing secondary vortices. Compared to a modified diaphragm, the standard type shows more complex vortex structures, greater flow instability, and dynamic response degradation under identical pressure and varying flow. These fragmented vortices further disrupt flow, affecting pump performance. The findings provide design insights for diaphragm pump optimization.

1. Introduction

The diaphragm pump is a core component of water purification systems, comprising a corrosion-resistant flexible diaphragm and a driving mechanism that transmits water through reciprocating motion. It features strong self-priming capability, low noise, and stable operation. Working in conjunction with the filter element, it plays a critical role in water purification, with its performance directly influencing overall system efficiency and stability. As demand for water purifiers increases and their applications expand across fields such as chemical processing, pharmaceuticals, and food manufacturing, performance requirements continue to rise.
The efficiency of diaphragm pumps depends largely on structural design and material selection. Key material properties, including chemical stability, wear resistance, aging resistance, and geometric precision, must be considered for their impact on flow and pressure. Structural simulation and numerical analysis provide effective means for optimizing pump design to meet evolving performance demands.
Diaphragm pump technologies have made significant advances in materials, design, manufacturing processes, and intelligent control. In the area of materials, researchers have focused on developing high-performance diaphragms to improve durability and reliability under diverse operating conditions. For instance, specialized materials have been engineered for specific environments. Khattak et al. [1] compared the properties of two magnetostrictive materials, Metglas and Galfenol, exploring their suitability as diaphragm materials. Anis and Meldrum [2] found that the diaphragm’s thickness and elastic modulus significantly influence the response time and flow rate in piezoelectric-driven pumps. Taylor and Velásquez-García [3] realized a fully additively manufactured multi-material micro diaphragm pump, while Amiri et al. [4] derived vibration control equations for diaphragms made from magnetoelastic materials. Van et al. [5] experimentally and numerically predicted diaphragm deformation and strain.
In terms of design, structural optimization through fluid dynamic analysis has improved flow channel configuration and diaphragm motion, enhancing performance. Redundant system designs and fault warning mechanisms have been implemented to increase reliability. Various innovative concepts have emerged: Skupień et al. [6] proposed an electromagnetic diaphragm pump controlled by an Arduino Nano; Ma et al. [7] developed a piezoelectric dual-crystal-driven microfluidic pump; Taylor et al. [8,9] demonstrated a fully additively manufactured micro diaphragm vacuum pump; Jiang et al. [10] designed a dual-cavity pocket pump; Yang et al. [11] developed a micro diaphragm pump for SCR systems and explored electrostatic diaphragm compressors for micro refrigeration.
Advanced manufacturing technologies, including precision casting, CNC machining, and laser welding, have improved production accuracy. Additive manufacturing, particularly 3D printing, has seen widespread adoption. Thomas et al. [12] developed wearable 3D-printed microfluidic pumps, Jairazbhoy et al. [13] proposed a pneumatic diaphragm pump model, Yang et al. [14] introduced micrometal molding techniques, Masse et al. [15] established a mathematical model for pneumatic dual-diaphragm pumps, Sakamoto et al. [16] used a PZT-Si composite process to fabricate valveless micropump diaphragms, Lee et al. [17] designed an IPMC-based valveless micropump, and Lee et al. [18] applied ultrasonic thermoforming to reduce manufacturing time.
Intelligent control integrates sensors with advanced algorithms to enable real-time monitoring and precise operation. Cao et al. [19] developed a magnetically coupled, dielectric elastomer-driven pneumatic diaphragm pump. Ping et al. [20] utilized control algorithms to stabilize the isentropic efficiency of pumps, while Abe et al. [21] applied reinforcement learning to determine optimal operating sequences in microperistaltic pumps. Truong et al. [22] proposed a control strategy to mitigate driver hysteresis effects. Moreover, automated processing of PIV flow field data supports performance optimization and fault diagnosis. For example, Sato et al. [23] used CFD and PIV techniques to analyze flow fields in central flow pumps. Micromanufacturing and microfluidic technologies are gaining prominence in micropump development. Van et al. [24] advanced the design of oscillating micropumps, highlighting the growing importance of micro-scale fluid control in emerging applications.
Research on diaphragm pump technology, both internationally and domestically, is progressing towards more efficient, intelligent, and environmentally sustainable solutions. International efforts have focused on optimizing pump structures to enhance flow rate, head, and overall efficiency while minimizing fluid resistance. Innovations in precision machining, additive manufacturing, and advanced surface treatments have significantly improved component durability and machining accuracy. Furthermore, the integration of smart sensors and adaptive control algorithms enables real-time flow regulation and predictive fault diagnosis, thereby enhancing operational reliability. Domestically, considerable advancements have been made in the application of new materials, structural optimization, performance enhancement, and intelligent control systems. These developments form a strong foundation for the ongoing evolution of diaphragm pumps, paving the way for more efficient, smarter, and greener technologies in the future.

2. Geometry and Working Principles of the Pump

The main parameters of the four-way opposed balanced diaphragm used in this study are shown in Table 1. Its diaphragm is a rubber diaphragm, and the working principle is based on the rotation of the motor rotor and the movement of the eccentric cam. The eccentric cam converts the rotational motion of the motor into reciprocating motion of the moving assembly, which is rigidly coupled to the cam. This reciprocating motion, in turn, drives the diaphragm to undergo simultaneous reciprocating movement, generating a cyclic suction and compression effect on the umbrella valve.
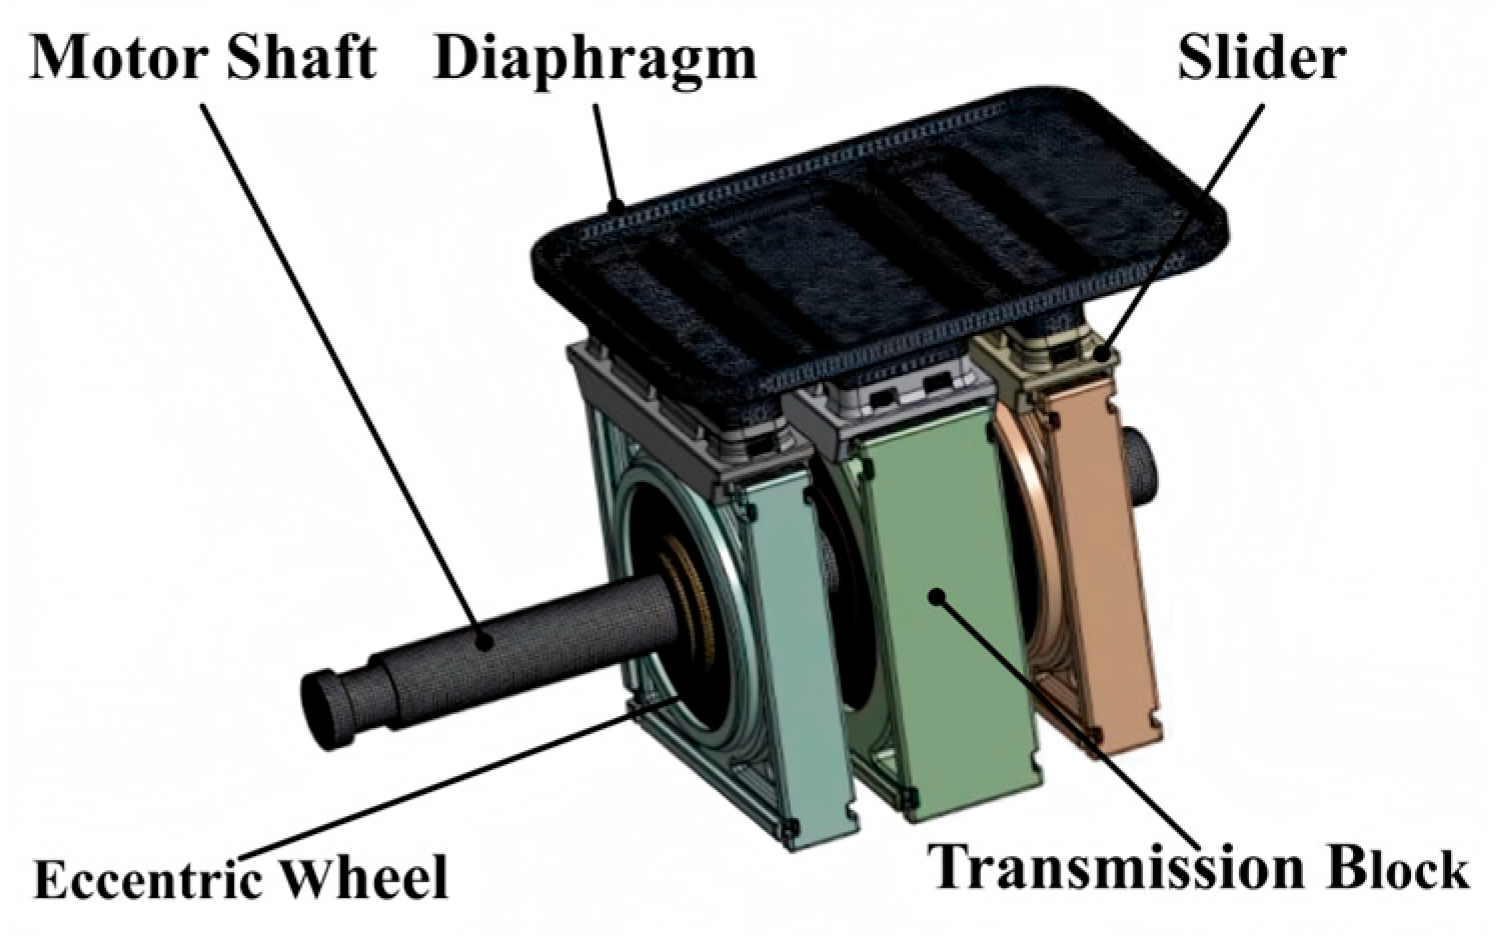
The appearance and internal structure of the four-way opposing balanced diaphragm pump are depicted in Figure 1. The axis is defined as the direction parallel to the motor shaft’s axial direction, while the plane is oriented parallel to the cross-section of the motor shaft.
The main components of this diaphragm pump include the motor shaft, eccentric wheel, transmission block, slider, bearing, diaphragm, and other related parts. During operation, the diaphragm experiences periodic pressure pulsations, which induce vibrations in the motor shaft, transmission blocks, eccentric wheel, and other components connected to the shaft, thereby generating noise.
The working principle of the pump is as follows: the three eccentric wheels are mounted on the motor shaft, where the rotation of the shaft drives the eccentric wheels to perform eccentric motion. This motion, in turn, drives the transmission block through the bearing. The transmission block and slider are designed to slide relative to each other, converting the inclined motion of the transmission block into a radial reciprocating motion of the slider. Figure 2 presents a schematic diagram of the pump diaphragm used in this study, clearly illustrating its geometric structure. The diaphragm consists of three movable sections, each rigidly connected to the slider. The radial reciprocating motion of the slider drives the diaphragm to expand and compress, thereby facilitating the pump’s inlet and outlet functions.

3. Flow Field Simulation and Static Analysis Boundary Conditions

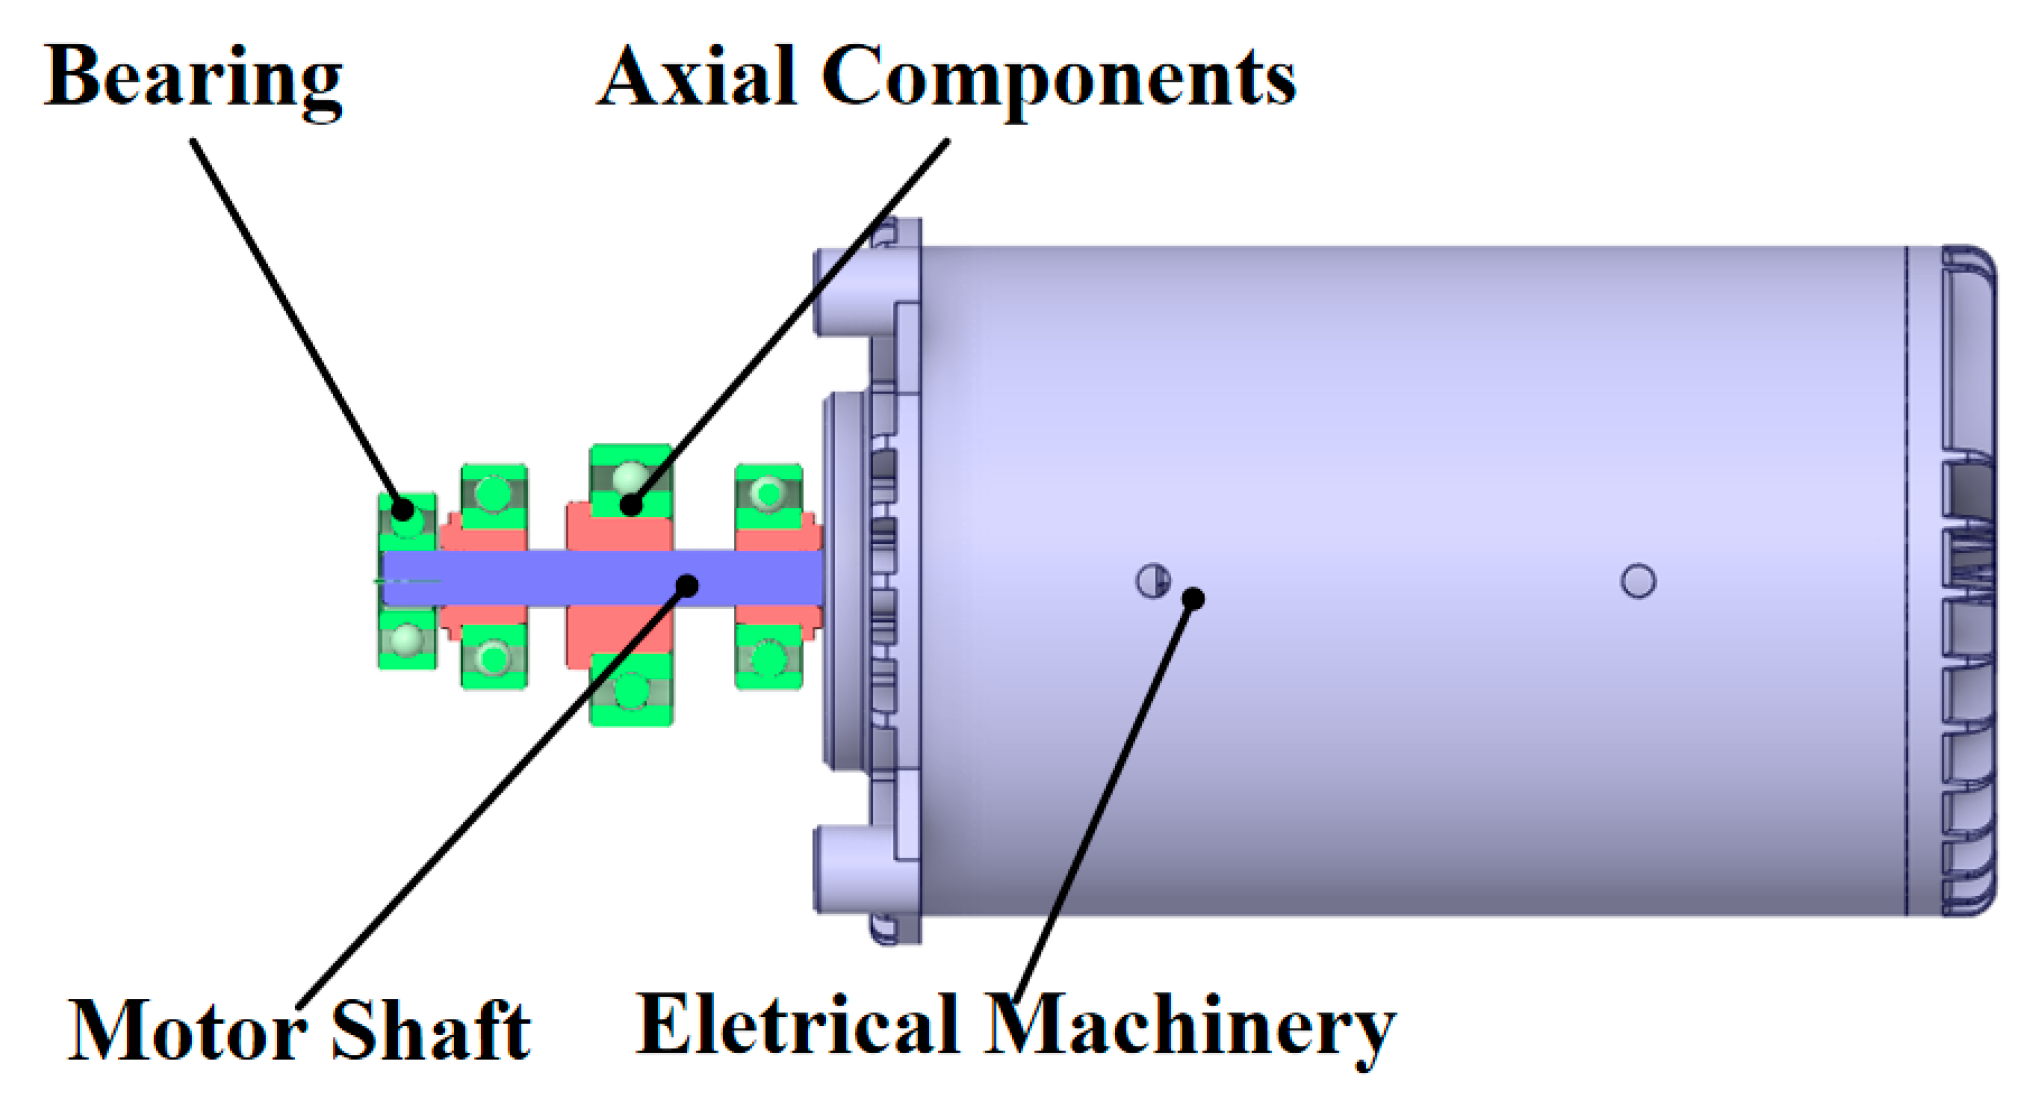
To simulate the diaphragm’s behavior during pumping, interactions of all components directly or indirectly affecting the diaphragm are translated into analytical conditions at the three-dimensional grid nodes. Figure 3 illustrates the motor shaft system model in the simulation software. This model includes key components such as eccentric wheels, transmission blocks, bearings, sliders, and diaphragms. The left end of the motor shaft is connected to the pump body casing through a bearing, while the right end connects to the motor. These motor shaft components serve as the primary load-bearing elements of the pump.

4. Numerical Analysis of Diaphragm Deformation and Stress

4.1. Simulation Model

This paper investigates the deformation behavior of the diaphragm in a four-way, opposite balanced diaphragm pump used in a water purifier system with a flow rate of 4000 mL/min and a working pressure of 70 Psi. Through a comprehensive analysis of the pump’s internal structure and operational principles, a simplified approach to the three-dimensional simulation model of the pump is proposed. The resulting model encompasses the diaphragm, drive wheel, housing, and sliding blocks, facilitating a more efficient analysis of the pump’s performance during operation. Since the diaphragm pump adopts a completely symmetrical geometric structure design, in order to save computing resources and improve simulation efficiency, only 1/4 of its geometric model is calculated and analyzed during numerical simulation. During the meshing process, taking into account the complexity of the model structure and the requirements for computational accuracy, the highly adaptable tetrahedral element type was selected to discretize the entire computational domain. Figure 4 clearly shows the simplified geometric model of the diaphragm pump and its corresponding tetrahedral meshing renderings.
The specific parameters of the four-way, opposing balanced diaphragm pump are as follows: the inlet pressure is set at 30 Psi, and the outlet pressure is 100 Psi. The diaphragm is constructed from rubber, and its material properties are modeled using the three-parameter Yeoh third-order constitutive model. All other components are made of structural steel.

4.2. Load and Boundary Conditions

4.2.1. Solid Boundary Conditions

Full constraints are applied to the support housing to ensure its relative immobility with respect to the ground. A contact pair is defined between the diaphragm and the upper housing to limit diaphragm lift. Similarly, contact pairs are established between the diaphragm and the support housing, the diaphragm and the iron core, and the diaphragm and the diaphragm fixing nails, all to restrict the diaphragm’s upward displacement. A partial constraint is applied to the cam, restricting its free translation along the y-axis and prohibiting relative rotation around both the x- and z-axes, thus allowing rotation solely in the y-direction. Additionally, a partial constraint is imposed on the iron core to prevent its rotation along the y-axis. The gravitational effects on all components of the three-chamber diaphragm pump are also considered.

4.2.2. Load Conditions

A constraint is applied to the upper case in the y-axis direction to limit its vertical displacement. Similarly, a constraint is applied to the diaphragm fixing nail in the y-axis direction to restrict the diaphragm’s lift. Additionally, a pressure of 0.7 MPa is applied in the positive direction of the diaphragm to simulate the fluid force acting on the diaphragm.

5. Numerical Analysis of Diaphragm Stress and Internal Flow Field Simulation

5.1. Numerical Analysis of Diaphragm Stress

The static structural module in ANSYS 2021 R1 software was used to simulate the steady-state structural behavior of the diaphragm pump. By modeling a complete cam rotation cycle, contour plots of diaphragm stress and deformation during operation were generated, and the maximum stress and deformation values were extracted.
Figure 5 and Figure 6 show the diaphragm deformation and pressure cloud diagrams of the diaphragm pump. During the static analysis of the diaphragm, the maximum operational stress was found to be 8.64 MPa, located at the lower edge of the fluid–structure coupling interface. At the same location, the maximum displacement was recorded as 0.134 mm. The relatively low stress levels suggest that the fluid pressures on both sides of the diaphragm are well-balanced, resulting in minimal deflection and negligible deformation due to pressure differentials.
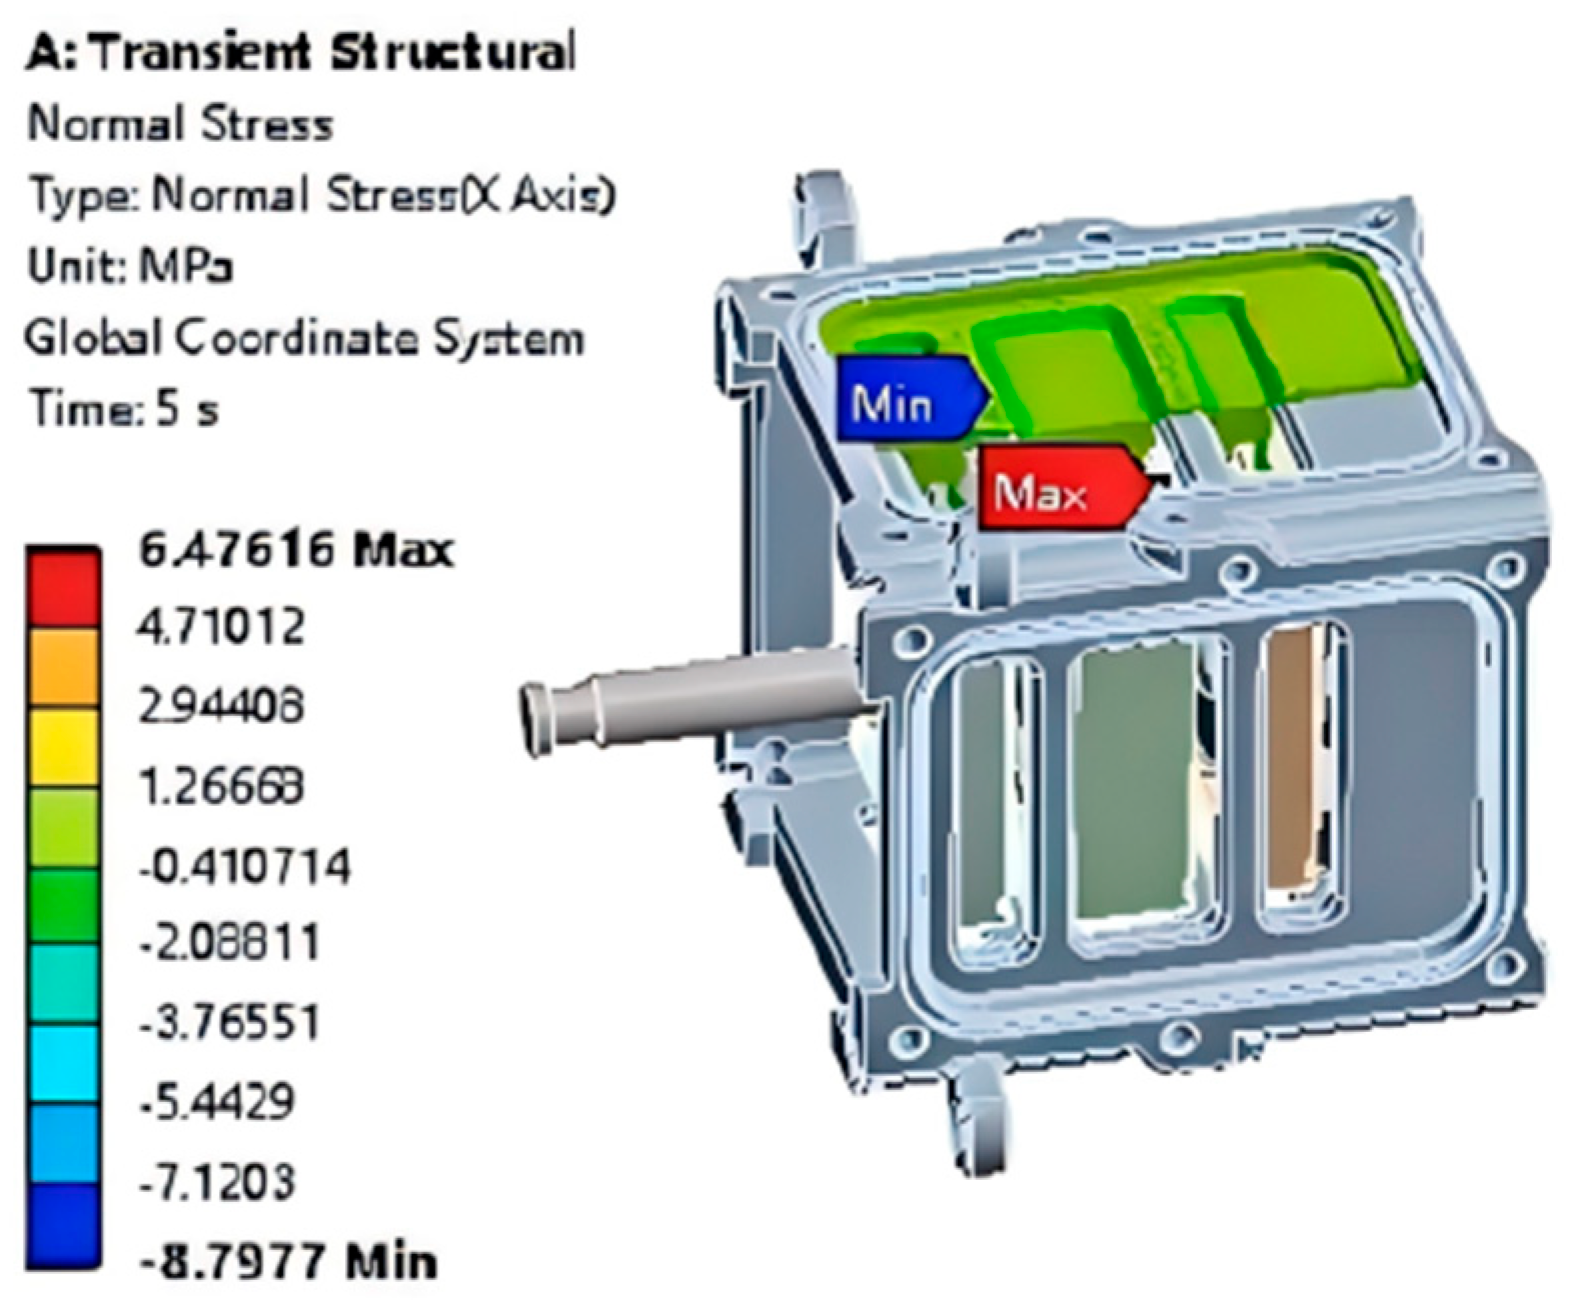
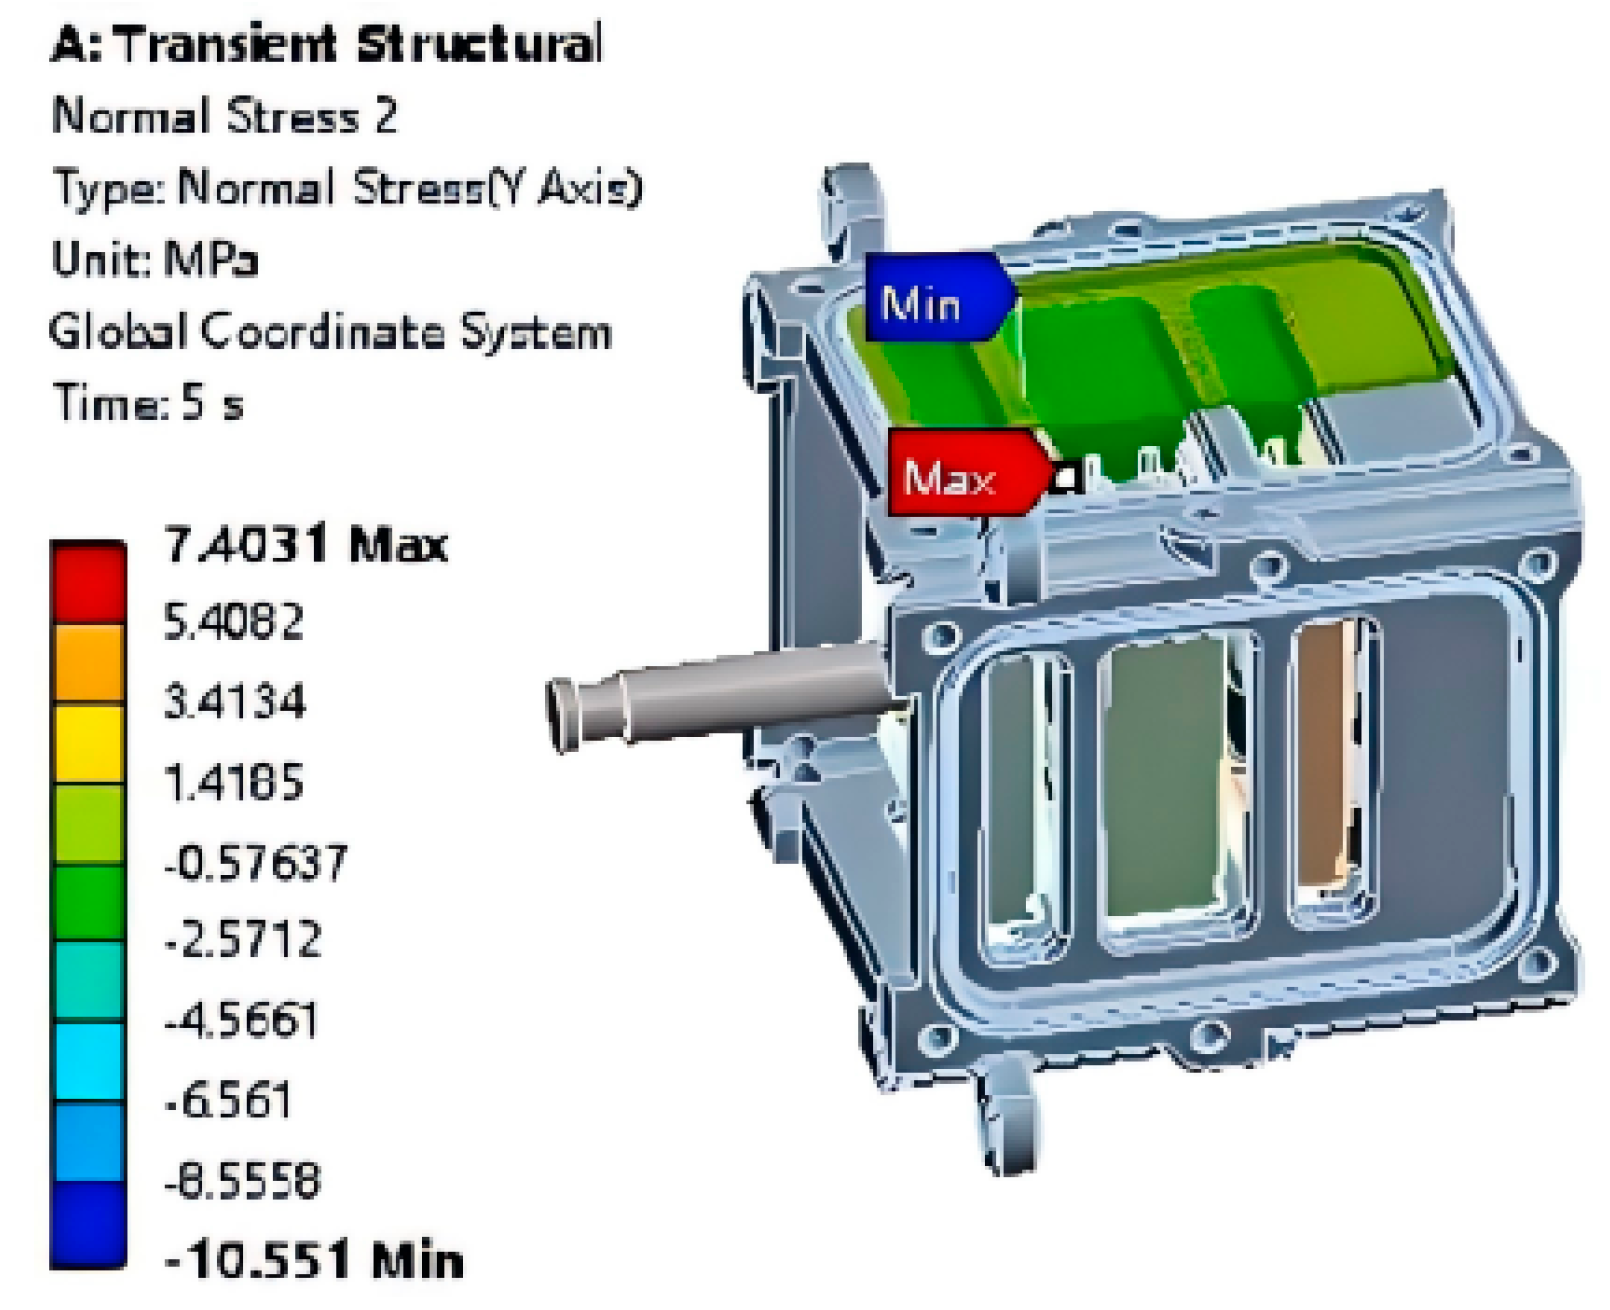
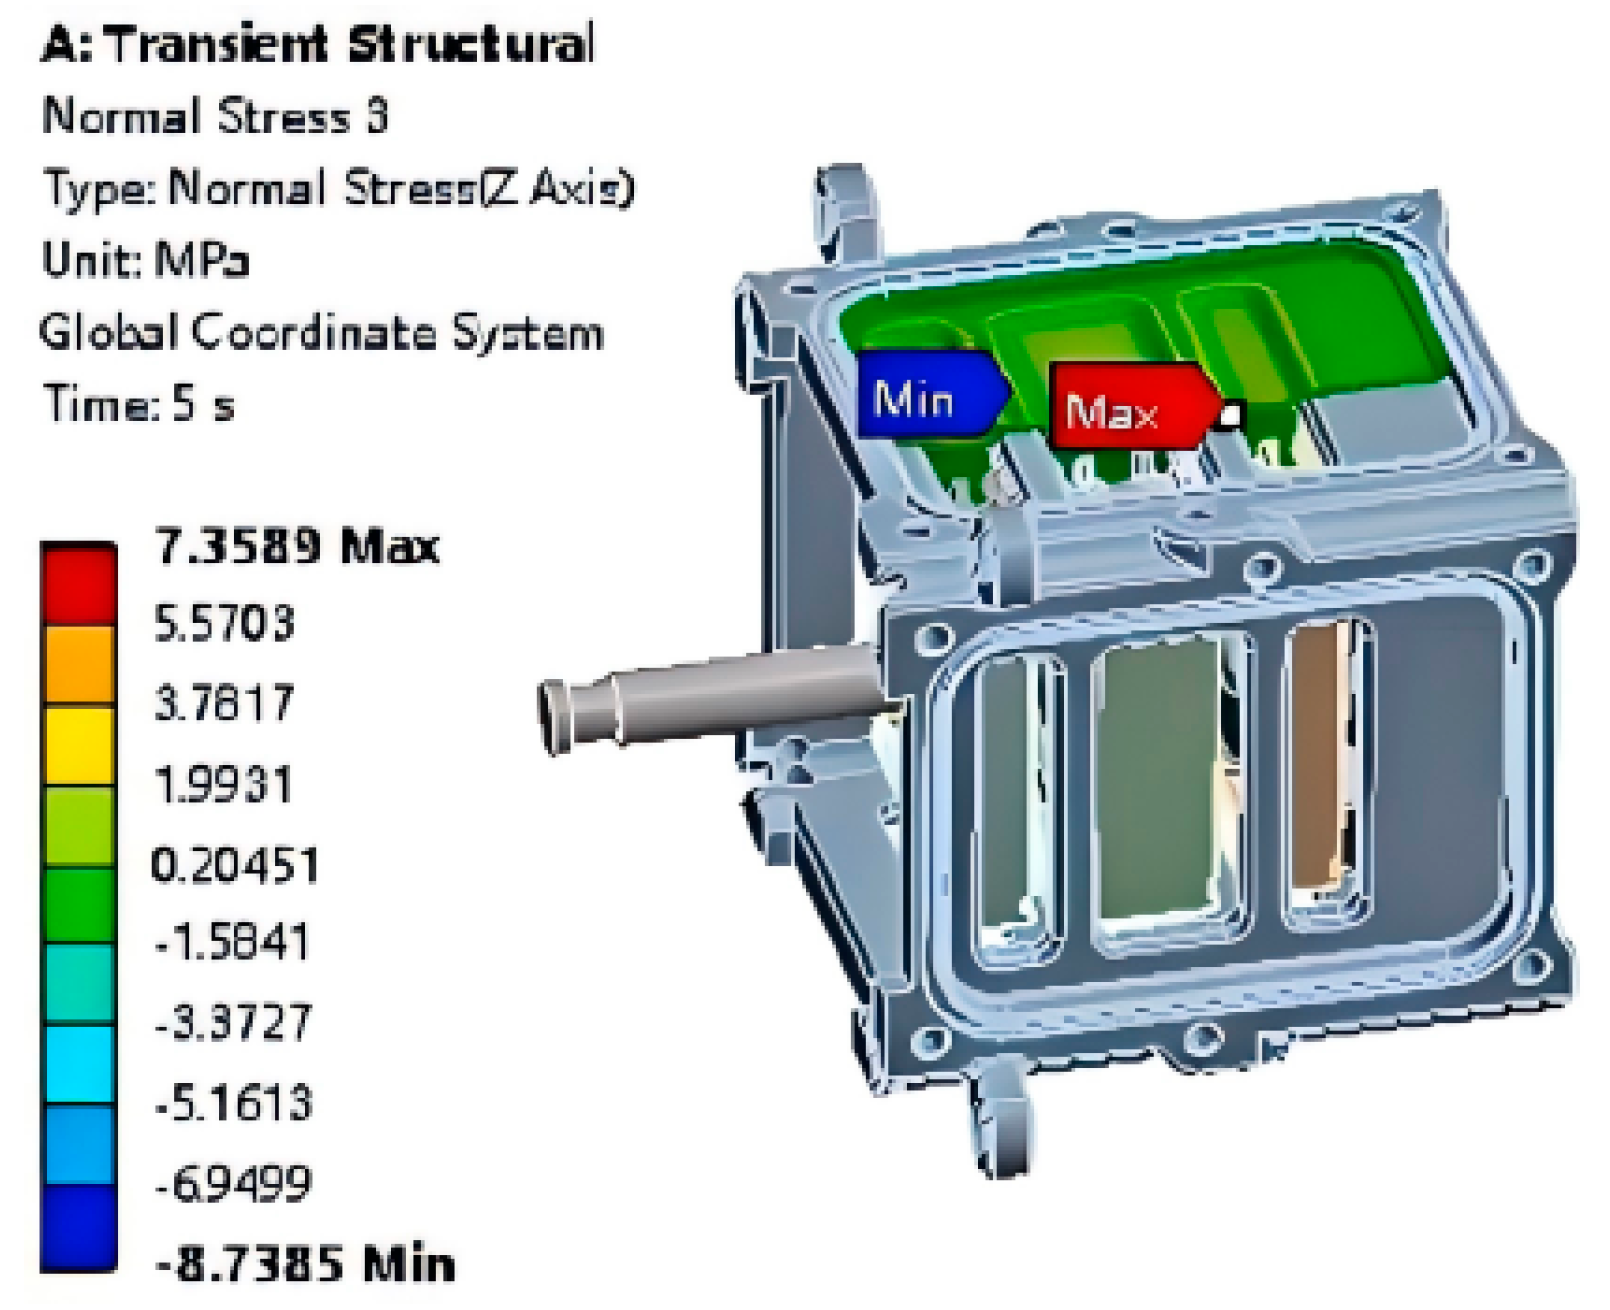
As shown in Figure 7, Figure 8 and Figure 9, in order to more comprehensively and deeply evaluate the mechanical response characteristics of the diaphragm under actual working conditions, we obtained three-dimensional spatial distribution data of the stress field and strain field in the three orthogonal directions of X, Y and Z through precision measuring instruments. After systematic comparative analysis, it can be clearly seen that during the working cycle, the external load endured by the diaphragm structure shows obvious directional characteristics. Among them, the pressure load from the y-axis direction is the most significant, reaching the peak level, while the pressure value along the z-axis direction is relatively small, but still at a high level. This asymmetric load distribution feature directly causes the diaphragm to easily deflect and deform during operation. This deformation mode may have an adverse impact on the long-term stable operation of the equipment. Additionally, the evolution of stress under transient pressure conditions was analyzed to investigate the diaphragm’s dynamic behavior across different operating scenarios.
The deformation behavior of the diaphragm under the combined influence of fluid and mechanical forces is a complex process. At low fluid velocities, stress concentrations tend to appear in small localized regions of the diaphragm where pressure values are relatively high. This suggests that under low fluid forces, the diaphragm is more likely to experience localized and significant deformation. In contrast, at higher fluid velocities, the stress-prone regions tend to expand, though the maximum pressure within these zones decreases. As a result, higher fluid forces lead to more uniform but overall smaller deformation of the diaphragm.
Mechanical motion also plays a significant role in diaphragm deformation. The elasticity of the diaphragm is influenced by several factors, including material composition, manufacturing processes, and the operating environment. When subjected to mechanical forces, the diaphragm deforms and, depending on its extensibility, may return to its original shape. However, excessive mechanical loading can lead to overstretching or compression, potentially damaging the internal structure and reducing the diaphragm’s elasticity and recovery capability.
The displacement of the drive wheel within the diaphragm mechanism is closely related to both the geometry of the diaphragm chamber and the placement of the probe within the diaphragm stroke system. As such, it represents a key design parameter in diaphragm pump development. Traditionally, the displacement of the diaphragm drive wheel has been determined experimentally by measuring diaphragm stroke. This approach, however, requires the construction of dedicated test platforms and specialized equipment, making it time-consuming and costly. In this study, a steady-state structural analysis method is used to directly obtain the motion displacement curves of both the diaphragm and the transmission block.
Comparison with experimental data reveals that the location of maximum stress in the simulation corresponds to the actual failure location of the diaphragm observed in practice. The highest stress occurs at the edge of the fluid–solid coupling interface, which is likely due to diaphragm bending during the return stroke. At this stage, tensile forces act on the edge of the fluid–solid interface, resulting in a sharp increase in local stress. Long-term operation under these conditions leads to fatigue and eventual failure. Failure analysis confirms that most fractures occur at this edge, further validating the accuracy of the simulation method.
Experimental verification also shows that the rupture location coincides with the high-stress region near the water-contact surface, particularly along the sector-shaped edges. The primary cause of diaphragm rupture is the high operational stress it endures. Under certain working conditions, however, both the maximum stress and deformation remain within the material’s allowable limits, indicating that the diaphragm pump design meets the required standards for strength and stiffness.
In flow field simulations of the diaphragm pump, a user-defined function (UDF) combined with dynamic mesh technology is employed to effectively capture time-dependent changes in the fluid domain. This method is particularly well-suited for modeling the periodic volume variations in the pump chamber during operation, as well as the resulting complex fluid dynamics.

5.2. Internal Flow Field Simulation

To comprehensively analyze the performance of the diaphragm pump, various directional vectors were considered in the simulation, including fluid velocity, pressure gradient, and vorticity. The variations in these vectors in different directions—such as axial, radial, and tangential-significantly influence key parameters, including pump efficiency, flow pulsation, and energy loss. Through UDF dynamic mesh simulation, the flow trajectories within the diaphragm pump cavity, the formation and dissipation of vortices, and the interaction between the fluid and pump walls can be observed. Furthermore, the impact of directional vectors on pump performance can be assessed, such as the contribution of the axial vector to flow rate and the effect of the radial vector on pressure distribution.
This study employs the dynamic grid DEFINE_CG_MOTION to define the motion law of the diaphragm’s ring-shaped upper surface. The dynamic grid procedure is outlined in Appendix A. Building on the dynamic grid technology described above, a comprehensive flow field analysis of the pump was conducted. As shown in Figure 10, three parts (A1, A2, and A3) were selected for research. By analyzing cross-sections at different locations, multiple angles ranging from 0° to 300° were considered, with a focus on the 60° angle.
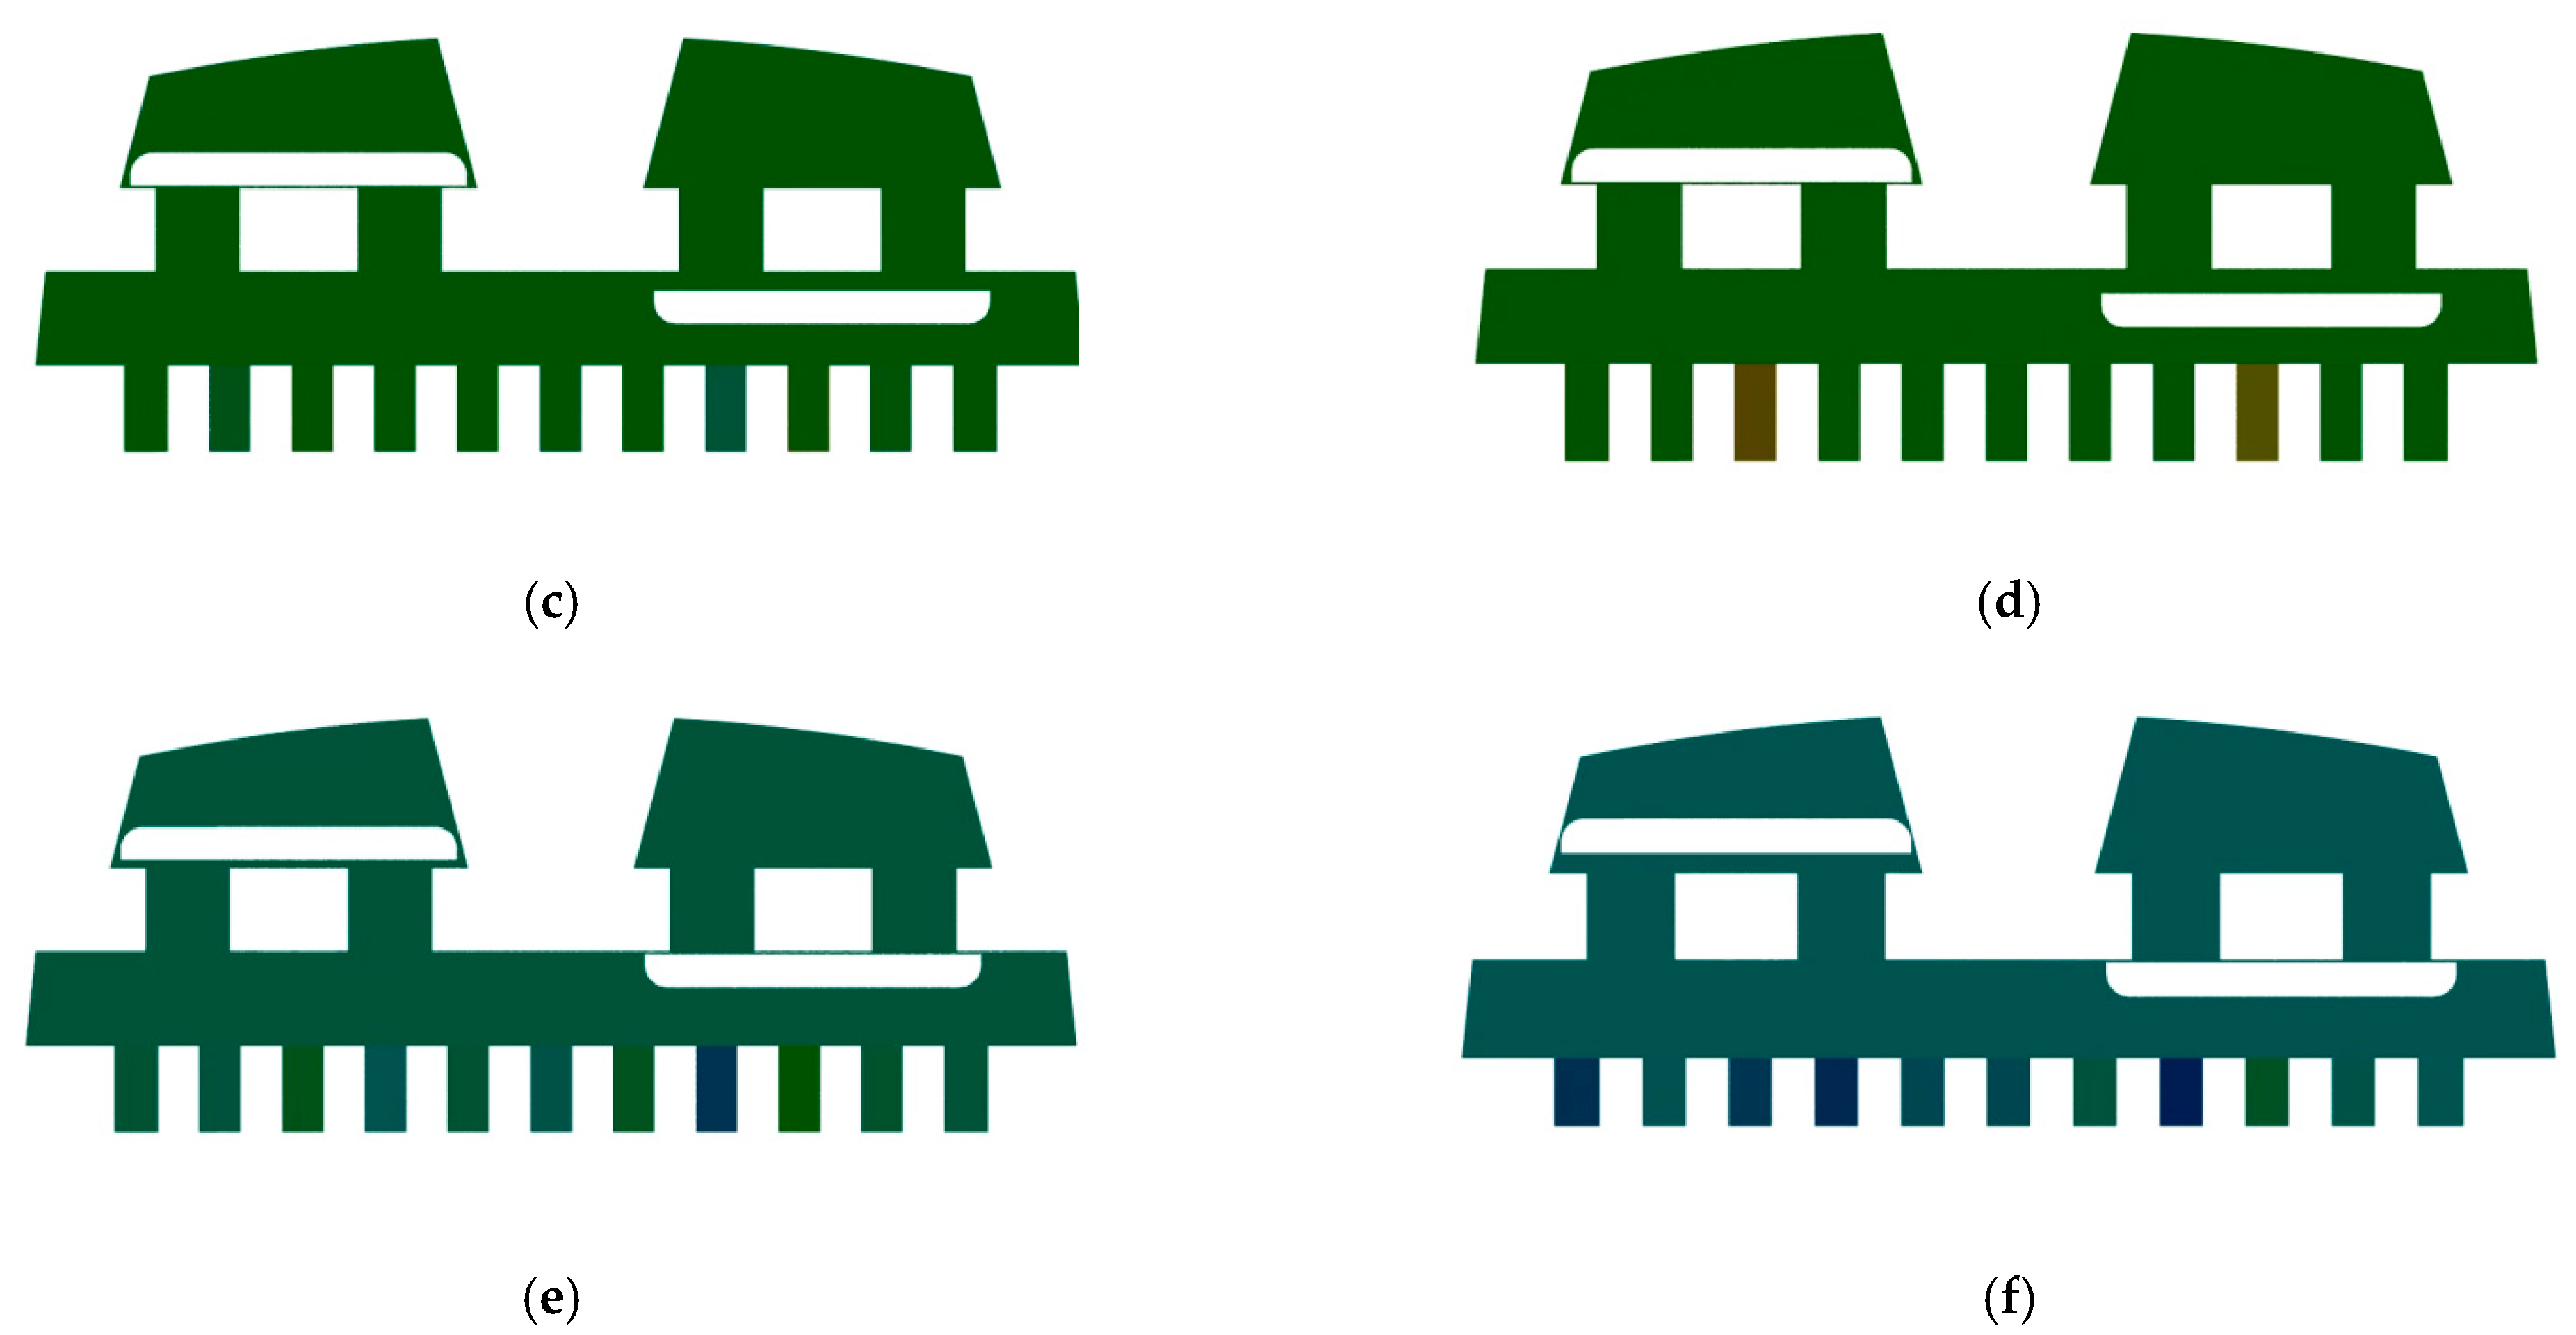
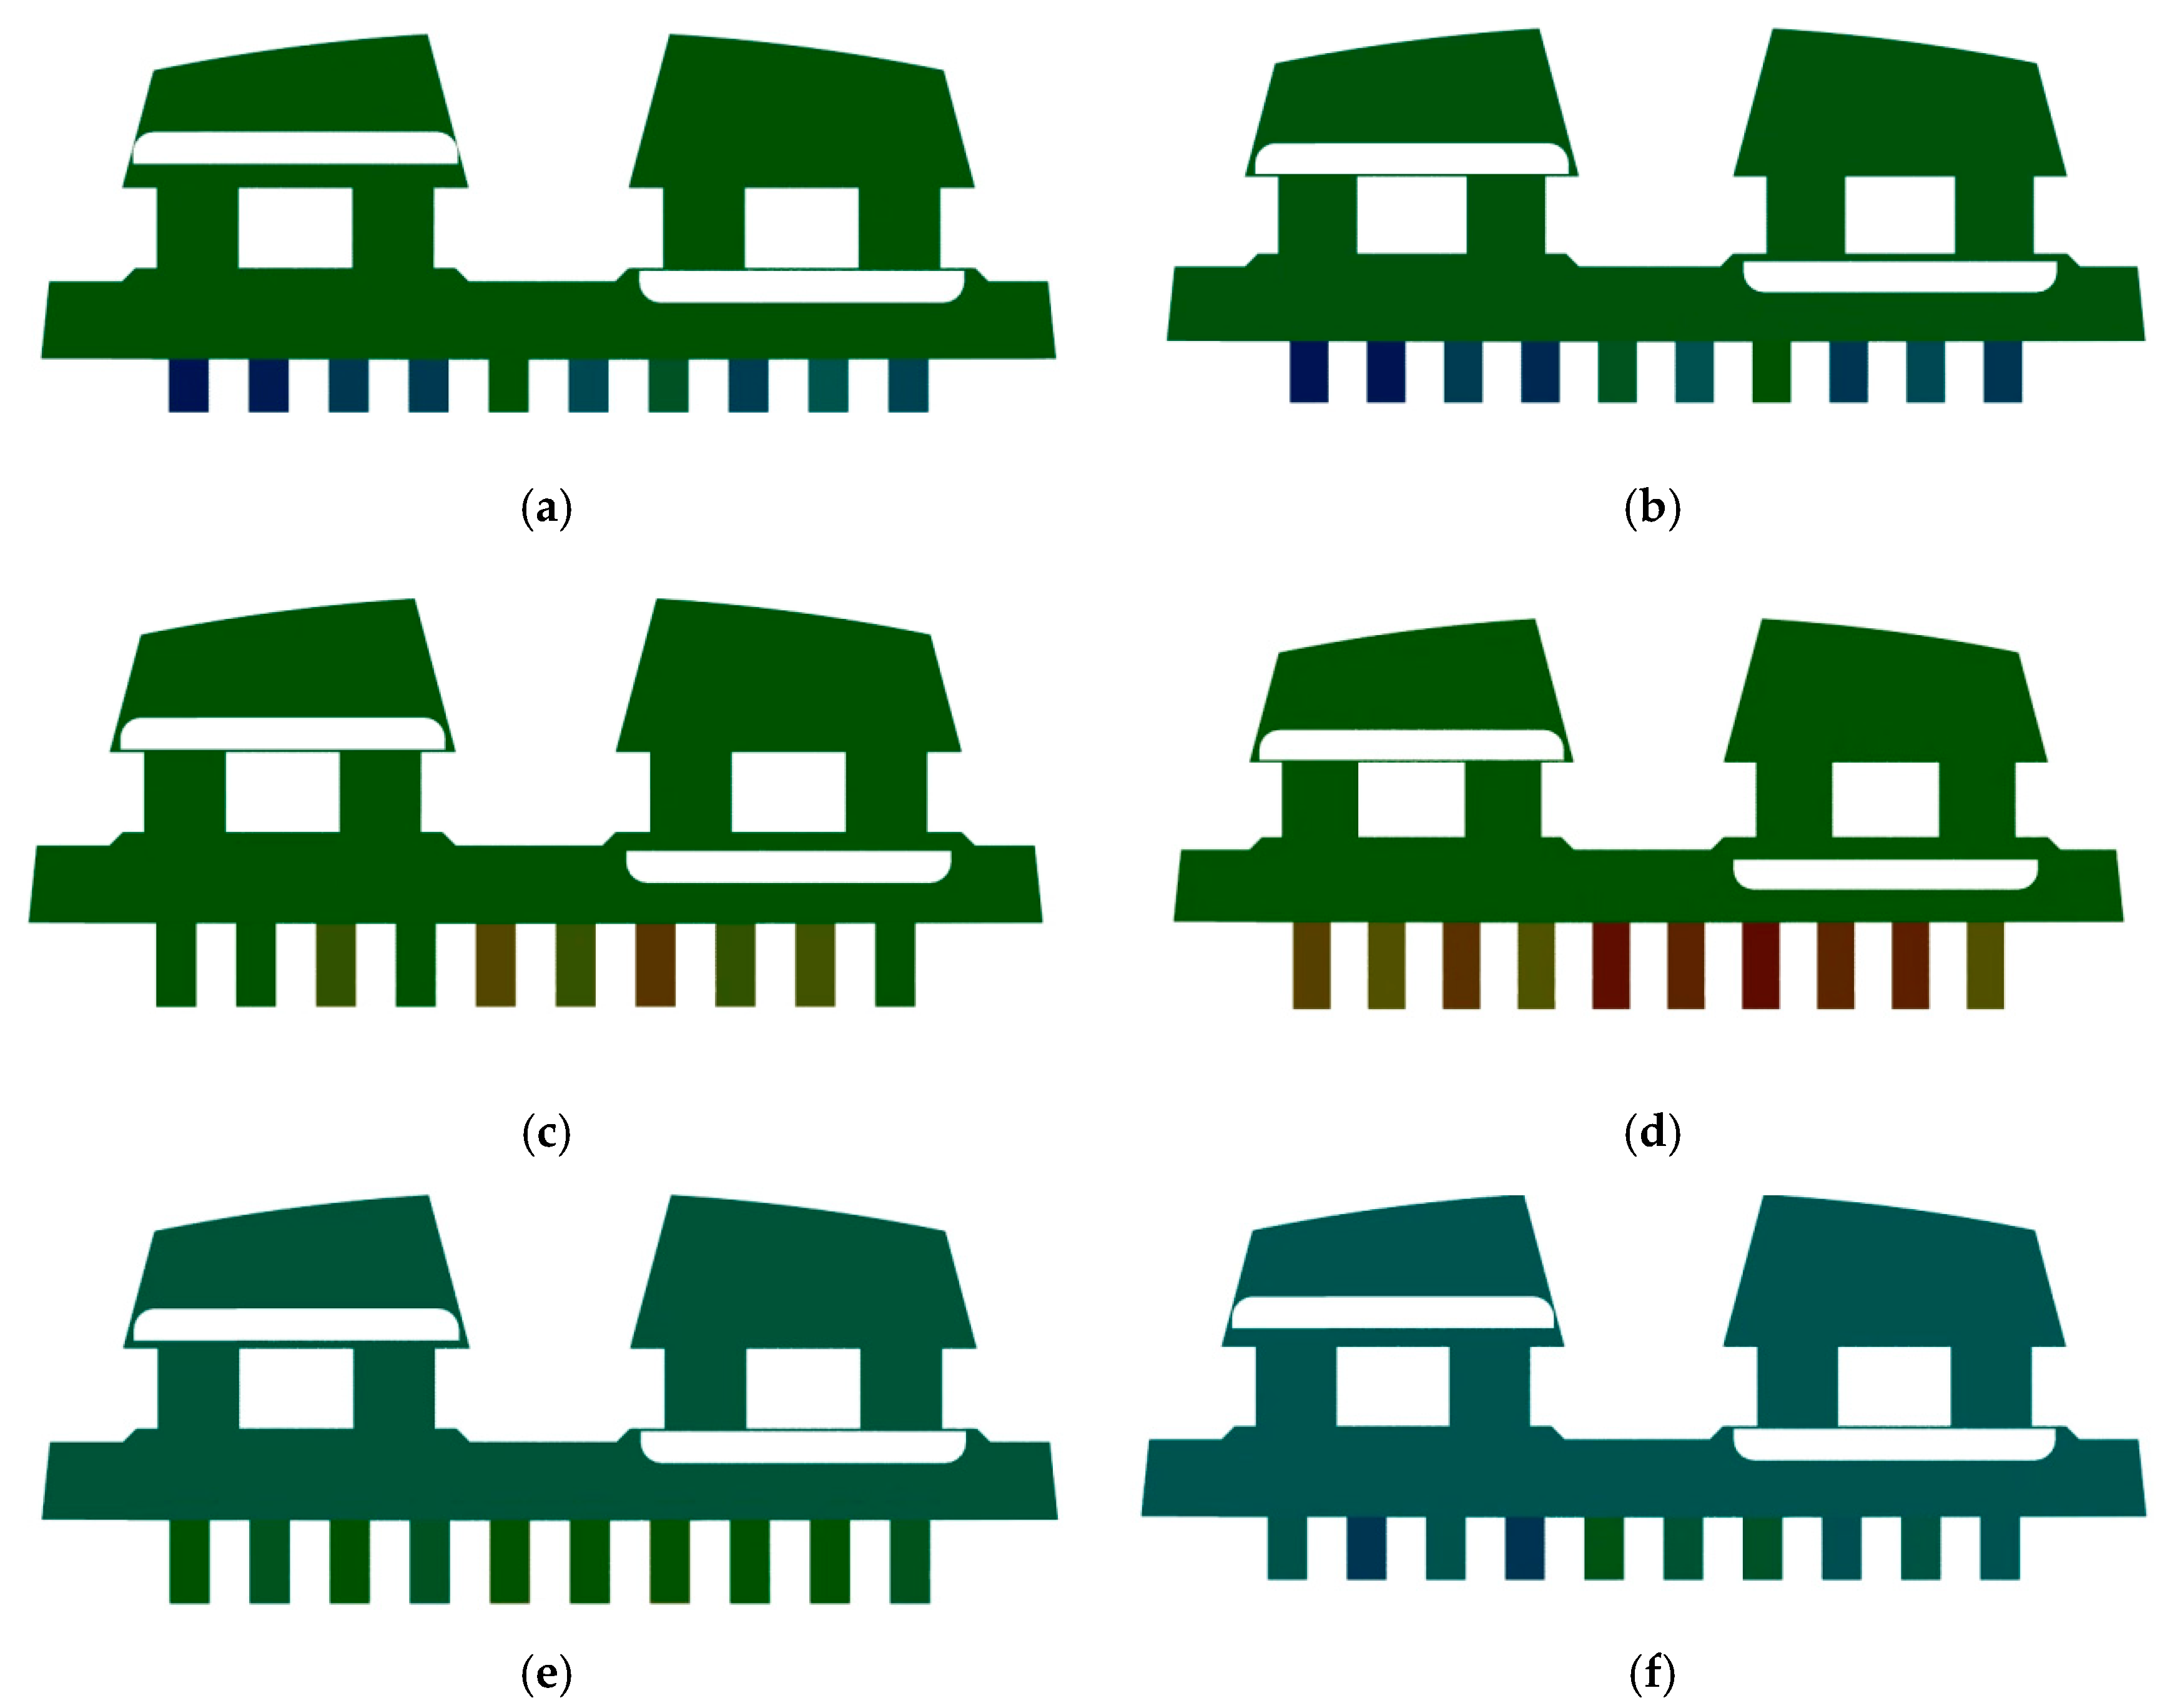
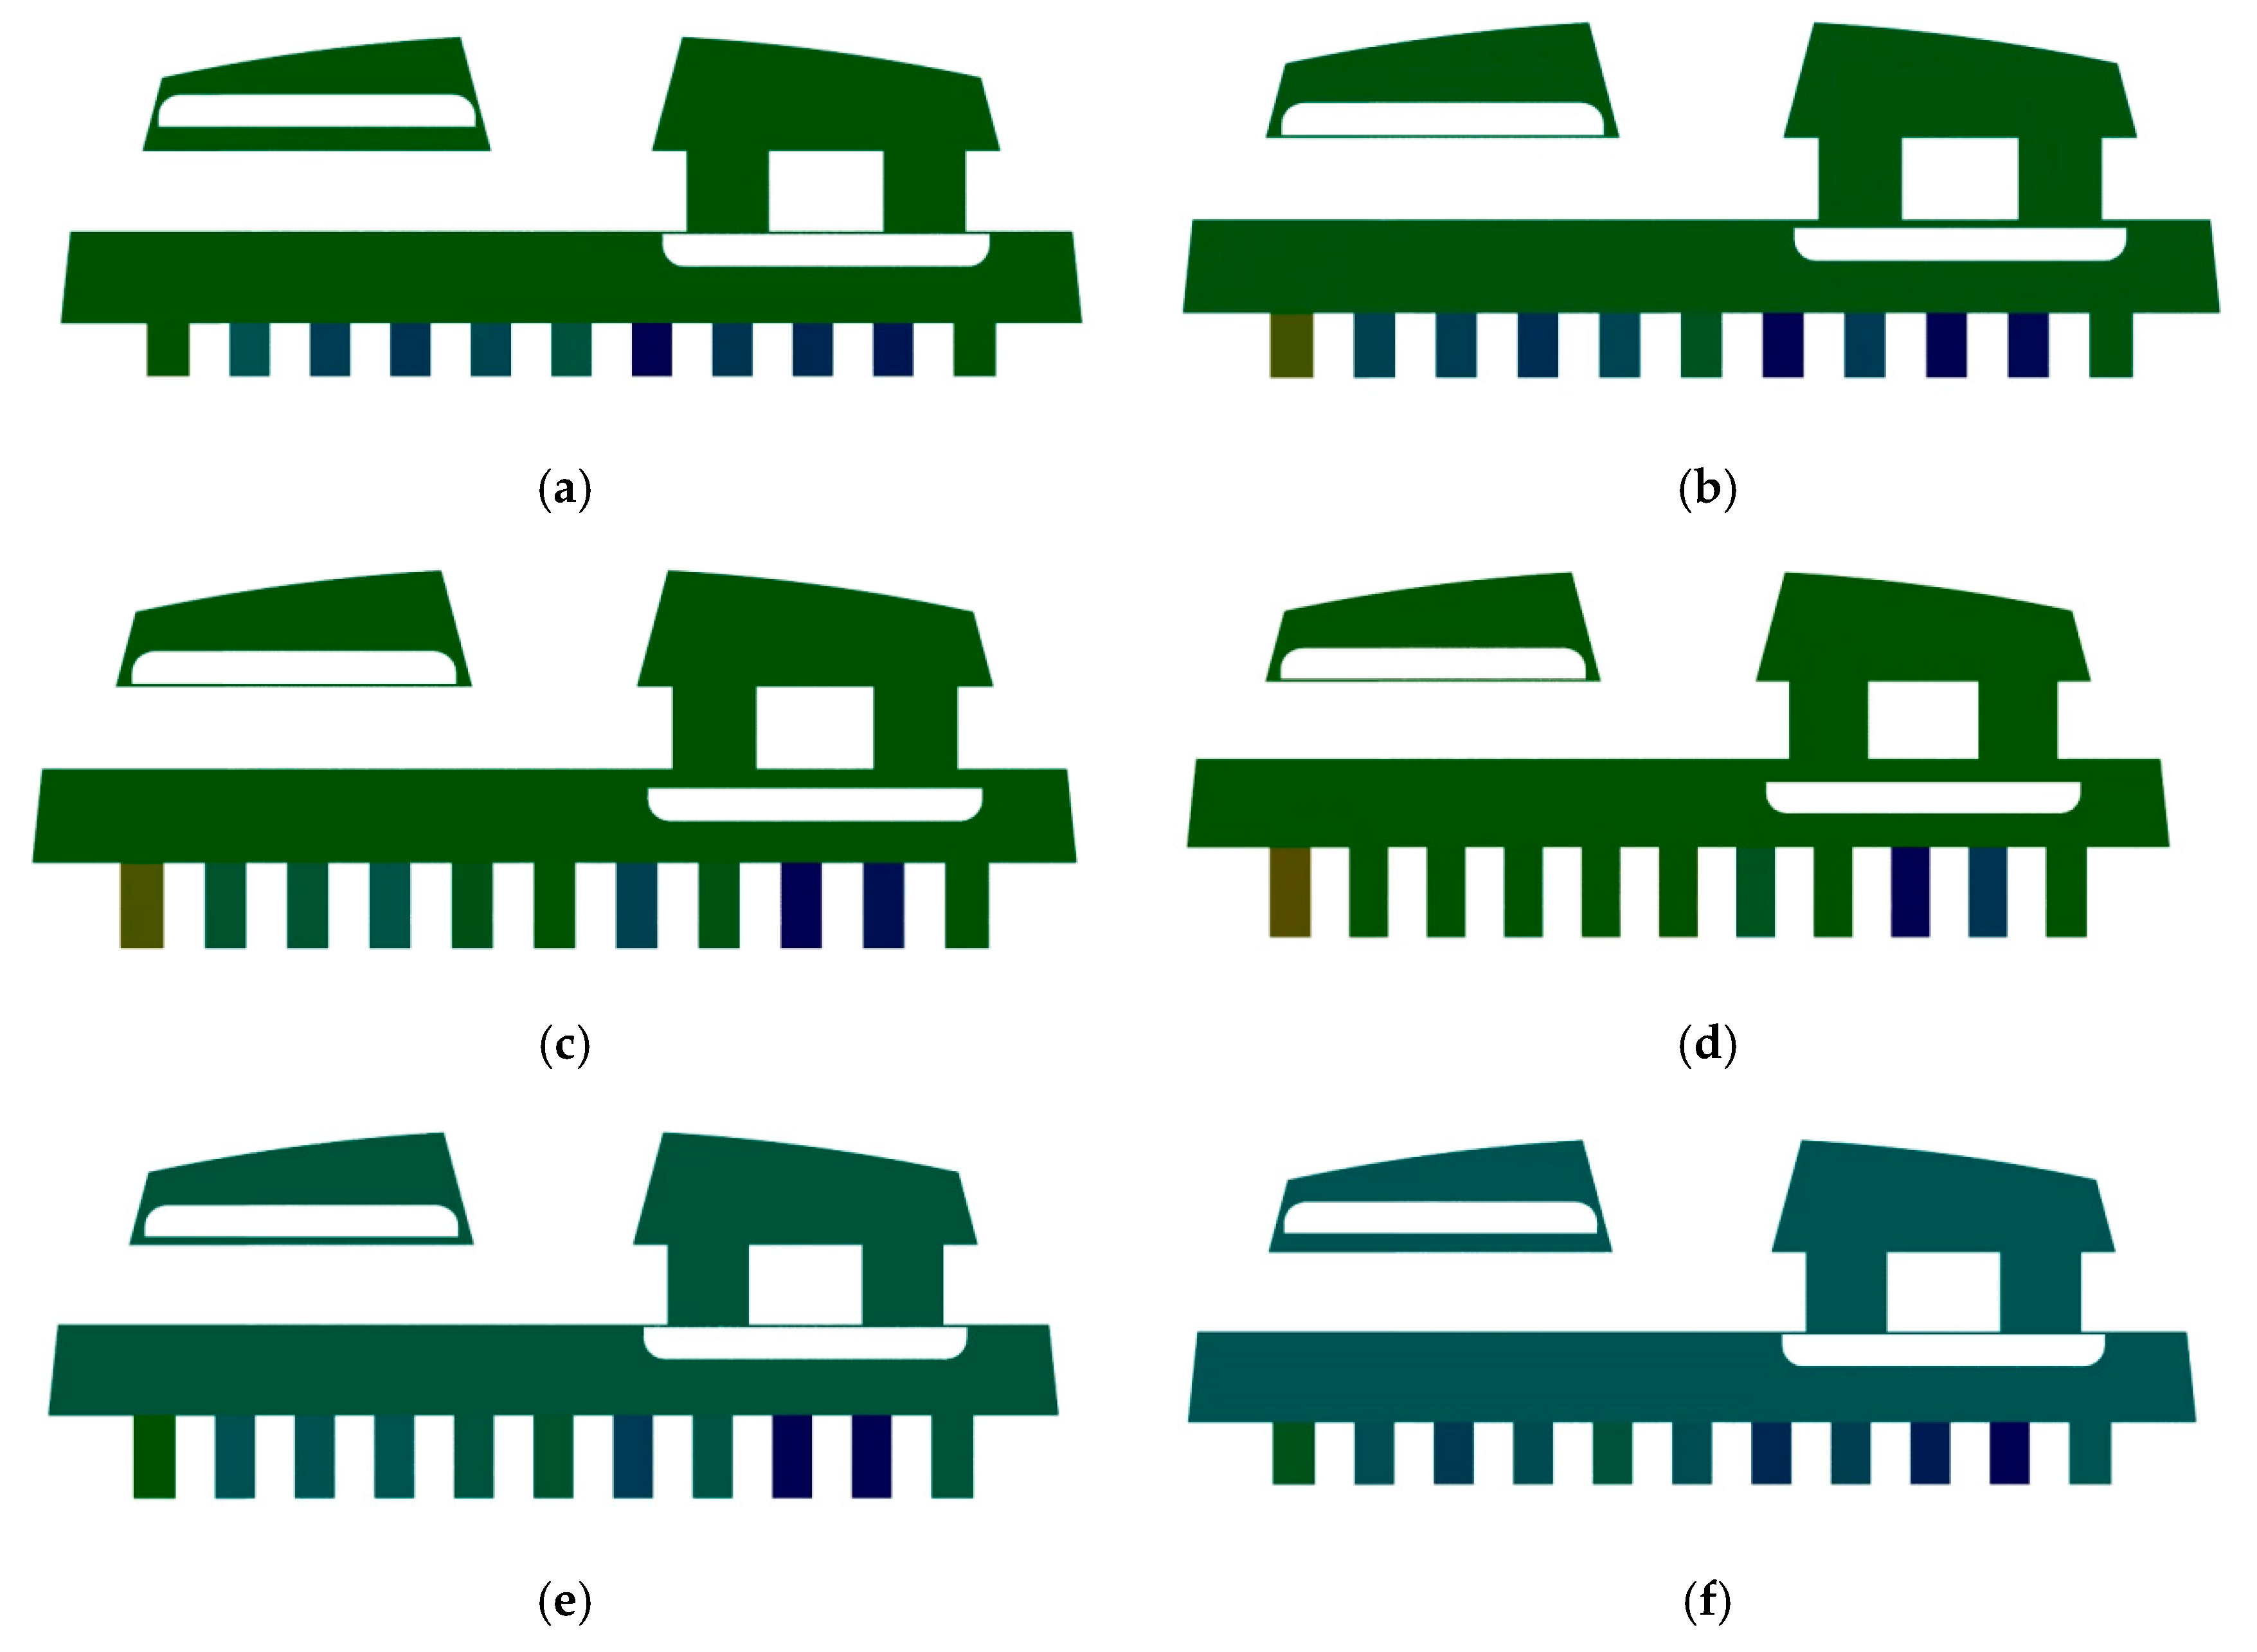
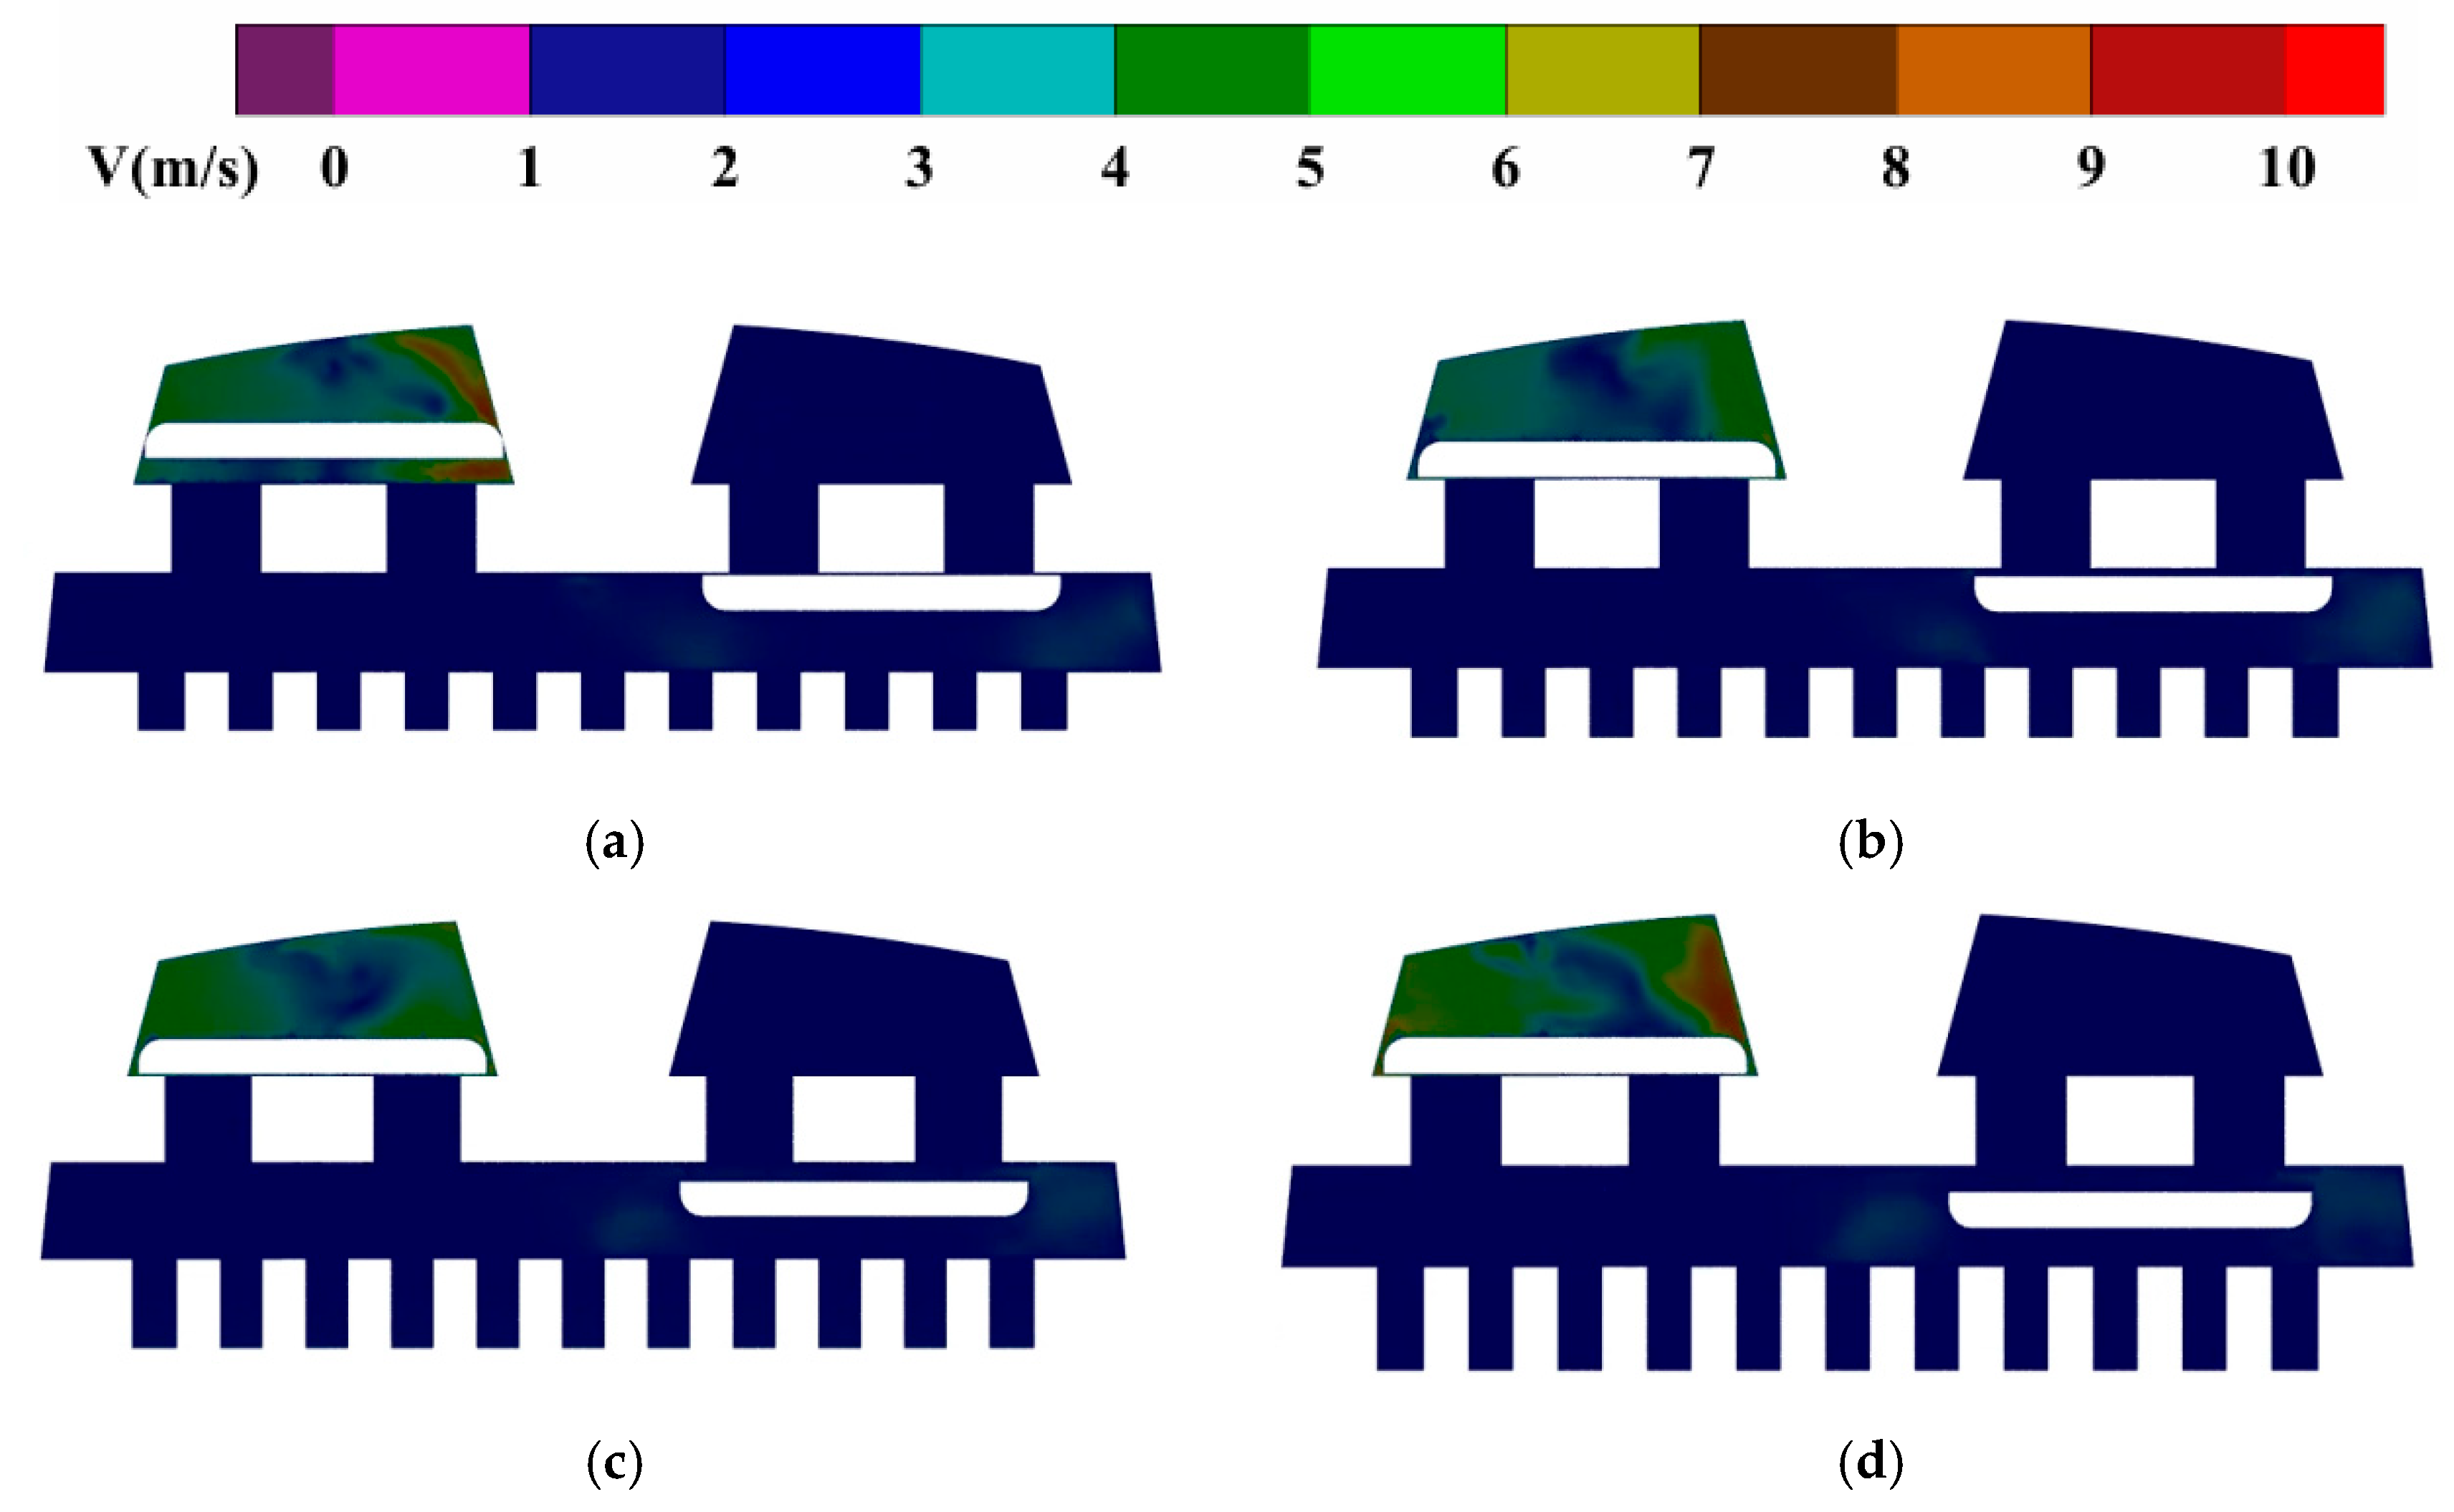
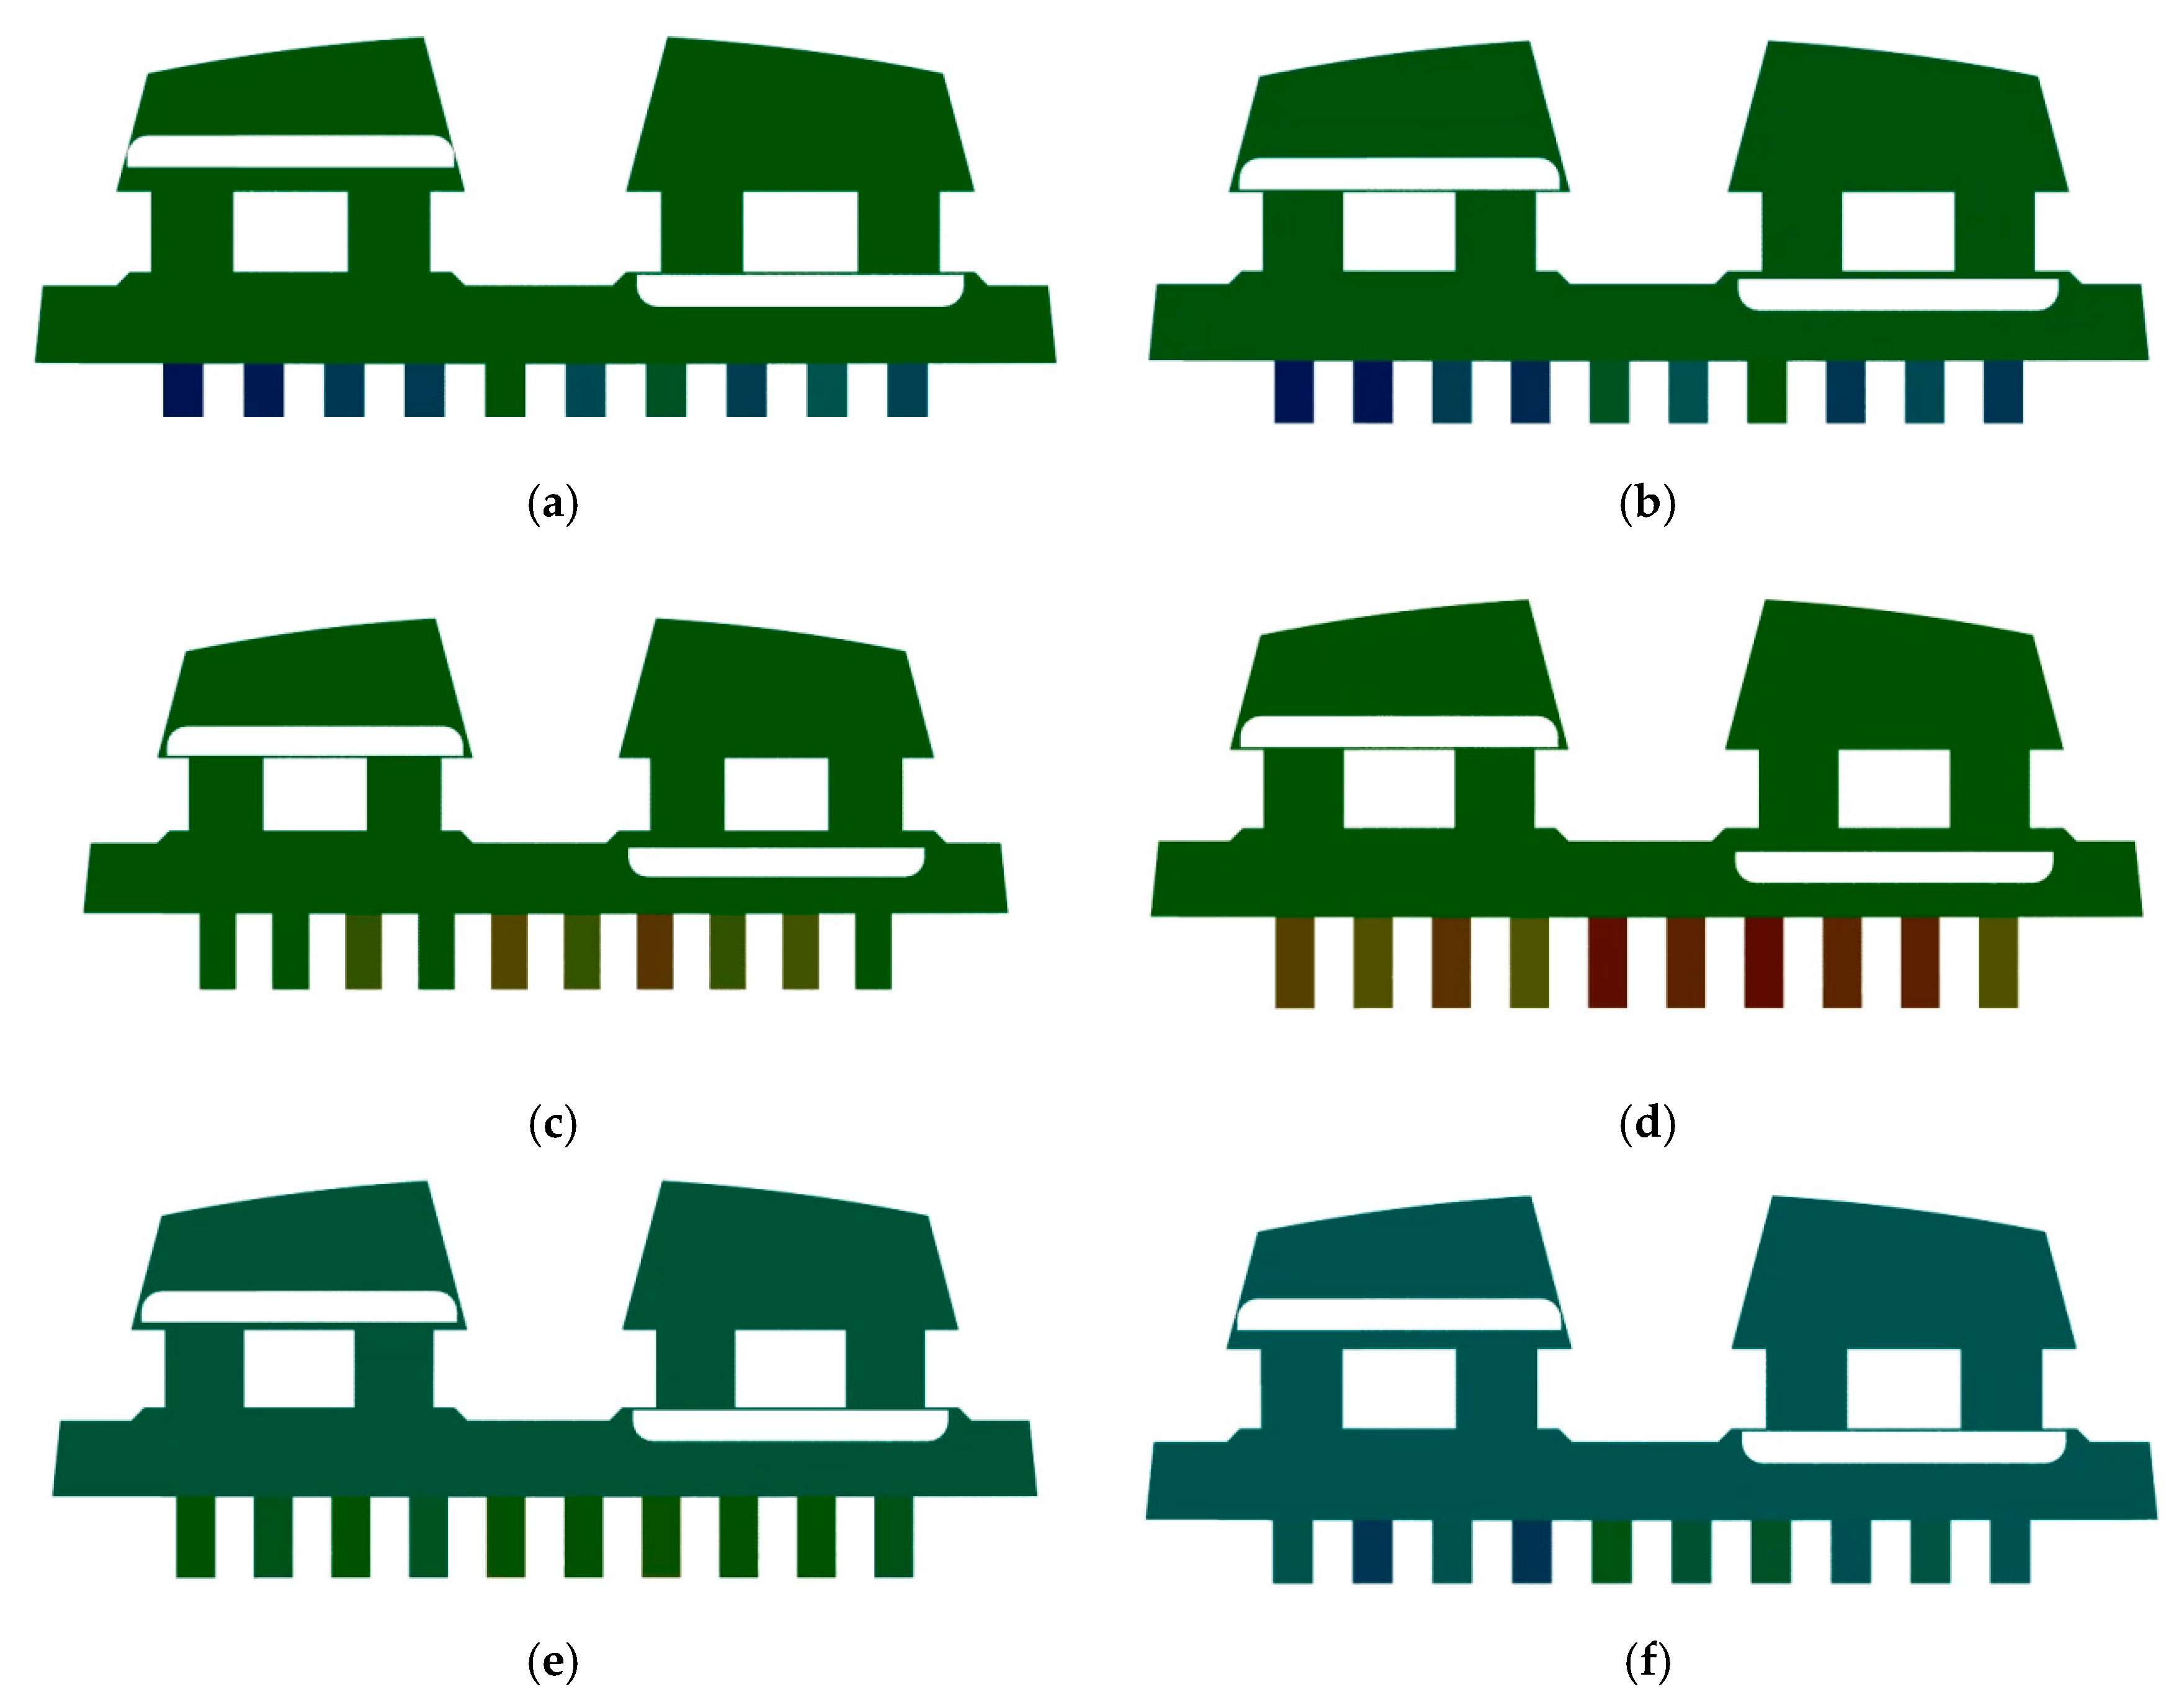
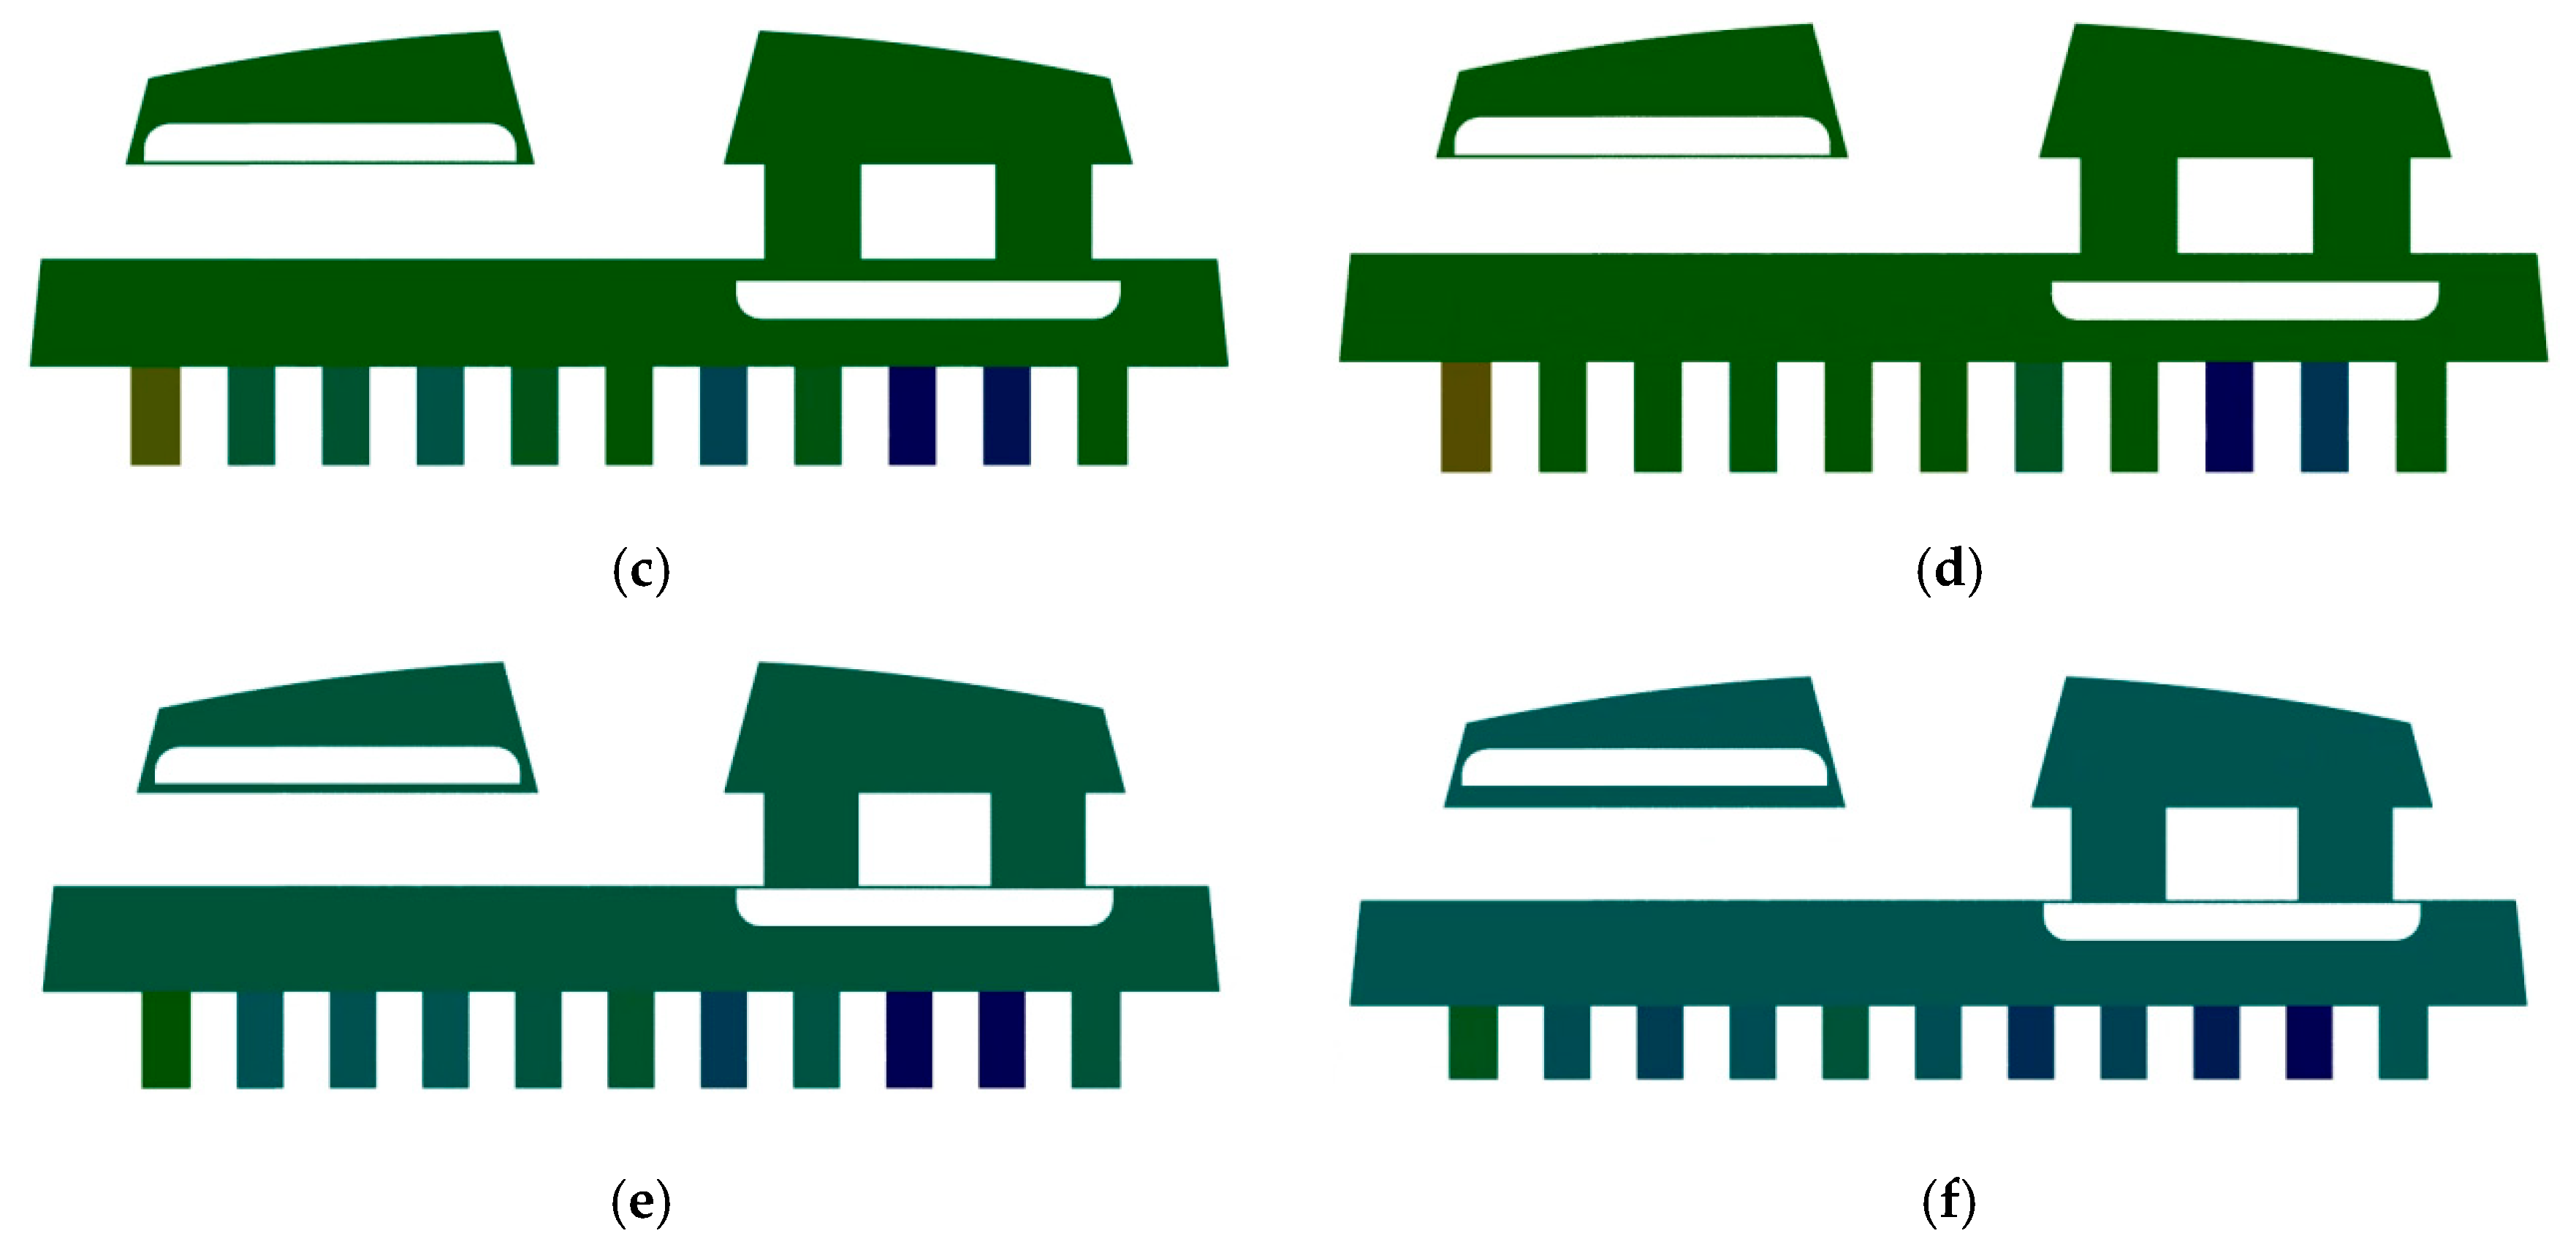
As shown in Figure 11, Figure 12 and Figure 13, these three cross-sections, respectively, show the pressure distribution cloud maps of the A1, A2 and A3. At the same time, Figure 14, Figure 15 and Figure 16 correspondingly show the velocity distribution cloud maps of the three sections. These velocity cloud maps clearly show the pressure and flow velocity distribution characteristics of the fluid at different sections. The calculation results indicate that the dynamic performance of the balancing pump under varying operating conditions follows distinct patterns. The flow field of the pump was analyzed using dynamic grid technology, which can accommodate the complex flow field changes and more accurately simulate fluid movement within the pump. Based on the pump’s structural characteristics and key fluid flow areas, three sections (A1, A2, A3) were selected for analysis. The analysis covered cross-sections at multiple angles ranging from 0° to 300°, with particular focus on the 60° angle. These angles correspond to different operating states of the pump. Pressure is a critical parameter in the flow field, and the simulation provides insights into the energy distribution and fluid transmission within the pump. Pressure and velocity contour maps at various angles for the cross-sections of A1, A2, and A3 reveal pressure fluctuations and flow velocity distributions within the pump. High-velocity areas are observed near the parallel region of the umbrella valve opening. By comprehensively analyzing changes in pressure and velocity contours at different sections and angles, a deeper understanding of the flow field characteristics in the balancing pump is achieved, offering valuable insights for optimizing the design and enhancing the pump’s performance.

6. PIV Experiment Investigation of Umbrella Valve

The unique design of the umbrella valve provides excellent unidirectional flow control, allowing the medium to pass in a specified direction while effectively preventing backflow. When the medium flows in the intended direction, pressure builds on the umbrella surface, causing it to open and permit smooth passage. Conversely, reverse flow generates opposing pressure that forces the umbrella surface to seal tightly against the valve seat, thereby preventing backflow.
During rapid medium flow, the umbrella surface acts as a cushion to absorb impact forces. In this process, the umbrella valve dissipates the energy generated by water hammer through structural deformation, serving to buffer and reduce pressure surges [25,26]. This mechanism protects piping systems and associated equipment from water hammer damage. Additionally, the cushioning effect mitigates noise and vibration, enhancing the overall smoothness and quietness of system operation.
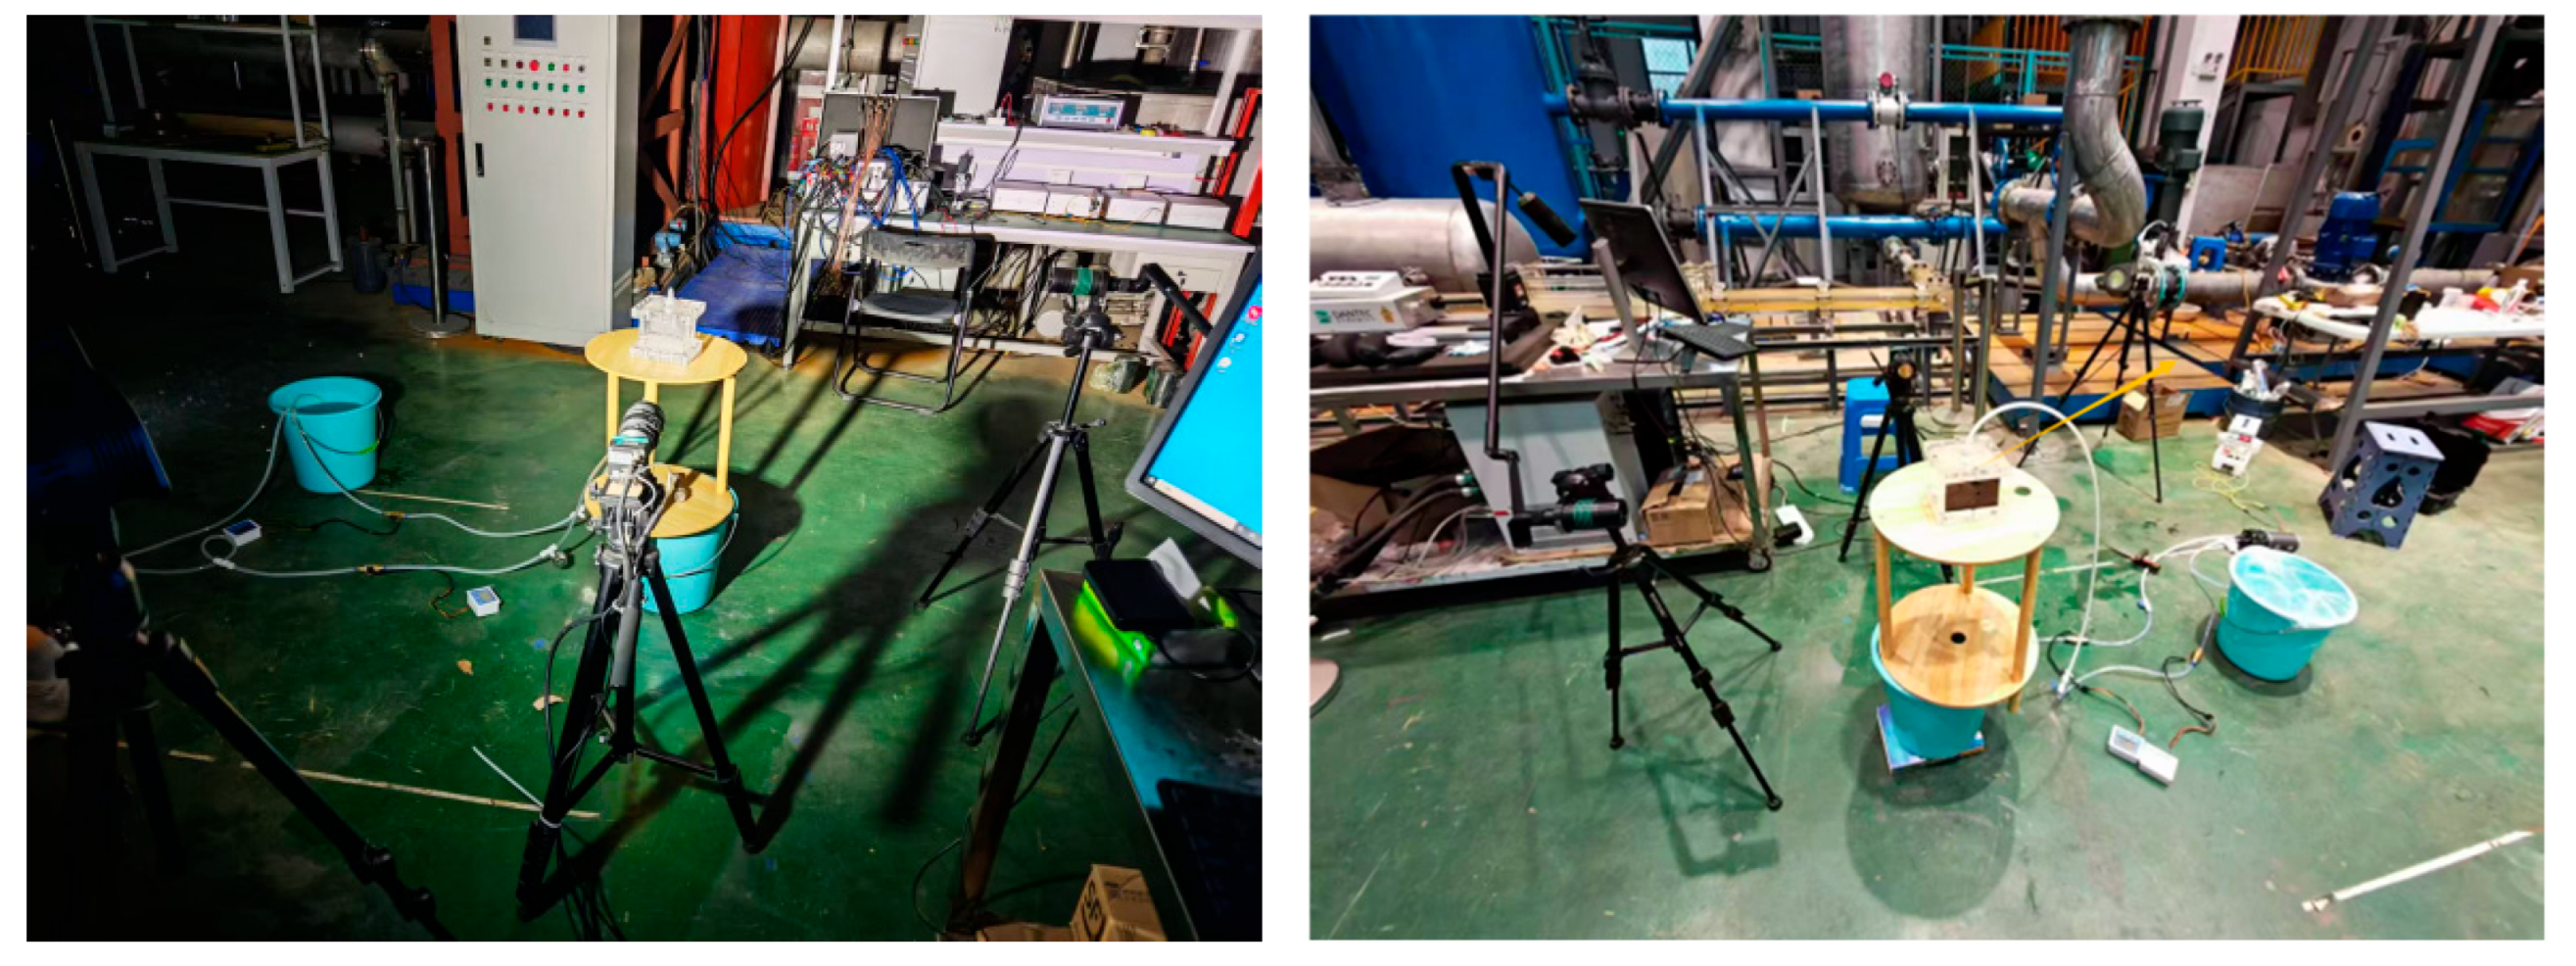
A laboratory setup was constructed to replicate actual working conditions, comprising piping systems, water pumps, regulating valves, pressure gauges, flow meters, a particle image velocimetry (PIV) system, and data acquisition and processing units. The PIV system includes a laser light source, a camera, and a tracer particle generator. The laser illuminates the flow field, while the camera captures images of tracer particles dispersed evenly to facilitate velocity measurements. Data acquisition and processing units collect the captured images and perform subsequent analyses to calculate flow parameters. The PIV experimental setup as shown in Figure 17. By adjusting the opening of the flow regulating valve, the flow rate and consequently the pressure before and after the umbrella valve chamber can be controlled.
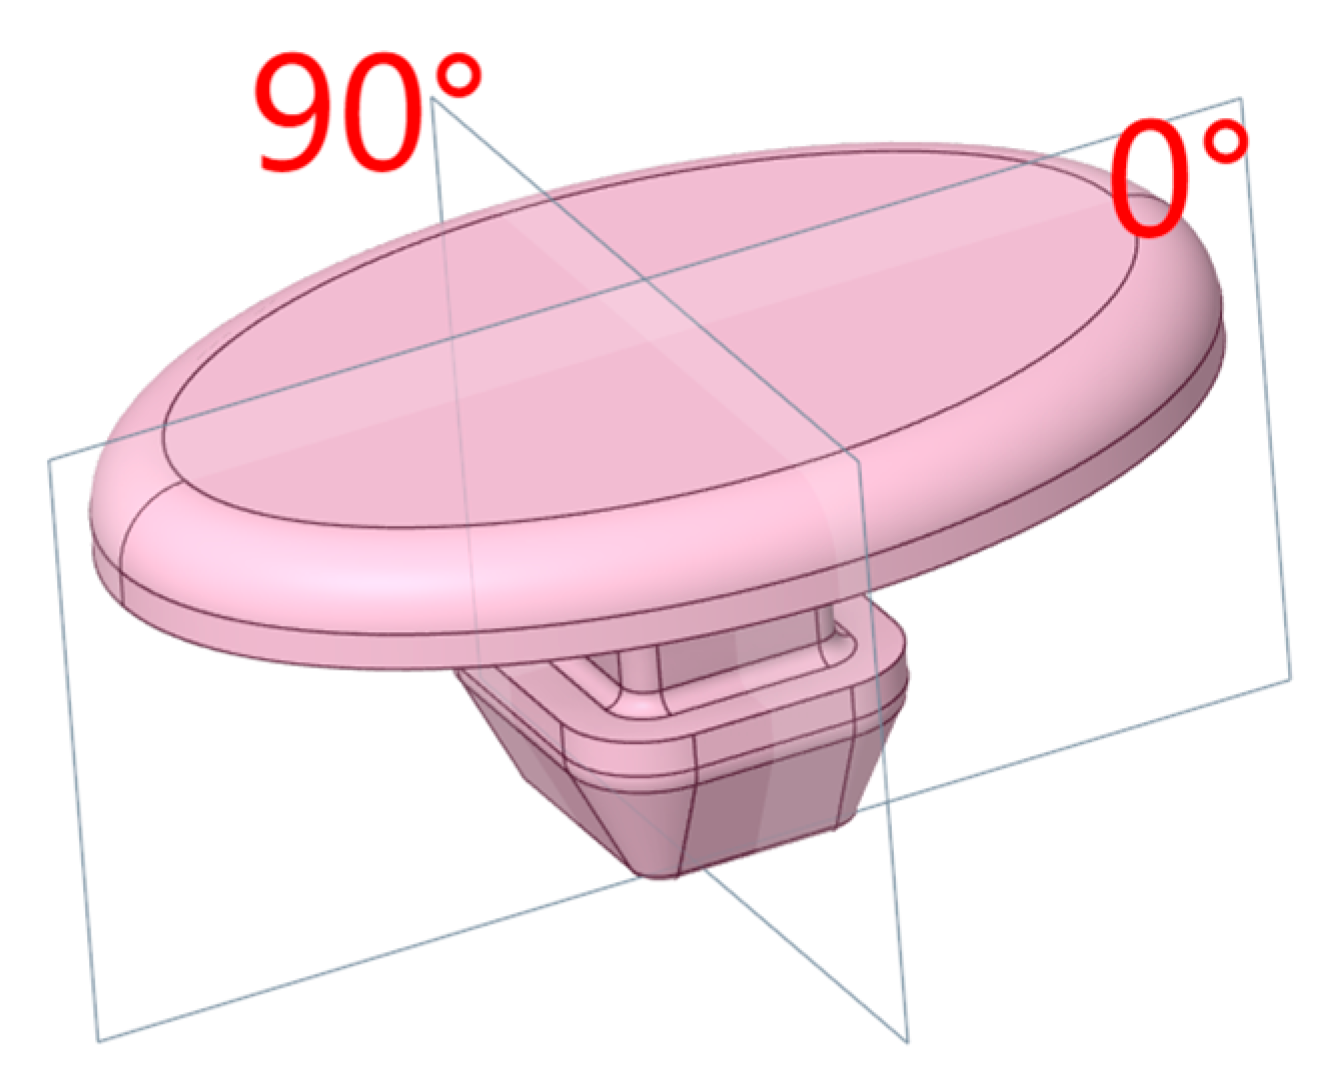
Figure 18 visually illustrates two placement angles of the umbrella valve. Table 2 shows several common tracer particles and their size parameters. Under the experimental conditions, 2–7 μm aluminum powder was used as the tracer particle in this study. The experimental pipeline is constructed from stainless steel, with an inner diameter of D = 5.5 mm and a wall thickness of t = 1 mm. The umbrella valve device box is made of transparent plexiglass. The experimental instrument parameters are shown in the following Table 3.
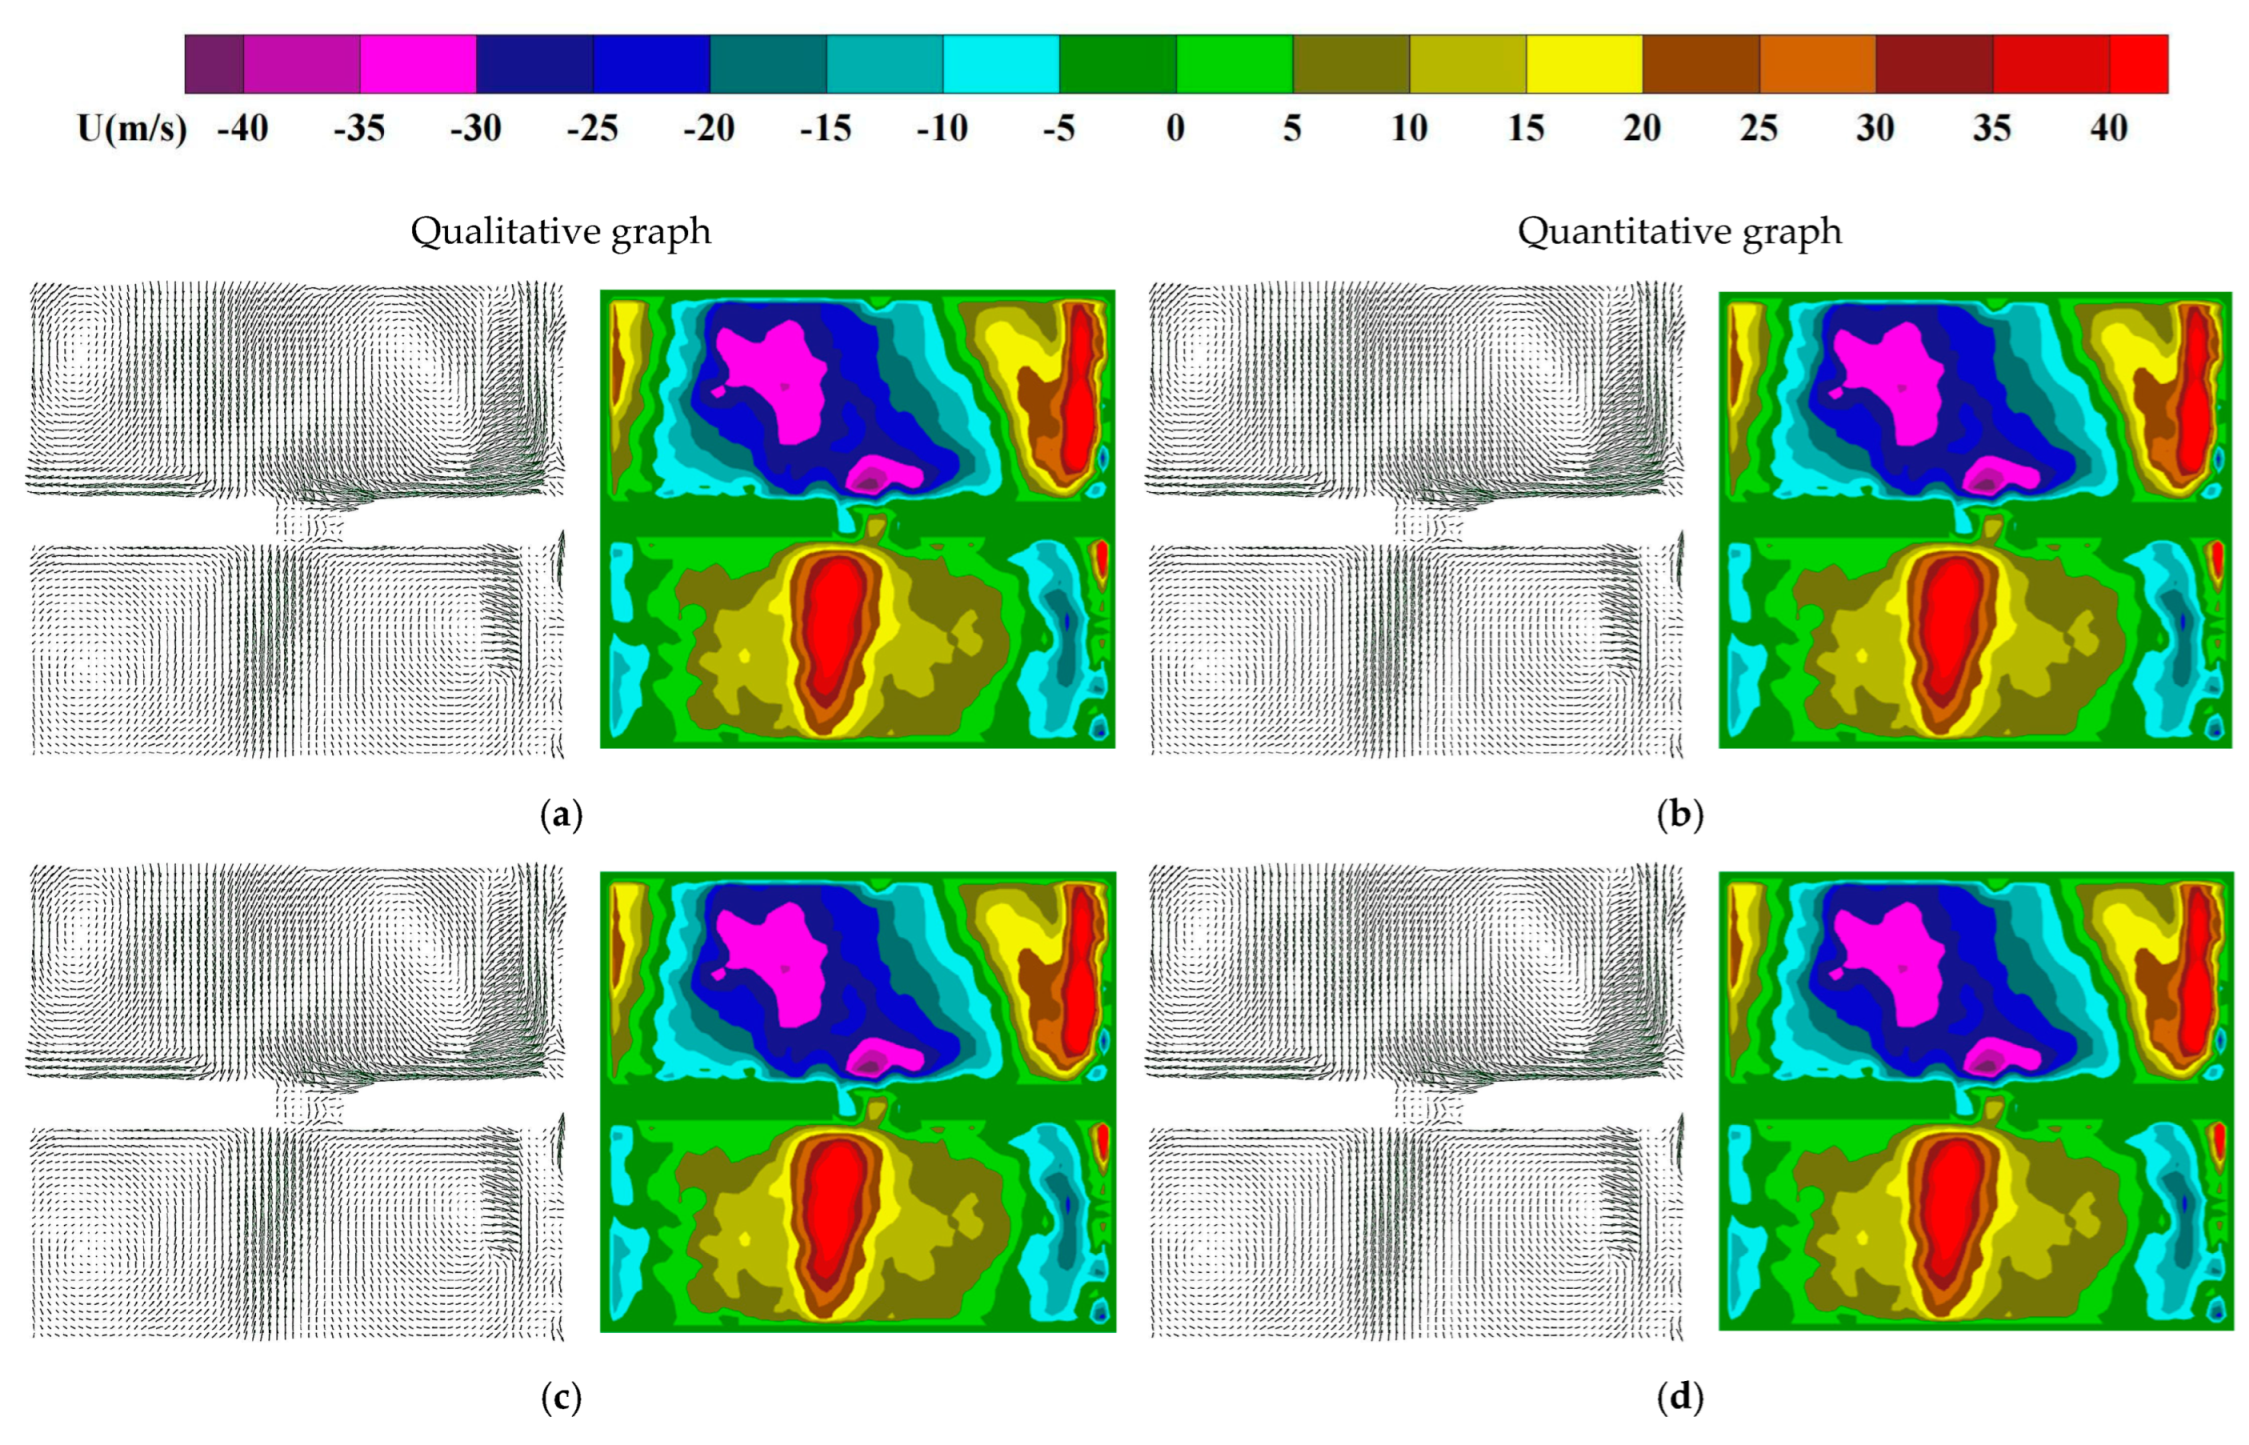
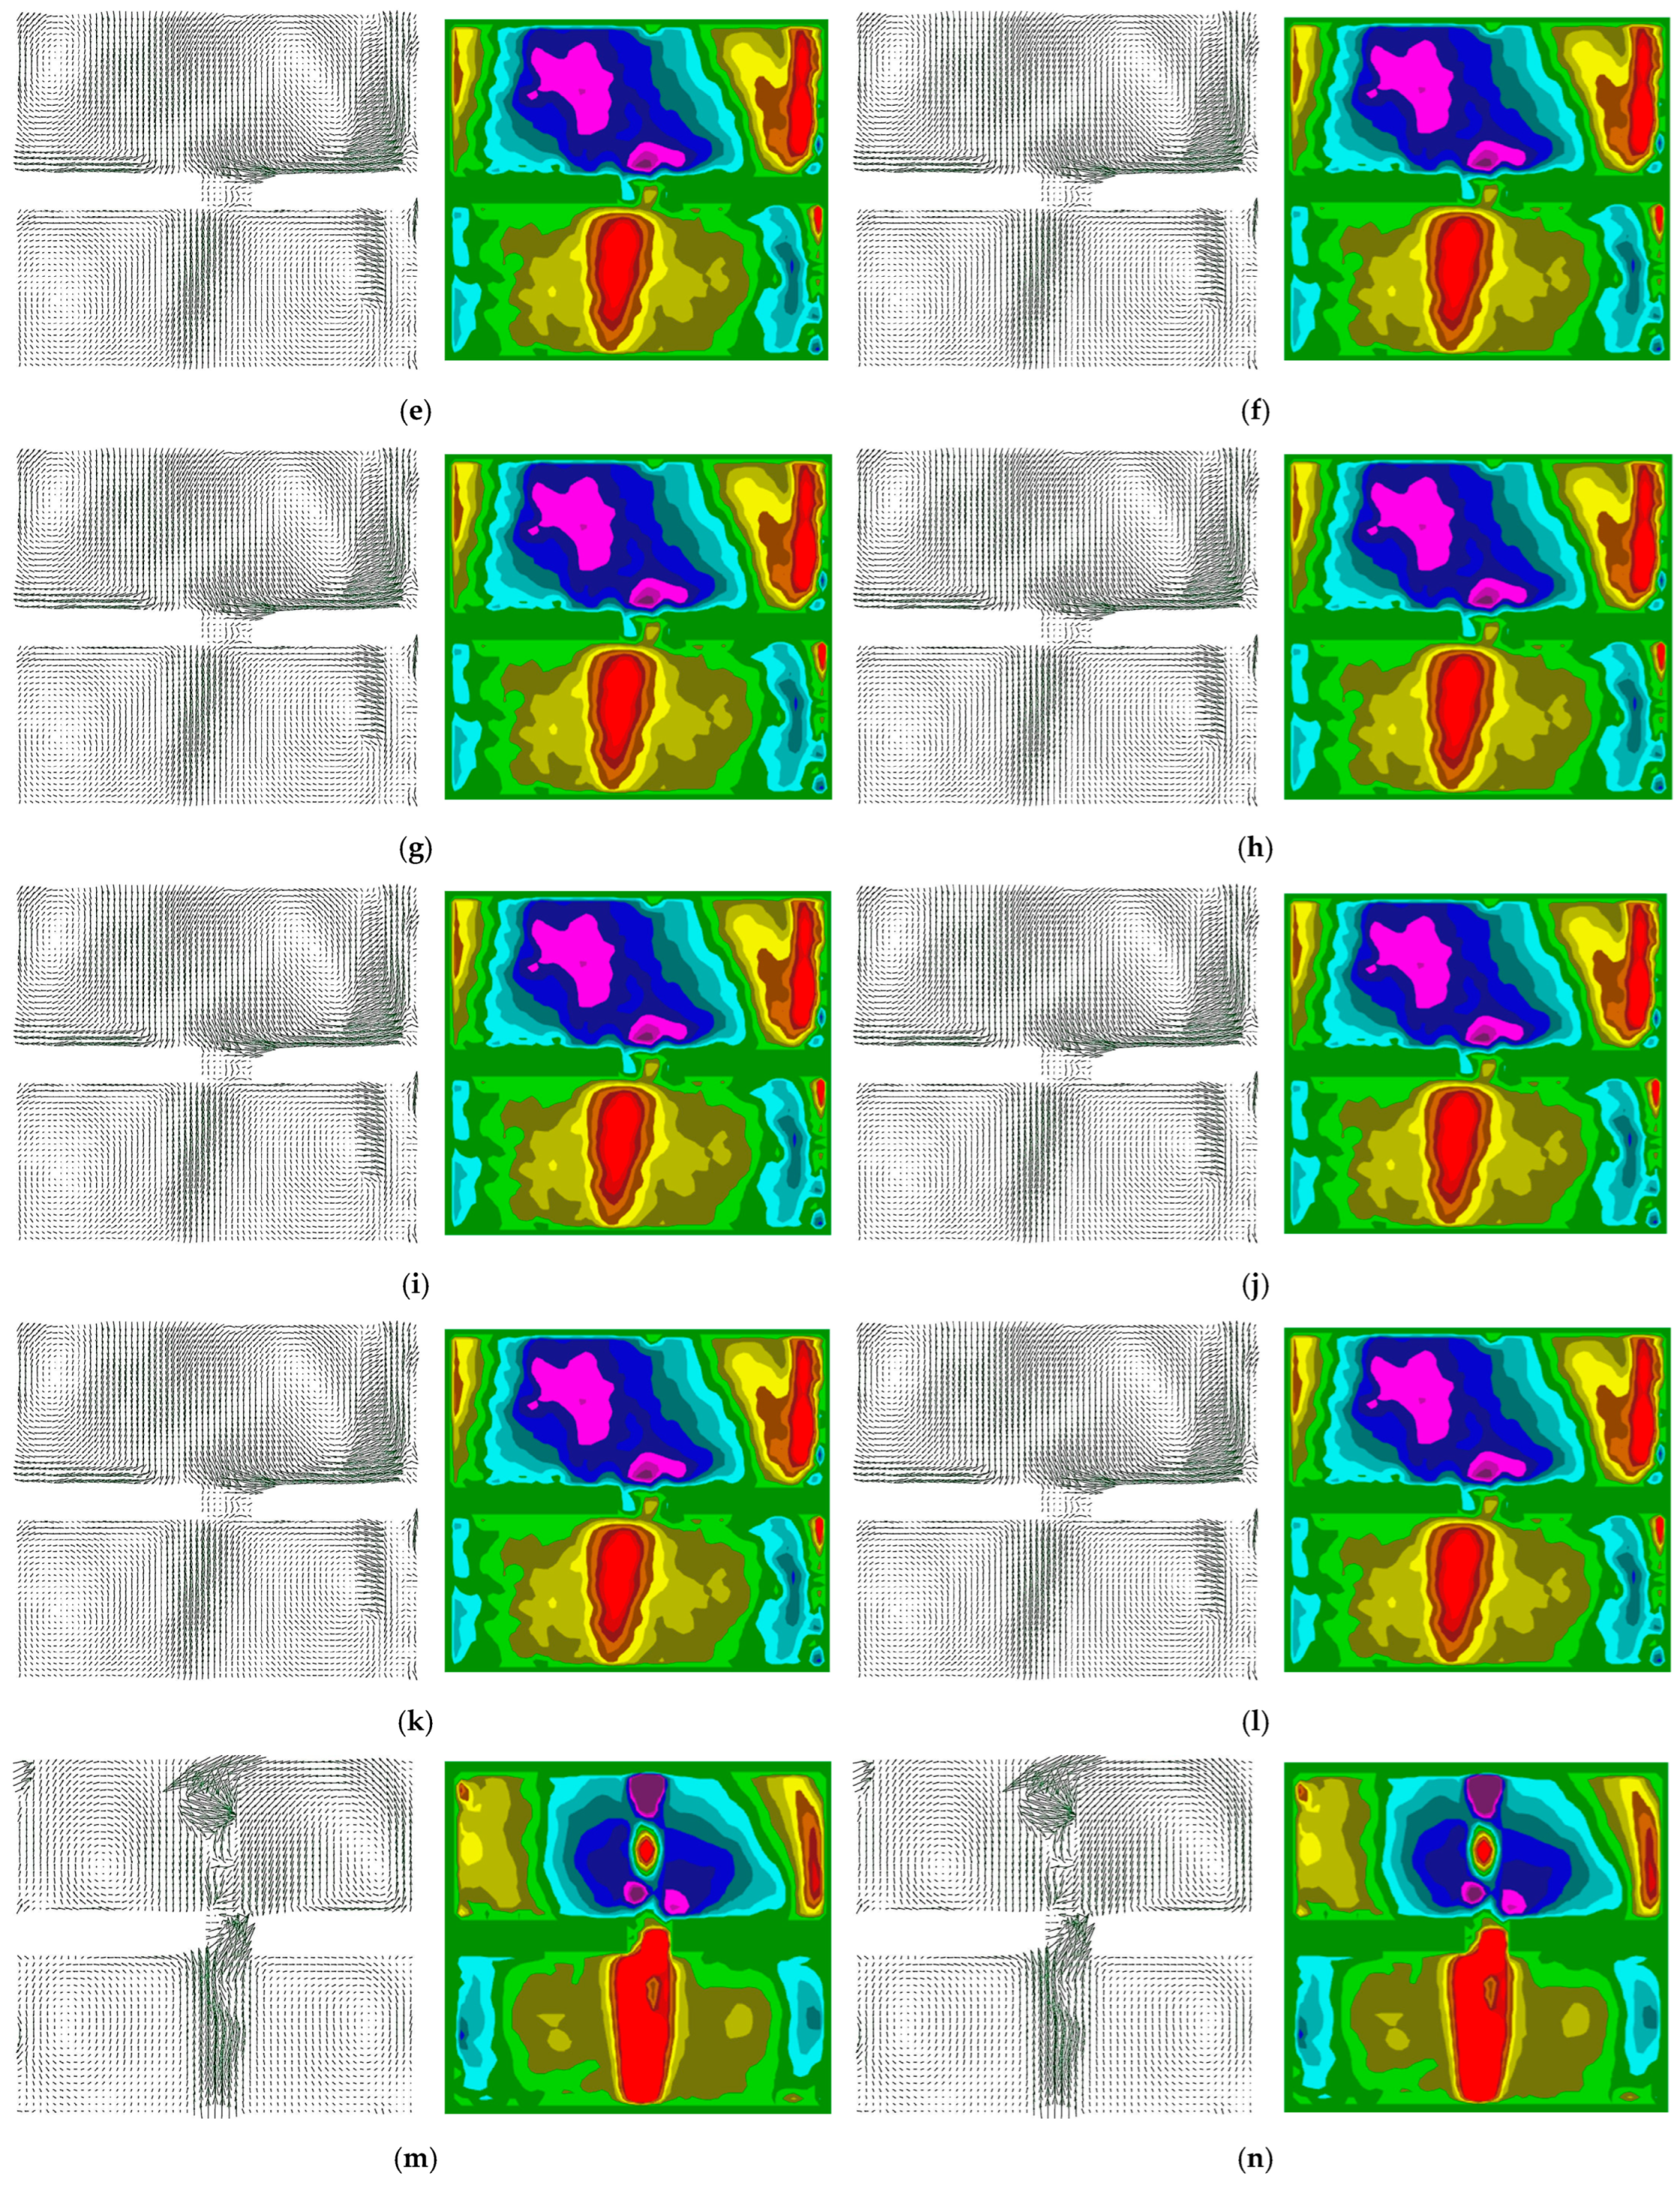
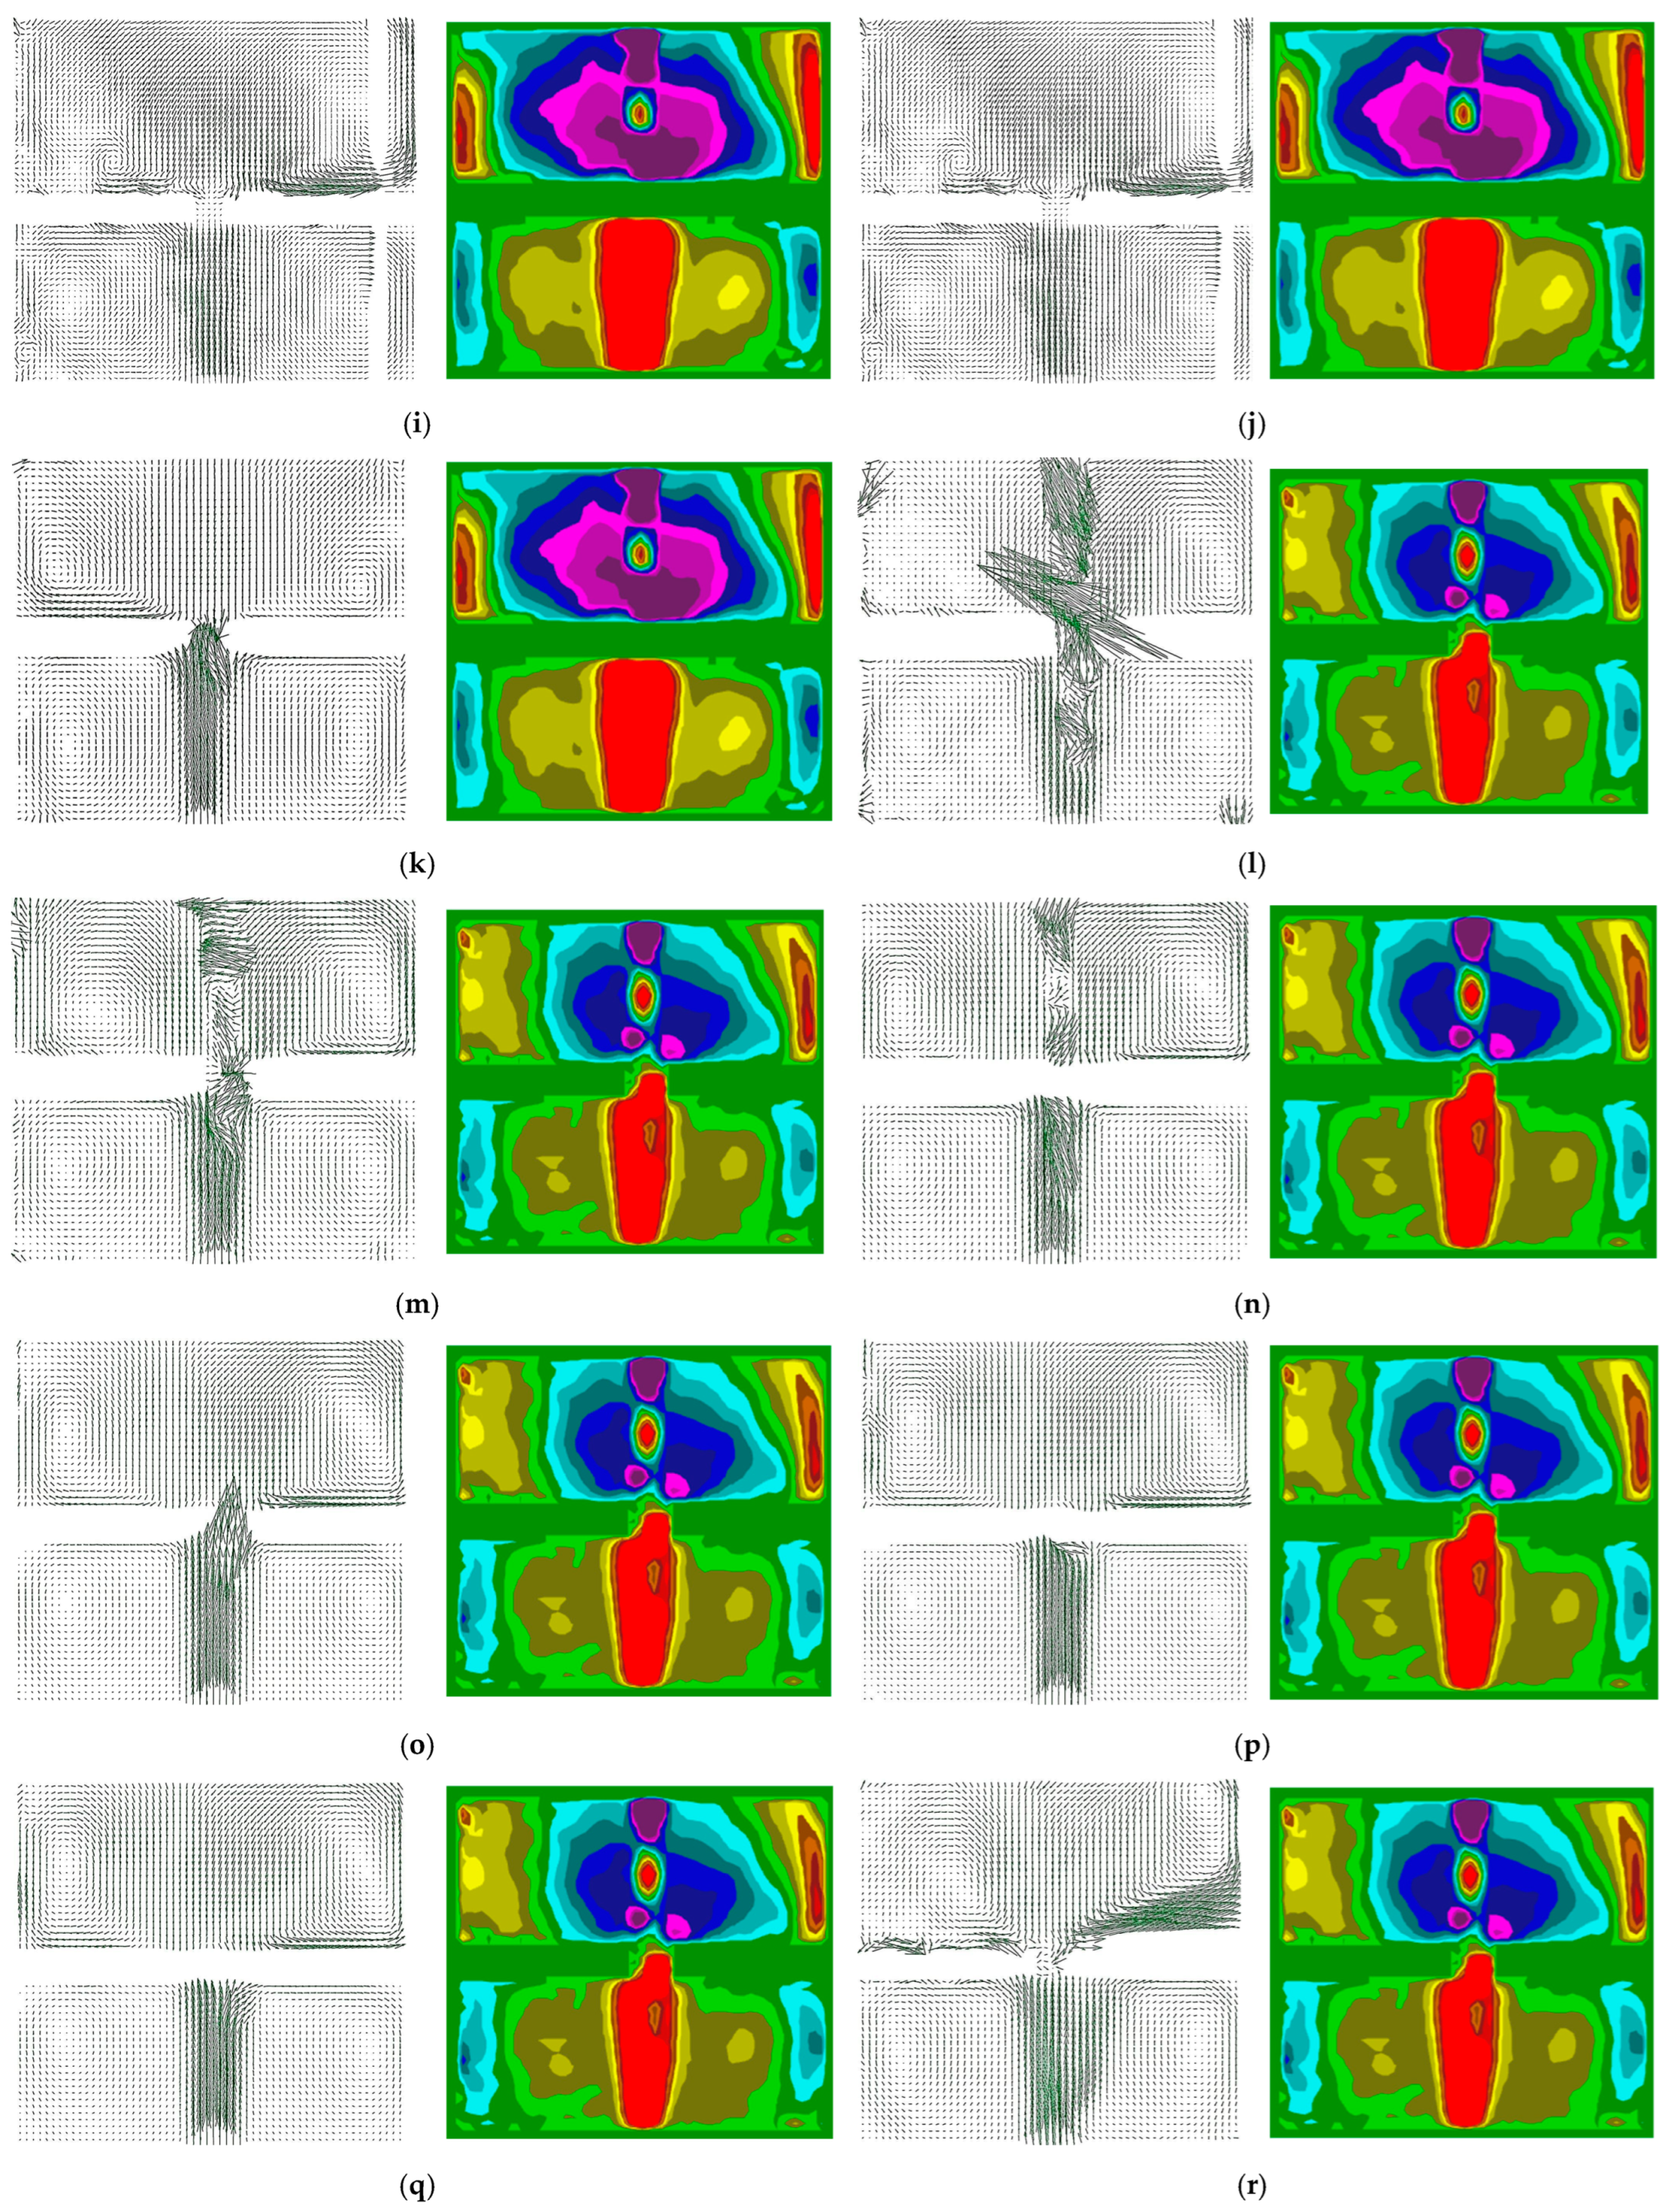
Table 3 shows some of the instruments used in this experiment and their corresponding indicators. According to the experimental requirements, different flow rates and umbrella valve opening parameters were set. The flow rate was controlled by adjusting the input voltage of the water pump and the opening of the control valve. For each working condition, a data acquisition system recorded measurements from pressure sensors and flow meters, while a particle image velocimetry (PIV) system captured dynamic images of tracer particles within the flow field. To ensure data reliability, multiple image sets were collected under each condition. For the internal flow field of the umbrella valve under varying operating conditions, velocity vector diagrams were constructed to visually represent the fluid flow direction and velocity distribution. In the schematic, The first number “1 and 2” represents the standard membrane and thickened membrane, the second number “6” represents the voltage input 6 V, the third number “0 and 90” corresponds to the angle parameters 0° and 90°, and the fourth number “3” represents working condition 3.
Figure 19 presents velocity vector diagrams of the internal flow field within the umbrella valve under various operating conditions. These diagrams visually depict the distribution of flow direction and velocity magnitude across the flow domain. Both qualitative and quantitative analyses are provided for each condition. The qualitative analysis offers an overview of flow patterns, directions, and other characteristic features, while the quantitative analysis delivers precise numerical data, such as velocity at discrete points within the flow field.
For the operating angles of 0° and 90°, six samples—numbered 1 through 6—were analyzed. Under constant flow rates but varying pressure conditions, the flow characteristics at these two angles are compared. The results show that, at fixed flow, increasing voltage leads to a progressive expansion of the umbrella valve opening, resulting in higher velocities and a broader velocity distribution. The qualitative diagrams reveal increased flow complexity, with the emergence of additional streamlines and vortices in regions that previously exhibited regular flow patterns.
Pressure variations also influence flow symmetry. At elevated pressures, the flow field remains relatively symmetrical; however, as pressure decreases, symmetry gradually deteriorates. Quantitative data further indicate that as the umbrella valve opening enlarges, both maximum and minimum velocities within the flow field change significantly. The maximum velocity increases markedly, while the minimum velocity also rises, albeit to a lesser degree. Spatial variations in velocity changes are notable as well: regions near the umbrella valve edge exhibit more pronounced velocity fluctuations compared to the relatively smooth changes observed near the centerline.
Comparing the flow fields at 0° and 90°, velocity variations are most pronounced in vertical planes at both the edge and centerline of the umbrella valve. Due to the valve’s structural characteristics, pressure in the lower region exceeds back pressure, inducing a butterfly-like vibration of the umbrella valve and consequently altering velocity profiles. A recirculation zone forms near the upper exit of the glass chamber; as flow rate increases, this zone expands and shifts downward.
Further comparison between the 0° and 90° flow field scenarios reveals distinct velocity change patterns. At 90°, the relative orientation between the umbrella valve and fluid flow direction causes larger and more frequent velocity fluctuations near the valve edge. Additionally, the shape and orientation of the recirculation zone differ with angle: at 0°, the recirculation area is relatively regular and circular, whereas at 90°, it elongates and narrows due to fluid flow direction. With increasing flow rates, the recirculation zone expands and descends at both angles; however, at 90°, it moves downward more rapidly, approaching the bottom of the glass chamber, potentially exerting a greater influence on overall flow field stability.
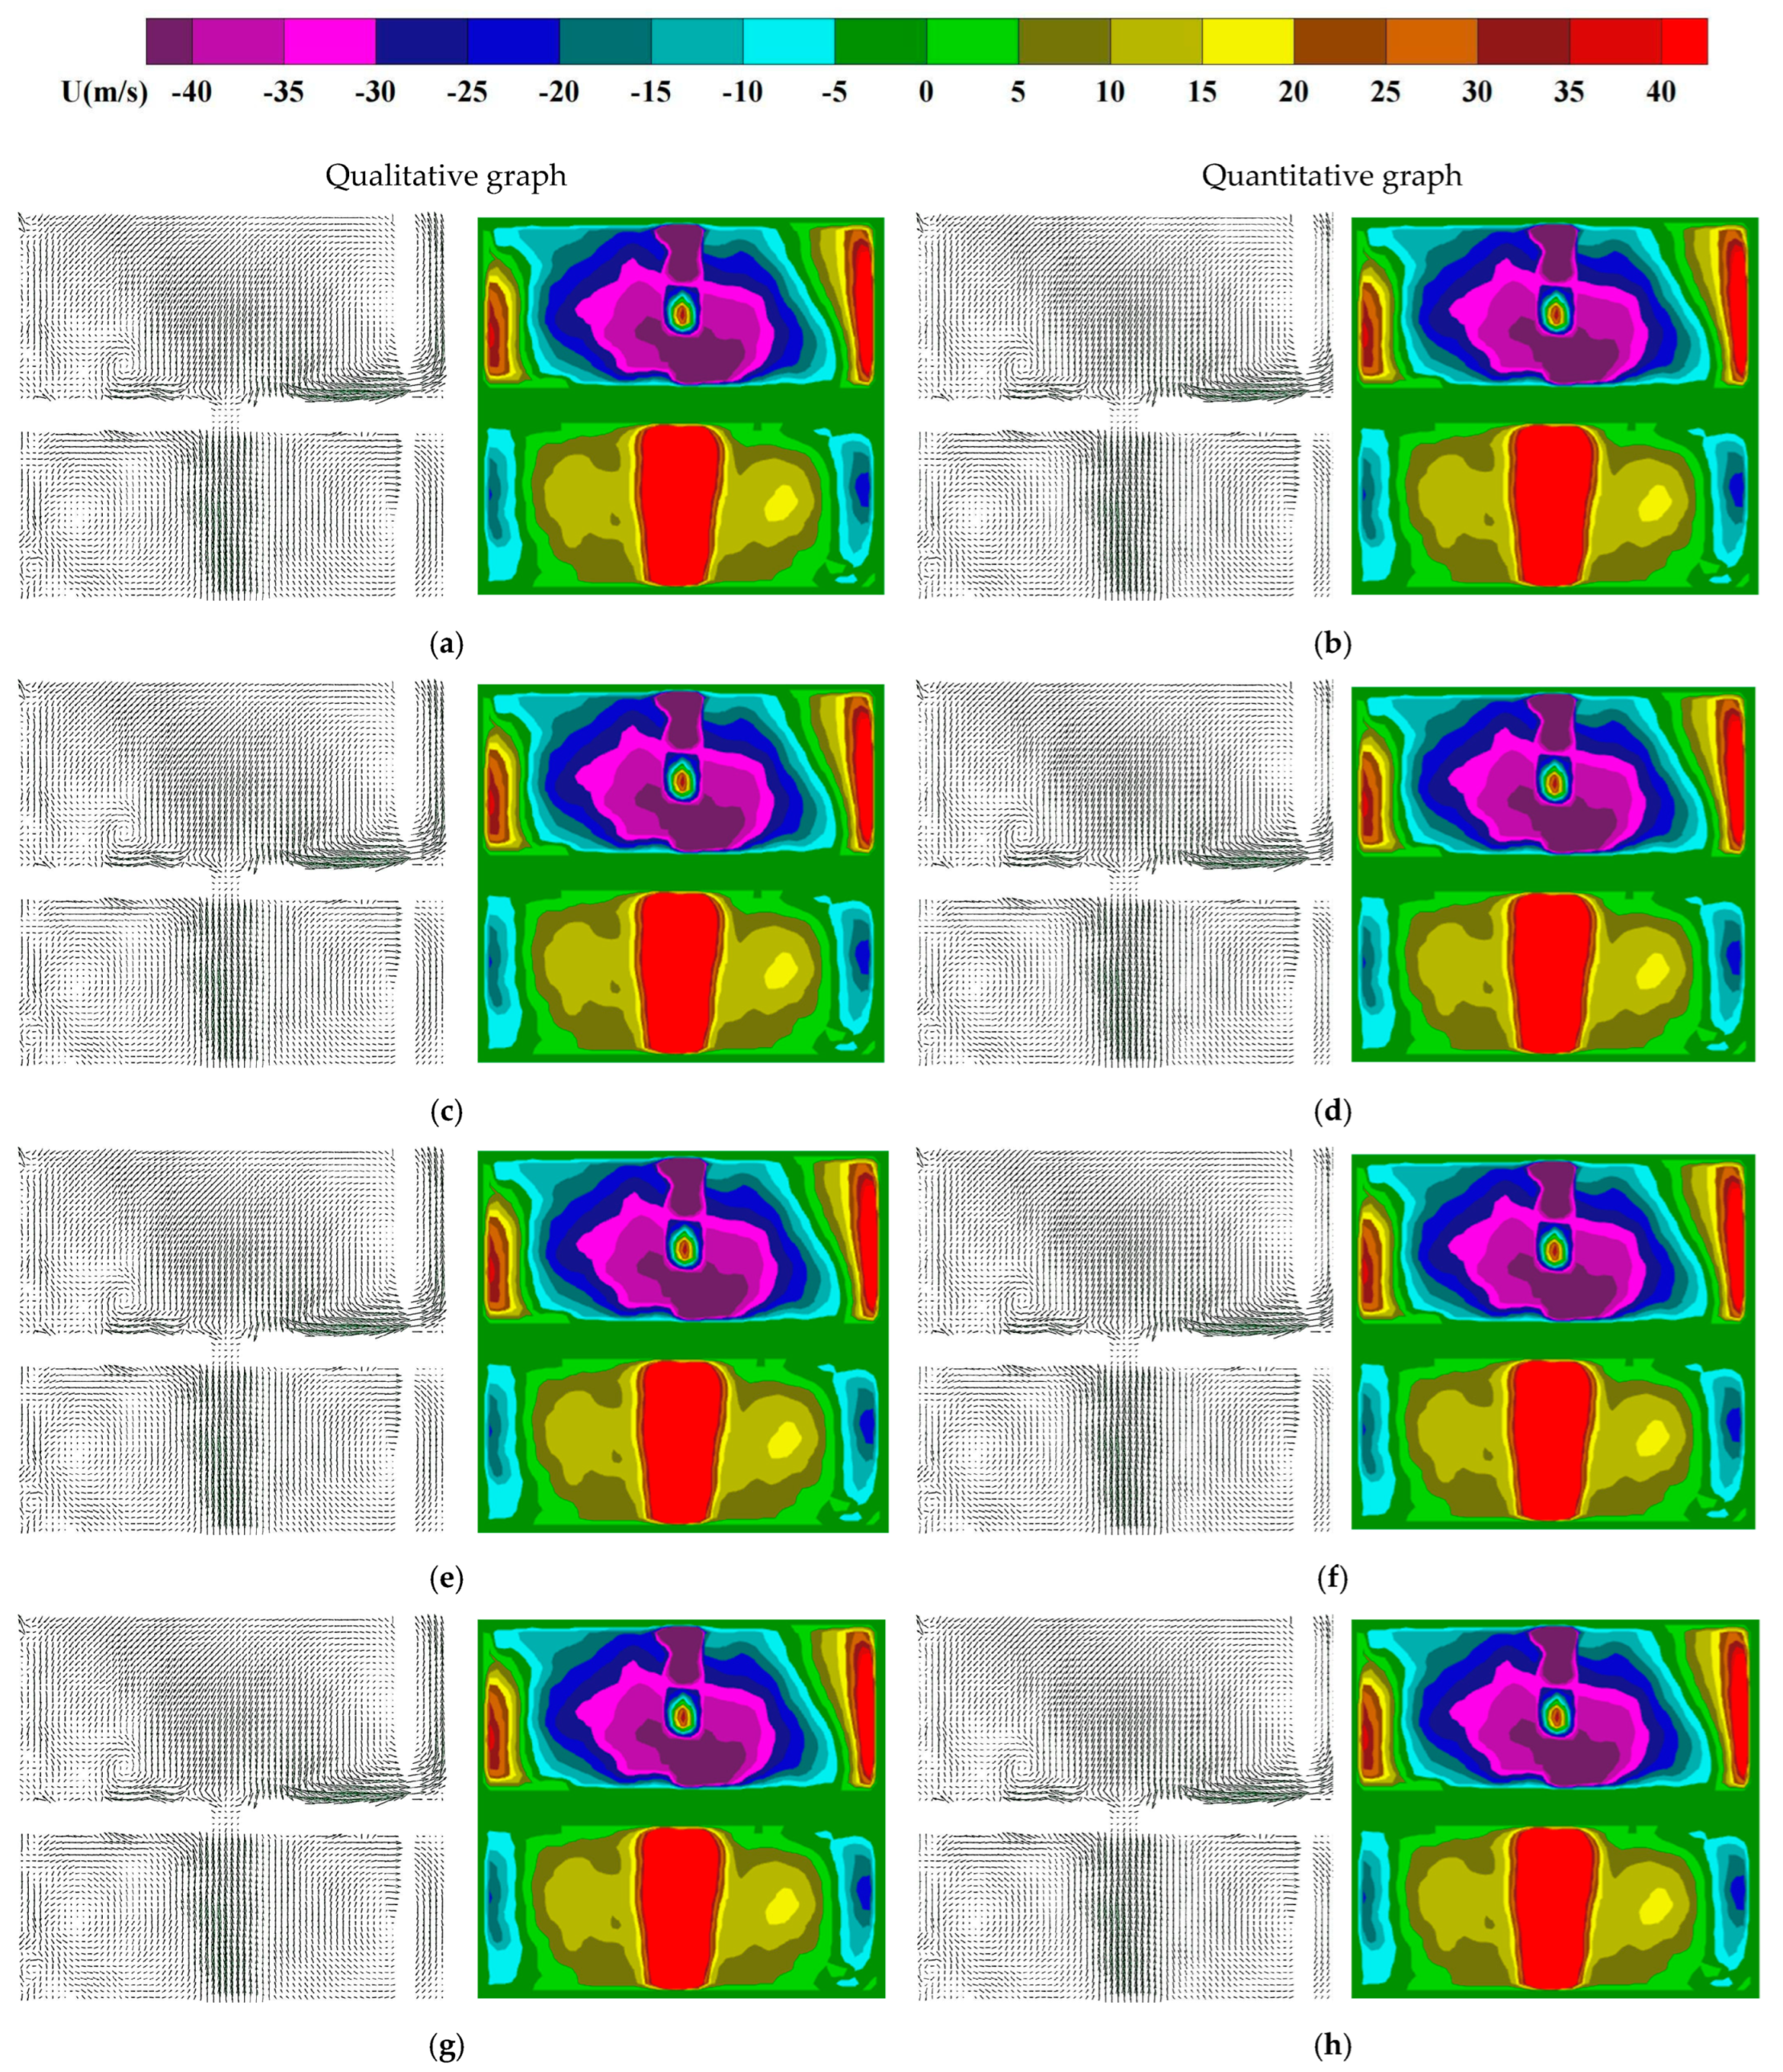
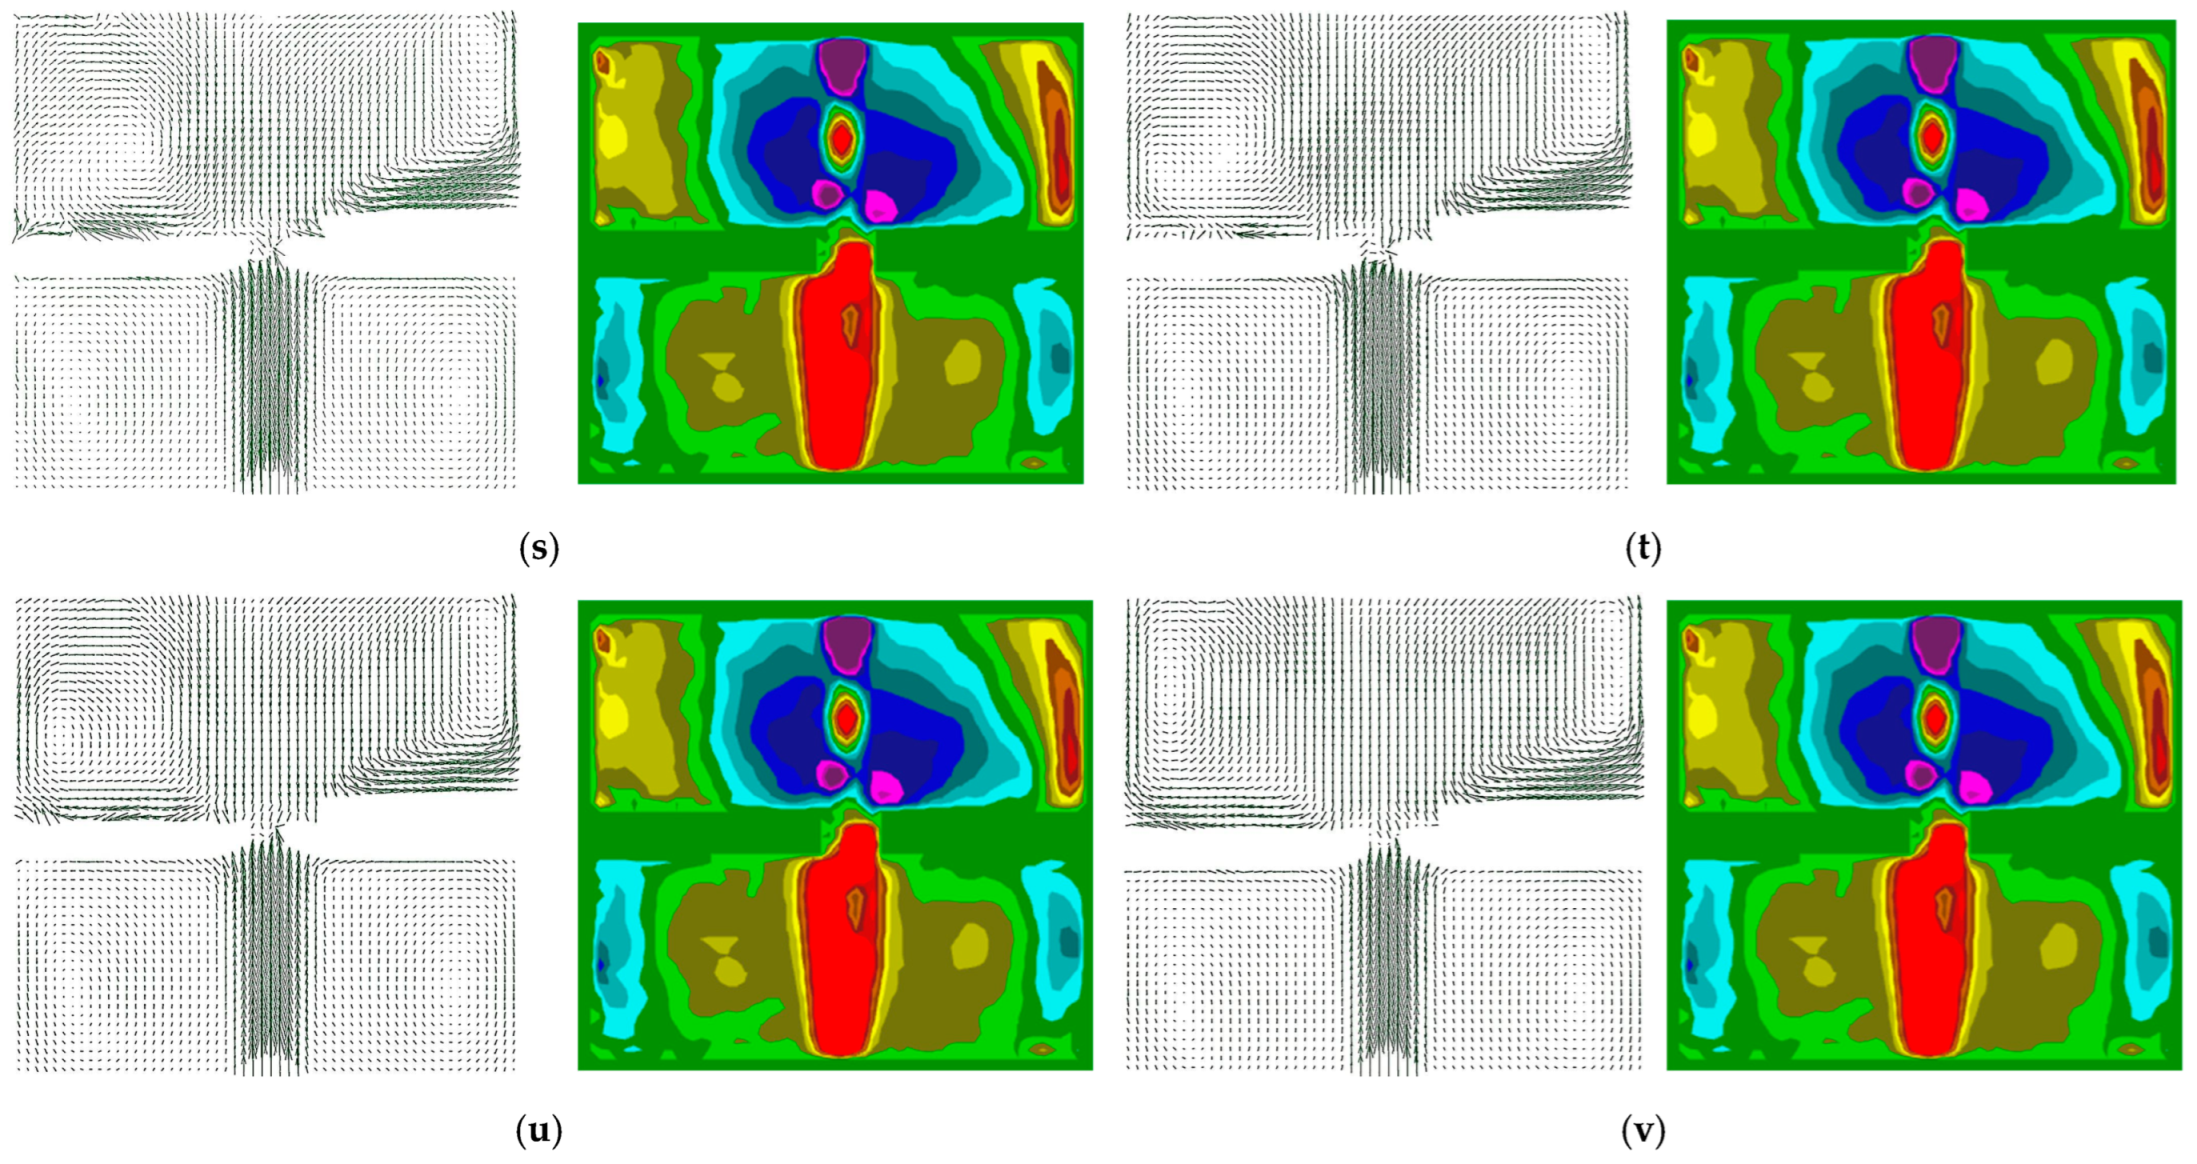
Figure 20 is a schematic diagram of the velocity vectors of the standard film and the thickened film at different pressures and angles. The location of vortices in or around the umbrella valve significantly influences its performance. Vortices forming near the valve port can disrupt normal fluid flow [27], leading to flow instabilities and abnormal local pressure fluctuations. When a vortex approaches the valve disc, it exerts uneven forces that interfere with the valve’s opening and closing mechanisms, potentially causing sealing issues or increased resistance during valve operation.
Vortex intensity is commonly quantified by vortex volume; larger vortex volumes correspond to stronger rotational flow. At constant pressure, increasing flow rates result in enlarged vortex volumes. High-intensity vortices consume more fluid energy, causing elevated pressure losses and reduced valve efficiency. Moreover, strong vortices generate substantial vibration and noise, adversely affecting system stability and reliability. The strength of a vortex can also be assessed via fluid velocity gradients. Additionally, intense vortices may erode the valve body’s inner wall and valve disc surfaces, shortening the umbrella valve’s service life.
Analysis reveals that vortex dynamics induce local pressure variations [28]. As flow rate increases, the vortex shifts markedly to the left, causing a significant pressure rise on the left side and a corresponding pressure drop on the right. This pressure differential alters fluid flow direction and velocity, disrupting previously stable patterns. Fluid tends to move toward the low-pressure region on the right, establishing new flow trajectories. Concurrently, vortex displacement induces local fluid acceleration and deceleration: increased pressure on the vortex’s left side creates a high-pressure stagnation zone that slows fluid velocity, while reduced pressure on the right accelerates flow, forming a low-pressure, high-velocity region.
These velocity distribution changes profoundly affect flow stability and distribution within the umbrella valve. In certain regions, this may cause either excessive or insufficient flow, compromising the valve’s normal operating efficiency. Furthermore, fluctuations in local pressure and velocity can initiate the formation of secondary vortices, further complicating and destabilizing flow dynamics.
Vortex formation and evolution also influence the umbrella valve’s dynamic response [29]. The generation and dissipation of large vortices slow valve opening and closing, thereby increasing system response time. This effect becomes especially pronounced in systems requiring rapid flow or pressure regulation. Optimizing valve geometry and flow conditions to minimize vortex formation and impact can improve the valve’s dynamic performance and meet rapid response demands.
Comparative analysis of umbrella valve internal geometries—standard diaphragm versus thickened diaphragm—under constant pressure but varying flow rates shows that vortices become more complex, with increased fluctuations in shape and position, resulting in greater fluid disturbances. Under constant flow rates and varying pressures, vortices become increasingly unstable and prone to breakup into smaller vortices, further disrupting fluid flow and producing more uneven velocity distributions within the valve [30]. These effects negatively impact flow distribution and stability, further reducing the valve’s dynamic response speed. Such factors must be carefully considered during valve design and operation to optimize overall performance.

7. Conclusions

Through an in-depth analysis of the steady-state structure of the balance pump model, we simulated the deformation and stress distribution of the diaphragm during the pump’s operation. The corresponding deformation and stress results were obtained, providing a solid foundation for the optimized design of the diaphragm structure. Based on the analysis presented in this paper, the following conclusions can be drawn:
1.
A steady-state structural analysis of the diaphragm pump was conducted using ANSYS, incorporating both large deformation and nonlinear material behavior of the rubber. The simulation results reveal a maximum stress of 8.64 MPa and a displacement of 0.134 mm, which occur at the lower edge of the fluid–solid coupling surface. These findings indicate that the fluid pressures are effectively balanced, providing critical insights for the structural optimization of diaphragm pump designs.
2.
A comparison between experimental results and actual operating conditions reveals that maximum stress occurs at the edge of the fluid–solid interface, aligning with the observed diaphragm failure locations. During the diaphragm’s return stroke, elevated tension in this region causes a sharp increase in local stress. Prolonged operation under these conditions leads to material fatigue and eventual structural failure. The observed damage at the diaphragm edge corroborates the predicted failure sites, thereby validating the accuracy of the stress analysis.
3.
PIV experiments on the umbrella valve demonstrate that, at a constant flow rate, increasing the voltage leads to greater valve opening, higher flow velocity, a wider velocity distribution, and more complex flow field patterns. These changes are accompanied by a loss of symmetry in the flow structure. Quantitative analysis shows a significant increase in both the maximum and minimum velocity values, with more pronounced velocity fluctuations near the valve edges. Abrupt changes are concentrated in the plane perpendicular to both the valve edge and the midline. At an angle of 90°, the edge velocity exhibits more frequent and larger amplitude variations.
4.
At constant pressure, an increase in flow rate leads to an expansion in vortex volume and higher energy consumption due to intensified vortex activity. This results in greater pressure loss and reduced overall efficiency. The elevated flow rate also introduces a left–right pressure differential, altering local velocities and destabilizing the flow distribution, which promotes the formation of additional small-scale vortices. Under varying flow rates, the behavior of the standard diaphragm becomes more complex. Vortices become increasingly unstable and prone to breakdown under different pressure conditions, ultimately reducing the system’s dynamic response speed.

Author Contributions

Conceptualization and Resource, G.P.; Methodology, H.C. (Han Chai); Software, C.L.; Writing—Original Draft Preparation, H.C. (Han Chai); Writing—Review and Editing, H.C. (Hao Chang); Validation, H.C. (Hao Chang); Data Curation, H.C. (Hao Chang); Investigation, K.Z.; Formal Analysis, J.Z. All authors have read and agreed to the published version of the manuscript.

Funding

The work was sponsored by the National Natural Science Foundation of China (Grant No. 52409114) and Science and Technology Program of JiangXi Education Department (GJJ2209004).

Data Availability Statement

The original contributions presented in this study are included in the article. Further inquiries can be directed to the corresponding author.

Conflicts of Interest

Authors Chengqiang Liu, Kai Zhao, Jianfang Zhang were employed by the Shenzhen Angel Drinking Water Industrial Group Corporation. The remaining authors declare that the research was conducted in the absence of any commercial or financial relationships that could be construed as a potential conflict of interest.

Appendix A

A2 cross-section diaphragm travel trajectory control code:
#include “udf.h”
#include <math.h>
/* Define constants */
#define A 0.042/* Amplitude of motion in y-direction 6mm */
#define PI M_PI/* Value of pi */
DEFINE_CG_MOTION(translate_invalva, dt, vel, omega, time, dtime)
{
real t, T, v_y;
T = 60.0/1350.0;
/* Calculate the current time */
t = time/T - floor(time/T);
/* Define the y-velocity as a function of time */
if (t < 0.1)
   {
v_y = 5*A*sin(PI*t/0.1);
}
   else if (t < 0.5)
   {
v_y = 0.0;
}
   else
   {
v_y = -A*sin(PI*(t-0.5)/0.5);
}
/* Set the velocity vector */
vel[1] = v_y;
}
A1, A3 cross-section diaphragm travel trajectory control code:
#include “udf.h”
#include <math.h>
/* Define constants */
#define A 0.042 /* Amplitude of motion in y-direction */
#define PI M_PI/* Value of pi */
DEFINE_CG_MOTION(translate_outvalve, dt, vel, omega, time, dtime)
{
real t, T, v_y;
T = 60.0/1350.0;
/* Calculate the current time */
t = time/T - floor(time/T);
/* Define the y-velocity as a function of time */
if (t < 0.5)
   {
/* Before half of the period */
v_y = A*sin(PI*t/0.5);
}
   else if (t < 0.6)
   {
/* Transition period */
v_y = -5*A*sin(PI*(t-0.5)/0.1);
}
   else
   {
/* After the transition period */
v_y = 0.0;
}
/* Set the velocity vector */
vel[1] = v_y;
}

References

  1. Khattak, M.M.; Dolph, A.W.; Headings, L.M.; Dapino, M.J. Magnetostrictive materials for tunable fluid pumps. In Behavior and Mechanics of Multifunctional Materials XVIII; SPIE: Bellingham, WA, USA, 2024; Volume 12947, pp. 97–107. [Google Scholar]
  2. Anis, Y.; Meldrum, D. Static and transient response analysis of a piezoelectric actuator driven diaphragm pico-liter pump. In Proceedings of the 2012 4th IEEE RAS & EMBS International Conference on Biomedical Robotics and Biomechatronics, Rome, Italy, 24–27 June 2012; pp. 652–656. [Google Scholar]
  3. Taylor, A.P.; Velásquez-García, L.F. Miniaturized diaphragm vacuum pump by multi-material additive manufacturing. J. Microelectromech. Syst. 2017, 26, 1316–1326. [Google Scholar] [CrossRef]
  4. Amiri, A.; Shabani, R.; Rezazadeh, G. Coupled vibrations of a magneto-electro-elastic micro-diaphragm in micro-pumps. Microfluid. Nanofluidics 2016, 20, 18. [Google Scholar] [CrossRef]
  5. Van Rijswick, R.; Talmon, A.; Van Rhee, C. Fluid structure interaction (FSI) in piston diaphragm pumps. Can. J. Chem. Eng. 2016, 94, 1116–1126. [Google Scholar] [CrossRef]
  6. Skupień, S.; Kowol, P.; Capizzi, G.; Sciuto, G.L. Control system hardware design, analysis and characterization of electromagnetic diaphragm pump. Appl. Sci. 2024, 14, 8043. [Google Scholar] [CrossRef]
  7. Ma, H.K.; Chen, R.H.; Yu, N.S.; Hsu, Y.H. A miniature circular pump with a piezoelectric bimorph and a disposable chamber for biomedical applications. Sens. Actuators A Phys. 2016, 251, 108–118. [Google Scholar] [CrossRef]
  8. Taylor, A.P.; Velásquez-García, L.F. 3-D printed miniaturized diaphragm vacuum pump. In Proceedings of the 2017 IEEE 30th International Conference on Micro Electro Mechanical Systems (MEMS), Las Vegas, NV, USA, 22–26 January 2017; pp. 1292–1295. [Google Scholar]
  9. Taylor, A.P.; Reyes, J.I.; Velásquez-García, L.F. Compact, magnetically actuated, additively manufactured pumps for liquids and gases. J. Phys. D Appl. Phys. 2020, 53, 355002. [Google Scholar] [CrossRef]
  10. Jiang, S.; Tang, C.; Dong, X.; Liu, X.J.; Zhao, H. Soft Pocket Pump for Multi-Medium Transportation via an Active Tubular Diaphragm. Adv. Funct. Mater. 2023, 33, 2305289. [Google Scholar] [CrossRef]
  11. Yang, S.D.; Shi, Y.C.; Pan, X.W.; Liu, Y.S. Theoretical and experimental study on flow characteristics of a diaphragm pump for urea-SCR systems. Int. J. Automot. Technol. 2019, 20, 835–844. [Google Scholar] [CrossRef]
  12. Thomas, D.J.; Tehrani, Z.; Redfearn, B. 3-D printed composite microfluidic pump for wearable biomedical applications. Addit. Manuf. 2016, 9, 30–38. [Google Scholar] [CrossRef]
  13. Jairazbhoy, V.; Stevenson, R.C. Mathematical modeling of molten metal dispensing: A study of a pneumatically actuated diaphragm-driven pump. Appl. Math. Model. 2008, 32, 141–169. [Google Scholar] [CrossRef]
  14. Yang, M.; Kabasawa, Y.; Ito, K. Fabrication of micro metallic valve and pump. In Fourth International Conference on Experimental Mechanics; SPIE: Bellingham, WA, USA, 2010; Volume 7522, pp. 509–514. [Google Scholar]
  15. Masse, P.A. Computer Modeling and Simulation of Pneumatically Driven Double-Diaphragm Pumps; University of Louisville: Louisville, KY, USA, 1995. [Google Scholar]
  16. Sakamoto, R.; Dao, D.V.; Tanaka, K.; Sugiyama, S. Design and fabrication process of a micropump using bulk Pb(Zr,Ti)O3 for microfluidic devices. In Device and Process Technologies for Microelectronics, MEMS, Photonics, and Nanotechnology IV; SPIE: Bellingham, WA, USA, 2008; Volume 6800, pp. 439–446. [Google Scholar]
  17. Lee, S.; Kim, K.J. Design of IPMC actuator-driven valve-less micropump and its flow rate estimation at lowReynolds numbers. Smart Mater. Struct. 2006, 15, 1103. [Google Scholar] [CrossRef]
  18. Lee, H.J.; Shin, D.J.; Park, K. Ultrasonic thermoforming of a large thermoplastic polyurethane film with the aid of infrared heating. J. Mech. Sci. Technol. 2017, 31, 5687–5693. [Google Scholar] [CrossRef]
  19. Cao, C.; Gao, X.; Conn, A.T. A magnetically coupled dielectric elastomer pump for soft robotics. Adv. Mater. Technol. 2019, 4, 1900128. [Google Scholar] [CrossRef]
  20. Ping, X.; Yao, B.; Niu, K.; Yuan, M. A machine learning framework with an intelligent algorithm for predicting the isentropic efficiency of a hydraulic diaphragm metering pump in the organic rankine cycle system. Front. Energy Res. 2022, 10, 851513. [Google Scholar] [CrossRef]
  21. Abe, T.; Oh-Hara, S.; Ukita, Y. Adoption of reinforcement learning for the intelligent control of a microfluidic peristaltic pump. Biomicrofluidics 2021, 15, 034101. [Google Scholar] [CrossRef]
  22. Truong, B.N.M.; Ahn, K.K. Modeling, control and experimental investigation of time-average flow rate of a DEAP actuator based diaphragm pump. Int. J. Precis. Eng. Manuf. 2017, 18, 1119–1129. [Google Scholar] [CrossRef]
  23. Sato, K.; Orihashi, K.; Kurosaki, T.; Tokumine, A.; Fukunaga, S.; Ninomiya, S.; Sueda, T. Analysis of flow patterns in a ventricular assist device: A comparative study of particle image velocimetry and computational fluid dynamics. Artif. Organs 2009, 33, 352–359. [Google Scholar] [CrossRef]
  24. Van der Burgt, R.C.; Anderson, P.D.; den Toonder, J.M.; van de Vosse, F.N. A microscale pulsatile flow device for dynamic cross-slot rheometry. Sens. Actuators A Phys. 2014, 220, 221–229. [Google Scholar] [CrossRef]
  25. Zhao, H.; Zhu, B.; Wang, C.; Han, Y. A prospective assessment of vortex evolution mechanisms and pressure fluctuation coupling in novel low-head pumped hydro energy storage units. Energy Convers. Manag. 2025, 342, 120136. [Google Scholar] [CrossRef]
  26. Zhao, H.; Zhu, B.; Xu, R.; Tan, L.; Zhang, H.; Chen, L.; Liu, Z.; Yang, J.; Deng, F. Evaluating the predictive potential of modeling frameworks for Pelton turbine energy performance and guiding engineering modeling in hydroelectric applications. Energy 2025, 330, 136861. [Google Scholar] [CrossRef]
  27. Tang, S.; Yan, Z.; Xue, Y.; Lim, K.M.; Zhu, Y. Deep transferable model with multi-head attention for small sample fault diagnosis of hydraulic pumps. Eng. Appl. Artif. Intell. 2025, 160, 111808. [Google Scholar] [CrossRef]
  28. Zhou, P.; Li, J.; Wu, Y.; Wang, Y.; Zhou, X.; Wen, Z.; Zhao, H. Study of cavitation-induced flow characteristics of a vortex pump based on coherence analysis. Phys. Fluids 2025, 37, 033318. [Google Scholar] [CrossRef]
  29. Chang, H.; Wang, Z.; Peng, G.; Shi, W.; Lin, R.; Zhou, L. Role of wall roughness on energy dissipation and vortex dynamics in self-priming centrifugal pump: A study via entropy generation and Liutex vortex identification. Energy 2025, 337, 138733. [Google Scholar] [CrossRef]
  30. Chang, H.; Yang, J.; Wang, Z.; Peng, G.; Lin, R.; Lou, Y.; Zhou, L. Efficiency optimization of energy storage centrifugal pump by using energy balance equation and non-dominated sorting genetic algorithms-II. J. Energy Storage 2025, 114, 115817. [Google Scholar] [CrossRef]
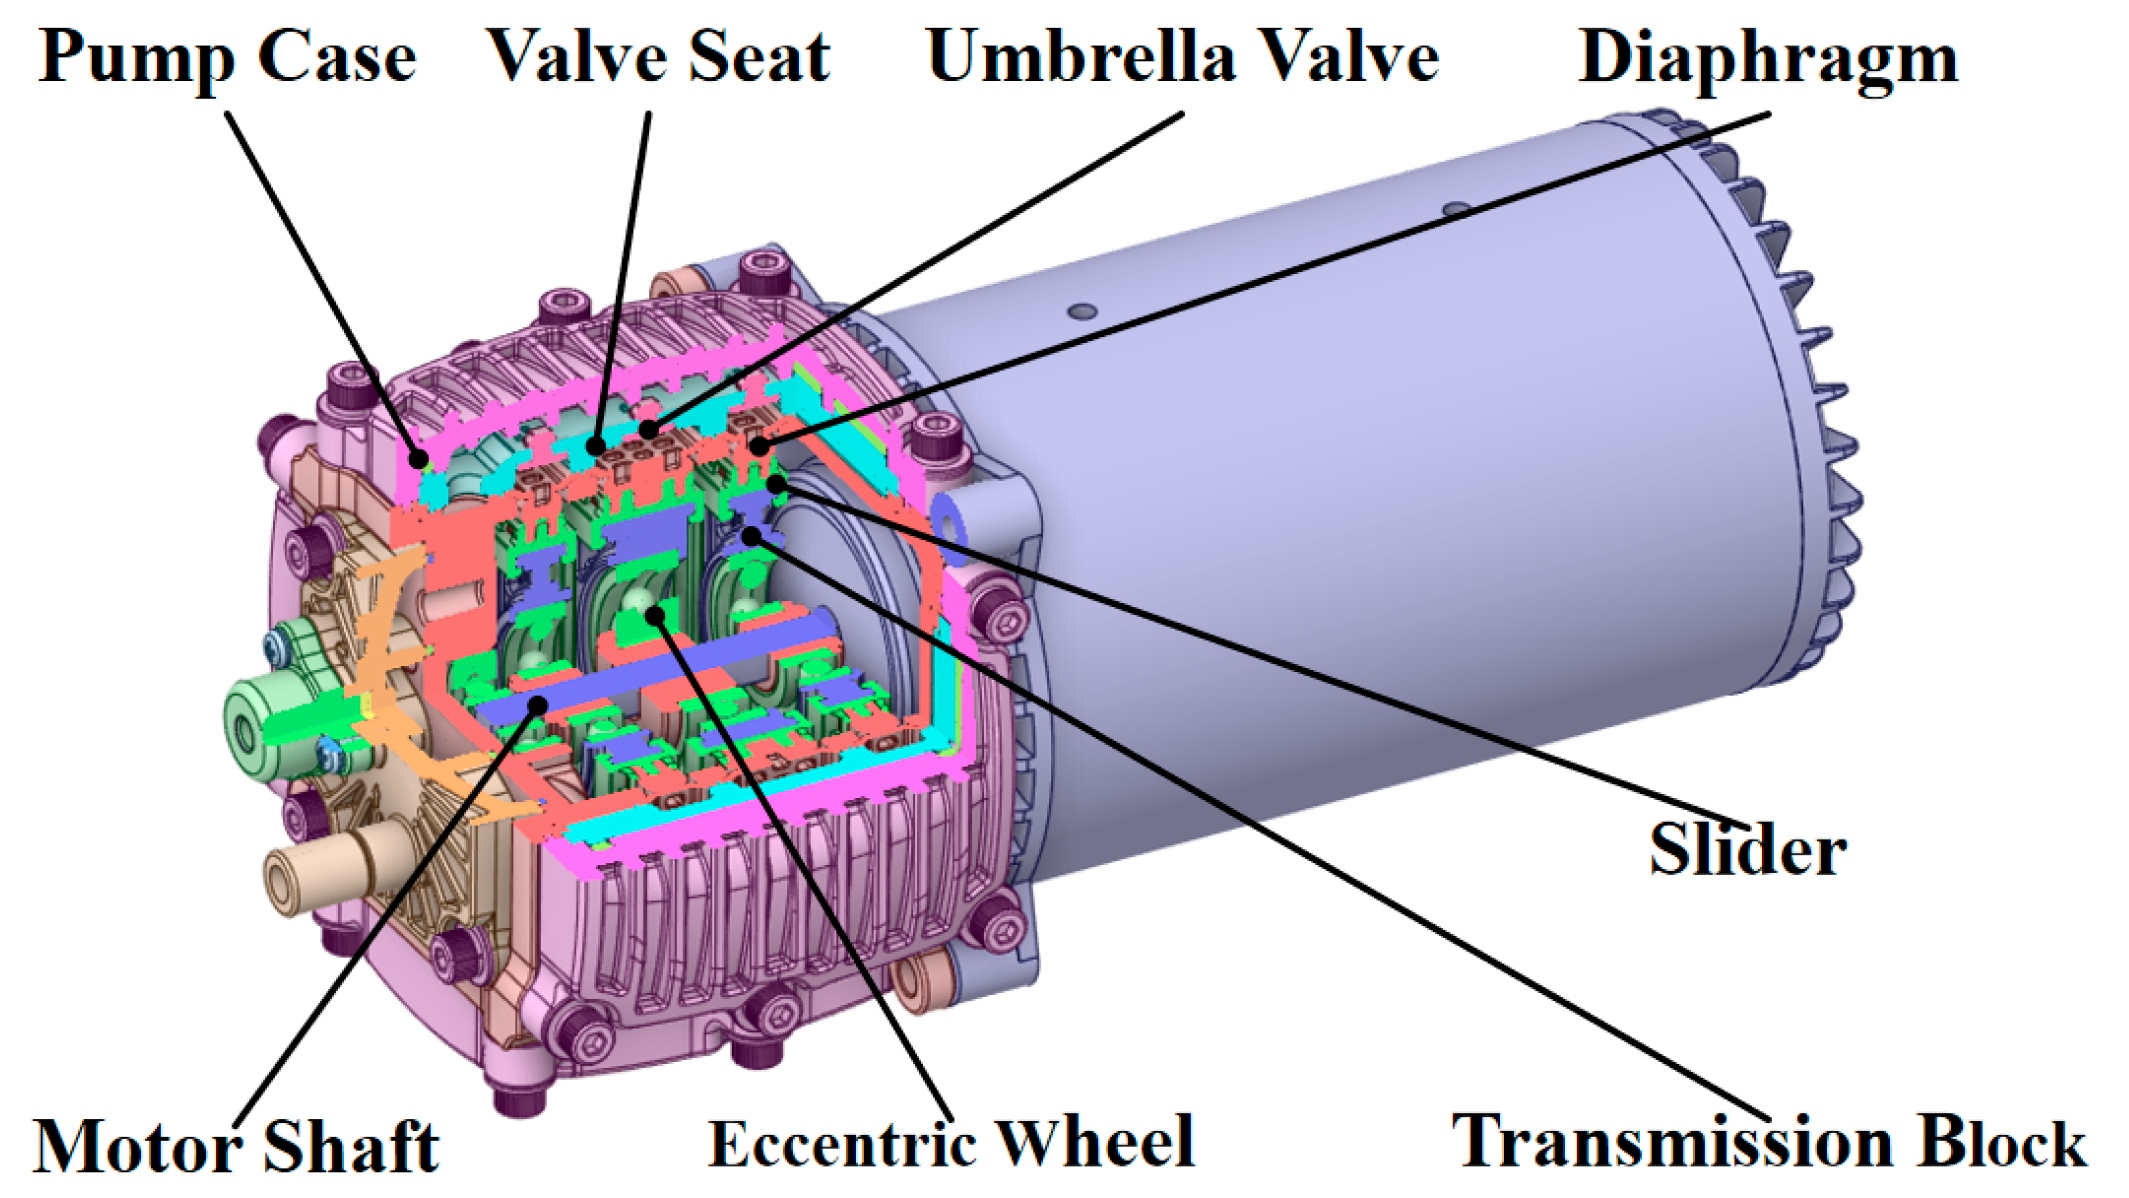
Figure 1. Schematic and internal structure of four-way opposite balanced diaphragm pump.
Water 17 03094 g001
Figure 2. Pump diaphragm.
Water 17 03094 g002
Figure 3. Schematic scheme of the plane axis system model.
Water 17 03094 g003
Figure 4. Meshing of a simplified model of a four-way opposed diaphragm pump.
Water 17 03094 g004
Figure 5. Diaphragm deformation value of radial diaphragm pump.
Water 17 03094 g005
Figure 6. Diaphragm stress value of radial diaphragm pump.
Water 17 03094 g006
Figure 7. Stress distribution in the X-direction.
Water 17 03094 g007
Figure 8. Stress distribution in the Y-direction.
Water 17 03094 g008
Figure 9. Stress distribution in the Z-direction.
Water 17 03094 g009
Figure 10. Cross-sectional position of (a) A1; (b) A2; (c) A3.
Water 17 03094 g010
Figure 11. The pressure distribution of the A1 cross-section. (a) 0°; (b) 60°; (c) 120°; (d) 180°; (e) 240°; (f) 300°.
Water 17 03094 g011aWater 17 03094 g011b
Figure 12. The pressure distribution of the A2 cross-section. (a) 0°; (b) 60°; (c) 120°; (d) 180°; (e) 240°; (f) 300°.
Water 17 03094 g012
Figure 13. The pressure distribution of the A3 cross-section. (a) 0°; (b) 60°; (c) 120°; (d) 180°; (e) 240°; (f) 300°.
Water 17 03094 g013
Figure 14. The velocity distribution of the A1 cross-section. (a) 0°; (b) 60°; (c) 120°; (d) 180°; (e) 240°; (f) 300°.
Water 17 03094 g014aWater 17 03094 g014b
Figure 15. The velocity distribution of the A2 cross-section. (a) 0°; (b) 60°; (c) 120°; (d) 180°; (e) 240°; (f) 300°.
Water 17 03094 g015
Figure 16. The velocity distribution of the A3 cross-section. (a) 0°; (b) 60°; (c) 120°; (d) 180°; (e) 240°; (f) 300°.
Water 17 03094 g016aWater 17 03094 g016b
Figure 17. Schematic scheme of umbrella valve PIV experiment.
Water 17 03094 g017
Figure 18. Schematic diagram of the umbrella valve placement.
Water 17 03094 g018
Figure 19. Flow-field distributions of standard and thickened membranes under varying flow rates and angles. (a) 1-12-0-1; (b) 1-12-0-2; (c) 1-12-0-3; (d) 1-12-0-4; (e) 1-12-0-5; (f) 1-12-0-6; (g) 1-12-90-1; (h) 1-12-90-2; (i) 1-12-90-3; (j) 1-12-90-4; (k) 1-12-90-5; (l) 1-12-90-6; (m) 2-12-0-1; (n) 2-12-0-2; (o) 2-12-0-3; (p) 2-12-0-4; (q) 2-12-0-5; (r) 2-12-0-6; (s) 2-12-90-1; (t) 2-12-90-2; (u) 2-12-90-3; (v) 2-12-90-4; (w) 2-12-90-5; (x) 2-12-90-6.
Water 17 03094 g019aWater 17 03094 g019bWater 17 03094 g019c
Figure 20. Flow-field distributions of standard and thickened membranes under varying pressures and angles. (a)1-12-0-3; (b) 1-18-0-3; (c) 1-24-0-3; (d) 1-30-0-3; (e) 1-36-0-3; (f) 1-6-90-3; (g) 1-12-90-3; (h) 1-18-90-3; (i) 1-24-90-3; (j) 1-30-90-3; (k) 1-36-90-3; (l) 2-6-0-3; (m) 2-12-0-3; (n) 2-18-0-3; (o) 2-24-0-3; (p) 2-30-0-3; (q)2-36-0-3; (r) 2-6-90-3; (s) 2-12-90-3; (t) 2-18-90-3; (u) 2-24-90-3; (v) 2-30-90-3.
Water 17 03094 g020aWater 17 03094 g020bWater 17 03094 g020c
Table 1. Main parameters of balanced diaphragm pump.
PARAMETERSCALIBRATION
D15.5
D25.5
D30.55
PIN30
POUT100
N1350
Q4000
Table 2. Common tracer particles in liquid flow fields.
ParametersMaterialAverage Diameter (mm)
SolidPolystyrene10–100
Aluminum powder2–7
Glass beads10–100
Synthetic cotton particles10–500
LiquidVarious oils50–500
GasOxygen bubbles50–1000
Table 3. Experimental instrument parameters.
ParametersModelPerformance Parameters
Diaphragm pumpQWRated inlet pressure: 207 kPa
Rated outlet pressure: 690 kPa
Rated flow rate: 4 L/min
Terbing flow meterLWGY-SUP-DN4-JS-BDCCFlow range: 60 L/h–360 L/h
Accuracy: 0.5%
Flow control valveWL94H-320PAccuracy: ±0.005 mm
Pressure gaugeSUP-PX400-JS-BDCCPressure range: 0–1.6 MPa
Accuracy: 0.25%
Disclaimer/Publisher’s Note: The statements, opinions and data contained in all publications are solely those of the individual author(s) and contributor(s) and not of MDPI and/or the editor(s). MDPI and/or the editor(s) disclaim responsibility for any injury to people or property resulting from any ideas, methods, instructions or products referred to in the content.