Abstract
The effective design and operation of hydraulic structures, particularly open channel spillways, are crucial for water resource management and flood risk reduction in dams. A clear understanding of flow properties, such as velocity fluctuations and discharge, across various depths is essential for optimizing performance. In this study, experimental analysis and numerical simulation using FLOW-3D were combined to investigate the hydraulic parameters of a scaled model of the Romaine IV spillway located in Quebec, Canada. Measurements focused on flow properties, including velocity fluctuations at various discharge rates in specific flow depths, at selected points along the spillway. The numerical model was assessed by reproducing experimental geometry, initial water levels, and boundary conditions, and through sensitivity analyses to ensure accurate flow representation. Comparisons of flow rates of 180, 240, and 340 L/s showed that while simulations with the renormalized group (RNG) turbulence model reliably predicted average velocities, they underestimated maximum values and overestimated minimum values, especially at higher discharges. The results highlight the difficulty of accurately capturing velocity extremes in turbulent flows and the need for further model refinement. This was evident from the 60% discrepancy in minimum velocities observed at the channel center. Despite these discrepancies, the study advances our understanding of spillway performance and identifies avenues to improve the accuracy of numerical modeling in hydraulic engineering.
1. Introduction
Spillways are crucial components in hydraulic engineering and dam safety, serving as essential mechanisms for controlling water flow and preventing dam failure. Among their various types, open channel spillways are particularly important due to their superior energy dissipation and effectiveness in safely conveying excess water from reservoirs during periods of high inflow, such as heavy rainfall or rapid snowmelt [1]. This prevents the overtop of dams and potential catastrophic failures [2]. By reducing pressure on dam structures through incorporating their superb energy dissipation features, open channel spillways protect downstream by safely release excess water from the reservoir to prevent the dam overtopping and local damage. Furthermore, these types of spillways provide operational flexibility for water resource management, including hydropower generation and maintaining navigational channels [3].
Studying the behavior of flow in spillways is of crucial significance in ensuring the safety and efficiency of water management systems [4]. However, predicting flow characteristics in these hydraulic structures presents several challenges due to the complex nature of the fluid dynamics involved. One major challenge is the complex flow patterns, including turbulence, air entrainment, and eddies, which are difficult to model accurately [5]. Scale effects are another problem, as the behavior of water in small-scale models often does not accurately represent full-scale conditions, leading to inconsistencies in predictions [6].
Furthermore, the interaction between the flow and the spillway structure itself, including potential vibrations and surface roughness, must be considered to ensure stability and performance [7,8]. Despite advancements in Computational Fluid Dynamics (CFD) modeling, simulating the highly turbulent and variable flow conditions in spillways still requires significant computational resources and sophisticated modeling techniques. Moreover, accurate predictions rely on well-calibrated and validated models; but gathering sufficient field data for this purpose can be particularly challenging during extreme events [9]. Addressing these challenges requires a combination of advanced modeling techniques, empirical data collection, and continuous refinement of predictive models to improve their accuracy and reliability.
Hydraulic engineering has traditionally relied on physical models for designing spillways, but numerical simulations are increasingly used [10]. These computational models, including 1D, 2D, and 3D approaches with various equations and discretization schemes, still require validation against physical prototypes to ensure accurate representation of flow processes [11]. Early spillway flow models were primarily one-dimensional, useful for estimating water surface profiles but unable to capture three-dimensional flow features [12]. Guercio and Magini [13] modeled 1D spillway flow using a free-surface equation derived from momentum principles, which was initially developed by Yen and Wenzel Jr [14] and later refined by Yen [15] based on the St-Venant equations. The method neglected turbulence, assumed hydrostatic pressure, and constant width, making results dependent on momentum correction factors determined from physical tests. In later studies, Berger and Carey [16] and Unami, Kawachi [17], conducted 2D spillway flow simulations using Euler and shallow water equations, capturing perturbations and curvature effects, and found good agreement with physical measurements at various discharge rates. However, these models are limited in applicability for complex, turbulent spillway flows due to assumptions of mild bed slopes and perturbation expansions. In another study, Causon, Mingham [18] applied a Godunov-type finite volume method for supercritical flow simulations, improving spillway capacity and bed pressure predictions, but shallow water assumptions limited accuracy for hydraulic jumps and 3D flow features. Recent advancements in spillway flow modeling have transitioned from 2D to more sophisticated 3D simulations, which represent turbulence as a dynamic phenomenon with spatially and temporally varying density, pressure, and velocities, providing more accurate and detailed predictions of flow behavior [19]. Song and Zhou [12] applied a 1D-3D hybrid Large Eddy Simulation (LES) to predict free surface flow over an ogee spillway, matching measurements near the entrance but showing discrepancies downstream due to neglected air entrainment.
Although previous studies provide a valuable understanding of flow behavior in hydraulic structures, they did not consider the effect of turbulence model and volume flow rate in hydraulic parameters variations, particularly the extreme values including maximum and minimum velocities, in different transversal and longitudinal cross-sections of the channel. Therefore, a thorough analysis of flow properties in open channel spillways by a combination of numerical modeling and experimental analysis becomes essential. This approach helps validate the numerical models by comparing them with experimental data in various flow depths in the width of the channel spanning from upstream to the downstream of the spillway, ensuring a more comprehensive and trustworthy understanding of the system’s behavior. The main objective of this paper is to investigate the variations in hydraulic parameters, including maximum, minimum, and average velocities as function of inflow rate using experimental and numerical analysis. A key technical innovation in this study is the development and implementation of a physical model integrated with a robotic measurement system, capable of capturing hydraulic parameters at any desired location along the spillway. This allows for a detailed evaluation of maximum and minimum velocities along the length and width of the channel under varying flow conditions. Most importantly, the paper quantifies the differences between numerical and experimental results at various locations, highlighting how these discrepancies evolve in both longitudinal and transversal directions and provides a basis for quantifying errors between numerical and experimental results. These errors are analyzed to understand how they evolve spatially in both directions, highlighting the limitations of conventional numerical models in accurately predicting extreme values under complex turbulent flow regimes.
This study investigates the spillway of the Romaine IV dam on the Romaine River, Quebec, combining numerical modeling and experimental analysis. FLOW-3D simulations were conducted to replicate the spillway behavior, and the results were validated against measurements from a scaled physical model. The experimental setup included a robotic system for measuring velocity and flow depth, enabling detailed assessment of hydraulic parameters and supporting evaluation of the numerical model’s accuracy.
2. Theoretical Background
Accurate prediction of spillway flow requires a combination of three-dimensional numerical modeling and turbulence representation. In this study, the flow is simulated using the Reynolds-Averaged Navier–Stokes (RANS) equations for incompressible flow, which ensure the conservation of mass and momentum:
Continuity equation:
Momentum equation:
where and represent the mean velocity components, is the fluid density, is the mean pressure, and is the kinematic viscosity. The term denotes the Reynolds stress tensor components, where and are the fluctuating components of the velocity in the and directions, respectively, accounting for the effects of turbulence.
Turbulence modeling has evolved from simple zero- and one-equation models, like mixing length and Spalart–Allmaras, [20], to advanced two-equation models like standard k-ε and k-ω SST (shear stress transport) models [21]. Among these, the renormalized group (RNG) k-ε model stands out for its enhanced accuracy particularly in handling complex flow scenarios involving high turbulence and rapidly changing flow conditions. This model is widely used due to its improved handling of both mean flow turbulence and large eddies in complex geometries, making it one of the most effective tools for computational fluid dynamics [22]. FLOW-3D software uses the RNG k-ε turbulence model to simulate complex flow scenarios with an appreciably high level of accuracy. The RNG model is an advanced turbulence model derived from statistical mechanics, enhancing the standard k-ε model by accounting for the effects such as rapid strain and streamline curvature, which are particularly significant in flows with highly variable velocity fields and vortical structures [23]. This model is particularly effective in predicting turbulence in flows with high shear and swirl, making it ideal for hydraulic structures like spillways. The model solves two key equations, i.e., the transport equation for turbulent kinetic energy () (Equation (3)), and the transport equation for its dissipation rate () (Equation (4)), providing detailed insights into the turbulent characteristics of the flow.
Turbulent kinetic energy () equation:
Dissipation rate (ε) equation:
where turbulent kinetic energy (k) represents the energy within turbulent motion, the dissipation rate () indicates the rate at which this energy is lost as heat. Both equations for (k) and () involve time (t), position (xj), and average velocity (Uj), along with the fluid’s viscosity () and an additional turbulent viscosity (), which reflects extra resistance due to turbulence. Each equation includes a spreading factor () for (k) and () for () that controls how quickly these quantities diffuse. In the k equation, (Pk) represents energy generated by the flow, while () captures energy lost. For the () equation, constants (Cε1) and (Cε2) adjust the production and loss rates, with (R) included to account for special effects like buoyancy.
3. Methodology
3.1. General Overview
The methodology adopted in this study consists of several key steps, each crucial for understanding the general approach utilized in this research to explore the effects of flow rate and channel cross section on the hydraulic parameters (see Figure 1). The spillway of the Romaine IV dam was first selected as the case study. This hydro-power facility is located along the Romaine River in the north of Havre-Saint-Pierre on the north shore of the St. Lawrence, Quebec, Canada. Next, the hydraulic parameters affecting erosion in spillways were identified. This study specifically investigates the effects of average, maximum, and minimum velocities in different transverse and longitudinal cross-sections on predicting the erosion prone zones in the channel using the data collected from a scaled-down physical model to validate the numerical model [24]. Additionally, flow behavior at various flow rates were examined to understand how changes in flow rate impact these hydraulic parameters. Following that, numerical simulations were conducted using the CFD method with FLOW-3D software (HYDRO 2022 R1). The numerical model’s geometry was created using AutoCAD 3D (Autodesk, 2022) to replicate the laboratory-scale Romaine IV spillway at a 1:40 scale, ensuring consistency with the experimental setup. Initial conditions were defined, assuming water properties similar to those at 20 °C, and an appropriate turbulence model (RNG k-ε model) was selected. Meshing and boundary conditions were carefully chosen to optimize runtime and ensure a mesh-independent analysis. The model was then tested with various flow rates to assess their impact on hydraulic parameter fluctuations. To analyze the results of the numerical simulations, five transversal cross sections were selected along the length and at the most strategic sections of the channel, in addition, five longitudinal cross sections are defined to analyze the water behavior at different lengths and widths of the channel. Following the numerical simulations, a series of experiments were conducted on a reduced-scale model, focusing on the discharge channel. A robotic system installed on a railing line along the channel facilitated the smooth movement of the robot along the channel’s length. The final step involved comparing data collected from experimental tests with those from numerical simulations. These comparisons were made at three different volume flow rates (180 L/s, 240 L/s, and 340 L/s) to assess the effect of increasing flow rate on the hydraulic parameters.
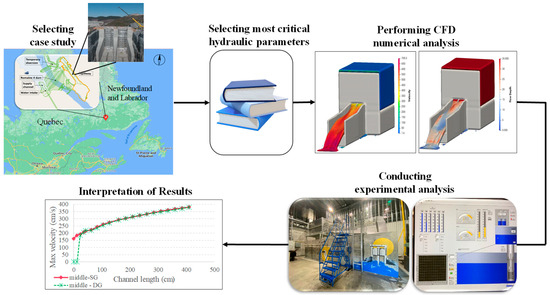
Figure 1.
Adopted methodology in this study.
3.2. Project Description
This study focuses on the discharge channel of the spillway of the Romaine IV Dam (Figure 2). The Romaine IV Dam is part of the larger Romaine hydroelectric complex, which harnesses the hydroelectric potential of the Rivière Romaine. The dam, with an 87.3 m height and a reservoir area of 142.2 km2, plays a key role in the region’s energy production. It features two Francis turbines, with a design flow of 307 m3/s and a net head of 88 m. This site was selected for its strategic importance and unique hydraulic characteristics. The unlined discharge channel offers a relevant case study for investigating the effects of varying flow rates on hydraulic parameters, specifically focusing on predicting erosion-prone areas. The advanced engineering design of the spillway, capable of handling significant water flow, provides an excellent basis for our research. Additionally, the Romaine IV Dam has undergone extensive environmental assessments to mitigate adverse impacts on local ecosystems and communities, particularly the traditional lands of the Innu First Nation. By studying this site, we aim to enhance our understanding of flow behavior and erosion mechanisms in spillways, contributing valuable insights to hydraulic engineering practices and supporting the sustainable management of hydroelectric infrastructure.
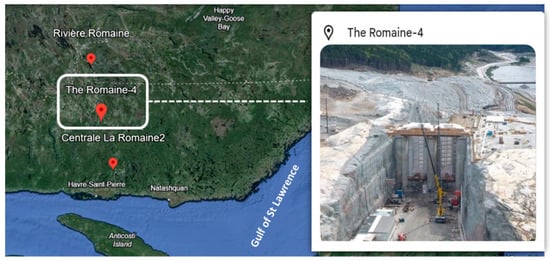
Figure 2.
Location of the Romaine IV dam’s spillway.
3.3. Selection of Critical Hydraulic Parameters
In hydraulic engineering, the selection of key parameters such as turbulence, volume flow rate, dynamic pressure, and static pressure is crucial for studying the flow behavior [25]. This study mainly focuses on the volume flow rate and the effect of fluid velocity (maximum, minimum, and average) and its variation on predicting erosion-prone areas. These parameters help us to gain a better understanding of the behavior of water flow within open channels and rivers. By understanding how these velocities and flow rates fluctuate within different parts of the channel, engineers can design effective erosion control measures and ensure the longevity and stability of hydraulic structures [26].
Different volume flow rates influence the hydraulic conditions within a channel, affecting velocity distribution, turbulence patterns, and ultimately, erosion rates. By studying a range of flow rates, engineers can predict how changes in discharge will impact erosion patterns. High flow rates may lead to increased erosion, while low flow rates could cause sediment deposition [27]. Furthermore, the maximum velocity in a flow system is crucial because it often determines the highest pressure exerted on the channel bed and banks. Higher static pressure may lead to increased erosion rates, making areas experiencing the highest velocities typically the most prone to erosion [28]. Understanding the maximum velocity helps in predicting and mitigating these high-risk areas. On the other hand, the minimum velocity is essential in sediment transport studies. Low velocities can lead to sediment deposition, changing flow paths and creating localized erosion downstream areas. Knowing where velocities drop can help identify regions where sediments may settle and accumulate, potentially leading to future erosion [29]. Moreover, the minimum velocity beneath a rock block is crucial in its removal process. When there is a higher velocity above the block compared to below it, a pressure differential develops. According to Bernoulli’s principle, this pressure difference creates an uplift force, lifting the rock block from its resting position [30]. Once lifted, the block becomes vulnerable to being carried away by the flow, especially if the flow velocity above it is significantly higher [31]. Finally, the average velocity provides a general sense of the flow regime within the channel and is often used in modeling and simulations to predict overall flow behavior and erosion potential. While the average velocity does not directly indicate extremes, it remains a valuable parameter for understanding the general flow behavior, which is essential for long-term erosion prediction and control [32,33].
3.4. Numerical Modeling
Numerical modeling is a computational technique essential for studying hydraulic structures, allowing for predictive analysis, design optimization and risk assessment [34]. It reduces the need for extensive physical testing, saving time and resources. FLOW-3D, which is employed in this study, is a prominent commercial CFD package recognized for its unique capabilities in simulating complex fluid behaviors [35]. It utilizes both VOF method for accurately tracking free surface movements and the Fractional Area/Volume Obstacle Representation (FAVOR) method to handle geometric complexities within structured computational meshes [36]. The software discretizes all relevant equations, including the RANS equations, using the FVM ensuring accurate representation of physical processes. FLOW-3D also incorporates advanced turbulence models, including the RNG model which is particularly effective for modeling turbulent flows over spillways and other hydraulic structures [37,38,39]. These features make FLOW-3D a suitable tool for analyzing and studying hydraulic systems with high turbulence flows.
3.4.1. Model Geometry
The geometry of the model was generated using AutoCAD 3D sketches incorporating the dimensions derived from a reduced-scale model, determined through dimensional analysis, as conducted by Koulibaly, Saeidi [40]. Dimensional analysis of the Romaine IV Dam involved creating a reduced-scale model at a 1:40 ratio [40]. By preserving essential dimensionless ratios like Reynolds and Froude numbers, this method ensures that the scaled model accurately reflects the dam’s spillway hydraulic performance at its original scale [41]. The structure has a length of 801.6 cm, with a channel slope of 9 degrees. As the channel progresses from the gates to the outlet, the width gradually increases from 68 cm to 87 cm. The use of aluminum in construction of the channel ensured that its surface roughness was minimal and could be considered negligible. Moreover, there are two adjustable flood gates that simulate the vertical lift gates of the Romaine IV spillway’s channel. Also, a rotary pump is integrated into the numerical model which is able to generate a flow rate up to 400 L/s, matching the pump in the scaled-down model (Figure 3).
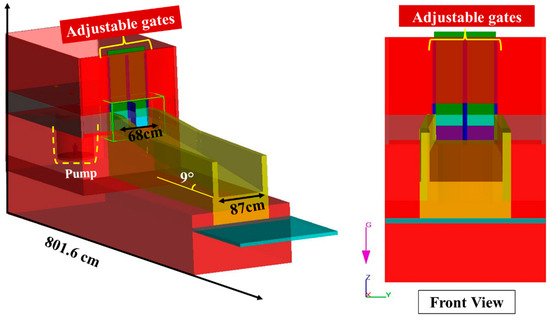
Figure 3.
Generated geometry for FLOW-3D simulation.
3.4.2. Meshing
Accurately simulating fluid behavior in numerical modeling requires proper meshing configuration. Three mesh blocks were created for this purpose: one for the entire domain (including water, solid structures, and air); another for the discharge channel; and a third for the adjustable gates. A mesh sensitivity analysis on the discharge channel block determined that 2 cm cell size minimized flow rate fluctuations, ensuring consistent results (Figure 4). As per FLOW-3D recommendations, a 2:1 ratio between nested mesh block cell sizes was maintained, resulting in cell sizes of 4 cm, 2 cm, and 1 cm for the first, second, and third blocks, respectively (Figure 5). Finer cell sizes (1 cm) were applied to small features like the adjustable gates and coarser cell sizes were utilized for areas with less details including air and surroundings. Despite increased runtime, this approach significantly enhanced the precision of the open channel results, ensuring the analysis’s accuracy and reliability.
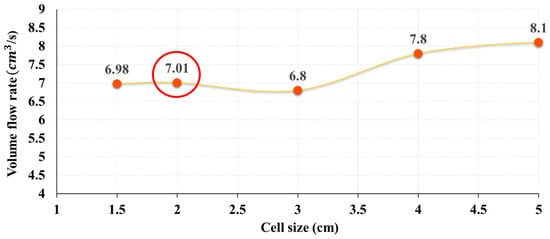
Figure 4.
Mesh sensitivity analysis conducted for second mesh block.
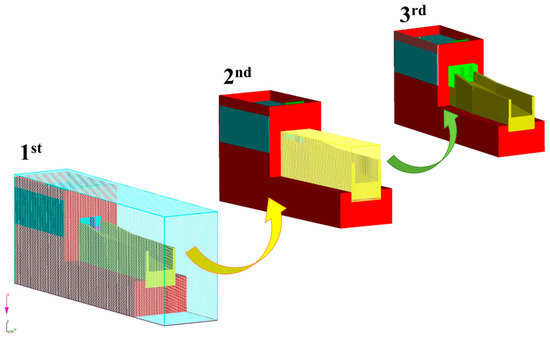
Figure 5.
Mesh blocks defined for the FLOW-3D numerical simulations conducted in this study.
3.4.3. Initial and Boundary Conditions
For the numerical simulation in FLOW-3D, specific initial and boundary conditions were established to accurately model the hydraulic behavior of the discharge channel of a spillway system. The one-fluid module was chosen for the simulation, with water properties at 20 °C specified with a density (ρ) of 998.2 kg/m3 and a viscosity (μ) of 1.002 × 10⁻³ Pa·s. In modeling open channel flow, typical boundary conditions involve specifying a velocity or discharge at the inlet and setting a pressure or free surface condition at the outlet. However, in this study, the integration of a pump significantly altered these standard practices. The pump was embedded directly into the model, which allowed it to control the flow rate at the inlet boundary and eliminated the need for separate velocity or pressure specifications. As a result, all the boundary conditions except for the outlet, were set to symmetry to simplify the simulation and decrease the calculation time. The outlet boundary condition was set to pressure with a specific water height to simulate the outflow of water into the pool beneath the channel. To ensure the accuracy of the initial conditions for the simulation, the pump was first operated at a flow rate of 240 L/s. Once the system reached a steady state, the water height in the reservoir was recorded at approximately 67–70 cm. This same flow rate was then applied to the numerical model using the mass and momentum sources module. The numerical model successfully replicated the water height observed in the physical model at steady state, validating that the flow conditions of both models were aligned. By aligning model predictions with known experimental or observational data, validation confirms the model’s implementation accuracy, ensuring that it captures the complex dynamics of open channel flows. This process enhances the model’s predictive power, enabling it to better represent the specific conditions and complexities of open channel spillways [42,43].
3.5. Experimental Setup
The experimental setup for this study involved a scaled physical model of the Romaine IV spillway, designed at a 1:40 scale which was conducted by Koulibaly et al. at 2021. This scale was determined based on rigorous dimensional analysis to preserve geometric and hydraulic similarity with the full-scale prototype. By maintaining key dimensionless parameters such as the Froude number, the model accurately reproduces the flow regimes, velocity distributions, and critical hydraulic behaviors observed in the actual spillway. The model was equipped with a pump to manage water flow inside the discharge channel. The pump directed water vertically into the upstream reservoir and allowed a natural overflow effect from the reservoir providing precise control over the flow rate. This study specifically focuses on three main volume flow rates, each of them corresponding to a precise water height in the reservoir (Table 1). There are also two adjustable floodgates for regulating the gate opening and discharge rate. These are vertical lift gates, which manage water flow by moving up and down along guide rails. Commonly used in spillways and reservoirs, they are recognised for their durability and capacity to withstand high water pressures [44].

Table 1.
Generated flow rate specifications.
Furthermore, a robotic XYZ system was installed above the discharge channel, mounted on rails parallel to the channel walls, enabling precise horizontal, vertical, and depth movements across the entire length of the channel (Figure 6). The robot is equipped with a pitot tube to measure the velocity inside the channel. The movement of the robotic arm could be managed by defining specific intervals in the width (y-direction) and depth (z-direction) of the channel. Custom software was developed to control the robotic arm, allowing for the definition of movement paths and data acquisition intervals. The software facilitated data capture at every 4 cm along the channel width and 1 cm intervals in depth, from the water surface to the bottom, with each measurement point collecting 10 s of data at a frequency of 100 Hz, resulting in 1000 data points per measurement point. It is important to note that these measurement points were located within five transverse cross-sections at strategic locations along the channel. Within each cross-section, five additional longitudinal sections were chosen, extending from the bottom of the channel to the water surface. This approach allowed for a comprehensive examination and comparison of the hydraulic behavior of the spillway.
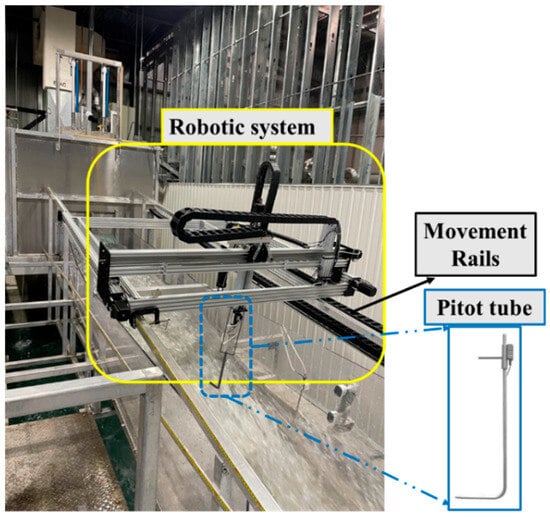
Figure 6.
Robotic system used in the experimental setup.
After collecting data and processing the results of experimental tests, the maximum, minimum, and average velocities at each measurement point were identified for further analysis. These measurement points are located within five transverse cross-sections at strategic locations along the channel. Within each cross-section, five additional longitudinal sections were chosen, extending from the bottom of the channel to the water surface. This approach allowed for a comprehensive examination and comparison of the hydraulic behavior of the spillway. The velocities obtained from the experiments were then compared with those acquired from the corresponding measurement points in the numerical post-processing analysis. By comparing these values, the numerical simulations could be validated, ensuring that they accurately represented the physical conditions observed in the study. A more detailed explanation of the cross-sections and measurement points adopted in this study will be elaborated in the following section.
3.6. Determination of the Most Significant Measurement Points
To comprehensively examine the variations in the hydraulic parameters across the dam’s spillway, as well as the effects of flow depth on these parameters, a systematic approach was employed in this study. In this regard, multiple cross-sections, both transversal and longitudinal, were positioned along the length of the channel for a detailed analysis (Figure 7). In particular, five key transversal cross-sections were established at critical points in the channel to precisely evaluate hydraulic parameters. The first cross-section, 68 cm wide, was placed near the gate at the start of the channel slope to assess the initial effects of the gate on flow characteristics. The second cross-section (77 cm wide), located 105 cm from the gate and at the middle of the channel’s widening section, was intended to observe the gate’s influence on flow properties as the channel expanded. The third cross-section, situated 160 cm from the gate, marked the end of the widening section, enabling analysis as the channel narrowed to a uniform width. The fourth cross-section was positioned at the midpoint of the straight channel segment to ensure accurate reflection of flow characteristics in this linear portion. Finally, the fifth cross-section, located 410 cm from the gate, was placed to observe water behavior as it exited the channel, ensuring the boundary conditions were far enough downstream to avoid affecting upstream measurements (Figure 7).
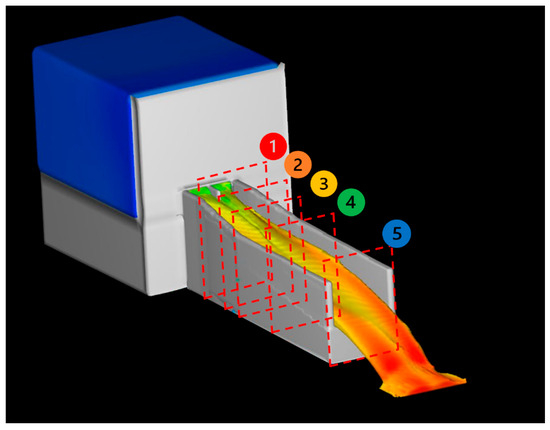
Figure 7.
Position of transverse cross-sections.
Additionally, within each transversal cross-section, five longitudinal sections were defined to analyze velocity variations across the channel width and at different water depths, from the channel bottom to the water surface. These longitudinal sections were positioned near the left wall, at one-quarter, midpoint, three-quarters, and near the right wall of the channel. This arrangement enabled a thorough examination and comparison of hydraulic behavior, allowing for the validation of numerical simulations against observed physical conditions. The data collection process, including the path followed by the robotic arm to gather data in the physical model and the measurement probes defined in the numerical simulation, are illustrated in Figure 8 and Figure 9, respectively.
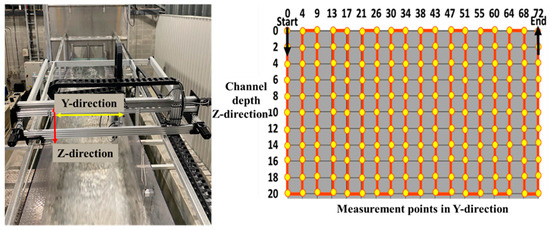
Figure 8.
Trajectory taken by the robotic arm.
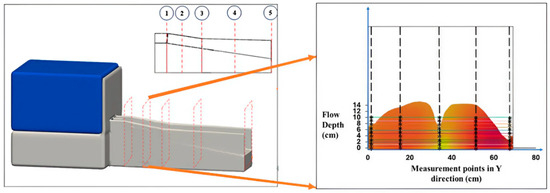
Figure 9.
Location of measurement probes in the FLOW-3D simulation.
4. Results
Understanding how hydraulic parameters vary within a channel is crucial for optimizing hydraulic performance. This involves analysing the results of numerical and experimental tests across designated transversal and longitudinal cross sections. Both these methods aim to explore how maximum, minimum, and average velocities fluctuate within the channel. The comparison between numerical and experimental data reveals both the strengths and limitations of the numerical method in predicting key hydraulic parameters. Meanwhile, the effects of increasing the flow rate from 180 L/s to 340 L/s on velocity behavior across various sections of the channel are also explored in this study.
4.1. Comparison of Numerical and Experimental Results (Q = 180 L/s)
Figure 10 represents the velocity variations from the bottom of the channel to the water surface for the volume flow rate of 180 L/s, with the vertical axis showing velocity values in m/s and the horizontal axis indicating the measurement points along the channel’s width in cm. In the figure legend, “N” denotes numerical results depicted by solid lines, whereas “E” indicates experimental data represented by dashed lines. Both data sets suggest a general increase in velocity as we move from the upstream section (42 cm, near the gates) toward the downstream section (410 cm, near the outlet). This trend is likely due to the acceleration of flow as it travels along the channel and encounters fewer obstacles or disturbances, leading to a more developed flow. At the upstream section (42 cm), velocity variations are more prominent across the channel width, with lower velocities near the walls, indicating a less stable, developing flow. As we move downstream to 285 cm, velocities become more uniform, particularly for average velocities, suggesting that the flow stabilizes in this region. However, at the furthest downstream section (410 cm), velocities do not follow the expected trend, particularly in VMax and VMin. This discrepancy suggests that flow conditions become more complex near the outlet, where the numerical model may struggle to capture the experimental flow patterns accurately. This disagreement can arise from several complex flow dynamics. Hydraulic jumps may cause abrupt transitions in flow conditions, leading to turbulence that numerical models struggle to capture. The effects of falling jets can create chaotic flow patterns, while gravitational forces might result in uneven energy distribution.
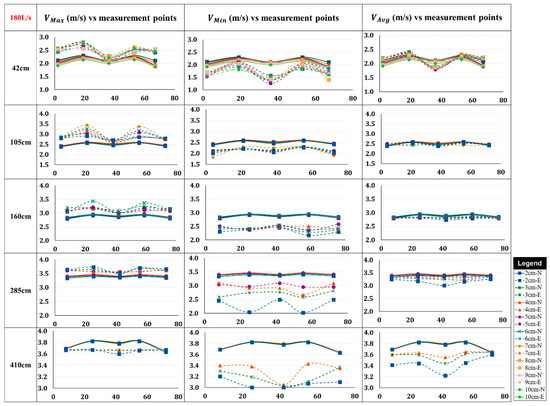
Figure 10.
Comparison between numerical and experimental velocity fluctuations along the width of the channel from bottom of the channel to water surface at 1 cm intervals with dashed line representing Experimental (E) and solid lines indicating Numerical (N) results (Q = 180 L/s).
Upon examining Figure 10, it is immediately apparent that in the left column of the table which compares maximum velocities, numerical data underestimate the experimental results. In contrast, in the middle column, representing minimum velocities, the numerical profiles tend to overestimate experimental values across all cross-sections, from the upstream to the downstream of the channel. However, an interesting observation is made in the right column, displaying average velocities. Here, the numerical profiles closely align with the experimental data across nearly all cross-sections. This suggests that the numerical model is reasonably efficient in predicting the overall flow behavior.
To better understand the comparison of results, a basic calculation was conducted to quantify the error percentage, showing the discrepancy between the numerical and experimental data, as follows:
where refers to the velocity obtained from numerical analysis and represents the velocity observed in the experimental results. This parameter facilitates a clearer evaluation of the extent of discrepancy between the two approaches adopted in this study with the main goal of enhancing the accuracy of the assessment. The values of the error parameter for different velocities and various cross sections have been plotted in Figure 11. This figure indicates that the greatest disparity between the numerical results and experimental data occurs when comparing minimum velocities, particularly at the center of the channel’s width, where a 60% difference is observed. However, as we move from the upstream section to the outlet of the channel, this error generally tends to decrease. For instance, at the 42 cm cross-section, the minimum velocities at the center of the channel show a 60% error, while further downstream, this error decreases to 30%. This reduction in error at the downstream might be due to flow stabilization and uniformity, improved boundary layer development, and reduced impact of channel geometry and turbulence effects, leading to more accurate numerical predictions.
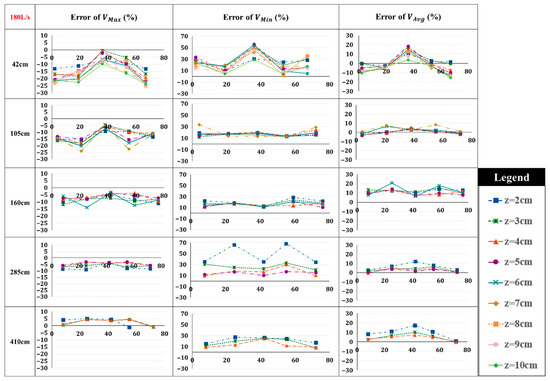
Figure 11.
Error percentages between numerical and experimental velocity data (Q = 180 L/s).
4.2. Effect of Increased Flow Rates on Velocity Distribution (Q = 240 L/s and 340 L/s)
In the next step, the volume flow rate was increased to 240 L/s to examine how the increased flow rate affects velocity variations. Since the average velocity results from numerical simulations closely matched the experimental data, the focus for the next two volume flow rates shifted to examining the maximum and minimum velocities. To support this observation, the average velocities for volume flow rates of 240 L/s and 340 L/s have been included in the annex of the paper. Figure 12 presents the comparison of velocity fluctuations at a flow rate of 240 L/s. Further examining this figure reveals a consistent trend where the maximum velocities of the numerical results are lower than the experimental data at every cross-section except for the last one, while the minimum velocities of the numerical results show generally higher values compared to the experimental outputs. This trend suggests that the numerical model may be less sensitive to rapid changes in velocity, which become more pronounced at higher flow rates, especially in regions with flow separation or turbulent eddies.
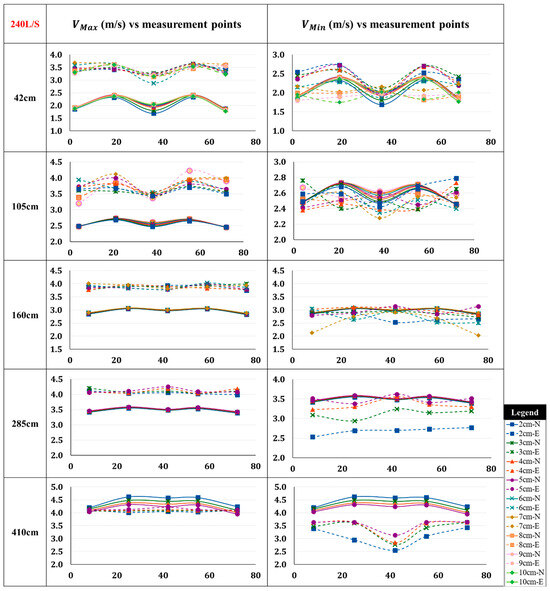
Figure 12.
Comparison between numerical and experimental velocity fluctuations along the width of the channel from bottom of the channel to water surface at 1 cm intervals with dashed line representing Experimental (E) and solid lines indicating Numerical (N) results (Q = 240 L/s).
It should also be noted that the numerical and experimental results for VMin align fairly closely at the first two upstream cross-sections particularly at the middle of the channel’s width.
Figure 13 presents the results of error calculations from Equation (5), revealing the largest discrepancies in minimum velocity comparisons. Moreover, an interesting pattern is observed when analyzing the velocity profiles at the downstream section of the channel (410 cm). At the final cross-section, the largest discrepancy for both minimum and maximum velocities is observed at a flow depth of 2 cm (channel bottom), reducing to a 10% to 20% difference at a 5 cm depth (water surface). The significant error observed at the flow depth of 2 cm can be explained by the boundary conditions set for the numerical model. In real-world scenarios, near the bottom of the channel, friction and the effects of the channel bed can influence velocity, but the numerical model might simplify this interaction by assuming zero velocity at the bed, leading to discrepancies in the low-flow regions. (Figure 14).
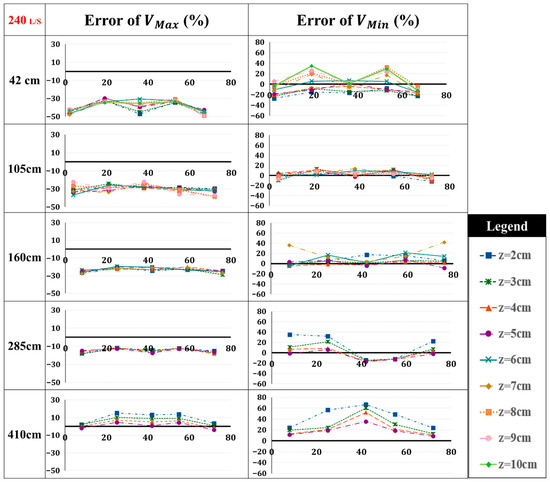
Figure 13.
Error percentages between numerical and experimental velocity data (Q = 240 L/s).

Figure 14.
Closer view of velocity variation in different depths of water (Q = 240L/s).
The same procedure was repeated for the flow rate of 340 L/s. Figure 15 demonstrates a similar pattern to the velocity variations in two previous flow rates. When comparing maximum velocities, numerical data are underestimating the experimental results at all cross-sections except for the downstream section. Moreover, the minimum velocities of numerical data are overestimating the experimental captured velocities. This discrepancy could be due to limitations in the numerical model, such as numerical diffusion where the model smooths out the sharp changes in the flow.
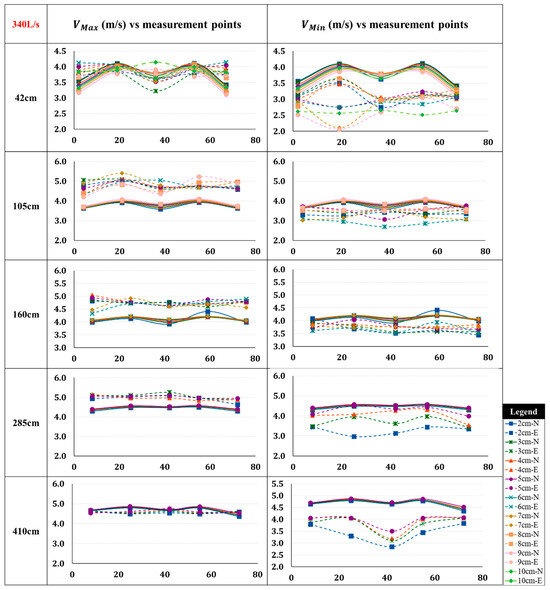
Figure 15.
Comparison between numerical and experimental velocity fluctuations along the width of the channel from bottom of the channel to water surface at 1 cm intervals with dashed line representing Experimental (E) and solid lines indicating Numerical (N) results (Q = 340 L/s).
To better understand the level of disagreement between numerical and experimental data, Figure 16 was generated through calculations of Equation (5). It is evident that the highest discrepancy between numerical and experimental data, especially for VMin, occurs at a flow rate of 340 L/s, which is likely due to increased flow complexity and turbulence. This is a consequence of the flow becoming more chaotic at higher flow rates, where turbulence and flow separation contribute to more complex behavior leading to formation of eddies that is difficult for numerical models to resolve, especially when the models cannot fully account for all the dynamic effects in high-speed flows.
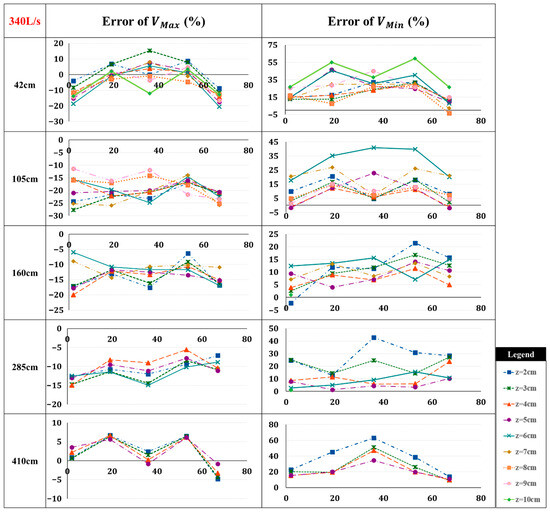
Figure 16.
Error percentages between numerical and experimental velocity data (Q = 340 L/s).
Bringing it all together, the discrepancies between experimental and numerical results in capturing extreme velocity values may arise from several factors inherent in the limitations of numerical modeling. First, the use of the RANS equations inherently averages the flow over time, reducing the ability to capture transient peaks and troughs that are present in high-frequency experimental data. In addition, the RNG turbulence model, while effective in many cases, relies on approximate formulations of turbulence effects rather than resolving all instantaneous fluctuations, which might lead to an underestimation of maximum velocities and an overestimation of minimum values. The VOF method further contributes by introducing slight smoothing effects at the free surface, which can dampen velocity extremes. Finally, memory constraints of the computer used for simulations in FLOW-3D limited the data capture far less than the experimentally obtained 100 points per second, which further restricted the model’s ability to capture transient fluctuations. The downstream sections, being more stabilized, allow the model to predict velocities more accurately.
Consequently, while the numerical model accurately predicts average velocities, it lacks the temporal resolution and turbulence details to replicate the exact maximum and minimum values observed experimentally. By analyzing these parameters, we can identify areas within the channel that are particularly susceptible to erosion, which enables the implementation of targeted mitigation strategies. These strategies are crucial for controlling erosion, thereby protecting infrastructure and preserving property.
5. Discussion
Understanding the fluctuations of hydraulic parameters like maximum, minimum, and average velocities within an open channel is crucial for optimizing hydraulic performance. By comparing numerical simulations with experimental data, the findings of the study revealed that at a flow rate of 180 L/s, the numerical model underestimated maximum velocities by an average of 14% and overestimated minimum velocities by an average of 41% across most cross-sections. This discrepancy suggested that the model has limitations in capturing detailed flow behavior, such as sharp changes in velocity. Interestingly, the model performed better in predicting average velocities, aligning more closely with experimental results. The underestimation of maximum velocities and overestimation of minimum velocities can be attributed to localized flow separation, vortices, and turbulence structures that the RANS-based numerical model might not be able fully capture. Depth-wise variations show that near the channel bed (2 cm), discrepancies are largest, whereas closer to the water surface (5 cm), numerical predictions align more closely with experimental results.
As the flow rate increased to 240 L/s, the numerical model’s predictions for maximum velocities continued to be lower than the experimental values at most cross-sections, except for the final one likely due to increased jet development, turbulence effects, or limitations in the turbulence model. For minimum velocities, the model consistently showed higher values. However, the average velocities observed in the experiments were noted to be well predicted by the numerical simulations. Moving forward to the highest flow rate of 340 L/s, the discrepancies between numerical and experimental results became more pronounced, especially for minimum velocity. The numerical model still tended to underestimate maximum velocities and overestimate minimum velocities across nearly all cross-sections, likely due to the increased flow complexity and turbulence that the model struggled to accurately capture. The error analysis revealed the largest discrepancies in minimum velocity comparisons, particularly at the channel’s center, with a noticeable reduction in error downstream. This may be attributed to improved flow stabilization and boundary layer development. The significant variation at 340 L/s highlighted the challenges of numerical modeling under high flow conditions, emphasizing the need for further calibration to address these discrepancies.
Although this research offered a comprehensive comparison of flow behavior through numerical simulations and experimental approaches, with detailed focus on velocity variations across different transverse and longitudinal sections and various depths of the channel, there still exist some discrepancies between the results. These differences, particularly at higher velocities and in turbulent conditions, emphasize limitations in the numerical model’s accuracy. Specifically, the model struggled with predicting maximum and minimum velocities under these conditions, which might be due to the inherent weaknesses in the turbulence models used. Despite these limitations, the numerical model using Flow3D successfully predicted the overall flow behavior by showing close agreement with experimental data for average velocities. This aspect is valuable for understanding the general behavior of the spillway, as it provides a reliable indication of the flow patterns and helps in assessing the performance of the spillway under various conditions. This study presents a novel comparison of numerical simulations and experimental data, focusing on velocity variations across different sections of an open channel spillway. Unlike previous studies, it examines the interaction of maximum, minimum, and average velocities across varying flow conditions, including turbulence effects. Additionally, the analysis spans from the channel bottom to the water surface, offering understanding into velocity variation at different flow depths. The experimental data were collected using a high-tech robotic system capable of measuring velocity at precise X-Y-Z locations within the channel, enhancing data accuracy.
While previous studies have primarily focused on average velocities, discharge, or water surface profiles in spillway flows [17,18,19], the present study extends these findings by examining extreme velocity values. Similarly to earlier work, downstream flow stabilization improves the model’s accuracy, reflecting the influence of fully developed flow on prediction reliability. For example, Bayon et al. [17] and Savage and Johnson [18] showed that numerical models using FLOW-3D or OpenFOAM reliably capture general flow patterns in stepped and ogee spillways, though they are limited in reproducing highly localized turbulent fluctuations. The comparisons indicate that the numerical model used here performs in line with established findings regarding general flow behavior while providing novel insights into extreme velocity variations that have not been explicitly examined in prior studies.
Future improvements could include employing advanced turbulence models, such as Large Eddy Simulation (LES), to enhance the accuracy of velocity predictions and address the observed discrepancies. Additionally, investigating more complex spillway geometries, unsteady flow conditions, and sediment transport processes could provide a more comprehensive understanding of flow dynamics, energy dissipation, and discharge distribution. These directions would help refine numerical predictions and extend the applicability of the model to a wider range of hydraulic structures.
6. Concluding Remarks
This study provided a comprehensive evaluation of flow behavior in an open channel spillway through both numerical simulations and experimental data. Additional data and information for reference are available in the Appendix A and Appendix B.
By analyzing how velocities fluctuate across various flow rates and channel sections, the following key findings emerged:
- At all three flow rates, the numerical model using Flow3D generally underestimated maximum velocities and overestimated minimum velocities; but it provides a good approximation when predicting average velocities.
- At 240 L/s, the Flow3D numerical model continued to show discrepancies, underestimating maximum velocities by 12–44% and overestimating minimum velocities by 6–66% with variations along the cross-sections. However, the agreement improved in the upstream sections.
- At 340 L/s, the model’s discrepancies in maximum and minimum velocities represented the similar trend with 5–27% of difference in Vmax and 2–63% of difference in Vmin values.
- The largest errors were noticed in minimum velocity predictions, especially at high flow rates, with a reduction in error observed in more stable downstream flow regions.
- Discrepancies decrease downstream as the flow stabilizes and becomes more uniform, indicating that the model effectively represents energy dissipation and fully developed flow patterns
- Model predictions of flow depth and discharge were consistent with experimental observations, confirming that the model captures overall flow distribution along the channel
- Observed reductions in velocity fluctuations and more uniform downstream flow indicate that the model realistically represents energy dissipation patterns.
- Despite discrepancies, the model effectively predicted average flow behavior, suggesting that it is useful for understanding general flow patterns
Author Contributions
Conceptualization, E.M.M., A.S., J.P. and A.R.; Methodology, E.M.M.; Software, E.M.M. and J.P.; Validation, A.S., J.P., A.R. and M.P.; Formal analysis, E.M.M.; Investigation, E.M.M. and J.P.; Resources, A.S.; Data curation, E.M.M.; Writing—original draft, E.M.M.; Writing—review & editing, A.S., J.P., A.R. and M.P.; Visualization, E.M.M., A.S. and J.P.; Supervision, A.S., J.P., A.R. and M.P.; Project administration, A.S.; Funding acquisition, A.S. All authors have read and agreed to the published version of the manuscript.
Funding
This research was funded by Natural Sciences and Engineering Research Council of Canada, with grant number [CRDPJ 537350-18].
Data Availability Statement
The original contributions presented in this study are included in the article. Further inquiries can be directed at the corresponding author.
Acknowledgments
The authors would like to thank the organizations that have funded this project: Natural Sciences and Engineering Research Council of Canada (NSERC) and Hydro-Quebec, and all those who helped us to improve the quality of this manuscript.
Conflicts of Interest
Author Javier Patarroyo was employed by the company Hydro-Quebec. The remaining authors declare that the research was conducted in the absence of any commercial or financial relationships that could be construed as a potential conflict of interest.
Appendix A. Average Velocity for Flow Rates of 240 L/s and 340 L/s
This section includes a figure comparing the numerical and experimental average velocities for each flow rate, showing variations from the upstream to the downstream sections at different flow depths, ranging from the channel bottom to the water surface.
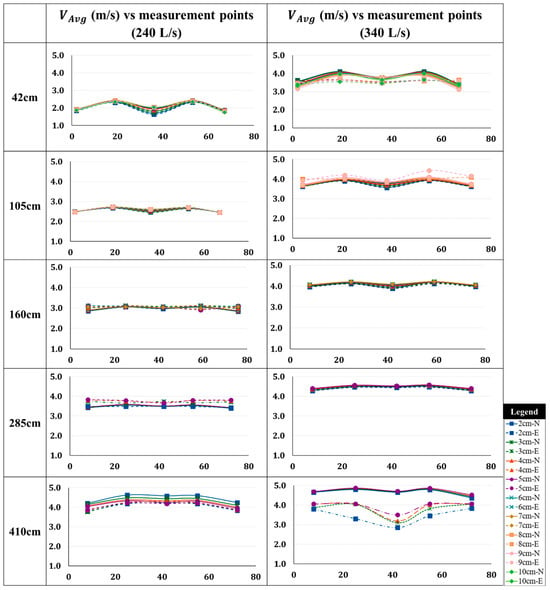
Figure A1.
Comparison between numerical and experimental average velocity fluctuations along the width of the channel from bottom of the channel to water surface at 1 cm intervals with dashed line representing Experimental (E) and solid lines indicating Numerical (N) results (Q = 240 L/s and 340 L/s).
Appendix B. Error of Average Velocities
This section provides detailed comparisons, including error calculations for each cross-section in various flow depths.
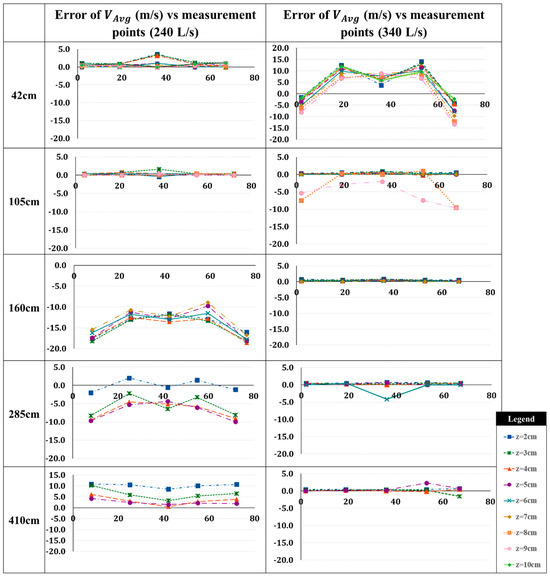
Figure A2.
Error percentages between numerical and experimental average velocity data (Q = 240 L/s and 340 L/s).
References
- Wurbs, R.A. Reservoir System Management. In Sustainable Water Management; CRC Press: Boca Raton, FL, USA, 2016; p. 125. [Google Scholar]
- Khatsuria, R.M. Hydraulics of Spillways and Energy Dissipators; CRC Press: Boca Raton, FL, USA, 2004. [Google Scholar]
- Muhammad, N.; Ullah, N. Simulation of flow on the hydroelectric power dam spillway via OpenFOAM. Eur. Phys. J. Plus 2021, 136, 1191. [Google Scholar] [CrossRef]
- Schleiss, A.J.; Erpicum, S.; Matos, J. Advances in spillway hydraulics: From theory to practice. Water 2023, 15, 2161. [Google Scholar] [CrossRef]
- Nichols, R.H. Turbulence Models and Their Application to Complex Flows, Revision; University of Alabama at Birmingham: Birmingham, AL, USA, 2010; Volume 4, p. 89. [Google Scholar]
- Heller, V. Scale effects in physical hydraulic engineering models. J. Hydraul. Res. 2011, 49, 293–306. [Google Scholar] [CrossRef]
- Jalili Kashtiban, Y.; Saeidi, A.; Farinas, M.-I.; Patarroyo, J. Evaluation of the Effect of Surface Irregularities on the Hydraulic Parameters within Unlined Dam Spillways. Water 2023, 15, 3004. [Google Scholar] [CrossRef]
- Bungartz, H.-J.; Schäfer, M. Fluid-Structure Interaction: Modelling, Simulation, Optimisation; Springer Science & Business Media: Berlin/Heidelberg, Germany, 2006; Volume 53. [Google Scholar]
- Sun, N.-Z.; Sun, A. Model Calibration and Parameter Estimation: For Environmental and Water Resource Systems; Springer: Berlin/Heidelberg, Germany, 2015. [Google Scholar]
- Kanyabujinja, N.P. CFD Modelling of Ogee Spillway Hydraulics and Comparison with Physical Model Tests. Master’s Thesis, Stellenbosch University, Stellenbosch, South Africa, 2015. [Google Scholar]
- López, P.; Mora, J.; Martínez, F.; Izquierdo, J. Computational fluid dynamics (CFD) models in the learning process of Hydraulic Engineering. Comput. Appl. Eng. Educ. 2010, 18, 252–260. [Google Scholar] [CrossRef]
- Song, C.C.; Zhou, F. Simulation of free surface flow over spillway. J. Hydraul. Eng. 1999, 125, 959–967. [Google Scholar] [CrossRef]
- Guercio, R.; Magini, R. Modelling Side-Channel Spillways. Int. J. Hydropower Dams 1998, 5, 60–63. [Google Scholar]
- Yen, B.C.; Wenzel, H.G., Jr. Dynamic equations for steady spatially varied flow. J. Hydraul. Div. 1970, 96, 801–814. [Google Scholar] [CrossRef]
- Yen, B.C. Open-channel flow equations revisited. J. Eng. Mech. Div. 1973, 99, 979–1009. [Google Scholar] [CrossRef]
- Berger, R.; Carey, G. Free-surface flow over curved surfaces: Part I: Perturbation analysis. Int. J. Numer. Methods Fluids 1998, 28, 191–200. [Google Scholar] [CrossRef]
- Unami, K.; Kawachi, T.; Babar, M.M.; Itagaki, H. Two-dimensional numerical model of spillway flow. J. Hydraul. Eng. 1999, 125, 369–375. [Google Scholar] [CrossRef]
- Causon, D.; Mingham, C.; Ingram, D. Advances in calculation methods for supercritical flow in spillway channels. J. Hydraul. Eng. 1999, 125, 1039–1050. [Google Scholar] [CrossRef]
- Jaw, S.Y.; Chen, C.J. Present status of second-order closure turbulence models. I: Overview. J. Eng. Mech. 1998, 124, 485–501. [Google Scholar] [CrossRef]
- Pope, S.B. Ten questions concerning the large-eddy simulation of turbulent flows. New J. Phys. 2004, 6, 35. [Google Scholar] [CrossRef]
- Wilcox, D.C. Turbulence Modeling for CFD; DCW industries: La Canada Flintridge, CA, USA, 1998; Volume 2. [Google Scholar]
- Toro, J.P.; Bombardelli, F.A.; Paik, J. Detached eddy simulation of the nonaerated skimming flow over a stepped spillway. J. Hydraul. Eng. 2017, 143, 04017032. [Google Scholar] [CrossRef]
- Launder, B.E.; Spalding, D.B. The numerical computation of turbulent flows. In Numerical Prediction of Flow, Heat Transfer, Turbulence and Combustion; Elsevier: Amsterdam, The Netherlands, 1983; pp. 96–116. [Google Scholar]
- Koulibaly, A.S.; Saeidi, A.; Rouleau, A.; Quirion, M. A reduced-scale physical model of a spillway to evaluate the hydraulic erodibility of a fractured rock mass. Rock Mech. Rock Eng. 2023, 56, 933–951. [Google Scholar] [CrossRef]
- Chanson, H. Turbulent air–water flows in hydraulic structures: Dynamic similarity and scale effects. Environ. Fluid Mech. 2009, 9, 125–142. [Google Scholar] [CrossRef]
- Novak, P.; Moffat, A.; Nalluri, C.; Narayanan, R. Hydraulic Structures; CRC Press: Boca Raton, FL, USA, 2017. [Google Scholar]
- Graf, W.H. Hydraulics of Sediment Transport; Water Resources Publication: Fort Collins, CO, USA, 1984. [Google Scholar]
- Chiu, C.-L.; Tung, N.-C. Maximum velocity and regularities in open-channel flow. J. Hydraul. Eng. 2002, 128, 390–398. [Google Scholar] [CrossRef]
- Sentürk, F. Sediment Transport Technology; Water Resources Publication: Fort Collins, CO, USA, 1977; p. 560. [Google Scholar]
- Maleki, S.; Fiorotto, V. Blocks stability in plunge pools under turbulent rectangular jets. J. Hydraul. Eng. 2019, 145, 04019007. [Google Scholar] [CrossRef]
- George, M.F.; Sitar, N. Block Theory Application to Scour Assessment of Unlined Rock Spillways; University of California Report No UCB GT 12-02; University of California: Berkeley, CA, USA, 2012. [Google Scholar]
- Te Chow, V. Open Channel Hydraulics; The Blackburn Press: Caldwell, NJ, USA, 1959. [Google Scholar]
- Julien, P.Y. Erosion and Sedimentation; Cambridge University Press: Cambridge, UK, 2010. [Google Scholar]
- Ferziger, J.H.; Perić, M. Computational Methods for Fluid Dynamics; Springer: Berlin/Heidelberg, Germany, 2002. [Google Scholar]
- Gacek, J. Numerical Simulation of Flow Through a Spillway and Diversion Structure. Ph.D. Thesis, McGill University, Montreal, QC, Canada, 2007. [Google Scholar]
- Barkhudarov, M.R. Lagrangian VOF Advection method for FLOW-3D. Flow Sci. 2004, 1. [Google Scholar]
- Hirt, C.W.; Nichols, B.D. Volume of fluid (VOF) method for the dynamics of free boundaries. J. Comput. Phys. 1981, 39, 201–225. [Google Scholar] [CrossRef]
- Fox, B. 3D CFD Modeling with FLOW-3D HYDRO. 2023. Available online: https://flow3d.co.kr/wp-content/uploads/285.pdf (accessed on 20 October 2025).
- Fard, S.M. Use of CFD Platform Flow−3?® Predictive Modeling for Hydraulic Structure Design. Ph.D. Thesis, New Mexico State University, Las Cruces, Mexico, 2023. [Google Scholar]
- Koulibaly, A.S.; Saeidi, A.; Rouleau, A.; Quirion, M. Identification of hydraulic parameters influencing the hydraulic erodibility of spillway flow channels. Water 2021, 13, 2950. [Google Scholar] [CrossRef]
- Gibbings, J.C. Dimensional Analysis; Springer Science & Business Media: Berlin/Heidelberg, Germany, 2011. [Google Scholar]
- Pinto Coelho, M.M.L. Experimental determination of free surface levels at open-channel junctions. J. Hydraul. Res. 2015, 53, 394–399. [Google Scholar] [CrossRef]
- Huang, J.; Weber, L.J.; Lai, Y.G. Three-dimensional numerical study of flows in open-channel junctions. J. Hydraul. Eng. 2002, 128, 268–280. [Google Scholar] [CrossRef]
- Sehgal, C.K. Design guidelines for spillway gates. J. Hydraul. Eng. 1996, 122, 155–165. [Google Scholar] [CrossRef]
Disclaimer/Publisher’s Note: The statements, opinions and data contained in all publications are solely those of the individual author(s) and contributor(s) and not of MDPI and/or the editor(s). MDPI and/or the editor(s) disclaim responsibility for any injury to people or property resulting from any ideas, methods, instructions or products referred to in the content. |
© 2025 by the authors. Licensee MDPI, Basel, Switzerland. This article is an open access article distributed under the terms and conditions of the Creative Commons Attribution (CC BY) license (https://creativecommons.org/licenses/by/4.0/).