Abstract
This work explores the relationship between landscape metrics and surface water in the Galicia-North Portugal Euroregion, employing 6,220,767 linear regression models through Python scripts to predict surface water quality. The Iberian Biological Monitoring Working Party (IBMWP) index, based on benthic macroinvertebrate communities from 40 sites across Portugal (PT) and Galicia (GL), served as the biological indicator. The models were initially selected based on linear regression assumptions (17 tests), and validated against real-world data, evaluating statistical performance through indicators such as R-squared, mean absolute percentage error (MAPE), and percentage bias (PBIAS). Results indicated that GL had a higher macroinvertebrate abundance, whereas Portugal showed greater diversity and family richness. Statistical analysis revealed that landscape significantly influenced water quality, with land use composition and configuration driving differences in ecological conditions between regions. The best-performing models demonstrated a high R-squared value of 0.7, a MAPE of 27% for calibration (PT) and 10% for the validation (GL), indicating a strong predictive relationship. The models provide valuable insights into the complex interactions between landscape patterns and water quality, highlighting how variations in landscape structure can directly affect ecological integrity. These findings reinforce the need for strategic land management to preserve water quality and emphasizing the importance of transboundary governance across the Euroregion to foster sustainable development.
1. Introduction
Water is crucial for human survival and development. The management of water resources has been alongside civilization for thousands of years [1], with legal frameworks dating back to 1750 B.C. [2]. Currently, managing water resources is a complex and dynamic process [3] that requires continuous adaptation. This complexity has increased with rising water demand driven by population growth [4], and climate change [3,5] which amplify both floods [6] and droughts [7]. As knowledge of pollution sources and their impacts on human health [8] and ecosystems [9,10] advances, concerns over the availability of consumable freshwater resources become even more pressing.
To guide water governance, the European Union (EU) implemented the Water Framework Directive (WFD) in the early 21st century (Directive 2000/60/EC) [11]. This directive establishes a comprehensive framework for managing water resources in terms of quality and quantity across the EU. Its implementation is monitored through River Basin Management Plans (RBMP), which propose measures to achieve WFD objectives [12] including the goal of attaining good or higher ecological status of surface waters by 2027 [13]. Achieving these goals requires systematic research and monitoring [14] to guide decision-makers [15].
Surface waters are complex systems influenced by interactions with groundwater [16] and climate [17]. They reflect both natural and anthropogenic processes occurring across connected catchments [18,19], as substances from soil are transported into rivers through runoff [20]. Pollution sources are generally classified into point source and diffuse emissions [21]. Point sources primarily include wastewater discharges from urban and industrial treatment plants [22,23]. Although these facilities aim to reduce contaminant loads, they can still degrade surface water quality [24], and even legally compliant concentrations may harm ecological integrity [25,26,27]. Diffuse emissions, on the other hand, originate from contaminants spread over large areas and transported by runoff and percolation [28]. In agriculture, excessive use of fertilizers and pesticides [29,30] poses significant threats as irrigation and rainfall carry pollutants to the surface and groundwater [31]. Livestock fields similarly contribute to organic pollutants and accelerate soil erosion [32]. Artificial surfaces exacerbate pollution through low infiltration rates, accumulating contaminants during dry periods that are washed into sewers and rivers during rainfall events [33].
Forests are the only land-use type that consistently benefits water quality [34]. When strategically located, forests act as barriers, retaining pollutant flows [35], particularly as riparian vegetation along river margins [36]. Therefore, effective forest management is crucial for preserving water resources [37]. Land-use composition and configuration also significantly influence water quality [38]. Their effects are often assessed through relationships between surface water parameters and landscape metrics [39]. These metrics quantify landscape features such as proportion, shape, and spatial distribution [40]. Given the multiple threats to water quality, multidisciplinary research is essential to comprehensively address the complex interactions affecting water systems and to support evidence-based decision-making [41].
To manage freshwater ecosystems effectively, various tools and techniques have been developed to assess water quality, analyze impacts on watershed security, and support decision-making [42,43]. Notable water quality models include the Soil and Water Assessment Tool (SWAT) [44,45], the Water Quality Simulation Program (WASP) [46,47], and the QUAL2K model [48,49]. These models are widely used to simulate water flow, nutrient transport, and pollutant dispersion. Statistical methods, such as regression analysis, also play a critical role in predicting water quality, sediment analysis, and assessing the impact of land cover on ecological integrity [50,51,52].
The integration of Geographic Information Systems (GIS) has further advanced water quality management by enabling the visualization and analysis of spatial and temporal pollution patterns [53,54]. Coupling GIS with statistical analysis and machine learning methods enhances both accuracy and adaptability in tackling water management challenges [55,56]. However, the use of these techniques is still limited by data availability, computational demands, and the need for specialized expertise [57,58].
A particularly effective approach involves the use of automatic regression algorithms to evaluate and predict water quality [59]. These algorithms efficiently explore combinations of variables, ensuring the assumptions of linear regression are met. By employing a “brute-force” strategy, the algorithm produces robust and accurate models for assessing and predicting water quality [60,61].
Building upon the critical need for effective water resource management outlined above, this study investigates the intricate relationships between landscape configuration and composition with water quality within the Galicia-North Portugal Euroregion. Integrating land-use composition and configuration into water quality assessments is increasingly recognized as vital. This approach helps to better understand and mitigate the impacts of human activities on freshwater ecosystems [38,39]. By leveraging the Iberian Biological Monitoring Working Party (IBMWP) index, a robust biological indicator of ecological status, this study bridges spatial and biological data to unravel the interactions between landscape patterns and riverine health. The application of Linear Regression Models, implemented in Python 3, not only ensures statistical rigor but also offers predictive insights into surface water quality. This aligns with the growing reliance on data-driven methods to inform sustainable decision-making in water governance [43,60].
The novelty of this study lies in its interdisciplinary approach, which combines advanced statistical tools with spatial and biological datasets to address regional challenges. The focus on the Galicia-North Portugal Euroregion is particularly significant, as it represents a transboundary area with shared hydrological networks and environmental policies under the Water Framework Directive (WFD). By analyzing two study areas, one in Spain and the other in Portugal, this research offers a comprehensive view of the determinants of water quality across political and ecological boundaries. Moreover, the findings contribute to the Euroregion’s shared objectives of achieving good ecological status for surface waters by 2027, as mandated by the WFD.
2. Materials and Methods
2.1. Study Area
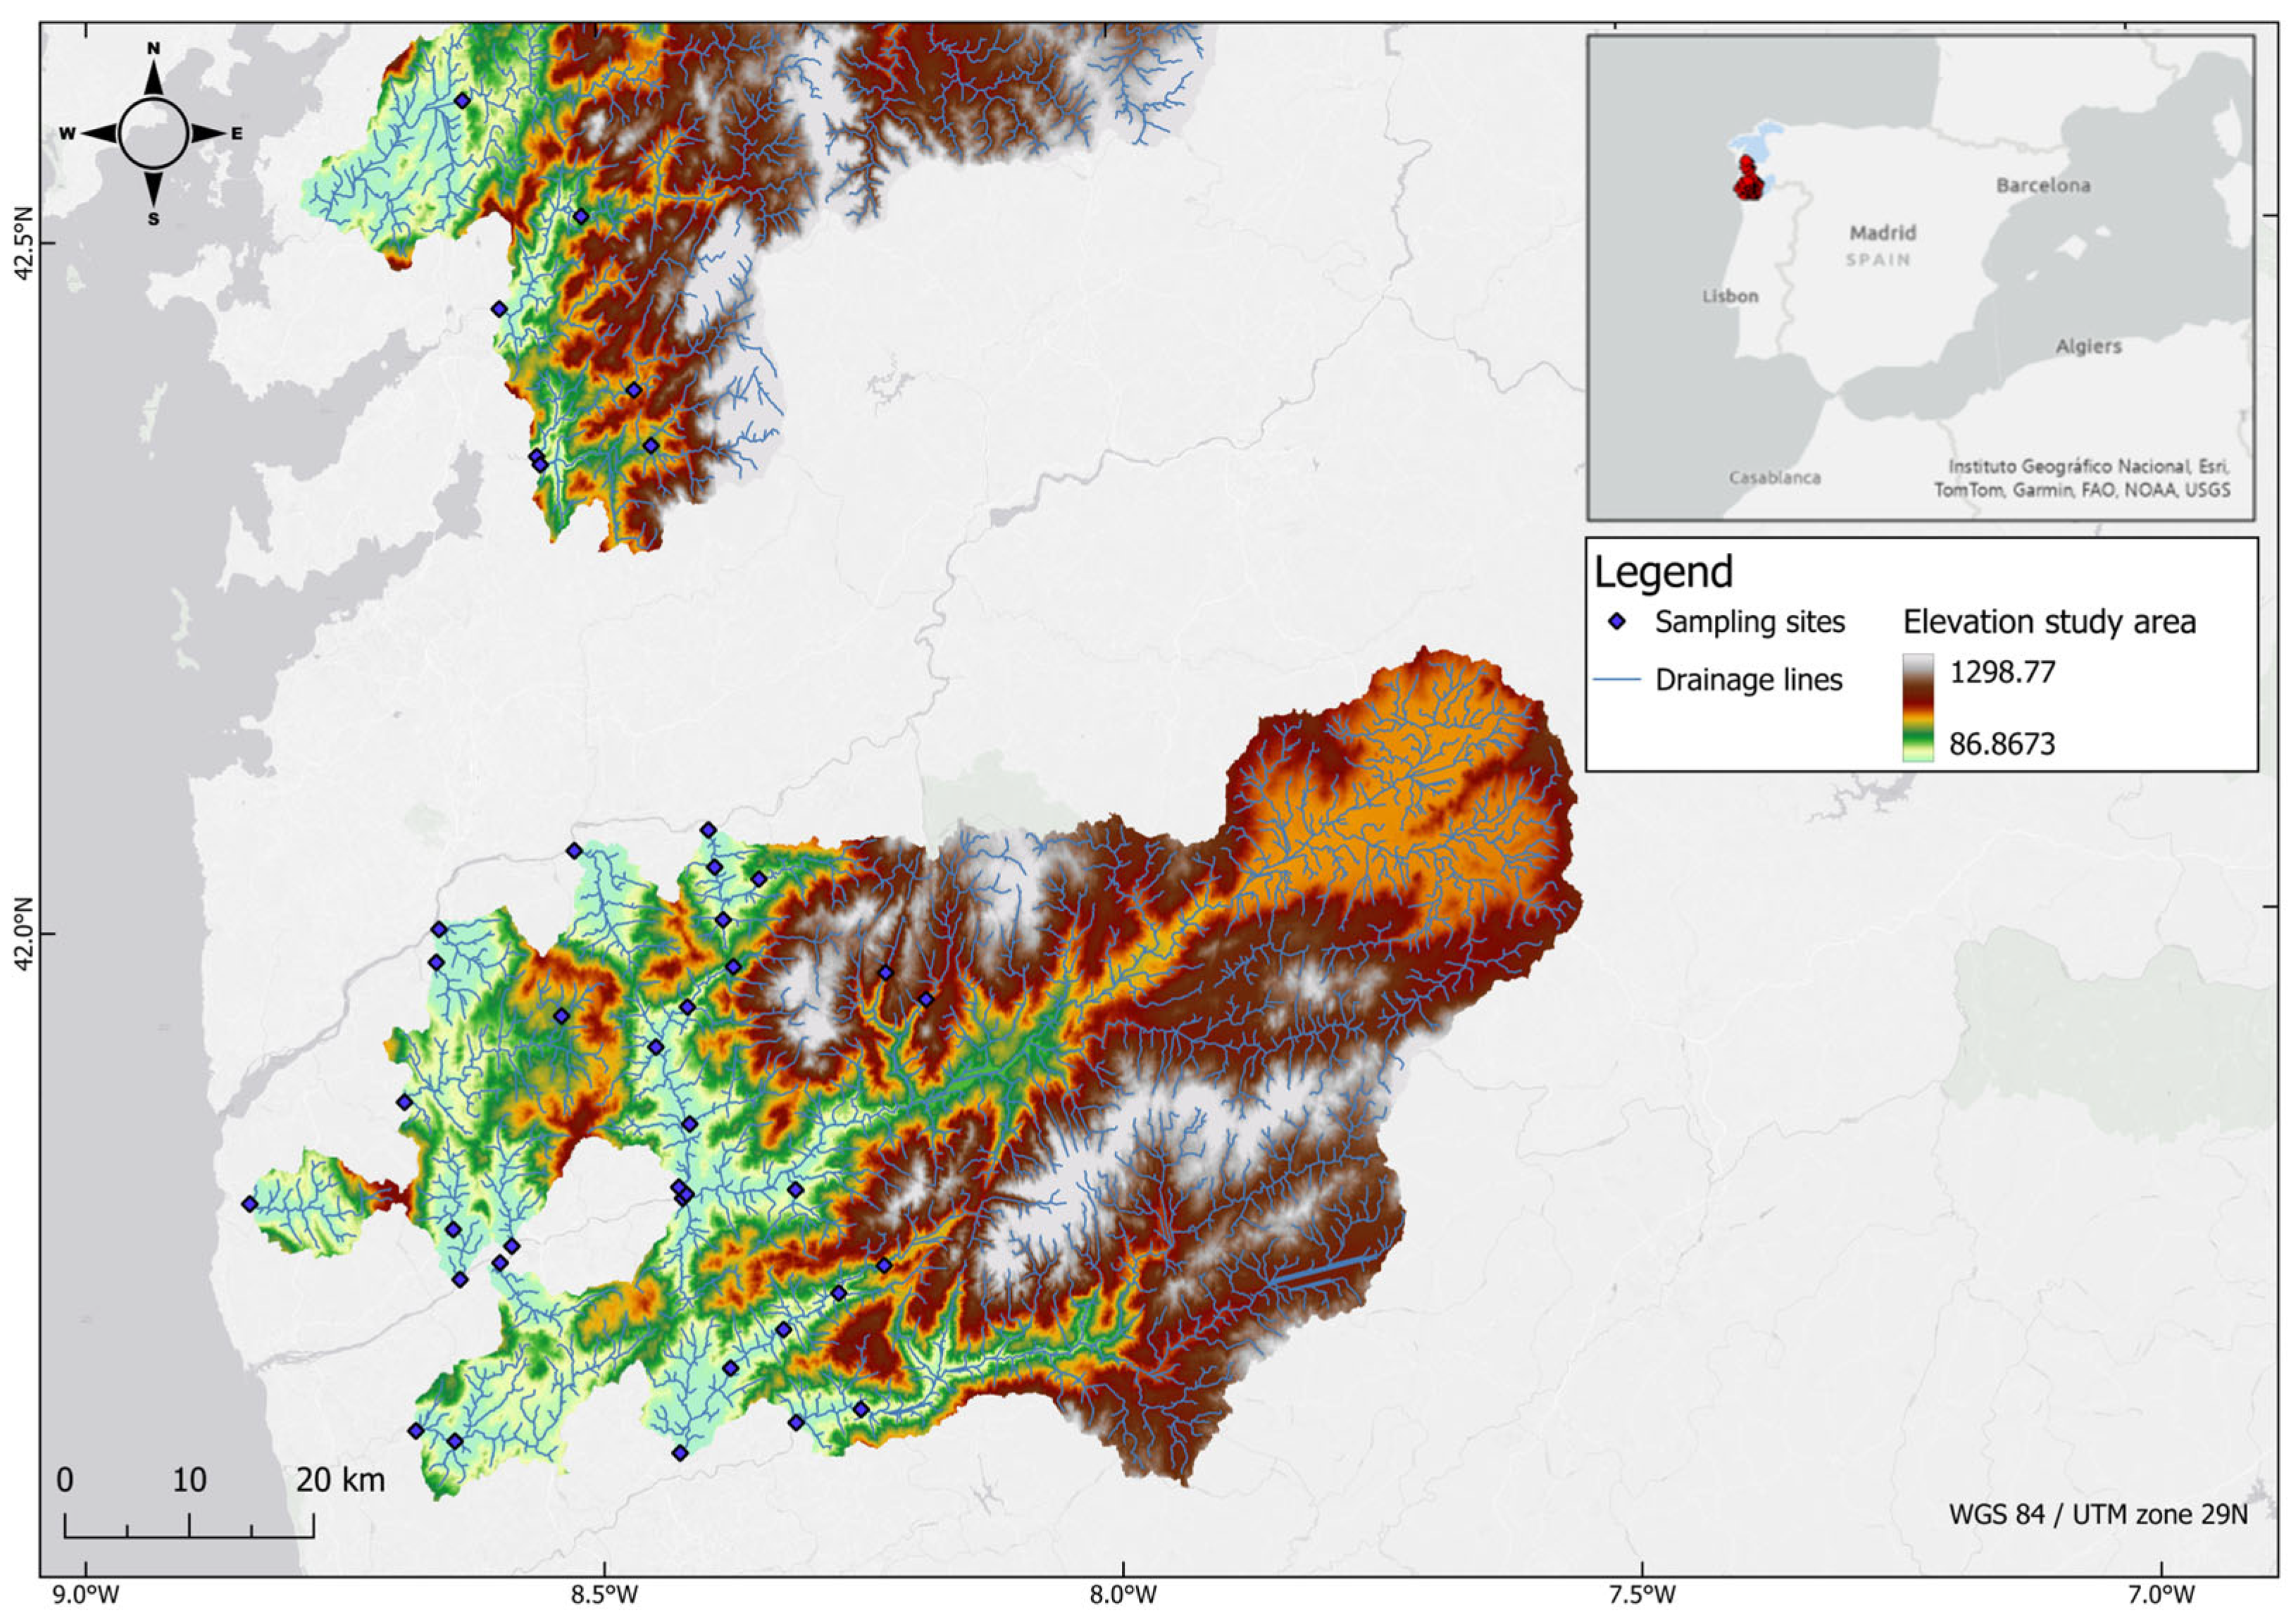
The study was conducted in the Northwestern Iberian Peninsula, encompassing the Galicia-North Portugal Euroregion, a transboundary territory of approximately 51,000 km2 (Figure 1). This region features a complex geological history dominated by igneous and metamorphic rocks of the Hesperian (Iberian) Massif and soils derived from granite and schist [62]. Land use, according to the Land Occupation Information System (SIOSE) [63], is diverse, with forests (49.41%), grasslands and shrublands (29.61%), agricultural areas (12.64%), and artificial surfaces (7.86%) and water bodies (0.49%). Forests, primarily maritime pine (Pinus pinaster Aiton 1789) and eucalyptus (Eucalyptus globulus Labill., 1800), often replace native oak species (Quercus rubra L., 1753), while riparian zones host willows, alders, poplars, ash trees, and elms, depending on soil and microclimatic conditions, the water regime of the water line, and human intervention. The area’s Atlantic climate, influenced by maritime and continental winds, supports productive ecosystems but faces seasonal water scarcity due to shallow aquifers and reduced storage capacity. Hydrological features include a dense river network, with drainage patterns shaped by tectonic structures and characterized by seasonal runoff variability [64,65,66].
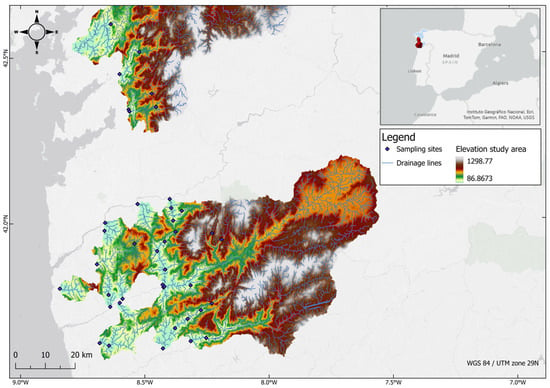
Figure 1.
Geographic location and digital elevation model in the Douro e Minho region—Portugal and Galicia region—Spain.
The key river basins analysed (Figure 1) include the Minho, Lima, and Cávado in the Portuguese territory, as well as the Oitavén, Verdugo, Lérez, and Umia in Galicia, which discharge into the highly productive Rías Baixas—coastal systems characterized by deeply indented shores shaped by gradual subsidence [67]. The Euroregion is home to several protected areas, including the Peneda-Gerês National Park, the North Litoral Natural Park, Serra do Cando, several protected landscapes and special protection zones, RAMSAR sites (e.g., the Umia-O Grove Intertidal Complex), UNESCO biosphere reserves, and Geosites. These areas are critical for conserving biodiversity and ensuring ecological connectivity. However, human activities such as agriculture, livestock farming, and forestry have significantly altered native vegetation, leading to ecosystem degradation [68]. Despite its environmental and socio-economic challenges, the Euroregion offers unique opportunities for studying interactions between landscape metrics and water quality to support sustainable management strategies.
2.2. Data and Variable Selection for Water Quality Analysis
2.2.1. Water Quality Assessment Using Benthic Macroinvertebrate Assemblages
Benthic macroinvertebrates constitute a taxonomically and functionally diverse group of aquatic organisms, including insect larvae such as Ephemeroptera (mayflies), Plecoptera (stoneflies), and Trichoptera (caddisflies), as well as Diptera (e.g., Chironomidae), crustaceans, molluscs, and annelids (e.g., Oligochaeta). These organisms inhabit the substrates of rivers and streams and respond sensitively to changes in water quality, habitat structure, and hydromorphological conditions. Due to their relatively limited mobility and life cycles spanning several months, macroinvertebrate assemblages provide an integrated measure of ecological conditions over time, reflecting both natural and anthropogenic influences. Macroinvertebrate communities were sampled in a total of 40 sites, 7 in the Galicia region (sampled during the years 2010 and 2016) and 33 in Entre Douro e Minho (sampled in the years 2010 and 2015–2016). The higher number of Portuguese sites reflects broader data availability from national and regional WFD monitoring networks. In Galicia, only sites with complete information on IBMWP values and corresponding landscape metrics for the same sampling years were included, ensuring data consistency and regional representativeness.
In Portugal, the sampling was conducted during the spring/summer (dry season), in accordance with the WFD regulations, which standardize the timing of ecological assessments. In Galicia, the data corresponds to regional monitoring programs conducted throughout all four seasons. Although these campaigns were not specifically designed for direct comparison with Portuguese sites, they provide enough information to apply the IBMWP index and evaluate ecological quality, enabling meaningful regional comparisons.
Benthic macroinvertebrate sampling followed a comparable protocol in both Portugal and Spain, ensuring data harmonization across the transboundary study area. In both countries, sampling was based on a multihabitat kick-sampling approach using a 500 µm mesh D-frame net (Entomopraxis, Barcelona, Spain). Habitat types were selected proportionally to their coverage in the reach. Only habitats occupying at least 5% of the streambed were included. In Portugal, macroinvertebrates were collected in a 50 m reach centered around a riffle (25 m upstream and 25 m downstream), using six sampling units of 1 m × 0.25 m (total sampled area ≈ 1.25 m2). These units were proportionally distributed across available microhabitats. Inorganic substrates included bedrock/boulders, stones, gravel/pebble, sand, silt and clay, while organic substrates comprised macrophytes and algae, and coarse particulate organic matter. The resulting composite sample was preserved in 99% ethanol (AGA, São Brás de Alportel, Portugal). In Spain, sampling was conducted over a 100 m reach, using 20 standardized kick samples of 0.5 m × 0.25 m (0.125 m2 each), covering a total area of 2.5 m2. Sampling effort was allocated proportionally to the estimated habitat cover, and the same net type and upstream sampling direction were used as in Portugal. Despite minor differences in reach length and total sampled area, both protocols are officially recognized and routinely used in their respective countries for the Iberian Biological Monitoring Working Party index (IBMWP). Therefore, both methods are valid and reliable, providing comparable results without compromising data accuracy or ecological integrity.
Despite the implementation of the WFD and the development of new biological indices based on macroinvertebrates, the Iberian Biological Monitoring Working Party index (IBMWP) [69,70] remains widely used. Due to its proven reliability and widespread use in both Portugal and Spain, this IBMWP index was chosen. Adapted from the United Kingdom BMWP index [71], it incorporates specific Iberian families, modifies some tolerance scores, and correlates its values with five levels of contamination [69]. This makes it highly suitable for regional ecological assessments. Therefore, both methodologies were implemented according to WFD requirements and are fully comparable for supporting ecological status assessments under this regulatory framework.
The IBMWP method evaluates water quality based on the different tolerance levels of aquatic invertebrates to organic pollution. Sensitive species like mayflies and stoneflies, which indicate cleaner water, are given a high tolerance score of 10, while less sensitive species such worms (Oligochaeta) receive a score of 1. The presence and diversity of macroinvertebrates are key indicators. Higher water quality supports a greater variety of sensitive species, which signals fewer pollutants. The score of the IBMWP index (a single metric index, [72,73]) is calculated by summing the sensitivity weightings (tolerance scores) of the taxa present in a sample. The IBMWP score ranges from 0 to >100. Its interpretation is as follows: very good quality (IBMWP score > 100), good quality (IBMWP score between 61 and 100), fair quality (IBMWP score between 36 and 60), bad quality (IBMWP score between 16 and 35), and very bad quality (IBMWP score < 16).
2.2.2. Landscape Metrics
For each sampling site, the corresponding drainage area was delineated using ArcGIS ArcHYDRO Tools 10.8 (Esri, Redlands, CA, USA) and Copernicus DEM 25 × 25 m (Copernicus/European Environment Agency, Copenhagen, Denmark), as input data [74]. Flow direction, flow accumulation, and drainage lines were first calculated. Next, the drainage area from the upstream point to the sampling location was delineated using ArcHydro [75].
Landscape metrics (LSM) were calculated from the CORINE Land Cover (Copernicus/European Environment Agency, Copenhagen, Denmark, 2018) to quantify landscape configuration and composition for each drainage area using various indices. The ZonalMetrics Toolbox (Adamczyk & Tiede, University of Salzburg, Austria) [76] introduced in ArcGIS 10.8 (Esri, Redlands, CA, USA) was used for this purpose. It provides an intuitive graphical user interface and allows batch calculations. Metrics were calculated for each land use type: agriculture (AGR), forest (FOR), and artificial areas (ART), as outlined in Table 1. Additionally, some metrics, such as the Shannon diversity index, were calculated across all land use types. In total, 42 metrics were derived to characterize the land use configuration and composition. These metrics were subsequently used as candidate regressors in the models.

Table 1.
Calculated landscape metrics, and respective nomenclature. ART stands for artificial surfaces, AGR for agricultural areas, and FOR for forests and semi-natural areas. ALL stands for landscape metrics that include all land uses in the calculation of the metric.
2.3. Data Analysis
2.3.1. Linear Regression Models for Water Quality Prediction
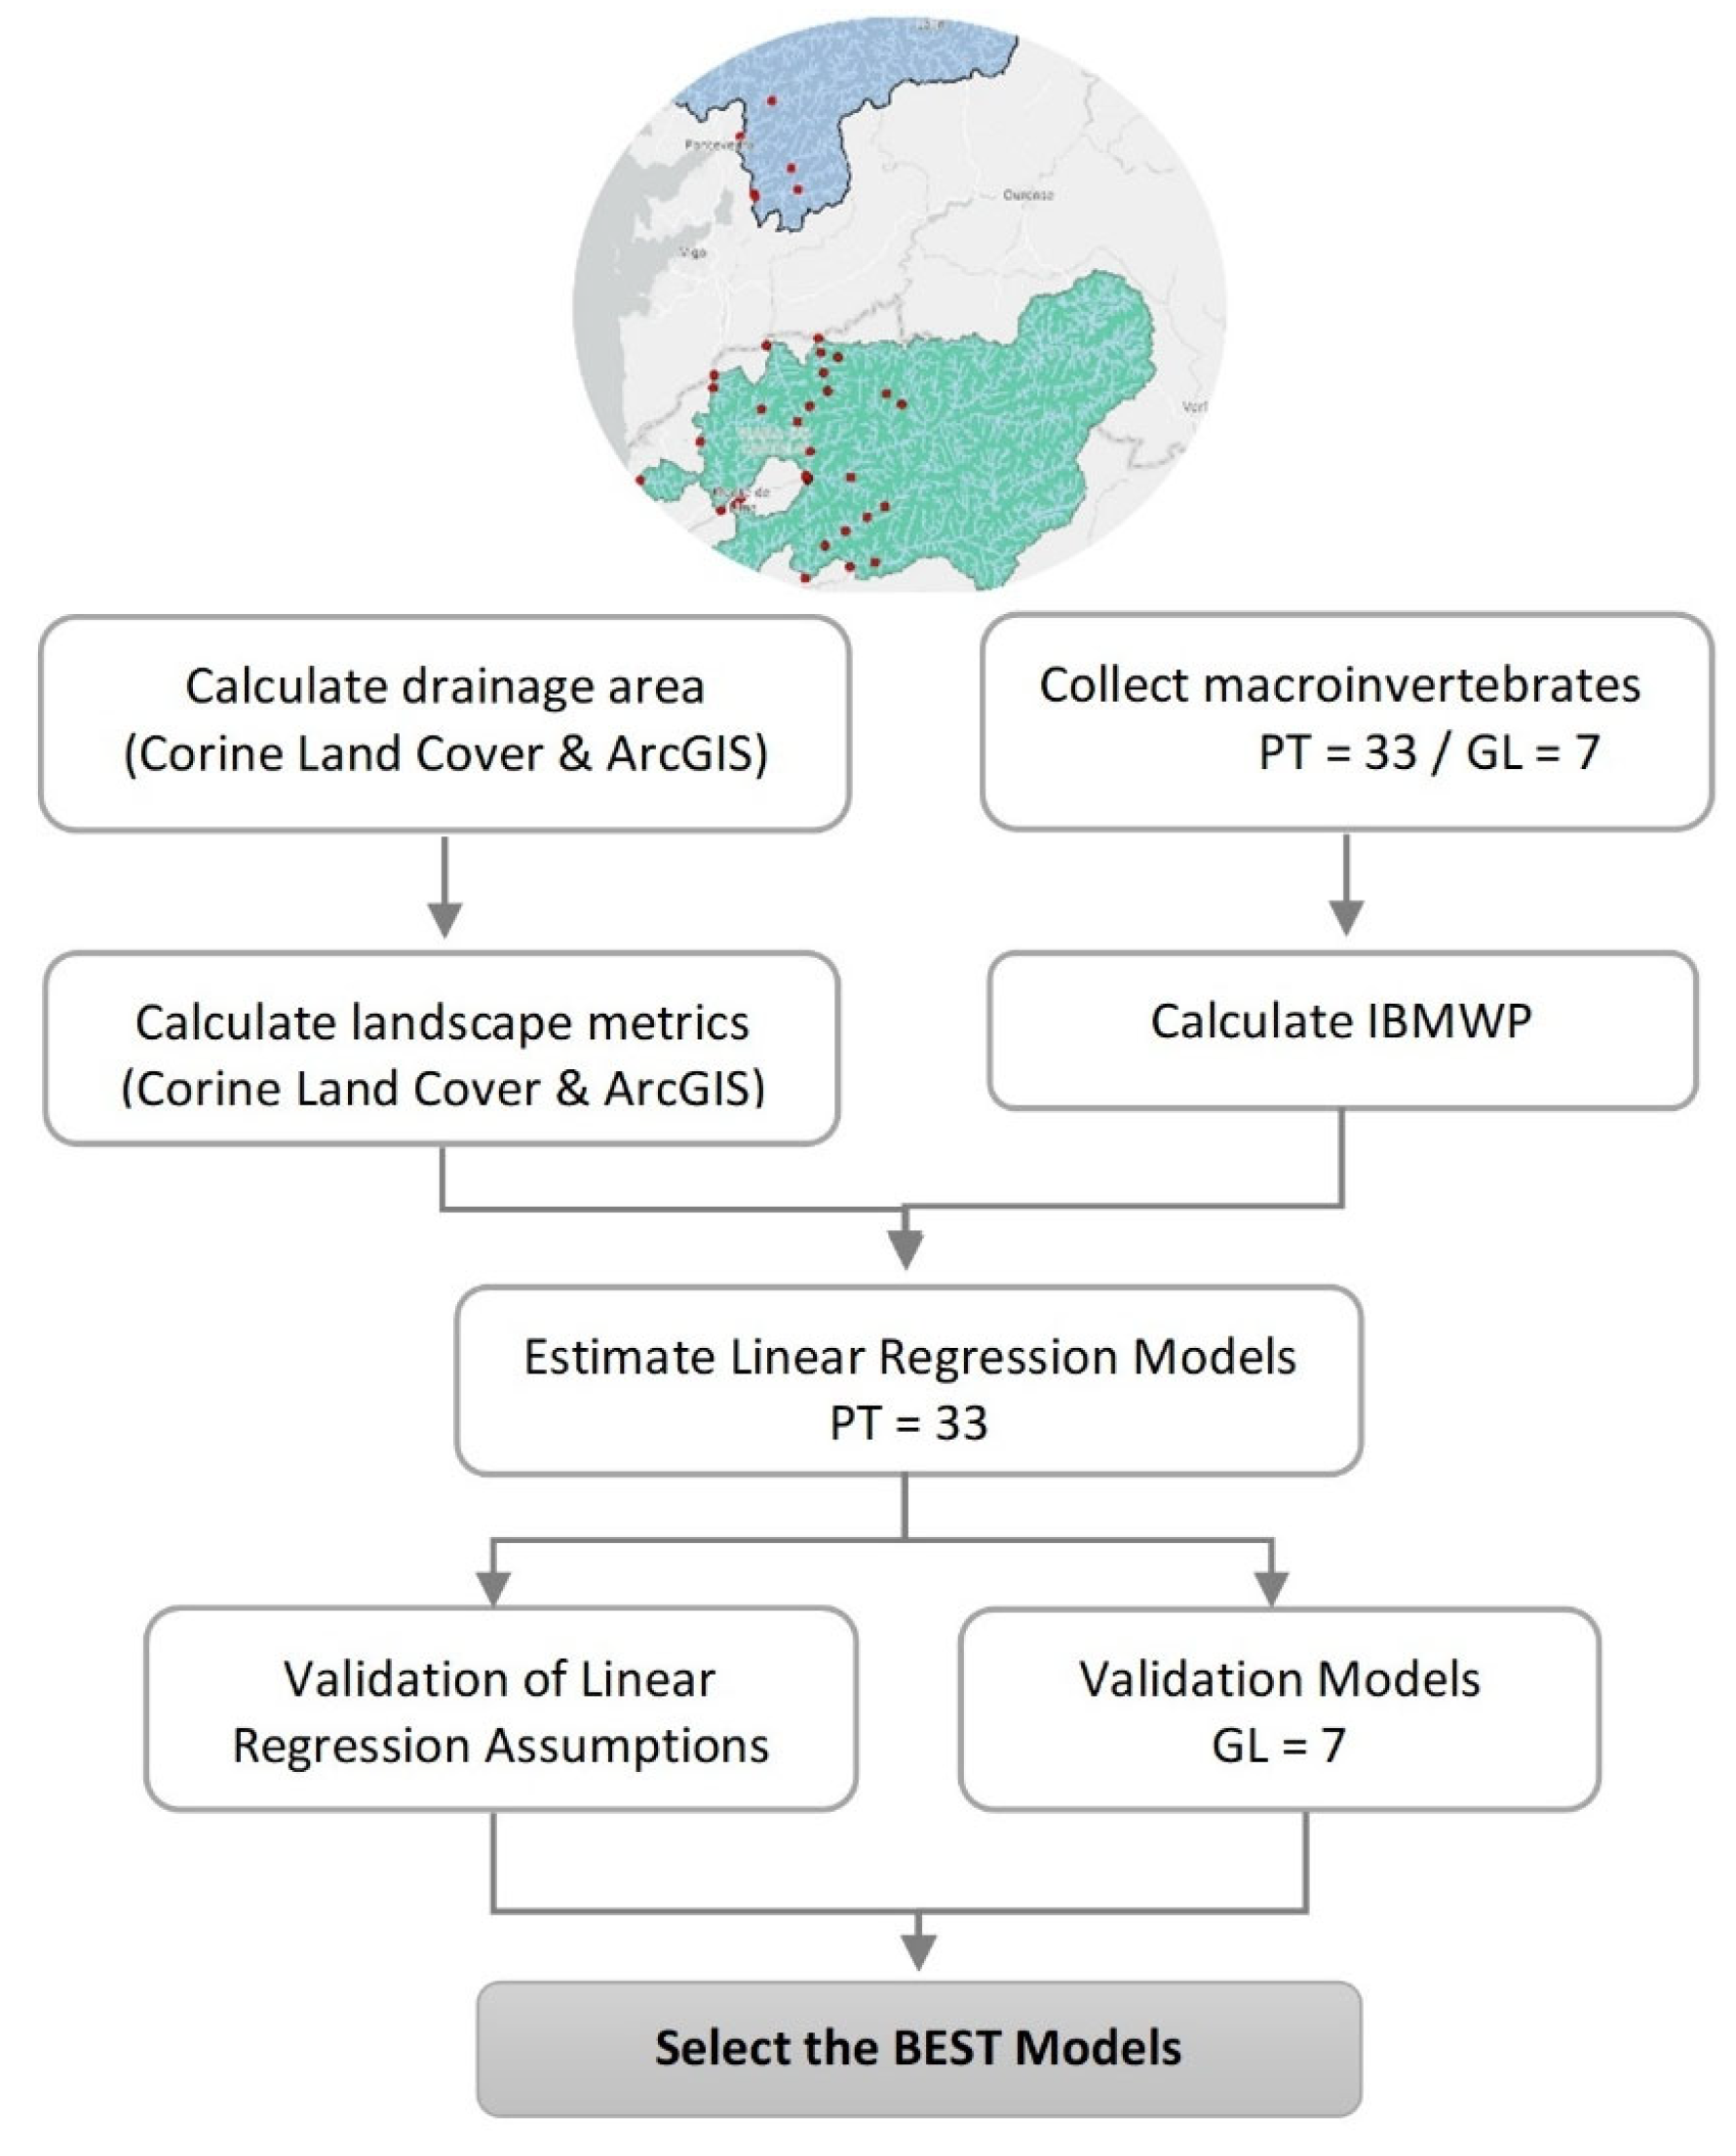
Once the input data from the 33 Portuguese samples were prepared, linear regression models were estimated using a brute force approach [59] in Python 3 (Python Software Foundation, Wilmington, DE, USA), Supplementary Materials S1. The objective was to identify all possible combinations of landscape metrics (independent variables) that could predict a surface water quality parameter IBMWP (dependent variable) (Figure 2). The algorithm used is thoroughly described by Fernandes et al., 2023 [59]. In summary, running the algorithm requires defining several inputs: candidate regressors (LSM), the dependent variable (IBMWP), the minimum and maximum number of regressors, the statistical significance threshold, and maximum Variance Inflation Factor (VIF). For this study, the number of regressors was set between 1 and 6, a statistical significance level of 0.05 and the maximum VIF among regressors was set at 5 to ensure minimal multicollinearity and reliable estimation of individual effects on the IBMWP index.
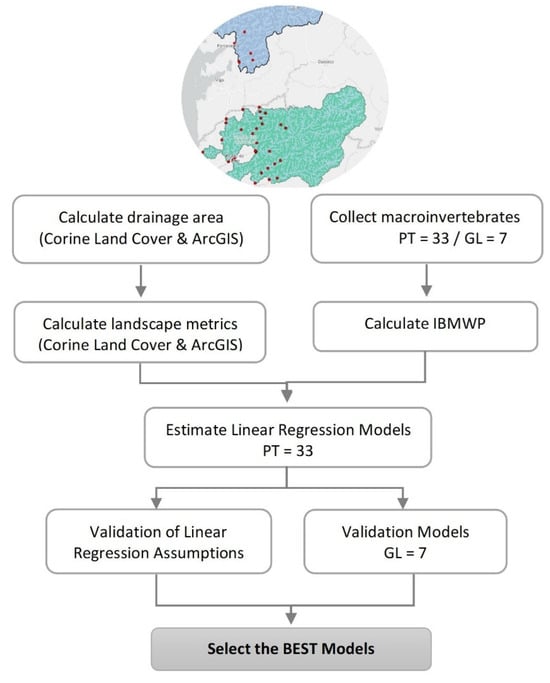
Figure 2.
Methodological workflow for choosing the best models for water quality prediction.
The algorithm generated all possible combinations of regressors within the thresholds. For each combination, it computed the linear regression model, VIF for each regressor, R2, adjusted R2, the significance of the regressors, and results of heteroscedasticity and error normality tests. If the defined thresholds are not met, the algorithm proceeded to the next combination of candidate regressors, continuing until all combinations were generated and evaluated. The final output is a list of linear regression models, including all relevant statistical test results and regression coefficients (Supplementary Materials S2).
The algorithm does not perform autocorrelation tests, as they are typically required when each sample corresponds to a different timestep. In this study, each sample represents a drainage area. Therefore, spatial autocorrelation of the error term was separately assessed using Moran’s I test [77] to ensure that the residuals were not spatially clustered (Supplementary Materials S2).
The resulting models were then analyzed considering the assumptions of linear regression. They were calibrated with data from Portugal (33 samples) and validated with data from the Galicia region (7 samples).
2.3.2. Model Assessment
The output models generated by the algorithm adhere to the predefined statistical thresholds. However, selecting a single “best” model is not straightforward, as multiple factors need to be considered. Key features of suitable models include high R2 values and high p-values for heteroscedasticity and error normality tests, as the regression model is valid when the null hypothesis is accepted. Additionally, models with low Zscores were considered preferable. Model performance was further evaluated using Mean Absolute Percentage Error (MAPE), Percentage Bias (PBIAS) and Normalized Root Mean Square Deviation (NRMSD) [59,78,79] These metrics were calculated for predictions in the Galicia drainage areas and compared with the observed values (Table 2).

Table 2.
Rating of water quality prediction models, based on the Percentage Bias (PBIAS) and Mean Absolute Percentage Error (MAPE), adapted from Salis et al., 2019 [79] and Fernandes et al., 2023 [59].
3. Results and Discussion
3.1. Macroinvertebrate Diversity and Water Quality
In this study, 1,926,343 benthic macroinvertebrate individuals belonging to 106 families were identified across the 40 studied sites (7 GL and 33 PT), coordinates are provided in the Supplementary Materials S2. Macroinvertebrate density varied significantly. The highest density was recorded at station GL_SS_1 (23,662.4 ind/m2) and the lowest at PT_T22 (25.6 ind/m2). Mean density also differed markedly between regions: GL had a mean of 9713.9 ind/m2, while PT averaged 815.5 ind/m2. Despite GL sites having higher macroinvertebrate abundance, PT sites exhibited greater family richness, with 103 families compared to 75 in GL. The Shannon-Wiener diversity index in GL ranged from 1.95 to 2.83, with the highest value at GL_SS_4 and the lowest at GL_SS_1 (1.36). These diversity values were moderate, reflecting a community dominated by a few families (Chironomidae, Simuliidae, Elmidae, Baetidae, Hydropsychidae, Leptophlebiidae, and Nemouridae). This dominance results in lower overall diversity. In contrast, PT sites exhibited a broader range of Shannon-Wiener diversity values, from 0.17 at PT_T8 to 3.08 at PT_T55. Overall, PT demonstrated higher diversity, particularly at sites such as PT_T55, PT_T50, and PT_T3, where values exceeded 2.5. This aligns with the earlier finding that PT sites, despite their lower macroinvertebrate abundance, exhibit greater family diversity and richness. Although some methodological differences exist between countries, both protocols are based on multihabitat kick-sampling. They were designed to capture the ecological heterogeneity of stream reaches. This common focus ensures comparability, especially for the application of the IBMWP index, which relies on the presence of key macroinvertebrate families rather than absolute abundance. The lower abundance values recorded in Portuguese sites likely reflect the smaller sampled area rather than ecological differences alone. However, because both methodologies prioritize the proportional representation of dominant habitats, they remain fully compatible and valid for assessing ecological quality under the IBMWP framework.
The significant differences observed between GL and PT regions align with ecological patterns documented in other studies. For instance, noted a similar trend in river systems, where sites with higher abundance often showed dominance by a few tolerant species, resulting in reduced diversity. This pattern is evident in the GL region, where the high abundance is accompanied by moderate diversity due to community dominance by a limited number of families. Conversely, the findings in the PT region [80], with its greater richness and diversity (103 families), align with studies like Zhang et al., 2019 [81]. These studies showed that regions with more diverse and heterogeneous habitats tend to support richer macroinvertebrate communities. The Shannon-Wiener index values further substantiate this trend, with PT sites exhibiting higher diversity compared to GL. Similarly, studies such as Dolédec et al., 2006 [82], highlight that high diversity, even in the context of lower abundance, reflects a more balanced and ecologically resilient structure, a pattern evident in the results of the present study.
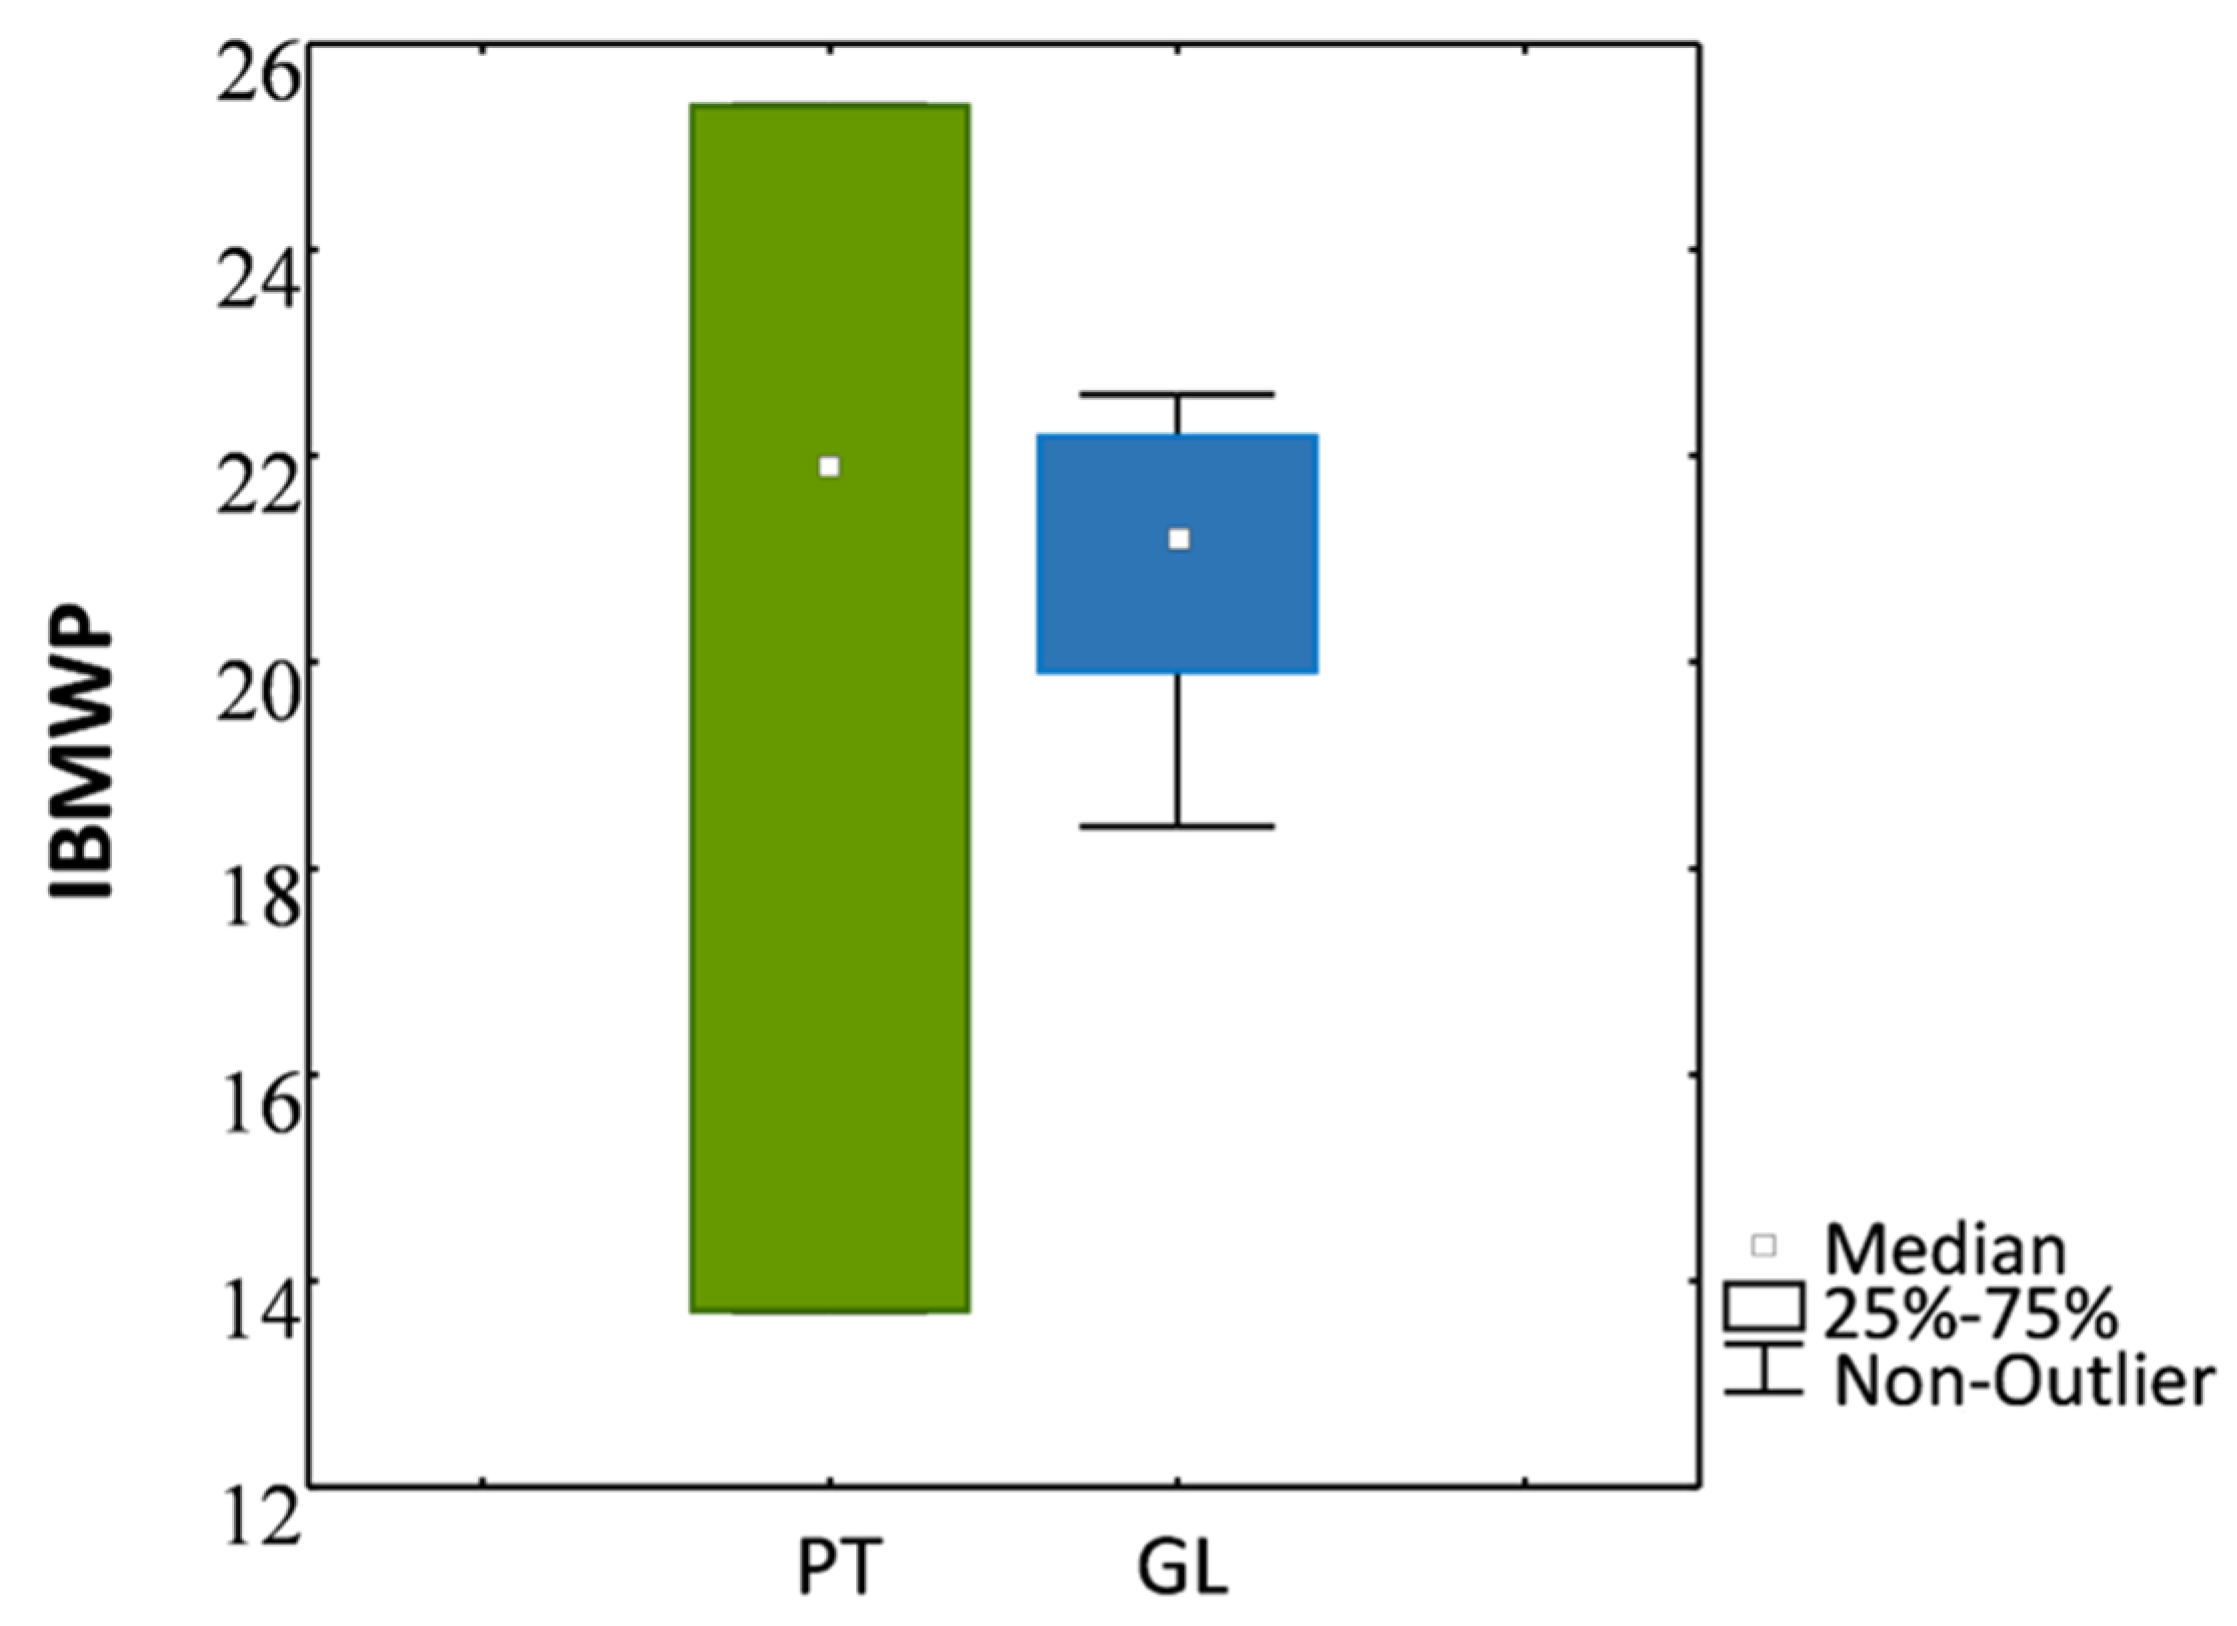
The high IBMWP scores across both regions, with 85% of sites showing very good biological quality, align with previous research linking biological monitoring indices to water quality assessments. Scores were consistently high across Portuguese and Spanish sampling sites, with no significant differences detected between regions (Kruskal–Wallis: KW-H (1;10) = 0.1169, p = 0.7324; ANOVA: F(1;8) = 0.064, p = 0.8066) (Figure 3). This pattern reflects preserved or moderately impacted ecosystems in both areas, as noted by Menezes et al., 2010 [83].
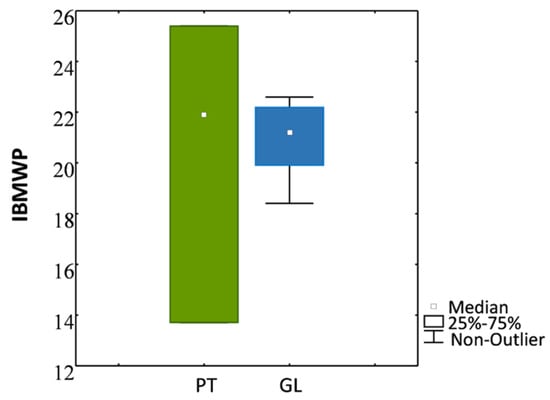
Figure 3.
Box and whisker plot showing the annual average IBMWP values variation among years (2010 to 2016) within the two studied regions (Entre Douro e Minho, n = 33); and Galicia, n = 7). The lower and upper end of boxes represent interquartile ranges (25%ile to 75%ile), range bars represent the maximum and minimum of non-outliers, small squares are medians. No significant differences were detected among regions (Kruskal–Wallis, p = 0.73; ANOVA, p = 0.81).
Of the 40 sites studied, 34 (85%) were classified as having very good biological quality encompassing all GL sites (100%) and most sites in the Entre Douro e Minho region (82%). However, in the remaining 18% of Entre Douro e Minho sites, water quality was more varied, spanning three quality classes: good (9%), fair (6%), and bad (3%). Notably, the variability in IBMWP scores was higher for Portuguese sites compared to GL ones, where the scores exhibited minimal variability, suggesting more consistent conditions in the GL region (Figure 3).
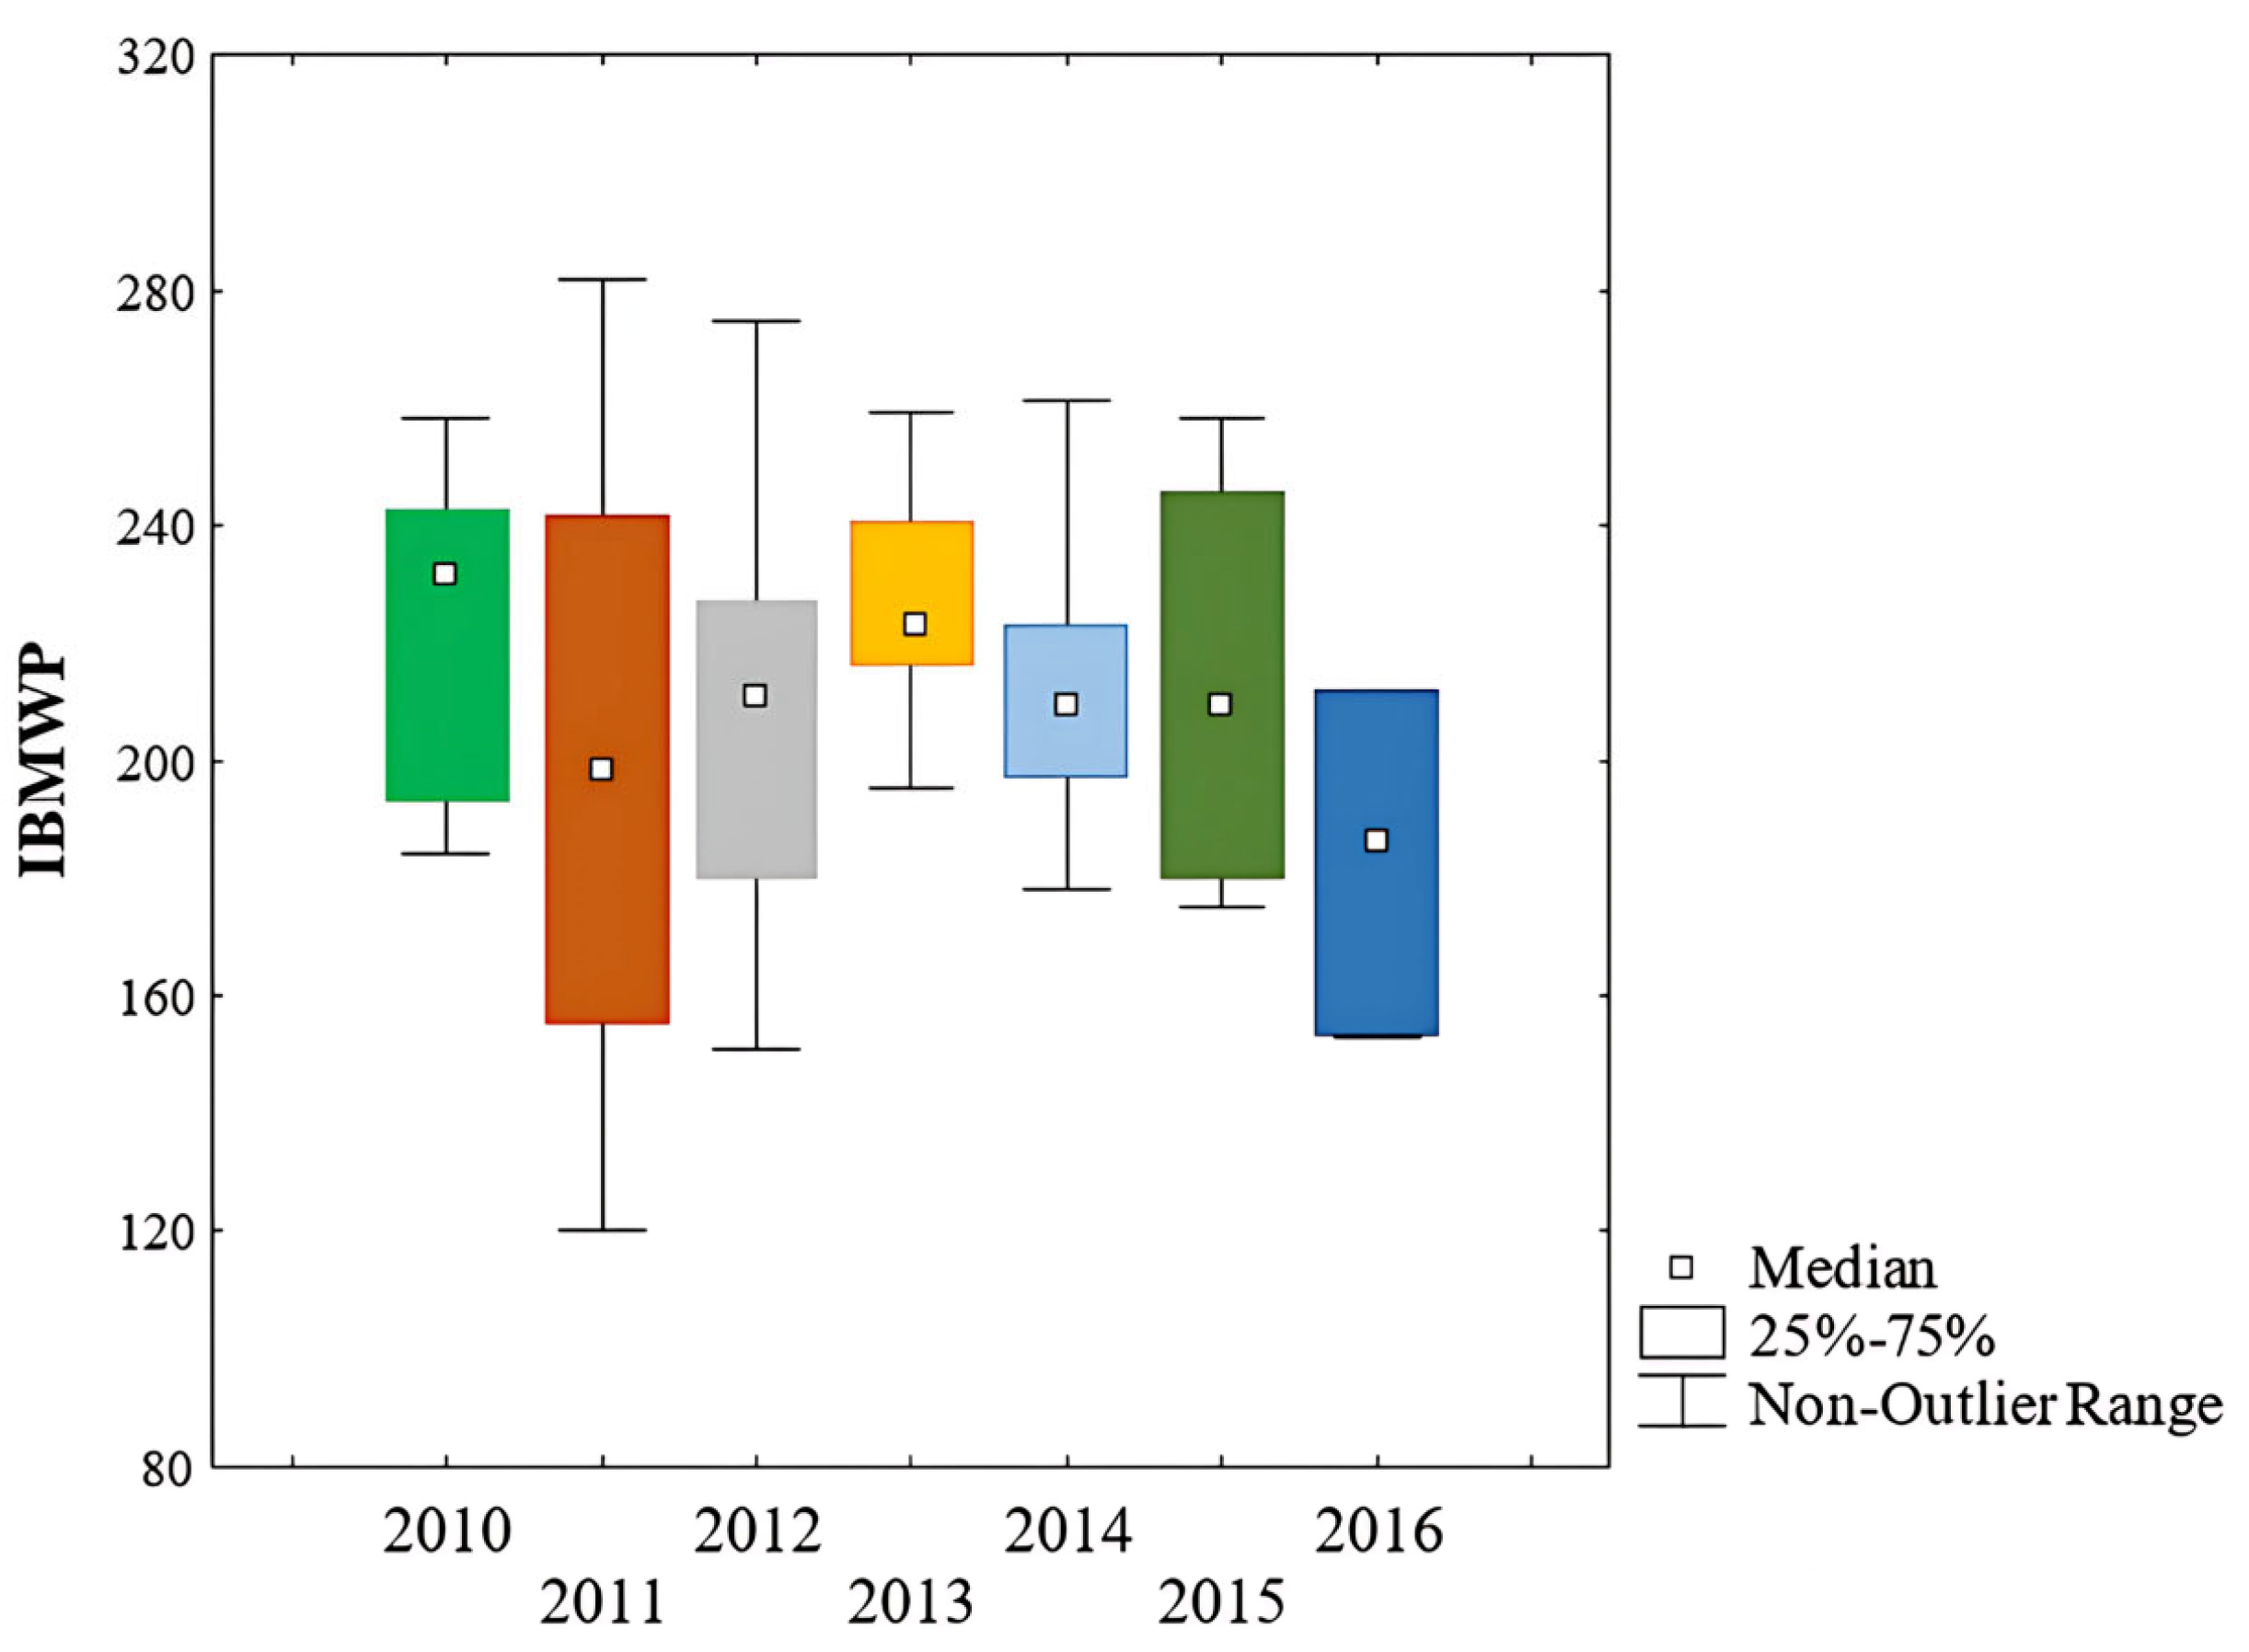
The absence of significant differences between annual IBMWP values in the GL region over the seven-year study period (KW-H (6;78) = 7.5447, p = 0.2734; F(6;71) = 1.4357, p = 0.2132) further underscores the stability of water quality in these ecosystems (Figure 4). Annual trends showed high variability in earlier years (2010–2011), followed by a moderate decrease in variability in later years (2013–2016). This trend, possibly influenced by environmental and sampling factors, suggests that while the median IBMWP values showed a slight downward trend, these fluctuations did not significantly impact water quality based on biological indicators (macroinvertebrates) (Figure 4). These results, combined with statistical tests showing no significant differences between regions or across years, align with findings by Feio et al. 2014 [84], who reported that biological indices remain stable across regions with diverse land uses, provided ecosystems are balanced. Despite differences in macroinvertebrate abundance and richness, the comparably high IBMWP scores in both regions reflect the overall health and stability of these aquatic ecosystems.
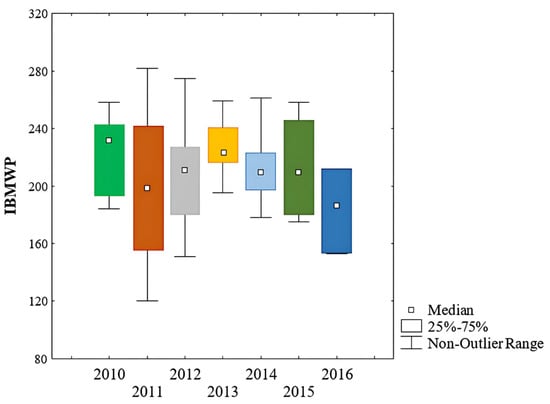
Figure 4.
Box and whisker plot showing the IBMWP values variation within the seven studied years (2010–2016) in Galicia sites. The lower and upper end of boxes represent interquartile ranges (25%ile to 75%ile), range bars represent the maximum and minimum of non-outliers, small squares are medians. No significant differences were detected among years (Kruskal–Wallis, p = 0.27; ANOVA, p = 0.21).
These findings have direct implications for management and conservation strategies. The higher family richness and diversity observed in Portuguese sites suggest that maintaining habitat heterogeneity is crucial for supporting resilient macroinvertebrate communities. Conversely, the dominance of a few tolerant species in GL sites, despite higher abundance, indicates that management should prioritize measures to increase habitat complexity and connectivity to promote ecological balance. In practice, monitoring efforts can focus on key strategic locations across the Euroregion to identify potential stressors and implement targeted restoration actions, such as riparian buffer enhancement or reforestation, which can help maintain or improve water quality.
3.2. Landscape Metrics Assessment
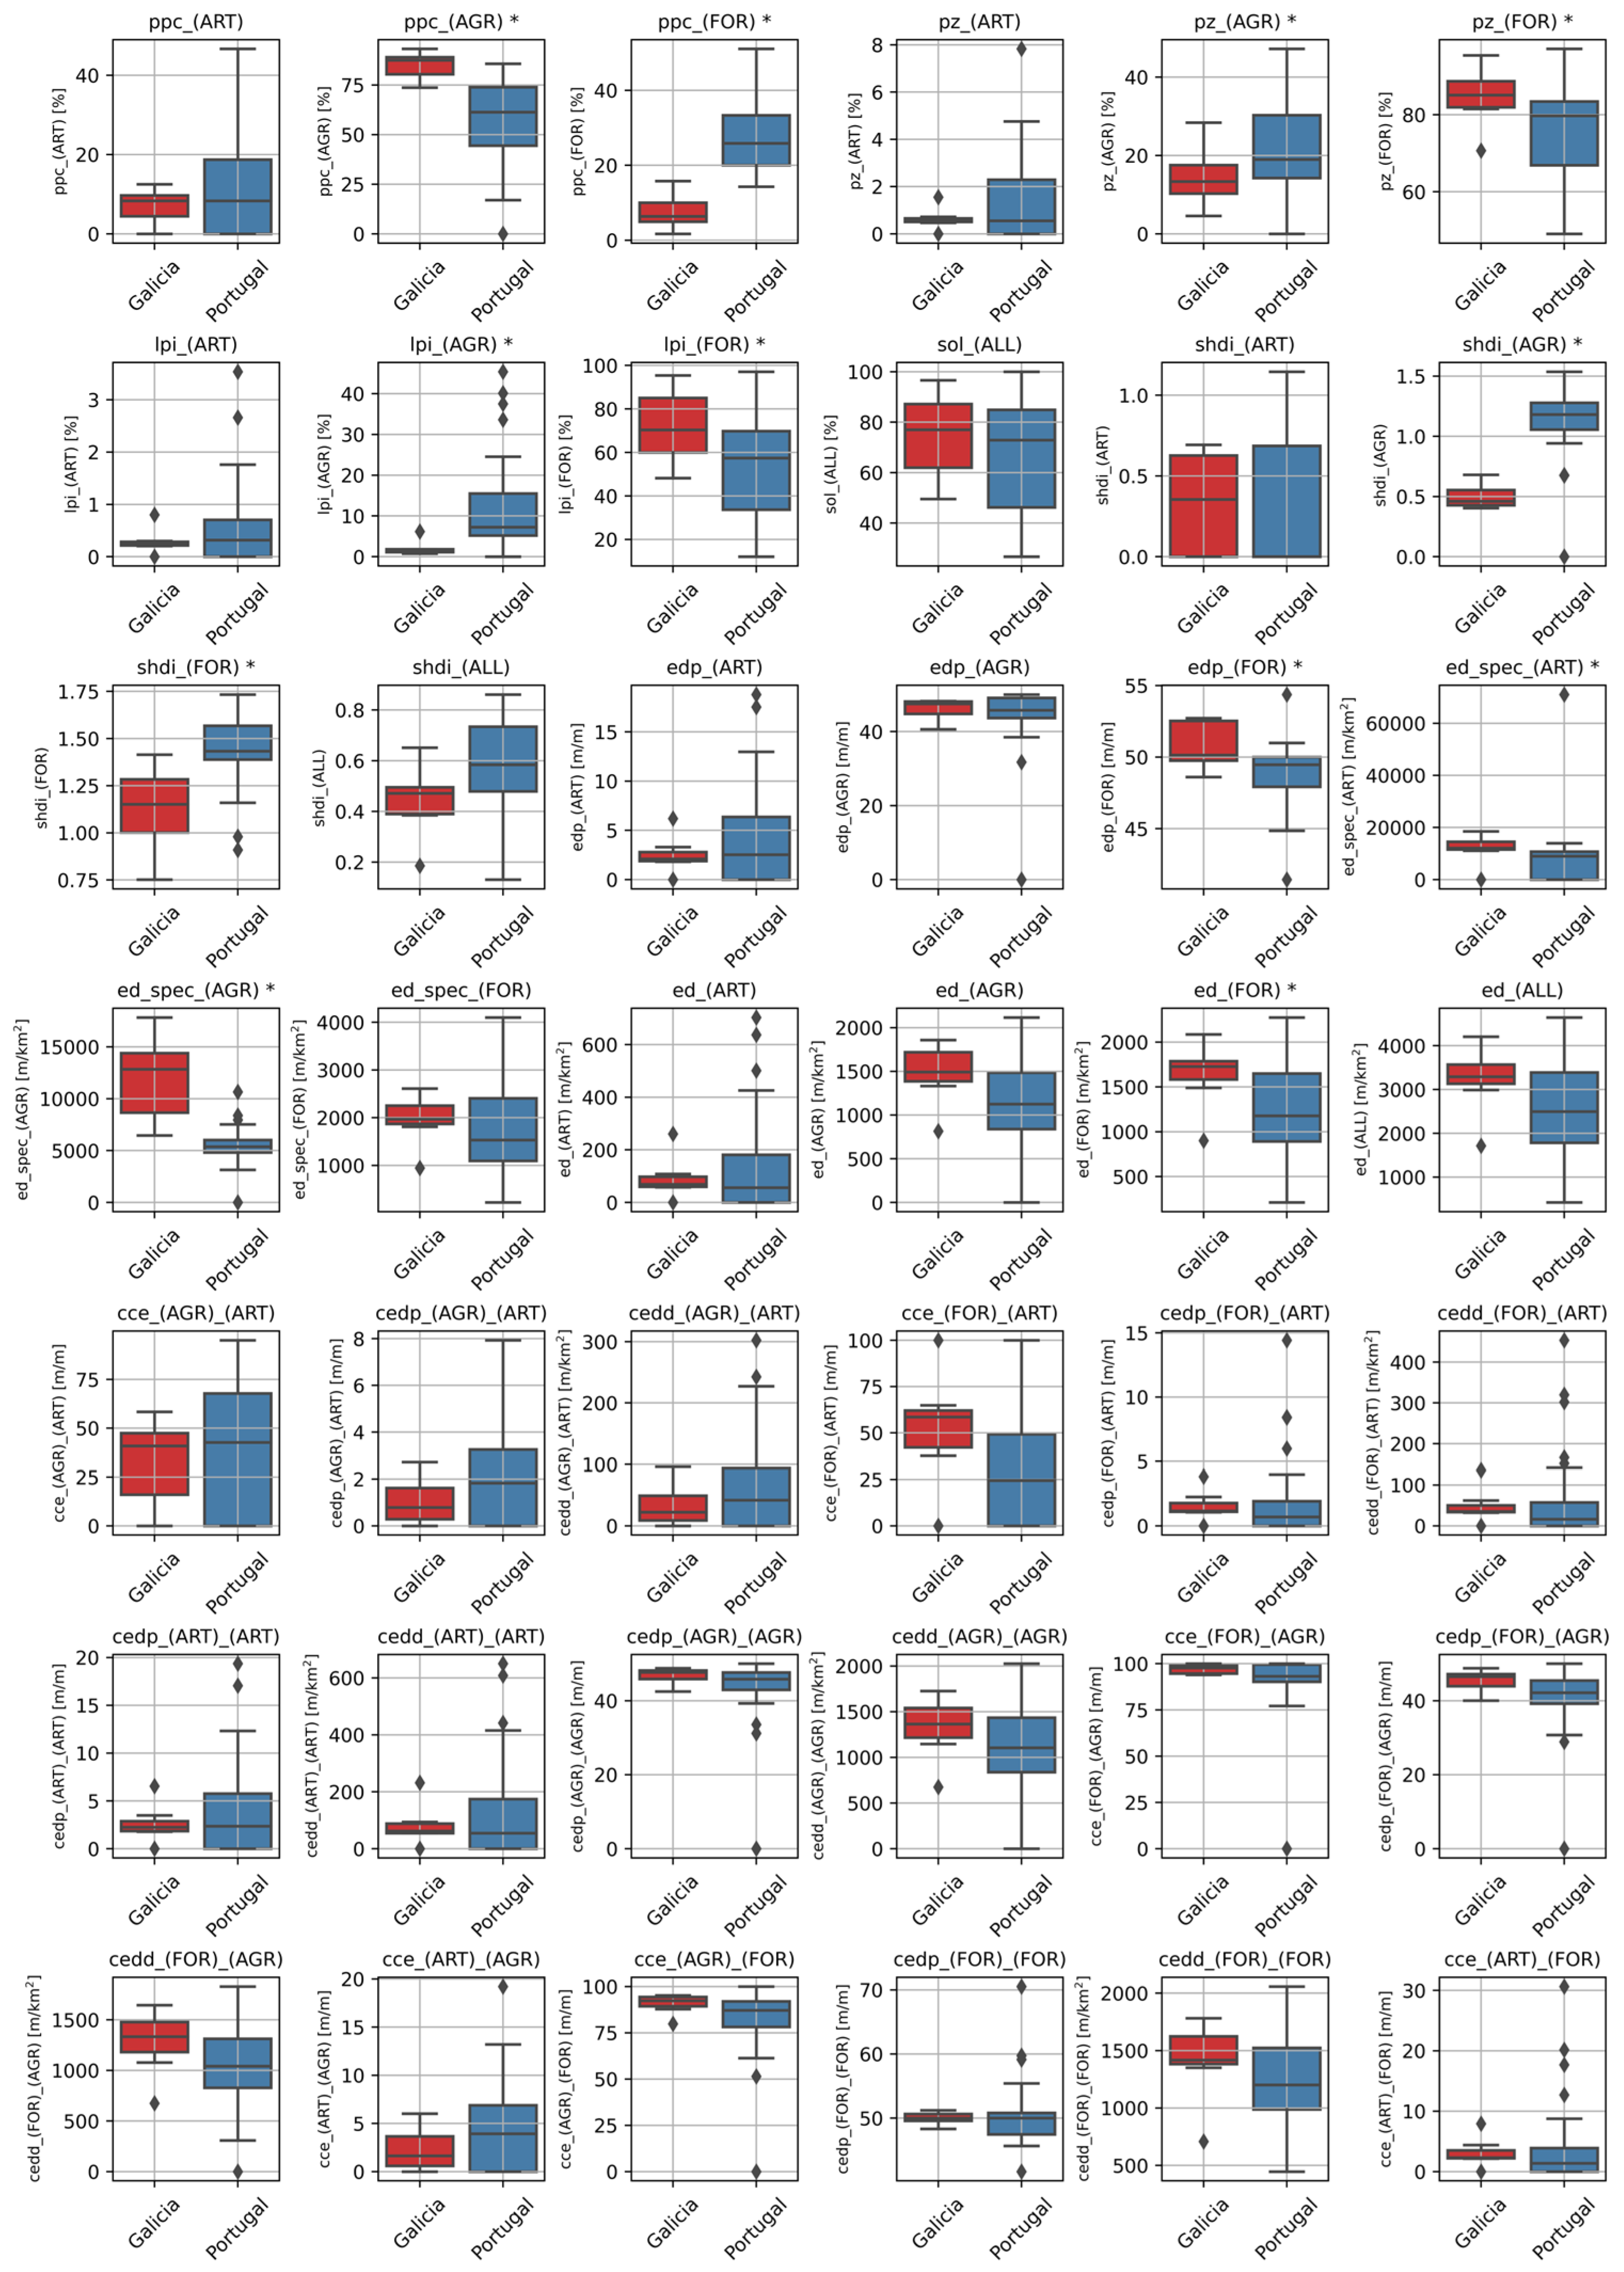
The analysis of landscape metrics highlights differences in land management practices between Galicia (GL) and Portugal (PT). These differences are particularly notable for agricultural and forested areas. A total of 42 landscape metrics, grouped into 11 categories, were calculated for different land uses. The values compared between the two regions (n = 33 for PT and n = 7 for GL) using the Shapiro–Wilk test (Figure 5). Comparisons were made using the Mann–Whitney U test for non-normal distributions or Student’s t-test for normal distributions. Significant differences (p < 0.05) were found in 13 metrics, highlighted with an asterisk (*) in Figure 5.
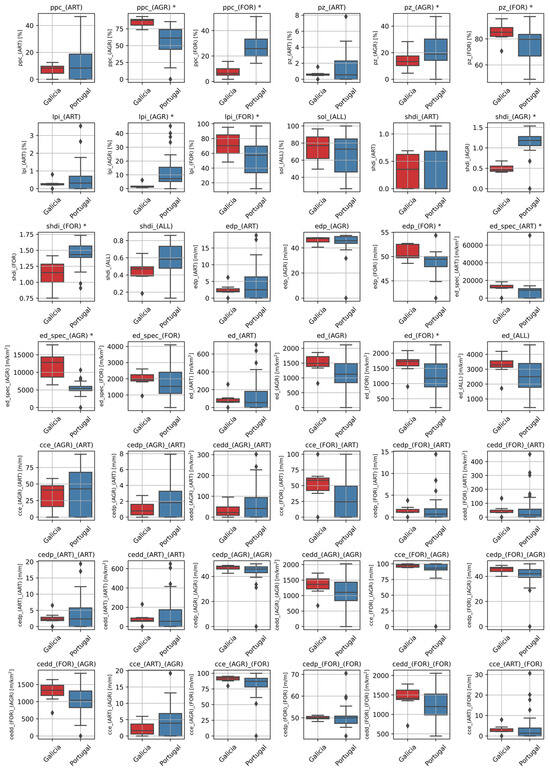
Figure 5.
Box and whisker plot showing the landscape metric (Table 1) values variation for the studied area from Portugal (n = 33) and Galicia (n = 7) within the studied years.
GL had a higher percentage of agricultural patches ppc_(AGR)*. In contrast, PT had higher percentages of forested patches ppc_(FOR)* and greater diversity indices in forested areas (shdi_(FOR)*). Discrepancies in the range of values between the two regions are evident in boxplots. GL shows a narrower range for some metrics, despite its smaller sample size. These findings suggest that management practices differ between the two regions, affecting landscape structure and ecological functions. PT shows greater diversity of land use types, with a mix of agricultural and forested patches. This diversity may contribute to higher biodiversity, consistent with findings from studies by Bieger et al., 2017 [85] and Dala-Corte et al., 2020 [86]. In contrast, the dominance of agricultural patches in GL reflects land use stress. This may explain its lower macroinvertebrate richness, a pattern similarly reported in agricultural watersheds by Marzin et al., 2012 [87]. This study highlights the loss of forested land to agricultural expansion, as noted by other studies in the area [88]. Regulatory frameworks also influence these observed differences. In Galicia, the Hydraulic Public Domain Regulation [89] and the Forest Law of Galicia [90] historically allowed forested land to be converted to agricultural use. These regulations often prioritized agricultural productivity over forestry. As a result, forested areas have decreased, negatively affecting connectivity and riparian biodiversity [88]. Reversing agricultural land to forestry is more complex. It is only permitted on abandoned agricultural land registered in a land bank for at least two years and requires prior notification to the forestry authority. Reforestation is only allowed under strict conditions. These include proximity to existing forested areas or the creation of up to 5-hectare enclaves using deciduous broad-leaved trees. This framework was in effect until its recent amendment under the Agricultural Land Recovery Law of Galicia [91], which came into force after the period analyzed in this study. In contrast, PT exhibited more diverse agricultural and forested landscapes, which are likely to support a richer ecological community and enhanced water quality regulation. However, the smaller sample size for GL limits the generalizability of these findings, as highlighted by Turner and Pham, 2015 [92]. Further studies with larger datasets are needed to confirm these patterns.
The analysis also underscores the impact of land ownership fragmentation, particularly in GL. As highlighted by Corbelle-Rico & López-Iglesias 2024 [93], fragmented ownership increases risks such as forest fires and flooding, complicating sustainable land management. These challenges emphasize the need for integrated governance strategies that balance agricultural and forestry interests [94], promoting a balance between agricultural production and biodiversity conservation, particularly in ecologically valuable areas.
From a management perspective, these landscape differences underline the importance of tailored land-use planning. In GL, strategies to reduce agricultural expansion or to restore forest patches in riparian zones could enhance connectivity and buffer capacity, mitigating runoff and improving water quality. In PT, preserving the diversity of forested and agricultural patches is essential to maintain ecosystem services. These insights support integrated, cross-border management policies that address both biodiversity conservation and sustainable land use, ensuring the long-term protection of aquatic ecosystems.
3.3. Global Model Results
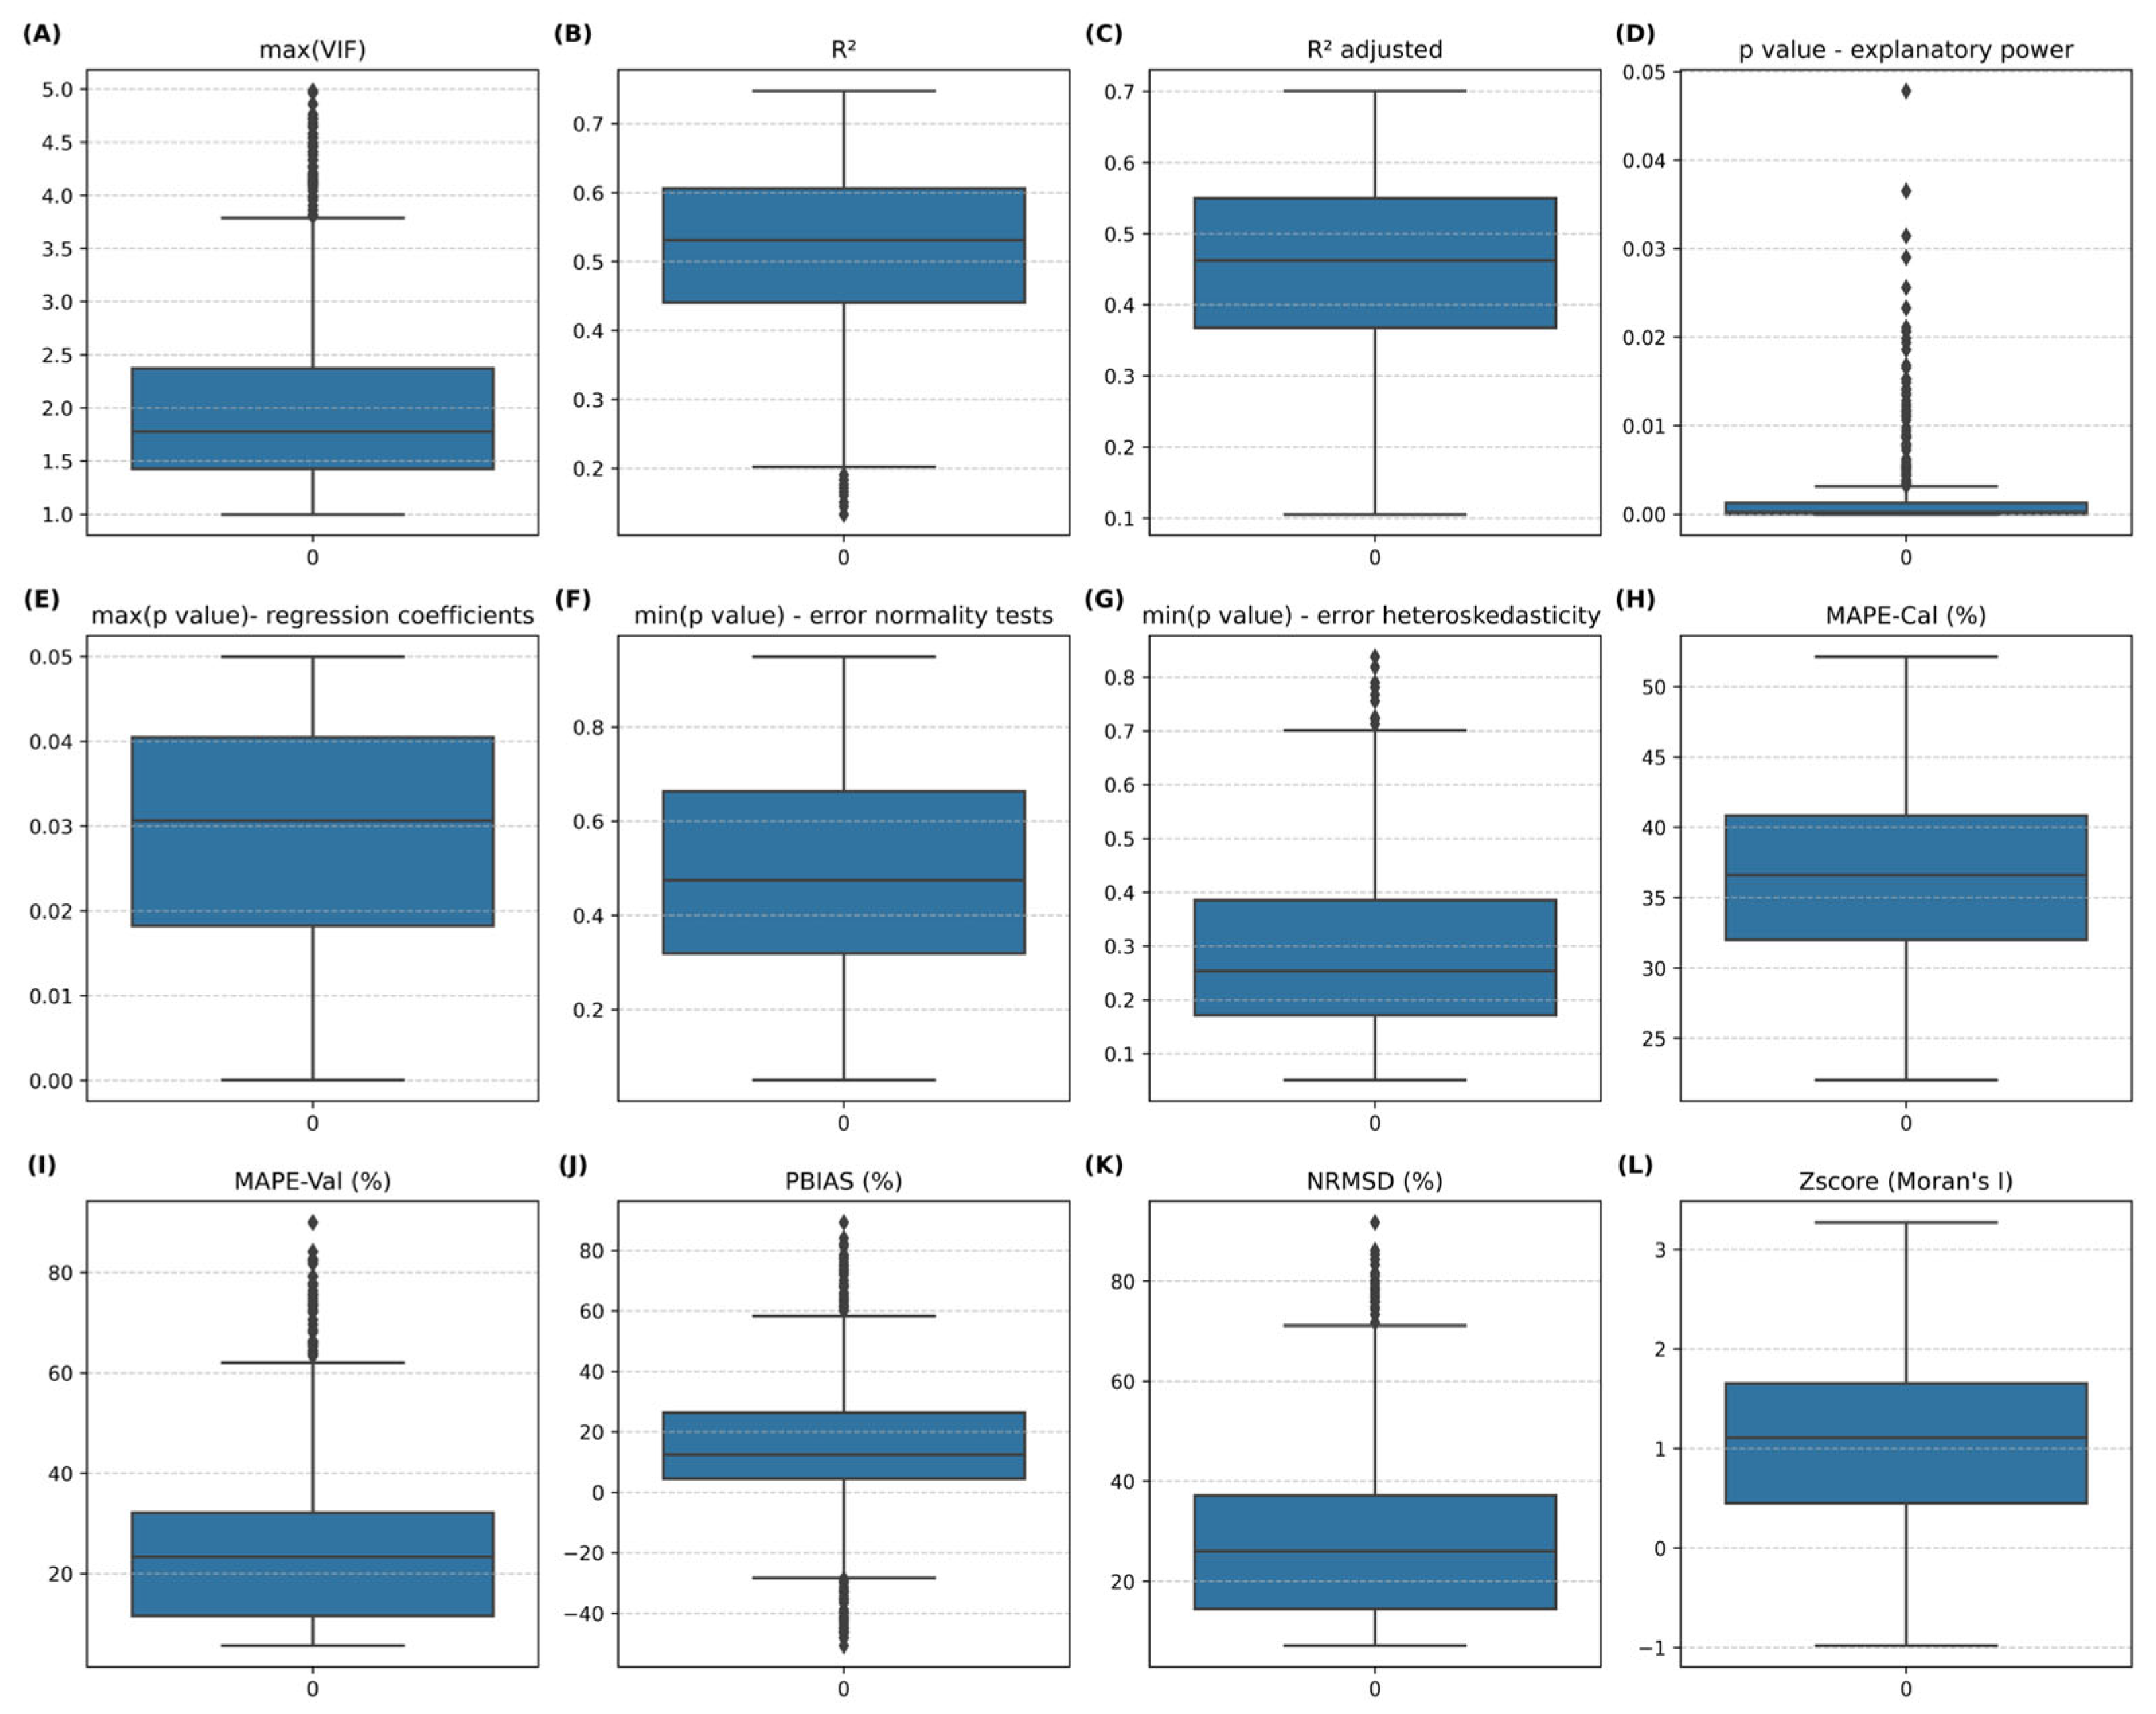
From the python script, a total of 6,220,767 linear regression models were tested to predict IBMWP from LSM in Portugal (n = 33). Among these, only 630 (0.01%) met all linear regression assumptions, and their statistical and performance metrics are shown in Figure 6. Individual metric values are provided in Supplementary Materials S3. According to the predefined thresholds of the script, the maximum VIF among regressors was below 5, while the p-values for model explanatory power and regression coefficients were all < 0.05. The minimum p-values for error normality and heteroskedasticity were above 0.05, indicating that residuals followed a normal and homoscedastic distribution. The spatial autocorrelation of residuals was also close to zero, suggesting no spatial dependence in the model errors.
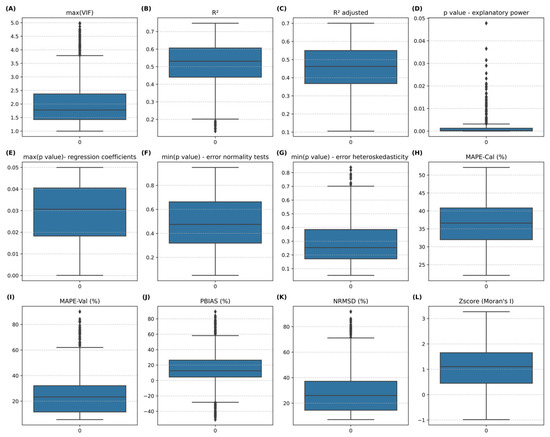
Figure 6.
Boxplot showing the distribution of statistical variables and model performance metrics across all linear regression models. Key indicators include: (A) maximum Variance Inflation Factor among regressors; (B) R2; (C) adjusted R2; (D) p-value of explanatory power; (E) maximum p-value of regression coefficients; (F) minimum p-value for error normality tests; (G) minimum p-value for heteroskedasticity tests; (H) MAPE of the calibration subset (I); MAPE of the validation subset; (J); PBIAS of the calibration subset; (K) NRMSD; (L) Z-score from Moran’s I test for spatial autocorrelation of the error term. These metrics were used to select the best-performing models and ensure compliance with linear regression assumptions.
MAPE for IBMWP predictions using Portuguese data (calibration) ranged from 22% to 52%, revealing a reasonable calibration performance (Mape-Cal, Figure 6). For Galician data (validation), MAPE, PBIAS, and NRMSD exhibited a broader range of values, yet still achieved a high-performance rating according to Table 1.
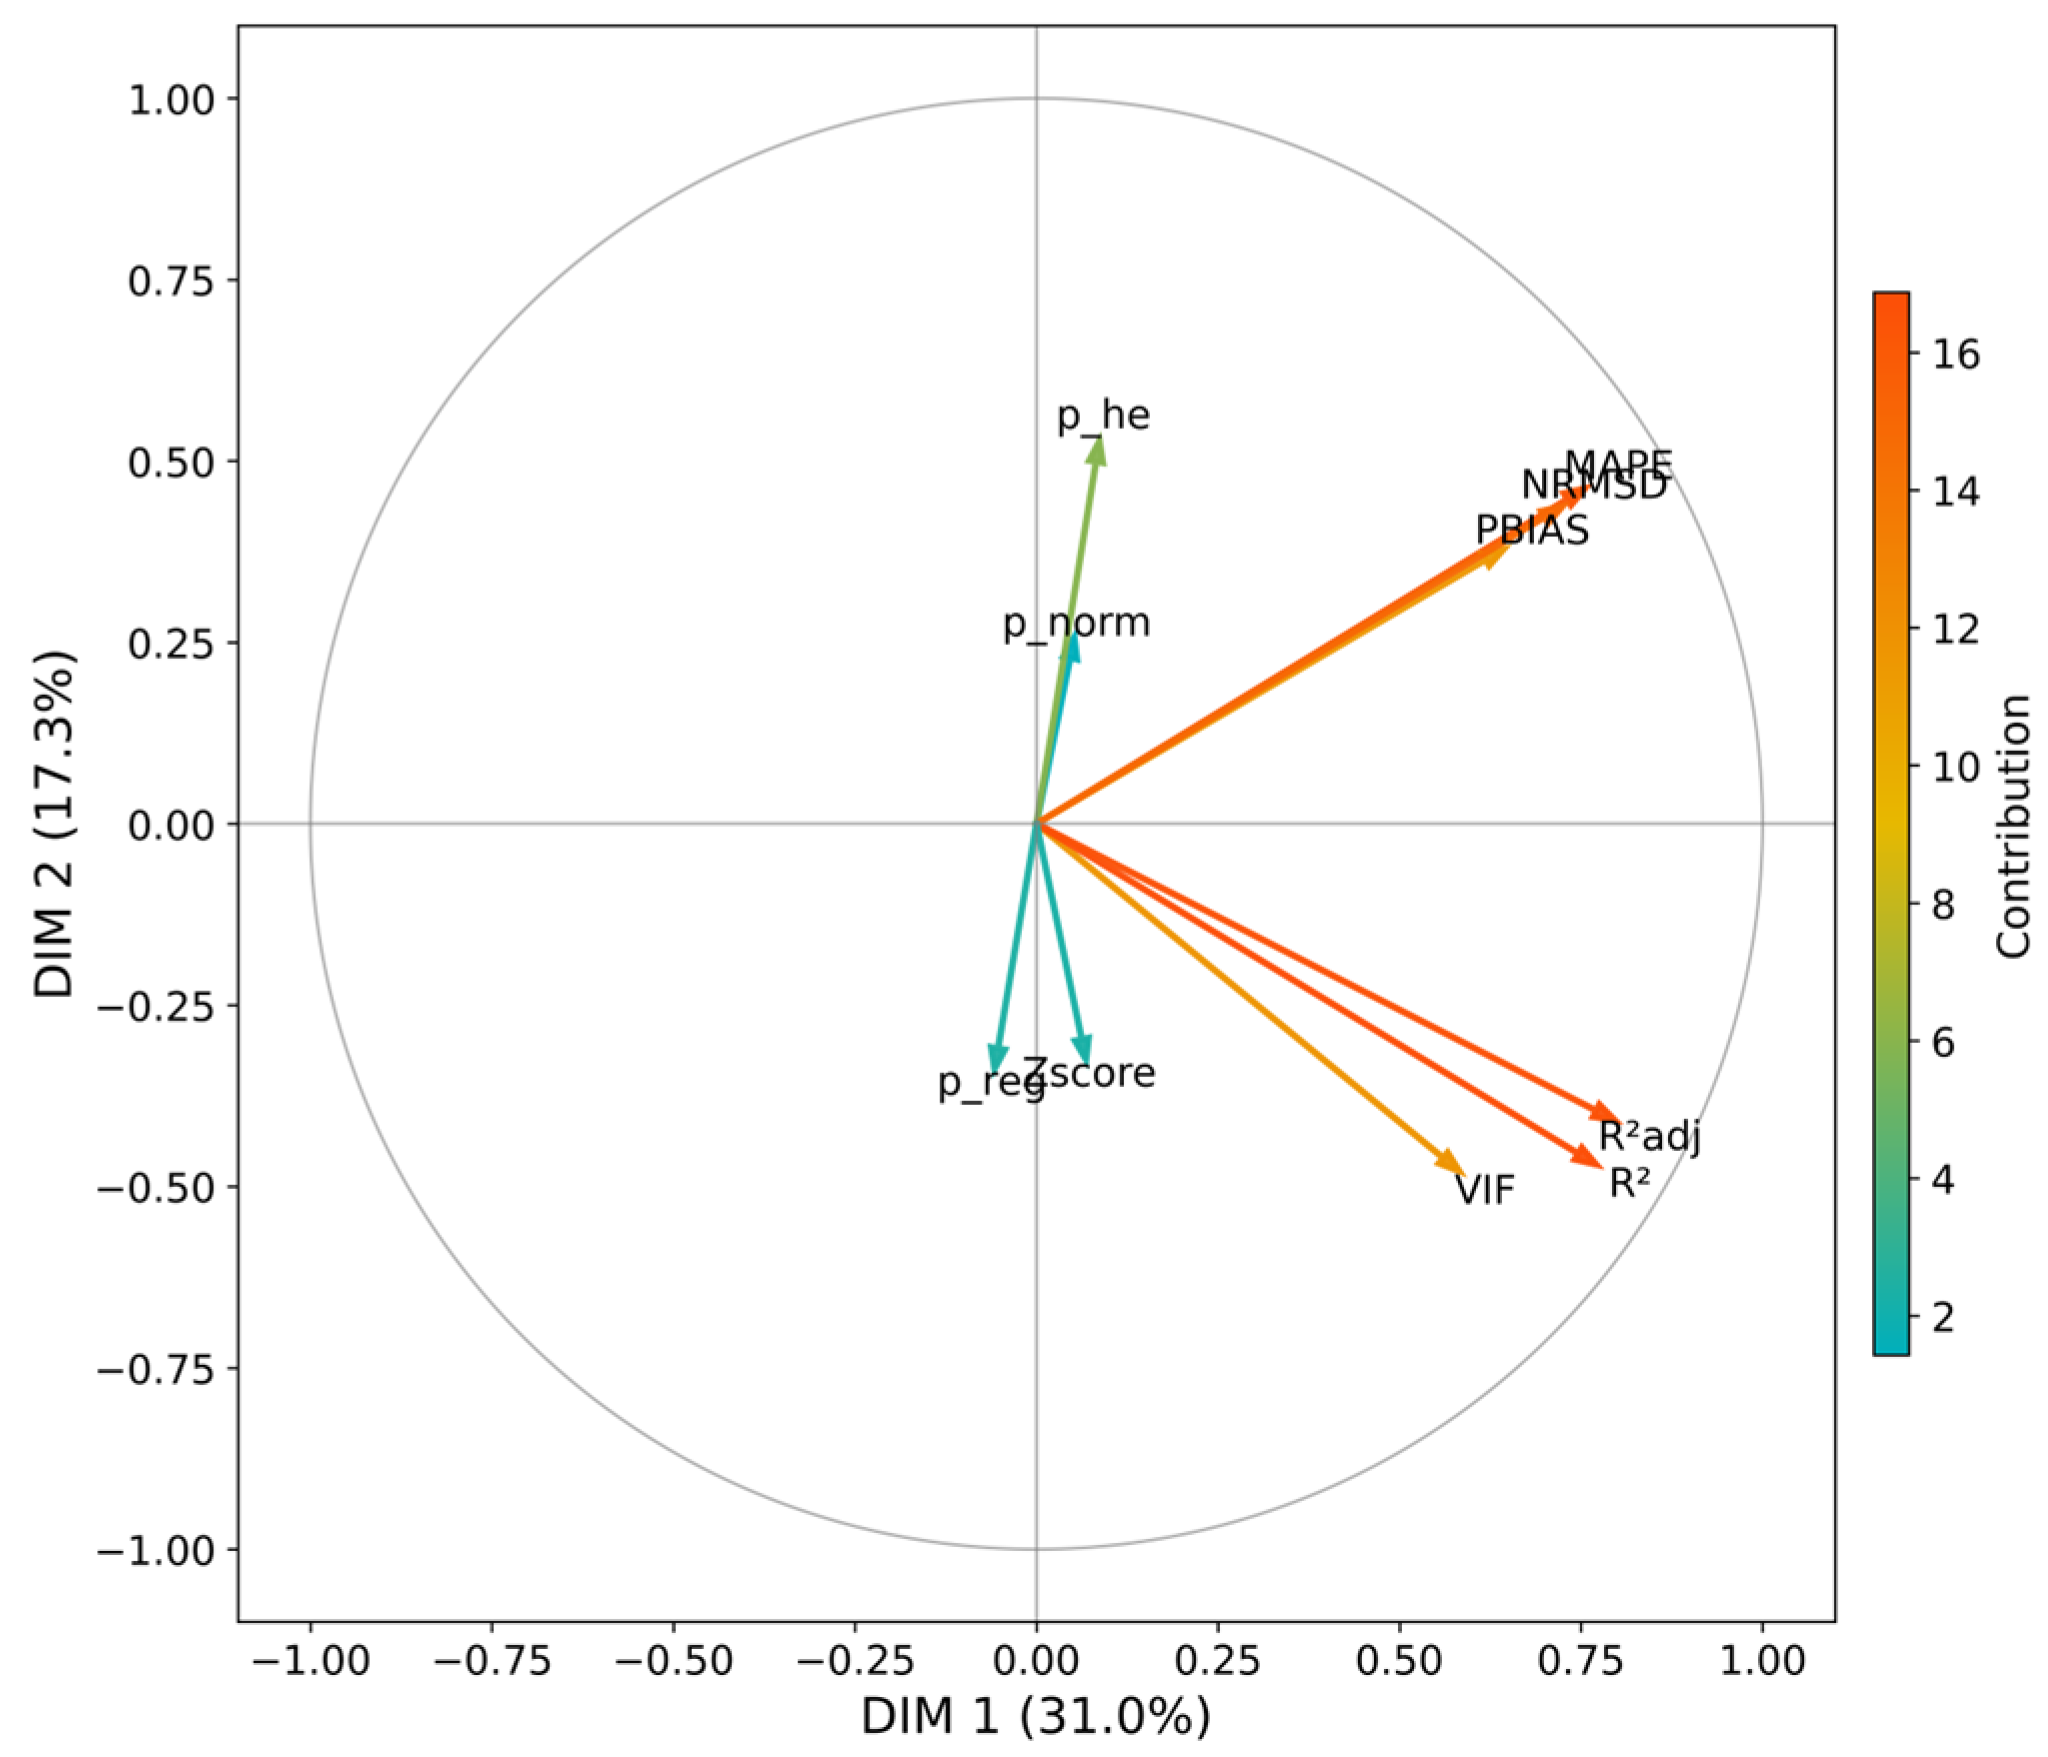
Principal Component Analysis (PCA) further clarified the relationships among statistical variables, explaining 31% and 17.3% of total variability through its first two axes (Dim1 and Dim2), respectively (Figure 7). Clusters dominated by R2, adjusted R2 (R2_adj), and VIF indicated strong positive correlations, whereas error metrics (MAPE, NRMSD, and PBIAS) formed a distinct group. Contrasting alignments (e.g., between p_he and Zscore) revealed negative correlations, while suggested vectors (e.g., between p_he and R2), suggested weak or negligible associations.
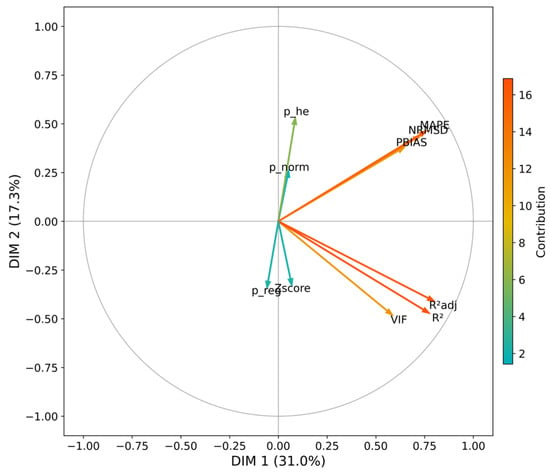
Figure 7.
PCA ordination diagram showing the relationships between statistical metrics of the linear regression models (VIF, R2, adjusted R2, p_reg, Zscore, and p_norm) and model validation performance indicators (NRMSD, MAPE, and PBIAS) in the space represented by the first two axes, which explained the percentage of the data variability. The colour gradient denotes the relative contribution of each variable, with warmer colours indicating higher contributions.
Overall, these results demonstrate that landscape metrics can effectively predict water quality, providing a robust basis for data-driven management decisions. From a practical perspective, managers can apply these models to identify areas where landscape modifications, such as increasing forest patch connectivity or managing fragmented agricultural land, are likely to yield the greatest ecological benefits. The consistent performance across calibration and validation datasets indicates that certain models may be transferable between regions, supporting coordinated cross-border water management.
Finally, the mechanisms underlying these results, whereby landscape composition and configuration regulate hydrological buffering, sediment retention, and nutrient dynamics, have been previously demonstrated in Iberian catchments [95]. These processes underpin the predictive performance of landscape-based models for water quality, reinforcing their utility for regional-scale management and spatial planning.
3.4. Best Models
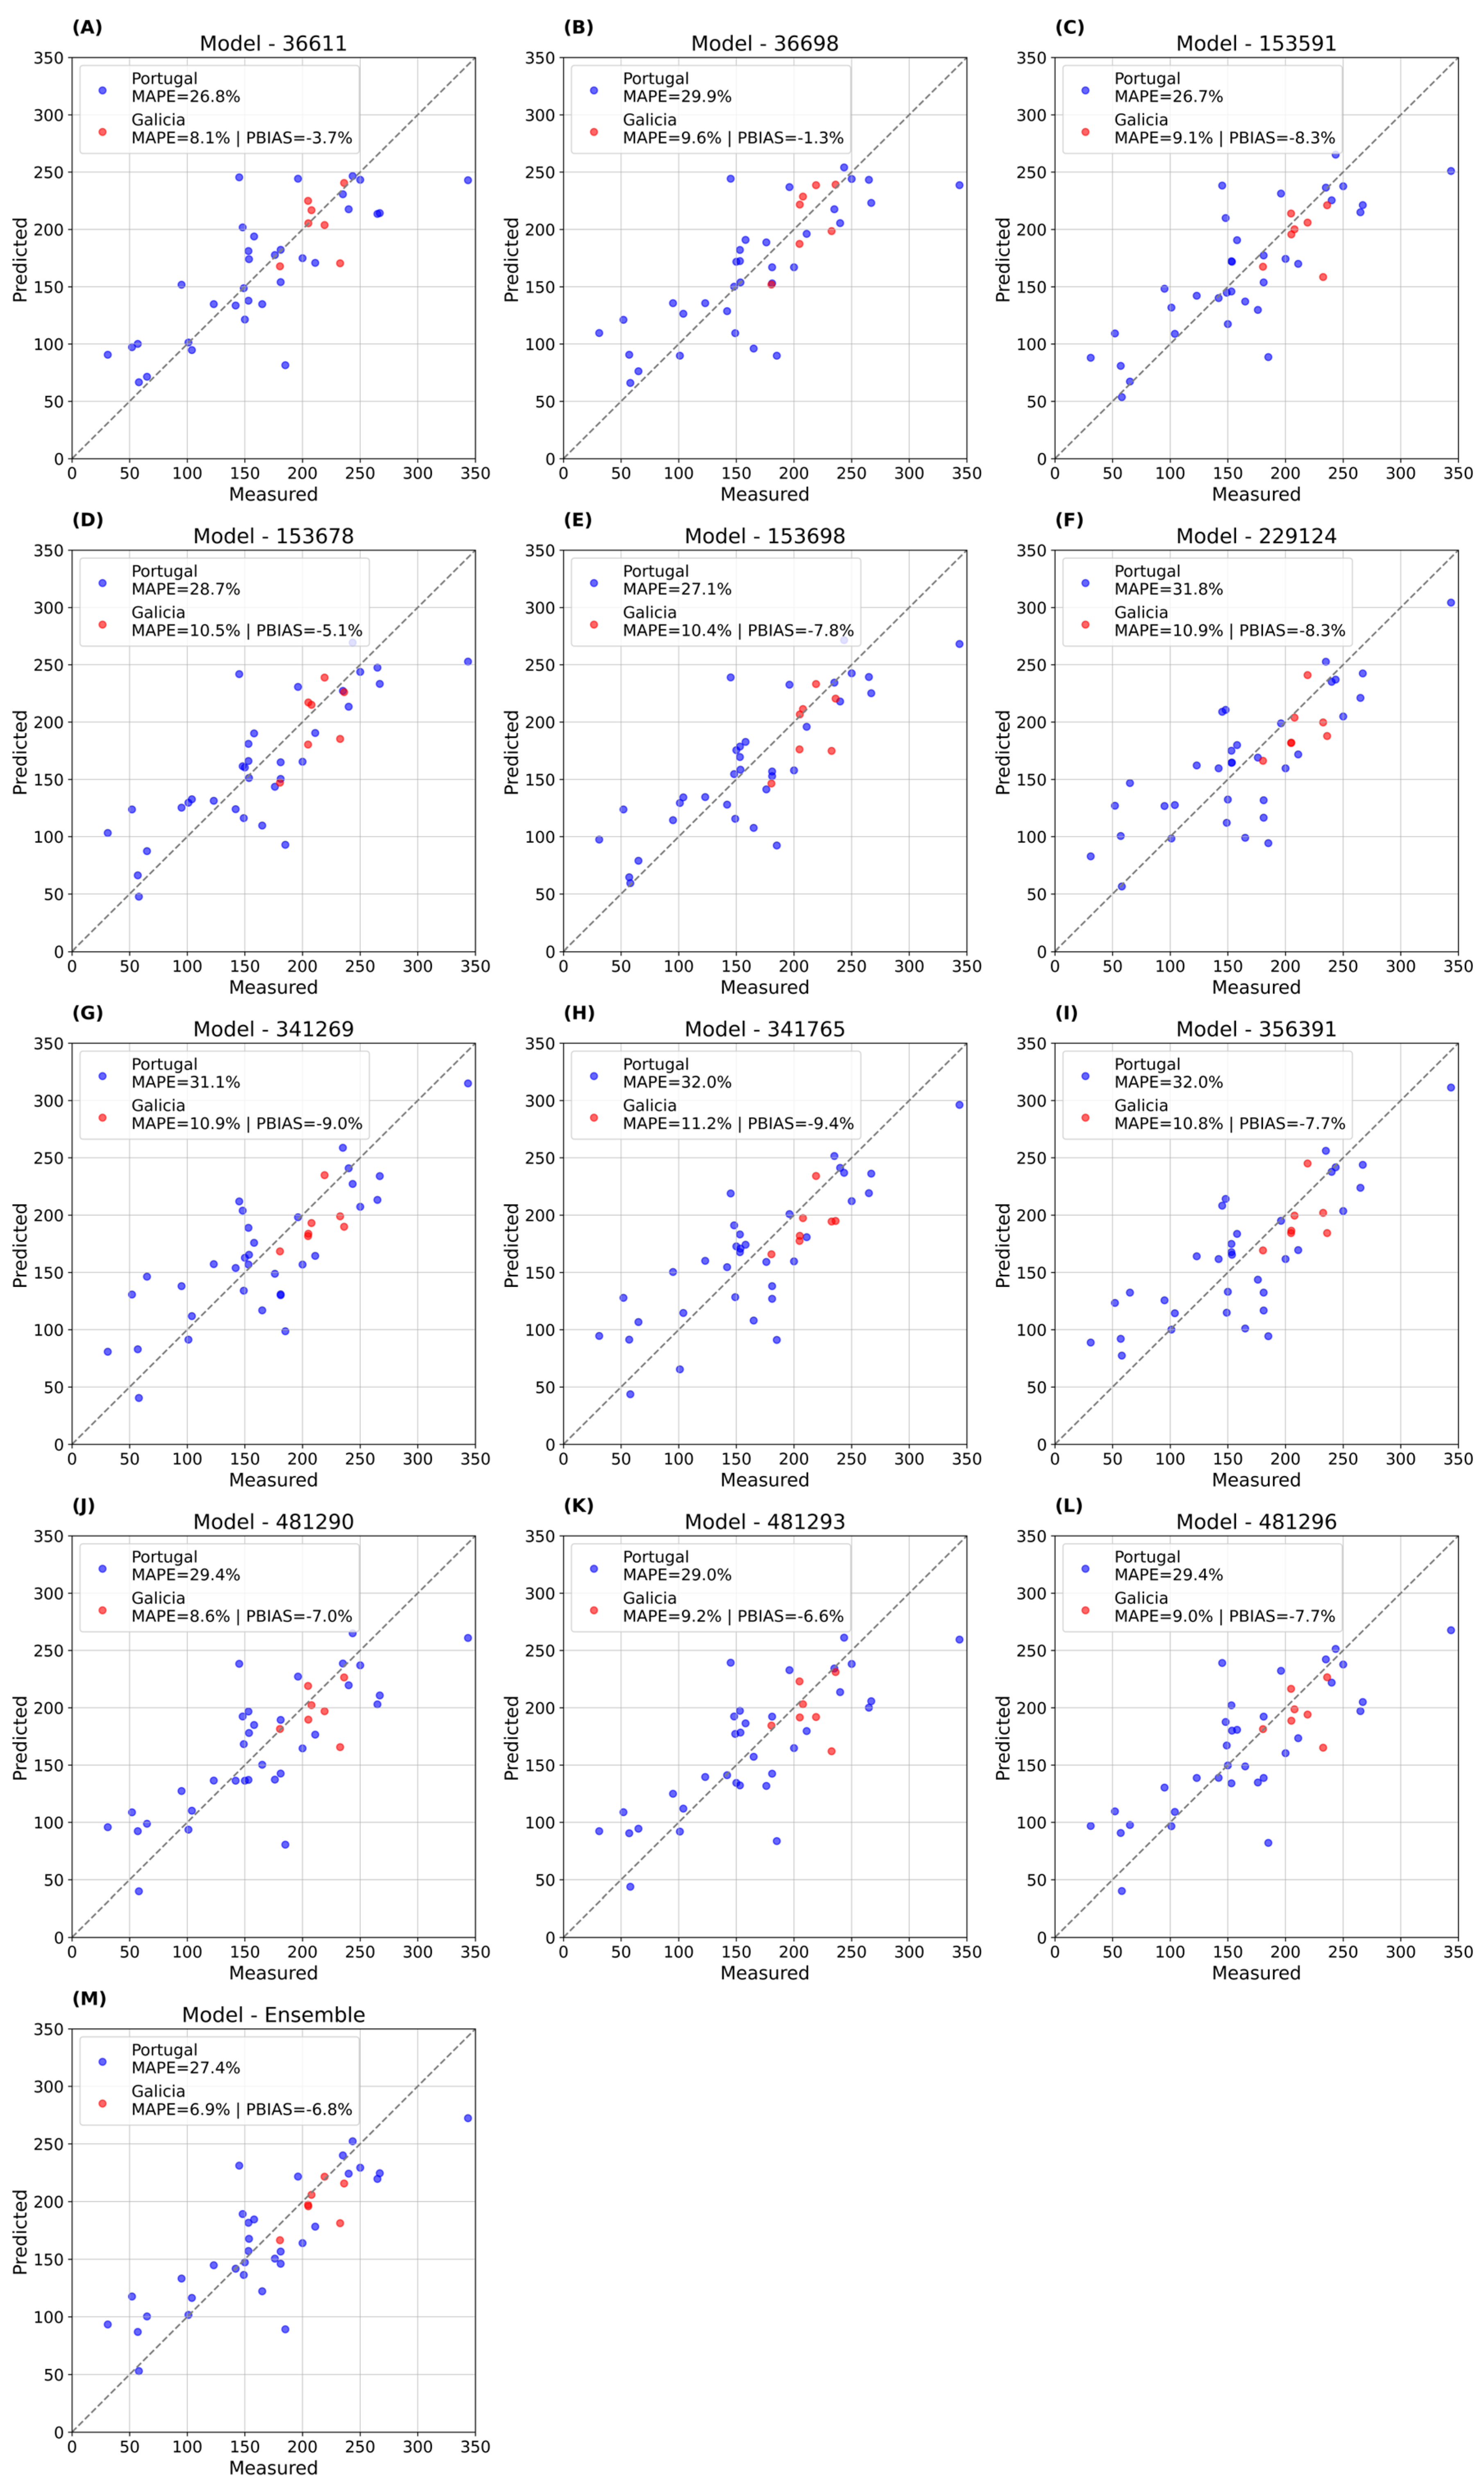
Based on the results from Figure 6, 12 models were selected as the best ones, within 630 from the python script. These were selected based on the 25th–75th %iles of the statistical/performance metrics. The respective selection criteria were: an adjusted R2 > 0.55; a MAPE-Cal <32.0%; MAPE-Val <11.6%; a |PBIAS|< 9.9 and a NRMSD (%)> 14.5%. For a min (p value)—error normality tests and min (p value)—error heteroskedasticity, besides the output models are already above 0.05 as required for linear regression analysis, was selected values > 0.31 and > 0.17, respectively. For Moran’s I Z- score for the error term, it was chosen only models between −1.65 and 1.65, since these indicate a random spatial autocorrelation. In Table 3, performance metrics are shown for each selected model, and Figure 8, the scatter distribution between observed and forecasted values of IBMWP can be seen. Still, in the Supplementary Materials S4, individual plots for all the 630 models can be found.

Table 3.
Performance of the selected models.
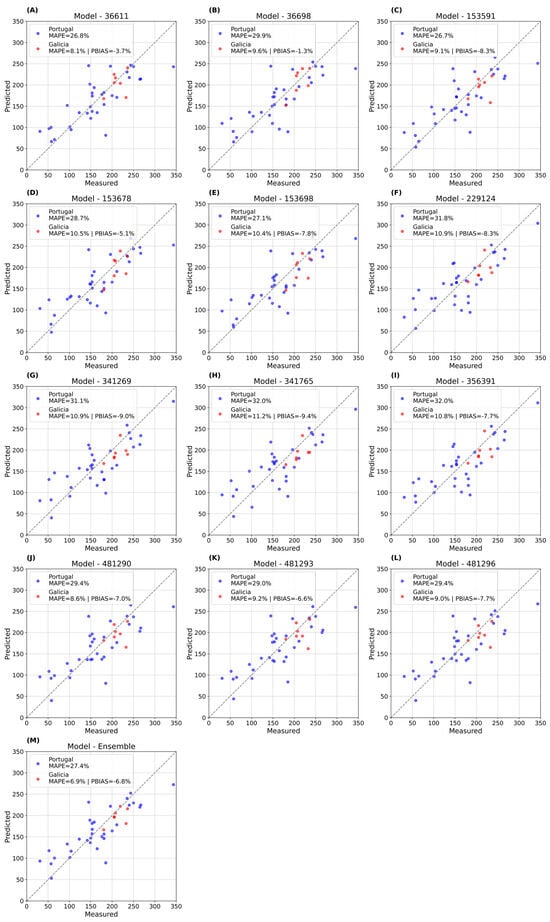
Figure 8.
Scatter plots of selected linear regression models with the best performance (A–L) and the ensemble by mean of the twelve models (M), showing the relationship between observed and predicted IBMWP values. The plots illustrate model fit, predictive accuracy, and consistency across calibration (Portugal) and validation (Galicia) datasets.
The landscape metrics retained in the best-performing models are biologically meaningful. Thus, higher forest cover and greater landscape heterogeneity are associated with improved riparian habitat quality, reduced sediment and nutrient runoff, and increased availability of allochthonous organic matter. These conditions favor sensitive macroinvertebrate taxa. Conversely, metrics reflective of agricultural dominance and fragmentation are linked to increased diffuse pollution and habitat simplification, promoting assemblages dominated by tolerant taxa [95,96]. These patterns reinforce the ecological basis of the statistical models and highlight the strong link between land management and riverine biotic integrity across the Euroregion.
The algorithm to calculate linear regression models was executed for a maximum of 6 regressors; still, the best models had from 4 to 5 regressors, resulting in a total of 12 models, Table 4. In common, these models have an average intercept of 447, which is the base IBMWP. The regressors have an equal sign across all models, which represents consistency across the selected models. The only positive regressor is ppc_(AGR), the percentage of agriculture land use patches, meaning that having fragmented agriculture areas safeguards hydric resources, as it creates a lower runoff contaminant loads comparatively linked agriculture areas in the same land use patch. However fragmented forested ppc_(FOR) decrease the capacity to retain contaminants in land to water [97]. The signs of the regressors is accordant to the correlation between the LSM and IBMWP (Supplementary Material S4), except for lpi_(FOR) which is poorly correlated with IBMP (Pearson’s r = 0.09), which has negative regression coefficients. Besides the signs are mostly consistent, it should not be blindly interpreted that a negative LSM represents a negative phenomenon on water quality, since the negative/positive sign results in a statistical approach to fit the model. Also, the LSM can better portray phenomena that decrease water quality, when used under transformations, or under other nonlinear models.

Table 4.
Regression coefficients of the selected models.
3.5. Final Considerations
Nevertheless, the primary innovation of this method lies in its ability to merge traditional ecological concepts with modern analytical technologies, driving a substantial advancement in conservation and sustainable management practices. Thus, the integration of statistical models and the use of the IBMWP index represent important advances in unifying evaluation criteria for river basin management across the Euroregion. This approach represents a milestone in the field of biomonitoring, expanding its applicability to a wide range of environmental scenarios.
The study also emphasizes the need for cooperative governance, as current disparities in land and water management practices between Spain and Portugal hinder effective and sustainable resource management. The results align with findings by White et al., 2021 [98], who underscore the importance of robust statistical frameworks for environmental modeling, and Gutiérrez-Rial et al., 2023 [99], who advocate for common indices in cross-border assessments.
The outcomes underscore the critical need to balance land use management with ecological and water quality goals. The conversion of forested land to agriculture, often driven by socio-economic needs, must account for its long-term impacts on river ecosystems, including biodiversity loss and increased flood risk. At the same time, the study highlights the importance of implementing adaptive measures to mitigate the effects of climate change and to protect the resilience of these systems. Moving forward, the integration of these models into a regional governance framework, as proposed by Fernandes et al., 2023 [59] will be essential for advancing sustainable land and water management strategies that reflect the shared environmental challenges and opportunities of the Galicia-North Portugal Euroregion. Despite these challenges, the study provides valuable insights into the relationships between model evaluation metrics, statistical indicators, and spatial characteristics, offering a solid foundation for water quality prediction in varying landscapes.
Overall, this study provides actionable insights for policy makers and water managers. By linking landscape configuration with macroinvertebrate-based water quality indices, we offer evidence-based guidance for prioritizing interventions, such as riparian reforestation, connectivity restoration, and adaptive land-use policies. Our findings align with previous evidence that landscape configuration (forest cover, patch connectivity, fragmentation) exerts a primary control on stream ecological integrity and can therefore guide targeted restoration and land-use planning measures [43,100,101]. Integrating these strategies within a coordinated Euroregion governance framework can enhance resilience to climate change, protect biodiversity, and maintain water quality across shared river basins.
4. Conclusions
This study demonstrates the importance of integrating landscape metrics and biological indicators to assess water quality in the Galicia–North Portugal Euroregion. Our results reveal that land management practices directly influence riverine ecological health: GL sites, with higher macroinvertebrate abundance but lower diversity, reflect the dominance of agricultural landscapes, whereas PT sites, with greater diversity and family richness, illustrate the benefits of heterogeneous land-use mosaics for biodiversity and water quality regulation.
Linear regression models and landscape metric analyses confirm that forest loss and agricultural expansion reduce ecological richness, while diverse and connected landscapes enhance ecosystem resilience. Despite regional differences, consistently high IBMWP scores indicate generally robust ecological conditions across the Euroregion.
These findings have clear practical implications for water and land management. They highlight the need for integrated, adaptive governance strategies that maintain habitat heterogeneity, support biodiversity, and mitigate the impacts of land-use change. Monitoring and management efforts can focus on key sites to implement targeted restoration actions, such as riparian buffer enhancement or reforestation, thereby safeguarding water quality and ecological resilience in transboundary river systems.
Supplementary Materials
The following supporting information can be downloaded at: https://www.mdpi.com/article/10.3390/w17213088/s1, S1: Script and input files; S2: Data analysis; S3: Scatter plot of all models; S4: Correlation matrix.
Author Contributions
Conceptualization: G.R.; X.Á.; L.F.F.; S.V.; A.F. Methodology: X.Á.; F.P.; A.F. Software: G.R.; A.F. Validation: C.A.-A.; X.Á.; V.P.; C.S.; M.L.; S.V. Formal analysis: G.R.; C.A.-A.; X.Á.; V.P.; C.S.; M.L.; S.V.; A.F. Investigation: C.A.-A.; X.Á.; V.P.; C.S.; M.L. Resources: X.Á.; S.V. Data Curation: V.P.; C.S.; M.L.; S.V.; A.F. Writing—Original Draft: G.R.; C.A.-A.; X.Á.; L.F.F.; D.T.; V.P.; C.S.; M.L.; F.P.; G.G.; S.V.; A.F. Writing—Review and Editing: G.R.; C.A.-A.; X.Á.; L.F.F.; D.T.; V.P.; C.S.; M.L.; F.P.; G.G.; S.V.; A.F. Visualization: G.R.; S.V.; A.F. Supervision: S.V.; A.F. Project administration: X.Á.; L.F.F.; F.P.; S.V. Funding acquisition: X.Á.; S.V. All authors have read and agreed to the published version of the manuscript.
Funding
For the authors integrated in the CITAB research Center, this work is supported by National Funds by FCT—Portuguese Foundation for Science and Technology, under the projects UID/04033/2025: Centre for the Research and Technology of Agro-Environmental and Biological Sciences and LA/P/0126/2020 (https://doi.org/10.54499/LA/P/0126/2020). For the author integrated in the CQVR, the research was additionally supported by National Funds of FCT—Portuguese Foundation for Science and Technology, under the projects UIDB/00616/2025 (https://doi.org/10.54499/UIDB/00616/2020) and UIDP/00616/2020 (https://doi.org/10.54499/UIDP/00616/2020). This work was supported by the CHIST-ERA grant CHIST-ERA-23-MultiGIS-06, project PCI2025-163208 funded by MICIU/AEI/10.13039/501100011033 and co-financed by the European Union (C. Acuña-Alonso and X. Álvarez).
Data Availability Statement
The CORINE Land Cover data used in this study are publicly available at https://land.copernicus.eu/pan-european/corine-land-cover (accessed on 10 October 2022). The IBMWP scores derived from macroinvertebrate sampling are provided in the Supplementary Materials. The full macroinvertebrate dataset collected from the river by the authors is available from the corresponding author upon request.
Acknowledgments
As regards the authors Fernando Pacheco, Luís Filipe Fernandes and Xana Álvarez, the current study was developed under the Research Agreement established with the University of Vigo in January 2023 for “Cooperation in water resources management in river basins”. The authors gratefully acknowledge the financial support from the Coordination for the Improvement of Higher Education Personnel–Brazil (CAPES).
Conflicts of Interest
The authors declare no conflicts of interest.
References
- Berking, J. Water Management in Ancient Civilizations; Edition Topoi: Berlin, Germany, 2018; ISBN 9783981836967. [Google Scholar]
- Nilson Bezerra Campos, J. A Gestão Integrada Dos Recursos Hídricos: Uma Perspectiva Histórica. Rev. Eletrônica Gestão E Tecnol. Ambient. 2013, 1, 111. [Google Scholar] [CrossRef][Green Version]
- Lewis, E.W.; Staddon, C.; Sirunda, J. Urban Water Management Challenges and Achievements in Windhoek, Namibia. Water Pract. Technol. 2019, 14, 703–713. [Google Scholar] [CrossRef]
- Widianingsih, I.; Riswanda, R.; Paskarina, C. Governing Water, Engaging Community: Indonesian Water Security Roadmap. J. Gov. 2020, 5, 202–215. [Google Scholar] [CrossRef]
- Lv, H.; Yang, L.; Zhou, J.; Zhang, X.; Wu, W.; Li, Y.; Jiang, D. Water Resource Synergy Management in Response to Climate Change in China: From the Perspective of Urban Metabolism. Resour. Conserv. Recycl. 2020, 163, 105095. [Google Scholar] [CrossRef]
- Terêncio, D.P.S.; Fernandes, L.F.S.; Cortes, R.M.V.; Moura, J.P.; Pacheco, F.A.L. Flood Risk Attenuation in Critical Zones of Continental Portugal Using Sustainable Detention Basins. Sci. Total Environ. 2020, 721, 137727. [Google Scholar] [CrossRef]
- Rehana, S.; Sireesha Naidu, G. Development of Hydro-Meteorological Drought Index under Climate Change—Semi-Arid River Basin of Peninsular India. J. Hydrol. 2021, 594, 125973. [Google Scholar] [CrossRef]
- Li, P.; Wu, J. Drinking Water Quality and Public Health. Expo. Health 2019, 11, 73–79. [Google Scholar] [CrossRef]
- Santos, R.M.B.; Monteiro, S.M.; Cortes, R.M.V.; Pacheco, F.A.L.; Fernandes, L.F.S. Seasonal Effect of Land Use Management on Gill Histopathology of Barbel and Douro Nase in a Portuguese Watershed. Sci. Total Environ. 2021, 764, 142869. [Google Scholar] [CrossRef]
- Meshesha, T.W.; Wang, J.; Melaku, N.D. Modelling Spatiotemporal Patterns of Water Quality and Its Impacts on Aquatic Ecosystem in the Cold Climate Region of Alberta, Canada. J. Hydrol. 2020, 587, 124952. [Google Scholar] [CrossRef]
- Directive 2000/60/EC of the European Parliament and of the Council of 23 October 2000 Establishing a Framework for Community Action in the Field of Water Policy. 2000. Available online: https://eur-lex.europa.eu/eli/dir/2000/60/oj/eng (accessed on 1 October 2025).
- Skoulikaris, C.; Zafirakou, A. River Basin Management Plans as a Tool for Sustainable Transboundary River Basins’ Management. Environ. Sci. Pollut. Res. 2019, 26, 14835–14848. [Google Scholar] [CrossRef] [PubMed]
- Carvalho, L.; Mackay, E.B.; Cardoso, A.C.; Baattrup-Pedersen, A.; Birk, S.; Blackstock, K.L.; Borics, G.; Borja, A.; Feld, C.K.; Ferreira, M.T.; et al. Protecting and Restoring Europe’s Waters: An Analysis of the Future Development Needs of the Water Framework Directive. Sci. Total Environ. 2019, 658, 1228–1238. [Google Scholar] [CrossRef] [PubMed]
- Mostert, E. The European Water Framework Directive and Water Management Research. Phys. Chem. Earth 2003, 28, 523–527. [Google Scholar] [CrossRef]
- de Mello, K.; da Costa, D.R.; Valente, R.A.; Vettorazzi, C.A. Multicriteria Evaluation for Protected Area Definition Aiming at Water Quality Improvement. Floresta e Ambiente 2018, 25, e20160134. [Google Scholar] [CrossRef]
- Martins, L.; Pereira, A.; Oliveira, A.; Fernandes, A.; Sanches Fernandes, L.F.; Pacheco, F.A.L. An Assessment of Groundwater Contamination Risk with Radon Based on Clustering and Structural Models. Water 2019, 11, 1107. [Google Scholar] [CrossRef]
- Bhurtun, P.; Lesven, L.; Ruckebusch, C.; Halkett, C.; Cornard, J.P.; Billon, G. Understanding the Impact of the Changes in Weather Conditions on Surface Water Quality. Sci. Total Environ. 2019, 652, 289–299. [Google Scholar] [CrossRef]
- Khatri, N.; Tyagi, S. Influences of Natural and Anthropogenic Factors on Surface and Groundwater Quality in Rural and Urban Areas. Front. Life Sci. 2015, 8, 23–39. [Google Scholar] [CrossRef]
- Voza, D.; Vukovic, M.; Takic, L.; Nikolic, D.; Mladenovic-Ranisavljevic, I. Application of Multivariate Statistical Techniques in the Water Quality Assessment of Danube River, Serbia. Arch. Environ. Prot. 2015, 41, 96–103. [Google Scholar] [CrossRef]
- Reid, A.J.; Carlson, A.K.; Creed, I.F.; Eliason, E.J.; Gell, P.A.; Johnson, P.T.J.; Kidd, K.A.; MacCormack, T.J.; Olden, J.D.; Ormerod, S.J. Emerging Threats and Persistent Conservation Challenges for Freshwater Biodiversity. Biol. Rev. 2019, 94, 849–873. [Google Scholar] [CrossRef]
- Ekholm, P.; Lehtoranta, J.; Taka, M.; Sallantaus, T.; Riihimäki, J. Diffuse Sources Dominate the Sulfate Load into Finnish Surface Waters. Sci. Total Environ. 2020, 748, 141297. [Google Scholar] [CrossRef]
- Guadie, A.; Yesigat, A.; Gatew, S.; Worku, A.; Liu, W.; Minale, M.; Wang, A. Effluent Quality and Reuse Potential of Urban Wastewater Treated with Aerobic-Anoxic System: A Practical Illustration for Environmental Contamination and Human Health Risk Assessment. J. Water Process Eng. 2021, 40, 101891. [Google Scholar] [CrossRef]
- Muhammad, N.; Nafees, M.; Ge, L.; Khan, M.H.; Bilal, M.; Chan, W.P.; Lisak, G. Assessment of Industrial Wastewater for Potentially Toxic Elements, Human Health (Dermal) Risks, and Pollution Sources: A Case Study of Gadoon Amazai Industrial Estate, Swabi, Pakistan. J. Hazard. Mater. 2021, 419, 126450. [Google Scholar] [CrossRef]
- Pérez Andrés, N.; Martínez Santa-María, C.; Fernández Yuste, J. Are Wasterwater Treatment Plants Modifying Our Rivers? Cuad. De La Soc. Española De Cienc. For. 2019, 45, 157–169. [Google Scholar] [CrossRef]
- Ferreira, A.R.L.; Sanches Fernandes, L.F.; Cortes, R.M.V.; Pacheco, F.A.L. Assessing Anthropogenic Impacts on Riverine Ecosystems Using Nested Partial Least Squares Regression. Sci. Total Environ. 2017, 583, 466–477. [Google Scholar] [CrossRef]
- Fonseca, A.R.; Sanches Fernandes, L.F.; Fontainhas-Fernandes, A.; Monteiro, S.M.; Pacheco, F.A.L. The Impact of Freshwater Metal Concentrations on the Severity of Histopathological Changes in Fish Gills: A Statistical Perspective. Sci. Total Environ. 2017, 599–600, 217–226. [Google Scholar] [CrossRef]
- Fonseca, A.R.; Sanches Fernandes, L.F.; Fontainhas-Fernandes, A.; Monteiro, S.M.; Pacheco, F.A.L. From Catchment to Fish: Impact of Anthropogenic Pressures on Gill Histopathology. Sci. Total Environ. 2016, 550, 972–986. [Google Scholar] [CrossRef]
- Mohamadi, M.A.; Kavian, A. Effects of Rainfall Patterns on Runoff and Soil Erosion in Field Plots. Int. Soil Water Conserv. Res. 2015, 3, 273–281. [Google Scholar] [CrossRef]
- Jayasumana, C.; Fonseka, S.; Fernando, A.; Jayalth, K.; Amarasinghe, M.; Paranagma, P. Presence of Arsenic in Agrochemicals and Their Association with the Agricultural Chronic Kidney Disease in Sri Lanka. J. Toxicol. Health 2014, 104, 352–361. [Google Scholar]
- Zörb, C.; Senbayram, M.; Peiter, E. Potassium in Agriculture–Status and Perspectives. J. Plant Physiol. 2014, 171, 656–669. [Google Scholar] [CrossRef]
- Cameira, M.d.R.; Mota, M. Nitrogen Related Diffuse Pollution from Horticulture Production—Mitigation Practices and Assessment Strategies. Horticulturae 2017, 3, 25. [Google Scholar] [CrossRef]
- Zhang, Y.; Long, H.; Li, Y.; Tu, S.; Jiang, T. Non-Point Source Pollution in Response to Rural Transformation Development: A Comprehensive Analysis of China’s Traditional Farming Area. J. Rural Stud. 2020, 83, 165–176. [Google Scholar] [CrossRef]
- Li, Y.; Li, J.; Are, K.S.; Huang, Z.; Yu, H.; Zhang, Q. Livestock Grazing Significantly Accelerates Soil Erosion More than Climate Change in Qinghai-Tibet Plateau: Evidenced from 137Cs and 210Pbex Measurements. Agric. Ecosyst. Environ. 2019, 285, 106643. [Google Scholar] [CrossRef]
- Clément, F.; Ruiz, J.; Rodríguez, M.A.; Blais, D.; Campeau, S. Landscape Diversity and Forest Edge Density Regulate Stream Water Quality in Agricultural Catchments. Ecol. Indic. 2017, 72, 627–639. [Google Scholar] [CrossRef]
- Warrington, B.M.; Aust, W.M.; Barrett, S.M.; Ford, W.M.; Dolloff, C.A.; Schilling, E.B.; Wigley, T.B.; Bolding, M.C. Forestry Best Management Practices Relationships with Aquatic and Riparian Fauna: A Review. Forests 2017, 8, 331. [Google Scholar] [CrossRef]
- Hilary, B.; Chris, B.; North, B.E.; Angelica Maria, A.Z.; Sandra Lucia, A.Z.; Carlos Alberto, Q.G.; Beatriz, L.G.; Rachael, E.; Andrew, W. Riparian Buffer Length Is More Influential than Width on River Water Quality: A Case Study in Southern Costa Rica. J. Environ. Manag. 2021, 286, 112132. [Google Scholar] [CrossRef] [PubMed]
- Santos, R.M.B.; Sanches Fernandes, L.F.; Pereira, M.G.; Cortes, R.M.V.; Pacheco, F.A.L. Water Resources Planning for a River Basin with Recurrent Wildfires. Sci. Total Environ. 2015, 526, 1–13. [Google Scholar] [CrossRef]
- Uuemaa, E.; Roosaare, J.; Mander, Ü. Landscape Metrics as Indicators of River Water Quality at Catchment Scale. Hydrol. Res. 2007, 38, 125–138. [Google Scholar] [CrossRef]
- Zhao, J.; Yang, K.; Tai, J.; Shan, F. Review of the Relationship between Regional Landscape Pattern and Surface Water Quality. Shengtai Xuebao/Acta Ecol. Sin. 2011, 31, 3180–3189. [Google Scholar]
- McGarigal, K. FRAGSTATS: Spatial Pattern Analysis Program for Quantifying Landscape Structure; General Technical Report PNW-GTR-351; U.S. Department of Agriculture, Forest Service, Pacific Northwest Research Station: Portland, OR, USA, 1995. Available online: https://www.fs.usda.gov/pnw/pubs/pnw_gtr351.pdf (accessed on 24 August 2025).
- Dwivedi, S.; Shikha, D. Water Pollution: Causes, Effects and Control; New Age International: New Delhi, India, 2016; Volume 16. [Google Scholar]
- Flotemersch, J.E.; Leibowitz, S.G.; Hill, R.A.; Stoddard, J.L.; Thoms, M.C.; Tharme, R.E. A Watershed Integrity Definition and Assessment Approach to Support Strategic Management of Watersheds. River Res. Appl. 2016, 32, 1654–1671. [Google Scholar] [CrossRef]
- Acuña-Alonso, C.; Fernandes, A.C.P.; Álvarez, X.; Valero, E.; Pacheco, F.A.L.; Varandas, S.D.G.P.; Terêncio, D.P.S.; Fernandes, L.F.S. Water Security and Watershed Management Assessed through the Modelling of Hydrology and Ecological Integrity: A Study in the Galicia-Costa (NW Spain). Sci. Total Environ. 2021, 759, 143905. [Google Scholar] [CrossRef]
- Fang, S.; Deitch, M.J.; Gebremicael, T.G.; Angelini, C.; Ortals, C.J. Identifying Critical Source Areas of Non-Point Source Pollution to Enhance Water Quality: Integrated SWAT Modeling and Multi-Variable Statistical Analysis to Reveal Key Variables and Thresholds. Water Res. 2024, 253, 121286. [Google Scholar] [CrossRef]
- Rohith, A.N.; Karki, R.; Veith, T.L.; Preisendanz, H.E.; Duncan, J.M.; Kleinman, P.J.A.; Cibin, R. Prioritizing Conservation Practice Locations for Effective Water Quality Improvement Using the Agricultural Conservation Planning Framework (ACPF) and the Soil and Water Assessment Tool (SWAT). J. Environ. Manag. 2024, 349, 119514. [Google Scholar] [CrossRef]
- Terry, J.; Lindenschmidt, K.-E. Water Quality and Flow Management Scenarios in the Qu’appelle River–Reservoir System Using Loosely Coupled WASP and CE-QUAL-W2 Models. Water 2023, 15, 2005. [Google Scholar] [CrossRef]
- K. C., D.V.; Abdul Rahiman, A.W.; E., A.; J., A.K.; N., P. Water Quality Simulation Using the WASP Model for Eutrophication Control in a South Indian Reservoir. Water Pr. Technol. 2023, 18, 2740–2758. [Google Scholar] [CrossRef]
- Mummidivarapu, S.K.; Rehana, S.; Rao, Y.R.S. Mapping and Assessment of River Water Quality under Varying Hydro-Climatic and Pollution Scenarios by Integrating QUAL2K, GEFC, and GIS. Environ. Res. 2023, 239, 117250. [Google Scholar] [CrossRef] [PubMed]
- Zehra, R.; Singh, S.P.; Verma, J.; Kulshreshtha, A. Spatio-Temporal Investigation of Physico-Chemical Water Quality Parameters Based on Comparative Assessment of QUAL 2Kw and WASP Model for the Upper Reaches of Yamuna River Stretching from Paonta Sahib, Sirmaur District to Cullackpur, North Delhi Districts of North India. Environ. Monit. Assess. 2023, 195, 480. [Google Scholar]
- Dai, Z.; Yu, M.; Chen, H.; Zhao, H.; Huang, Y.; Su, W.; Xia, F.; Chang, S.X.; Brookes, P.C.; Dahlgren, R.A.; et al. Elevated Temperature Shifts Soil N Cycling from Microbial Immobilization to Enhanced Mineralization, Nitrification and Denitrification across Global Terrestrial Ecosystems. Glob. Change Biol. 2020, 26, 5267–5276. [Google Scholar] [CrossRef]
- Villar-Rúa, S.; Acuña-Alonso, C.; Álvarez, X. Estimation of the Ecological Integrity of the Guadiana River Using Partial Least Squares Path Modelling and Simulation Scenarios. Sci. Total Environ. 2024, 954, 176305. [Google Scholar] [CrossRef]
- Fernandes, A.C.P.; Sanches Fernandes, L.F.; Moura, J.P.; Cortes, R.M.V.; Pacheco, F.A.L. A Structural Equation Model to Predict Macroinvertebrate-Based Ecological Status in Catchments Influenced by Anthropogenic Pressures. Sci. Total Environ. 2019, 681, 242–257. [Google Scholar] [CrossRef]
- Chatrabhuj; Meshram, K.; Mishra, U.; Omar, P.J. Integration of Remote Sensing Data and GIS Technologies in River Management System. Discov. Geosci. 2024, 2, 67. [Google Scholar] [CrossRef]
- Shravan Kumar, S.M.; Pandey, M.; Shukla, A.K. Spatio-Temporal Analysis of Riverbank Changes Using Remote Sensing and Geographic Information System. Phys. Chem. Earth Parts A/B/C 2024, 136, 103692. [Google Scholar] [CrossRef]
- Ibrahim, H.; Yaseen, Z.M.; Scholz, M.; Ali, M.; Gad, M.; Elsayed, S.; Khadr, M.; Hussein, H.; Ibrahim, H.H.; Eid, M.H.; et al. Evaluation and Prediction of Groundwater Quality for Irrigation Using an Integrated Water Quality Indices, Machine Learning Models and GIS Approaches: A Representative Case Study. Water 2023, 15, 694. [Google Scholar] [CrossRef]
- Jayaraman, P.; Nagarajan, K.K.; Partheeban, P.; Krishnamurthy, V. Critical Review on Water Quality Analysis Using IoT and Machine Learning Models. Int. J. Inf. Manag. Data Insights 2024, 4, 100210. [Google Scholar] [CrossRef]
- Alzubaidi, L.; Bai, J.; Al-Sabaawi, A.; Santamaría, J.; Albahri, A.S.; Al-dabbagh, B.S.N.; Fadhel, M.A.; Manoufali, M.; Zhang, J.; Al-Timemy, A.H.; et al. A Survey on Deep Learning Tools Dealing with Data Scarcity: Definitions, Challenges, Solutions, Tips, and Applications. J. Big Data 2023, 10, 46. [Google Scholar] [CrossRef]
- Taye, M.M. Understanding of Machine Learning with Deep Learning: Architectures, Workflow, Applications and Future Directions. Computers 2023, 12, 91. [Google Scholar] [CrossRef]
- Fernandes; Fonseca, A.; Pacheco, F.; Sanches Fernandes, L. Water Quality Predictions through Linear Regression - A Brute Force Algorithm Approach. MethodsX 2023, 10, 102153. [Google Scholar] [CrossRef]
- Rashid, J.; Kanwal, S.; Kim, J.; Nisar, M.W.; Naseem, U.; Hussain, A. Heart Disease Diagnosis Using the Brute Force Algorithm and Machine Learning Techniques. Comput. Mater. Contin. 2022, 72, 3195–3211. [Google Scholar] [CrossRef]
- Riyad, W.A.; Yee, S.C.P.; Thinakaran, R.; Salam, Z.A.B.A. Comparative Evaluation of Numerous Optimization Algorithms for Compiling Travel Salesman Problem. J. Adv. Res. Dyn. Control Syst. 2020, 12, 877–883. [Google Scholar] [CrossRef]
- Piçarra, J.M.; Gutiérrez-Marco, J.C.; Sá, A.A.; Meireles, C.; Gonzálezclavijo, E. Silurian Graptolite Biostratigraphy of the Galicia—Trás-Os-Montes Zone (Spain and Portugal). GFF 2006, 128, 185–188. [Google Scholar] [CrossRef]
- Gobierno de España SIOSE. Sistema de Información de Ocupación Del Suelo de España. Ministerio de Transportes, Movilidad y Agencia urbana. 2017. Available online: https://www.siose.es/ (accessed on 25 September 2022).
- Ribeiro, O. Portugal, o Mediterrâneo e o Atlântico, 2nd ed.; Letra Livre: Lisboa, Portugal, 2021; ISBN 978-989-8268-50-1. [Google Scholar]
- Queijeiro, J.; Blanco, D.; Álvarez, C. Climatic Zoning and Viticulture in Galicia (North West Spain) Zonage Viticole et Viticulture En Galice (Nord-Ouest de l’Espagne). In Proceedings of the 6th International Terroir Congress/VIe Congrès International des Terroirs Viticoles, Bordeaux, France, 2–8 July 2006; pp. 34–39. [Google Scholar]
- Harding, A.; Palutikof, J. The Climate System. The Physical Geography of the Mediterranean; Oxford University Press: Oxford, UK, 2009. [Google Scholar]
- Pagés Valcarlos, J.L. Origen y Evolución Geomorfológica de Las Rías Atlánticas de Galicia. Rev. Soc. Geológica España 2000, 13, 393–403. [Google Scholar]
- Pedrosa, A.d.S.; Gonçalves, A.B.; Vieira, A.; Costa, F.d.S. Livro-Guia Da Viagem de Estudo Ao Litoral Norte e Serras Do Noroeste Português. 2010. Available online: https://repositorium.uminho.pt/entities/publication/4e9996a4-19de-4f2a-ab59-cdb276e331a0 (accessed on 1 October 2025).
- Alba-Tercedor, J.; Jáimez-Cuéllar, P.; Alvarez, M.; Avilés, J.; BONADA, N.; Casas, J.; Mellado-Díaz, A.; Ortega, M.; Pardo, I.; Prat, N.; et al. Caracterización Del Estado Ecológico de Ríos Mediterráneos Ibéricos Mediante El Índice IBMWP (Antes BMWP’). Limnetica 2002, 21, 175–185. [Google Scholar] [CrossRef]
- Alba-Tercedor, J. Macroinvertebrados Acuáticos y Calidad de Las Aguas de Los Ríos. In IV Simposio del Agua en Andalucía (SIAGA); Instituto Tecnológico Geominero de España: Madrid, Spain, 1996; Volume II, pp. 203–213. ISBN 84-7840-262-4. [Google Scholar]
- Armitage, P.D.; Moss, D.; Wright, J.F.; Furse, M.T. The Performance of a New Biological Water Quality Score System Based on Macroinvertebrates over a Wide Range of Unpolluted Running-Water Sites. Water Res. 1983, 17, 333–347. [Google Scholar] [CrossRef]
- Munné, A.; Prat, N. Use of Macroinvertebrate-Based Multimetric Indices for Water Quality Evaluation in Spanish Mediterranean Rivers: An Intercalibration Approach with the IBMWP Index. Hydrobiologia 2009, 628, 203–225. [Google Scholar] [CrossRef]
- Couto-Mendoza, M.T.; Vieira-Lanero, R.; Cobo, F. More Complexity Does Not Always Mean More Accuracy: The Case of IBMWP and METI in NW Spain. Ecohydrology 2015, 8, 595–609. [Google Scholar] [CrossRef]
- EEA. Copernicus Land Monitoring Service—EU—DEM; EEA: Copenhagen, Denmark, 2018; Available online: https://land.copernicus.eu/ (accessed on 1 October 2025).
- Kraemer, C.; Panda, S. Automatic ArcHydro for Watershed Delineation. In Proceedings of the 2009 Georgia Water Resources Conference, Kansas City, MO, USA, 17–21 May 2009. [Google Scholar]
- Adamczyk, J.; Tiede, D. ZonalMetrics—A Python Toolbox for Zonal Landscape Structure Analysis. Comput. Geosci. 2017, 99, 91–99. [Google Scholar] [CrossRef]
- Anselin, L.; Kelejian, H.H. Testing for Spatial Error Autocorrelation in the Presence of Endogenous Regressors. Int. Reg. Sci. Rev. 1997, 20, 153–182. [Google Scholar] [CrossRef]
- Montaño, J.; Palmer, A.; Sesé, A.; Cajal, B. Using the R-MAPE Index as a Resistant Measure of Forecast Accuracy. Psicothema 2013, 25, 500–506. [Google Scholar] [CrossRef]
- Salis, H.H.; Costa, A.; Moreira Vianna, J.H.; Azeneth Schuler, M.; Künne, A.; Sanches Fernandes, L.F.; Leal Pacheco, F.A. Hydrologic Modeling for Sustainable Water Resources Management in Urbanized Karst Areas. Int. J. Environ. Res. Public Health 2019, 16, 2542. [Google Scholar] [CrossRef]
- Li, L.; Zheng, B.; Liu, L. Biomonitoring and Bioindicators Used for River Ecosystems: Definitions, Approaches and Trends. Procedia Environ. Sci. 2010, 2, 1510–1524. [Google Scholar] [CrossRef]
- Zhang, Y.; Cheng, L.; Kong, M.; Li, W.; Gong, Z.; Zhang, L.; Wang, X.; Cai, Y.; Li, K. Utility of a Macroinvertebrate-Based Multimetric Index in Subtropical Shallow Lakes. Ecol. Indic. 2019, 106, 105527. [Google Scholar] [CrossRef]
- Dolédec, S.; Lamouroux, N.; Fuchs, U.; Mérigoux, S. Modelling the Hydraulic Preferences of Benthic Macroinvertebrates in Small European Stream. Freshw. Biol. 2006, 52, 145–164. [Google Scholar] [CrossRef]
- Menezes, S.; Baird, D.J.; Soares, A.M.V.M. Beyond Taxonomy: A Review of Macroinvertebrate Trait-based Community Descriptors as Tools for Freshwater Biomonitoring. J. Appl. Ecol. 2010, 47, 711–719. [Google Scholar] [CrossRef]
- Feio, M.J.; Ferreira, J.; Buffagni, A.; Erba, S.; Dörflinger, G.; Ferréol, M.; Munné, A.; Prat, N.; Tziortzis, I.; Urbanič, G. Comparability of Ecological Quality Boundaries in the Mediterranean Basin Using Freshwater Benthic Invertebrates. Statistical Options and Implications. Sci. Total Environ. 2014, 476–477, 777–784. [Google Scholar] [CrossRef] [PubMed]
- Bieger, K.; Arnold, J.G.; Rathjens, H.; White, M.J.; Bosch, D.D.; Allen, P.M.; Volk, M.; Srinivasan, R. Introduction to SWAT+, a Completely Restructured Version of the Soil and Water Assessment Tool. JAWRA J. Am. Water Resour. Assoc. 2017, 53, 115–130. [Google Scholar] [CrossRef]
- Dala-Corte, R.B.; Melo, A.S.; Siqueira, T.; Bini, L.M.; Martins, R.T.; Cunico, A.M.; Pes, A.M.; Magalhães, A.L.B.; Godoy, B.S.; Leal, C.G.; et al. Thresholds of Freshwater Biodiversity in Response to Riparian Vegetation Loss in the Neotropical Region. J. Appl. Ecol. 2020, 57, 1391–1402. [Google Scholar] [CrossRef]
- Marzin, A.; Archaimbault, V.; Belliard, J.; Chauvin, C.; Delmas, F.; Pont, D. Ecological Assessment of Running Waters: Do Macrophytes, Macroinvertebrates, Diatoms and Fish Show Similar Responses to Human Pressures? Ecol. Indic. 2012, 23, 56–65. [Google Scholar] [CrossRef]
- Acuña-Alonso, C.; Novo, A.; Rodríguez, J.L.; Varandas, S.; Álvarez, X. Modelling and Evaluation of Land Use Changes through Satellite Images in a Multifunctional Catchment: Social, Economic and Environmental Implications. Ecol. Inf. 2022, 71, 101777. [Google Scholar] [CrossRef]
- Ministerio de Obras Públicas y Urbanismo Real Decreto 849/1986, de 11 de Abril, Por El Que Se Aprueba El Reglamento Del Dominio Público Hidráulico, Que Desarrolla Los Títulos Preliminar I, IV, V, VI y VII de La Ley 29/1985, de 2 de Agosto, de Aguas. 1986. Available online: https://www.boe.es/buscar/act.php?id=BOE-A-1986-10 (accessed on 1 October 2025).
- Xunta de Galicia Ley 7/2012, de 28 de Junio, de montes de Galicia. Boletín Oficial del Estado (BOE)/Diario Oficial de Galicia, 2012. Available online: https://www.boe.es/buscar/act.php?id=BOE-A-2012-11414 (accessed on 1 October 2025).
- Xunta de Galicia. Ley 6/2011, de 13 de octubre, de movilidad de tierras. Boletín Oficial del Estado (BOE)/Diario Oficial de Galicia, 2011. Available online: https://www.boe.es/buscar/pdf/2011/BOE-A-2011-17718-consolidado.pdf (accessed on 1 October 2025).
- Turner, S.; Pham, T.-T.-H. “Nothing Is like It Was before”: The Dynamics between Land-Use and Land-Cover, and Livelihood Strategies in the Northern Vietnam Borderlands. Land 2015, 4, 1030–1059. [Google Scholar] [CrossRef]
- Corbelle-Rico, E.; López-Iglesias, E. Farmland Abandonment and Afforestation—Socioeconomic and Biophysical Patterns of Land Use Change at the Municipal Level in Galicia, Northwest Spain. Land 2024, 13, 1394. [Google Scholar] [CrossRef]
- Sotirov, M.; Arts, B. Integrated Forest Governance in Europe: An Introduction to the Special Issue on Forest Policy Integration and Integrated Forest Management. Land. Use Policy 2018, 79, 960–967. [Google Scholar] [CrossRef]
- Fernandes, A.C.P.; Sanches Fernandes, L.F.; Cortes, R.M.V.; Leal Pacheco, F.A. The Role of Landscape Configuration, Season, and Distance from Contaminant Sources on the Degradation of Stream Water Quality in Urban Catchments. Water 2019, 11, 2025. [Google Scholar] [CrossRef]
- Fernandes, A.C.P.; De Oliveira Martins, L.M.; Fernandes, L.F.S.; Pacheco, F.A.L. Effect of Landscape Metrics on Water Quality Over Three Decades: A Case Study of the Ave River Basin, Portugal. WIT Trans. Ecol. Environ. 2020, 242. [Google Scholar] [CrossRef]
- Thomas, A.; Masante, D.; Jackson, B.; Cosby, B.; Emmett, B.; Jones, L. Fragmentation and Thresholds in Hydrological Flow-Based Ecosystem Services. Ecol. Appl. 2020, 30, e02046. [Google Scholar] [CrossRef] [PubMed]
- White, J.; Hemmings, B.; Fienen, M.N.; Knowling, M. Towards Improved Environmental Modeling Outcomes: Enabling Low-Cost Access to High-Dimensional, Geostatistical-Based Decision-Support Analyses. Environ. Model. Softw. 2021, 139, 105022. [Google Scholar] [CrossRef]
- Gutiérrez-Rial, D.; Soto González, B.; García Vázquez, D.; Méndez-Martínez, G.; Pombal Diego, M.Á.; Garrido González, J. Freshwater Biodiversity Loss in Urbanised Rivers. Ecol. Indic. 2023, 156, 111150. [Google Scholar] [CrossRef]
- Valle Junior, R.F.; Varandas, S.G.P.; Pacheco, F.A.L.; Pereira, V.R.; Santos, C.F.; Cortes, R.M.V.; Sanches Fernandes, L.F. Impacts of Land Use Conflicts on Riverine Ecosystems. Land. Use Policy 2015, 43, 48–62. [Google Scholar] [CrossRef]
- Cortes, R.M.V.; Hughes, S.J.; Pereira, V.R.; da Graça Pinto Varandas, S. Tools for Bioindicator Assessment in Rivers: The Importance of Spatial Scale, Land Use Patterns and Biotic Integration. Ecol. Indic. 2013, 34, 460–477. [Google Scholar] [CrossRef]
Disclaimer/Publisher’s Note: The statements, opinions and data contained in all publications are solely those of the individual author(s) and contributor(s) and not of MDPI and/or the editor(s). MDPI and/or the editor(s) disclaim responsibility for any injury to people or property resulting from any ideas, methods, instructions or products referred to in the content. |
© 2025 by the authors. Licensee MDPI, Basel, Switzerland. This article is an open access article distributed under the terms and conditions of the Creative Commons Attribution (CC BY) license (https://creativecommons.org/licenses/by/4.0/).

