1. Introduction
The theory of ecosystem services posits that human society relies on natural ecosystems for various types of services, including resource provision and climate regulation [
1,
2,
3]. The capacity of natural ecosystems to supply such services, combined with the intensity of human demand, jointly determines the balance between provision and requirement [
4]. This state of ecosystem service carrying capacity between humans and nature directly influences the well-being of human communities. With continued urbanization, urban development has caused significant disruption to surrounding ecosystems [
5,
6]. In particular, land cover changes resulting from urban expansion fundamentally alter regional natural environments, thereby affecting the service capacity of local ecosystems [
7,
8,
9]. For instance, as cities expand, they encroach upon nearby forests, water bodies, and other natural ecosystems. Impervious surfaces such as construction land lack key ecological functions including water provision and retention, air purification, and carbon sequestration that are inherent to natural ecosystems [
10]. Large-scale degradation of natural ecosystems significantly reduces the overall capacity of regional ecosystem services, leading to a severe imbalance with societal demand. This imbalance is further exacerbated by the continuous expansion of human needs, resulting in intensified environmental degradation [
11,
12].
Water resources, as a fundamental natural resource supporting urban socio-economic development, have a sustainable supply capacity directly linked to a city’s ecological security and long-term development [
13,
14].
Water resource carrying capacity serves as a critical indicator for assessing regional sustainability in the context of rapid urbanization [
15]. While urban expansion intensifies water demand and alters hydrological cycles through land use change and pollution, it also compromises the self-regulating capacity of aquatic ecosystems [
16]. In China, research on water resource carrying capacity has gradually shifted from static “blue water” accounting toward more integrated assessments that incorporate socio-economic drivers and ecological constraints [
17]. However, the role of ecosystem-mediated hydrological regulation—such as water conservation services involving rainfall interception, soil infiltration, and runoff modulation—remains underrepresented in current frameworks [
18]. Incorporating these ecosystem functions is essential for advancing the theoretical and practical understanding of water security in urbanizing basins globally [
19,
20]. As a critical link between natural and socio-economic systems, the performance and spatial distribution of water conservation services directly determine the stability and sustainability of regional water supply patterns [
21,
22]. Therefore, integrating the supply of water conservation services, urban water demand, and regional water carrying capacity assessment from an ecosystem service supply–demand perspective can more effectively reveal the sustainable limits of regional water resource utilization.
To further investigate changes in regional water ecological carrying capacity under urban expansion, this study focuses on the critical function of water conservation and conducts the following research: (1) selecting the typical water-deficient region of China—Gansu Province—as the study area, and analyzing the characteristics of land use change based on multi-temporal Land Use and Land Cover Change (LUCC) data; (2) constructing an assessment model for the supply, demand, and carrying capacity of regional water conservation from the perspective of ecosystem service supply–demand trade-offs, and analyzing changes in water conservation carrying capacity in the study area; and (3) employing spatial clustering analysis to explore the spatial pattern and evolution of water ecological carrying capacity, thereby providing a basis for water ecological security management and control in the region.
3. Results
3.1. Changes in Land Use Types in Gansu Province
Based on Gansu Province’s land cover data, land use transition matrices were constructed for the period 2000–2020 at five-year intervals.
Table 1,
Table 2,
Table 3 and
Table 4 present the results of the land use transition matrices for the periods 2000–2005, 2005–2010, 2010–2015, and 2015–2020, respectively.
As shown in
Table 1, in the year 2000, the most abundant land use type in Gansu Province was unused land, with a total of 183,680 km
2, followed by grassland, with 172,203 km
2. The number of patches of other land use types was significantly lower than these two. By 2005, among the land use types that underwent changes, the most notable transitions involved plowland: 1793 km
2 were converted to grassland, while 1267 km
2 of grassland were converted to plowland. The area of construction land expanded from 5664 km
2 in 2000 to 6051 km
2 in 2005. The increase in construction land primarily resulted from the encroachment on plowland and grassland. Additionally, ongoing ecological restoration projects in the region aimed at desert and Gobi unused land led to the conversion of 1146 km
2 of unused land to plowland and 579 km
2 to grassland.
During the period from 2005 to 2010, Gansu Province carried out significant development of unused land, with 1295 km2 converted to plowland, 2320 km2 to grassland, and 538 km2 to water bodies. Meanwhile, urban areas continued to expand, increasing from 6051 km2 in 2005 to 6814 km2 in 2010. From 2010 to 2015, the area of plowland decreased, primarily due to conversion to grassland, amounting to 1062 km2. Conversely, 1000 km2 of grassland were reclaimed for plowland under the influence of agricultural activities. By 2015, construction land had further increased to 7480 km2, reflecting continued urban expansion that mainly encroached on agricultural plowland, with a total of 447 km2 converted. During this period, the development of unused land continued, with 346 km2 converted to plowland, 345 km2 to grassland, and 221 km2 to construction land.
During the period from 2015 to 2020, land cover types in Gansu Province underwent intense changes. Only 59,854 km2 of plowland remained unchanged. As China continued to implement the Grain for Green and Grazing for Grass programs, 648 km2 of plowland were artificially converted to forest, and 7102 km2 were restored to grassland. Meanwhile, urban expansion intensified significantly. The area of construction land increased sharply from 7480 km2 in 2015 to 8751 km2 in 2020. This expansion involved the conversion of 1172 km2 of plowland and 546 km2 of grassland. Regarding the development of unused land, 891 km2 were reclaimed as plowland, 738 km2 were converted to water bodies, and 657 km2 were developed into construction land.
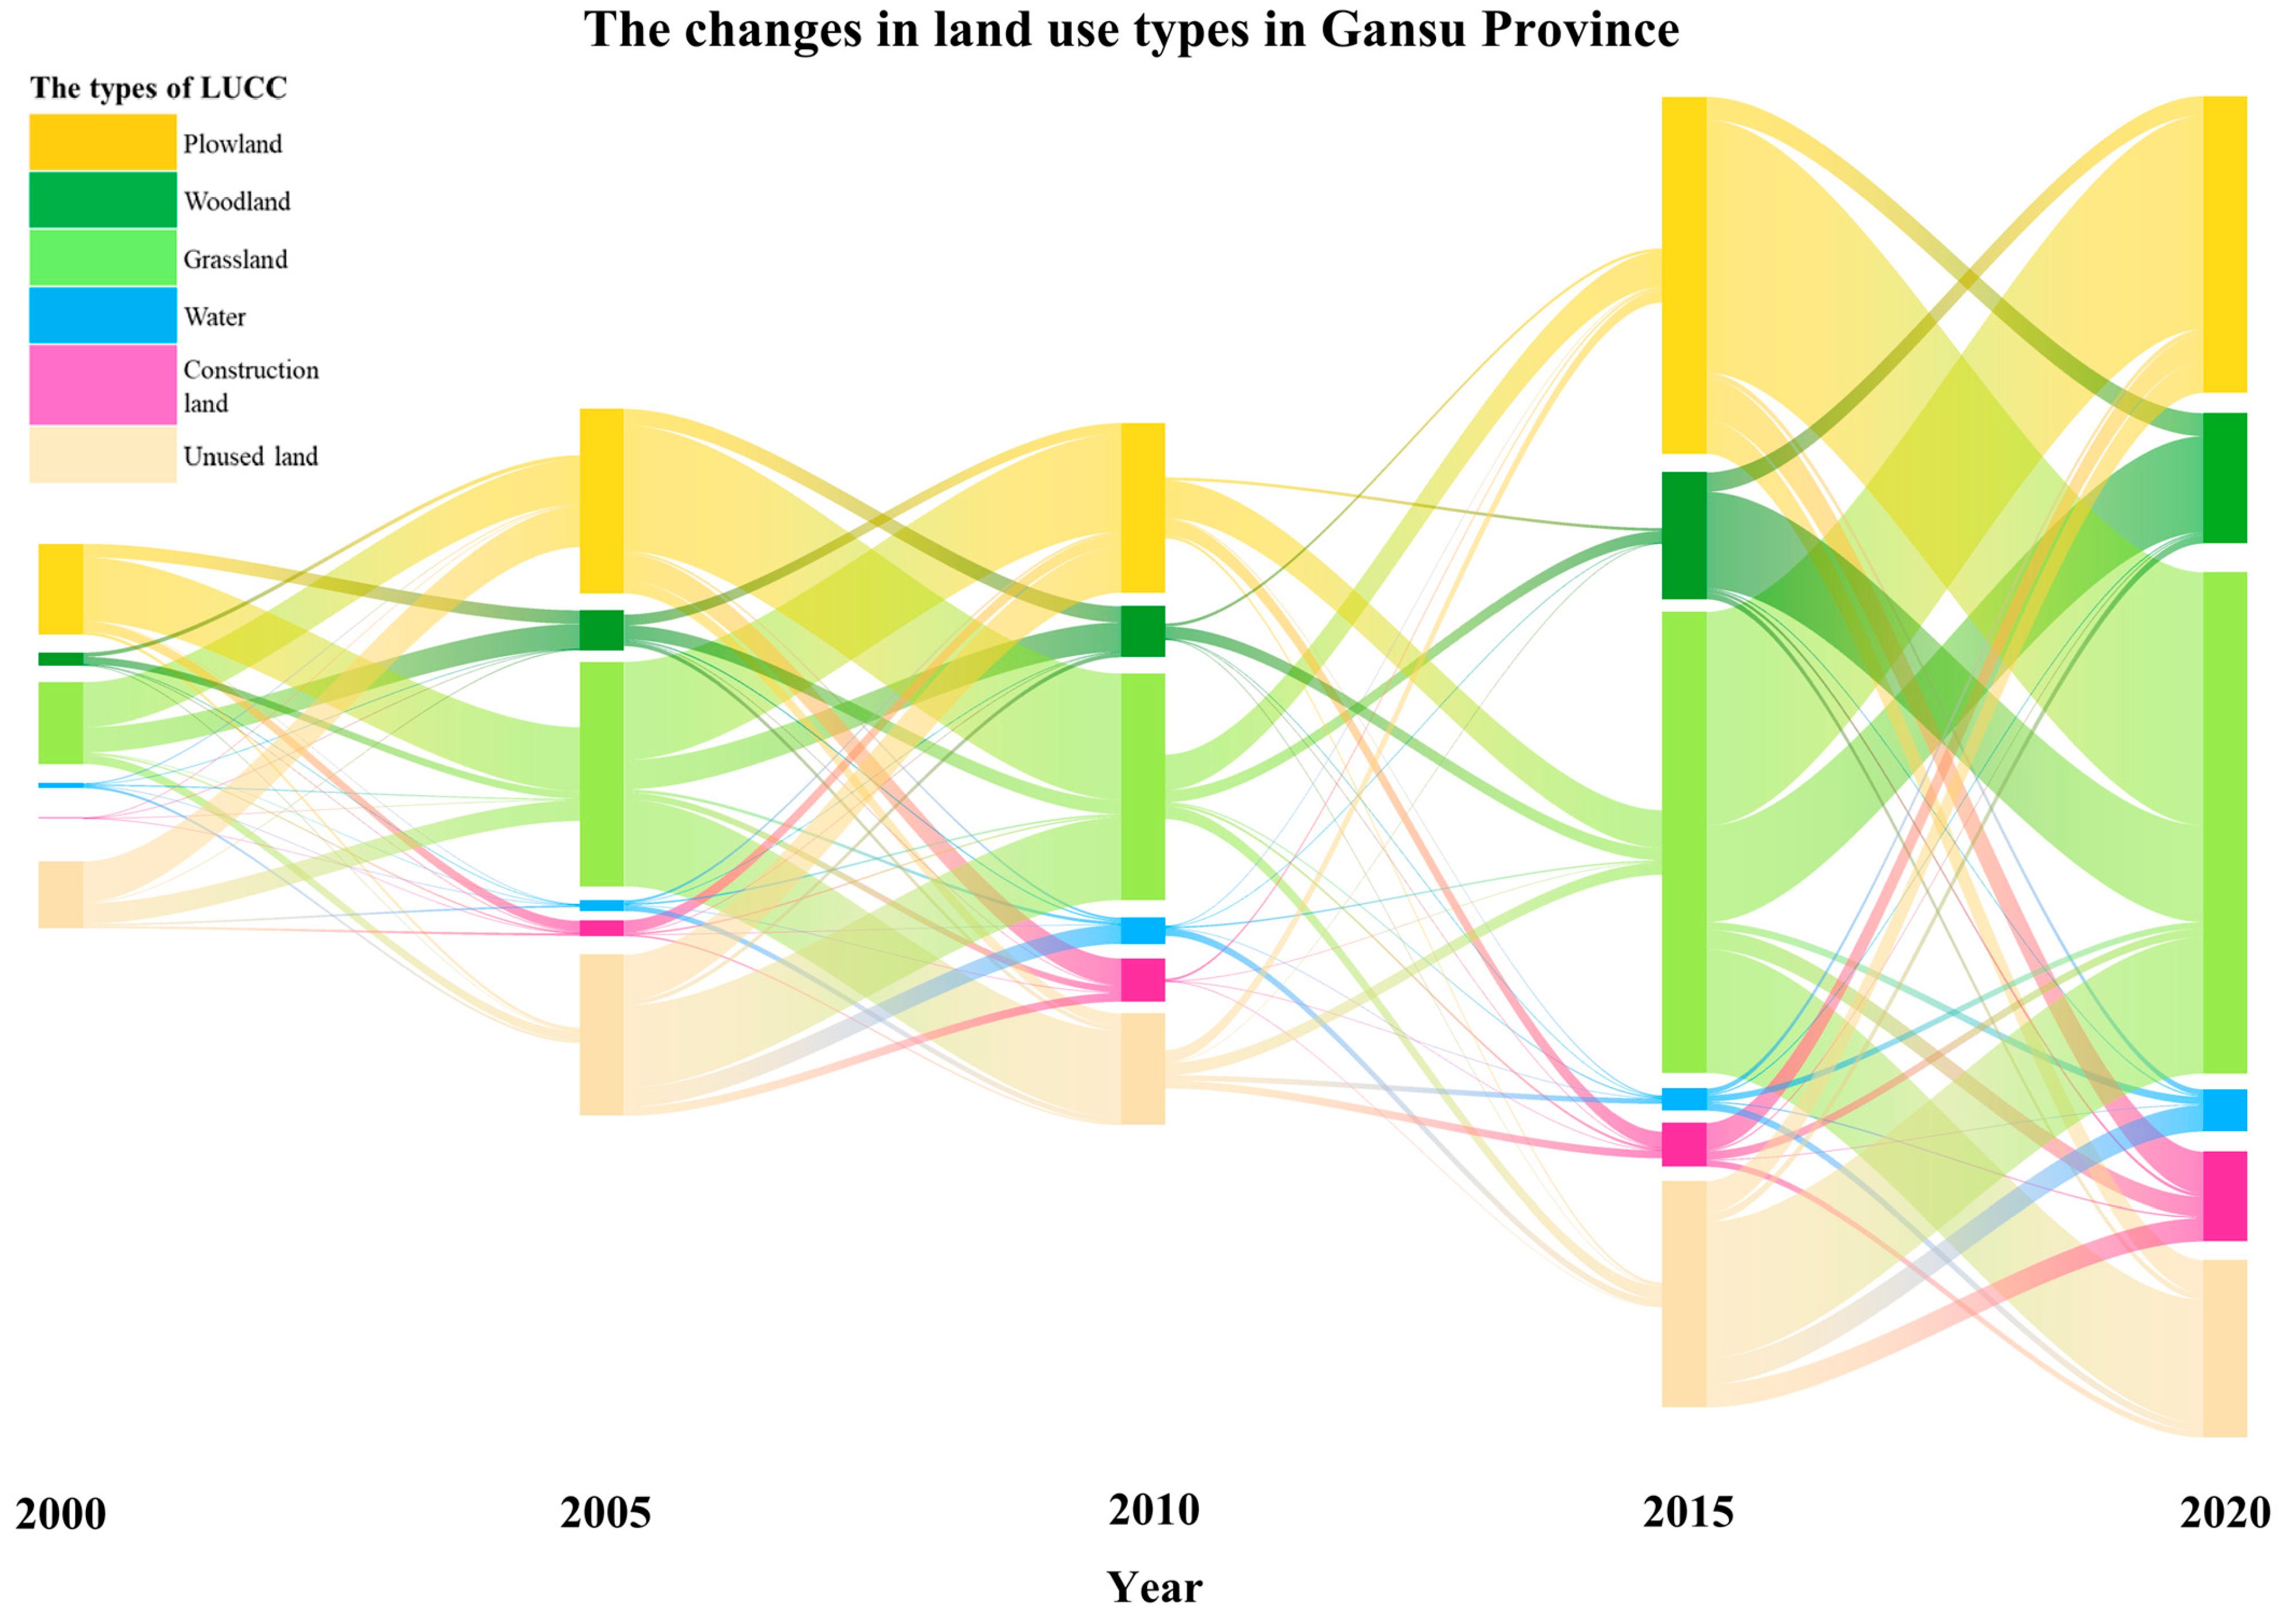
Figure 2 illustrates the transitions among the six major land types in Gansu Province from 2000 to 2020. As shown in the figure, the most significant area changes at five-year intervals occurred in plowland, grassland, and unused land, which were converted to other categories at notable scales. During 2000–2005, the primary transitions included the conversion of plowland to grassland, grassland to plowland, and unused land to plowland. In the period 2005–2010, changes were dominated by the transformation of plowland to grassland. Meanwhile, grassland was partly converted to plowland due to agricultural activities, but a larger portion degraded into unused land such as desert as a result of desertification. Desert restoration projects also achieved notable outcomes, with some unused land being reclaimed as plowland and even more being improved into grassland. Between 2010 and 2015, the overall scale of land transitions was relatively limited, with mutual conversion between plowland and grassland being the most common type of change. From 2015 to 2020, land cover transitions intensified significantly. A large portion of plowland was returned to grassland, while some forest areas experienced decreased vegetation density due to environmental degradation and were gradually converted to grassland. Grassland faced dual pressures from agricultural expansion and desertification risks. At the same time, desertification control projects continued, with most unused land being artificially greened and transformed into grassland.
3.2. The Assessment Results and Numerical Distribution Changes in Gansu Water Conservation from 2000 to 2020
Using the InVEST model and combining multi-source data such as evaporation and rainfall, the water conservation values of Gansu Province during the period from 2000 to 2020 were evaluated.
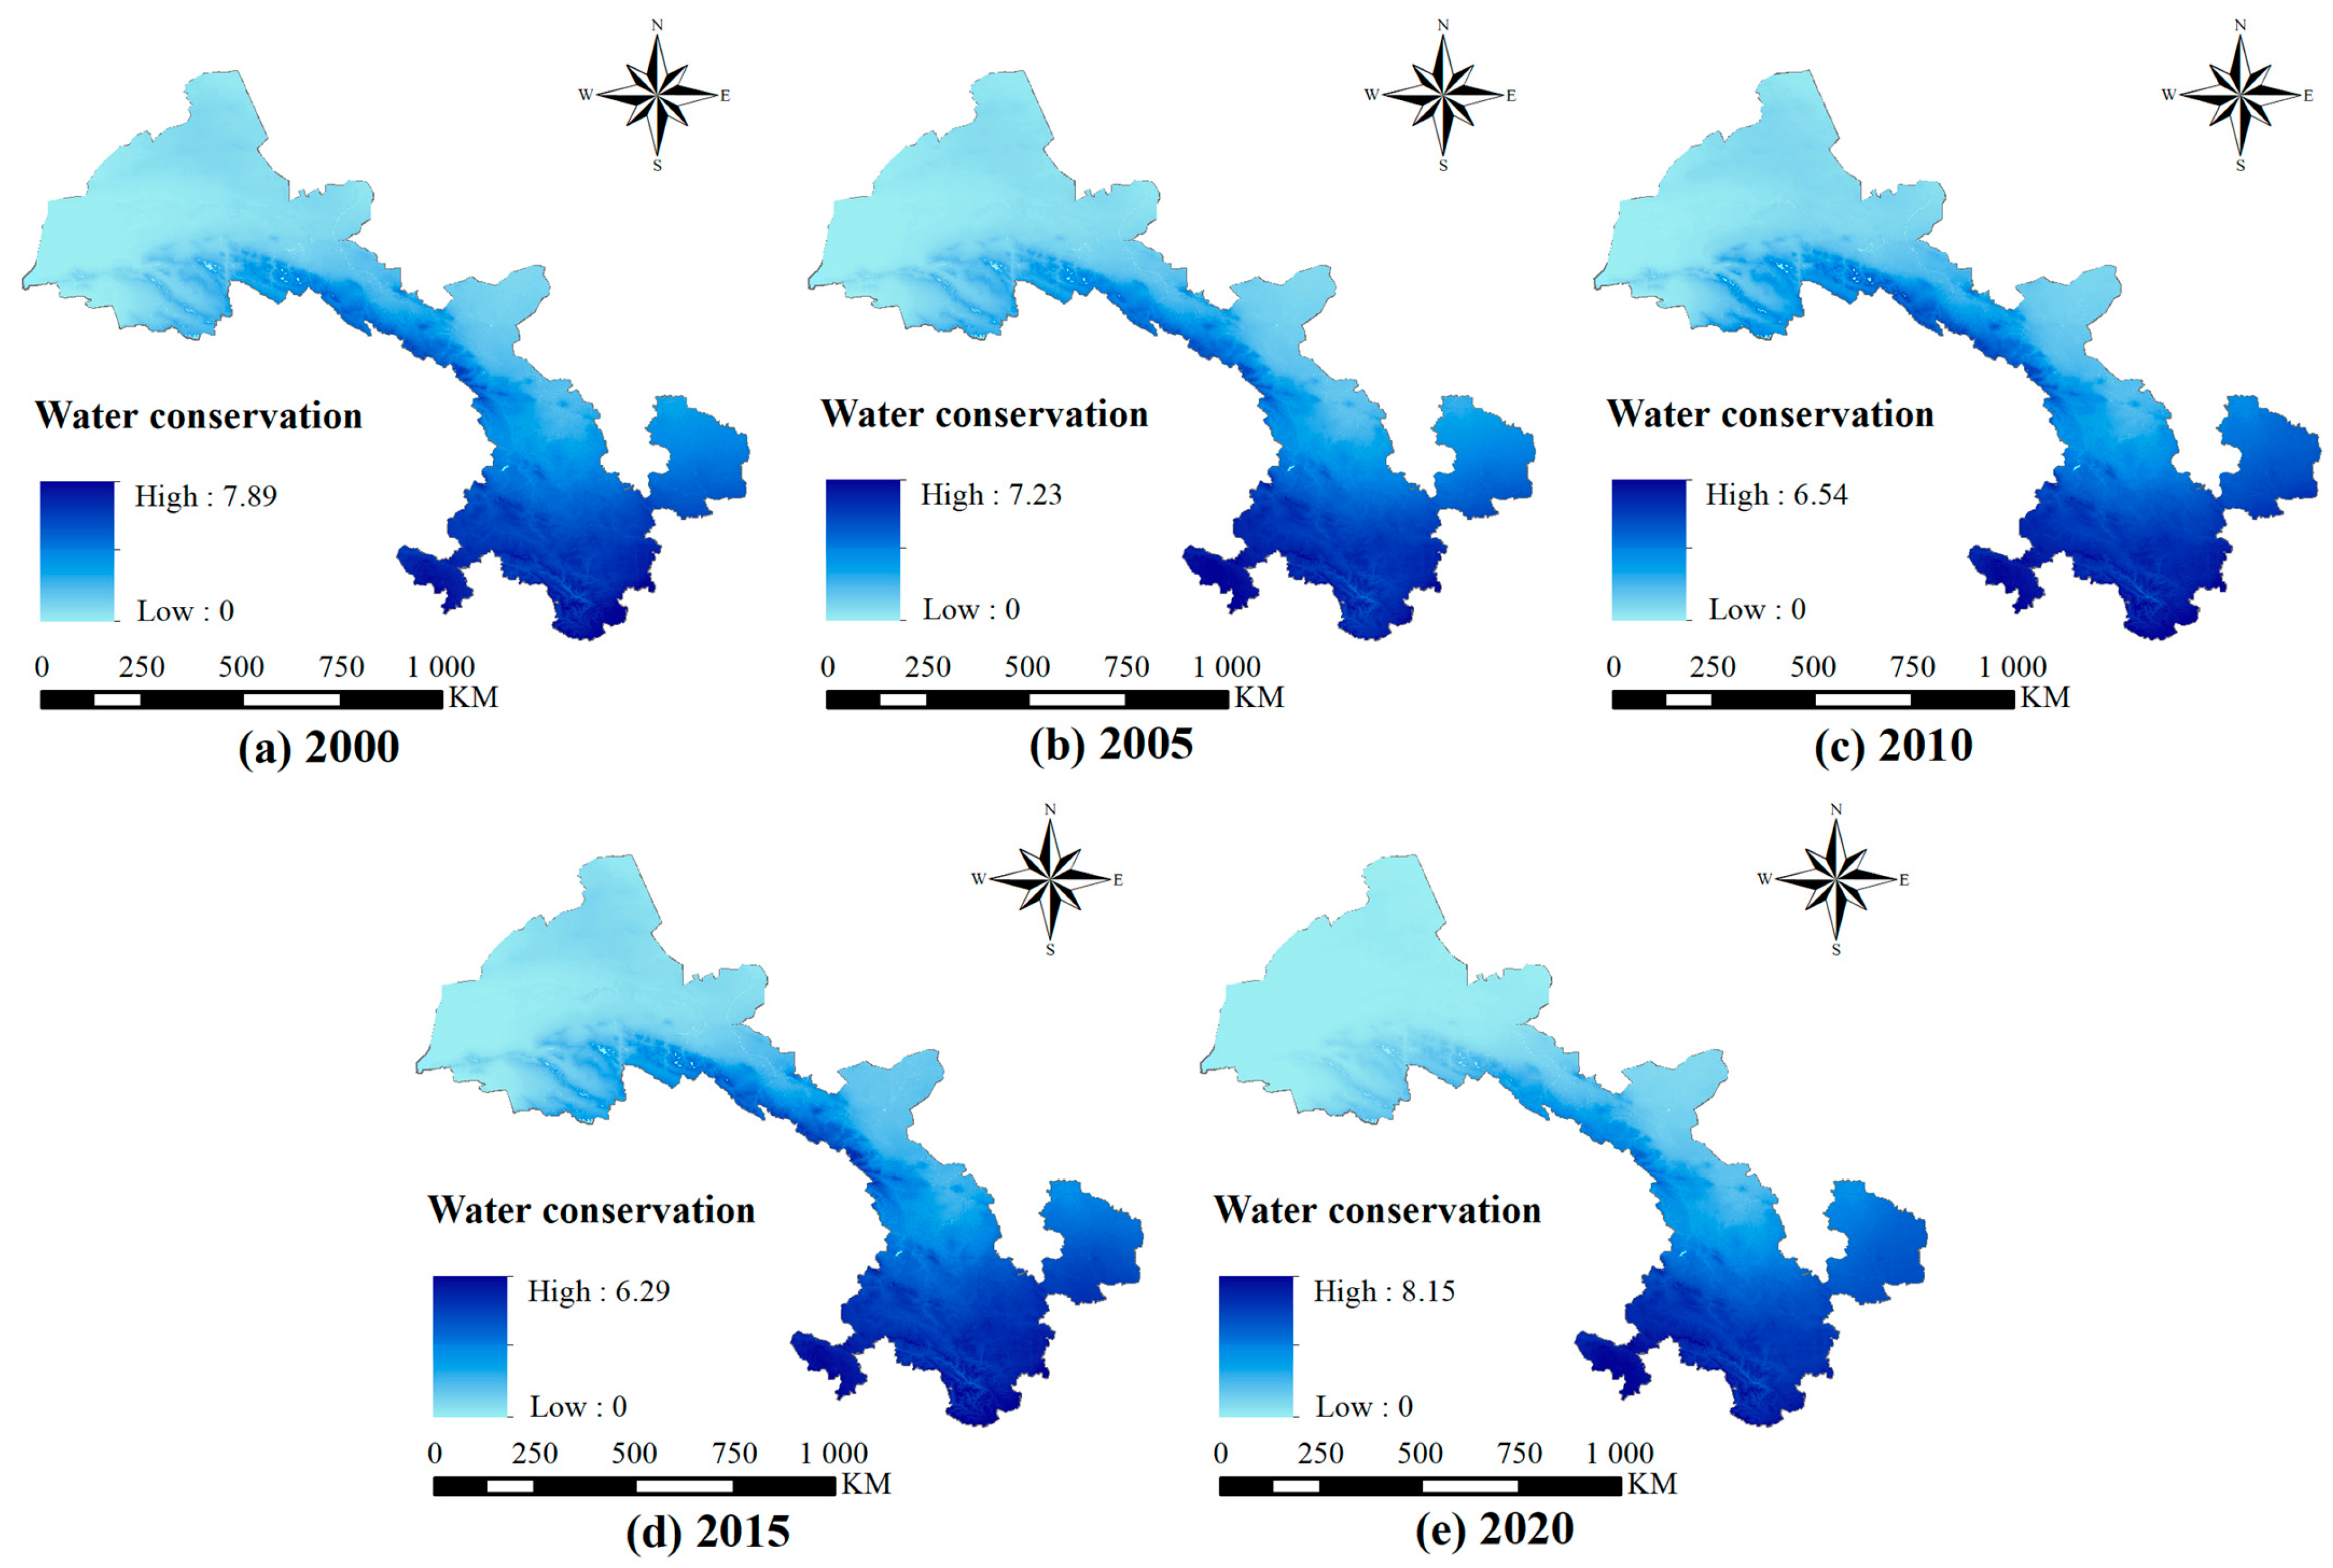
In terms of water conservation capacity, as shown in
Figure 3, the maximum water conservation per pixel in Gansu Province was 7.89 × 10
5 m
3 in the year 2000, which increased to 8.15 × 10
5 m
3 by 2020. In contrast, the lowest value was recorded in 2015, at only 6.29 × 10
5 m
3 per pixel. Spatially, both water yield and water conservation exhibited a distinct pattern of being “higher in the south and lower in the north” and “higher in the west and lower in the east”. Regions such as Lanzhou, Baiyin, Gannan, Longnan, Dingxi, Tianshui, and Linxia were identified as key areas with high water conservation capacity. Pixels with high water yield and conservation were predominantly distributed along the eastern Qilian Mountains and the southern Qinling Mountains.
Based on LUCC data, forests and grasslands in Gansu are mainly concentrated in the southern Qinling and eastern Qilian Mountain regions. The high vegetation coverage in these areas enhances the retention and conservation of natural rainfall and surface water resources, contributing significantly to regional water balance. However, a comparison between the years 2000 and 2020 reveals noticeable ecosystem degradation in northern Gansu, where water conservation capacity has further declined. Moreover, due to urban expansion, construction land has increasingly encroached on forest and grassland areas. As a result, the water conservation service capacity has also decreased in major urban centers, including Lanzhou.
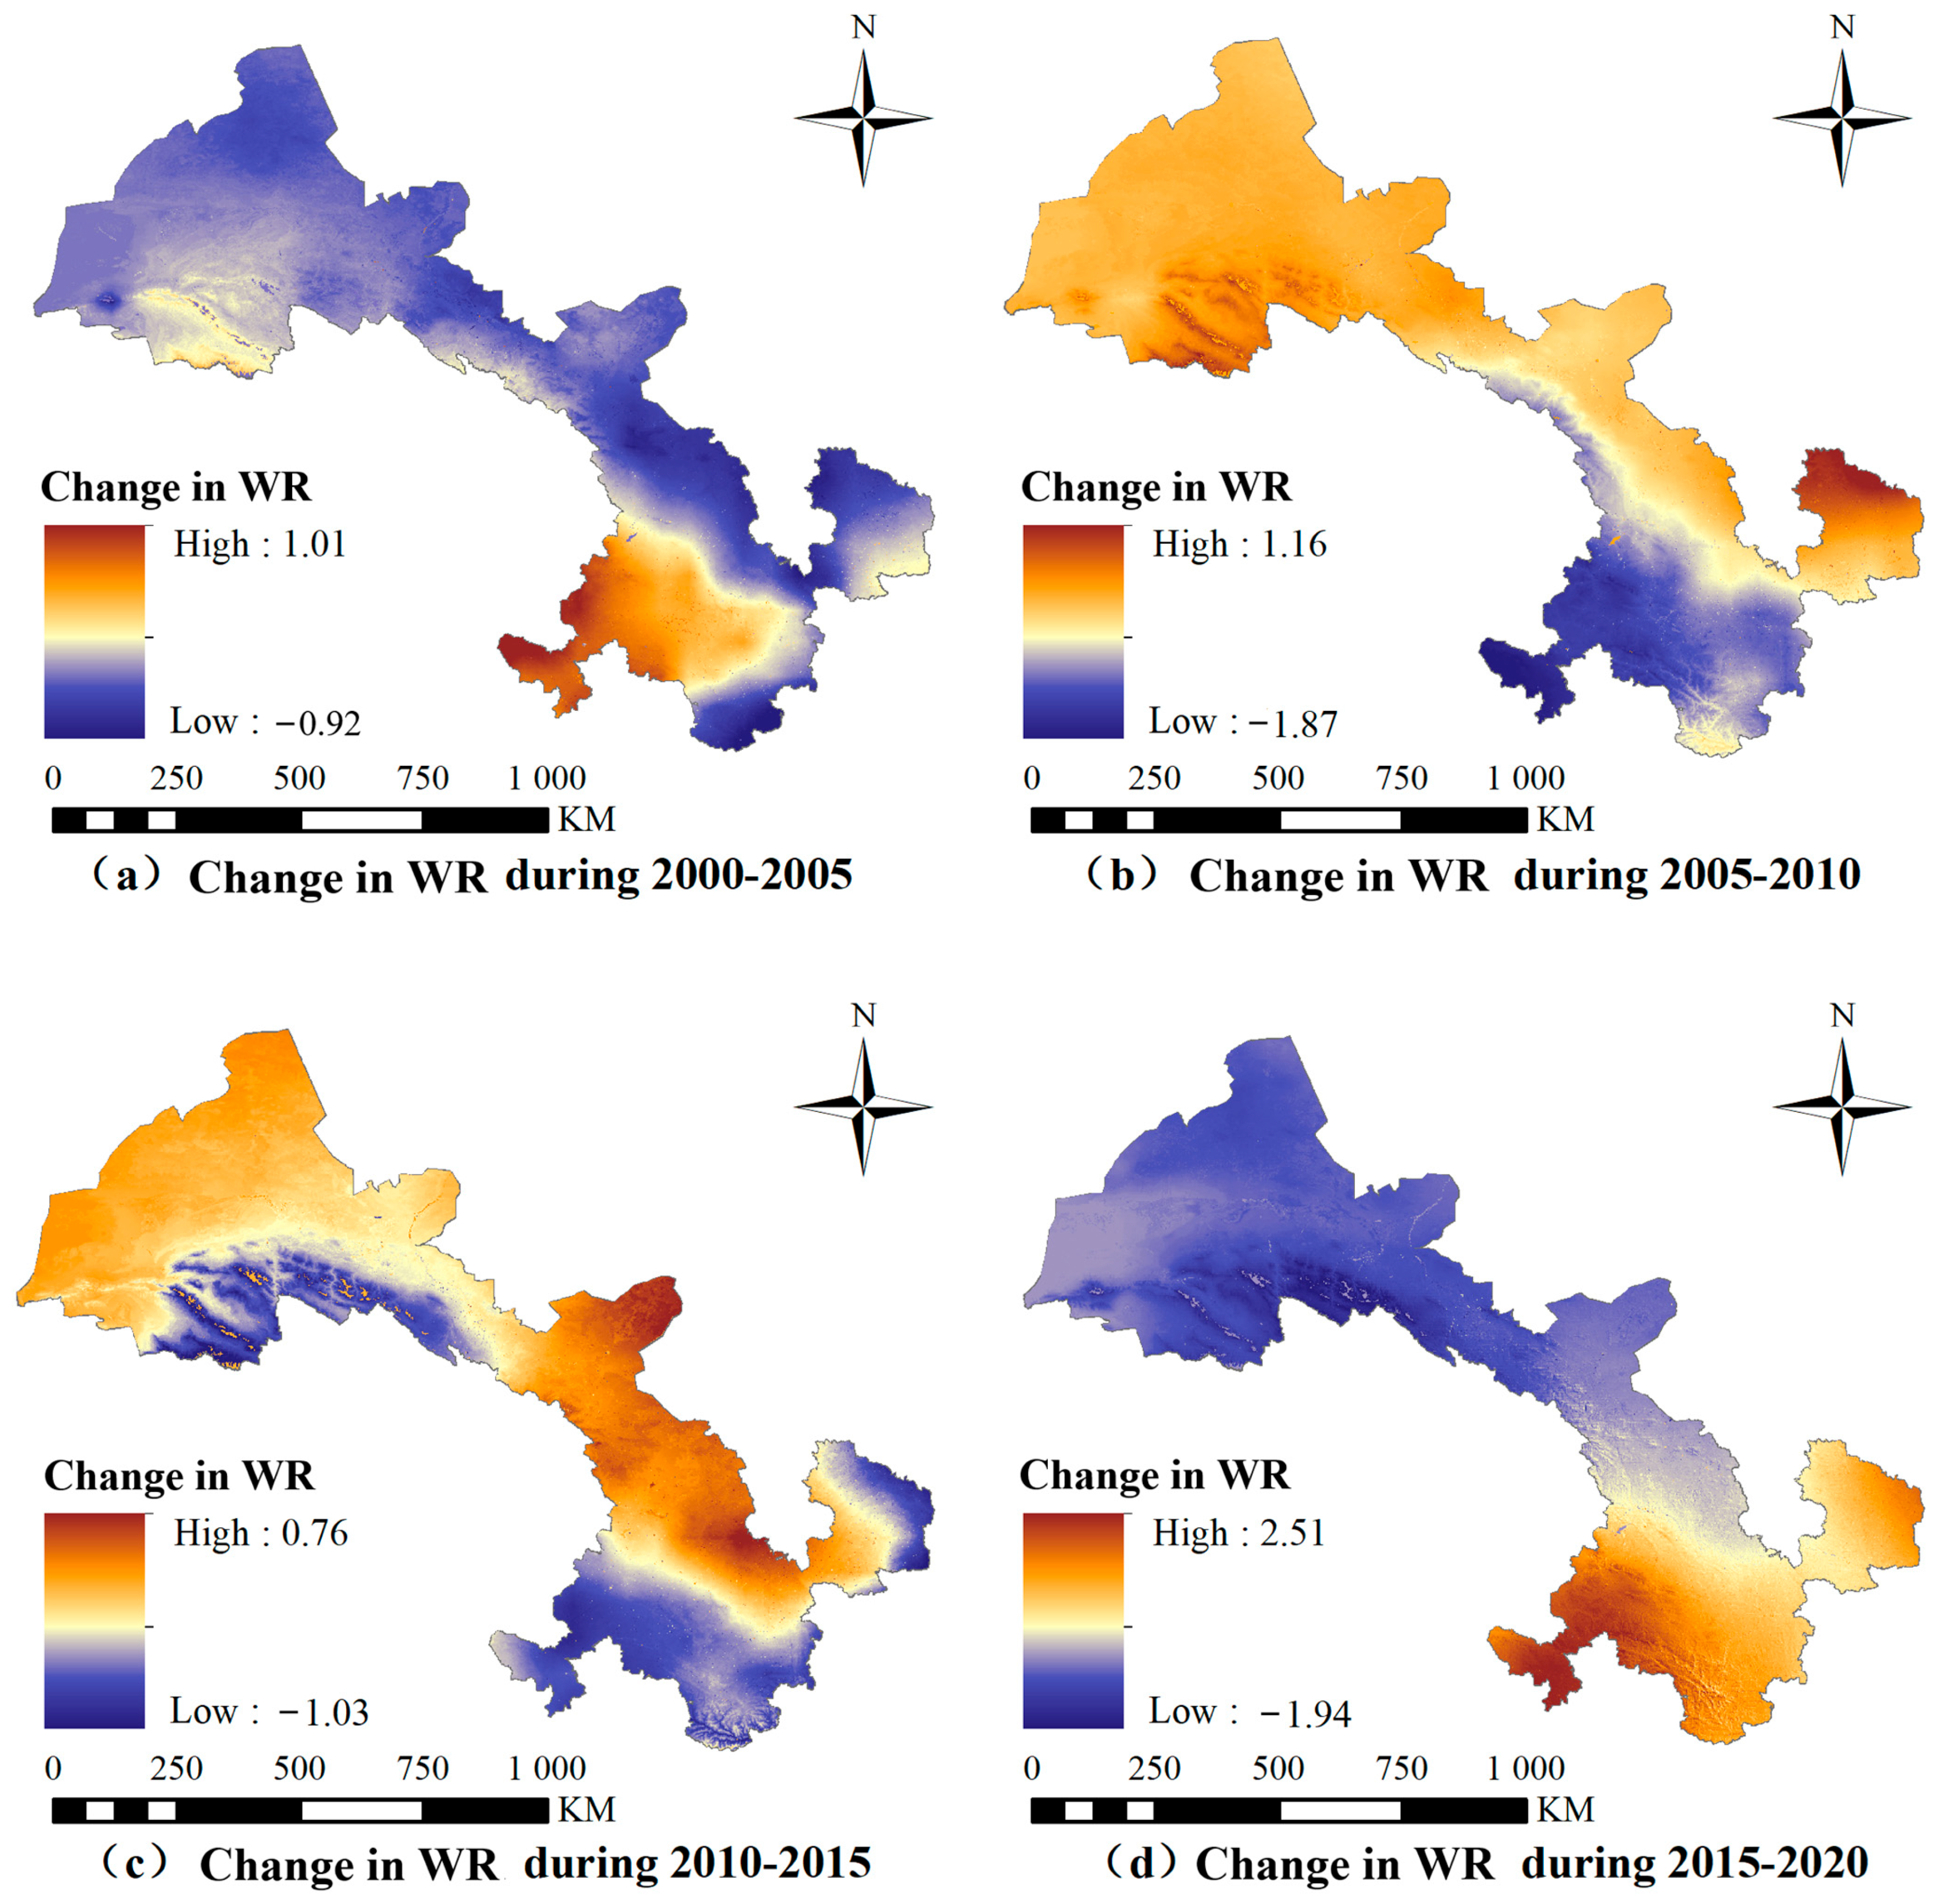
Figure 4 illustrates the changes in water conservation service levels during the study period. Compared to the year 2000, by 2005, Gansu Province exhibited a significant decline in its water conservation capacity, with the maximum decrease per unit pixel reaching 0.92 × 10
5 m
3. In terms of the overall spatial pattern, aside from the unused land areas such as deserts and Gobi in the central and northern regions, the decline was primarily concentrated along the urban corridors of Lanzhou, Zhangye, Jinchang, and Wuwei. The Qilian Mountains region in northwestern Gansu also experienced a decrease in water conservation capacity; it was not severe. During this period, the continuous expansion of these central cities encroached upon surrounding natural ecological covers, such as grasslands, leading to a reduction in the ecosystem’s water conservation capacity in these areas. Between 2000 and 2005, only the Gannan region in the southwest continued to show an increase in water conservation service levels, with the maximum increase per unit pixel reaching 1.01 × 10
5 m
3.
During the two periods of 2005–2010 and 2010–2015, the spatial patterns of changes in water conservation services within Gansu Province’s ecosystems exhibited overall similarities. Increases in water conservation per unit were observed in the desert regions of the northwest and in areas such as Baiyin and Dingxi in the east. The maximum increase per unit pixel reached 1.16 × 10⁵ m3 during 2005–2010 and 0.76 × 10⁵ m3 during 2010–2015. In contrast, the decline was concentrated in the Gannan region. Notably, the Qilian Mountains area showed a significant decrease during 2010–2015, indicating a risk of vegetation cover degradation in these regions.
Between 2015 and 2020, two contrasting trends emerged: a decline and an increase. A distinct north–south divergence pattern was observed. The water conservation capacity of ecosystems in the northern region showed a significant decrease, with the Qilian Mountains continuing the trend seen during the 2010–2015 period and experiencing a notable decline, reaching a maximum unit value of 1.94 × 10⁵ m3. In contrast, areas with increased water conservation remained concentrated in the southern regions, such as Gannan, Longnan, and Tianshui, which are characterized by high vegetation coverage, with a maximum unit value of 2.51 × 10⁵ m3. During this period, the overall water conservation capacity of ecosystems in Gansu Province weakened. Moreover, the ecosystem services provided by central cities have significantly eroded the surrounding ecological functions, particularly exacerbating the deterioration in key mountainous areas of northern Gansu Province.
3.3. Changes in Water Conservation Carrying Capacity of Gansu Province
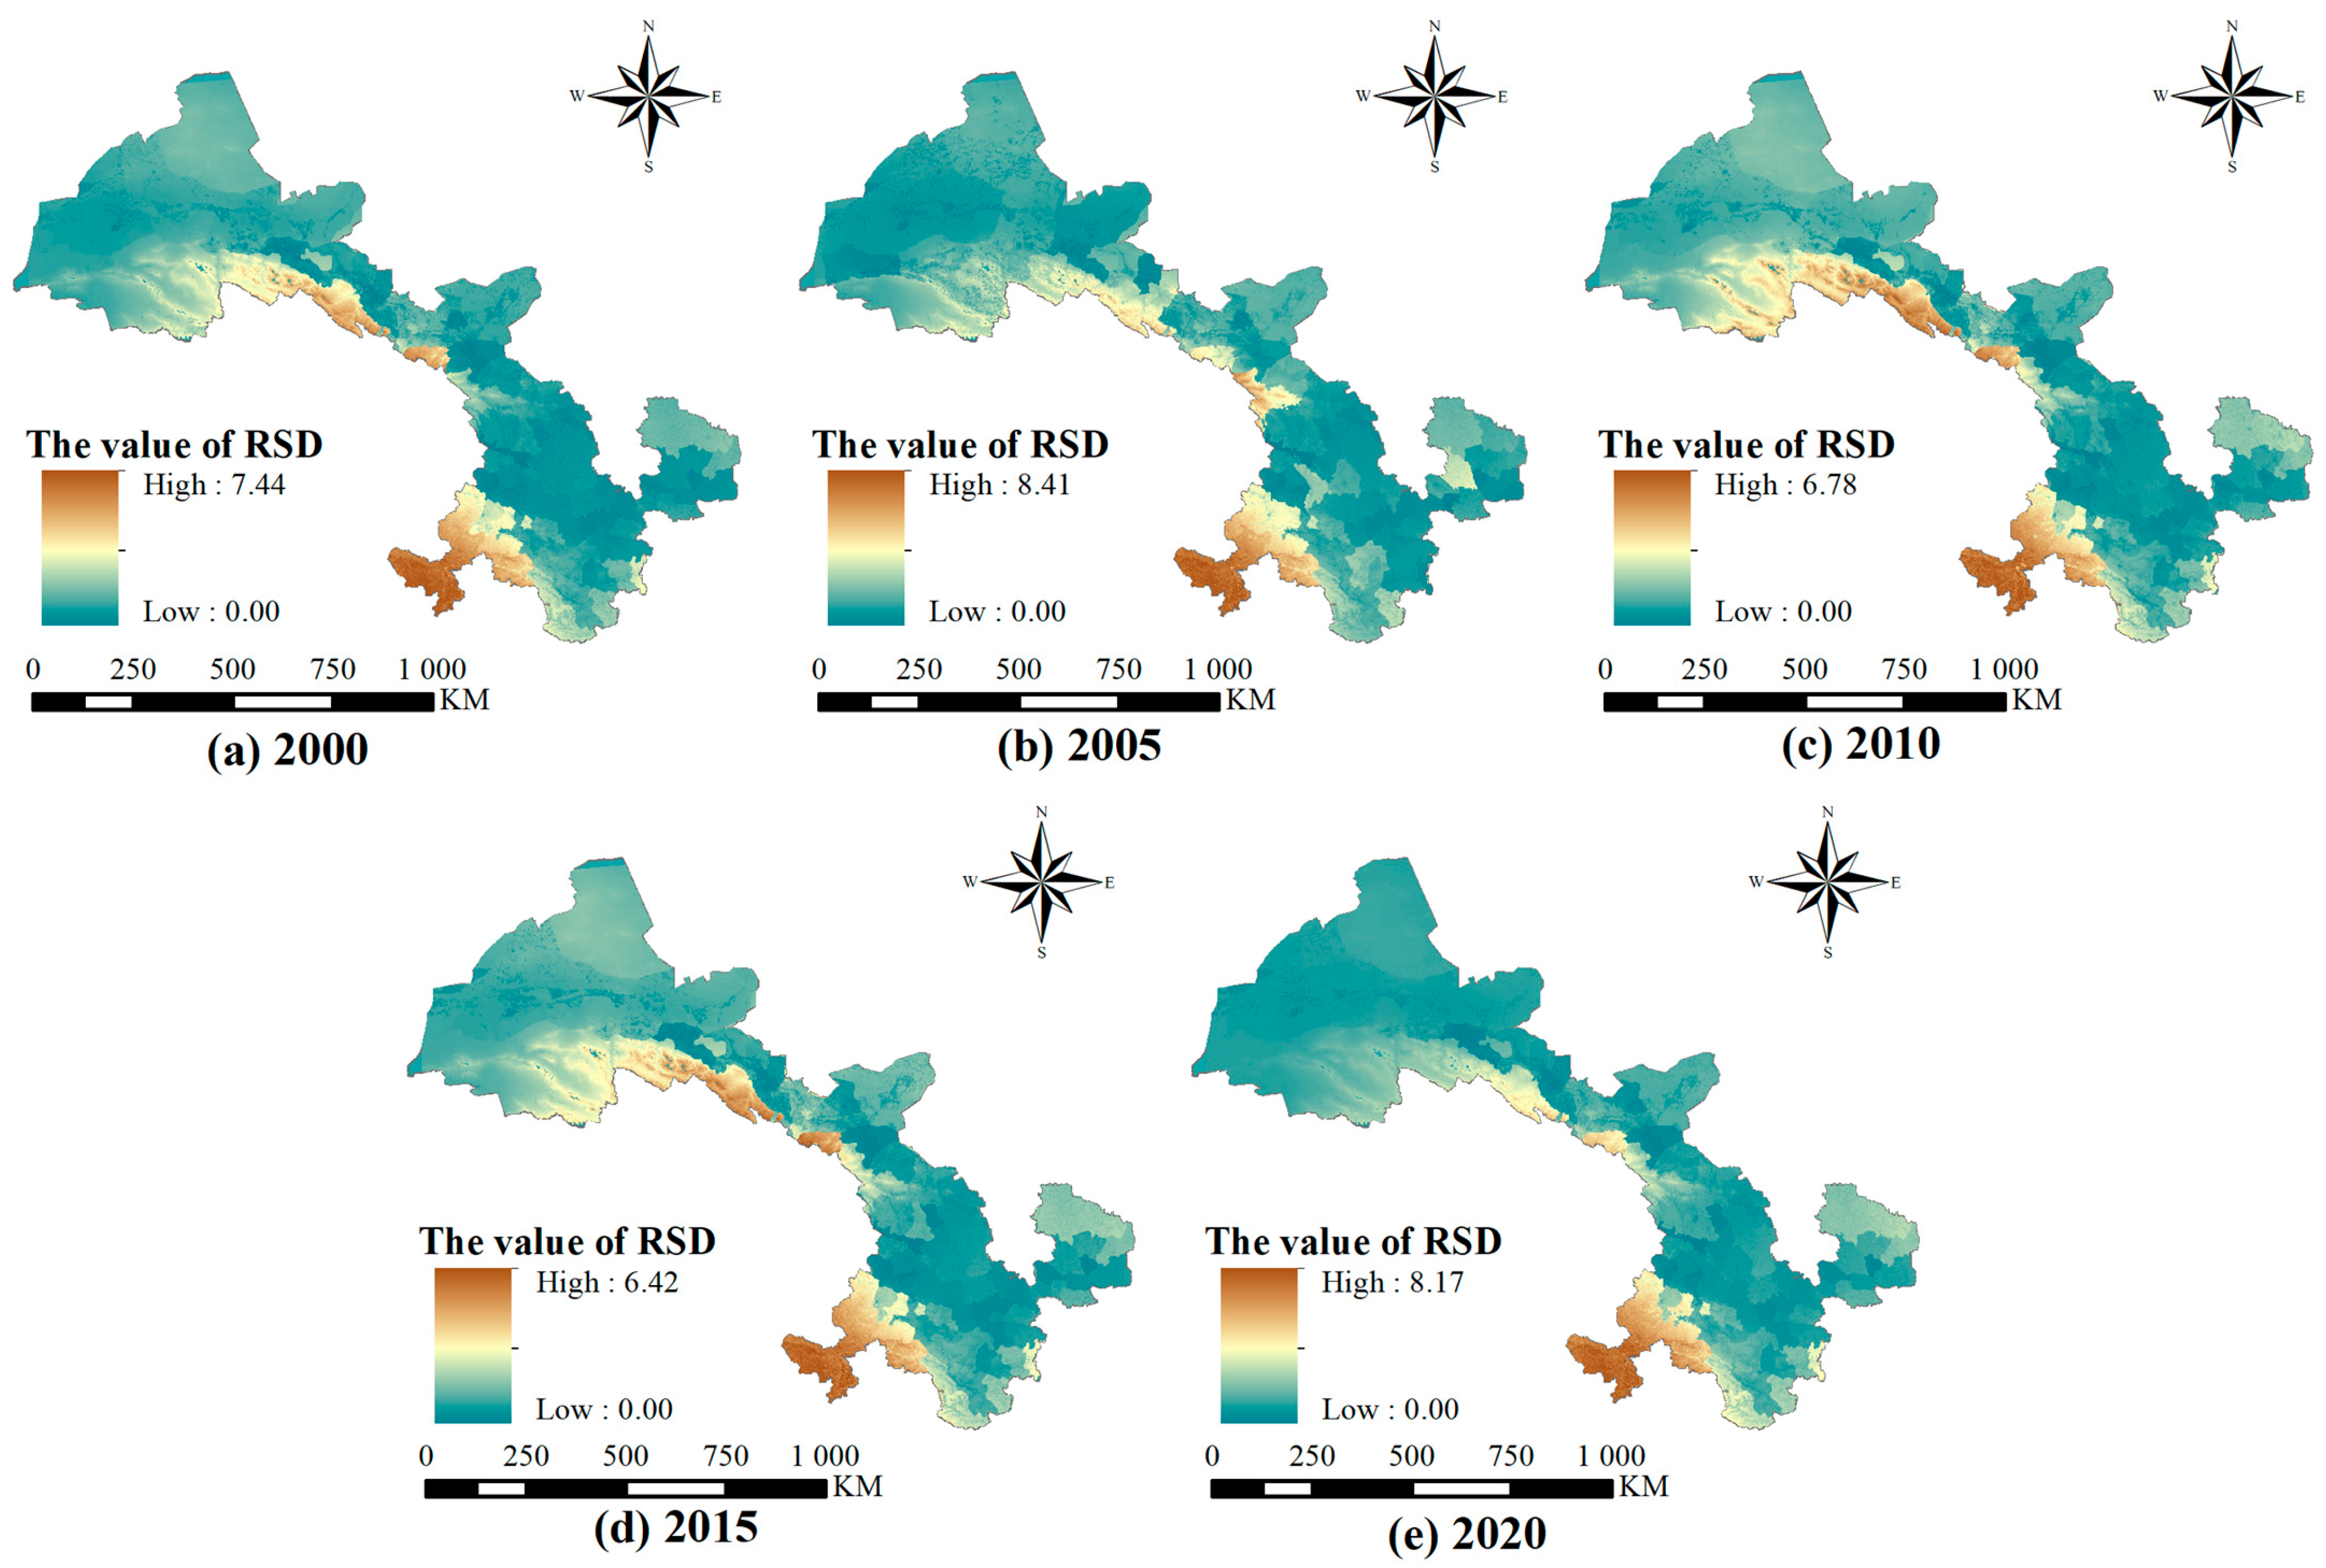
Based on the assessment of annual water conservation supply and demand in Gansu Province during the study period, and through the integration of a water conservation carrying capacity model with raster data calculations, the RSD results at the pixel scale were ultimately obtained. The specific spatial distribution is shown in
Figure 5. In the figure, deeper shades of blue-green indicate lower RSD values, suggesting a higher risk of imbalance between water conservation supply and demand in the area. Deeper shades of brown indicate that the water conservation supply significantly exceeds demand, corresponding to higher RSD values and a lower risk of supply–demand imbalance.
In 2000, the maximum RSD value per pixel in Gansu Province was 7.44. Pixels with a low risk of supply–demand imbalance were mainly concentrated in the southwestern mountainous areas of Gannan Prefecture and parts of the Qilian Mountains in the northwest. The minimum RSD values were close to 0. Such pixels were predominantly distributed in highly urbanized areas, forming a high carrying pressure belt extending northwest–southeast across central Gansu, including cities such as Jiayuguan, Zhangye, Jinchang, Wuwei, and Lanzhou, as well as a deficit zone stretching southwest–northeast in the southeast, composed of cities such as Tianshui, Pingliang, and Qingyang.
By 2020, the spatial distribution of RSD values at the pixel level had undergone significant changes compared to 2000. Although the maximum value per pixel increased to 8.17, the overall area with high-value pixels shrank and remained mainly concentrated in the southwestern Gannan Autonomous Prefecture. Meanwhile, the proportion of high RSD pixels along the Qilian Mountains in the northwest decreased noticeably, indicating an increasing pressure on water conservation capacity in this region during the study period. Human social activities have already caused certain impacts in this area. Spatially, regions with high risk of water conservation carrying capacity imbalance were concentrated around Lanzhou City. During this period, with economic growth and population concentration in urban core areas across the province, water conservation demand became highly concentrated in regions with intensive industrial and domestic water use, such as Lanzhou. As a result, deficit pixels showed a more densely clustered distribution within urban areas.
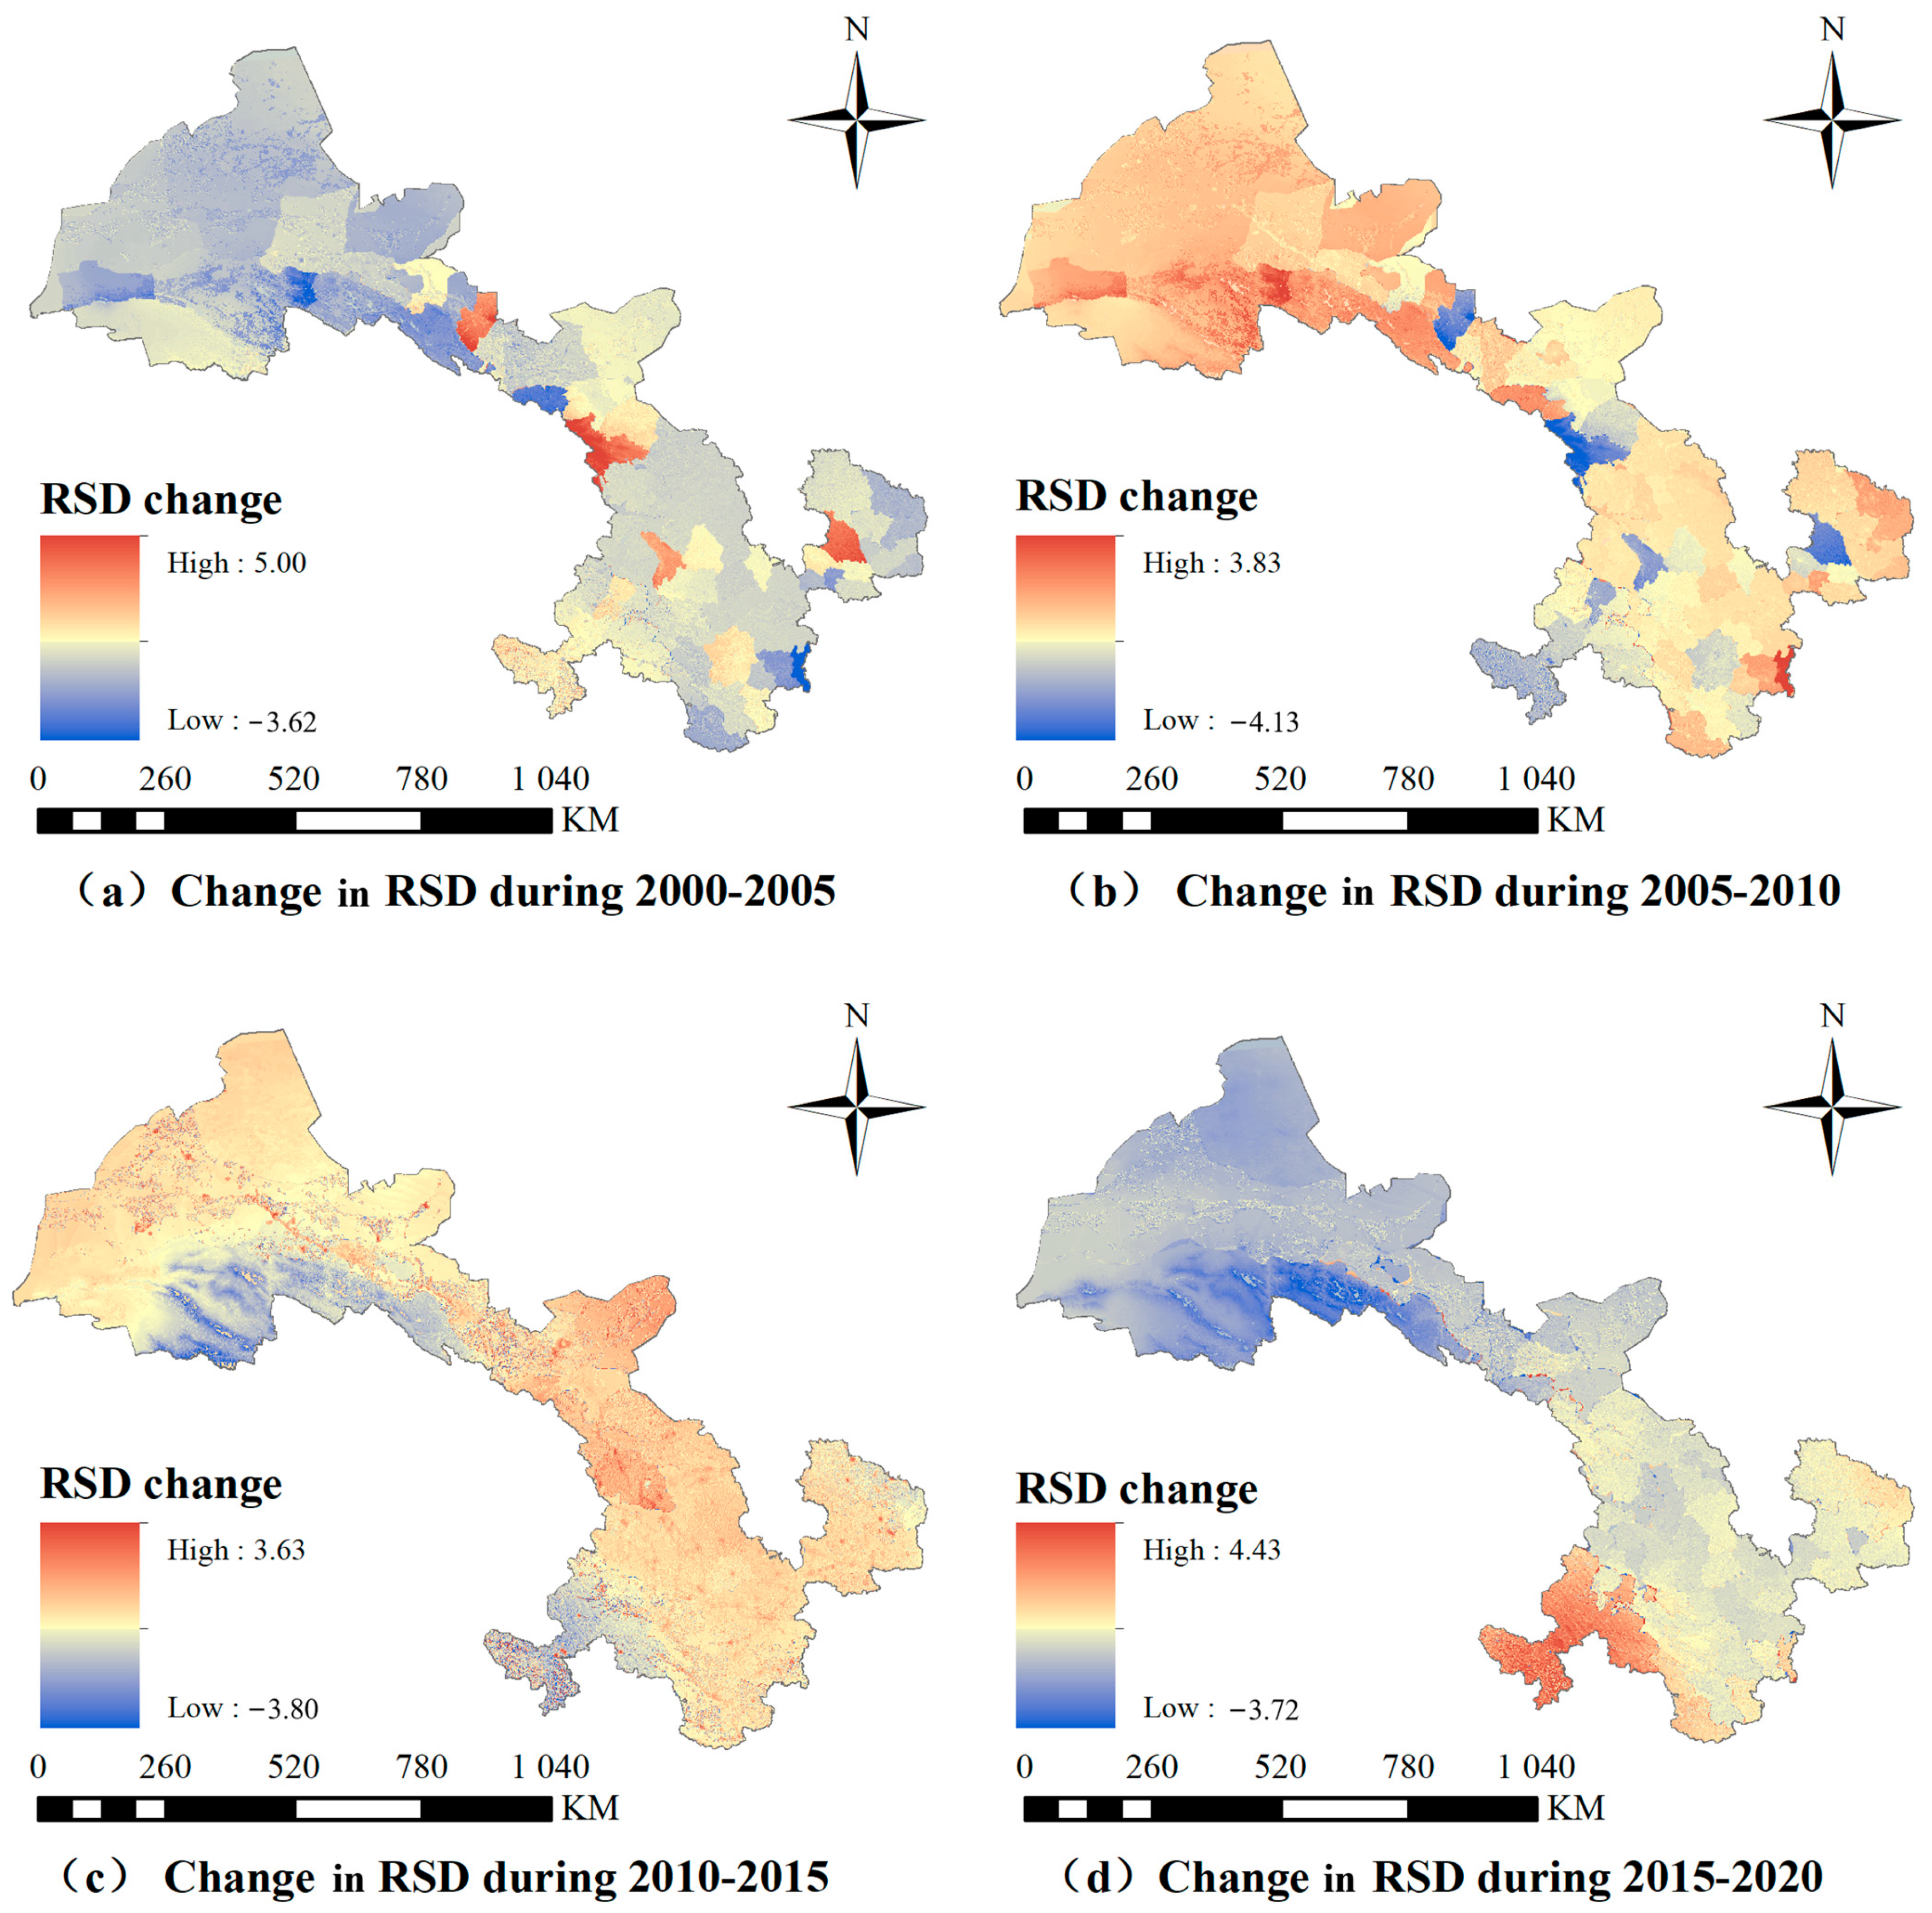
Figure 6 illustrates the changes in the RSD values of water conservation in Gansu Province between different time nodes during the study period. As shown in the figure, from 2000 to 2005, the RSD values exhibited a decreasing trend, indicating an overall aggravation of the risk of imbalance between water conservation supply and demand. A few areas with significant RSD increases were concentrated in forest-covered regions along the border between Zhangye and Wuwei cities in central Gansu. In terms of numerical changes, the maximum increase per pixel reached 5.00, while the maximum decrease was 3.62. During the periods 2005–2010 and 2010–2015, the overall RSD values in Gansu Province showed an upward trend, suggesting a mitigation of the water conservation supply–demand imbalance risk across the region during these intervals. However, consistent with earlier single time node RSD results, the Qilian Mountains region in the northwest experienced a decline in the RSD during 2010–2015, which heightened the risk of carrying capacity imbalance. From 2015 to 2020, this pattern continued: northern and central Gansu generally showed decreased RSD values, while the southern part—except for significant increases in Gannan Prefecture—only registered minor improvements. The maximum increase per pixel reached 4.43, while the maximum decrease was 3.72. These findings indicate that during this period, the overall supply–demand relationship of water conservation in Gansu Province faced an elevated risk of imbalance, accompanied by increased pressure on the ecological environment carrying capacity.
3.4. Spatial Aggregation and Evolution Characteristics
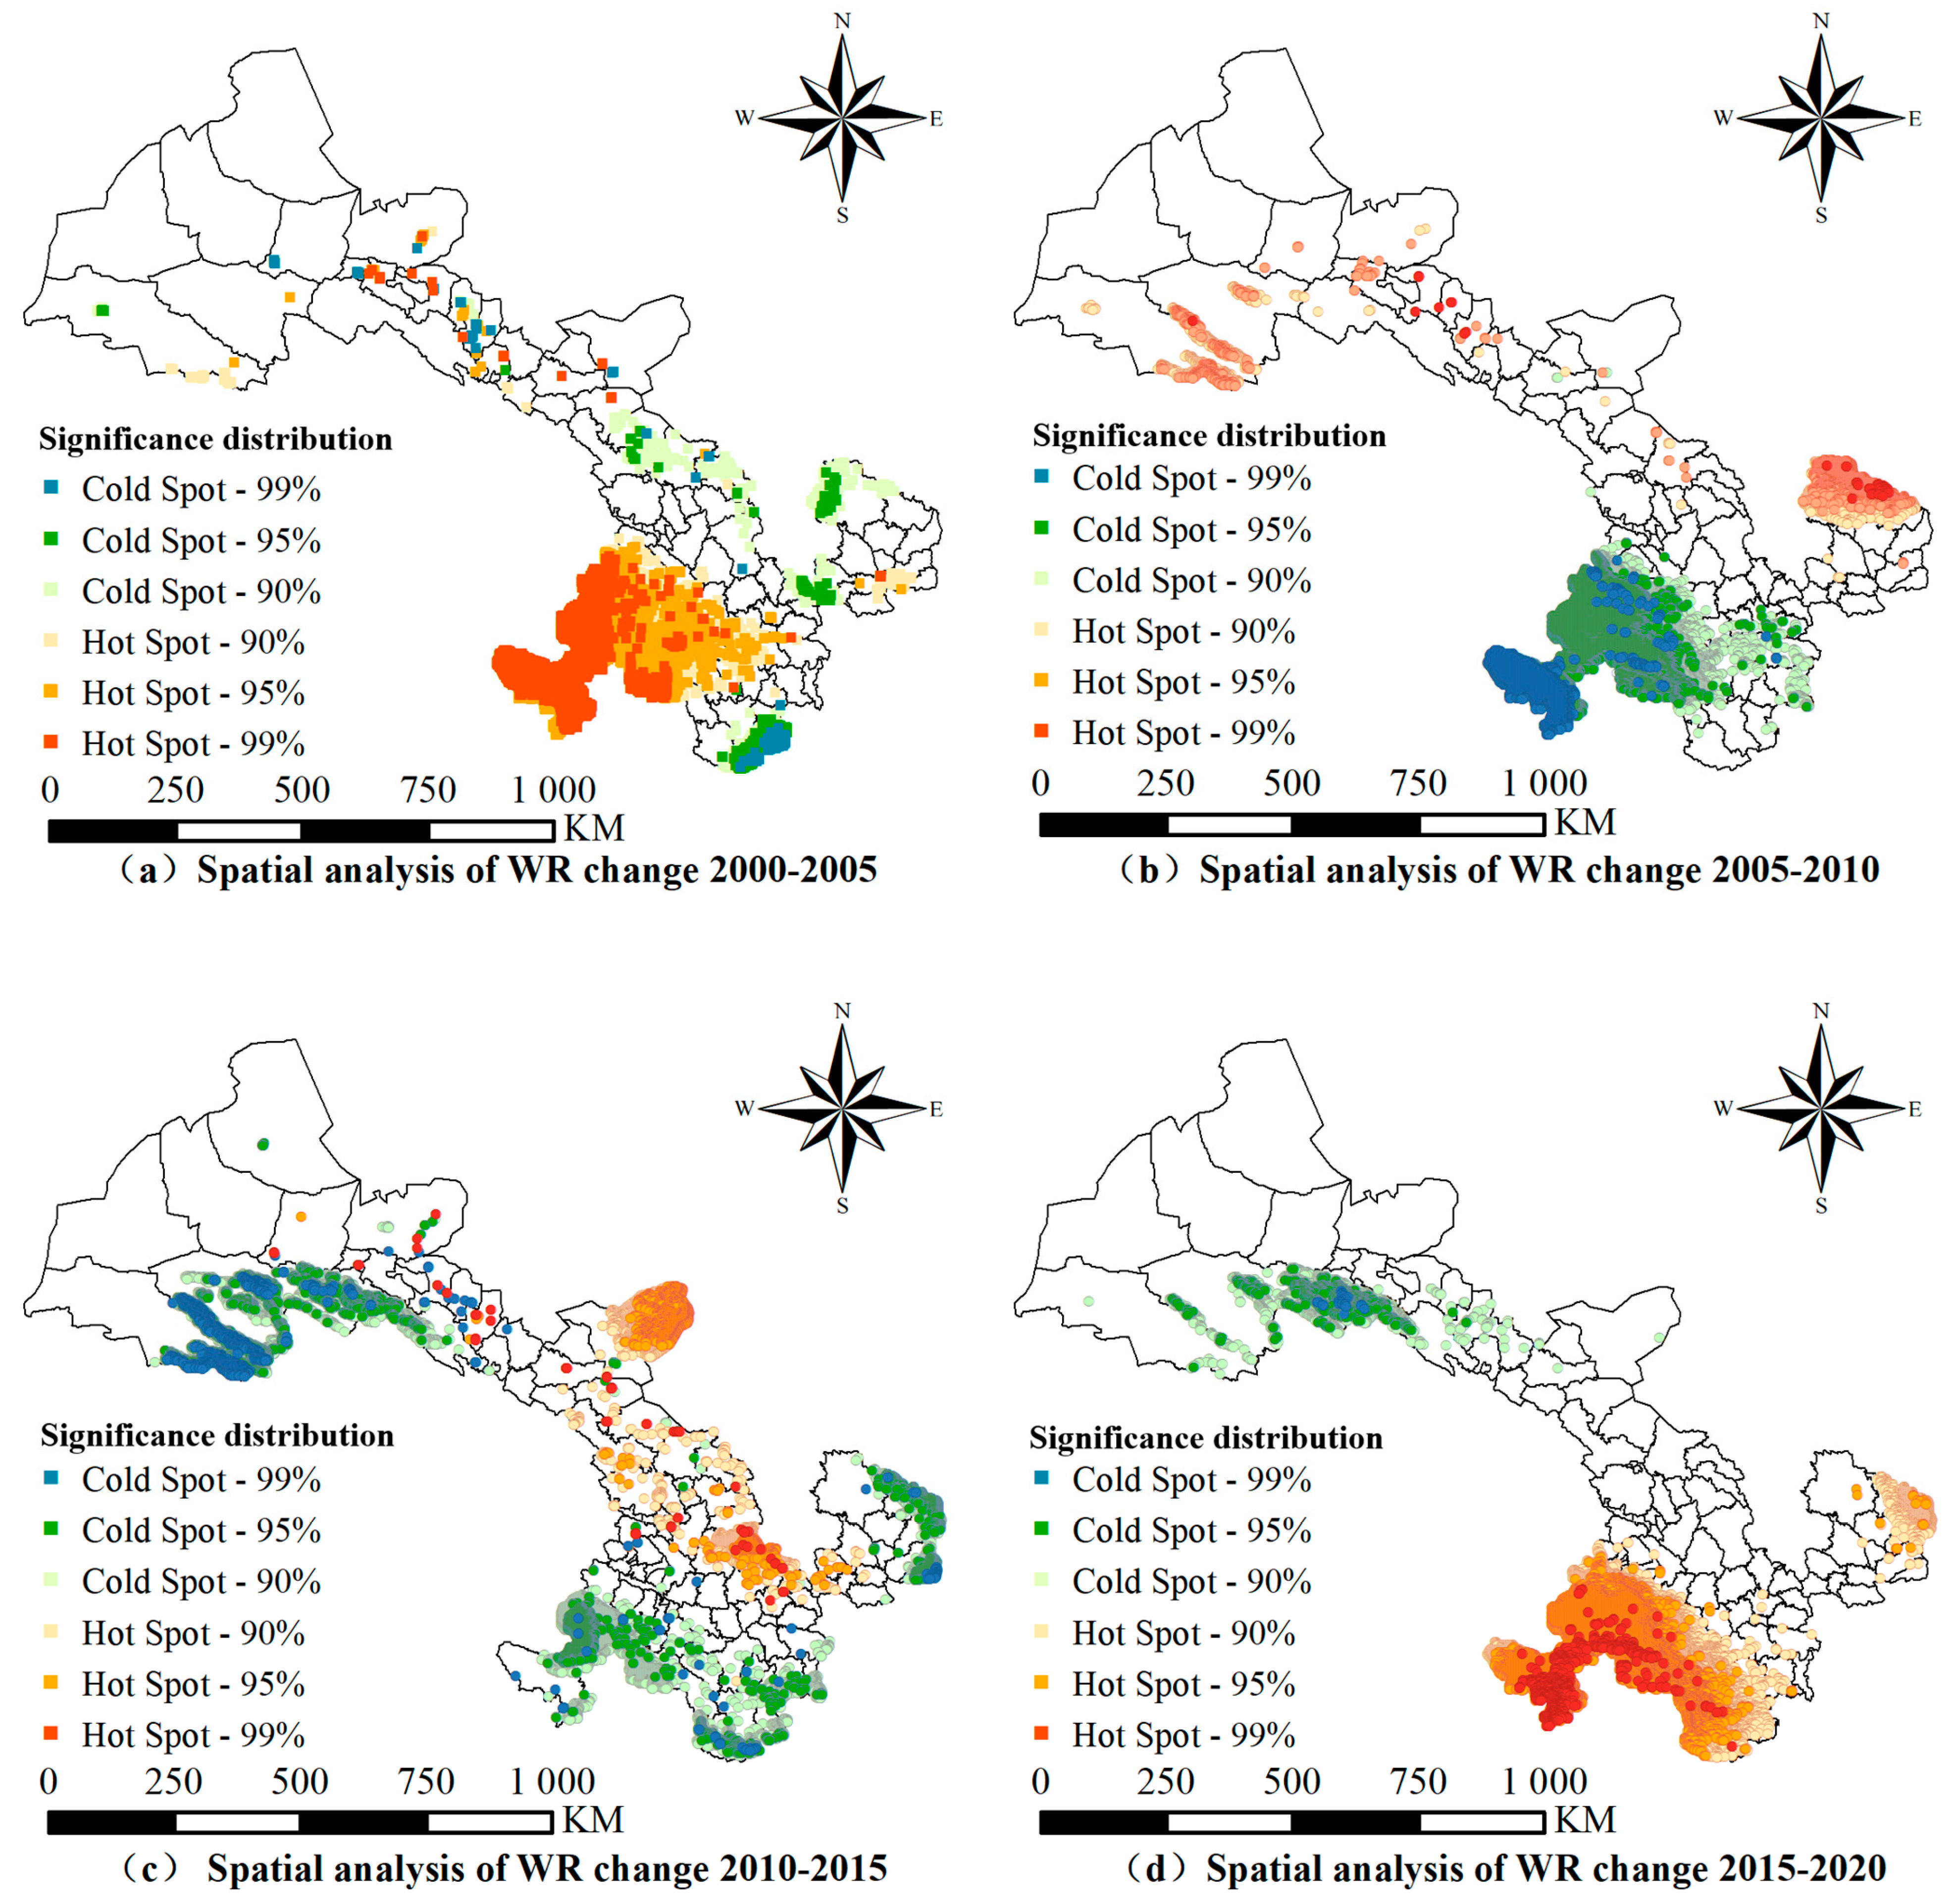
Figure 7 presents the results of the cold spot and hot spot analysis (
p < 0.01) for the changes in water conservation supply–demand surplus across various prefectures in Gansu Province during the periods 2000–2005, 2005–2010, 2010–2015, and 2015–2020. The maps reveal that the water conservation capacity of the province underwent significant dynamic changes throughout the study intervals.
During 2000–2005, no pronounced cold or hot spot clusters were observed in the central and northern parts of the province. In contrast, significant hot spot clustering was identified in Gannan Prefecture in the southwest, indicating an improvement in ecosystem-based water conservation supply and relatively high water retention capacity in this region. Conversely, cold spot clusters emerged along the border between Longnan Prefecture in southern Gansu and Sichuan Province, suggesting a declining trend in local water conservation capacity. Notably, in the Hexi Corridor—a region typically characterized by water supply–demand deficits—the spatial pattern of change was heterogeneous, with both cold and hot spots coexisting without a clear aggregated trend. From 2005 to 2010, marked spatial differentiation appeared across the province. Some areas in the northern Qilian Mountains exhibited linear hot spot clusters, reflecting recovered ecosystem conditions and enhanced water conservation capacity during this period. Meanwhile, Gannan Prefecture showed concentrated cold spot clusters, signaling elevated hydro-ecological risks likely due to the degradation of natural ecosystems such as forests and grasslands, which led to a decline in water conservation services. In eastern Gansu, counties including Huanxian and Huachi in Qingyang City displayed hot spot clustering. Between 2010 and 2015, degradation of water conservation services became more evident along the Qilian Mountains in northwestern Gansu, where significant loss of water supply capacity intensified local hydro-ecological risks. Concurrently, cold spot clusters were widespread in southern Gannan Prefecture and eastern Qingyang City. In the period 2015–2020, ecological conservation initiatives such as the protection of the Yellow River source area contributed to the recovery of ecosystem functions and water conservation services in Gannan and Qingyang. However, ecological risks remained severe in the Qilian Mountains region, where cold spots were predominantly distributed around the junction of Jiuquan, Jiayuguan, and Zhangye cities. Moreover, a spreading trend of degradation was observed along the Hexi Corridor toward central Zhangye, including counties such as Gaotai and Minze.
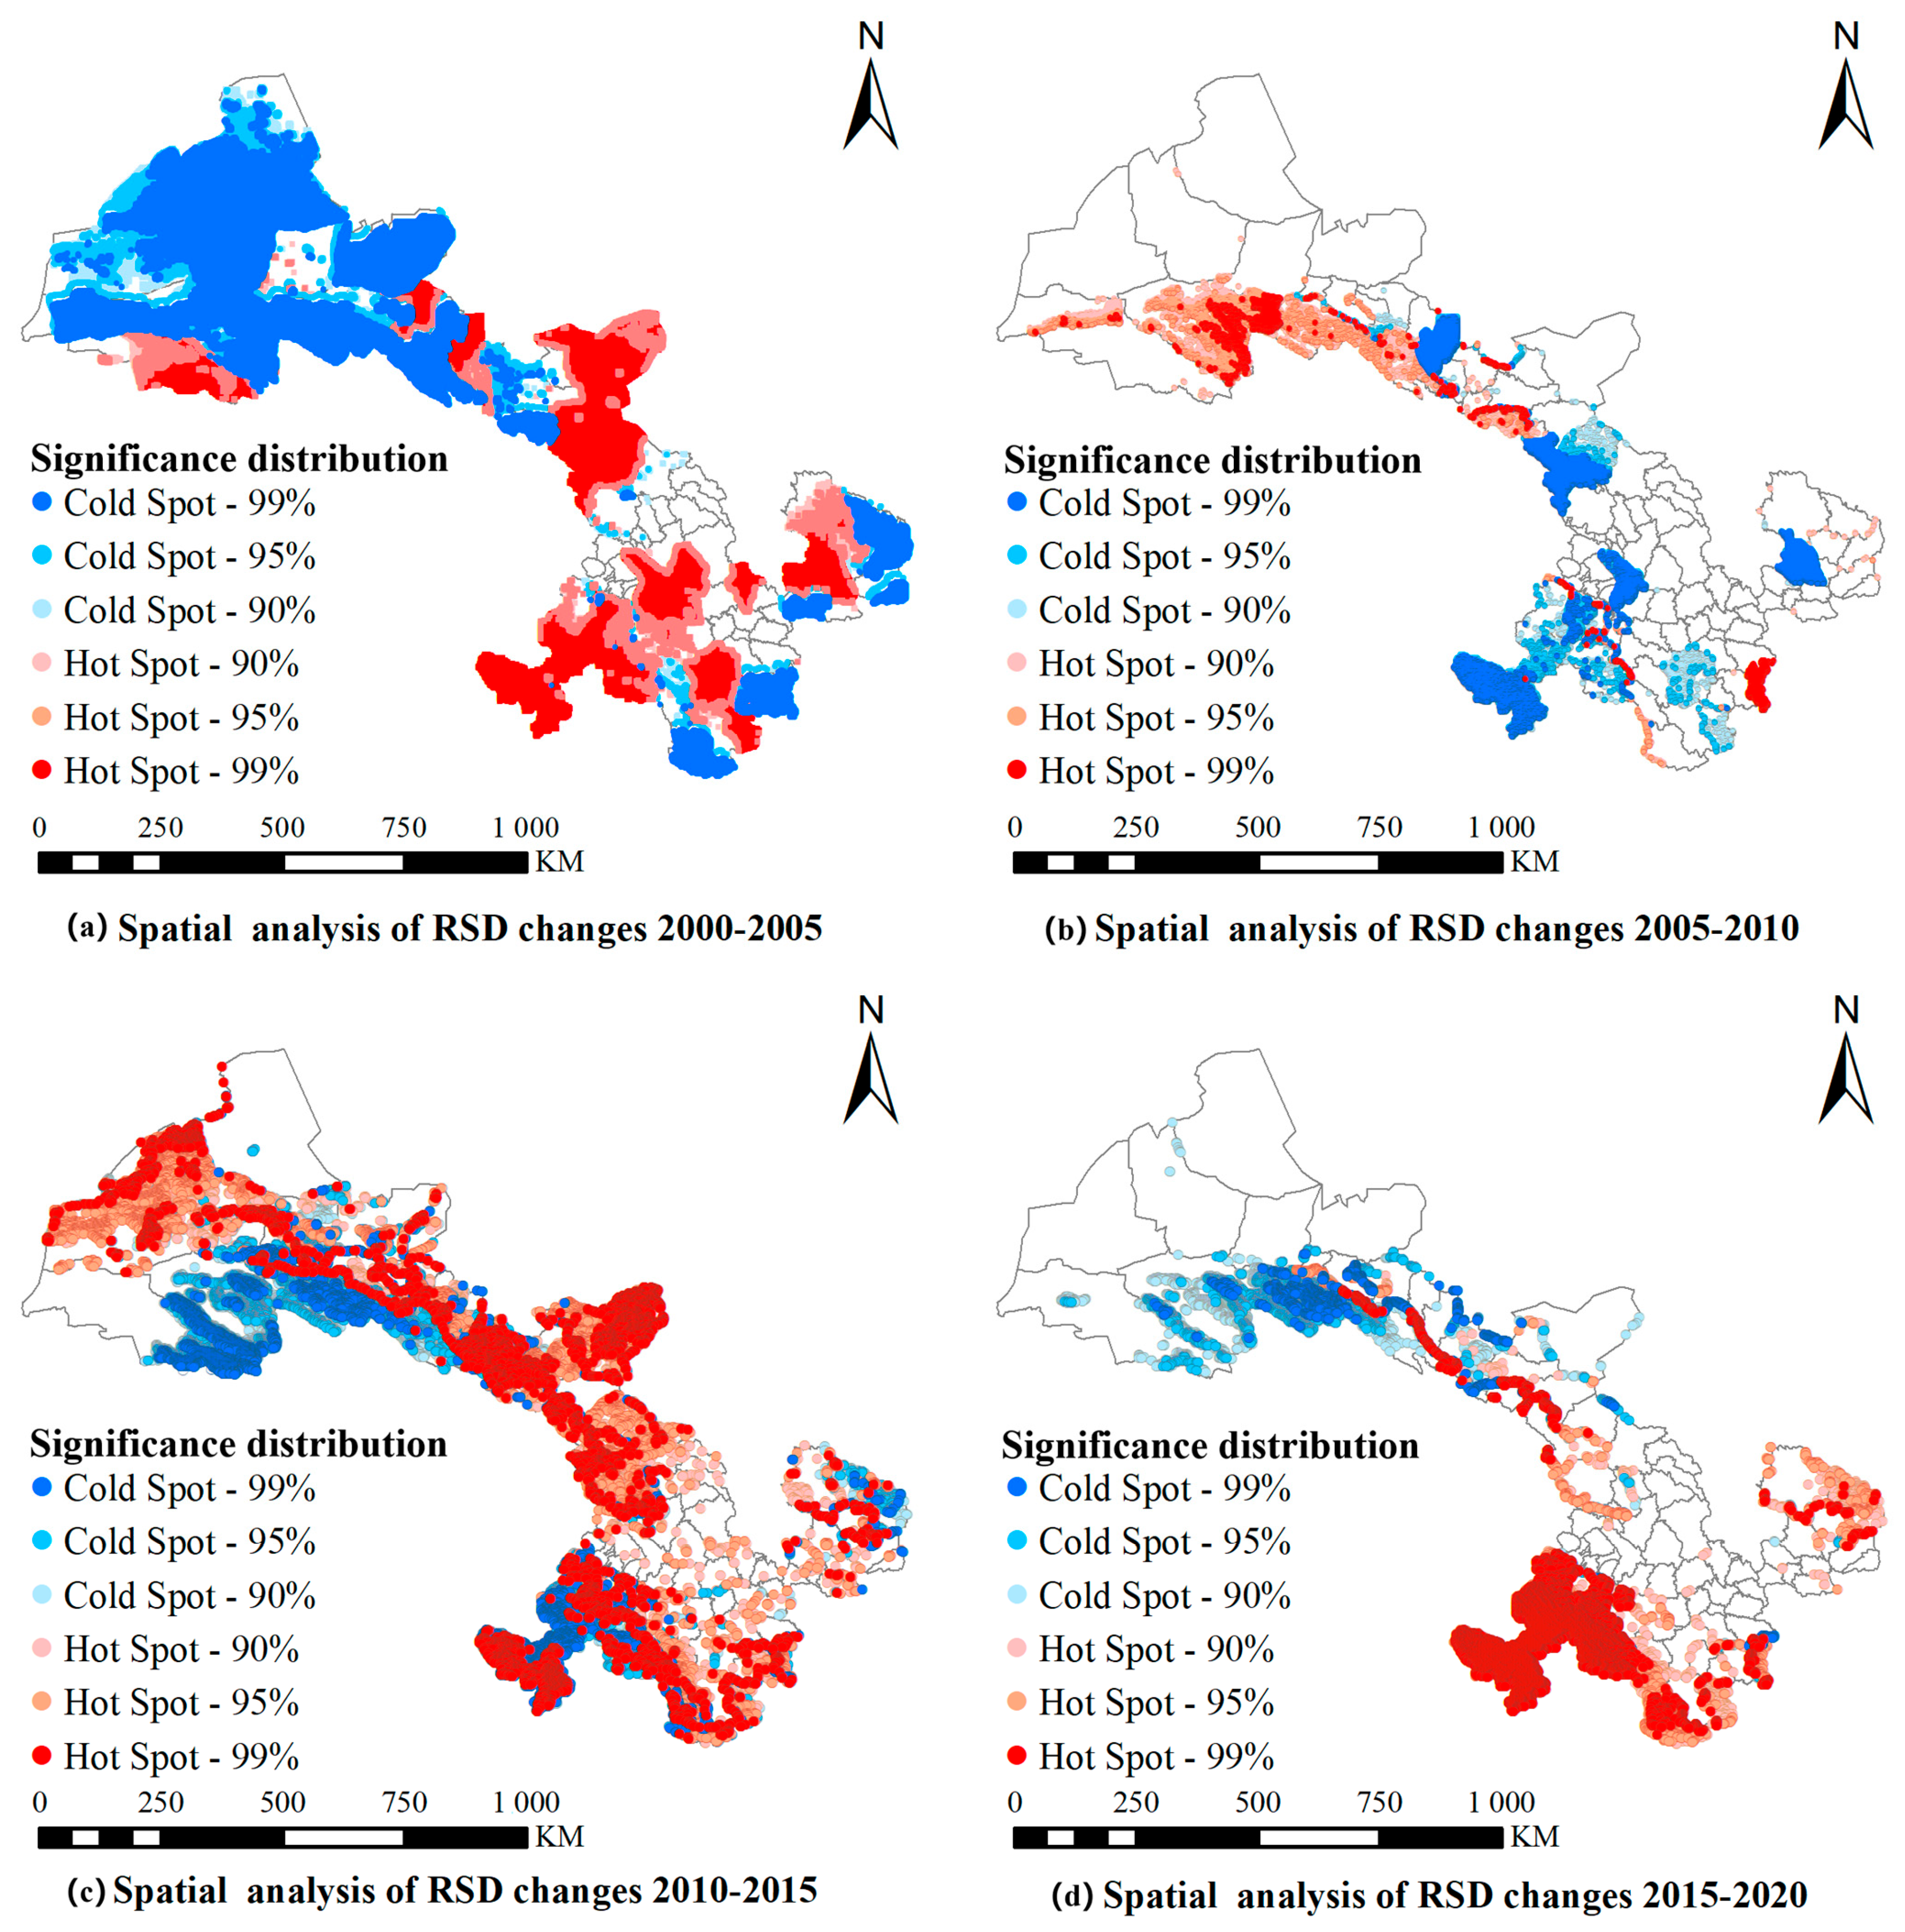
Spatial aggregation characteristics of the RSD (
p < 0.05) changes in Gansu Province at five-year intervals were also analyzed, and the results are shown in
Figure 8. The maps indicate that during 2000–2005, a distinct “hot in the south, cold in the north” spatial clustering pattern emerged. Hot spots were concentrated in Wuwei, Qingyang, Gannan, and Dingxi, while cold spots were predominantly observed in arid northern cities such as Jiuquan, Zhangye, and Jiayuguan, where desert landscapes cover a large proportion of the area.
From 2005 to 2010, spatial clustering became more concentrated. Hot spots were mainly distributed along the northern Qilian Mountains, whereas cold spots appeared in the western counties of Wuwei and the western part of Gannan. During 2010–2015, hot spot clustering of the RSD became dominant and was widely distributed across most regions of Gansu. In contrast, cold spots were identified in the Qilian Mountains area in the northwest. By 2015–2020, the spatial evolution of the RSD showed clearer patterns. Consistent with numerical trends, hot spots were primarily clustered in the southwestern Gannan region. Meanwhile, cold spots in the Qilian Mountains shifted southeastward, expanding into Jiayuguan and northwestern Zhangye. This spatiotemporal aggregation pattern of the RSD aligns with the trajectory of urban development in Gansu Province. The population is largely concentrated in central and western cities such as Lanzhou, Tianshui, and Wuwei. Population growth and urban expansion have increased the demand for water conservation services from surrounding ecosystems. However, increased emphasis on ecological protection—particularly given Gansu’s role as a key conservation area for the source region of the Yellow River—has led to the implementation of afforestation and desert restoration projects. These efforts have contributed to partially alleviating pressure on water conservation capacity.
4. Discussion
4.1. Urban Expansion and Regional Water Conservation Carrying Capacity Risks
This study evaluated long-term water yield and conservation dynamics in Gansu Province. Model validation was performed through cross-comparison with official hydrological data and published research. The estimated water conservation volume showed a relative error of 5–15% when compared with surface runoff and total water resources reported in the Gansu Water Resources Bulletin (2000–2020), meeting the required accuracy standards. Spatially, the results align with Pu et al. [
32], who identified a “high in the northwest, low in the southeast” pattern in ecosystem service supply in the Qilian Mountains—consistent with the concentration of high water conservation values in the northwestern part of the region, thereby supporting the spatial credibility.
Assessment of the spatial pattern of water conservation supply and demand in Gansu Province reveals a prominent coexistence of water scarcity and spatial mismatch across the region, with supply–demand deficits concentrated primarily in central urban areas such as Lanzhou and Tianshui. Continued population growth and industrial agglomeration have further intensified water resource competition in these regions, increasing the risk of systemic overload in aquatic ecosystems. Rapid urbanization has directly altered regional ecological structure through the encroachment of construction land on natural ecological spaces such as grasslands and wetlands, resulting in surface hardening, reduced rainwater infiltration, and significantly diminished natural water conservation functionality. This is particularly evident in the Hexi Corridor and central Longzhong region, where urban expansion not only reduces ecological water allocation but also exacerbates local water shortages through rising domestic and industrial consumption. Land use change analyses indicate that between 2000 and 2020, built-up expansion in regional centers such as Lanzhou involved substantial conversion of surrounding cropland and grassland, directly contributing to the decline in regional water conservation capacity and aggravating supply–demand imbalance and spatial mismatch.
Urban expansion not only consumes ecological space directly but also imposes multi-faceted risks on regional water conservation carrying capacity by altering hydrological processes and increasing water demand. To mitigate water supply–demand conflicts in Gansu, it is essential to strictly delineate urban development boundaries and aquatic ecological protection redlines within territorial spatial planning, thereby achieving coordinated development between urbanization and sustainable water resource utilization. Recent trends in regional water conservation research emphasize moving beyond single-dimensional supply-side assessments toward coupled human–water system analysis, particularly in arid and semi-arid regions like Gansu. There is growing focus on the spatial optimization of land use and dynamic zoning of ecological functions to mitigate urbanization pressures. In response, adaptive strategies are increasingly combining remote sensing-based early warning systems with land use regulation—such as strictly delineating urban growth boundaries and aquatic ecological protection redlines within territorial spatial planning. Furthermore, the integration of nature-based solutions into urban and watershed planning is considered critical to enhancing infiltration and restoring hydrological regulation capacity. Implementing such integrative approaches will be essential to achieving coordinated development between urbanization and sustainable water resource utilization in water-stressed regions.
4.2. Water Ecological Security Risk Management Recommendations
Based on the spatial analysis of water conservation supply and demand in Gansu Province, the ecological security pattern in the Qilian Mountains region has undergone significant fluctuations, with a continuous decline in water conservation capacity observed between 2010 and 2020. Concurrently, Gannan Prefecture in the southwest also faced severe ecological degradation risks from 2005 to 2015. Growing water demand in major cities along the Hexi Corridor has further intensified pressures on the provincial water–ecological security system. To address ecological risks stemming from declining water conservation capacity and intensified human activities, an integrated management system combining zonal regulation, dynamic monitoring, and risk early warning should be established. The following recommendations are proposed:
Firstly, implement differentiated land use management strategies. In key water conservation areas such as the Qilian Mountains and Gannan Plateau, strictly control industrial and mining activities as well as cropland expansion, and promote grazing withdrawal, grassland restoration, and cropland-to-forest conversion to maintain the proportion of ecological land. In regions with prominent water supply–demand conflicts such as the Hexi Corridor, delineate urban growth boundaries and limit the proportion of impervious surfaces to prevent further loss of ecological land.
Secondly, optimize the spatial distribution of population and industry. In major cities such as Lanzhou and Tianshui enforce strict total water use redlines and guide water-intensive industries to relocate to nodes with relatively abundant water resources, such as Zhangye and Wuwei. In ecologically fragile areas like the Loess Plateau of central Gansu, implement ecological migration and settlement consolidation programs.
Thirdly, establish a comprehensive ecological and environmental risk prevention system. Utilize remote sensing and other monitoring technologies to conduct real-time, multi-period surveillance of groundwater over-extraction in critical basins such as the Shiyang River and Heihe River, enabling early warning based on water level thresholds. Implement dual-control systems for both water quality and quantity along the main stem of the Yellow River in Gansu to ensure water source health and sustainability.
Particular attention should be given to regions with high water resource carrying capacity risks (RSD < 1), such as the central urban agglomerations and the Hexi Corridor. In these areas, it is essential to strengthen the dynamic assessment of water resource carrying capacity, delineate groundwater over-exploitation zones, and promote the use of reclaimed water and smart water-saving technologies. Ecological restoration in desertification-prone areas should be integrated with urban spatial planning, embedding water conservation goals into urban development policies to achieve a balance between urbanization growth and water sustainability.
4.3. Limitations and Future Research Directions
This study examines the impact of land use change on the spatial pattern of water ecological carrying capacity, with a specific focus on water conservation services. Limited by data resolution, a 1 km pixel size was adopted, which may affect the identification of fine spatial details. Furthermore, while the current assessment primarily addresses water conservation services, it does not incorporate other ecosystem functions critical to water ecological security, such as water purification and soil retention. Future research will expand the range of services evaluated and establish a more comprehensive ecosystem service assessment framework to enhance the integrated evaluation of water ecological security in Gansu Province.
In addition, as quantitative ecosystem service assessments largely rely on LUCC data, changes in land cover types directly influence the supply capacity of regional ecosystem services. Accordingly, subsequent studies will focus on the effects of land cover change on key ecological functional zones, with in-depth analysis of natural and anthropogenic driving factors—particularly the stress effects of urbanization on ecosystem health. The findings aim to provide a scientific basis and long-term strategic support for optimizing ecological resource management and implementing zoning governance for ecological security.
5. Conclusions
Based on the theory of ecosystem services, this study applied the InVEST model and ArcGIS-based geospatial analysis to quantitatively assess water conservation—a key ecosystem supply service—across Gansu Province from 2000 to 2020. From a supply–demand perspective, the study visually reveals the evolution of hydro-ecological security patterns in the region during this period. The results indicate the following:
Urban expansion has significantly exacerbated the imbalance between water supply and demand in key regions of Gansu Province. The encroachment of construction land on ecological spaces such as forests and grasslands—particularly around urban centers like Lanzhou—has reduced natural water conservation capacity, while continued population growth and industrial agglomeration have further increased local water consumption. This dual pressure has resulted in a pronounced spatial mismatch: critical ecological functional areas such as the Qilian Mountains and southern Gannan still maintain relatively high water conservation capacity, whereas urbanized zones along the Hexi Corridor, including Zhangye, Jiayuguan, and Lanzhou, have become high-risk areas for water resource carrying capacity imbalance.
Temporal analysis further indicates that water conservation services in the Qilian Mountains experienced significant degradation between 2010 and 2015. Although some recovery occurred in southern regions such as Gannan and Qingyang from 2015 to 2020, northwestern Gansu continues to face severe ecological risks, with water scarcity hot spots expanding along the Hexi Corridor.
Uncontrolled urban expansion poses multi-dimensional threats to water ecological carrying capacity by diminishing supply through land cover changes while simultaneously driving up demand. Achieving sustainable water resource management in rapidly urbanizing regions like Gansu requires strictly delineating ecological protection redlines, controlling urban boundary expansion, and optimizing the spatial distribution of population and industry.

