1. Introduction
Subalpine meadows are high-altitude grasslands that are located in the biotic zone immediately below tree line around the world [
1]. Subalpine meadows play a critical role in the ecosystem because they can provide services to buffer the effects of climate changes [
2,
3]. However, due to the vulnerability of subalpine meadow soil to increasing rainfall and anthropogenic influences, land and water managers meet unprecedented difficulties in conservation of subalpine meadow soils [
4,
5,
6]. On the eastern Tibetan Plateau, subalpine meadow soils are characterized by thin soil layer and poor stability and are prone to be eroded in terms of shallow landslide [
7]. Differing from the snowmelt-related erosion of alpine meadow soil, the shallow slide of subalpine meadow soil is generally affected by seasonal rainfall [
8]. Reports show that the subalpine meadow soils, which provide irreplaceable land-use for local animal husbandry, are undergoing expanding area of degradation in recent years [
9]. Once subalpine meadow soil erosion occurs, the grassland would be converted into black bare land which is of no value [
10]. In order to prevent the irreversible loss, shallow landslides of subalpine meadow soils should be well studied in those regions.
Various methods and approaches have been developed and applied in predicting shallow slide of meadow soils. Deterministic algorithm-based models, which directly use mathematical equations to describe relevant physical processes, are considered to be the most effective way to facilitate the management system of plateau ecological conservation. Shallow Landsliding Stability Model (SHALSTAB), a coupled steady-state runoff and infinite-slope stability model, was proposed and used to map the relative potential for shallow landsliding to reduce the incidence resulting from forest management practices across a landscape in Northern California [
11,
12]. The distributed physically based slope stability model (dSLAM) was developed for accessing forest management practices’ influence on landslide initiation and volume in a subwatershed of Carnation Creek, Vancouver Island, British Columbia [
13,
14]. The Stability Index Mapping Model (SINMAP) has proven useful for predicting shallow landslides triggered by extreme rainfall in the Serra do Mar, Sao Paulo, Brazil [
15]. The application of shallow landslide instability prediction model (SLIP) in northern Italy achieved a good agreement between the instability condition and the real date of each considered event [
16]. Transient Rainfall Infiltration and Grid-Based Regional Slope Stability (TRIGRS), which is released by USGS, demonstrated a good level of forecasting ability to assess landslide susceptibility in a frequent shallow erosion area with weathered gneiss [
17]. However, a specialized model for shallow landslides of subalpine meadow soil has yet to be published.
This study investigates the occurrence of meadow soil erosion induced by intense rainfall events in May 2021 in Xinduqiao Town, Kangding City, Sichuan Province. The TRIGRS model, along with a coupling of the TRIGRS and TOPMODEL method, was utilized to forecast shallow landslides in meadow soil. A comparative analysis and validation of the reliability of these two models were conducted using success rate curves and other methodologies. The findings of this study contribute to the development of ecological management regulations and hold significant theoretical and practical implications for soil and water conservation on the eastern Tibetan Plateau.
2. Study Area and Erosion Mechanisms
2.1. Study Area
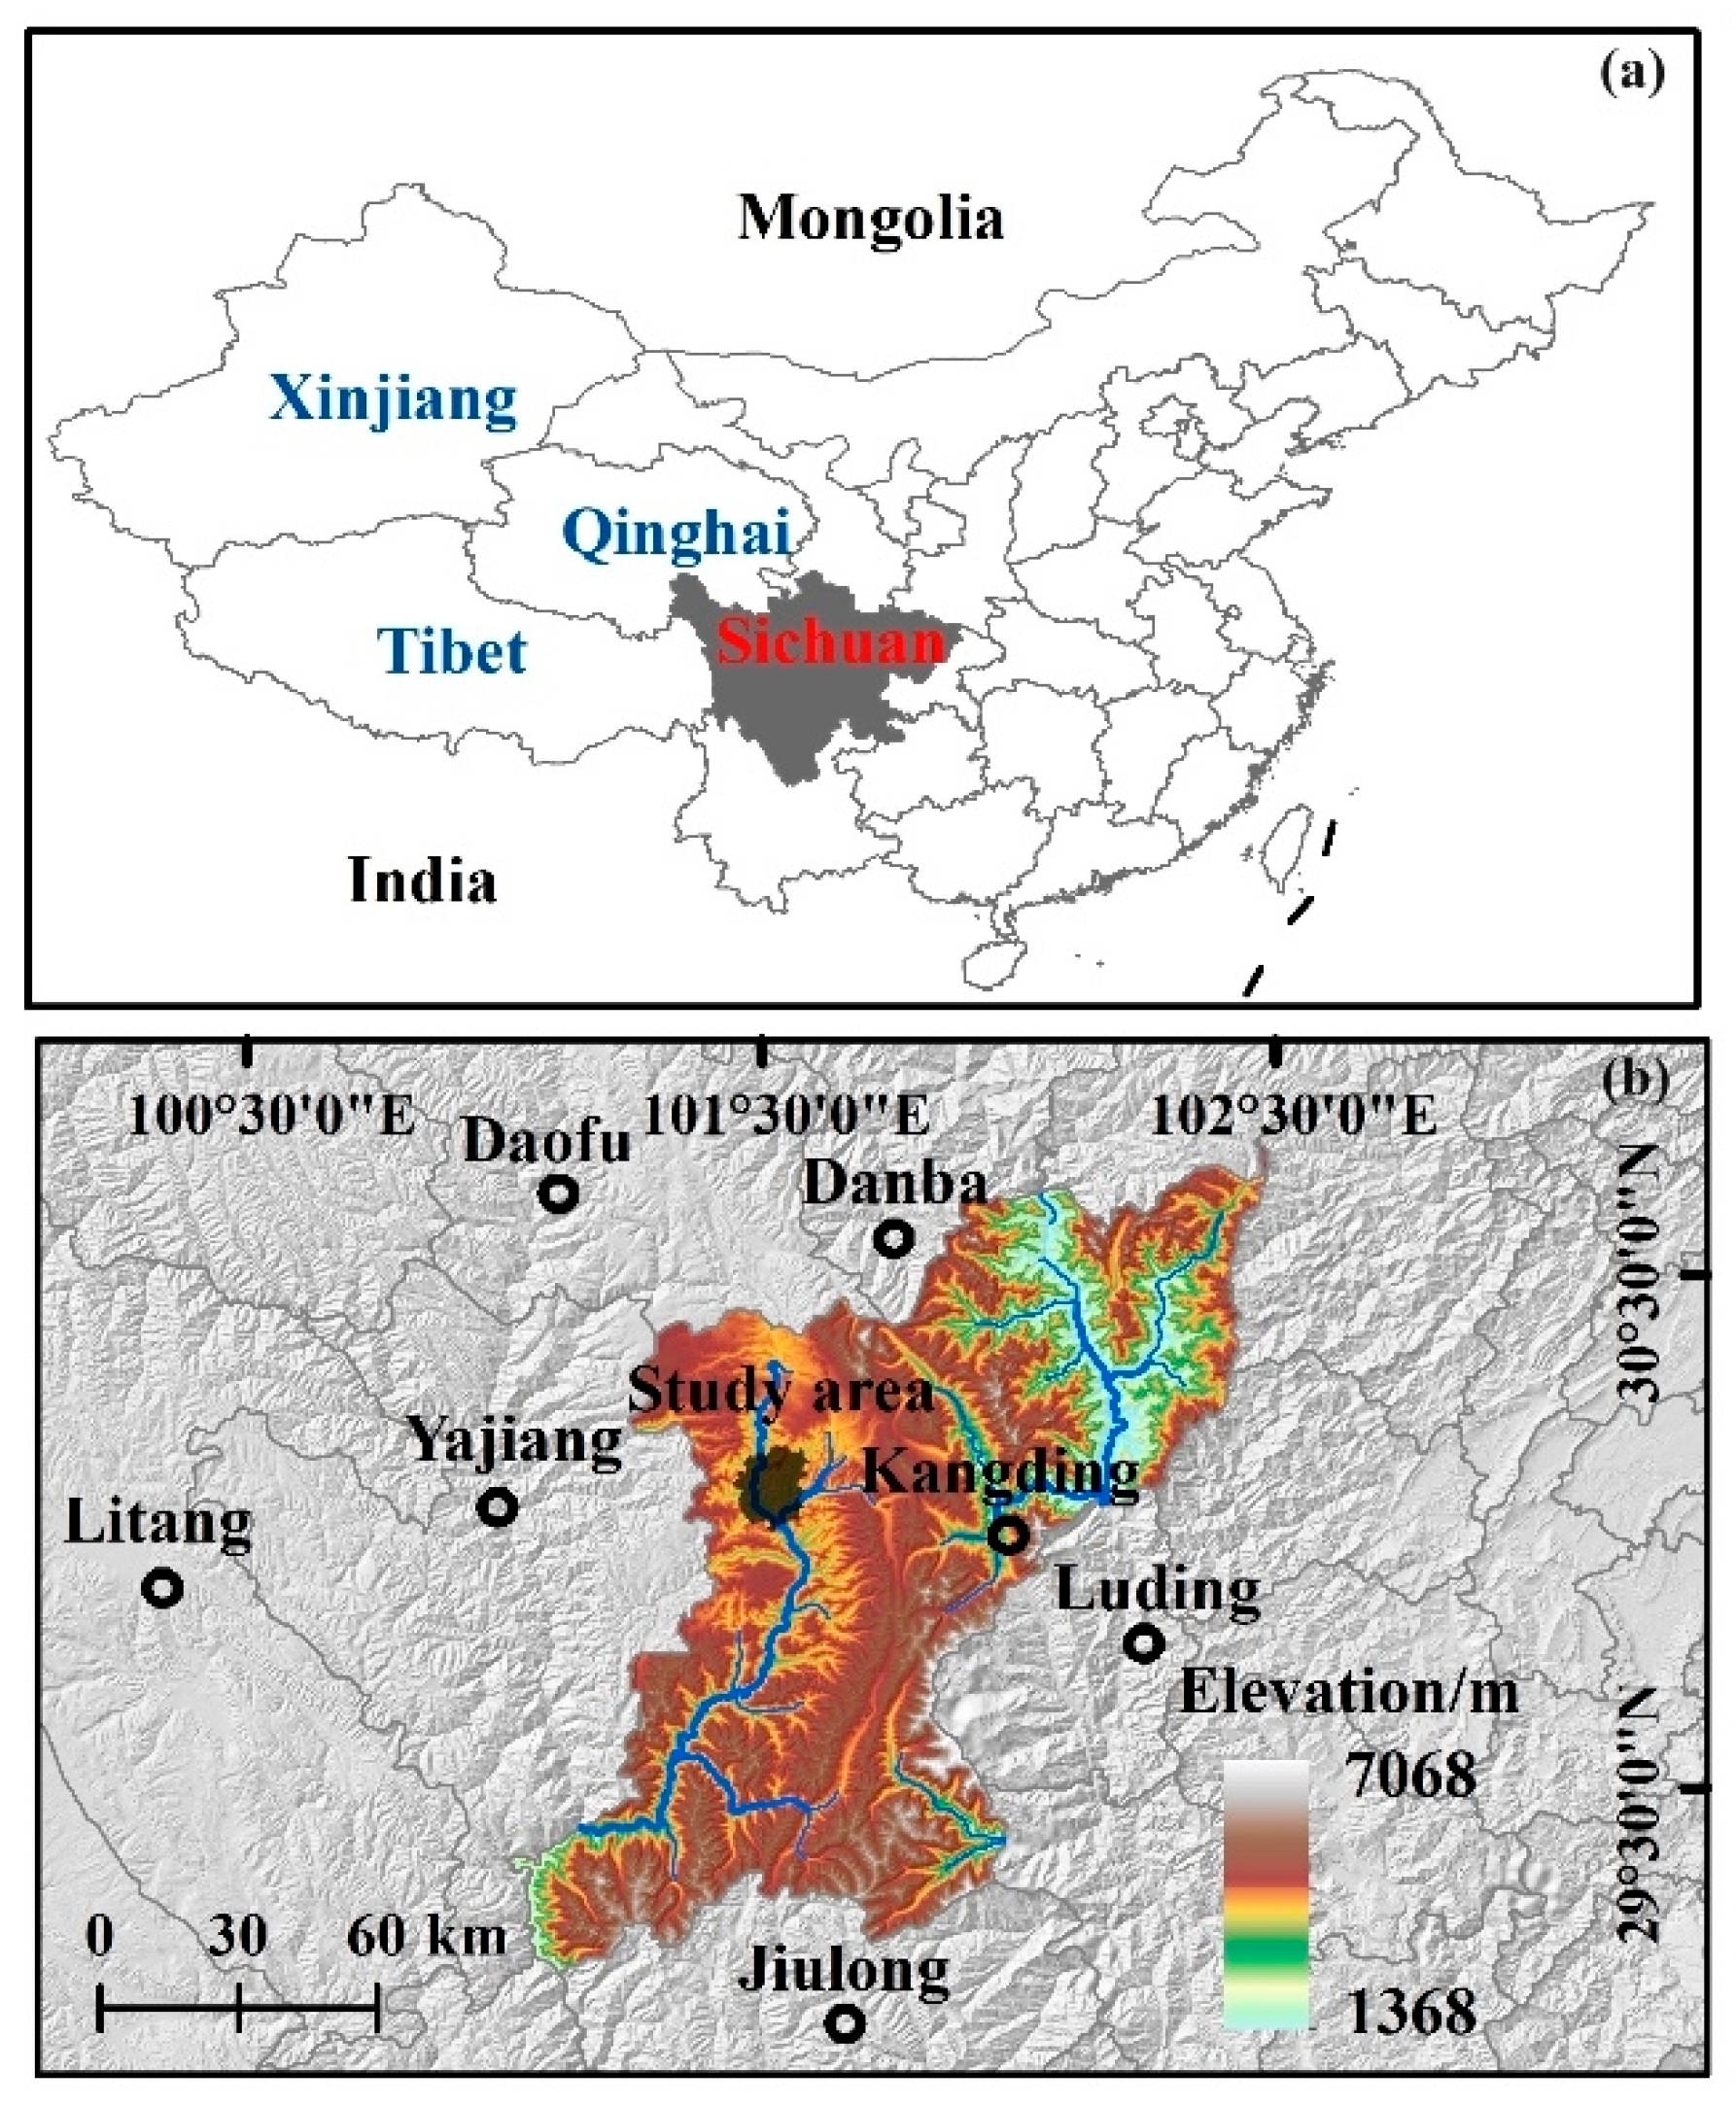
The study area (101°40′0.76″ E~101°28′17.06″ E, 30°14′04.96″ N~30°00′28.37″ N) is situated in a catchment north to the Xinduqiao County, Sichuan Province, southwestern China. As one of the five pasturing regions in China, the study area belongs to the central part of the Hengduan Mountains. Most of the residents in the study area live near the valley, and a few live scattered on the mountain. Topographically, the northern part of the study area averages 3800 m in elevation and is 300 m higher than that of the southern part. The Yalong River, intersected with branch rivers, flows southwardly through the study area and forms a “U”-shaped valley with slope gradients from 5° to 30°, see in
Figure 1. Plateau climate is typically featured in the study area. According to local meteorological data, annual temperatures range from −15 °C to 26 °C, with an average temperature of 7.1 °C. Rainfall events are concentrated from May to July, with an annual precipitation of 699.4 mm. Rainfall events during the flood season are characterized by long duration and large cumulative precipitation.
Tectonically, the study area is located on the eastern margin of the Tibetan Plateau where regional faults intersect. Triassic strata, dominated by sandy slate, is the main bedrock in the study area and is locally exposed. Quaternary sediments, including residual soil and sandy gravel, are covered by alpine meadow soil. The alpine meadow soil features high organic carbon content, porosity and permeability, whereas the bulk density is low. Shallow landslide of subalpine meadow soil is widely distributed in the study area.
According to synoptic/hourly observations contained in the USAF DATSAV3 Surface data and Federal Climate Complex Integrated Surface Data (ISD), in May 2021, Kangding City experienced intense rainfall; the single-day rainfall on 25 May reached 59.9 mm, which is the highest value since 2015. In this study, the shallow landslide of subalpine meadow soil triggered by the extreme rainfall event on 25 May 2021 in Xinduqiao County was used as the research object.
2.2. Field Prototypes and Schematic Model
A thorough field investigation covering a total survey area of approximately 414 km
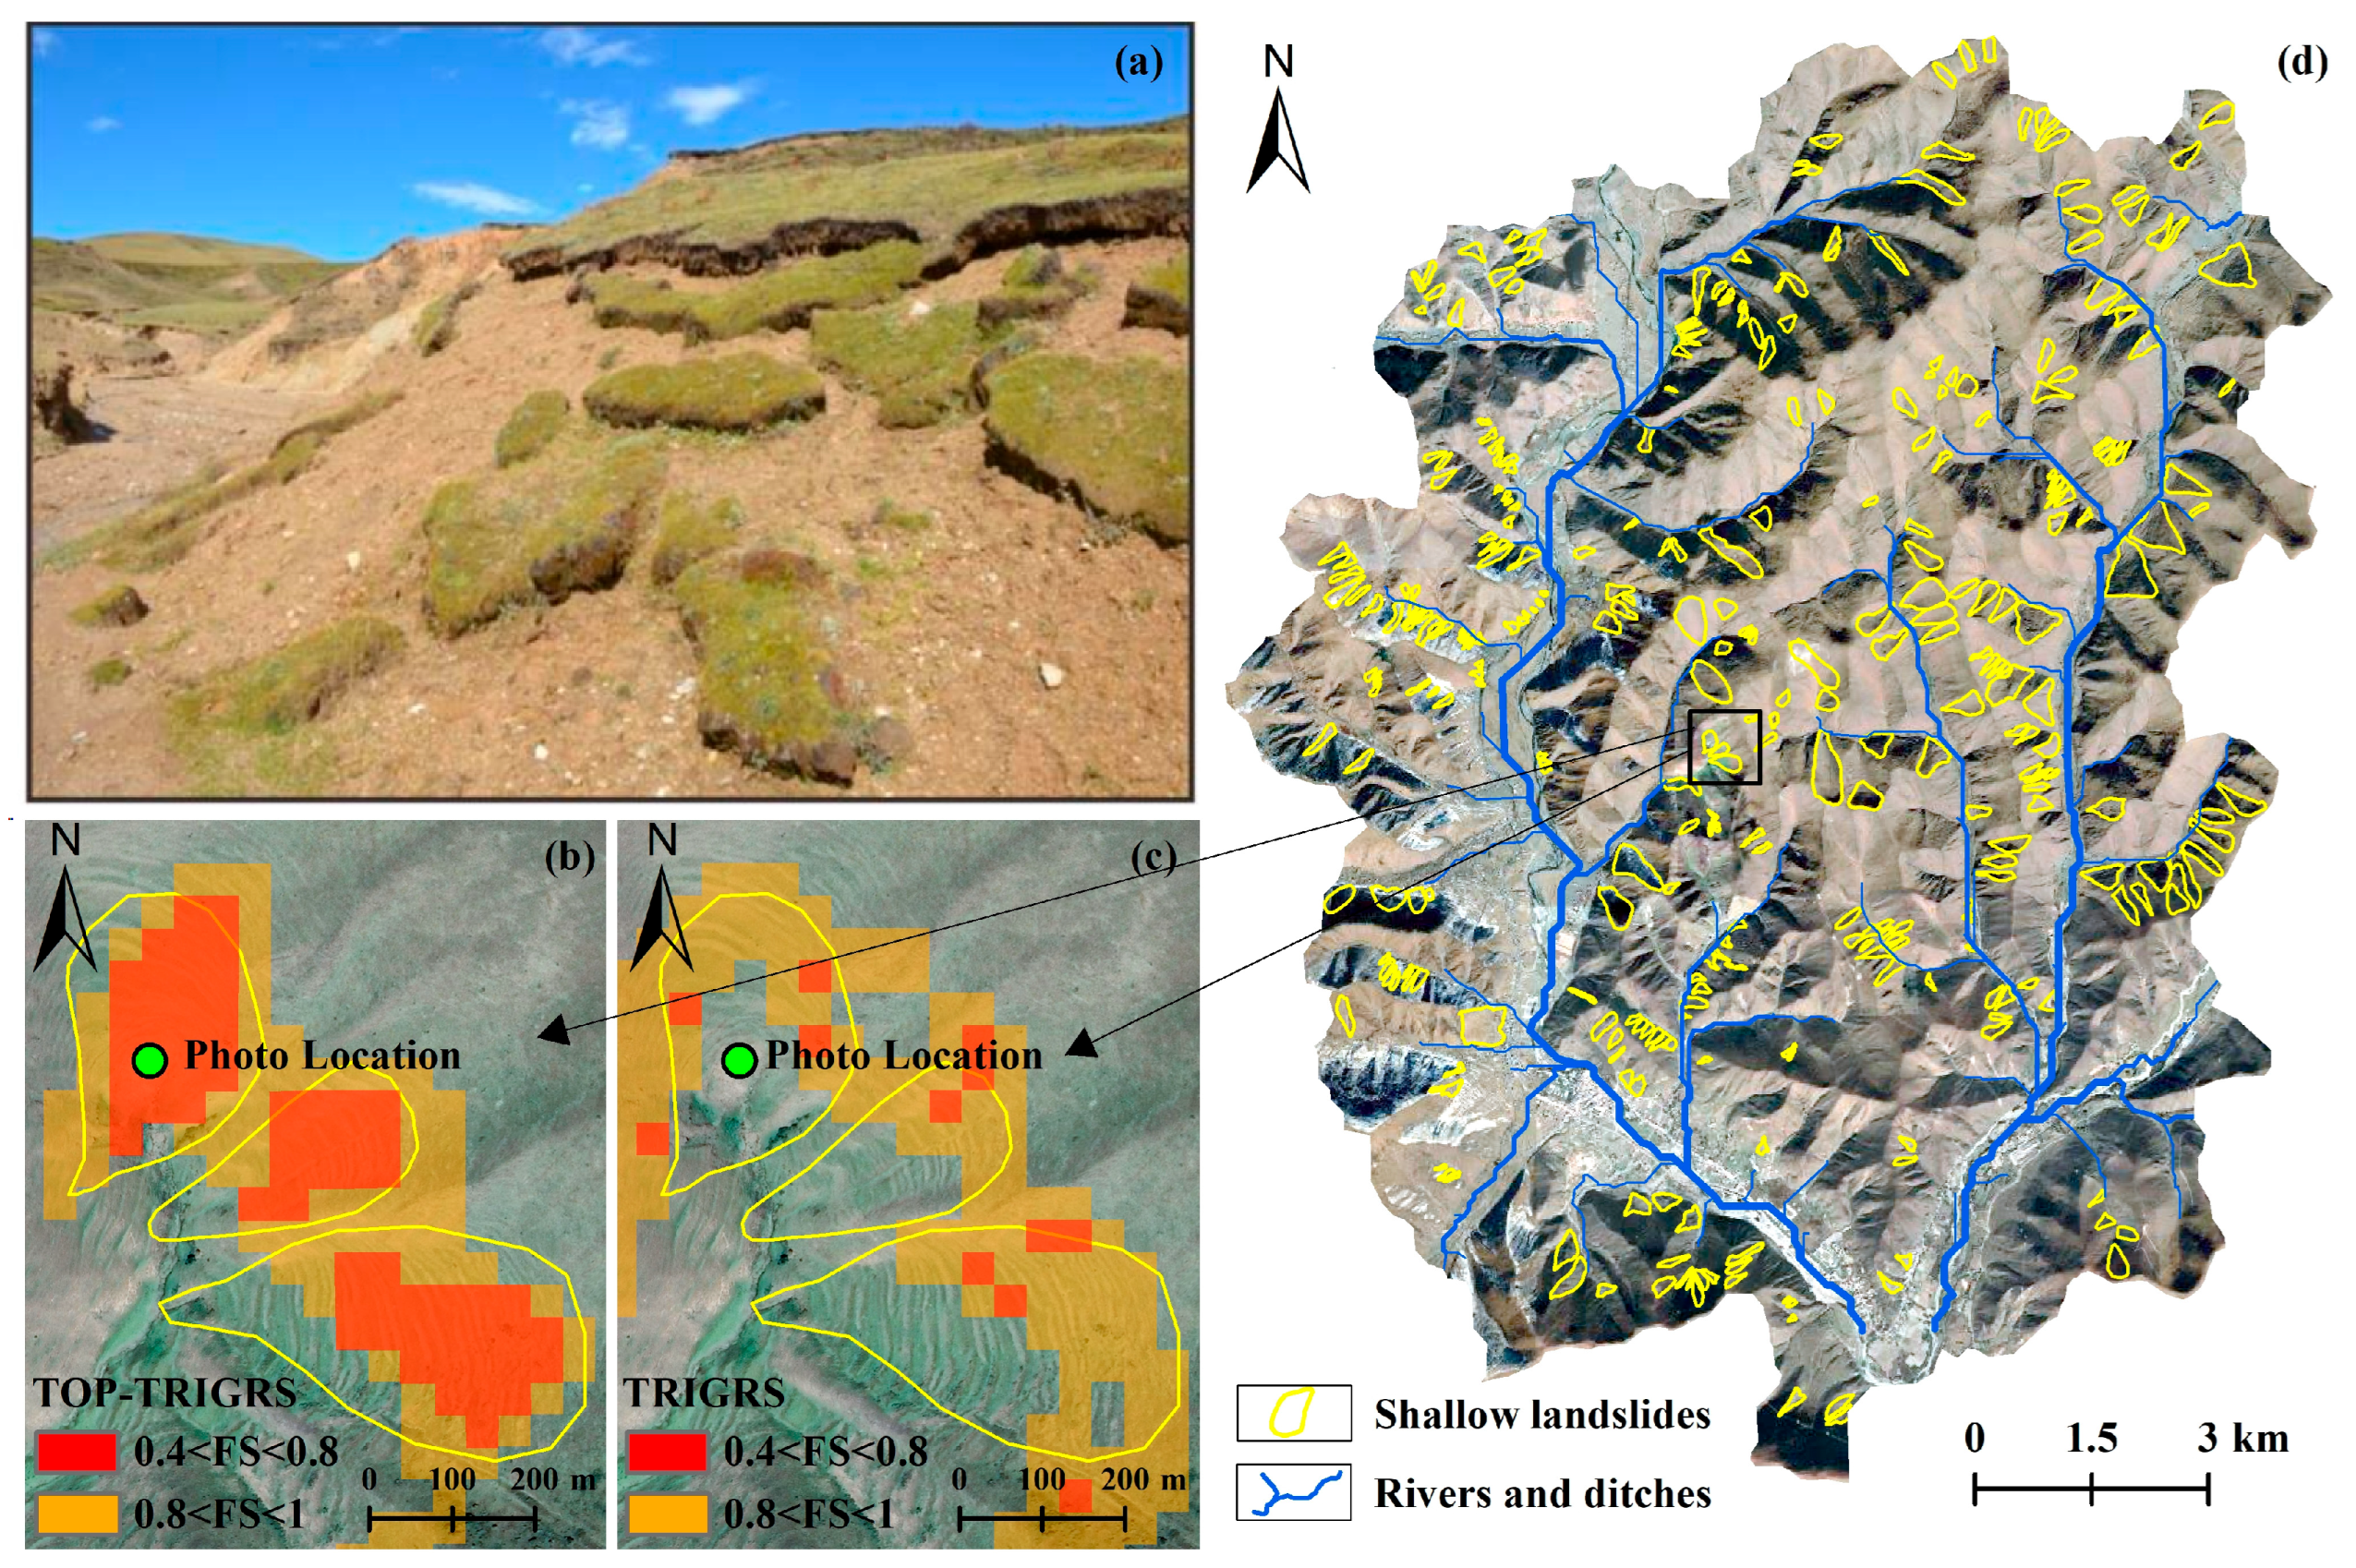
2 was carried out in the study area. The investigation focused on the shallow landslide of subalpine meadow soil along the paved roads, with each event meticulously documented using registration cards. A comprehensive catalog of meadow soil erosion events was compiled, including details such as ID number, location, altitude, slope gradient, geomorphology, lithology, tectonics, thickness and composition of soil layers, as well as the area and volume of each erosion event. Additionally, soil samples were collected from the alpine meadows during fieldwork, and laboratory tests were conducted to analyze the physical, hydrological and mechanical properties of the soil. In instances where erosion events occurred in areas inaccessible by road, 0.5 m resolution Google Earth images were utilized to identify these areas. The spatial distribution of shallow landslides obtained through image interpretation and field surveys can be seen in
Figure 2.
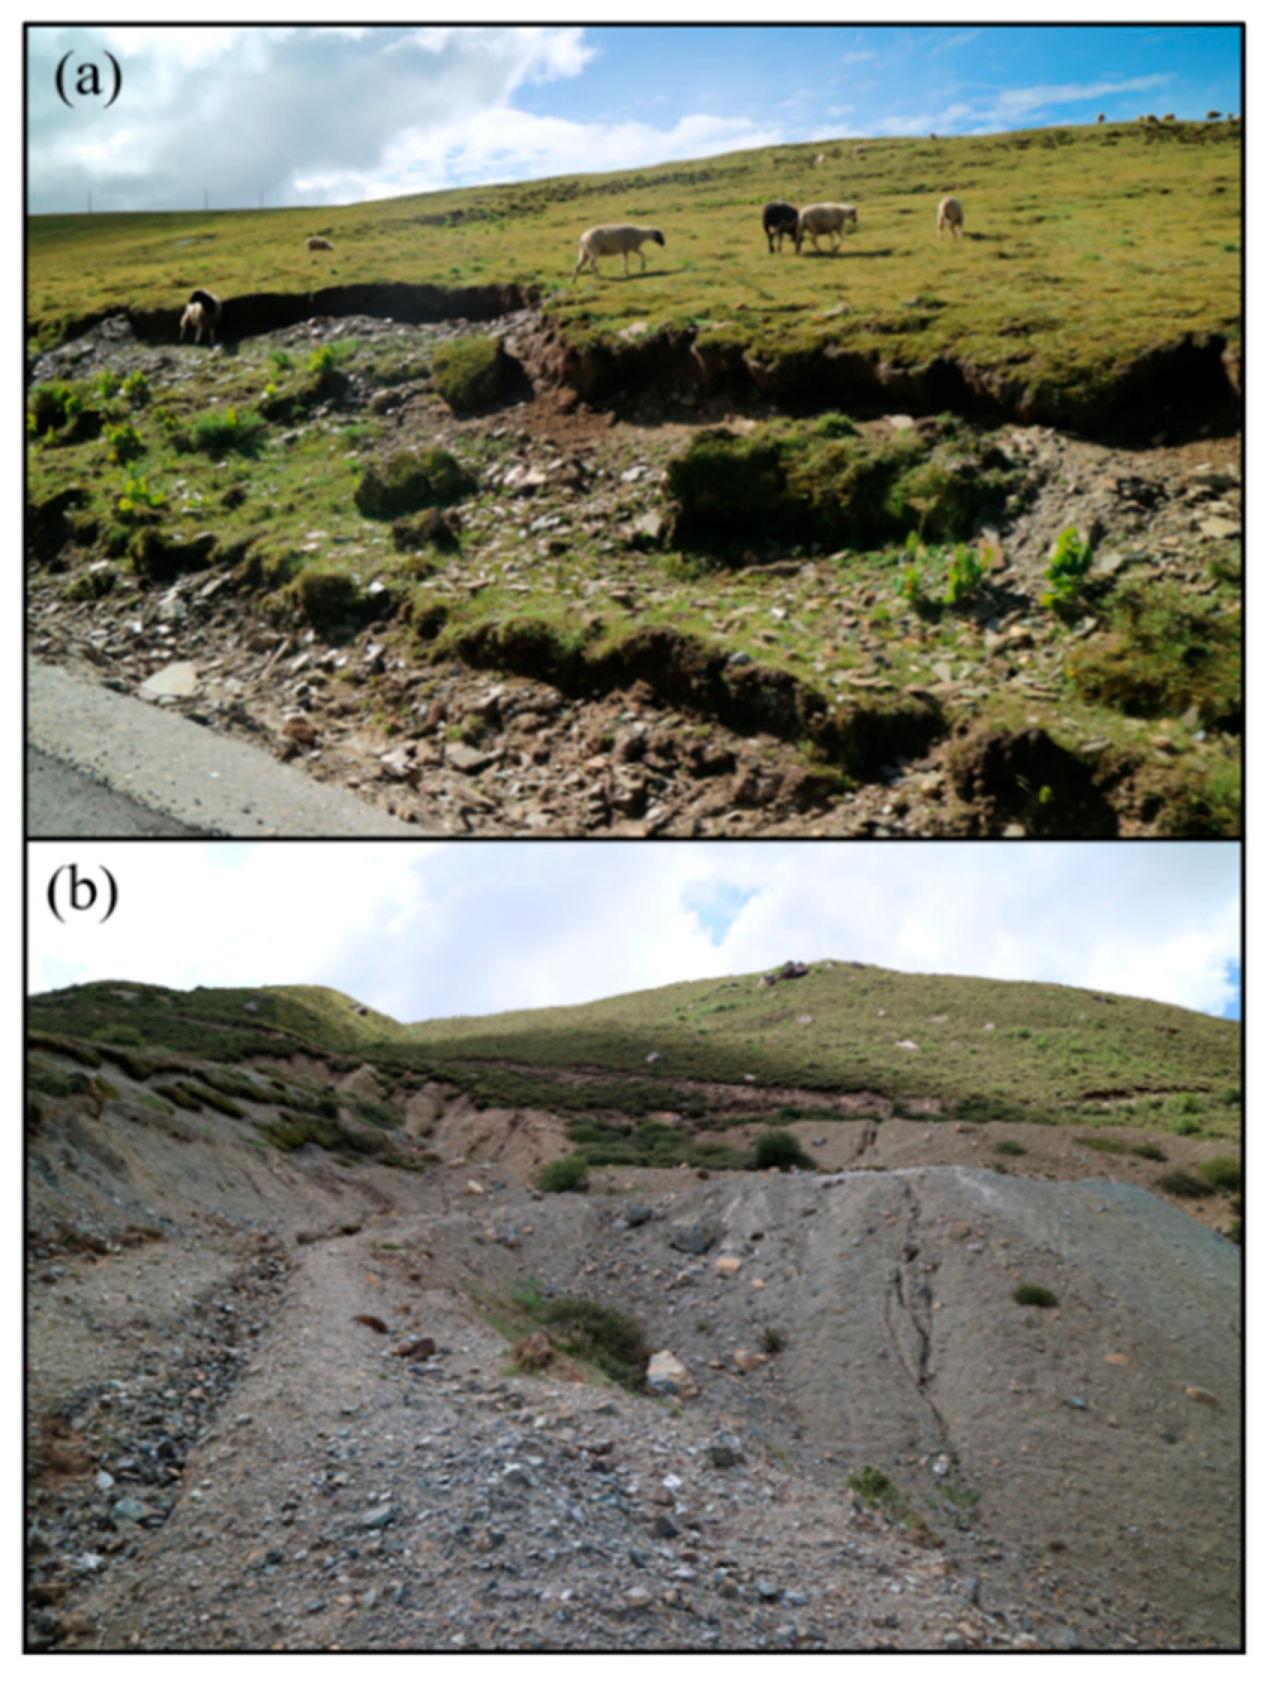
Based on the findings of the field investigation, it was observed that erosion typically initiates at the base of the slope and progresses upwards until the entire slope is affected, leaving behind bare land, as illustrated in
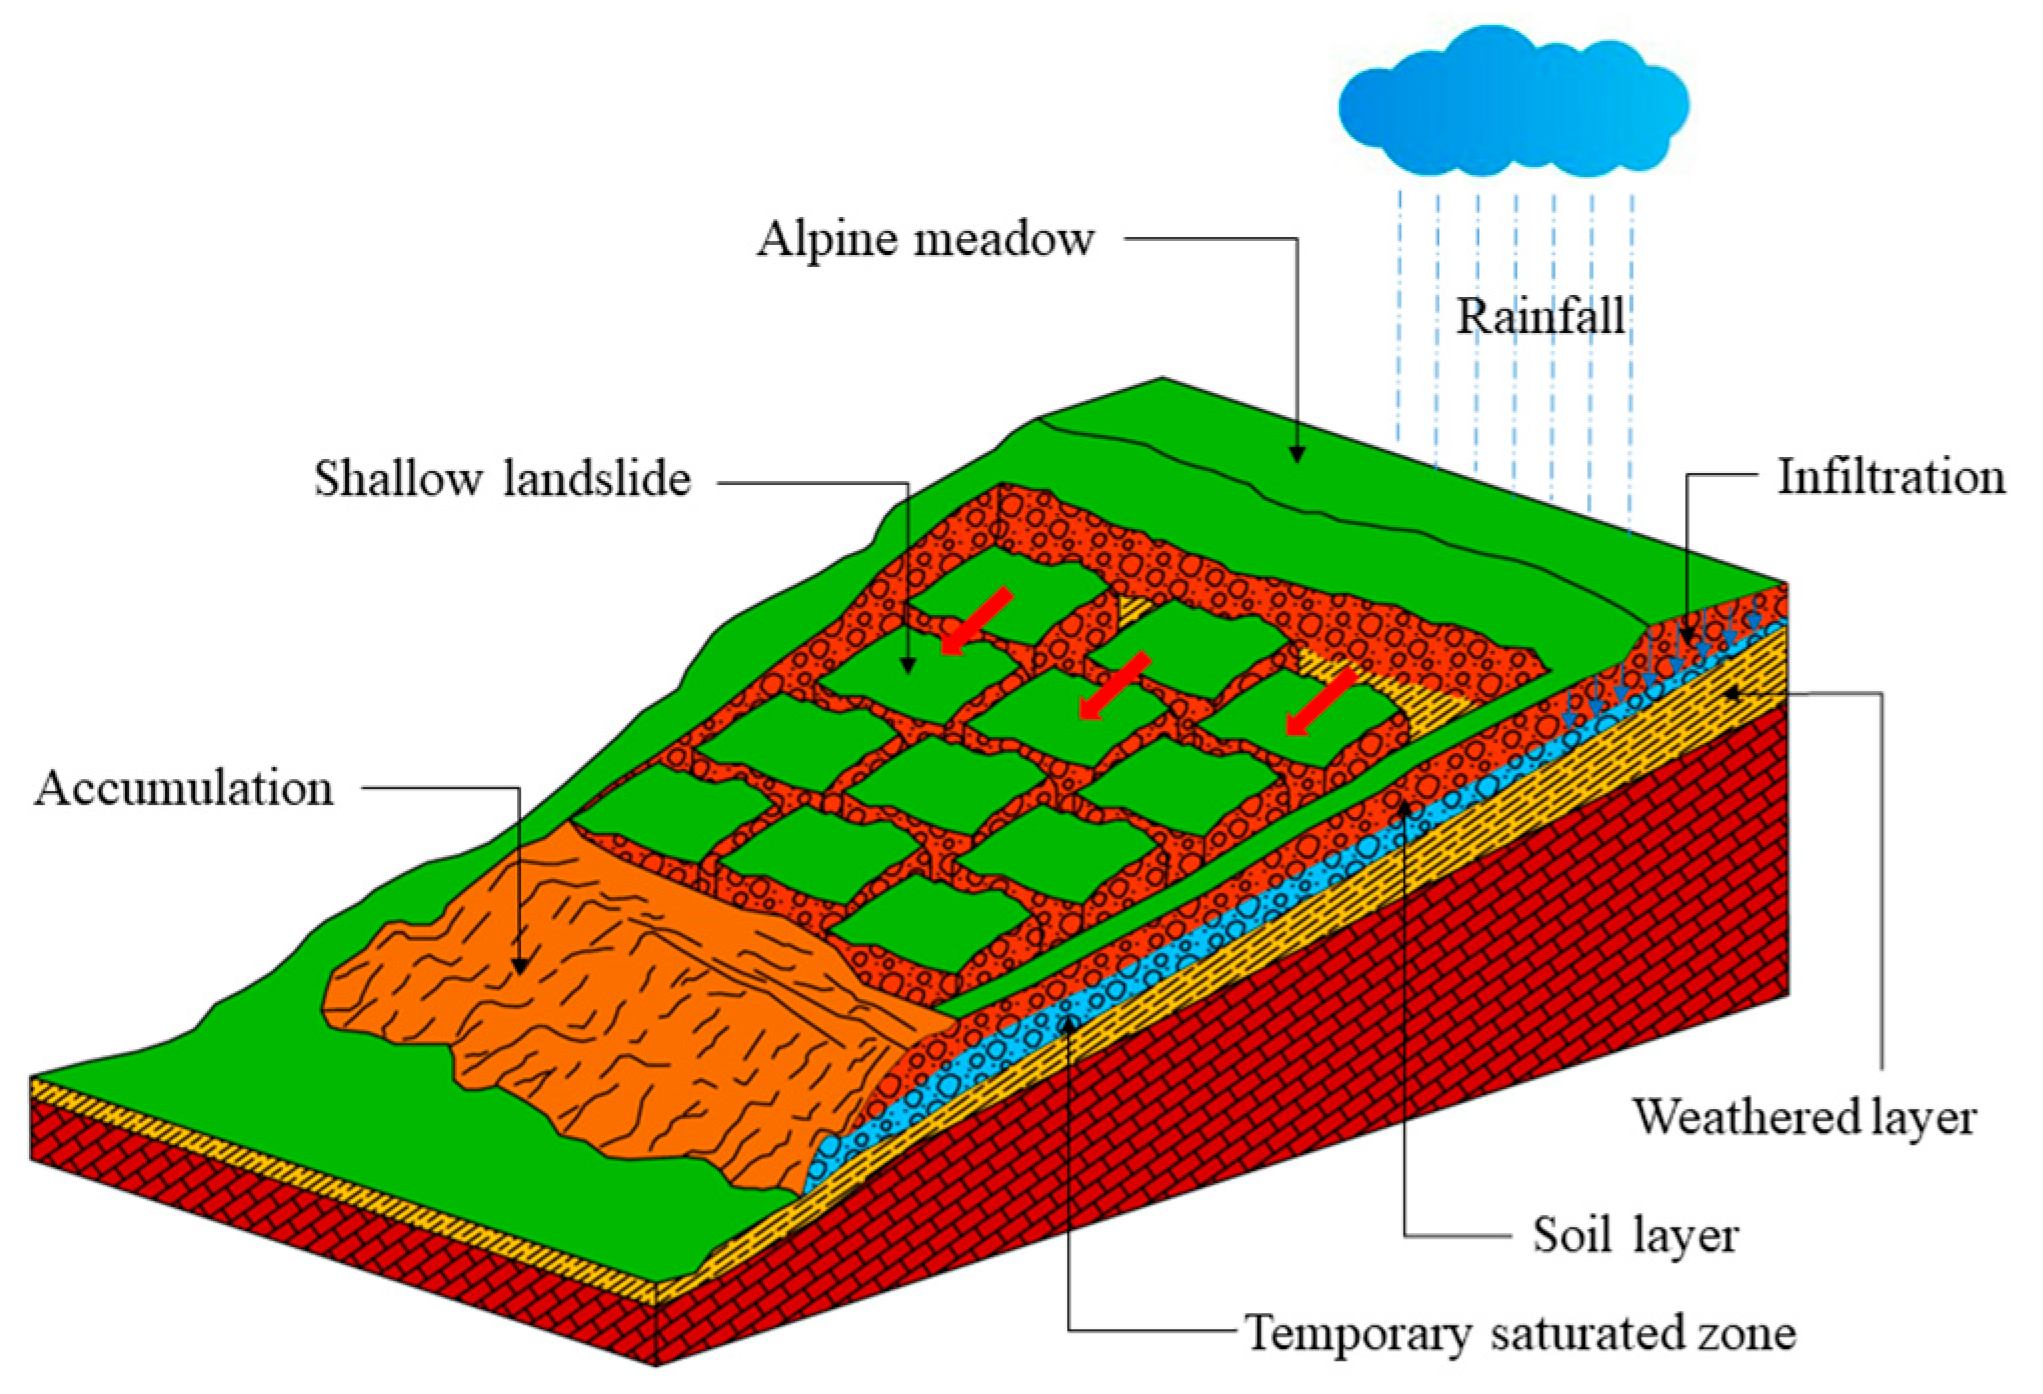
Figure 3. Shallow landslide of meadow soil is primarily induced by rainfall, where the combination of gravity and hydrodynamic pressure contributes to the instability of the meadow slope. This mechanism is illustrated in the conceptual model depicted in
Figure 4. The slope comprises a meadow soil layer, weathered layer and bedrock layer, exhibiting a gentle slope gradient. Rainfall infiltration is regulated by the less hydraulically conductive weathered clay layer beneath the meadow soil. When the rainfall intensity surpasses the infiltration capacity of the weathered layer, a temporary saturated zone forms within the meadow soil layer. As subsurface flow, driven by the slope gradient, intensifies, the seepage pressure within the temporary saturated zone rises, leading to the disintegration and sliding of meadow soils.
3. Method
3.1. Hydrological Model Integration Methods
TRIGRS, a shallow landslide prediction model integrating a 1-D transient infiltration model and slope stability analysis, holds significance in predicting the occurrence and locations of shallow landslides and assessing susceptibility. While coupling a hydrological model with a stability model for forecasting meadow soil erosion events induced by rainfall, TRIGRS overlooks groundwater exchange between cells during the computation of transient pore-pressure changes. Consequently, this oversight may result in an underestimation of water table depth when applied to the shallow landslide of subalpine meadow soil.
This study aims to integrate a TOPography-based hydrological model (TOPMODEL), which considers catchment area topography and soil characteristics, with the rainfall infiltration model of TRIGRS. By employing TOPMODEL to adjust local groundwater levels within the catchment area, in conjunction with the infinite slope model, it facilitates the analysis of shallow landslide risk within the study area. The specific implementation process is illustrated in
Figure 5.
3.2. TRIGRS Model
The TRIGRS (Transient Rainfall Infiltration and Grid-based Regional Slope-Stability) model, a physically based approach, is widely employed for analyzing shallow landslides induced by rainfall. Developed by the United States Geological Survey (USGS), the TRIGRS model is implemented as a Fortran program [
18,
19]. This model calculates pore pressure and the factor of safety by considering rainfall infiltration. The pressure head (
ψ), which varies with time (
t) and depth (
Z), is determined using a linearized solution of Richards’ equation [
19]:
where
is the volumetric water content, and
is the function of hydraulic conductivity.
TRIGRS utilizes a one-dimensional infinite-slope stability model, assuming the sliding mass’s thickness is significantly smaller than its length [
19]. Uniform soil thickness and physical properties are assumed for each grid cell, and lateral stresses between grid cells are neglected. The factor of safety (
FS) for the infinite slope is calculated using the formula:
where
represents the cohesion of the rock-soil mass,
denotes the friction angle,
represents the unit weight and
represents the unit weight of groundwater.
FS < 1 denotes unstable conditions, which means a shallow landslide event. On the contrary, when the
FS ≥ 1, there is no instability.
3.3. Hydrological Modeling with TOPMODEL
Beven and Kirby [
20] proposed a TOPography-based hydrological model (TOPMODEL) to derive the distance between the surface and the aquifer from the relationship between topographic conditions and soil properties in a catchment area. They suggested that the groundwater level can be calculated from Equation (3). This means that the groundwater level is controlled by the average groundwater level, topographic index and average topographic index within that catchment area.
where “
” is the groundwater level at a location [m], “
” is the TPI of that location, “
” is the average groundwater level of the catchment area [m], “
” is a soil coefficient, which could be obtained from basic hydrogeological data, and “
” is the average TPI of the catchment area.
4. Data Input and Result
4.1. Input Data
4.1.1. Digital Elevation Model
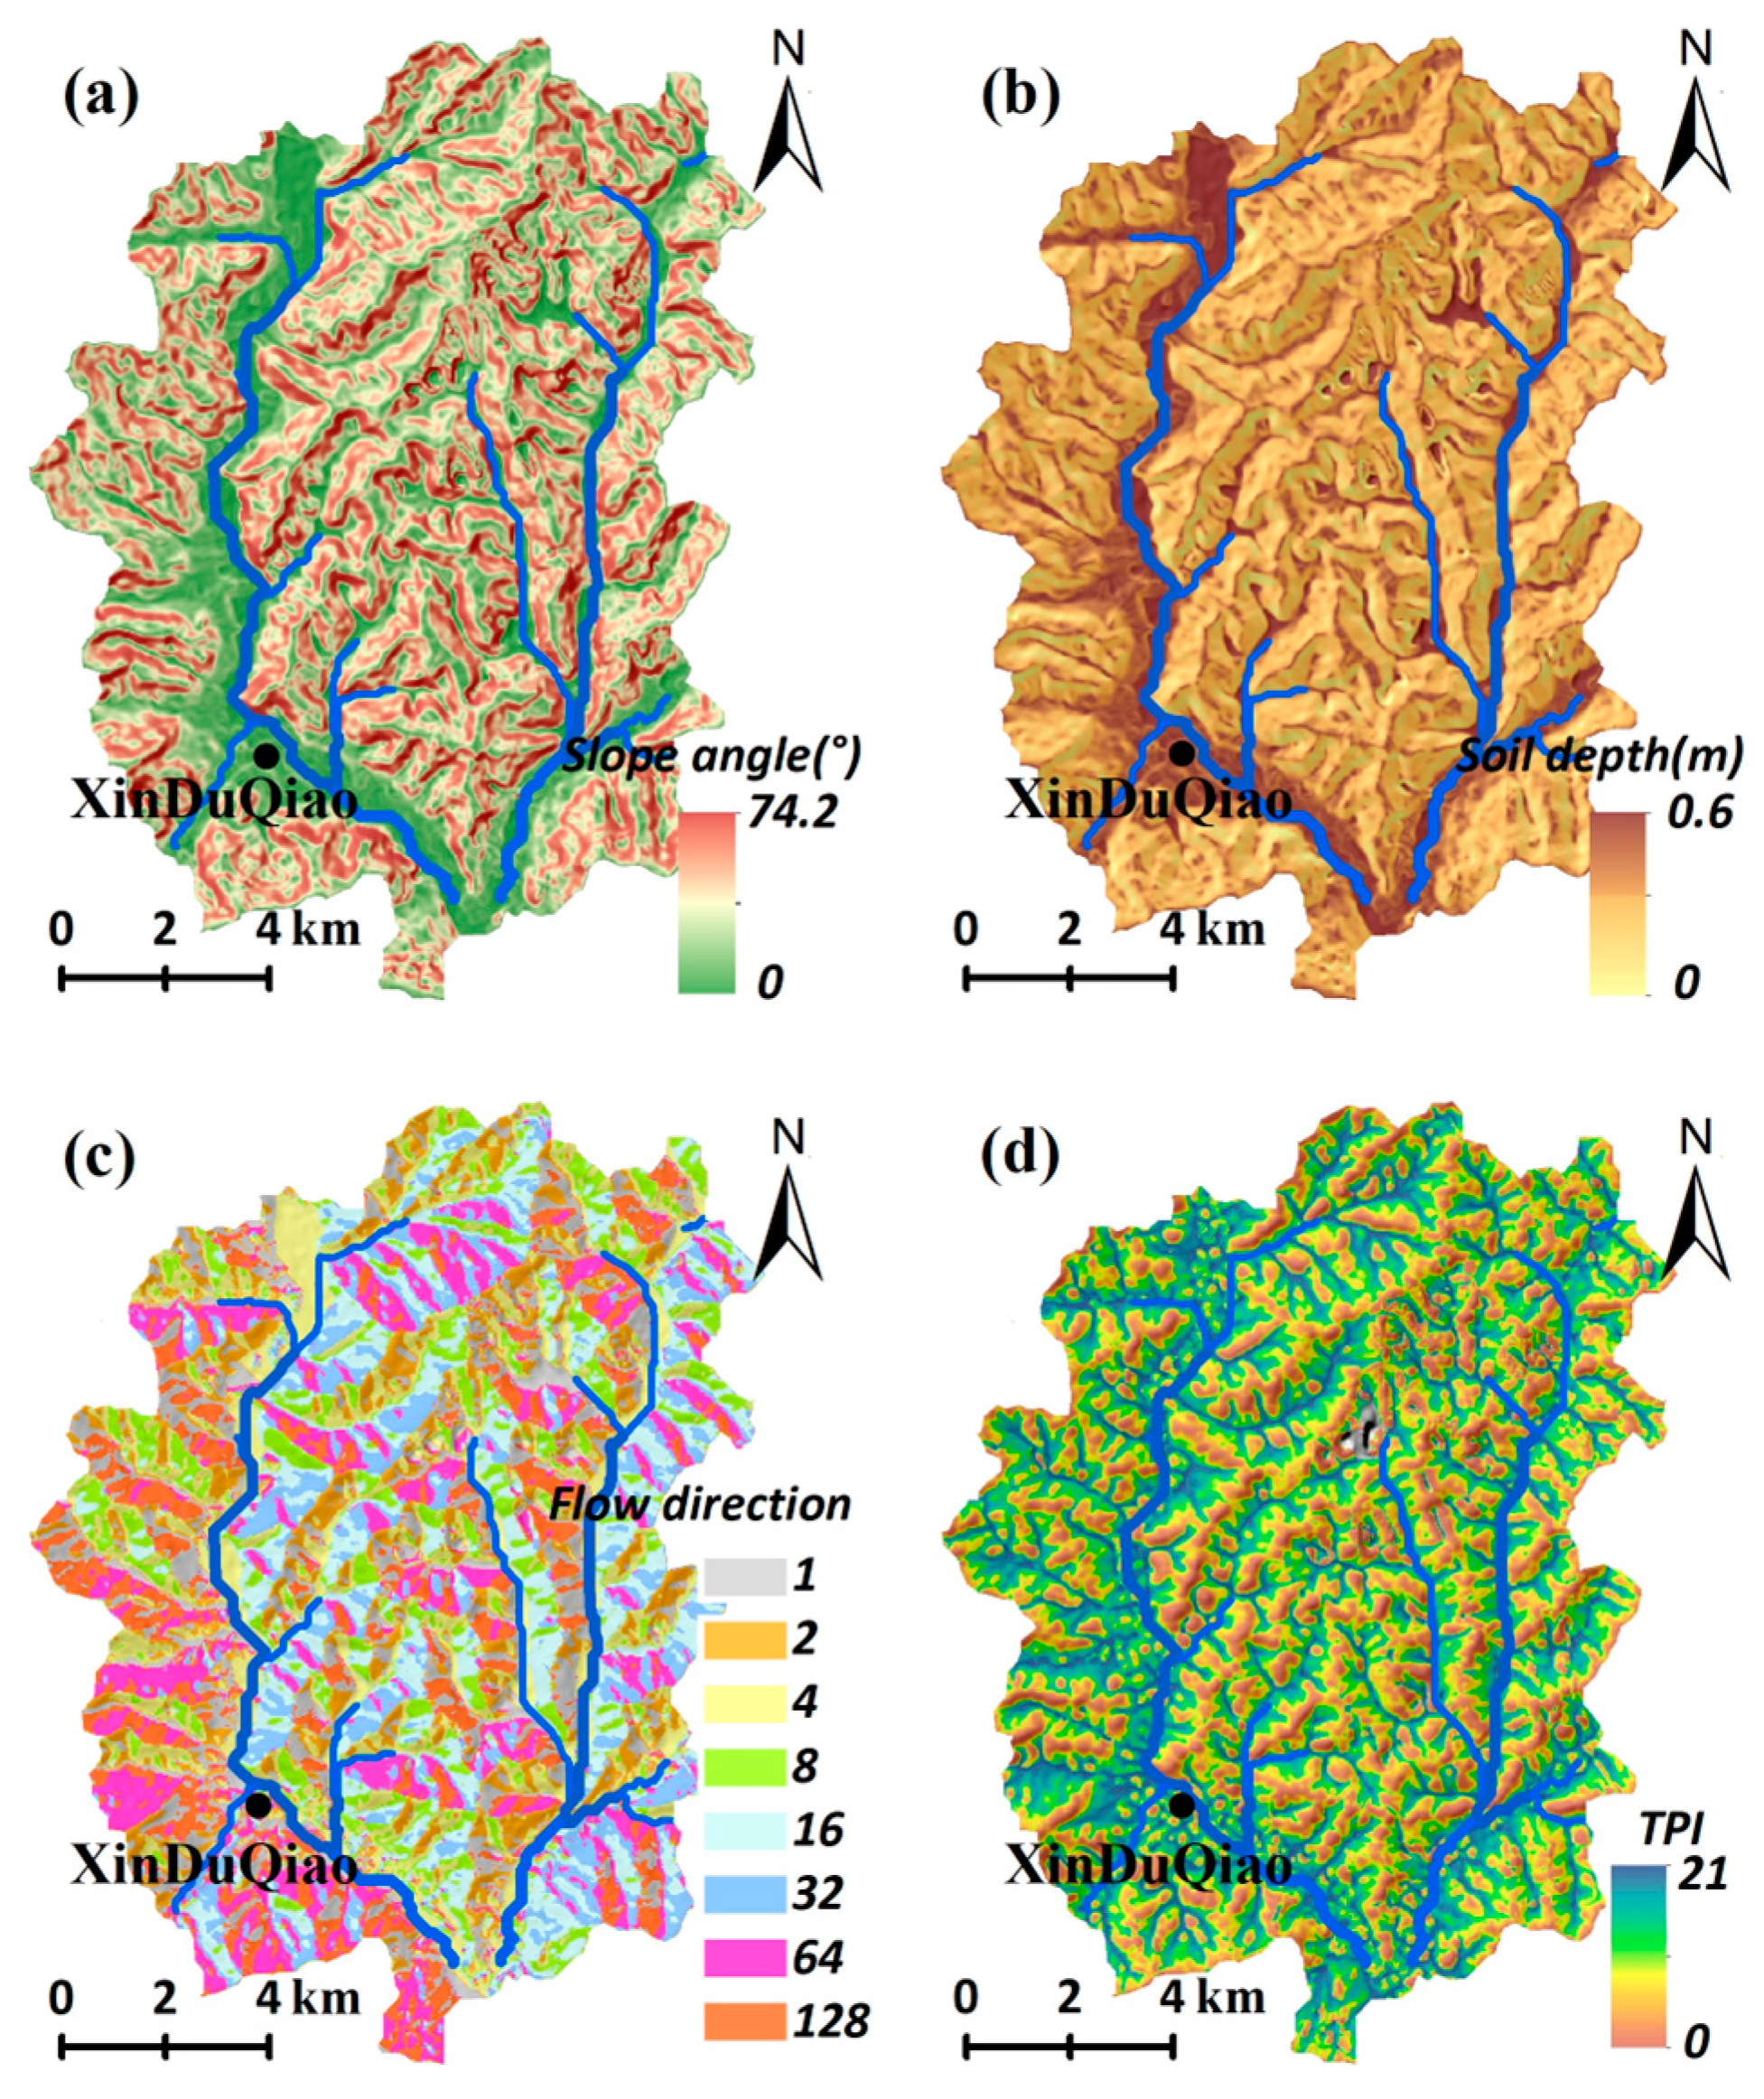
The digital elevation model (DEM) provides the basic data for TRIGRS simulation. The ALOS-PALSAR DEM data for the study area was obtained from Earthdata of NASA, with a grid cell size of 12.5 m. Moreover, TRIGRS requires slope, flow direction and Topographic Position Index (TPI) maps as input. These maps were all generated using ArcGIS 10.2 (
Figure 6).
4.1.2. Geotechnical Parameters
In conducting TRIGRS simulations, geotechnical parameters are essential inputs. These parameters, including unit weight (
), internal friction angle (
), cohesion (
), saturated hydraulic conductivity (
), saturated water content (
) and residual water content of the soil (
), were determined experimentally. We collected 19 representative samples of meadow soil from various depths and locations within the study area, conducting laboratory static triaxial and other experiments for parameter measurement, the average measurement for each parameter served as input data for TRIGRS simulations, as detailed in
Table 1. Additionally, for hydraulic diffusivity (
) and the initial surface flux (
), previous research provided guidance. Following prior studies [
21,
22], we set saturated hydraulic diffusivity (
) to
= 200
and the initial surface flux (
) to a value generally lower than
to one power or more, specifically
= 0.01
.
TRIGRS requires input of soil thickness, a parameter that significantly impacts stability simulation outcomes [
23] and slope hydrological response [
24,
25]. However, using a fixed soil thickness may yield unreasonable results in certain areas. To address this, several studies have generated soil thickness maps by correlating soil thickness with slope [
26,
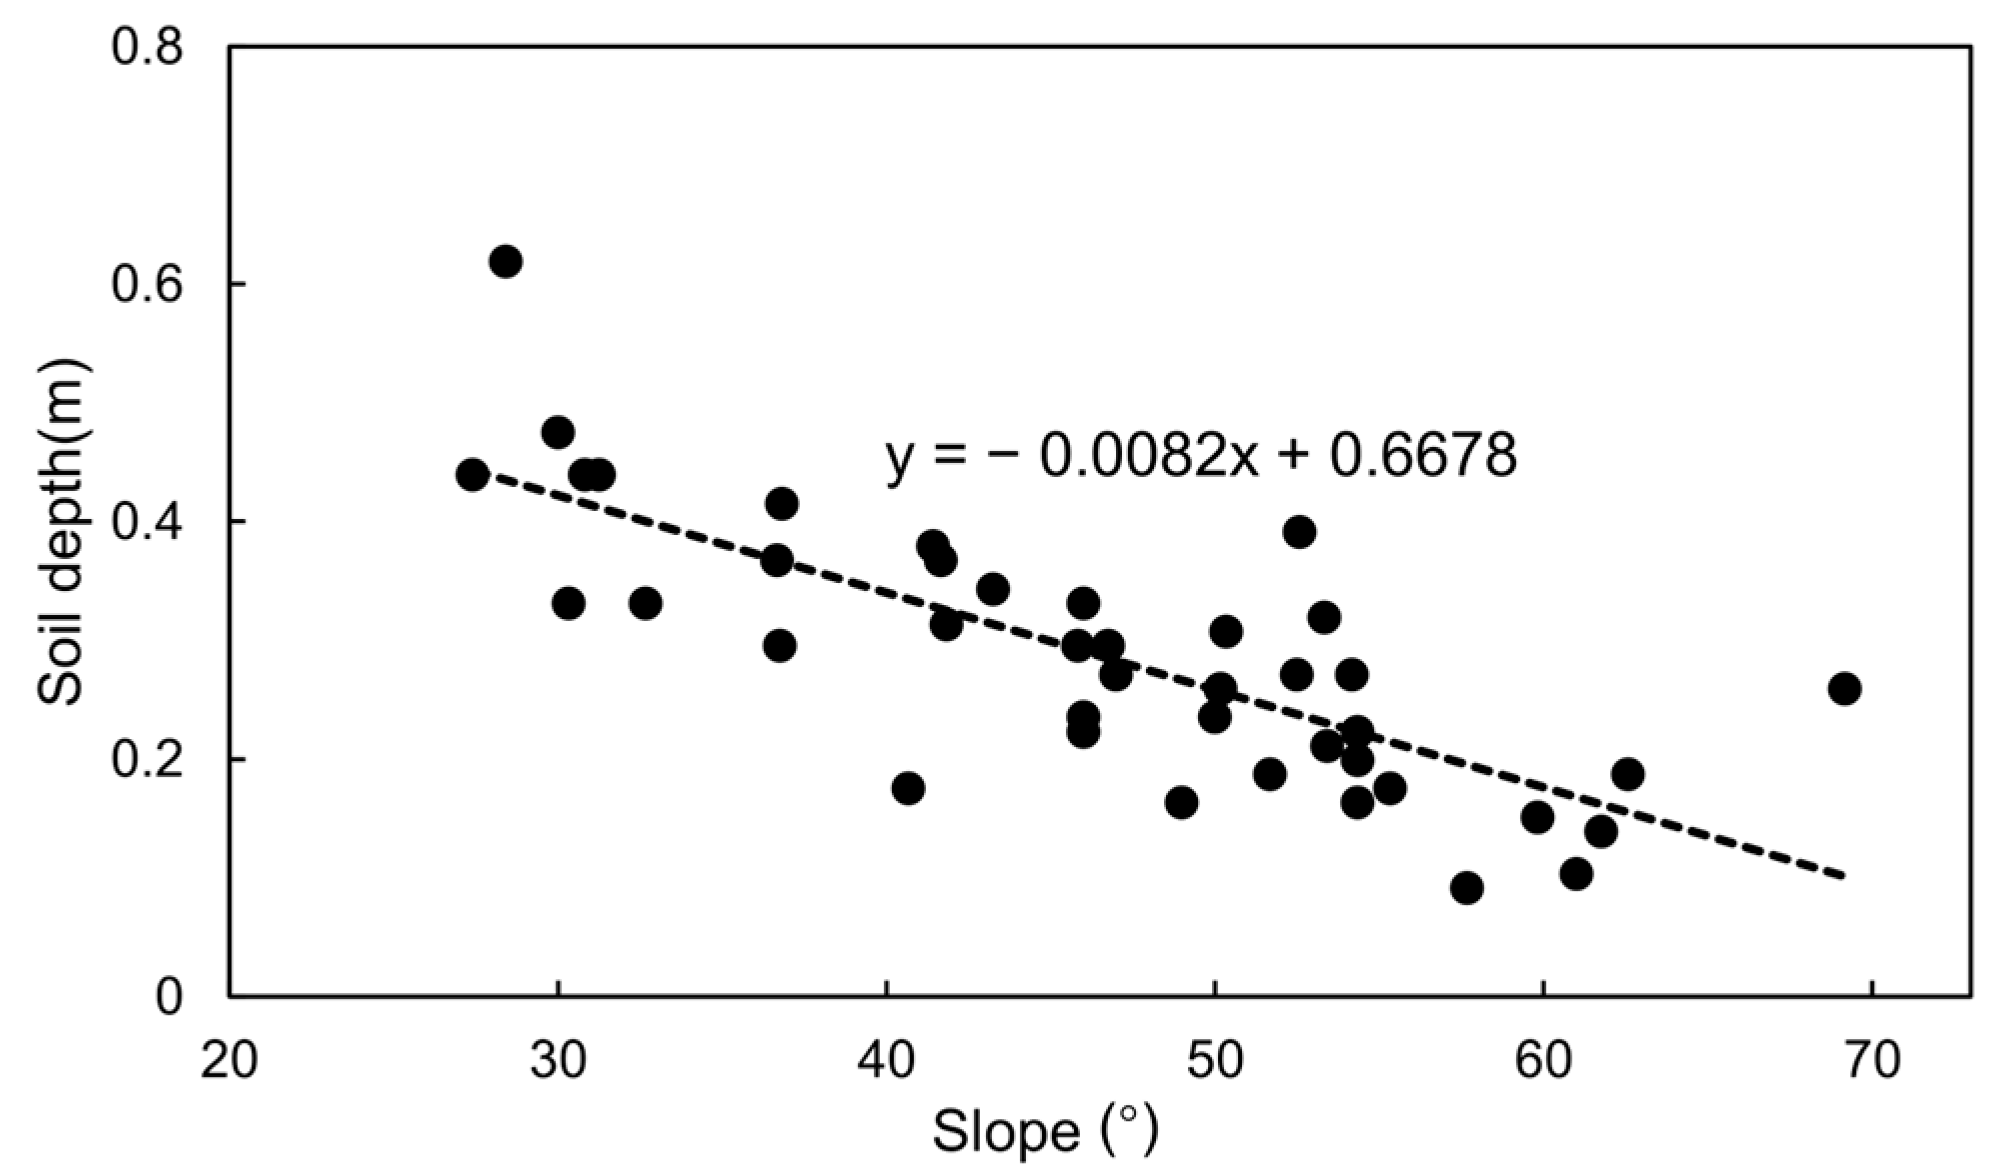
27]. Consequently, we developed a regression equation relating meadow soil thickness to slope, leveraging field survey data (
Figure 7).
This linear relationship posits that soil thickness varies inversely with slope. By applying Equation (4), we can derive the soil thickness (
y) corresponding to a given slope (
x). Subsequently, we computed the soil thickness for each grid cell within the study area using this equation. Both
y and
x are expressed in meters and degrees, respectively.
4.2. Prediction of TRIGRS
The factor of safety (
FS) across the whole study area was computed for each cell by TRIGRS and TOP-TRIGRS. Note that TRIGRS is a transient rainfall infiltration and slope stability model; therefore, the
FS changes with computing time step as well. We plotted the
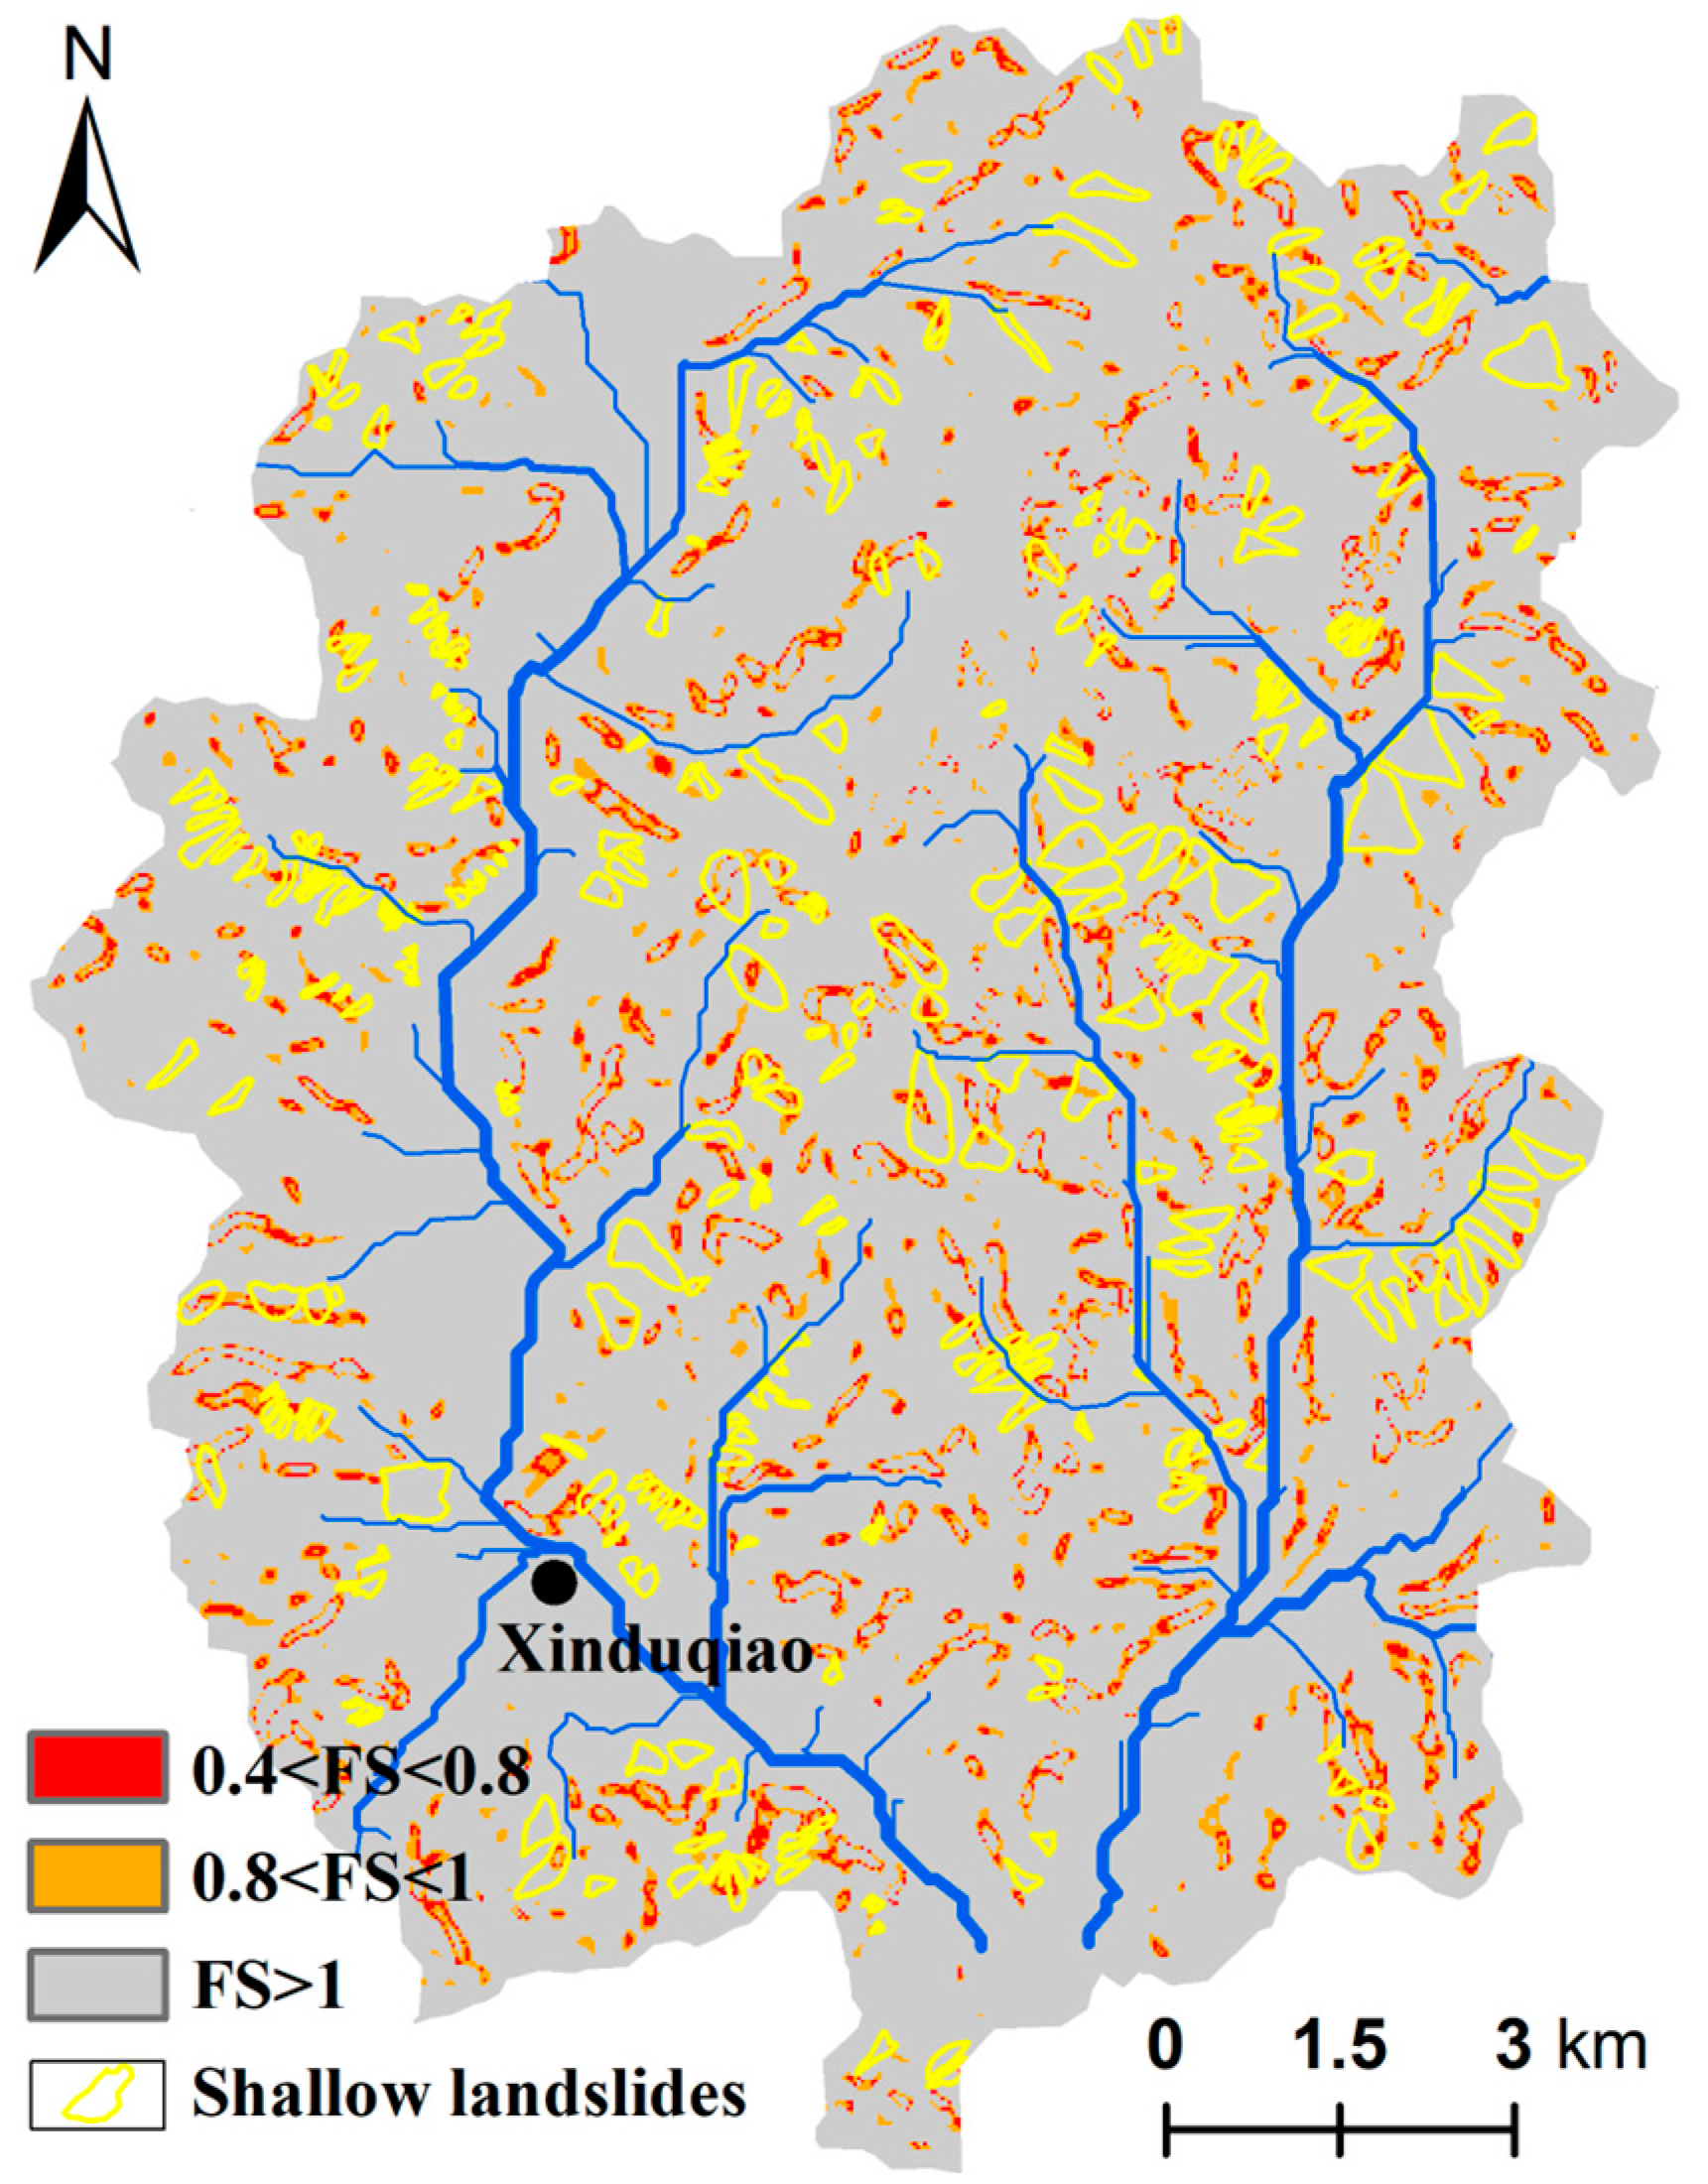
FS distribution 12 h after the heavy rainfall, see in
Figure 8.
In the TRIGRS simulation results, the most unstable class (0.4 to 0.8) occupies 3.2% of the total study area. The subsequent class, with FS values ranging from 0.8 to 1.0, accounts for approximately 6.4%. The cumulative area of these two classes (FS < 1) results in 9.6% of the basin being classified as unstable. Subsequent classes indicating stable conditions (FS > 1) collectively represent 90.4% of the basin.
4.3. Prediction of TOP-TRIGRS
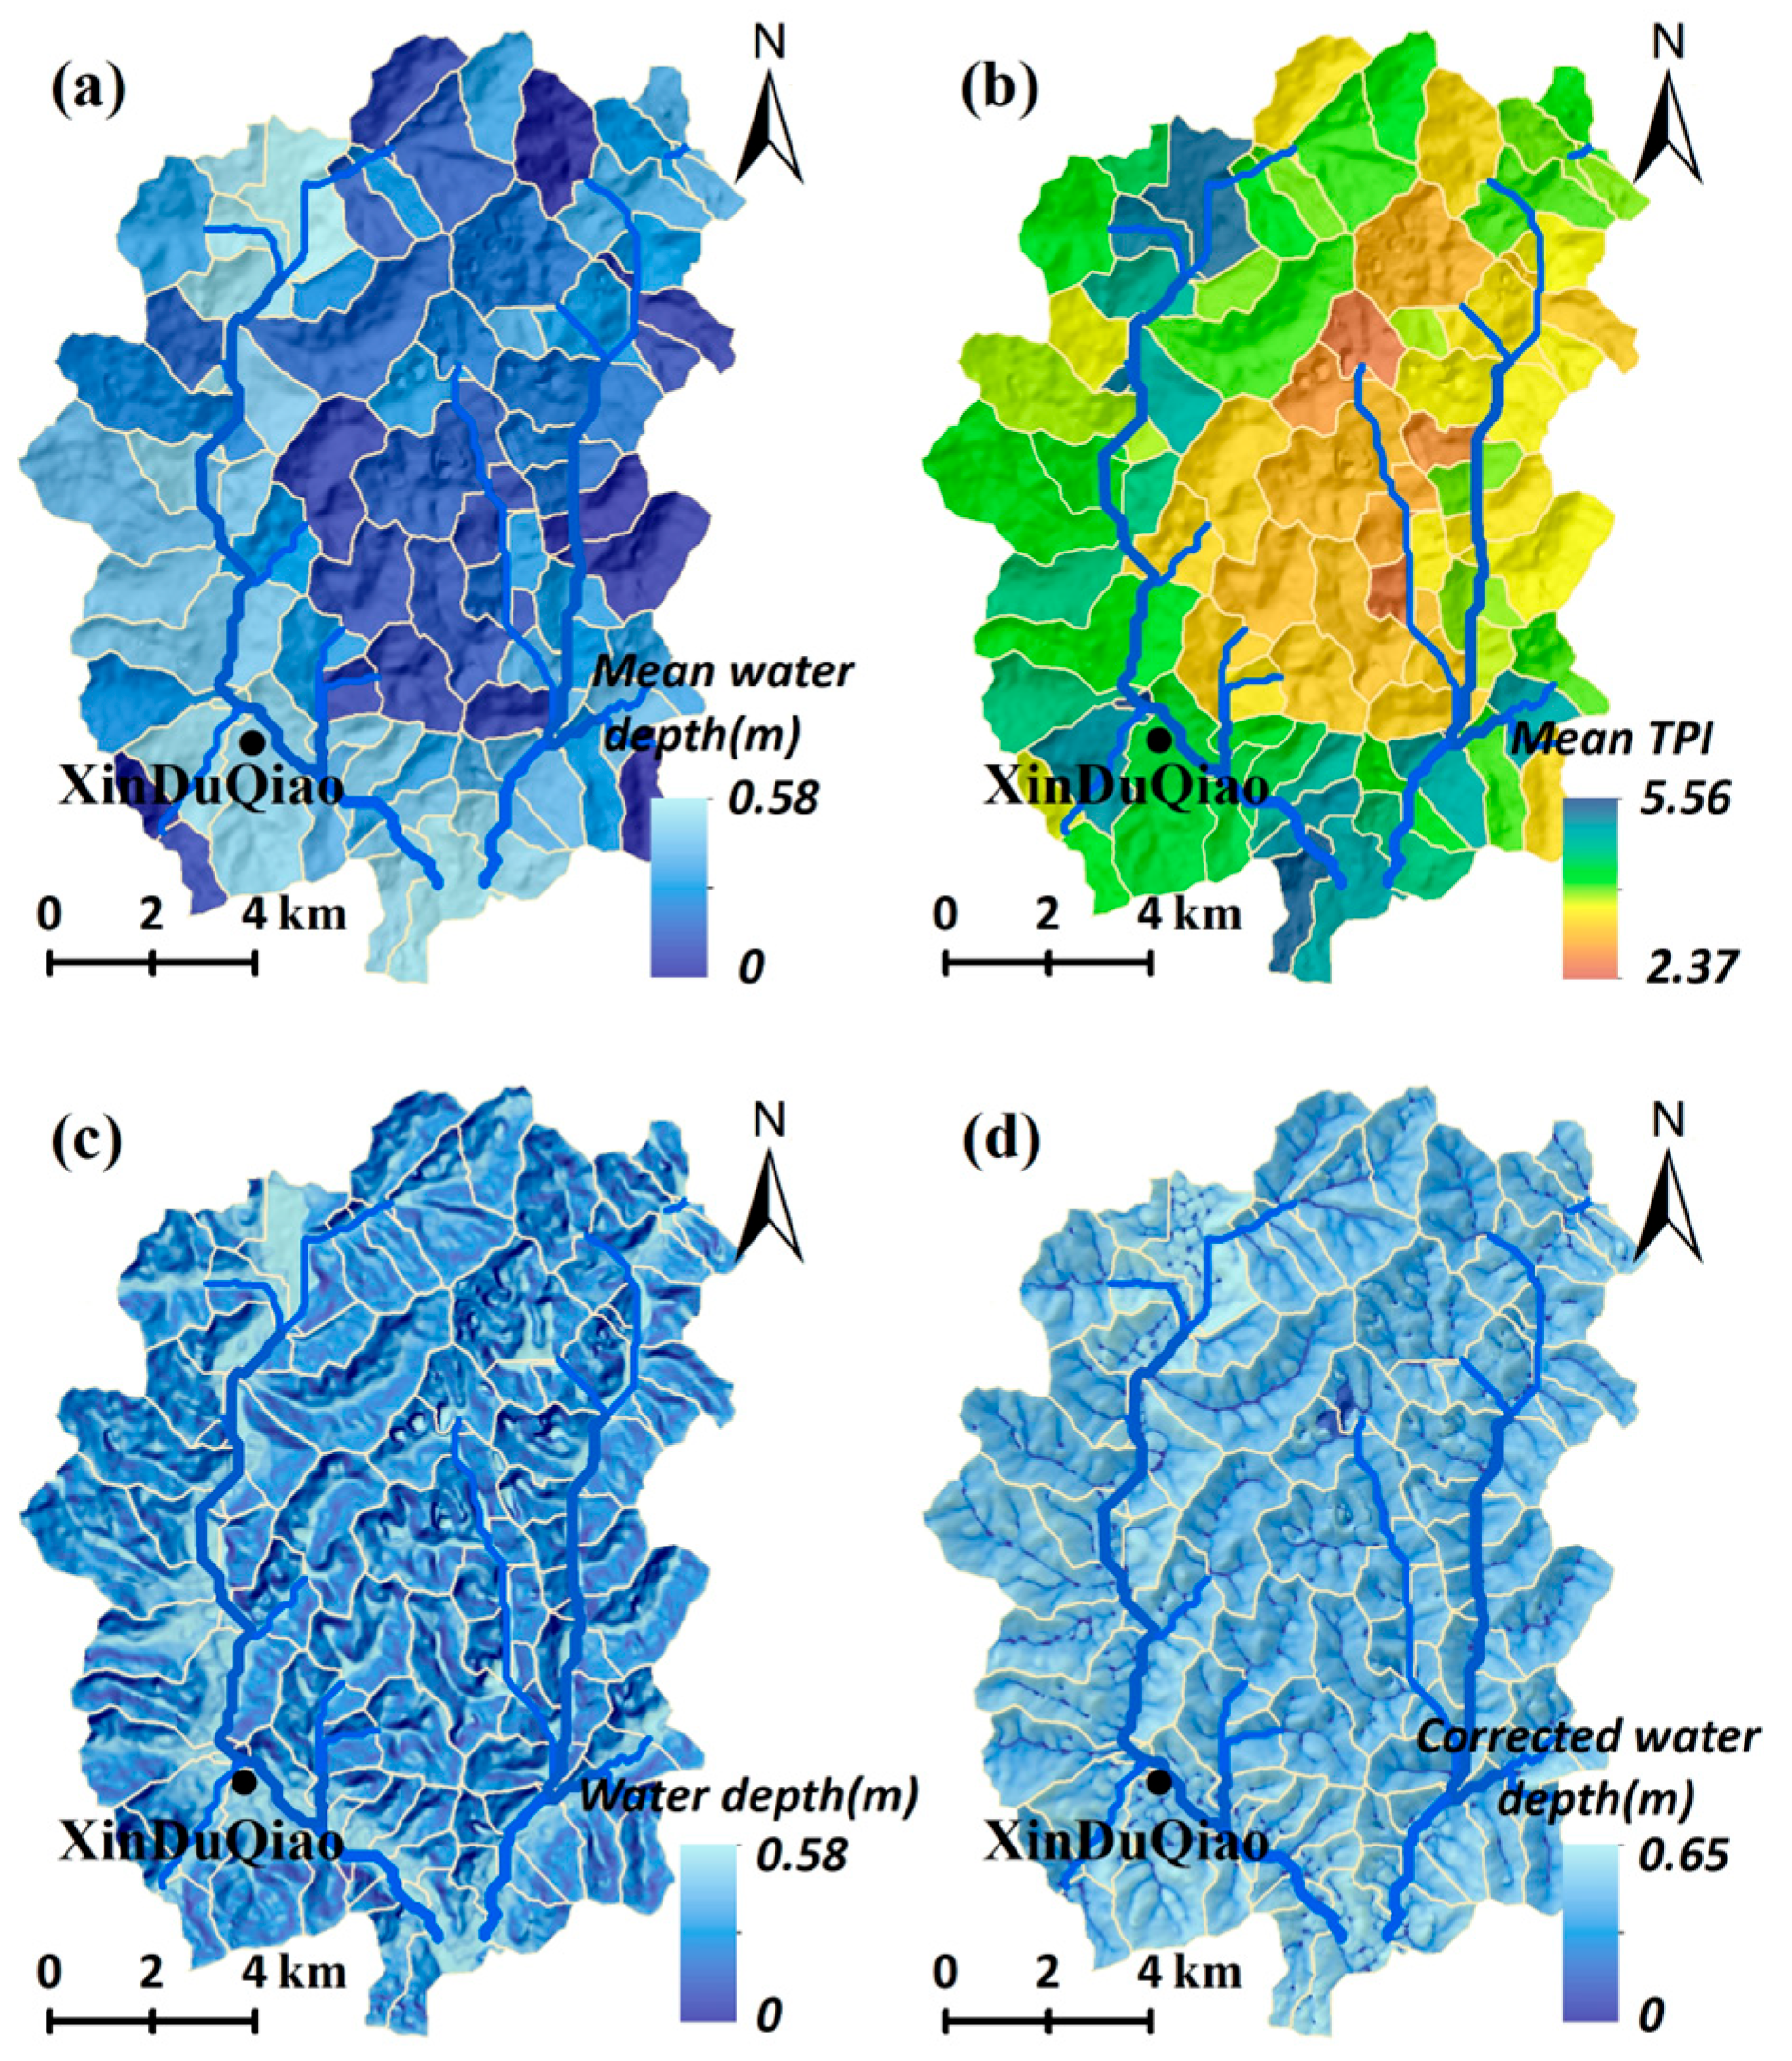
Initially, the groundwater levels within the study area were corrected using TOPMODEL. The study area was divided into 105 sub-catchment areas using river network nodes to enhance the precision of erosion prediction. Subsequently, TOPMODEL corrected the groundwater levels of each cell within each catchment. These corrected results served as the raw data required by TRIGRS for slope stability simulation.
The TOPMODEL-corrected groundwater levels are depicted in
Figure 9. The data reveals a trend towards shallower groundwater depths at the bottom of the slope following TOPMODEL’s adjustments. Apart from direct rainfall infiltration, lateral groundwater recharge at the bottom of the slope base occurs as water flows downward from the upper slope, leading to notable elevation of the groundwater level.
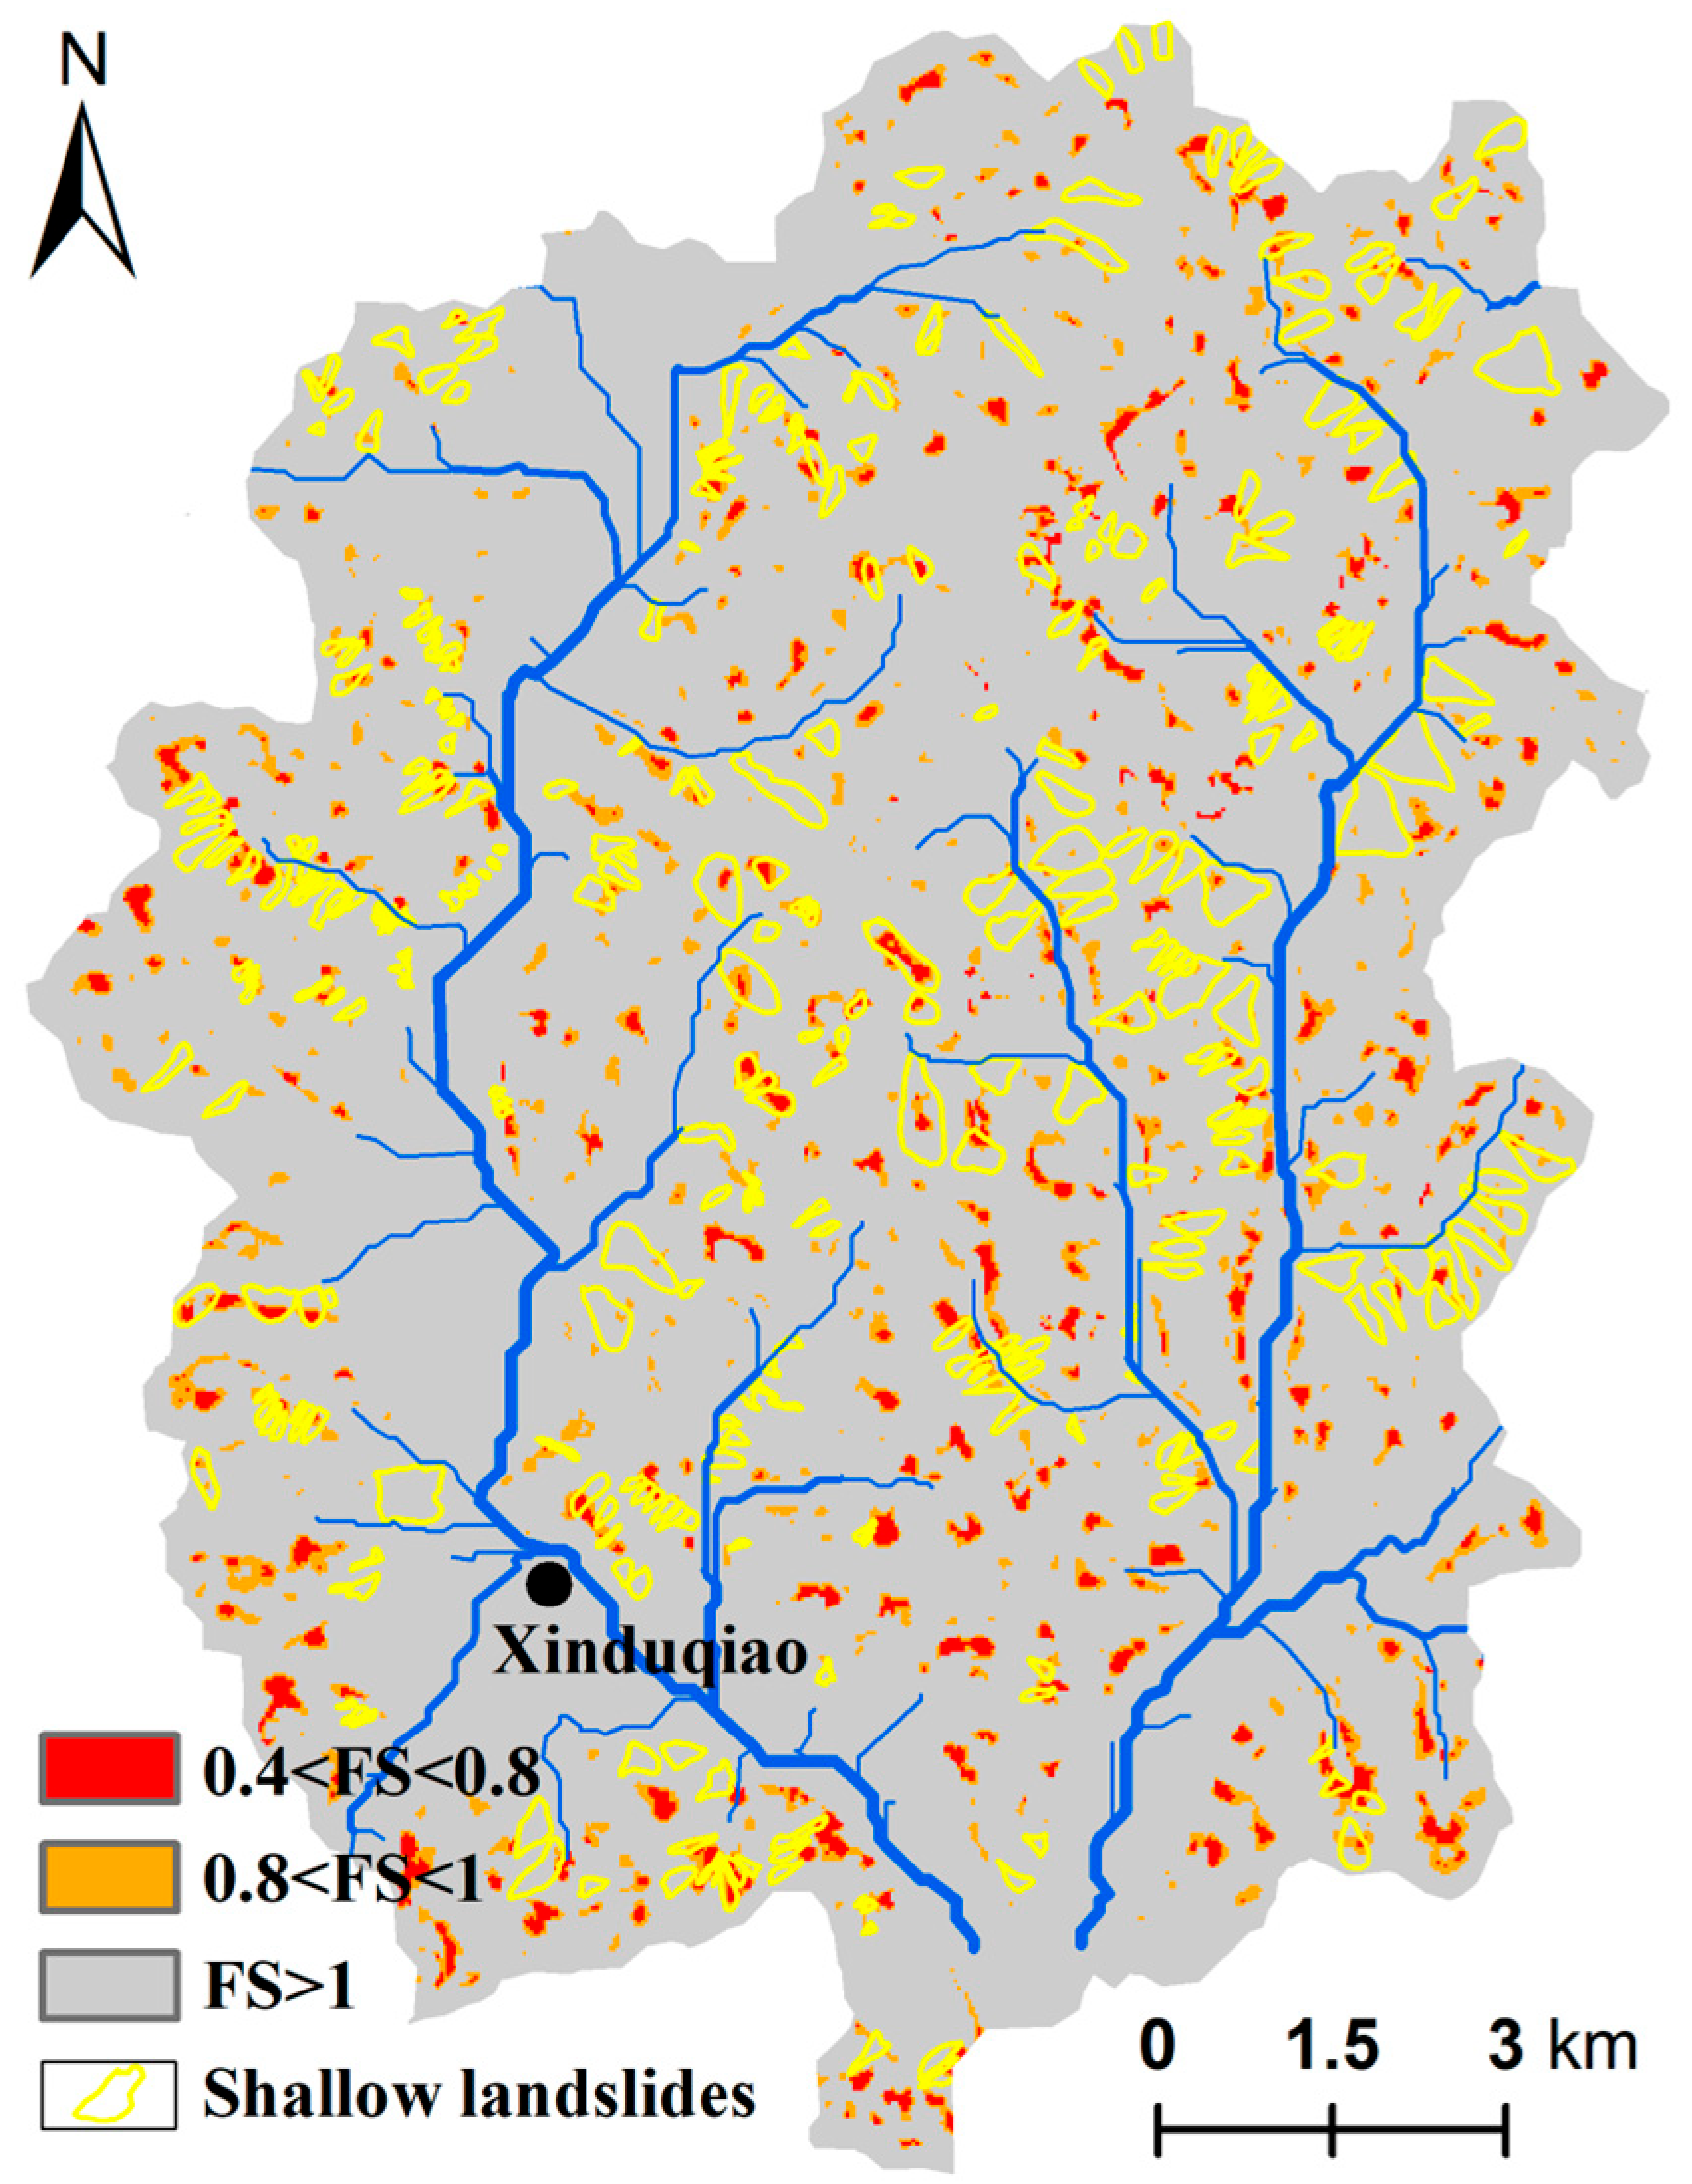
Following this, the adjusted groundwater levels have been incorporated into TRIGRS for slope stability analysis. In the predictive results of the TOP-TRIGRS model (
Figure 10), 3.12% coincide with the most unstable class (0.4 and 0.8). The subsequent class (0.8 and 1.0) accounts for approximately 5.4%. Combined (
FS < 1), they yield 8.52% of the unstable area, slightly less than that computed by the TRIGRS model.
5. Discussion
5.1. Validation of Models
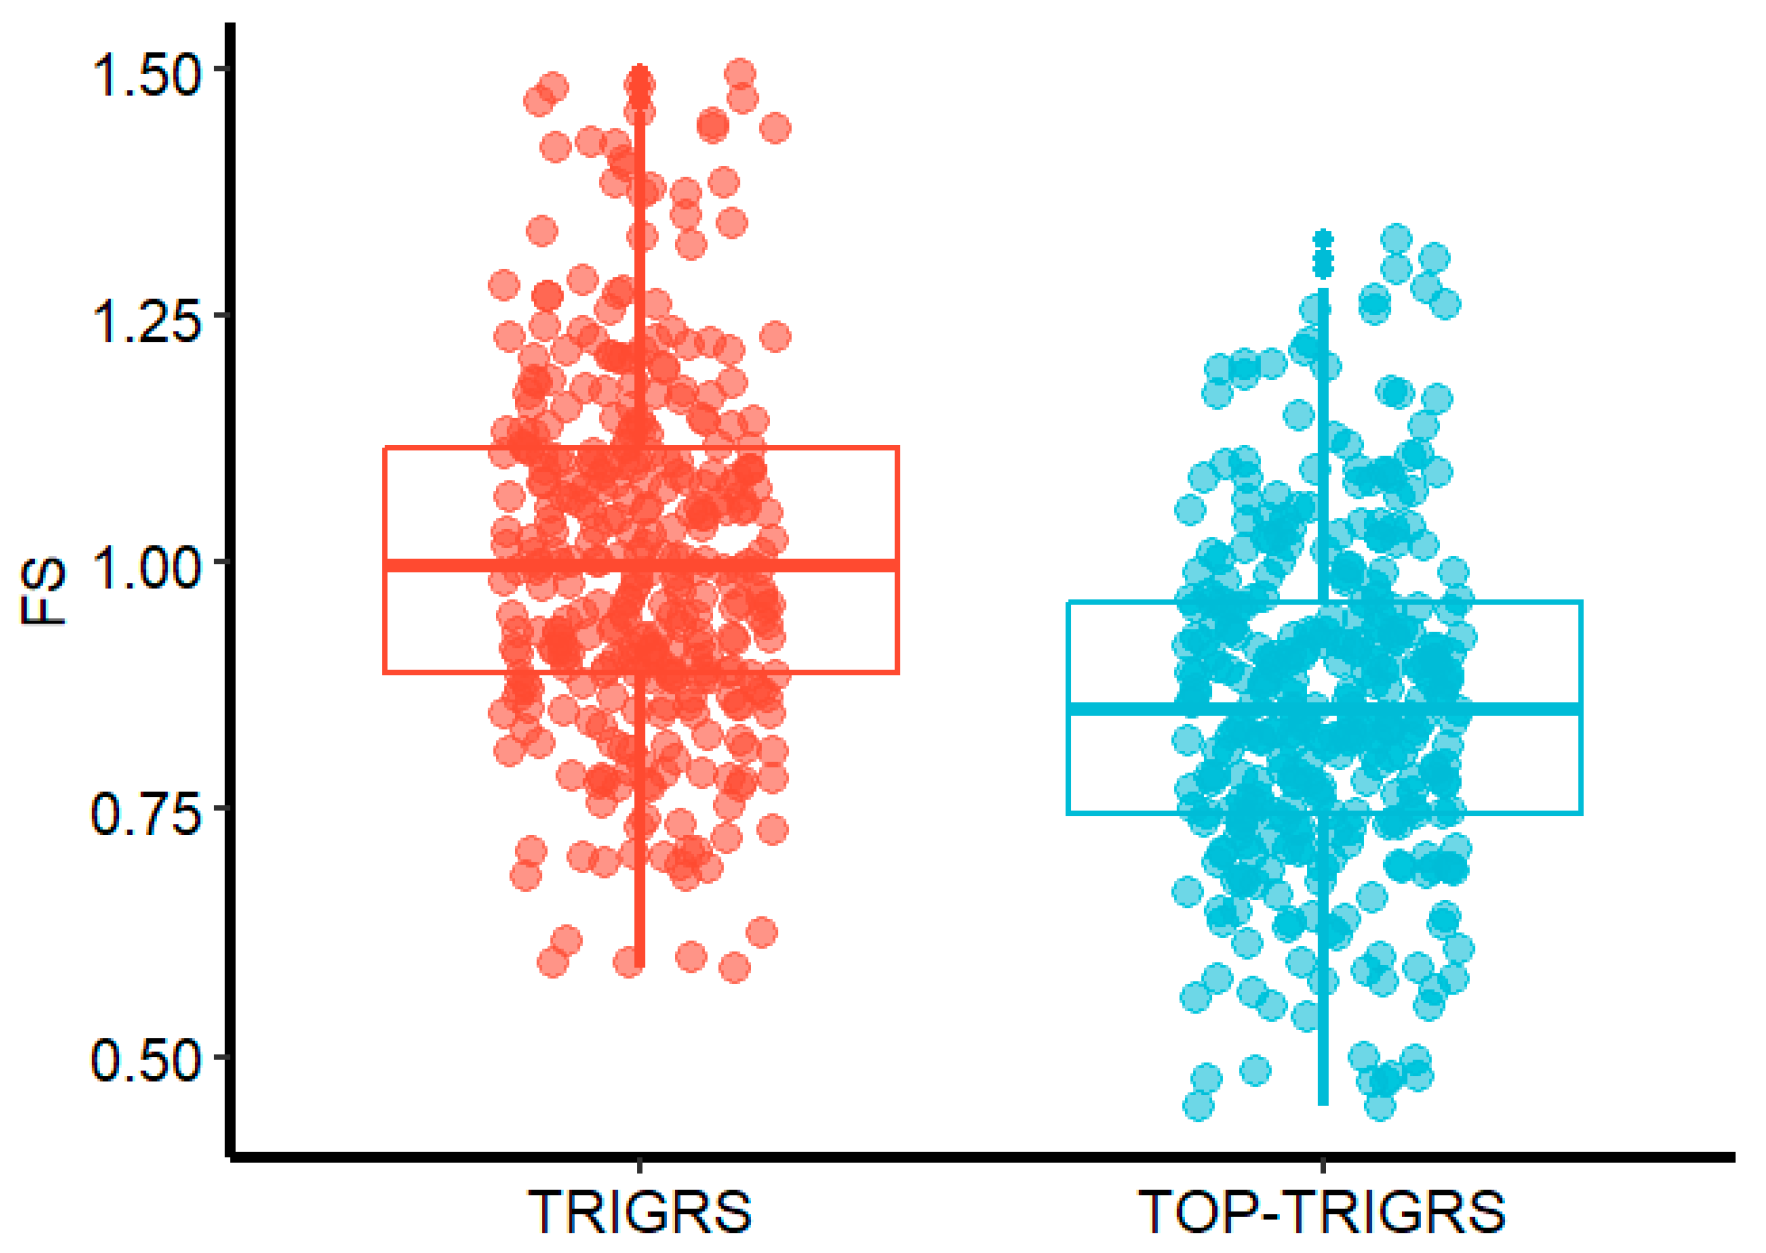
Validation is an integral component of geological hazard risk assessment research, as it serves to substantiate the effectiveness and scientific significance of models. In this study, we validated the accuracy of the TRIGRS and TOP-TRIGRS models using shallow landslide catalog obtained from field investigation and visual interpretation of 0.5 m resolution Google Earth images. Firstly, the average
FS within each actual slide zones were extracted separately, which can be seen in
Figure 11.
In the TRIGRS prediction results, the FS of actual slide zones ranged from 0.59 to 1.49. The average FS value was 1.02 with a standard deviation of 0.18; 169 slide zones had an average FS value of less than 1, which accounted for 50.31% of the total. In the TOP-TRIGRS prediction results, the FS of actual shallow slide zones ranged from 0.44 to 1.32. The average FS value was 0.86 with a standard deviation of 0.17; 270 slide zones had an average FS value of less than 1, which accounted for 80.35% of the total. Overall, under consistent parameter conditions (in addition to the initial groundwater level condition), the TOP-TRIGRS model makes more accurate determinations of actual shallow landslide areas.
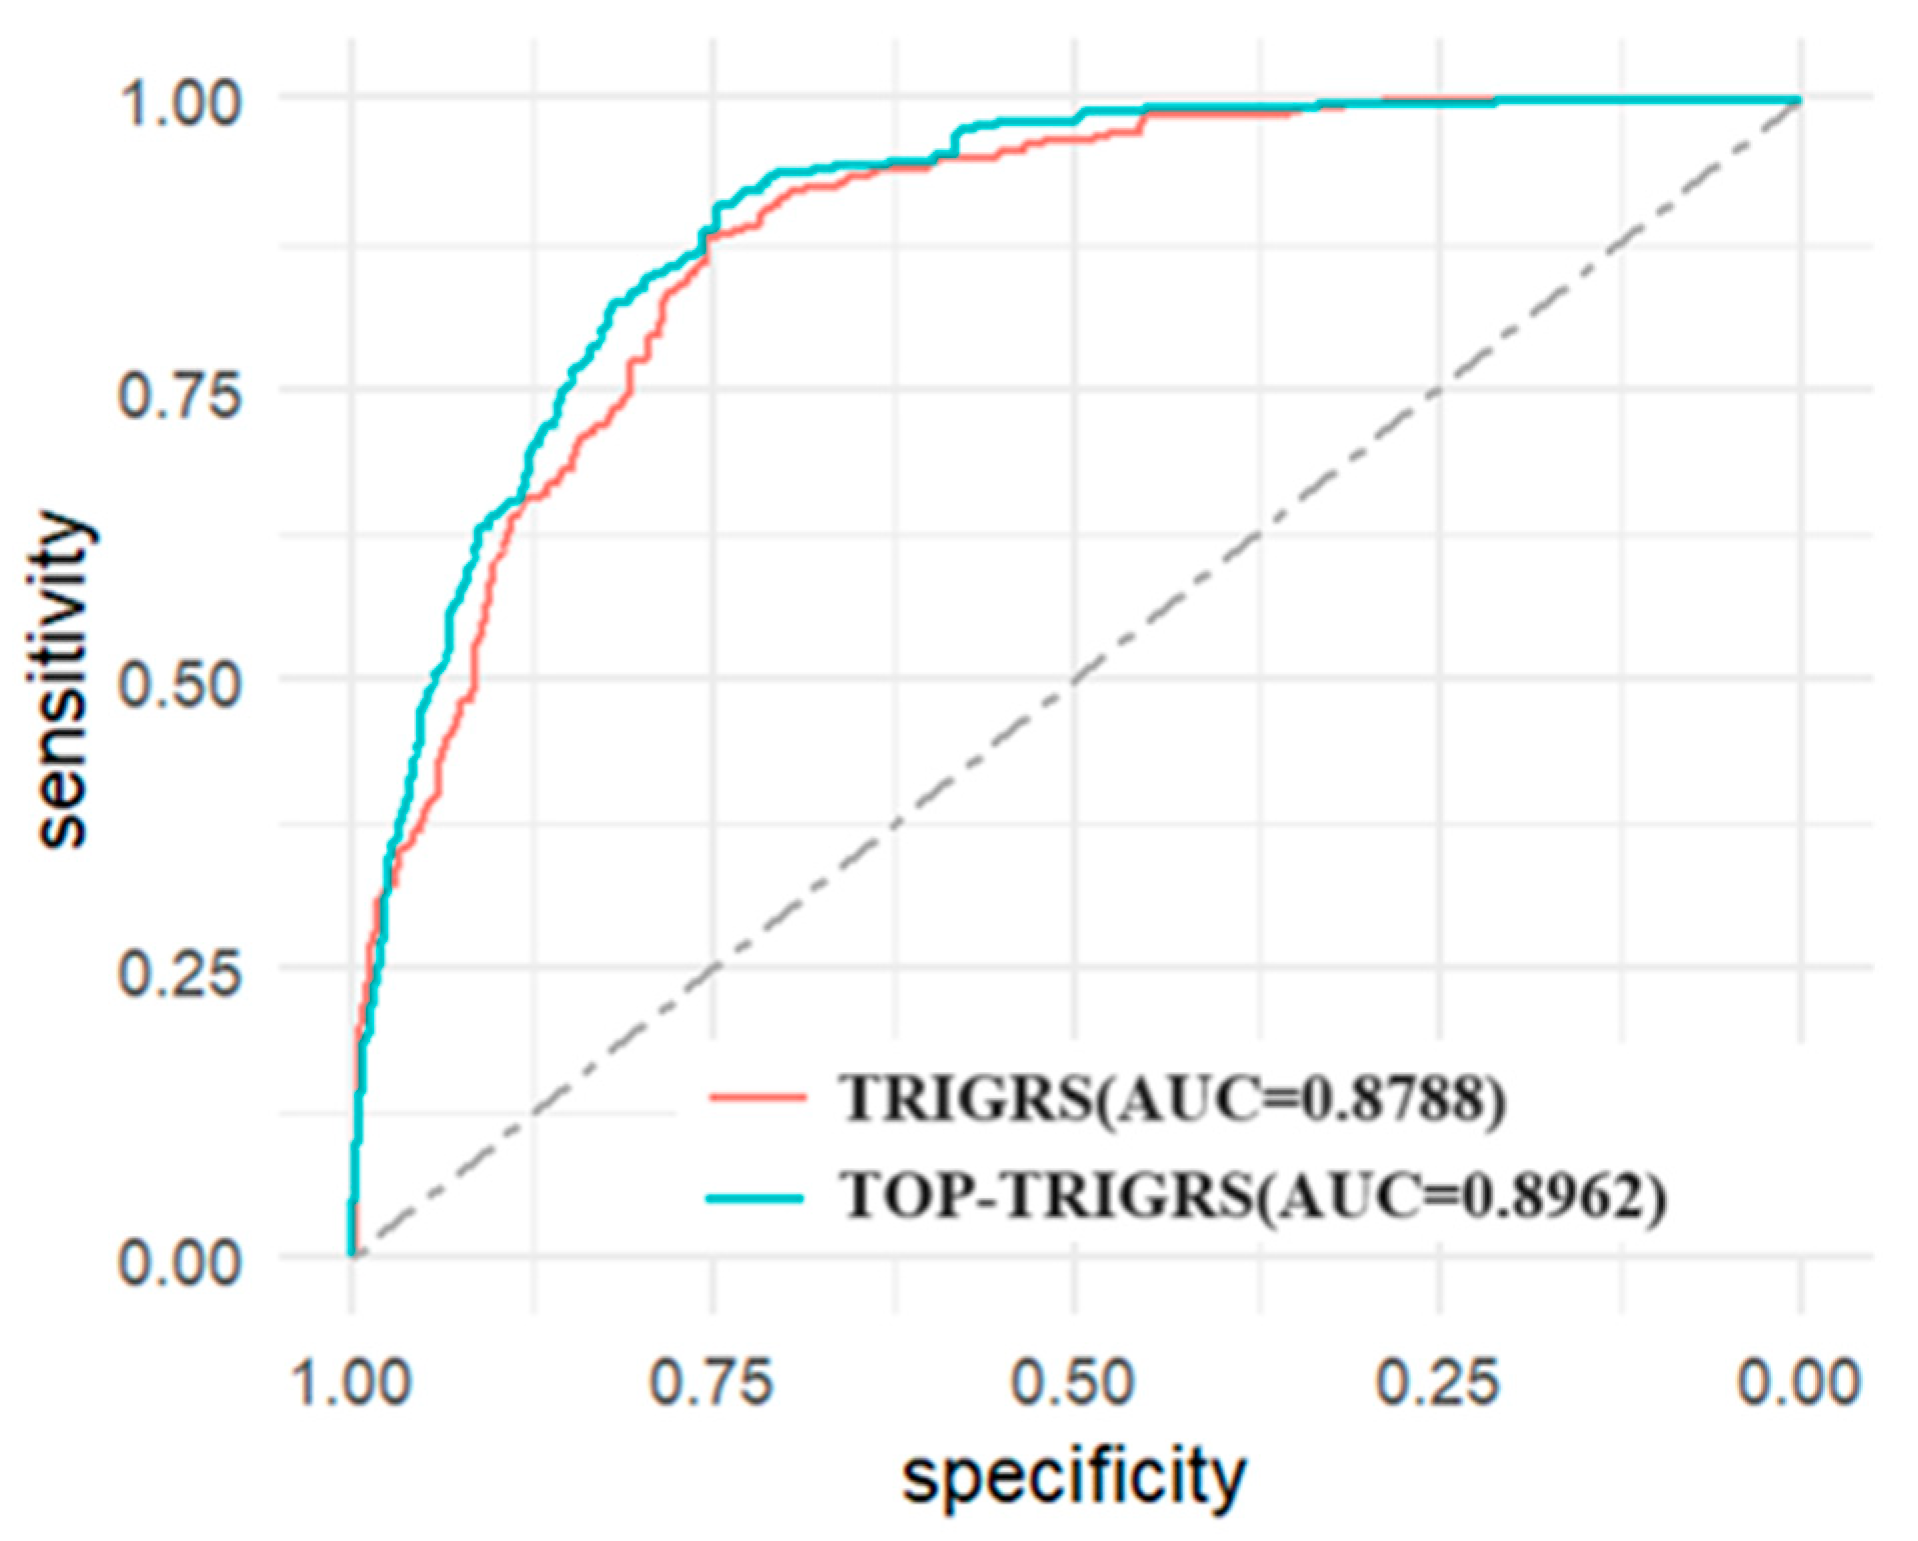
To enhance the accuracy assessment of the models, receiver operating characteristic (ROC) curves were employed to evaluate the predictive performance of both the TRIGRS and TOP-TRIGRS models.
Figure 12 illustrates the predictive performance of these models. For the TRIGRS model, the area under the ROC curve (AUC) was 0.896, with optimal critical thresholds and confidence intervals of 1.19 and (0.794, 0.907), respectively. In contrast, the TOP-TRIGRS model yielded an AUC value of 0.878, with optimal critical thresholds and confidence intervals of 1.38 and (0.345, 0.796), respectively. These statistical parameters indicate that the TOP-TRIGRS model, after correcting for groundwater level conditions, achieved a higher AUC value and relatively narrower confidence intervals. Compared to the TRIGRS model, the TOP-TRIGRS model exhibited greater precision and stability in predicting shallow landslides.
5.2. Prediction Results in Detail
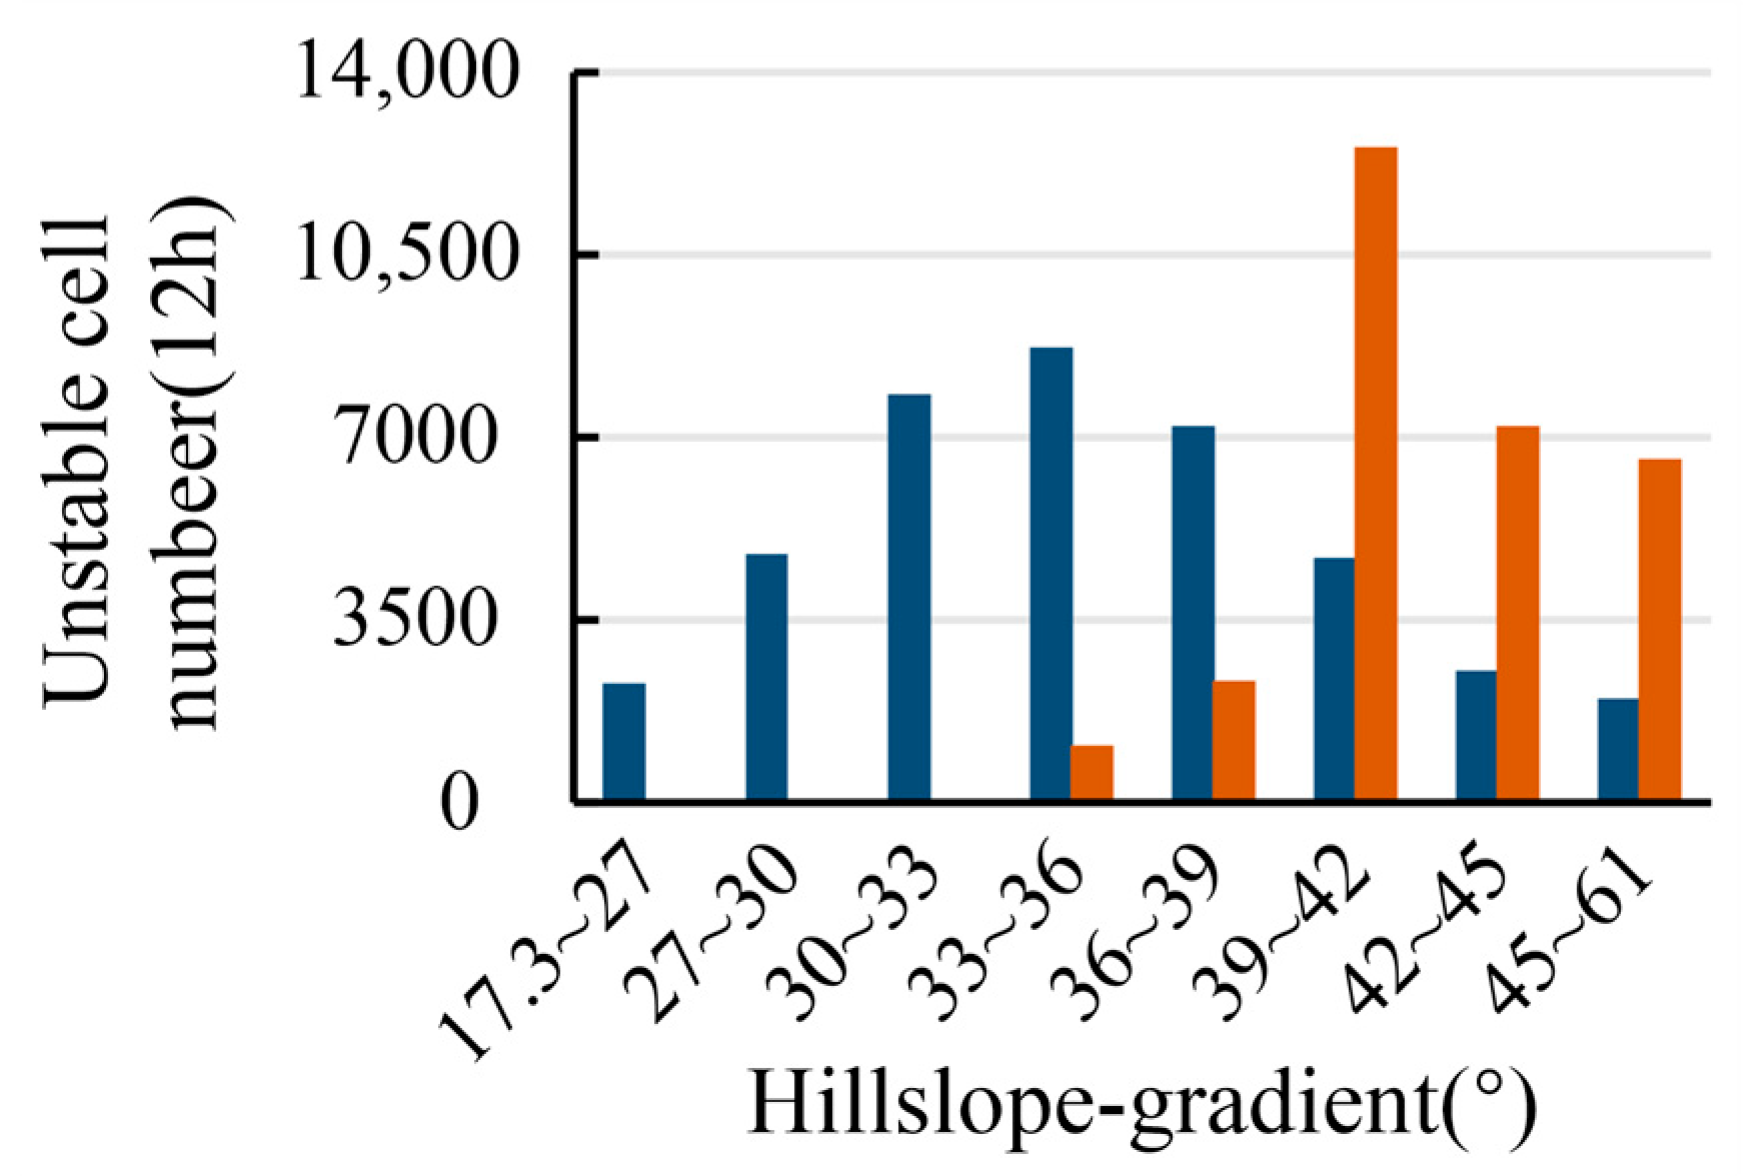
In terms of the spatial distribution of instability areas (
FS < 1), the two models exhibit distinct characteristics, as depicted in
Figure 13. An analysis of the terrain slopes associated with the unstable regions computed by TRIGRS and TOP-TRIGRS was conducted. The results reveal that unstable regions identified by TRIGRS are predominantly situated within the slope range of 33° to 61°, with the most significant concentration observed between 39° and 42°, accounting for 30.7% of the total unstable area. Conversely, unstable regions identified by TOP-TRIGRS are distributed across a slope range of 17.3° to 61.0°, with the highest concentration occurring between 33° and 36°, constituting 21.3% of the total unstable area. Overall, terrain slopes associated with unstable regions identified by TOP-TRIGRS tend to be lower than those identified by TRIGRS.
To elucidate this variation, attention can be drawn to a specific shallow landslide within the meadow soil.
Figure 14b,c illustrate the stability simulation outcomes of an actual erosion area within the central part of the study area conducted by TRIGRS and TOP-TRIGRS, respectively. It is noticeable that the unstable regions simulated by TRIGRS are primarily situated in steep areas near the slope’s summit, with most unstable regions having
FS values ranging from 0.8 to 1. In contrast, the unstable regions predicted by TOP-TRIGRS extend to the gentler slopes in the lower part of the slope, showing a tendency for lower
FS values near the bottom compared to the top.
Due to the oversight of groundwater exchange between grid cells in the TRIGRS model, it tends to overestimate groundwater levels in recharge zones within the same catchment area. This overestimation leads to lower FS values and an exaggerated extent of unstable areas near the recharge zones compared to the actual conditions. Conversely, in discharge zones, the model underestimates groundwater levels, resulting in higher FS values and an underestimation of the extent of unstable areas near the discharge zones compared to the actual conditions.
Figure 14a illustrates the real instability condition of the landslide area following a heavy rainfall event, indicating that the sliding failure initiates from the lower end of the slope and progressively extends towards the hilltop. The simulation outcomes from TOP-TRIGRS align more closely with the actual field erosion damage state and the theoretical schematic model.
6. Conclusions
Restraining the aggravation of shallow landslide of subalpine meadow soil is of decisive significance for conservation of soil and water on the eastern Tibetan Plateau. This paper proposed a deterministic model to assess rainfall-induced shallow slide erosions of subalpine meadow soil, and the prediction model was validated in a catchment north to the Xinduqiao County, Sichuan Province, southwestern China. The study can be concluded as follows:
(1) In the study area, numerous instances of shallow landslide occur across the subalpine meadow soil slopes, with rainfall serving as the primary triggering factor. The seepage pressure induced by subsurface flow within temporary saturated zones emerges as the primary catalyst for slides, reflecting a combination of gravitational and hydraulic forces. During intense rainfall events, erosion typically commences at the slope’s base and gradually advances upwards until the entire slope is affected, resulting in the exposure of bare land.
(2) The combined TOP-TRIGRS model, integrating TRIGRS and TOPMODEL, was utilized to simulate shallow landslides triggered by heavy rainfall events within the study area, with predictive outcomes compared against the traditional TRIGRS model. Results reveal that unstable regions predicted by the TRIGRS model are mainly concentrated within the 39° to 42° slope range, while those by the TOP-TRIGRS model are primarily within the gentler 33° to 36° slope range. The TRIGRS model predicts unstable areas covering 9.6% of the total study area, whereas the TOP-TRIGRS model covers 8.5%.
(3) The model reliability was assessed, revealing that the TRIGRS model identified 50.31% of actual shallow landslides, whereas the TOP-TRIGRS model identified 80.35% of these zones, indicating superior predictive performance over the TRIGRS model. Regarding the ROC curve analysis, the area under the curve (AUC) for the TOP-TRIGRS model was 0.896, exceeding the TRIGRS model’s AUC of 0.878. Thus, the TOP-TRIGRS model demonstrated higher precision in predicting shallow landslides compared to the TRIGRS model.
(4) Due to the oversight of groundwater exchange between grid cells, the TRIGRS model tends to overestimate unstable areas, particularly at the steep areas atop slopes, thereby exaggerating the extent of shallow landslides. Additionally, the TRIGRS model fails to identify the onset of erosion at lower slope portions. The TOP-TRIGRS model partially mitigates these limitations of the TRIGRS model in assessing shallow landslides of subalpine meadow soil zones. The findings of this study carry significant theoretical and practical implications for soil and water conservation in the eastern Tibetan Plateau.
Author Contributions
Conceptualization, J.G. and H.X.; methodology, S.L.; software, S.Y.; validation, S.Y. and Z.Q.; investigation, S.L. and Z.Q.; data curation, S.Y.; writing—original draft preparation, H.X.; writing—review and editing, J.G.; project administration, J.G.; funding acquisition, J.G. and H.X. All authors have read and agreed to the published version of the manuscript.
Funding
This research was funded by the National Natural Science Foundation of China, grant number 41807292 and Program of China Scholarship Council, grant number 202409230004.
Data Availability Statement
The original contributions presented in this study are included in the article. Further inquiries can be directed to the corresponding author(s).
Acknowledgments
The authors are particularly grateful to the reviewers for their constructive comments and suggestions, which have greatly improved the quality of this manuscript.
Conflicts of Interest
Authors Huabo Xiao and Sijia Li were employed by the company POWERCHINA Chengdu Engineering Corporation Limited. The remaining authors declare that the research was conducted in the absence of any commercial or financial relationships that could be construed as a potential conflict of interest.
References
- Lee, S.R.; Berlow, E.L.; Ostoja, S.M.; Brooks, M.L.; Génin, A.; Matchett, J.R.; Hart, S.C. A multi-scale evaluation of pack stock effects on subalpine meadow plant communities in the Sierra Nevada. PLoS ONE 2017, 12, e0178536. [Google Scholar] [CrossRef] [PubMed]
- Lubetkin, K.C.; Westerling, A.L.; Kueppers, L.M. Climate and landscape drive the pace and pattern of conifer encroachment into subalpine meadows. Ecol. Appl. 2017, 27, 1876–1887. [Google Scholar] [CrossRef]
- Albano, C.M.; McClure, M.L.; Gross, S.E.; Kitlasten, W.; Soulard, C.E.; Morton, C.; Huntington, J. Spatial patterns of meadow sensitivities to interannual climate variability in the Sierra Nevada. Ecohydrology 2019, 12, e2128. [Google Scholar] [CrossRef]
- Dunne, J.A.; Harte, J.; Taylor, K.J. Subalpine meadow flowering phenology responses to climate change: Integrating experimental and gradient methods. Ecol. Monogr. 2003, 73, 69–86. [Google Scholar] [CrossRef]
- Wang, Y.; Li, X.Y.; Wu, X.C.; Wu, H.W.; Zhang, J.H.; Wu, Y.N.; Zhao, C.Y. Temporal changes of soil respiration in a subalpine meadow in the Heihe River Basin, Northwest China. CATENA 2019, 178, 267–275. [Google Scholar] [CrossRef]
- Luo, Z.; Liu, J.; Jia, T.; Chai, B.; Wu, T. Soil bacterial community response and nitrogen cycling variations associated with subalpine meadow degradation on the Loess Plateau, China. Appl. Environ. Microbiol. 2020, 86, e00180-20. [Google Scholar] [CrossRef]
- Li, G.; Li, X.; Chen, W.; Li, J.; Zhu, H.; Hu, X.; Zhou, H.; Sun, H. Effects of degradation severity on the physical, chemical and mechanical properties of topsoil in alpine meadow on the Qinghai-Tibet Plateau, west China. CATENA 2020, 187, 104370. [Google Scholar] [CrossRef]
- Shi, X.; Zhang, F.; Wang, L.; Jagirani, M.D.; Zeng, C.; Xiao, X.; Wang, G. Experimental study on the effects of multiple factors on spring meltwater erosion on an alpine meadow slope. Int. Soil Water Conserv. Res. 2020, 8, 116–123. [Google Scholar] [CrossRef]
- Li, Y.; Degen, A.A.; Sun, T.; Wang, W.; Bai, Y.; Zhang, T.; Long, R.; Shang, Z. Three years of cultivating or fencing lands have different impacts on soil nutrients and properties of a subalpine meadow in the Tibetan plateau. CATENA 2020, 186, 104306. [Google Scholar] [CrossRef]
- Ma, M.; Baskin, C.C.; Li, W.; Zhao, Y.; Zhao, Y.; Zhao, L.; Chen, N.; Du, G. Seed banks trigger ecological resilience in subalpine meadows abandoned after arable farming on the Tibetan Plateau. Ecol. Appl. 2019, 29, e01959. [Google Scholar] [CrossRef] [PubMed]
- Montgomery, D.R.; Dietrich, W.E. A physically based model for the topographic control on shallow landsliding. Water Resour. Res. 1994, 30, 1153–1171. [Google Scholar] [CrossRef]
- Dietrich, W.E.; Bellugi, D.; De Asua, R.R. Validation of the shallow landslide model, SHALSTAB, for forest management. Water Sci. Appl. 2001, 2, 195–227. [Google Scholar]
- Wu, W.; Sidle, R.C. A distributed slope stability model for steep forested basins. Water Resour. Res. 1995, 31, 2097–2110. [Google Scholar] [CrossRef]
- Dhakal, A.S.; Sidle, R.C. Long-term modelling of landslides for different forest management practices. Earth Surf. Process. Landf. 2003, 28, 853–868. [Google Scholar] [CrossRef]
- Nery, T.D.; Vieira, B.C. Susceptibility to shallow landslides in a drainage basin in the Serra do Mar, São Paulo, Brazil, predicted using the SINMAP mathematical model. Bull. Eng. Geol. Environ. 2015, 74, 369–378. [Google Scholar] [CrossRef]
- Montrasio, L.; Valentino, R.; Losi, G.L. Rainfall-induced shallow landslides: A model for the triggering mechanism of some case studies in Northern Italy. Landslides 2009, 6, 241–251. [Google Scholar] [CrossRef]
- Ciurleo, M.; Mandaglio, M.C.; Moraci, N. Landslide susceptibility assessment by TRIGRS in a frequently affected shallow instability area. Landslides 2019, 16, 175–188. [Google Scholar] [CrossRef]
- Alvioli, M.; Baum, R.L. Parallelization of the TRIGRS model for rainfall-induced landslides using the message passing interface. Environ. Model. Softw. 2016, 81, 122–135. [Google Scholar] [CrossRef]
- Baum, R.L.; Godt, J.W.; Savage, W.Z. Estimating the timing and location of shallow rainfall-induced landslides using a model for transient, unsaturated infiltration. J. Geophys. Res. Earth Surf. 2010, 115, F03013. [Google Scholar] [CrossRef]
- Beven, K.J.; Kirkby, M.J.; Schofield, N.; Tagg, A.F. Testing a physically-based flood forecasting model (TOPMODEL) for three UK catchments. J. Hydrol. 1984, 69, 119–143. [Google Scholar] [CrossRef]
- He, J.; Qiu, H.; Qu, F.; Hu, S.; Yang, D.; Shen, Y.; Zhang, Y.; Sun, H.; Cao, M. Prediction of spatiotemporal stability and rainfall threshold of shallow landslides using the TRIGRS and Scoops3D models. CATENA 2021, 197, 104999. [Google Scholar] [CrossRef]
- Park, D.; Nikhil, N.V.; Lee, S.R. Landslide and debris flow susceptibility zonation using TRIGRS for the 2011 Seoul landslide event. Nat. Hazards Earth Syst. Sci. 2013, 1, 2547–2587. [Google Scholar] [CrossRef]
- Tran, T.V.; Alvioli, M.; Lee, G.; An, H.U. Three-dimensional, time-dependent modeling of rainfall-induced landslides over a digital landscape: A case study. Landslides 2018, 15, 1071–1084. [Google Scholar] [CrossRef]
- Tufano, R.; Formetta, G.; Calcaterra, D.; De Vita, P. Hydrological control of soil thickness spatial variability on the initiation of rainfall-induced shallow landslides using a three-dimensional model. Landslides 2021, 18, 3367–3380. [Google Scholar] [CrossRef]
- Fusco, F.; Mirus, B.B.; Baum, R.L.; Calcaterra, D.; De Vita, P. Incorporating the effects of complex soil layering and thickness local variability into distributed landslide susceptibility assessments. Water 2021, 13, 713. [Google Scholar] [CrossRef]
- De Vita, P.; Agrello, D.; Ambrosino, F. Landslide susceptibility assessment in ash-fall pyroclastic deposits surrounding Mount Somma-Vesuvius: Application of geophysical surveys for soil thickness mapping. J. Appl. Geophys. 2016, 59, 126–139. [Google Scholar] [CrossRef]
- Del Soldato, M.; Pazzi, V.; Segoni, S.; De Vita, P.; Tofani, V.; Moretti, S. Spatial modeling of pyroclastic cover deposit thickness (depth to bedrock) in peri-volcanic areas of Campania (southern Italy). Earth Surf. Process. Landf. 2018, 43, 1757–1767. [Google Scholar] [CrossRef]
| Disclaimer/Publisher’s Note: The statements, opinions and data contained in all publications are solely those of the individual author(s) and contributor(s) and not of MDPI and/or the editor(s). MDPI and/or the editor(s) disclaim responsibility for any injury to people or property resulting from any ideas, methods, instructions or products referred to in the content. |
© 2025 by the authors. Licensee MDPI, Basel, Switzerland. This article is an open access article distributed under the terms and conditions of the Creative Commons Attribution (CC BY) license (https://creativecommons.org/licenses/by/4.0/).
