Abstract
The instability of bank slopes with uneven and soft geological layers under a heaped load will influence the safe and normal operation of ports. Therefore, this paper takes the bank slope in Xiaqinglong Port for slope stability evaluation and treatment measure effectiveness analysis. Firstly, the geological conditions, material composition and potential failure modes of the bank slope were determined through a field investigation and engineering geological analysis. Moreover, the slope stability was evaluated and calculated using the finite difference method (FDM) and the limit equilibrium method (LEM) with Bishop and Morgenstern–Price and a method considering pile resistance. Moreover, passing flow analysis (PFA) was applied to optimize the treatment measure design, and the treatment measures’ effectiveness was analyzed with simulation results. The results indicated that (1) the upper soft and lower hard strata are the main cause of the bank slope’s instability and deformation under heaped loads; (2) PFA can effectively calculate the maximum resistance of the pile and optimize the pile arrangement, with three rows with spacing of 2.3 m and a length of 22 m; (3) with piles, the stability of the bank slope improves from unstable to stable, along with an increase in the stability coefficient and a reduction in displacement, as well as a maximum shear strain increment and plastic zones. The study provides certain contributions to stability evaluation and treatment design optimization to prevent the potential instability and failure of similar bank slopes under the action of heaped loads.
1. Introduction
With the development of the global economy, ports and wharves along rivers and coasts are key to connecting various regions and promoting economic exchange at the core intersection of water and land transportation. In port and coastal engineering, a high-pile wharf is a typical hydraulic structure that utilizes pile foundations to transmit the upper load to deeper stable strata [1,2] and improve the bank slope’s stability through anti-sliding piles [3,4]. However, due to the complex geological conditions and sedimentary environment, the uneven and soft geological layers of the upper soft and lower hard strata influence the bank slope’s stability, especially under a heaped load, threatening the safe use, normal operation, and structural stability of the wharf and people’s lives and property. Therefore, it is necessary to evaluate bank slopes’ stability and analyze the treatment measures’ effectiveness, which would enhance the safety and stability of bank slopes and achieve the goal of disaster prevention.
Nowadays, many scholars have studied the deformation modes and failure mechanisms of bank slopes. Due to their efficiency and convenience, numerical methods are widely used to analyze the instability mechanism, simulate the deformation characteristics, and evaluate the bank slope’s stability, including the finite element method (FEM) [5,6,7,8], discrete element method (DEM) [9,10,11], finite difference method (FDM) [12,13,14], etc. Meanwhile, model tests are utilized to clarify and analyze the deformation and failure mechanisms and stage characteristics, stability changes, etc., of the bank slope with pile foundations by reproducing the deformation and failure process [15,16], while centrifugal model tests are adopted to study the deformation characteristics, failure mode, displacement variations, internal force rules, etc., of the bank slope under heaped loads [17,18].
As for the instability or low stability of bank slopes, some scholars have studied treatment measures and their effectiveness. Some studies have analyzed the pile reinforcement mechanism and optimized the treatment measures based on the slope deformation process and failure mechanism, proposing a pile foundation correction reinforcement method [19] and demonstrating the reinforcement effect [20,21]. Considering the mechanical mechanism of pile foundations, some scholars have illustrated optimized schemes’ effectiveness, such as through the mechanical response of the pile structure or design and slope stability [22,23,24] and the soil arch and thrust sharing between the piles regarding the reinforcement effect [25,26,27].
According to the above literature review, it can be concluded that pile foundations can reinforce the bank slope, but there is no clear stability evaluation method or treatment measures for the bank slope due to the complex geological conditions [28,29], pile–soil interaction [30,31], etc. Therefore, this paper takes the river bank slope in Xiaqinglong Port in Jingjiang City, Jiangsu Province, along the Yangtze River, as the research object to evaluate the bank slope’s stability and analyze the treatment measures’ effectiveness. Based on a field investigation, the soil mechanical parameters, and the geological engineering conditions of the study area, the stability influencing factors and deformation mechanism of the bank slope were determined. Meanwhile, considering a heaped load and the upper soft and lower hard geological layers, the bank slope stability and potential failure modes were comprehensively evaluated using the 2D limit equilibrium method (LEM) with Bishop and Morgenstern–Price, a method considering pile resistance, and the 3D finite difference method (FDM). In addition, passing flow analysis (PFA) was utilized to calculate the pile’s maximum resistance and optimize the treatment measure design. Combining this with the calculation results, the treatment measures’ effectiveness was verified. This study is of great practical significance for stability evaluation and treatment measure optimization for similar bank slopes with high pile foundations under a heaped load.
2. Overview of the Study Area
2.1. Location and Topography of the Study Area
The study area is located on the left bank slope of Xiaqinglong Port on the Yangtze River in Jingjiang City, Jiangsu Province (Figure 1). The landform of the study area comprises the alluvial plains of the Yangtze River Delta, with relatively gentle terrain undulations. The study area involves land and water areas, and the terrain elevation difference is relatively large, with elevations ranging from −3.43 m below sea level to 6.86 m above sea level.
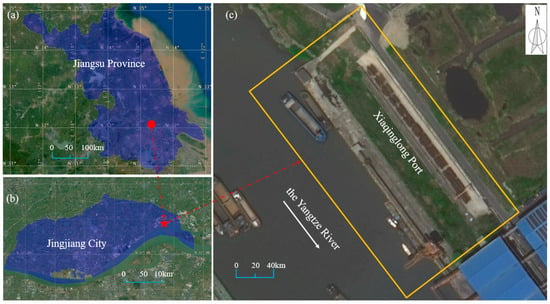
Figure 1.
Location and image of the bank slope: (a) scope of Jiangsu Province; (b) scope of Jingjiang City; (c) scope of Xiaqinglong Port.
The land area of the study area can be divided into farmland, the embankment, and the floodplain: the farmland includes artificial filled soil, the embankment consists of artificial filled soil and concrete, and the floodplain is composed of cohesive soil and crushed stones caused by river water erosion. The water area contains the riverbed and bank slope, where silt is accumulated. The water level of the river before the normal operation of the wharf in Xiaqinglong Port was about 1.00–1.30 m above sea level, with 150–220 m in width and 2.0–2.3 m in depth. Moreover, the groundwater within the bank slope and wharf is phreatic water, and the phreatic water and the Yangtze River are complementary to each other. According to the permeability test of the soil layer of the upper 20 m bank slope, it is known that the soil layer is a weakly permeable layer.
2.2. Geological Engineering Background of the Bank Slope
The study area is located in the northeast of the Yangtze formation, with relatively complete geological stratum development. The bank slope in Xiaqinglong Port is mainly composed of marine sedimentary strata with conformable or disconformable contacts between strata. There are no active fault structures near the study area, which has a relatively stable structural fault block. The geological structure of the study area is relatively stable, with little influence on the bank slope.
According to the field investigation and the stratum information revealed by the drilling core (Figure 2), it can be concluded that the bank slope stratum includes soil layers of the Quaternary Holocene (Q4al), with the characteristics of upper soft and lower hard layers. The upper soil layers of the bank slope are composed of the fill soil and soft cohesive soil of the floodplain phase, while the lower soil layers of the bank slope consist of the sandy soil of the riverbed phase. Due to the poor properties of the mucky silty clay within the bank slope, its thickness can determine the depth and location of the potential sliding surface. Therefore, the section with the thickest mucky silty clay is selected as a typical section of the bank slope (Figure 3). Based on the field investigation and drilling core, the bank slope is divided into 8 soil layers from top to bottom. The description of each soil layer is as follows.
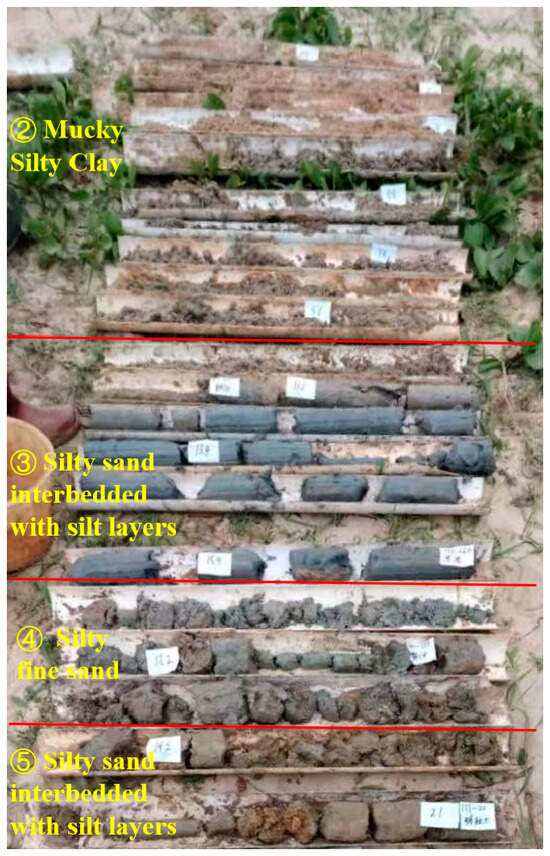
Figure 2.
Diagram of the core of the bank slope.
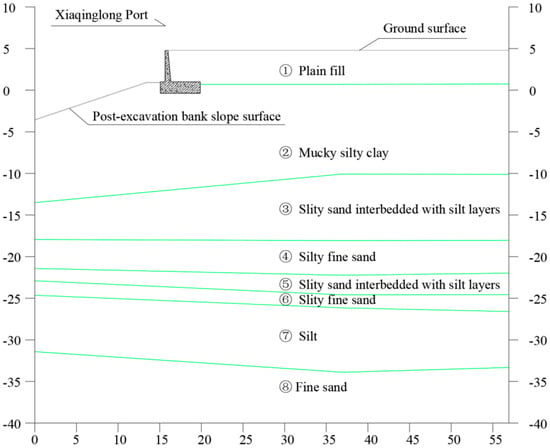
Figure 3.
Diagram of the soil layers of the bank slope.
- Plain fill: This is gray yellow or gray loose silty soil in a plastic flow with an average thickness of about 1.39 m. The physical and mechanical properties of the soil layer are uneven, with high compressibility and poor engineering properties.
- Mucky silty clay: This is a grey and clear-layered mucky silty clay in a plastic flow with an average thickness of about 12.58 m. The soil layer has high compressibility, low strength, moderate dry strength, and moderate toughness.
- Silty sand interbedded with silt layer: This is grey, slightly dense, and saturated mucky silty sand interbedded with a silt layer, with an average thickness of about 5.59 m. The soil layer has medium compressibility, medium strength, and general engineering properties.
- Silty fine sand: This is a grey, medium-density, and saturated silty fine sand with an average thickness of about 7.39 m. The soil layer has good particle size gradation, medium compressibility, medium strength, and better engineering properties.
- Silty sand interbedded with silt layer: This is grey, slightly dense, and wet mucky silty sand interbedded with a silt layer, with an average thickness of about 3.46 m. The soil layer has medium compressibility, medium strength, and general engineering properties.
- Silty fine sand: This is a grey, clear-layered, medium-density, and saturated silty fine sand with an average thickness of about 5.40 m. The soil layer has medium compressibility, medium strength, and better engineering properties.
- Silt: This is grey, slightly to moderately dense, and wet silt with an average thickness of about 6.27 m. The soil layer has moderate to low dry strength, moderate to low toughness, moderate compressibility, moderate strength, and general engineering properties.
- Fine sand: This is a grey, slightly to moderately dense, and saturated fine sand. The soil layer has good particle size gradation, medium to low compressibility, medium to high strength, and good engineering properties.
2.3. Construction Scheme of the Wharf and Working Conditions
It is proposed to adopt a wharf with high piles as the wharf foundation and treatment measure for the bank slope. The original ground surface is cut and changed to reflect the bank slope over the water and land area and the storage yard on the rear land area (Figure 4).

Figure 4.
Diagram of the construction of the wharf.
As a design requirement, the heaped load of the storage yard on the rear land area is 150 kPa. The river water level changes under different wharf operation conditions, being −1.28 m, −0.40 m, 3.07 m, and 5.21 m at extremely low, design low, design high, and extremely high water levels, respectively. The original ground surface is excavated twice, leading to the lowest elevation of the riverbed of −5.50 m and the bank slope ratio of 1:3. The pile foundations are designed in multiple rows and a plum blossom shape.
Owing to the fact that the piles play a critical role in the bank slope’s stability, the pile foundation scheme has to enable the safe use and normal operation of the wharf. This paper takes the most dangerous operating condition combination during normal operation as the working conditions; therefore, the condition of a sharp drop in the water level is not considered. According to the requirements of the relevant standard [32], the value of the bank slope stability under the working conditions is 1.25. The operating conditions considered in the working conditions are as follows:
- Water level: extremely low water level of −1.28 m below sea level;
- Groundwater level of storage yard: 2.60 m above sea level;
- Heaped load of storage yard: 150 kPa.
2.4. Potential Failure Mechanism Analysis of the Bank Slope
According to the field investigation, the material composition of the bank slope, the engineering characteristics of the soil layers, and the construction scheme of the wharf, the potential failure of the bank slope is mainly influenced by topography changes, the lithology characteristics, and human engineering activities.
Surface excavation during wharf construction leads to a height difference of nearly 11 m between the top and bottom of the bank slope, with a steeper topographical falling gradient. Moreover, the original stress inside the bank slope is released with the excavation, resulting in the redistribution of stress and a reduction in the resistance within the bank slope. Therefore, the topography change of the bank slope provides sliding space for deformation.
The bank slope mainly consists of an uneven and soft soil layer with the characteristics of upper soft and lower hard strata, especially regarding the mucky silty clay and plain fill. Moreover, parts of the soil layer have poor engineering properties, such as high compressibility, low strength, low dry strength, and low toughness. Therefore, the materials within the bank slope cannot provide sufficient strength to resist soil compression and shear deformation. As the water level changes, the groundwater level and soil moisture content change. The increase in the adsorbed water of the soil particles weakens the matric suction of the soil, leading to a reduction in weight and soil shear strength. Moreover, the generation of buoyancy forces reduces the soil’s effective weight, increases the soil’s pore water pressure, and reduces the soil’s normal stress, leading to the lower anti-sliding resistance of the bank slope.
In addition, the heaped load of the storage yard on the rear land area accelerates the compression of the soil on the bank slope, so that the soil layers with poor engineering properties are more prone to shear deformation. Therefore, a reasonable pile foundation layout of the wharf would ensure the normal operation of the wharf and reinforce the bank slope.
3. Methodology
3.1. Slope Stability Calculation Method and Passing Flow Analysis Method for Pile Maximum Resistance Calculation
The calculation of the bank slope’s stability should consider the limit equilibrium state of both the pile body and the soil mass, while the piles should maintain the stability of the bank slope. According to the force acting on the slope block (Figure 5) and the rigid body limit equilibrium method, the maximum resistance of each pile should be calculated with the ultimate resistance of the pile per unit length. The safety factor of the bank slope can be calculated when the thrust of the last sliding mass is equal to zero after trial calculation. The limit equilibrium equation and the pile resistance calculation are shown in Equations (1)–(5):
where is the reaction force of the i + 1 sliding block on the i block, is the reaction force of the i − 1 sliding block on the i block, is the sliding force of the block, is the resistant shearing force of the block, is the pore water pressure acting on the sliding surface, is the length of the sliding surface, is the internal friction angle of the sliding surface, is the cohesion, is the ultimate resistance of the pile per unit length, is the transfer coefficient, is the angle between the sliding surface and horizontal surface, is the angle between the sliding surface and horizontal surface of the i − 1 sliding block, is the weight of the block, and are the seismic vertical and horizontal forces, is the maximum resistance of each pile, and and are the horizontal and vertical spacing of the piles.
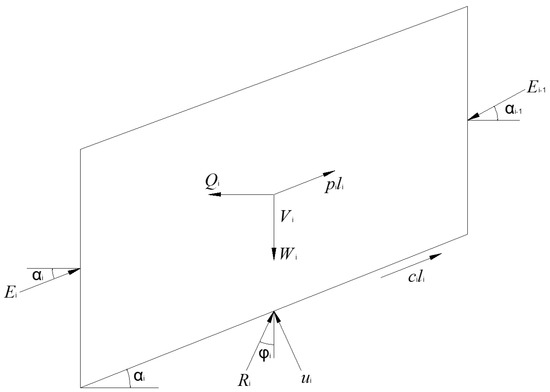
Figure 5.
Diagram of the force acting on the slope block.
The pile foundation resistance, shown in Equation (5), is calculated based on the stability requirements of the sliding mass, while is calculated according to the potential sliding surface depth and the pile body. However, if the distance between piles is too large, the soil mass of the bank slope with the potential for sliding may bypass the piles and slide down. Therefore, it is necessary to calculate the maximum resistance provided by the piles through PFA and design the spacing of the piles according to the principle of .
With piles, soil resistance will be generated in the sliding mass. Therefore, according to the semi-empirical relationship of the soil resistance within the piles and the PFA [32,33], the passing flow resistance of the soil around the piles can be calculated based on limit equilibrium theory, the existing semi-empirical relationship and calculation formulas, and the following assumptions:
- The soil layer is infinitely vast and moves horizontally relative to the vertical piles;
- The soil layer is an ideal cohesive or Mohr–Coulomb material;
- The surface of the pile is absolutely rough.
Based on these assumptions, the maximum resistance of the pile per unit length () should be calculated as per Equations (6)–(10):
where is the maximum resistance of the pile per unit length, is the cohesive pressure, is the lateral pressure, is the lateral pressure coefficient, is the vertical stress, is the vertical depth, is the pile diameter, and A and B are simplified coefficients for calculation.
According to the distribution of the soil layers on the bank slope and the arrangement of the piles, different soil layers can be converted into homogeneous soil layers according to the foundation proportion coefficient [34], as shown in Equation (11), and the deformation coefficient of the pile can be calculated as in Equation (12):
where is the foundation coefficient of the converted homogeneous soil layer, is the foundation coefficient for different soil layers below the sliding surface, is the thickness of the pile in different soil layers, is the deformation coefficient of the pile, is the calculation width of the pile, is the diameter of the pile, and is the relative stiffness coefficient of the pile.
Then, the internal forces and lateral stress surrounding the pile body can be calculated according to the related design requirements for piles [35,36]. Considering the stratum conditions of the bank slope, the M method is applied, which considers the pile bottom as the free end. The displacement and rotation angle of the pile body at the sliding surface are calculated as per Equations (13) and (14) and the displacement and stress of any section of the pile below the sliding surface via Equations (15)–(19):
where , , , and are the displacement, rotation angle, bending moment, and shear force of the pile body at the sliding surface; , , , and are the displacement, rotation angle, bending moment, and shear force of any cross-section below the sliding surface; and , , , and are the function values, which vary with the conversion depth of the pile.
3.2. Two-Dimensional Finite Element Method and Model Establishment
GeoStudio 2018, a finite element analysis software program, can perform limit equilibrium stability analysis, seepage analysis, stress field analysis, etc., of the whole or part of the bank slope with analysis modules such as Slope/W and Seep/W, using different functions. According to the typical section of the bank slope, a 2D model is established (Figure 6) for stability calculation using finite element analysis with the limit equilibrium method and stable percolation analysis to calculate the slope stability and simulate the pore water pressure distribution inside the bank slope. The Bishop and Morgenstern–Price methods in the Slope/W module are adopted to achieve slope stability analysis and calculation.
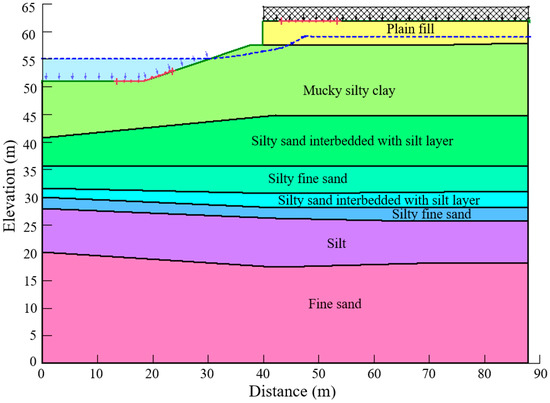
Figure 6.
The two-dimensional model for the limit equilibrium analysis of the bank slope.
The Morgenstern–Price method needs to satisfy the moment balance and static balance based on the tangential and normal forces between adjacent soil blocks and the function related to the horizontal direction. The factor of safety of the Morgenstern–Price method can be calculated as per Equations (20)–(24). The Bishop method only considers the tangential force between soil blocks with the moment balance and force imbalance, assumes that the safety factors of the sliding surfaces of each soil block are the same, and then calculates the safety factor as per Equations (25)–(27):
where and are the calculation coefficients related to the transfer coefficients, is the horizontal seismic inertia force response coefficient, is the angle between the soil block and the vertical direction, is the effective internal friction angle, is the effective cohesion, is the width of the soil block, and and are the interslice force functions.
where is the calculation coefficient, and and are the tangential forces of the soil block.
The dimensions of the 2D model are 87 m (length) × 61 m (height). To simulate the pore water pressure distribution and calculate the slope stability more realistically, the boundary conditions of the 2D model have been set with an impermeable bottom boundary, and the infiltration of the left, right, and slope surface boundaries under steady seepage conditions is considered. The Van Genuchten (VG) model is adopted for the soil mass of the bank slope.
3.3. Three-Dimensional Finite Difference Method and Model Establishment
FLAC 3D 6.00, a finite difference software program, divides the entire bank slope calculation model into n units and represents the motion of nodes by calculating the velocity and displacement of the nodes and the strain and stress of the elements through an equilibrium equation based on the stress–strain relationship. When a load is applied to the nodes, the motion equation of the nodes is represented in finite difference form, and the total strain increment at time t + Δt can be obtained according to the stress state at time t and the time step Δt. Then, the strain and stress of the units can be calculated according to the node velocity and stress–strain relationship, the stress vector on the node can be obtained, and the velocity and displacement of unit nodes can be solved based on the equilibrium equation. After continuous iteration cycles, all calculation areas of the bank slope reach convergence, enabling the accurate simulation of the elastic or plastic deformation, potential failure, and flow of the soil mass of the bank slope.
During the calculation iterations and loops, the forces acting on the vertices of the tetrahedral units are determined according to fast Lagrangian analysis in FLAC 3D. Based on the Gaussian divergence theorem, the volume and surface of the tetrahedral unit are integrated. Therefore, the velocity component of any point on the tetrahedral unit is expressed as in Equation (28):
where is the velocity component of any point on the tetrahedral unit i, is the volume of the tetrahedral unit i, is the unit normal vector component acting on the outer surface of the tetrahedral unit i, and is the external surface area of the tetrahedral unit i.
Based on the virtual work theorem, the unbalanced forces in the static equilibrium state acting on the tetrahedron unit at any time can be analyzed, as shown in Equation (29):
where is the unbalanced force on the tetrahedral unit i, is the component of the stress tensor of the tetrahedral unit i, is the density of the unit, and is the volume force per unit mass.
Therefore, the potential deformation and failure of the bank slope can be accurately simulated using the FLAC 3D software with the results of the displacement, stability coefficient, shear strain increment, and plastic zone during the calculation iterations and loops until all calculation areas reach convergence. The three-dimensional calculation model of the bank slope was established according to the typical section of the bank slope with 8 soil layers. The dimensions of the 3D model are 87.5 m (length) × 20.5 m (width) × 54.0 m (height), including 177,675 nodes and 93,242 grid cells (Figure 7).
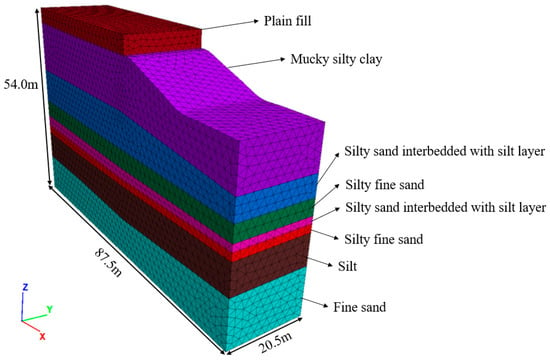
Figure 7.
The three-dimensional model for the finite difference analysis of the bank slope.
The Mohr–Coulomb model is set for the soil layers, the boundary conditions are set to limit deformation and stress changes, and the pile structural units are set for the pile foundations. The initial stress in the model includes vertical stress and horizontal stress, where the vertical stress is generated by gravity and the horizontal stress is 0.5 times the vertical stress. To simulate unsaturated seepage, the FISHCALL command of the FISH function is applied to adjust the FLAC 3D variables, such as the mechanical and seepage parameters, to calculate the fluid volume variations in the nodes.
As for the plastic zone, in FLAC 3D, this refers to the area in the model where the stress state satisfies the specific yield criteria of the Mohr–Coulomb model and undergoes irreversible plastic deformation. Therefore, based on the stress states of the units and the Mohr–Coulomb model, the plastic state can be mainly divided as follows: (1) “shear-n” indicates that the unit stress state is on the shear yield surface and it is undergoing plastic shear; (2) “shear-p” indicates that the unit has experienced shear yielding before, but the current stress state is no longer on the yield surface and plastic shear strain has accumulated; (3) “tension-n” indicates that the tensile stress of the unit exceeds the tensile strength of the material and a plastic tensile fracture is occurring; (4) “tension-p” indicates that tensile yielding has occurred before, but the current tensile stress is lower than the tensile strength, and plastic tensile strain has accumulated; (5) “none” indicates that the unit stress state is inside the yield surface and the material is in the elastic deformation stage.
3.4. Soil Mass Mechanical Parameters of the Bank Slope
According to the soil layers revealed by the field investigation and drilling core, the bank slope is mainly composed of different soil layers with the characteristics of upper soft and lower hard strata. Due to the influence of the mucky silty clay on the depth and location of the potential sliding surface, the results of the consolidated shear test and the field vane shear test are adopted to obtain the shear strength of the mucky silty clay based on the requirements of the related standard [37], while the direct shear test is utilized for the shear strength of other soil layers [38]. The mechanical parameters of the soil mass are selected based on the test results and in situ test data, while some parameters are comprehensively adopted according to the relevant standards [39,40], empirical parameters, and similar projects in the study area. The parameters of each soil layer are shown in Table 1.

Table 1.
The mechanical parameters of the soil layers.
4. Research Results
4.1. Potential Failure Mode of Natural Bank Slope Under Heaped Loads and Pile Foundation Scheme
Based on the 2D calculation model and the working conditions, the stability of the bank slope without treatment measures is calculated using GeoStudio with different LEMs, such as the Bishop method, Morgenstern–Price method, and limit equilibrium method considering PFA. The evaluation standard stability judgement is selected based on the Code for Foundation Design in Port and Waterway Engineering [32]. The calculation results and the potential sliding surface of the bank slope are, respectively, shown in Table 2 and Figure 8.

Table 2.
Stability calculation results of the natural bank slope.
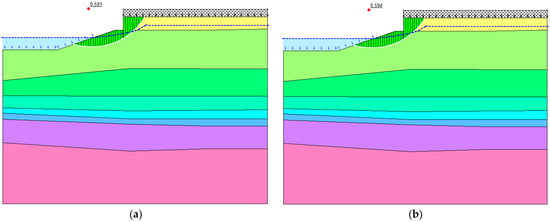
Figure 8.
Calculation results for the stability of the bank slope: (a) Bishop method; (b) Morgenstern–Price method.
The stability calculation results of the natural bank slope indicate that the slope stability under a heaped load cannot meet the need for safety. The potential failure surface is a circular arc surface, mainly passing through the mucky silty clay, which is essentially consistent with the failure mechanism analysis of the bank slope. Although there is a certain difference between the Bishop method and Morgenstern–Price method, the difference is small and the calculation results indicate that the bank slope is in an unstable state under a heaped load in normal use.
Moreover, the distribution of the pore water pressure under steady seepage conditions within the bank slope is simulated using the GeoStudio software and shown in Figure 9. Based on the pore water pressure distribution, it can be concluded that the pore water pressure in the bank slope increases proportionally with the decrease in elevation, and it gradually decreases from the inside to the outside of the slope.
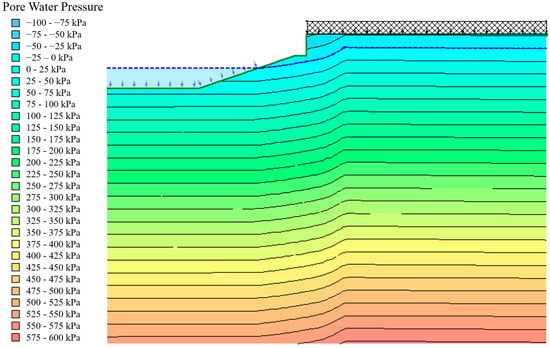
Figure 9.
The distribution of the pore water pressure within the natural bank slope.
Since the stability of the natural bank slope under a heaped load cannot meet the safety requirements, systematic treatment measures are needed to improve the slope stability. According to the potential failure surface revealed by the calculation results, the piles are arranged as three rows along the section with spacing of 2.3 m, a length of 22.0 m, and a diameter of 1.2 m as a treatment measure (Figure 10).
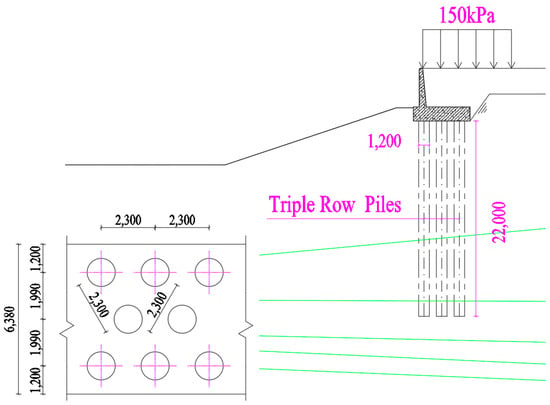
Figure 10.
Diagram of pile foundations of the bank slope (mm).
4.2. Effectiveness Analysis of Treatment Measures for the Bank Slope Under a Heaped Load
4.2.1. Analysis of the Internal Force Within the Pile
According to the pile locations, the landslide thrust is 2188.55 kPa and the thrust corresponding to each pile is 5033.66 kPa. Based on the PFA, the maximum resistance of the pile per unit length is 348.27 kPa.
Combining this with Rankine’s theory of the passive pressure of soil, the passive earth pressure in front of the pile is 1359.94 kN/m and the remaining sliding resistance force in front of the pile is 613.43 kN/m. Therefore, the pile design takes the remaining sliding resistance force as the stratum resistance of the pile with a value of 141.9 kN/m. Owing to the fact that there is no effective analytical method to calculate the internal force of multiple-row piles, internal force calculation can only be carried out according to single-row piles.
Therefore, combined with the calculation of the internal forces and lateral stress surrounding the pile body, the bending moment, shear force, and soil stress around the pile and the horizontal displacement are calculated and shown in Figure 11. It can be found that (1) the maximum bending moment of the pile on the retaining side is 6683.669 kN∙m and the maximum shear force is 1508.825 kN, respectively located 11 m and 14 m from the pile top; (2) the stress around the pile is less than the allowable soil stress, indicating that the soil will not be damaged; (3) according to the limit equilibrium method considering PFA, as in Equation (1), the stability of the bank slope reaches 1.283, meeting the requirements for bank slope stability.
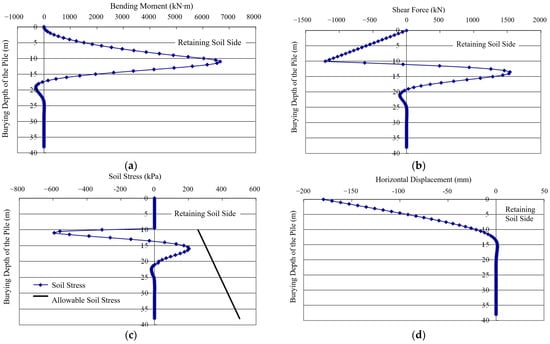
Figure 11.
Calculation results for the internal force within the pile: (a) bending moment; (b) shear force; (c) soil stress around the pile; (d) horizontal displacement.
4.2.2. Analysis of Calculation Results of Two-Dimensional Numerical Simulation
The stability calculation results indicate that the natural bank slope under a heaped load is in the unstable stage, with the stability coefficient ranging from 0.59 to 0.61, and treatment measures are needed. Therefore, a 2D calculation model of the reinforced bank slope is established to verify the treatment measures’ effectiveness (Figure 12). The stability of the reinforced bank slope is calculated, and the results are, respectively, shown in Table 3 and Figure 13.
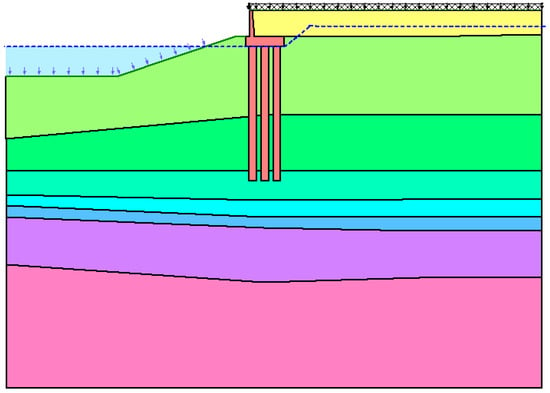
Figure 12.
The two-dimensional model of the reinforced bank slope.

Table 3.
Stability calculation results of the reinforced bank slope.
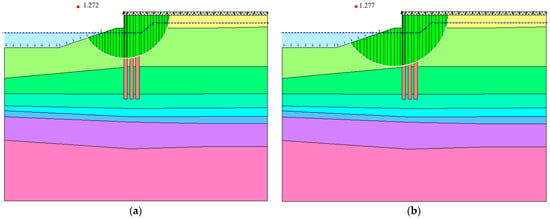
Figure 13.
Calculation results for the stability of the reinforced bank slope: (a) Bishop method; (b) Morgenstern–Price method.
The calculation results show that the stability of the reinforced bank slope has increased from 0.59–0.61 to 1.27–1.28, with an average increase of about 0.68. Moreover, although the depth of the potential sliding surface is deeper than the natural bank slope, the sliding surface is smoother, with the better stability of the reinforced bank slope, indicating that the optimized pile layout scheme can improve the bank slope’s stability.
4.2.3. Analysis of Calculation Results of Three-Dimensional Numerical Simulation
The 2D numerical simulation results show that the pile layout scheme plays a great role in increasing the stability of the bank slope. A 3D calculation model of the bank slope with piles is also established (Figure 14) to further verify the effectiveness of the pile layout scheme using the finite difference software (FLAC 3D 6.00) and compare the calculation results (displacement, stability coefficient, shear strain increment, and plastic zone) for the natural and reinforced bank slopes.
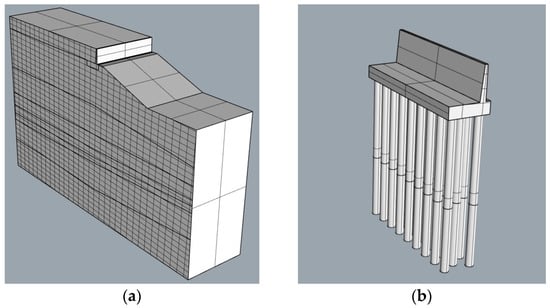
Figure 14.
The three-dimensional model of the reinforced bank slope: (a) numerical simulation 3D model; (b) pile foundation body.
When the calculation iterations reach convergence among the unbalanced forces, the calculation tends to stabilize. The displacement calculation results of the bank slope are shown in Figure 15 as displacement cloud maps, and the stability coefficient results are shown in Table 4.
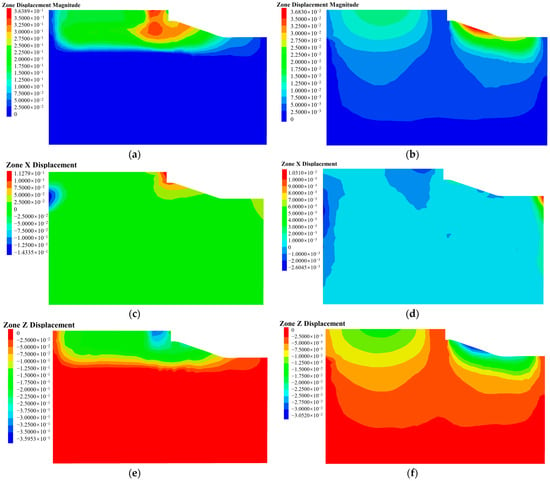
Figure 15.
The cloud maps of displacement: (a) total displacement of natural bank slope; (b) total displacement of reinforced bank slope; (c) horizontal displacement of natural bank slope; (d) horizontal displacement of reinforced bank slope; (e) vertical displacement of natural bank slope; (f) vertical displacement of reinforced bank slope.

Table 4.
Calculation results in terms of stability coefficient according to finite difference simulation.
- The displacement is mainly concentrated in the slope area and the yard area with or without the piles, owing to the fact that the upper soil layers cannot provide sufficient strength to resist soil compression and shear deformation under a heaped load.
- Based on the displacement cloud map in Figure 15a, it can be found that the main displacement area is essentially consistent with the potential sliding surface obtained by the 2D calculations. The failure surface occurs in both the mucky silty clay and plain fill layers, consistent with the potential failure mechanism analysis.
- The maximum displacement of the natural bank slope is 0.364 m, which is much higher than the maximum displacement of the reinforced bank slope at 0.037 m. Moreover, the displacement and deformation of the yard area in the reinforced bank slope significantly decrease. Considering that piles can effectively reduce the horizontal displacement caused by soil compression and thrust under a heaped load, the displacement of the reinforced slope is mainly composed of vertical displacement.
- The stability coefficient of the bank slope increases from 0.799 to 1.311, which not only meets the safety needs but also indicates that the pile layout scheme can improve the stability of the bank slope effectively.
Therefore, it can be concluded that the compression and shear of the upper soft soil layers under a heaped load are the main reasons for the failure and deformation of the natural bank slope. The treatment measures, i.e., pile foundations, can effectively decrease the deformation by improving the resistance to thrust and shear stress.
The maximum shear strain increment and the distribution of the plastic zones of the natural and reinforced bank slopes are shown in Figure 16 and Figure 17.

Figure 16.
The cloud map of the maximum shear strain: (a) natural bank slope; (b) reinforced bank slope.

Figure 17.
The distribution of the plastic zones: (a) natural bank slope; (b) reinforced bank slope.
According to Figure 16, it can be summarized that the shear strain increment of the natural bank slope is mainly located on the mucky silty clay and plain fill layers, where the displacement value is relatively high, especially in the deeper part of the mucky silty clay, indicating that the natural bank slope may slide along the deeper part of the mucky silty clay layer. The shear strain increment of the reinforced bank slope is concentrated on the surface of the slope area, with a decrease in the maximum shear strain increment from 2.4762 × 10⁻¹ to 1.7512 × 10⁻².
Additionally, the type of plastic zone on the bank slope can reflect the deformation type of the soil mass in different areas under heaped loads. According to the plastic state and the distribution of the plastic zone, the interconnection of plastic zones (especially shear-n) indicates a form of continuous slip or failure and indicates potential instability. Therefore, the distribution of the plastic zones of the bank slope shows that, with reinforcement, there is less shear deformation in the yard area, and the run-through of the plastic zone is reduced between the yard and slope areas.
Therefore, considering the calculation results of the displacement, stability coefficient, shear strain increment, and plastic zone, the stability of the reinforced bank slope is higher and the possibility of further deep sliding is lower, verifying that the pile layout scheme can control the deformation development of the bank slope. Consequently, the bank slope does not undergo significant deformation, and Xiaqinglong Port is in safe use and exhibits normal operation (Figure 18).
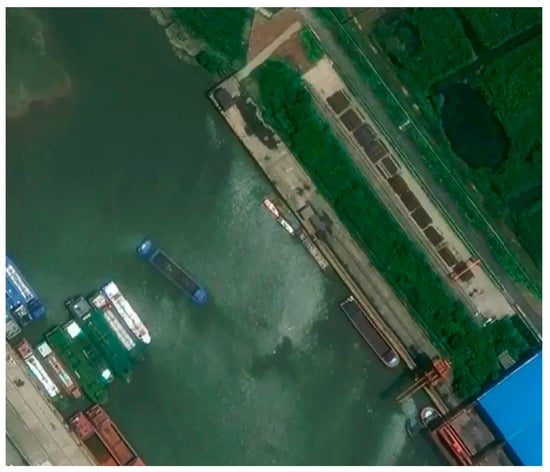
Figure 18.
The current situation of the reinforced bank slope.
5. Discussion
This paper studied the stability of the bank slope and analyzed the treatment measures’ effectiveness with numerical simulation results. Through the analysis, the following can be drawn:
- The deformation of the natural slope is mainly caused by the heaped load and the soil layer structure’s characteristics. The heaped load accelerates the deformation of the upper plain fill and mucky silty clay. The shear stress and thrust increase the horizontally expanding deformation and vertical compression deformation of the soil mass.
- The excavated slope can only maintain its own stability and will undergo deformation under heaped loads. Additionally, it is necessary to take the soil mass and the pile layout scheme into consideration due to the possibility of the soil mass sliding around and between the piles.
- According to the PFA and the simulation results regarding the depth and thrust of the potential sliding surface, a pile layout scheme has been proposed to meet the requirements regarding the internal force and slope stability.
However, although this study discussed the bank slope’s stability under a heaped load and verified the treatment measures’ effectiveness, there are some limitations. Firstly, although 2D and 3D numerical calculation results can correspond to each other, a difference in the simulation results exists due to theoretical differences. Additionally, the heaped load was applied as a static load on the yard area, but the results regarding the equivalent surface force and dynamic load were not compared. Moreover, as the aim was to study the slope stability with piles, the upper structures have not been considered, and the study only simulated the most dangerous conditions, which may result in differences between the results and actual conditions (such as water level changes). Additionally, certain parameters for the numerical simulation were adopted, but their rationality should be verified by qualitative analysis and discussed via indoor testing or simulation experiments. Therefore, subsequent studies can be conducted as follows: improve the calculation model with the upper structures to simulate the structure’s stability; conduct more tests to calibrate the key parameters; and simulate more working conditions with better stress and seepage field coupling.
6. Conclusions
Based on the geological conditions of the study area, the material composition of the bank slope, and the numerical simulation results, this paper comprehensively evaluated the bank slope’s stability, analyzed the potential failure modes, and verified the specific treatment measures’ effectiveness. The conclusions can be drawn as follows.
(1) The bank slope located in Xiaqinglong Port has the characteristics of uneven and soft geological layers with upper soft and lower hard strata. The potential sliding surface of the bank slope under the action of a heaped load is mainly determined by the mucky silty clay. Due to the compression and shear failure of the soil mass caused by the heaped load, the natural bank slope is in an unstable state, with a stability coefficient ranging from 0.591 to 0.608 and maximum displacement of 0.364 m.
(2) Based on the depth and location of the potential sliding surface and the sliding thrust, PFA is adopted to calculate the maximum resistance of the piles and further optimize the pile design, using an arrangement of three-row piles with spacing of 2.3 m, a length of 22.0 m, and a diameter of 1.2 m, and the maximum resistance of the pile per unit length is 348.27 kPa.
(3) The calculation results show that the optimized pile layout scheme improves the bank slope’s stability from an unstable state to a stable state. Compared to the natural bank slope, the stability of the reinforced bank slope is increased from 0.59–0.61 to 1.27–1.28 and from 0.78 to 1.31, respectively, in the 2D and 3D simulations, while the maximum shear strain increment decreases from 2.4762 × 10⁻¹ to 1.7512 × 10⁻² and the maximum displacement is reduced from 0.364 m to 0.037 m, which indicates that the application of the piles effectively decreases the deformation and controls the failure development of the soil bank slope under the heaped load.
The results of the study and analysis provide certain contributions to stability evaluation and treatment measure optimization for bank slopes under a heaped load. The study is of practical significance and value regarding the stability influencing factor analysis, stability evaluation, and treatment design optimization and verification, aiming to prevent the potential instability and failure of similar river bank slopes under heaped loads.
Author Contributions
Conceptualization, W.X. and W.Q.; methodology, W.X. and S.L.; software, Q.C. and X.L.; validation, W.X., S.L. and X.L.; formal analysis, W.X. and S.L.; investigation, W.X., W.Q. and Q.C.; writing—original draft preparation, X.L., W.X. and S.L.; writing—review and editing, X.L., W.X. and S.L.; visualization, W.X. and W.Q.; supervision, W.X. and Q.C. All authors have read and agreed to the published version of the manuscript.
Funding
This research received no external funding.
Data Availability Statement
The data presented in this study are available on request from the corresponding author.
Conflicts of Interest
Wei Xue, Wei Qian and Qingqing Chen were employed by the Nanjing Hydraulic Research Institute and Nanjing R&D Tech Group Co., Ltd. The remaining authors declare that the research was conducted in the absence of any commercial or financial relationships that could be construed as a potential conflict of interest.
References
- Li, W.J.; Bie, S.A.; Wu, Z.Y.; Zhao, S.Z.; Liu, Y.X. The impact of sediment accumulation on the structural stress of high-pile wharf and sediment removal measures. Hydro-Sci. Eng. 2024, 5, 31–41. [Google Scholar] [CrossRef]
- Liu, M.W.; Li, H.; ABI, E.; Gao, J.S. Deformation of pile foundation in deep filling slope based on ANSYS. Hydro-Sci. Eng. 2018, 3, 40–47. [Google Scholar] [CrossRef]
- He, L.L.; Zhou, L.; Liang, Y. Research on effect of sudden drawdown of reservoir water level and pile foundation on stability of high filled bank slope. J. Disaster Prev. Mitig. Eng. 2020, 40, 959–966. [Google Scholar] [CrossRef]
- Liu, T.Y.; Zhuge, A.J.; Yu, Z.F. Numerical simulation study on influence of pile foundation parameters on bank slope stability. Port Waterw. Eng. 2020, 4, 156–161. [Google Scholar] [CrossRef]
- Zhu, J.N.; Wang, J.X.; Feng, C.M. Deformation characteristics and sensitivity analysis of aeolian soil bank slope in Xinjiang desert open channel. Environ. Earth Sci. 2024, 83, 430. [Google Scholar] [CrossRef]
- Zhu, J.N.; Wang, J.X.; Feng, C.M. Stability analysis of aeolian soil bank slope of Xinjiang desert water conveyance open channel based on Midas GTS/NX. Sci. Technol. Eng. 2024, 24, 2036–2044. [Google Scholar] [CrossRef]
- Chen, Q.; Qin, Z.P.; Jiang, N.; Zhou, L.Z.; Chen, Z.R.; Qin, Y.Y.; Li, T.; Peng, Y. Stability analysis of drainage channel slopes under rainfall and water level changes. J. Water Resour. Water Eng. 2024, 35, 186–196. [Google Scholar] [CrossRef]
- Zhang, J.R.; Liu, X.L.; Lv, L.; Shao, Y.; Lv, X.L. Pseudo-static analysis of overall stability of slopes of high pile wharves subjected to earthquakes. Chin. J. Geotech. Eng. 2024, 46 (Suppl. 2), 205–209. [Google Scholar] [CrossRef]
- Li, X.K.; Zhang, X.L.; Zhang, F.M.; Huang, J.; Tang, S.X.; Liu, Z.Q. A Case Study for Stability Analysis of a Toppling Bank Slope with Fault Fracture Zones Developed Under the Action of Bridge Loads and Reservoir Water. Water 2024, 16, 494. [Google Scholar] [CrossRef]
- Wang, S.F.; Zhang, L.P.; Lei, M.; Zhu, Y.S.; Wang, T. Investigation of deformation failure mechanism and stability of the guobu reservoir slope at laxiwa hydropower station. Bull. Eng. Geol. Environ. 2024, 83, 385. [Google Scholar] [CrossRef]
- Xie, L.F.; Zhu, Q.Y.; Qin, Y.J.; Wang, J.H.; Qian, J.G. Study on Evolutionary Characteristics of Toppling Deformation of Anti-Dip Bank Slope Based on Energy Field. Sustainability 2020, 12, 7544. [Google Scholar] [CrossRef]
- Huang, J.; Tang, S.X.; Liu, Z.Q.; Zhang, F.M.; Dong, M.L.; Liu, C.; Li, Z.N. A Case Study for Stability Analysis of Toppling Slope Under the Combined Action of Large Suspension Bridge Loads and Hydrodynamic Forces in a Large Reservoir Area. Water 2023, 15, 4037. [Google Scholar] [CrossRef]
- Lin, J.H.; Zhu, Y.S.; Hou, J.; Pan, B.; Chu, W.J.; Huang, W.H. Equivalent Continuum Coupling-Based Slope Stability Analysis of Zhouning Pumped Storage Power Station. Geofluids 2021, 2021, 9926751. [Google Scholar] [CrossRef]
- Luo, B.; Liu, Y.H.; Tu, G.X.; Zhang, X.; Zhang, Y.M.; Li, A.R. Study on the failure mechanism of a large bank slope deposit induced by reservoir water storage: A case study of RS deposit in a reservoir of Lancang River. Water Resour. Hydropower Eng. 2023, 15, 156–166. [Google Scholar] [CrossRef]
- Zhao, Y.Y.; Fu, H.Y.; Yang, T.; Zhou, M.Z.; Li, H. Model test study of bridge pile horizontal bearing behavior under landslide deformation. Sci. Rep. 2024, 14, 15043. [Google Scholar] [CrossRef]
- Lin, J.S.; Yu, S.W.; Luo, Y.H.; Xu, T.; Lin, Y.Q.; Zheng, W.W.; Li, W.X.; Wang, Y.K. Research on stability of dam substation on inclined soft soil foundation reinforced by pile foundation. Water 2023, 15, 3527. [Google Scholar] [CrossRef]
- Wang, Z.; Dai, Q.Q.; Zhang, Y.T.; Cai, S.Y. Experimental study on interaction mechanism between slope soil and pile- supported wharf subjected to yard loads. Chin. J. Geotech. Eng. 2024, 46 (Suppl. 1), 254–258. [Google Scholar] [CrossRef]
- Xu, G.M.; Wang, N.X.; Gu, X.W.; Ren, G.F.; Zhou, C.E.; Wu, J.W. Preliminary study on influences of model container constraint on large- deformation failure behaviors by centrifuge modeling. Chin. J. Geotech. Eng. 2023, 45, 232–242. [Google Scholar] [CrossRef]
- Li, S.Y.; Yao, G.W.; Zhang, G.F.; Wang, W.; Song, A.X.; Liu, W.P.; Qin, T.; Zhou, G.P.; Zhang, L.H. Study on the Damage Mechanism of Bank Slope-Bridge Pile Foundation Interaction Under Reservoir Water Level Cycle. Appl. Sci. 2023, 13, 7014. [Google Scholar] [CrossRef]
- Liu, S.J.; Luo, F.Y.; Zhang, G. Pile reinforcement behavior and mechanism in a soil slope under drawdown conditions. Bull. Eng. Geol. Environ. 2021, 80, 4097–4109. [Google Scholar] [CrossRef]
- Liu, S.J.; Zhang, G.; Luo, F.Y. Centrifuge modeling of new pile reinforcement on slopes subjected to drawdown. Bull. Eng. Geol. Environ. 2022, 81, 396. [Google Scholar] [CrossRef]
- Wang, F.F.; Shao, J.G.; Li, W.K.; Wang, Y.F.; Wang, L.F.; Liu, H.L. Study on the Effect of Pile Foundation Reinforcement of Embankment on Slope of Soft Soil. Sustainability 2022, 14, 14359. [Google Scholar] [CrossRef]
- Deng, F.M.; Yu, F.; Li, W. Gradual reinforcement calculation of bedded rock high slope in wharf land area based on Geo-slope software. Port Waterw. Eng. 2021, 9, 66–70. [Google Scholar] [CrossRef]
- Peng, Y.; Chen, H.K. Study on the distance between trapezoid-sectional vertical pre-stressed anchor anti-slide piles. Water Resour. Hydropower Eng. 2018, 49, 185–190. [Google Scholar] [CrossRef]
- Que, Y.; Chen, X.; Qiu, Y.H.; Zhu, X.H.; Leung, A.K.; Jiang, Z.L. Novel Spatial Soil Arching Effect on a Steep-Slope High Embankment in a Double-V Narrowing Gully. Int. J. Geomech. 2023, 23. [Google Scholar] [CrossRef]
- Li, H.H.; Fu, S.J.; Hui, J.W. 3D finite element analysis of anti-slide pile group treatment scheme for a large deposit slope. Eng. J. Wuhan Univ. 2021, 54, 1028–1036. [Google Scholar] [CrossRef]
- Zhou, C.M.; Qin, Z.H.; Li, G.B.; Xing, H.G. Analysis of influencing factors on the soil arching effect of anti-slide piles in reservoir bank landslides. Front. Earth Sci. 2025, 13, 1581491. [Google Scholar] [CrossRef]
- Fan, S.Q.; Cai, Z.Y.; Tan, J.K.; Dong, C.R.; Liu, Y. Study on bearing capacity of pile foundation in deep silt soft soil layer. Build. Struct. 2022, 52 (Suppl. 1), 2729–2735. [Google Scholar] [CrossRef]
- Mo, L.H. Research on the Influence of Soft Soil Foundation Pretreatment on the Improvement of Pile Foundation’s Horizontal Bearing Capacity. Chin. J. Undergr. Space Eng. 2024, 20, 398–407. [Google Scholar] [CrossRef]
- Gao, S.F.; Gong, J.X.; Feng, Y.F. Advances in research on seismic performance and design methods for pile- supported wharves Part II: Pile-soil interaction. Hydro-Sci. Eng. 2017, 1, 57–72. [Google Scholar] [CrossRef]
- Ren, J.Y.; Wang, K.P.; Cui, C.Y.; Liu, H.L.; Zhao, M. Analysis of force deformation in wharf pile foundation-slope system under siltation conditions. Hydro-Sci. Eng. 2024, 5, 113–123. [Google Scholar] [CrossRef]
- Tomio, I.; Matsui, T. Methods to Estimate Lateral Force Acting on Stabilizing Piles. Soils Found. 1975, 15, 43–59. [Google Scholar] [CrossRef] [PubMed]
- Shen, Z.J. The anti-sliding resistance of piles and the ultimate design of anti-sliding piles. Chin. J. Geotech. Eng. 1992, 14, 51–56. Available online: https://www.cgejournal.com/article/id/9551 (accessed on 12 October 2025).
- JTG3363—2019; Specifications for Design of Foundation of Highway Bridges and Culverts. Chinese Standard: Beijing, China, 2019.
- DBJ50/T-029-2019; Standard for Design of Geological Hazard Prevention. Chongqing Standard: Chongqing, China, 2019.
- GB/T 38509-2020; Code for the Design of Landslide Stabilization. Chinese Standard: Beijing, China, 2020.
- JTS 147–2017; Code for Foundation Design on Port and Waterway Engineering. Chinese Standard: Beijing, China, 2017.
- GB/T 50123-1999; Standard for Soil Test Method. Chinese Standard: Beijing, China, 1999.
- Hua, J.X.; Zheng, J.G. Basic knowledge of geology and classification of rock and soil. In Geological Engineering Handbook, 5th ed.; China Architecture & Building Press: Beijing, China, 2018. [Google Scholar]
- GB 50330-2013; Technical Code for Building Slope Engineering. Chinese Standard: Beijing, China, 2013.
Disclaimer/Publisher’s Note: The statements, opinions and data contained in all publications are solely those of the individual author(s) and contributor(s) and not of MDPI and/or the editor(s). MDPI and/or the editor(s) disclaim responsibility for any injury to people or property resulting from any ideas, methods, instructions or products referred to in the content. |
© 2025 by the authors. Licensee MDPI, Basel, Switzerland. This article is an open access article distributed under the terms and conditions of the Creative Commons Attribution (CC BY) license (https://creativecommons.org/licenses/by/4.0/).