Article

Hydrochemical Characteristics of Shallow Groundwater and Analysis of Vegetation Water Sources in the Ulan Buh Desert

1
Hohhot General Survey of Natural Resources Center, China Geological Survey, Hohhot 010010, China
2
Innovation Base for Water Resource Exploration and Eco-Environmental Effects in the Daheihe Basin of the Yellow River, China Geological Survey, Hohhot 010010, China
*
Author to whom correspondence should be addressed.
Water 2025, 17(21), 3058; https://doi.org/10.3390/w17213058
Submission received: 30 September 2025 / Revised: 21 October 2025 / Accepted: 23 October 2025 / Published: 24 October 2025

Abstract

The Ulan Buh Desert represents a quintessential desert ecosystem in the arid northwest of China. As the key factor to maintain the stability of ecosystem, the chemical characteristics of groundwater and its water relationship with vegetation need to be further studied. Through field sampling, hydrochemical analysis, hydrogen and oxygen isotope testing and the Bayesian mixing model (MixSIAR), this study systematically analyzed the chemical characteristics of groundwater, spatial distribution and vegetation water sources in the study area. The results show that the groundwater is predominantly of the Cl–SO42− type, with total dissolved solids (TDS) ranging from 0.34 to 9.56 g/L (mean: 2.03 g/L), indicating medium to high salinity and significant spatial heterogeneity. These characteristics are jointly controlled by rock weathering, evaporative concentration, and ion exchange. Soil water isotopes exhibited vertical differentiation: the surface layer (0–20 cm) was significantly affected by evaporative fractionation (δD: −72‰ to −45‰; δ18O: −9.3‰ to −6.2‰), while deep soil water (60–80 cm) showed isotopic enrichment (δD: −29‰ to −58‰; δ18O: −6.8‰ to 0.9‰), closely matching groundwater isotopic signatures. Vegetation water use strategies demonstrated depth stratification: shallow-rooted plants such as Reaumuria soongorica and Kalidium foliatum relied primarily on shallow soil water (0–20 cm, >30% contribution), whereas deep-rooted plants such as Nitraria tangutorum and Ammopiptanthus mongolicus predominantly extracted water from the 40–80 cm soil layer (>30% contribution), with no direct dependence on groundwater.

1. Introduction

Desertification represents a primary ecological and environmental challenge in arid regions [1,2,3], where vegetation constitutes the fundamental component of the ecosystem [4,5]. Since the growth of vegetation depends on water, apart from the limited precipitation, soil water and groundwater are also important ecological water sources [6,7,8]. Water is the core limiting factor for the structure and function of ecosystems in arid regions, and its spatial distribution pattern and chemical characteristics profoundly regulate the composition of vegetation communities, productivity, and ecological stability [9]. Under the background of global climate change, the problem of water shortage in arid regions is becoming increasingly severe. Revealing the water transport mechanism of the groundwater-soil-vegetation system is crucial for maintaining the stability of the ecosystem. Especially in the arid regions of northwest China, groundwater, as a scarce liquid water resource, its storage state, chemical evolution process, and interaction with vegetation directly affect the recovery potential and sustainable management of desert ecosystems [10,11,12].
As one of the countries most severely affected by desertification in the world, China has implemented a series of large-scale ecological restoration projects since the 1970s, aiming to curb desert expansion, restore vegetation cover, and improve the ecological environment [13,14]. Among them, the “Three-North Shelter Forest System Project”, launched in 1978, is one of the largest ecological construction projects globally [15,16], covering the northwestern, northern, and northeastern regions of China, with a total area of 4.069 million square kilometers. Through measures such as large-scale afforestation, grassland restoration, and soil and water conservation, this project has significantly improved the regional ecological environment, slowed down the process of land desertification, and enhanced the stability and resilience of the ecosystem [17,18,19,20,21]. Driven by this national strategy, as one of the key governance areas of the Three-North Project, the ecological environment status and water resource management strategies of the Ulan Buh Desert have attracted extensive attention [22]. Therefore, in-depth research on the hydrochemical characteristics of groundwater and the vegetation water use mechanism in this region not only contributes to understanding the water migration laws in desert ecosystems but also provides a scientific basis for evaluating the effectiveness of ecological projects and subsequent management.
Therefore, the primary objectives of this study are threefold: (1) to elucidate the spatial differentiation patterns of shallow groundwater chemical characteristics and identify their dominant controlling factors; (2) to clarify the vertical transport characteristics of soil water isotopes and their coupling relationship with groundwater; and (3) to quantify the water utilization strategies and stratified absorption patterns of typical desert vegetation. By integrating hydrochemical analysis, stable isotope techniques, and Bayesian mixing models, this research aims to provide a comprehensive understanding of the groundwater-soil-vegetation system in the Ulan Buh Desert, thereby offering theoretical support for water resource management and ecological restoration.

2. Materials and Methods

2.1. Study Area

The Ulan Buh Desert, one of the principal deserts in Northwest China, is situated within the Alxa League and Bayannur City in the western part of the Inner Mongolia Autonomous Region (Figure 1). It lies in the transitional zone between the southeastern Alxa Plateau and the Hetao Plain of the Yellow River. Bounded by the Yellow River to the east, the northern foothills of the Helan Mountains to the south, and the Langshan-Bayannur Mountains to the west, its geographic coordinates span a semi-arid to arid climatic transition zone [23]. Additionally, it marks the westernmost edge of the eastern monsoon climate region in northern China [24]. The study area exhibits diverse geomorphological types, predominantly featuring denuded hills, accumulation terraces, depositional basins, the Yellow River valley, and alluvial plains. Elevation ranges from 971 to 1353 m, with a relative height difference of 340 m, and local sand dunes can reach heights of 50–60 m [25].
Geologically, the Ulan Buh Desert is situated on the western margin of the Ordos Basin and the northern fringe of the Alxa Block, which has undergone multiple phases of tectonic evolution since the Mesozoic [26]. The region is characterized by a thick succession of Quaternary aeolian and fluvial deposits overlying Cretaceous and Tertiary sedimentary formations [27]. Quaternary system is widely exposed in the study area (Figure 1c), including Pleistocene and Holocene. The Pleistocene is dominated by the Jilantai Formation, and its proluvial deposits are distributed at the desert margins and piedmonts, while lacustrine deposits are found in the low-lying areas of the desert. The Holocene can be further divided into four types: alluvial, lacustrine, aeolian, and chemical deposits. Alluvial deposits are distributed in the piedmonts and modern riverbeds, mainly composed of loose sandy clay and gravel. Lacustrine deposits are located in desert depressions, consisting of sand, clay, and silt. Aeolian deposits are widely spread inside the desert, with mobile barchan dunes and sand ridges in the center and fixed-semi-fixed grassy dunes or flats at the margins. The Quaternary system predominantly consists of loose sand, silt, and clay layers, which form the primary aquifers for shallow groundwater. The underlying Cretaceous strata comprise sandstone and mudstone, while Tertiary deposits include red clay and gypsum-bearing formations, contributing to the mineral composition of groundwater through weathering and dissolution processes [27,28]. The desert’s geomorphology is largely shaped by wind erosion and deposition, resulting in extensive sand dunes, interdunal lowlands, and alluvial plains along the Yellow River margin [29]. Hydrologically, the area is part of a closed basin with internal drainage, where groundwater flow is generally from the southwestern highlands toward the northeastern low-lying areas, ultimately discharging into the Yellow River or evaporating in the central depressions [28].
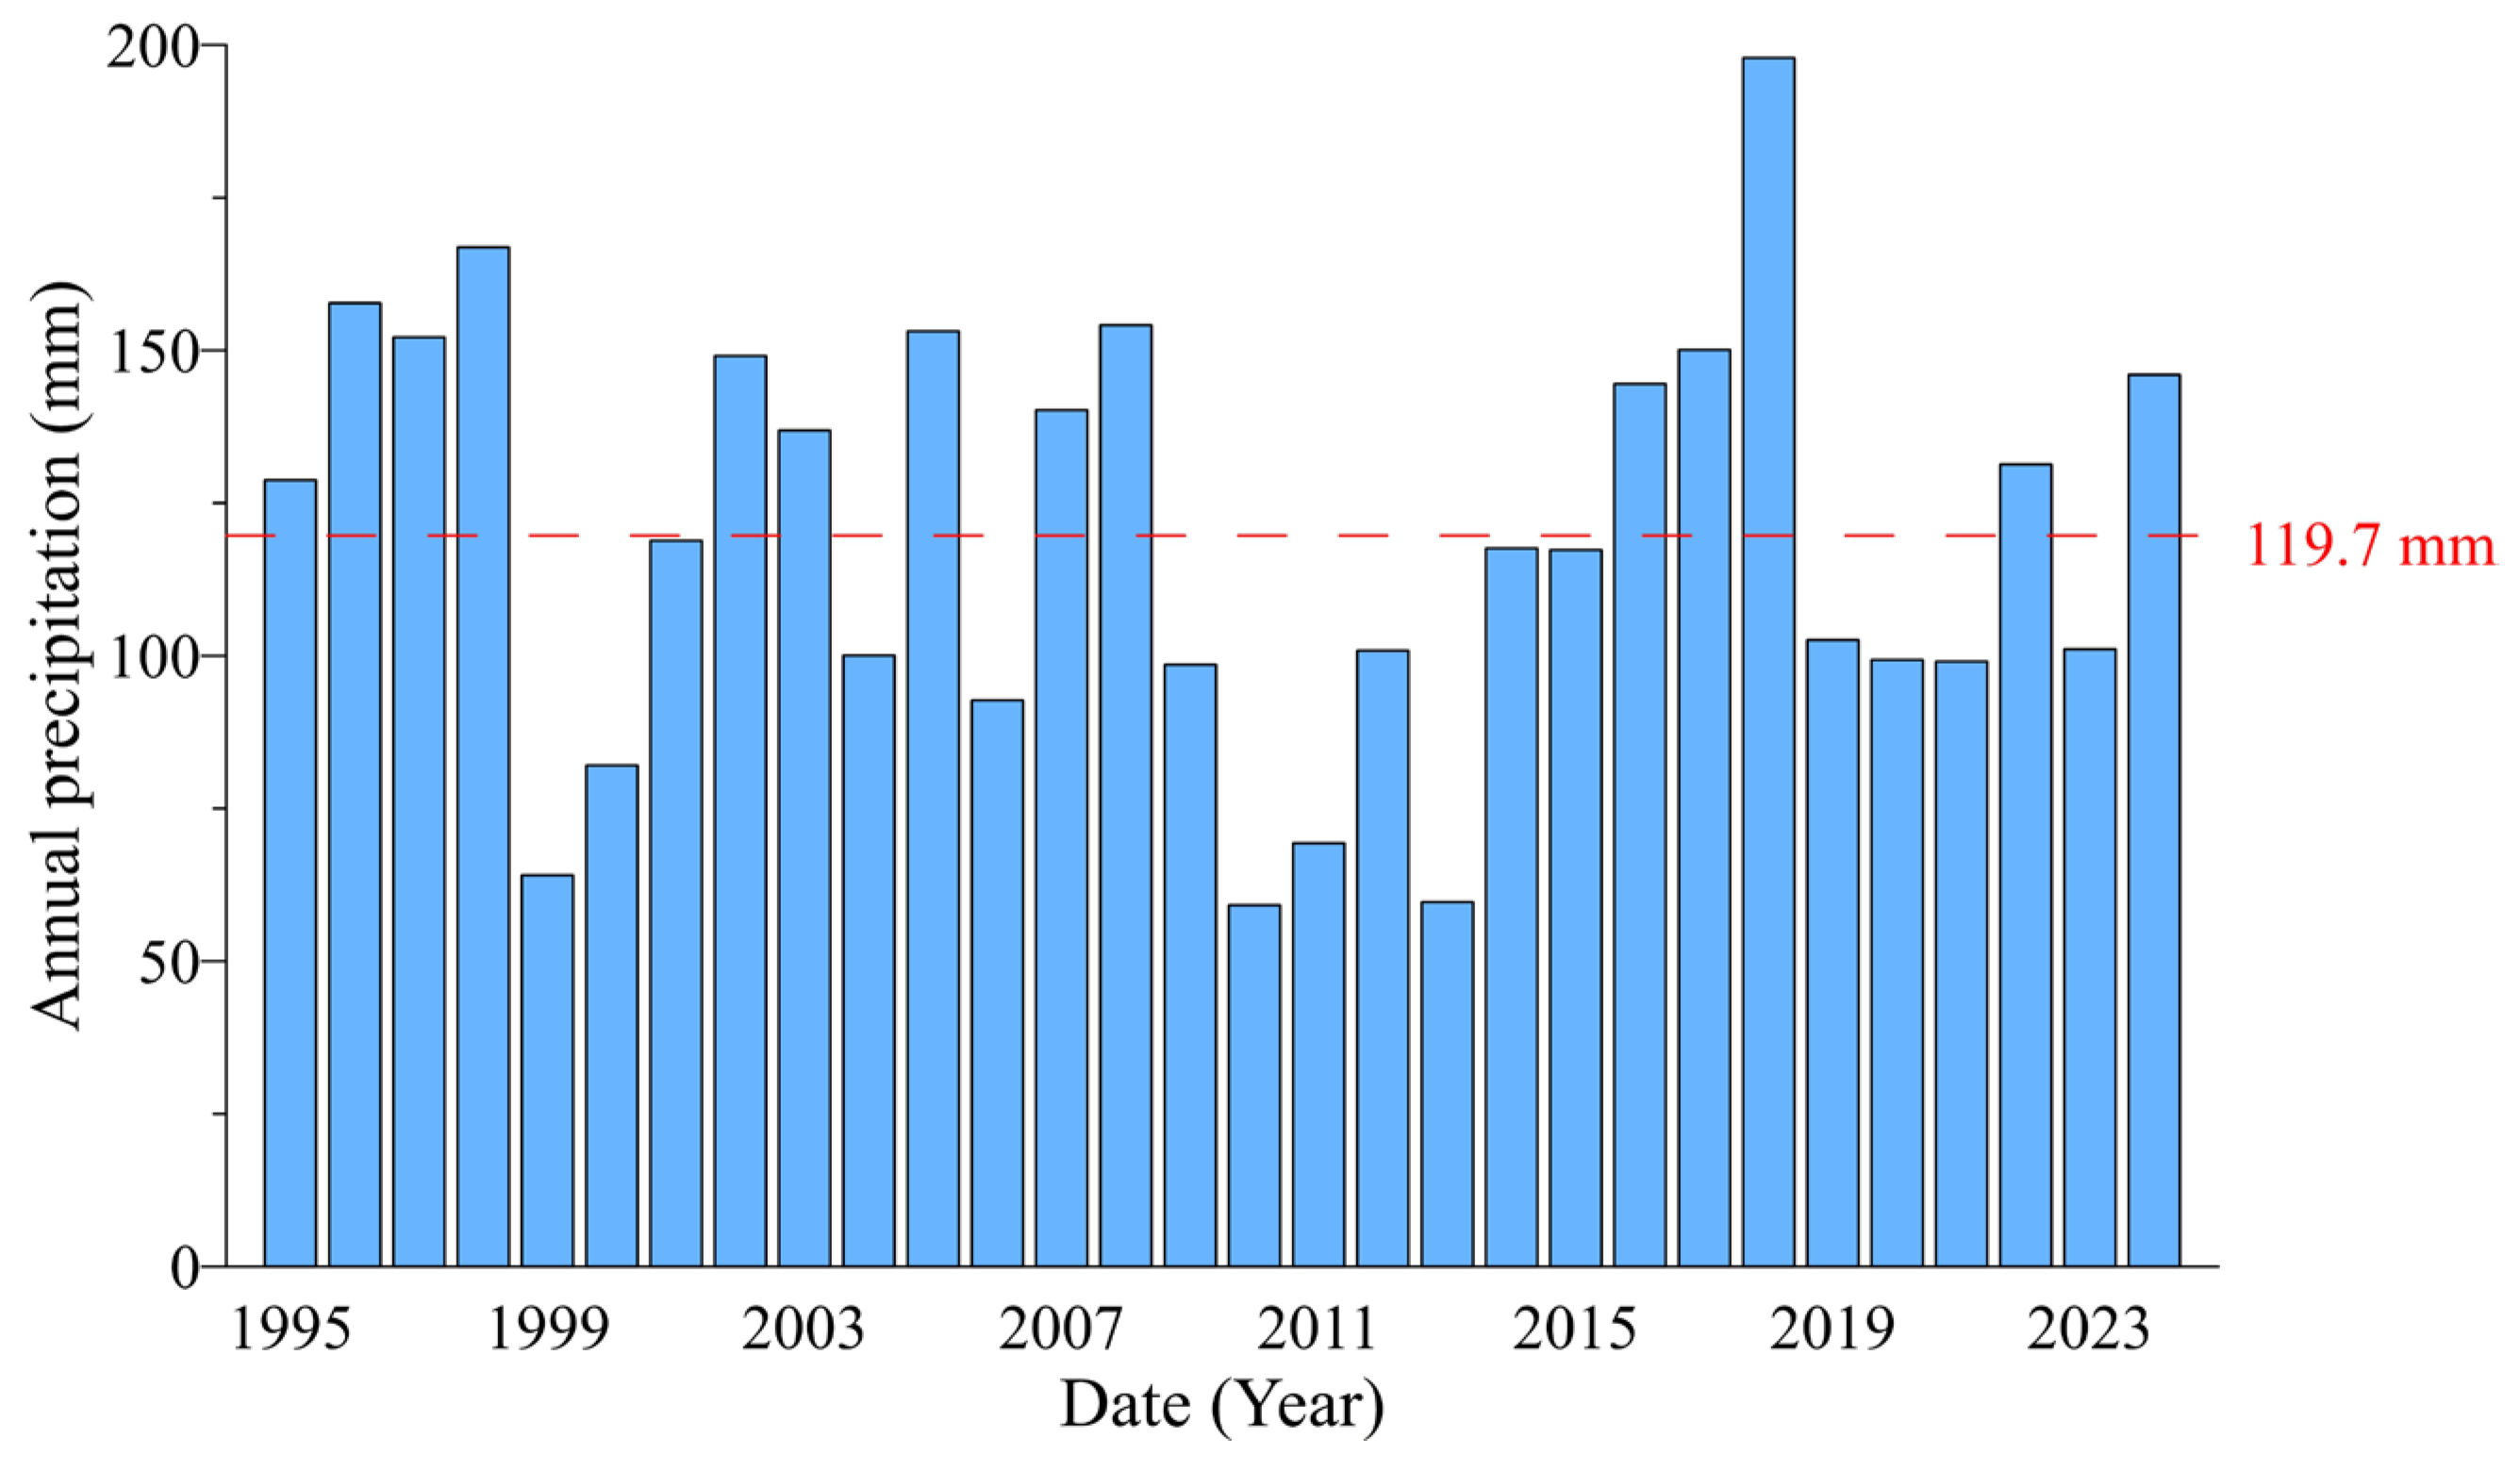
The region experiences a typical temperate continental climate, characterized by cold, dry winters and hot, arid summers. The mean annual temperature is 8.6 °C, with significant diurnal and seasonal variations. Extreme temperatures reach 40.2 °C in July and −31.4 °C in January. Precipitation is low and exhibits uneven distribution, both temporally, with concentration as brief, heavy storms in July and August, and spatially, with a trend of increasing from west to east [30]. Based on a substantial amount of meteorological observation data from the Jilantai Meteorological Station (Figure 2), the multi-year average precipitation over the past 30 years is 119.7 mm. There are significant variations in annual precipitation. The maximum precipitation occurred in 2018, reaching 197.9 mm, while the minimum was recorded in 2010, with a precipitation value of 59.2 mm. In stark contrast, potential evaporation is exceptionally high, with annual values ranging from 2560 to 3200 mm. This value represents 15 to 30 times the annual rainfall and exhibits an increasing trend from east to west [31]. Solar energy resources are abundant, with an annual global solar radiation of 153.69 kCal/cm2 and 3209.48 h of sunshine. The growing season (April–September) receives over half of the annual sunshine hours (1758 h) and 63.37% of the effective photosynthetic radiation. The annual average wind speed is 3.7 m/s, and the prevailing wind directions are westerly and northwesterly. Severe wind and sand events predominantly occur from March to May, with the annual number of blowing sand days ranging from 75 to 79 days. The frost-free period lasts 136 to 205 days.
The vegetation in the region is primarily composed of drought-resistant shrubs and herbs [32]. In this study, we focused on six dominant and ecologically important desert shrub species: Artemisia ordosica, Calligonum mongolicum, Nitraria tangutorum, Reaumuria soongorica, Kalidium foliatum, and Ammopiptanthus mongolicus (Table 1). These species represent a range of root architectures and water-use strategies critical for understanding the local ecohydrology.

2.2. Sample Collection

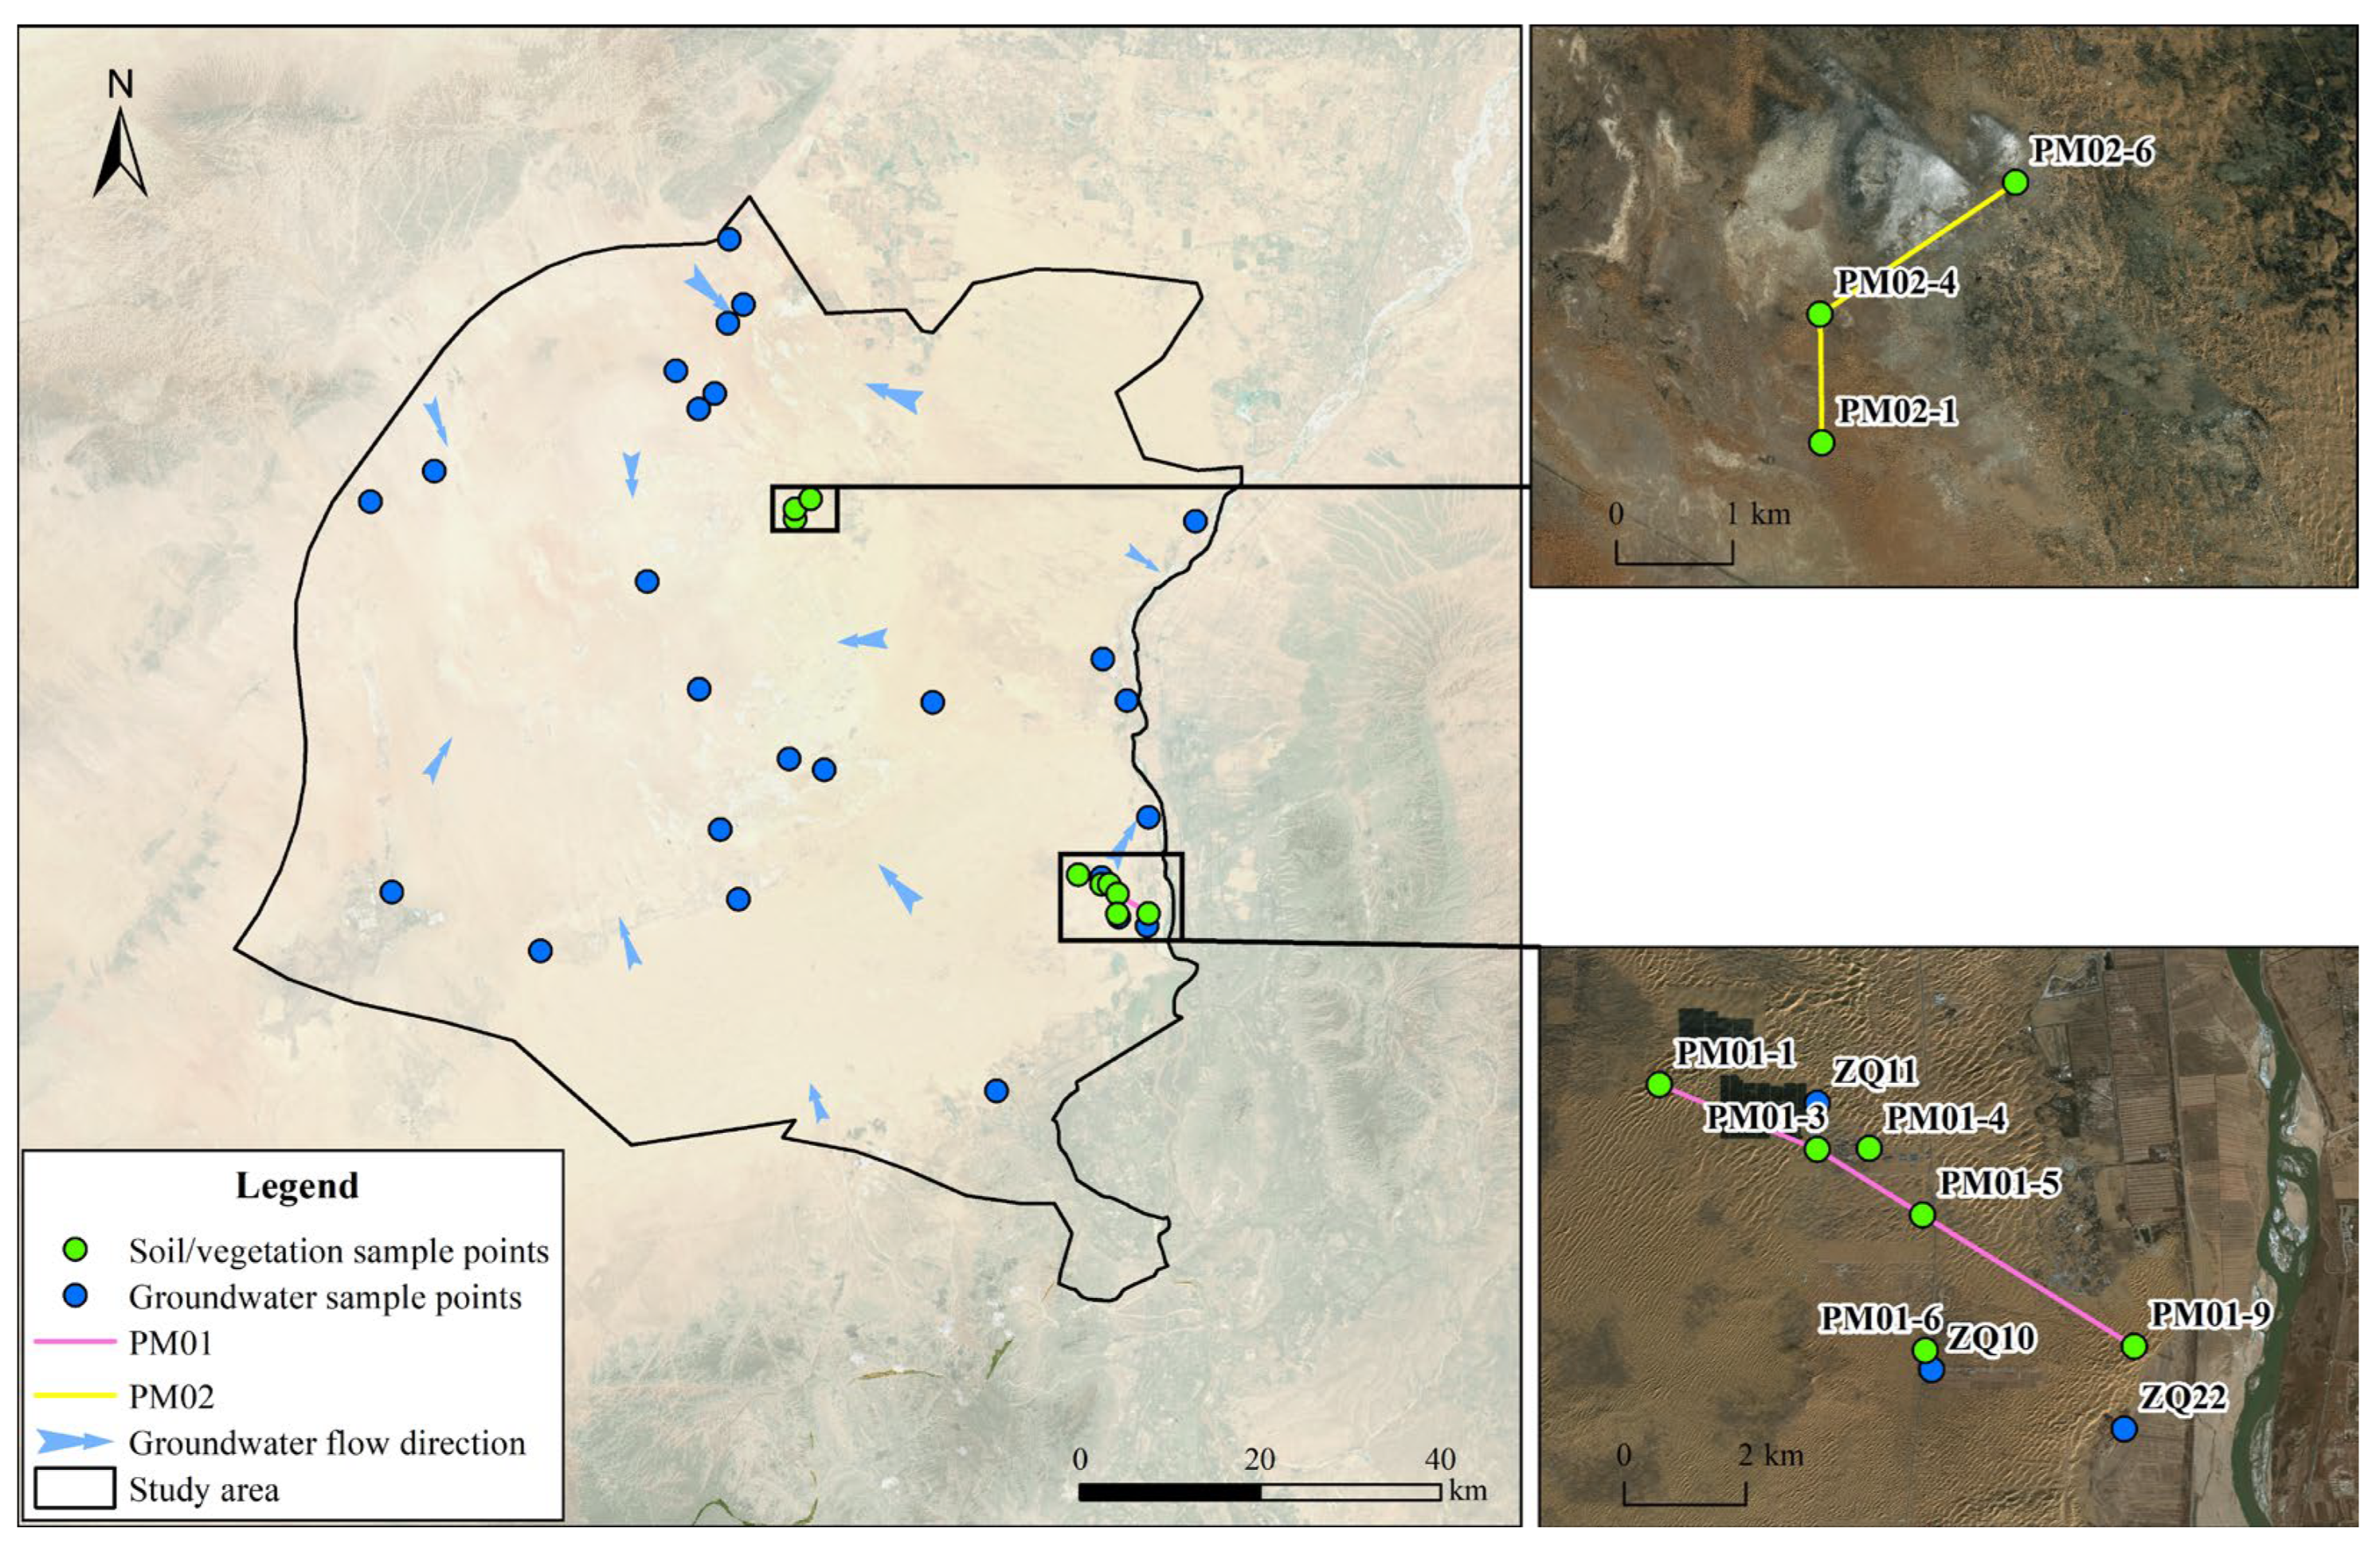
A total of 25 groundwater quality samples and 50 hydrogen and oxygen isotope samples were collected within the study area (Figure 3). Prior to groundwater sampling, a 10-min pumping procedure was implemented to ensure the collection of fresh water samples [33]. All samples were preserved in polyethylene bottles. Cation analysis samples were acidified with 1:1 HNO3, while anion analysis samples were stored without chemical treatment [34]. All sample bottles were sealed with parafilm and refrigerated at 4 °C, then transported to the laboratory within 24 h for hydrochemical analysis [35].
Two profiles were selected in the vicinity of the Yellow River and the central desert region, respectively, for the collection of soil, vegetation, and groundwater hydrogen and oxygen isotope samples. Non-green branches, approximately 3–5 cm in length, were selected based on plant species. For each species at each site, 3–5 individual plants were sampled to ensure biological replication. The bark and phloem were promptly removed, retaining only the xylem, which was immediately placed into 12 mL glass sampling vials, plugged with absorbent cotton, and tightly sealed [36,37]. Soil samples were collected in close proximity to the vegetation. To investigate the water infiltration and transport processes and analyze the extent of soil water imbalance fractionation at different depths, soil samples from the 0–0.8 m profile were collected in four stratified layers: 0–20 cm, 20–40 cm, 40–60 cm, and 60–80 cm, and subsequently stored in 12 mL glass sampling vials. In the area of profile PM01, where the groundwater table is relatively shallow (approximately 2 m), three groundwater hydrogen and oxygen isotope samples were collected from surrounding pastoral wells. Groundwater samples were transferred into 20 mL plastic bottles for preservation. All samples were sealed with parafilm and stored under refrigeration.
All samples were collected in September 2024, during the late growing season in the Ulan Buh Desert. This period represents a relatively stable hydrological phase following the summer precipitation peak (July–August), allowing for a clearer interpretation of groundwater-soil-vegetation interactions without the strong confounding effects of recent rainfall. Additionally, vegetation water use strategies are more pronounced under post-rainy season conditions, facilitating the identification of depth-dependent water uptake patterns.

2.3. Sample Analysis

pH was measured using a pH meter (PB-10, Sartorius, Göttingen, Germany). Cation concentrations (K+, Na+, Ca2+, Mg2+) were determined by inductively coupled plasma optical emission spectrometry (Avio550Max, PerkinElmer, Waltham, MA, USA), a method widely validated for its accuracy in groundwater hydrochemical analysis in arid regions. Anion concentrations (Cl, SO42−, NO3) were analyzed using an ion chromatograph (Metrohm 930, Metrohm AG, Herisau, Switzerland). Bicarbonate (HCO3) was determined by volumetric titration with hydrochloric acid. Hydrogen and oxygen isotopes (δD, δ18O) were measured with a water isotope analyzer (L2130i, Picarro, Santa Clara, CA, USA), which has been extensively used in ecohydrological studies to trace water sources and movement.

2.4. Data Processing and Analysis

2.4.1. Ionic Balance Validation

The reliability of the hydrochemical data was ensured by calculating the ionic balance error for each groundwater sample. The error was computed using the formula [38,39]:
I o n i c   B a l a n c e   E r r o r   ( % ) = c a t i o n s a n i o n s c a t i o n s + a n i o n s × 100
where all ionic concentrations are expressed in milliequivalents per liter (meq/L). The calculated ionic balance errors for all samples fell within the acceptable range of ±5%, with a mean absolute error of 2.66% (range: 0.46% to 4.56%). This confirms the high accuracy and internal consistency of the hydrochemical analyses performed.

2.4.2. Spatial and Statistical Analysis

The spatial distribution of sampling points and hydrochemical classification maps in the study area were generated using ArcGIS 10.6. Gibbs and Piper diagrams, along with bivariate plots illustrating the ion ratio relationships, were produced using Origin 2021. These diagrams were used for analysis of groundwater types and hydrochemical genesis. Descriptive statistics, including mean, median, minimum, maximum, standard deviation (Std), and coefficient of variation (CV), were calculated for all hydrochemical parameters using Microsoft Excel 2016 [40].

2.4.3. Isotopic Analysis

For the hydrogen and oxygen isotope data, a dual approach was adopted. First, the direct comparison method was used to qualitatively identify potential water uptake depths by plotting the isotopic signatures of plant water against those of soil water from different depths and groundwater [41]. Subsequently, a quantitative analysis was performed using the Bayesian mixing model (MixSIAR) in the R environment (v.4.4.2) to estimate the proportional contributions of water from various soil layers to plant uptake [42]. This model is particularly suited for handling uncertainty in source partitioning and has been extensively validated in ecohydrological studies [43]. We defined the soil layers (0–20 cm, 20–40 cm, 40–60 cm, 60–80 cm) as potential sources and the plant xylem water isotope values as the mixture. The model employs the Markov Chain Monte Carlo (MCMC) method to estimate the entire posterior distribution of each variable. The model was run using the “extreme” setting (chain length: 3,000,000 iterations; burn-in: 1,500,000 iterations; thin interval: 500), which employs three Markov chains to ensure robust estimation and convergence. Convergence was assessed using the Gelman-Rubin diagnostic (all values ≤ 1.05). The results are presented as the posterior mean proportion with the 5th and 95th percentiles, representing the credible interval for the contribution of each soil layer.

3. Results

3.1. Hydrochemical Characteristics of Groundwater

According to the hydrochemical test results (Table 2), the pH value of groundwater is 7.27~8.60, the mineralization degree is 0.34~9.56 g/L, and the average value is 2.03 g/L, showing the characteristics of medium high mineralization. The primary cation is Na+, while the main anions are Cl and SO42−, which aligns with the typical characteristics of salt enrichment under evaporation concentration in arid regions. The standard deviations of Cl and Na+ reach 1168.53 mg/L and 678.01 mg/L, respectively, with variation coefficients of 1.63 and 1.15, reflecting significant impact of local geological conditions (e.g., rock salt dissolution, ion exchange) or human activities [44,45]. The pH variation coefficient is only 0.04, indicating a stable acid-base environment that is conducive to maintaining groundwater chemical equilibrium [46].

3.2. Characteristics of Hydrogen and Oxygen Isotopes

The hydrogen and oxygen isotope characteristics of soil, groundwater and vegetation moisture in the study area are shown in Table 3. The δD values of plant samples in the study area range from −30‰ to −72‰, while the δ18O values range from −5.1‰ to 5.5‰, demonstrating significant species-specific variations.
A. ordosica (δD: −30‰~−41‰, δ18O: 2.8‰~5.5‰) and N. tangutorum (δD: −43‰~−72‰, δ18O: −5.1‰~0.9‰) exhibit distinct isotopic compositions, potentially related to the differential root water uptake depths among plant species. The soil water isotopes display pronounced vertical stratification, with surface soil (0–20 cm) showing significantly depleted δD (−45‰ to −72‰) and δ18O (−9.3‰ to −6.2‰) values. As depth increases to the 60–80 cm layer, the δD (−29‰ to −58‰) and δ18O (−6.8‰ to 0.9‰) values become progressively enriched, reflecting the evaporative fractionation effect on surface soil water.
The isotopic composition of groundwater sampled near the PM01 profile exhibits overall stability, demonstrating certain comparability with the isotopic characteristics of deep soil water (60–80 cm depth) and specific plant species (e.g., C. mongolicum and N. tangutorum). This suggests potential hydraulic connectivity between groundwater, deep soil moisture, and water sources utilized by certain vegetation types. Notably, the PM01 profile at the 60–80 cm soil layer exhibits positive δ18O values (0‰ to 0.9‰), potentially indicating capillary rise groundwater recharge at this stratum.

4. Discussion

4.1. Hydrochemical Genesis Analysis of Shallow Groundwater

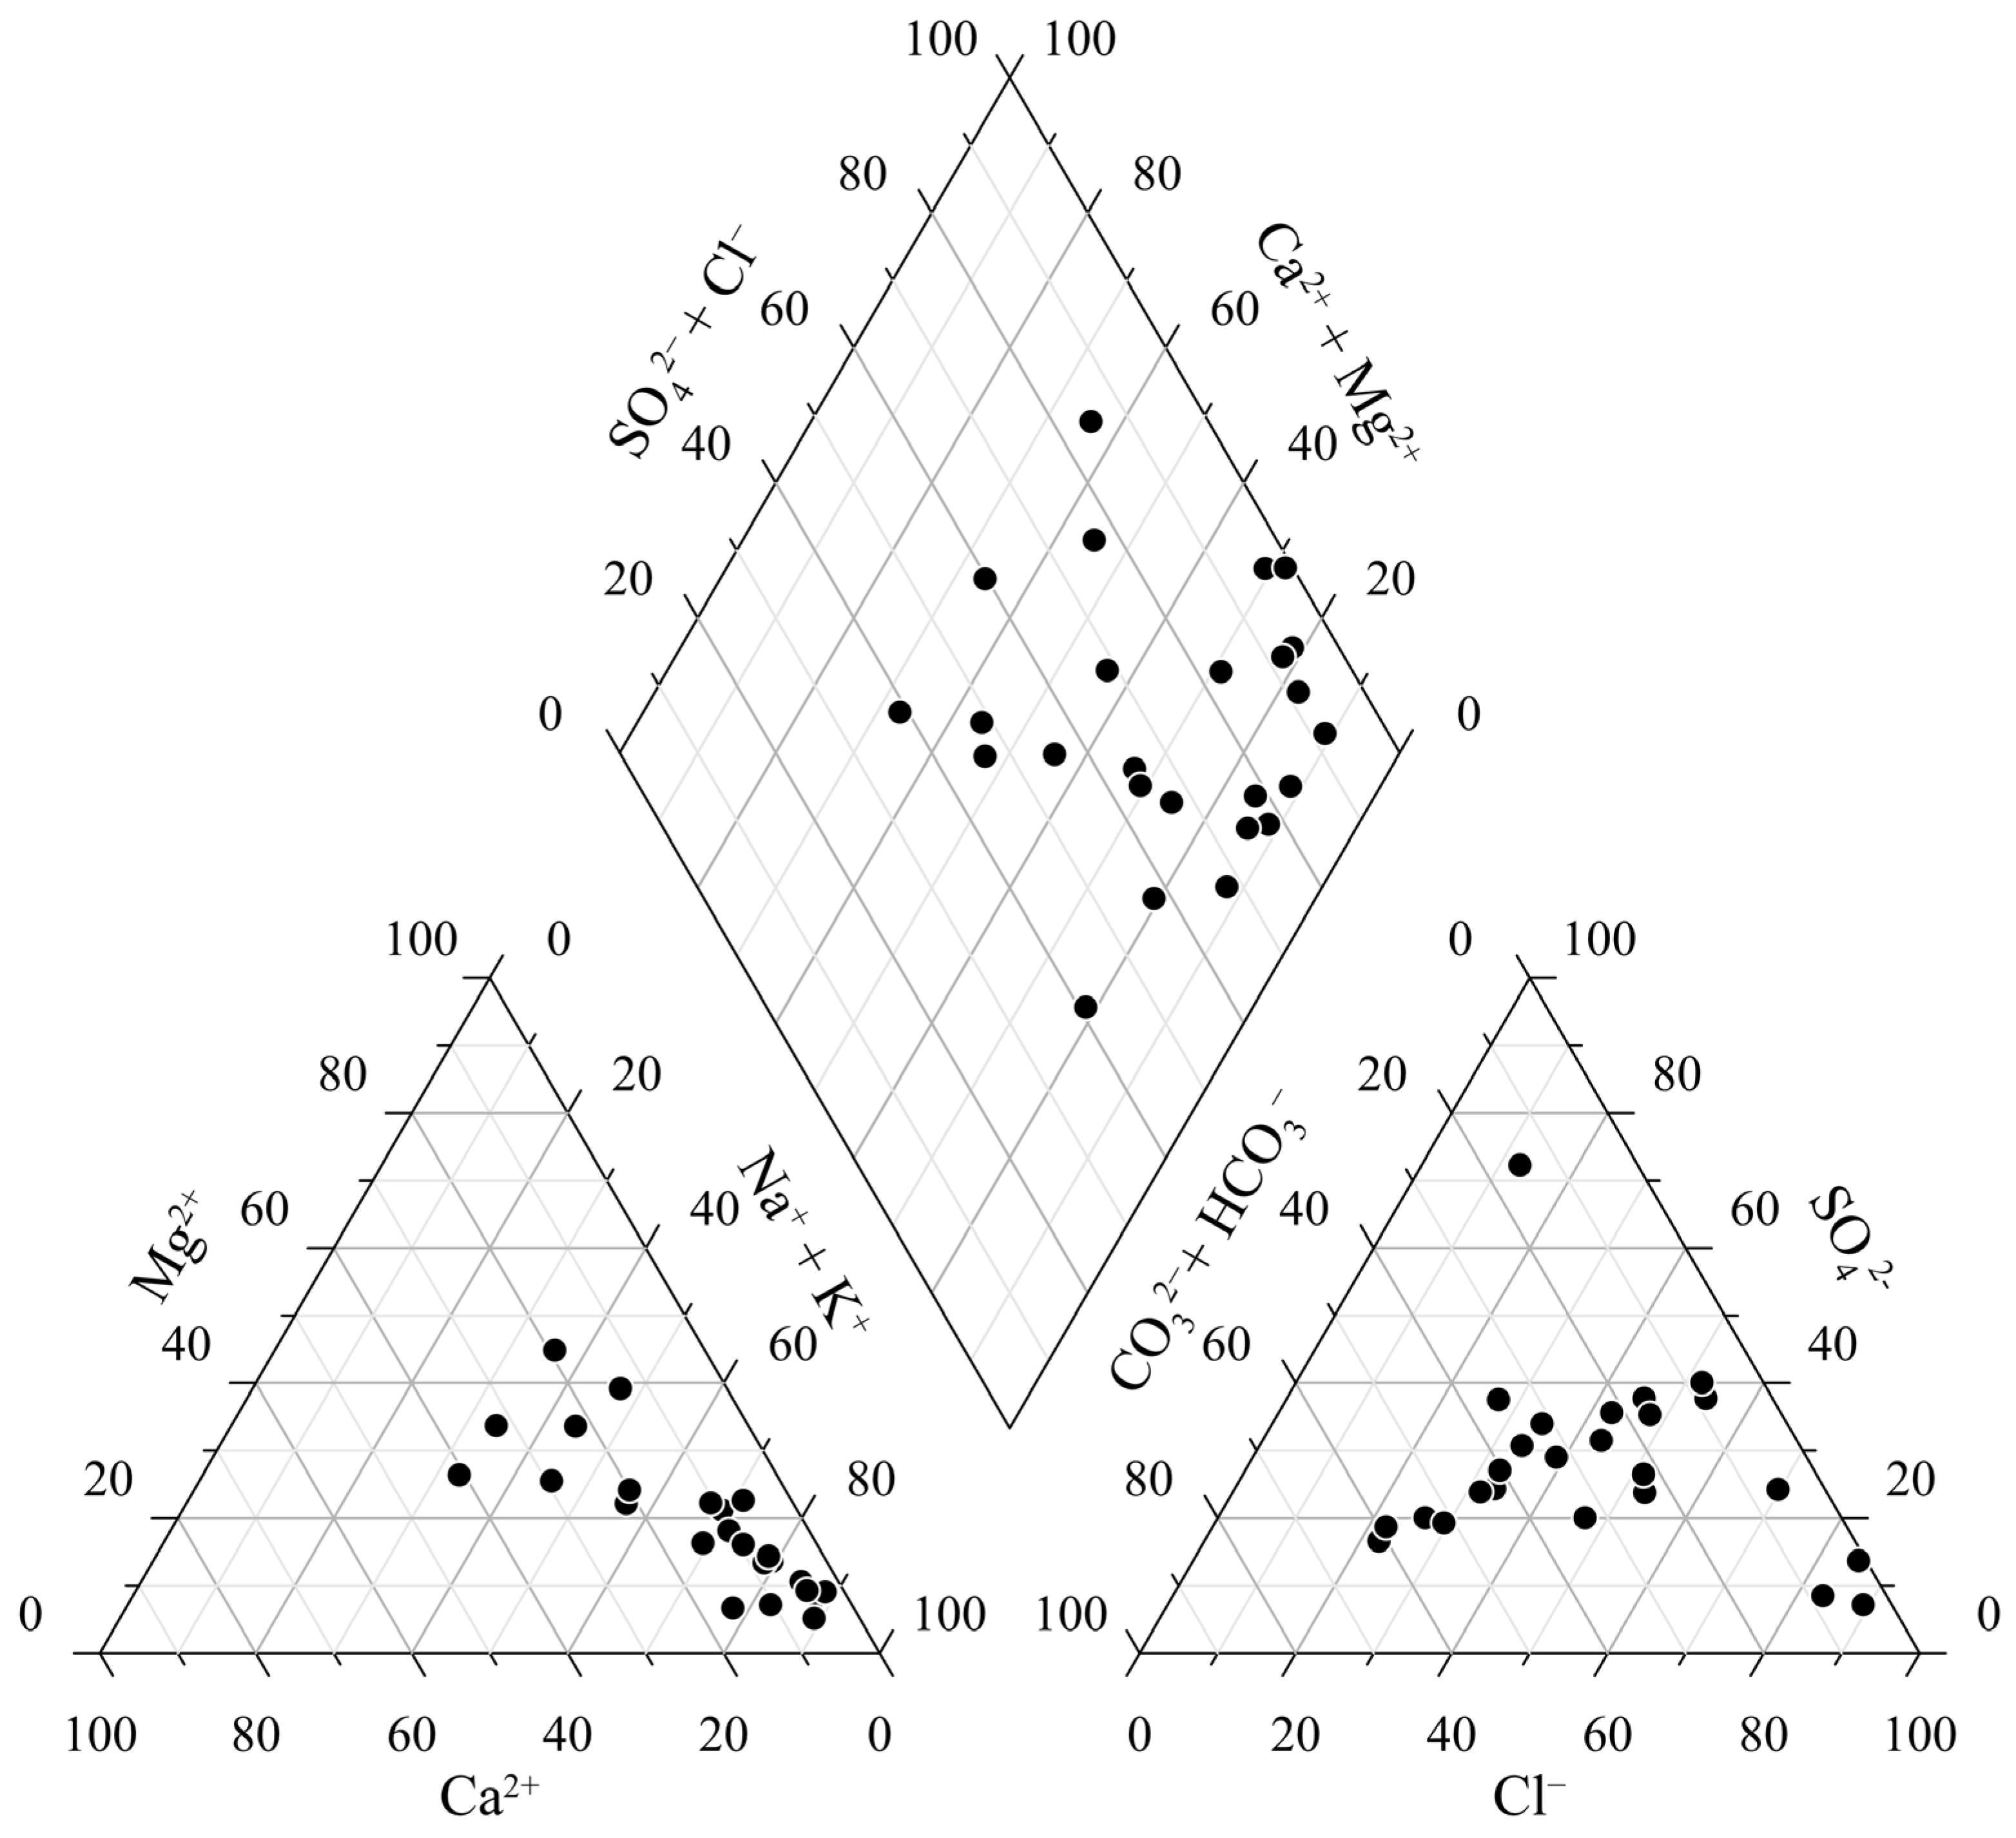
According to the piper diagram of groundwater (Figure 4), the cation composition of shallow groundwater in the study area is mainly Na+, followed by Mg2+ and Ca2+, indicating that significant water rock interaction occurs as groundwater flows through the calcium bearing mineral layer. The enrichment of sodium ions may reflect the ion exchange process or the dissolution of sodium containing minerals. The anions are mainly HCO3 and Cl, suggesting that the hydrochemical characteristics of groundwater in the study area are influenced by both carbonate mineral dissolution and evaporative concentration. SO42− concentrations are generally low and spatially dispersed, with only minor enrichment observed at certain sampling points, may attributable to the dissolution of local gypsum or other sulfur-bearing minerals. Hydrochemical type characteristics show that the groundwater is mainly HCO3 type and Cl type. This combination is common in arid and semi-arid areas, and is closely related to the recharge and discharge conditions of strong evaporation and slow groundwater runoff. The variable ratio of Ca2+ to Na+ + K+ in cations suggests a potential transition in the groundwater flow path from dominance of calcareous mineral dissolution to sodium mineral dissolution or cation exchange processes. This dynamic evolution further corroborates the complex geochemical-hydrological interactions within the study area.
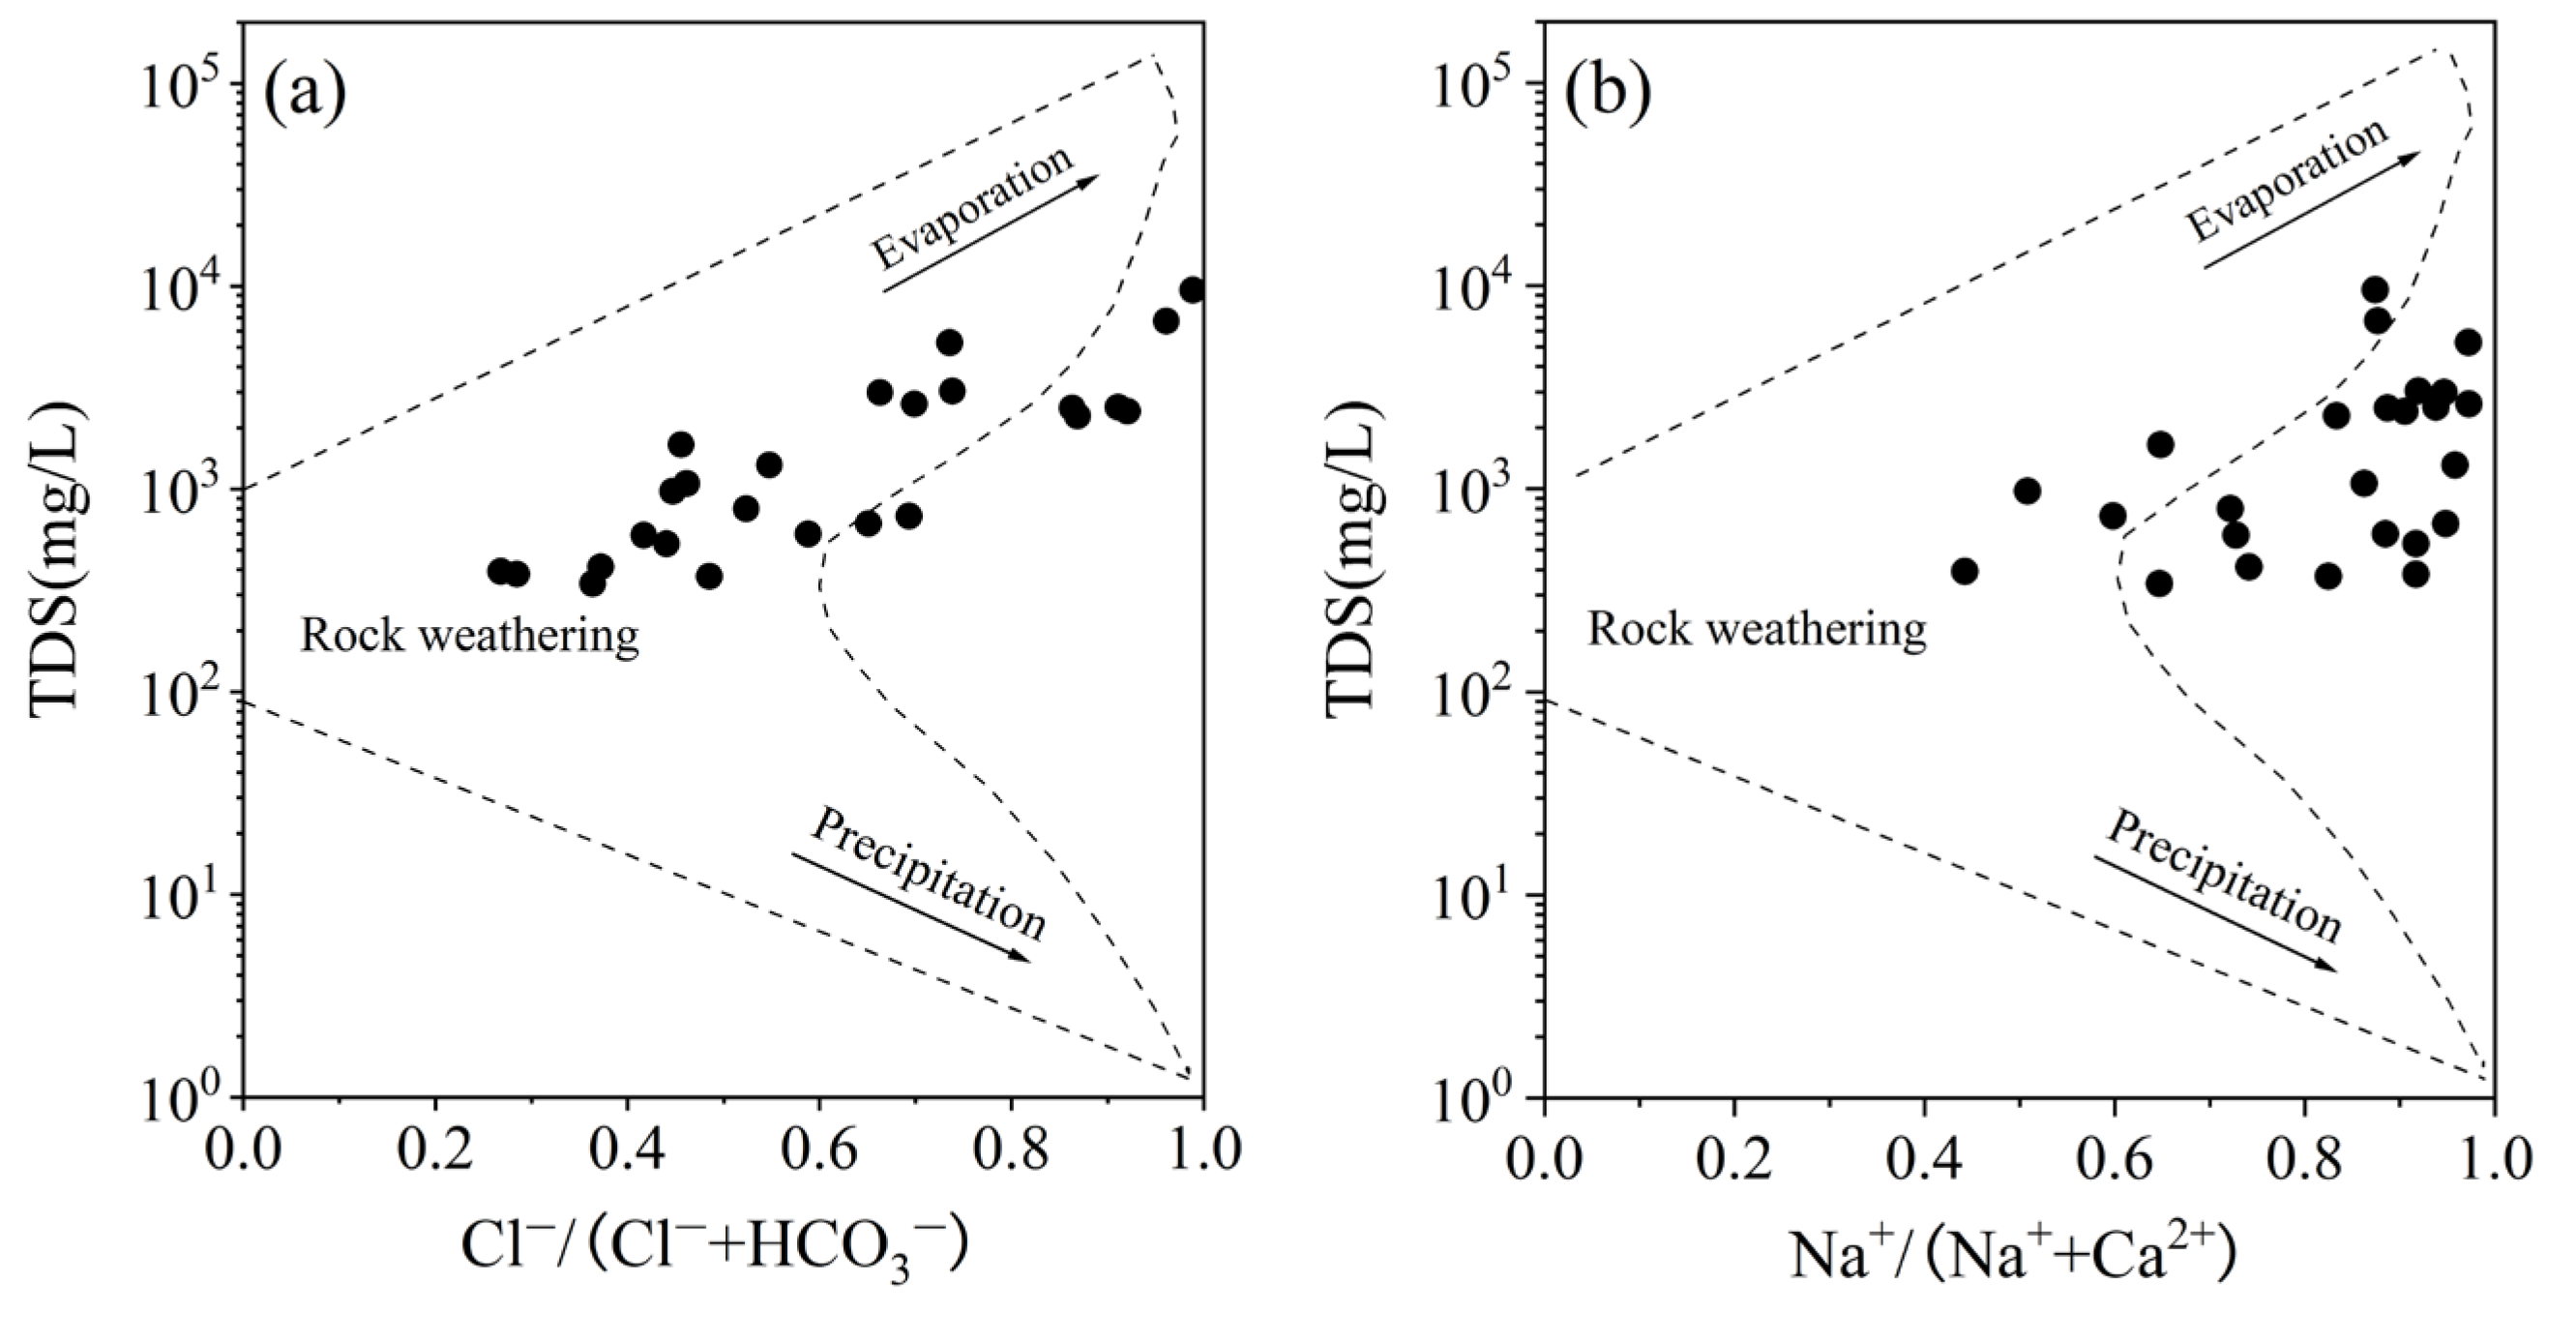
Gibbs diagram can be employed to identify the sources of chemical constituents in natural waters. The natural formation control patterns of aqueous chemical compositions can be categorized into evaporation crystallization type, rock weathering dominance, and precipitation dominance [47,48,49,50]. As illustrated by the Gibbs diagram of groundwater in the study area (Figure 5), the majority of groundwater sampling points are clustered in the central region of the diagram, indicating that rock weathering serves as the predominant controlling factor for hydrochemical composition in the study area. However, certain sampling points exhibit a tendency to shift toward the upper-right quadrant, suggesting that evaporation-crystallization processes also exert non-negligible influence on the chemical characteristics of groundwater in the investigated region.
The ion concentration relationship is used to reveal the source of major ions, so as to further analyze the chemical evolution process of groundwater [51,52]. Na+ and K+ in groundwater mainly come from precipitation and rock salt dissolution. Without the influence of human activities, rock salt dissolution is the main source of Na+ and Cl in groundwater, with their concentration ratio (meq/L) typically around 1. As shown in Figure 6a, the concentration ratio of Na+ to Cl in groundwater is mostly greater than 1, indicating that silicate mineral weathering or cation exchange has additional contributions to Na+ under natural conditions.
The concentration ratio of Ca2+ to Mg2+ can reflect the dissolution of carbonate minerals such as calcite and dolomite. If the ratio is close to 1, it shows that dolomite is dissolved to a large extent. If the ratio increases, it may be due to the dissolution of calcite. When the ratio exceeds 2, it suggests that silicate minerals have dissolved. The Ca2+/Mg2+ relationship diagram of groundwater (Figure 6b) reveals that most groundwater samples exhibit a concentration ratio close to or below 1, indicating that Ca2+ and Mg2+ primarily originate from the dissolution of carbonate minerals like dolomite and calcite. Only a few scattered samples display higher ratios, potentially attributed to silicate mineral dissolution, which may be associated with localized tectonic activities or the mineralogical characteristics of aquifer media.
The ratio of c(Ca2+ + Mg2+)/c(HCO3 + SO42−) is used to characterize the dissolution of carbonate and sulfate minerals in groundwater system. As illustrated in Figure 6c, the majority of water samples cluster around the 1:1 line, indicating the occurrence of carbonate and silicate dissolution. Some samples deviate above this line, suggesting additional dissolution of SO42− bearing minerals alongside carbonate minerals in the groundwater.
To further clarify the main sources of ions in the groundwater within the study area, the relationship between c(Ca2+ + Mg2+–HCO3–SO42−) and c(Na+–Cl) (meq/L) was used to characterize the degree of ion exchange in the samples. The groundwater samples exhibited a positive correlation between the two parameters (Figure 6d), indicating the occurrence of ion exchange processes in the region. Specifically, Na+ ions in groundwater replaced Ca2+ and Mg2+ ions within the vadose zone and aquifer media, resulting in elevated concentrations of Ca2+ and Mg2+ in groundwater and consequently increasing groundwater hardness.

4.2. Analysis of Groundwater and Soil Moisture Sources

Utilizing the C-Isoscape dataset compiled and published by Professor Wang’s research team at Northwest Normal University, which employs a regional fuzzy clustering method to generate multi-year monthly averaged precipitation hydrogen and oxygen stable isotope products [53], we extracted isotopic data from the nearest interpolation points to the sampling locations to establish the Local Meteoric Water Line (LMWL) for the study area: δD = 7.85 × δ18O + 4.48 (R2 = 0.99) (Figure 7). Both the slope and intercept of this equation are lower than those of the Global Meteoric Water Line (GMWL: δD = 8 × δ18O + 10), indicating pronounced arid climatic characteristics in the study area, with evaporation exerting a significant influence on atmospheric precipitation isotopes.
The correlation between δD and δ18O in groundwater and soil water is strong, exhibiting a clear linear relationship (Figure 7). All fitting equations lie below the LMWL, suggesting that precipitation serves as the primary recharge source for both groundwater and soil water, while also being influenced by evaporation. The slope characteristics of the Soil Water Evaporation Line (SWEL) in the soil profile show that PM01 > PM02. From the perspective of regional climate conditions, PM01 is situated at the eastern edge of the Ulan Buh Desert, in close proximity to the Yellow River, enjoying more favorable conditions for water vapor condensation and a relatively wetter climate. In contrast, PM02 is located in the central part of the desert, experiencing a more arid climate, which results in a lower slope for its SWEL. The groundwater sample points are relatively close to SWELPM01, indicating that the soil moisture at PM01 may originate from groundwater recharge.
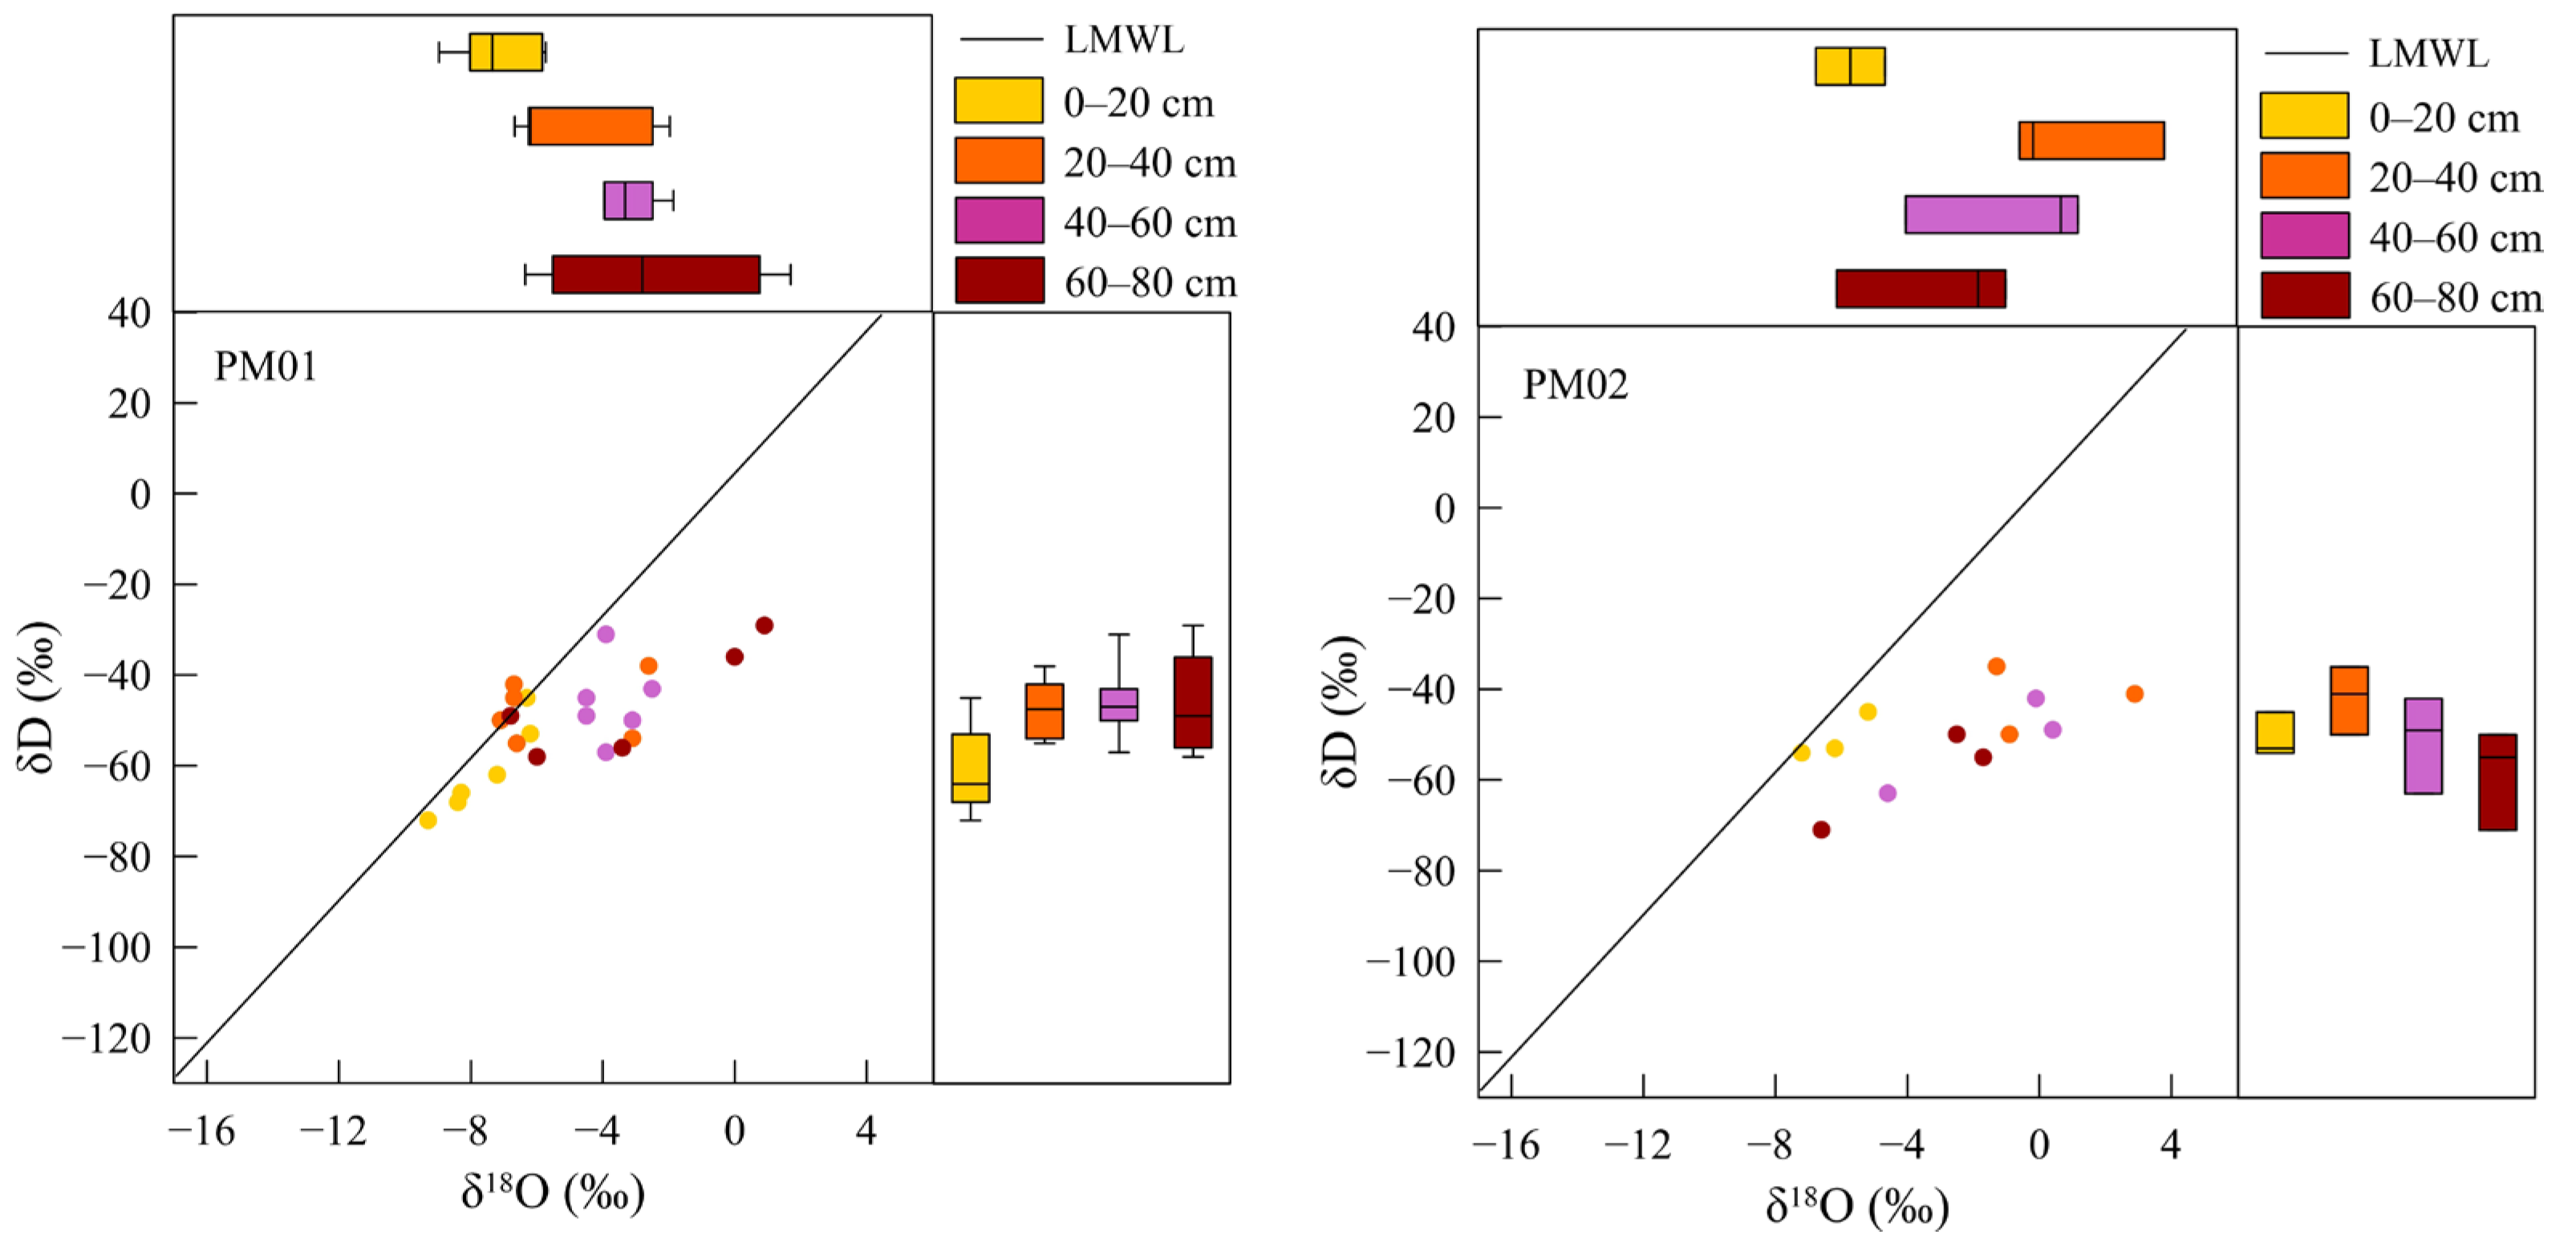
The hydrogen and oxygen isotope values of soil water from PM01 exhibited a gradual enrichment trend as depth increased (Figure 8). This trend could be attributed to the shallow soil receiving more recharge from precipitation. During precipitation infiltration, previously isotope-enriched soil water is displaced downwards, leading to a relative enrichment of isotopes in deeper soil water. The hydrogen and oxygen isotope values of shallow soil water exhibited significant fluctuations, primarily influenced by external environmental perturbations such as evaporation and precipitation. Frequent occurrences of evaporation-induced fractionation at varying degrees contributed to the instability of the isotope values in shallow soil water. As the soil layer deepened, the impact of environmental perturbations on soil water gradually diminished, evaporation fractionation decreased, and the hydrogen and oxygen isotope values tended toward stability.
The vertical variation pattern of soil water isotopes in PM02 exhibits an inverse trend compared to PM01. Both δ18O and δD values demonstrate progressive depletion with increasing soil depth, indicating a gradual attenuation of evaporative effects from surface to subsurface layers. Within the 0–40 cm depth interval, isotopic enrichment of soil water occurs with depth, suggesting dominant influences from soil evaporation and plant transpiration in this stratum. Below 40–80 cm, however, isotopic values display a consistent decreasing trend with depth, implying potential hydraulic connectivity between deep soil water and groundwater, likely reflecting significant contributions from groundwater recharge.

4.3. Water Utilization Strategies of Vegetation

The PM01 and PM02 regions are predominantly characterized by zonal vegetation, primarily consisting of A. ordosica, C. mongolicum, R. soongorica, N. tangutorum, K. foliatum, and A. mongolicus. A. ordosica, R. soongorica, and K. foliatum exhibit predominantly shallow root systems, concentrated within the 0–50 cm soil layer, with strong horizontal expansion capabilities [54,55,56]. Under arid conditions, these roots may extend to deeper layers but generally rely on shallow water absorption. In contrast, C. mongolicum, N. tangutorum, and A. mongolicus develop taproots reaching depths of 1–2 m, with lateral roots extensively distributed in shallow layers (0–50 cm), forming a networked absorption structure [57,58].
Hydrogen and oxygen isotope analysis of groundwater samples collected near PM01-4, PM01-6, and PM01-9 revealed more depleted isotopic signatures compared to vegetation water, suggesting that local vegetation may not primarily rely on groundwater as its main water source. Evaporation induces isotopic enrichment in heavier isotopes, leading to elevated δD and δ18O values. Consequently, the isotopic signature of vegetation water likely reflects evaporative enrichment, further indicating that plants predominantly absorb shallow soil water or precipitation. This demonstrates a shallow water utilization strategy where vegetation preferentially exploits shallow soil moisture or precipitation rather than deep groundwater. Such a phenomenon aligns with typical arid and semi-arid region characteristics, where vegetation adapts to water-stressed environments by predominantly relying on shallow water sources.
Significant variations exist in hydrogen and oxygen isotopic compositions of soil water across different depths. Consequently, by directly comparing the δD and δ18O values of soil water and plant water to identify their intersection points or proximity ranges, we can preliminarily determine the primary water uptake depth of vegetation (Figure 9).
The δD values of A. ordosica show close alignment with soil water at 40–80 cm depth. Specifically, the vegetation water δD values of samples PM01-1 and PM01-9 intersect with soil water values at 60–80 cm, while PM01-3 and PM01-4 exhibit closest correspondence with soil water at 40–60 cm. This suggests that A. ordosica predominantly absorbs soil moisture from the 40–80 cm layer.
For C. mongolicum (PM01-5), its δ18O values show one intersection point with soil water at 40–60 cm, indicating primary water uptake from this depth range during growth. In the PM02 sampling area, three sites with N. tangutorum growth all demonstrate intersection points between plant water δ18O values and soil water at 40–60 cm. The isotopic enrichment patterns of R. soongorica (PM02-1) and K. foliatum (PM02-4) resemble those of N. tangutorum. A. mongolicus (PM02-6) shows one intersection point between plant water δD values and soil water at 40–60 cm. These observations preliminarily suggest that N. tangutorum, R. soongorica, K. foliatum, and A. mongolicus primarily utilize soil moisture from the 40–60 cm layer.
In summary, the direct comparison method indicates that A. ordosica mainly absorbs water from 40–80 cm soil depth, while C. mongolicum, N. tangutorum, R. soongorica, K. foliatum, and A. mongolicus predominantly utilize water from the 40–60 cm layer.
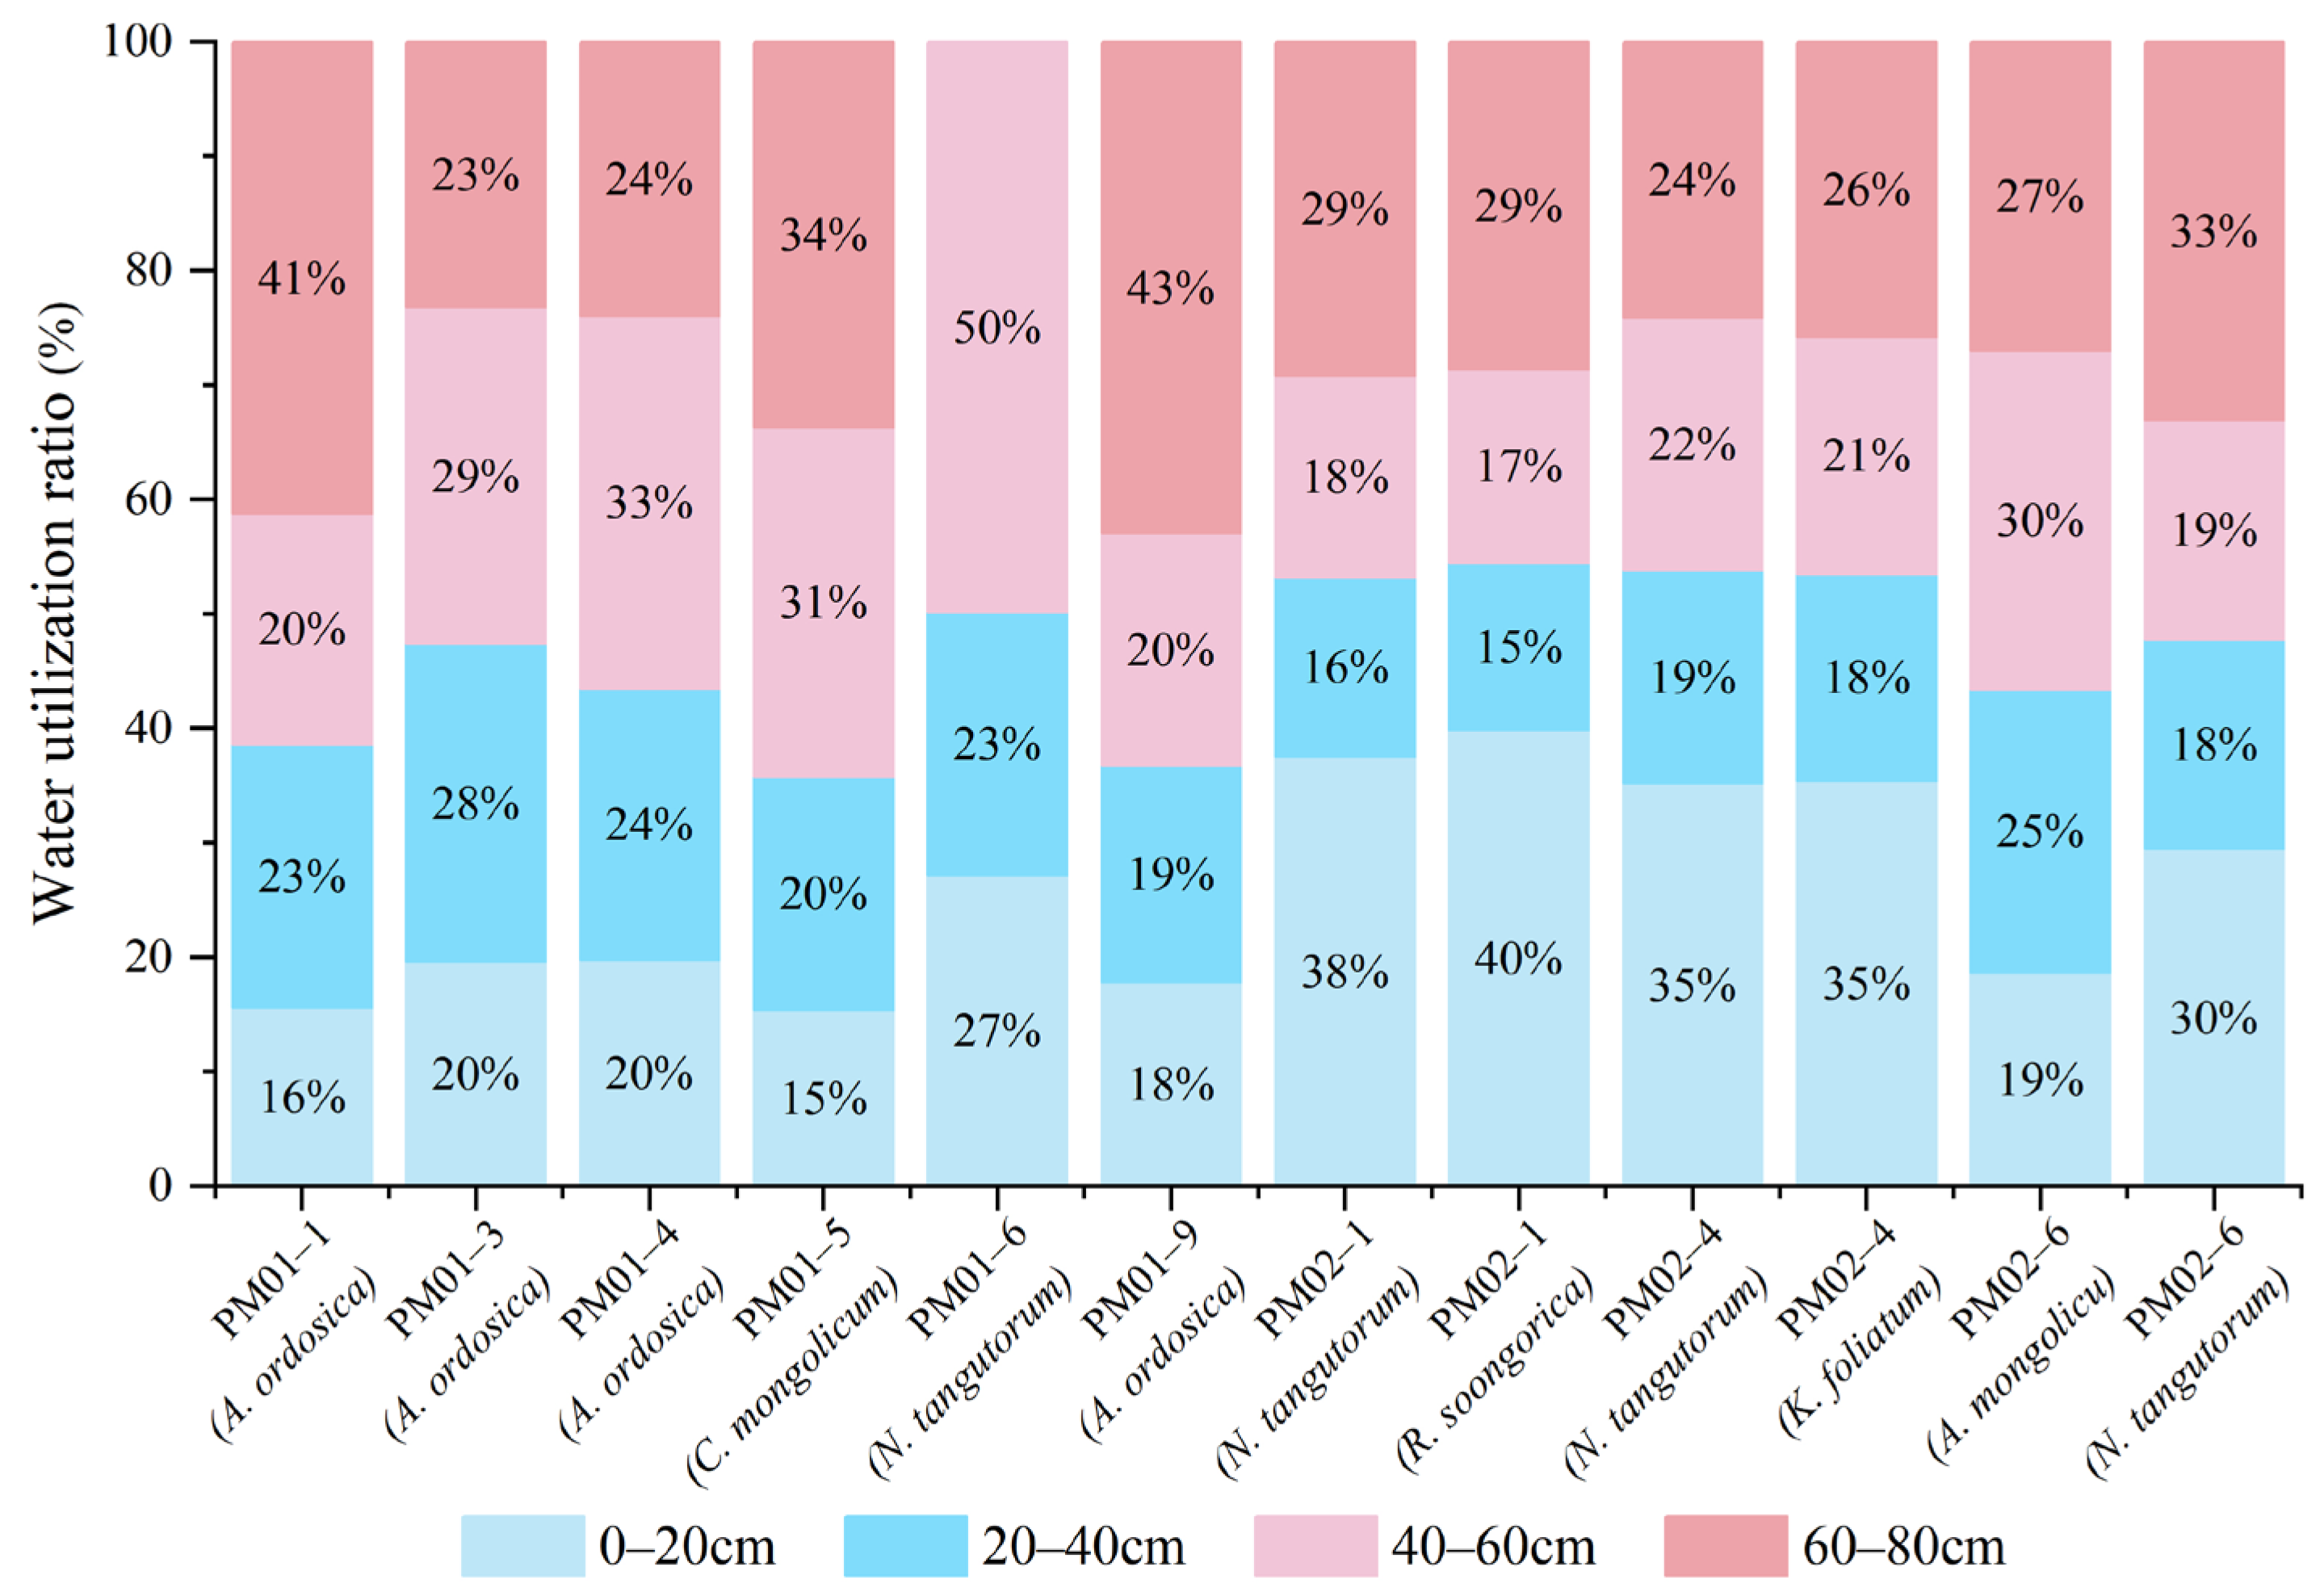
Although the direct comparison method can provide general information on plant water sources, determining the specific absorption proportions from various water sources is more critical in practical applications. Therefore, MixSIAR was employed to analyze the proportional utilization of soil water from different soil layers by plants. The results reveal significant differences in water source selection among vegetation (Figure 10).
In PM01, vegetation primarily utilized soil water from the 40–60 cm and 60–80 cm layers. Specifically, A. ordosica in PM01-1 and PM01-9 predominantly absorbed water from the 60–80 cm layer, while that in PM01-3 and PM01-4 mainly relied on the 40–60 cm layer, with utilization proportions exceeding 30% in both cases. C. mongolicum in PM01-5 demonstrated comparable utilization of soil water from both the 40–60 cm and 60–80 cm layers, with proportions of 31% and 33%, respectively.
In PM02, N. tangutorum, R. soongorica, and K. foliatum primarily utilized soil moisture from the 0–20 cm layer, with proportions exceeding 30%, followed by reliance on the 60–80 cm layer, with utilization approaching 30%. In contrast, A. mongolicus exhibited minimal utilization of soil moisture from the 0–20 cm layer, while showing comparable utilization proportions across other soil depths.
The aforementioned analysis demonstrates that the vegetation in the study area exhibits a distinct stratified water utilization strategy, preferentially absorbing shallow soil water rather than groundwater. A. ordosica primarily extracts moisture from the deeper soil layer at 40–80 cm. C. mongolicum utilizes soil water from both the 40–60 cm and 60–80 cm layers in comparable proportions. In contrast, N. tangutorum, R. soongorica, and K. foliatum predominantly rely on shallow soil water at 0–20 cm while partially utilizing moisture from the 40–80 cm layer. A. mongolicus demonstrates relatively balanced water uptake across the 40–80 cm soil profile.
The vegetation adapts to arid conditions through stratified soil water utilization (shallow + deep layers). Shallow-rooted species (e.g., R. soongorica, K. foliatum) depend on shallow soil moisture, whereas deep-rooted species (e.g., N. tangutorum, A. mongolicus, C. mongolicum) utilize deeper water sources. Some shallow-rooted plants (e.g., A. mongolicus, R. soongorica, K. foliatum) are compelled to access deeper soil water (40–80 cm) when drought conditions accelerate evaporation from shallow layers. This adaptive strategy enables vegetation to maintain survival and growth under water-limited conditions.
The combined application of the MixSIAR model and direct comparison method has quantitatively revealed species-specific water uptake proportions from different soil layers, providing robust evidence for understanding vegetation water-use strategies in arid ecosystems.

4.4. Research Limitations and Future Prospects

This study integrates hydrochemical and stable isotope techniques to elucidate the hydrochemical characteristics of shallow groundwater and the water-use strategies of typical desert vegetation at the end of the growing season in the Ulan Buh Desert, thereby providing essential basic data for ecohydrological processes in this region. However, the research exhibits certain limitations in temporal and spatial dimensions. A clear understanding of these limitations will provides important insights for future investigations.
Temporally, all samples were collected in September 2024, corresponding to the late growing season, which is aimed to capture relatively stable groundwater–soil–vegetation interactions following the peak summer precipitation. Nevertheless, hydrological processes and plant water-use strategies in desert ecosystems are often characterized by strong seasonal fluctuations and precipitation-pulse dynamics [59]. A single sampling event is insufficient to fully capture such variability. Previous studies have demonstrated marked seasonal divergence in water-use strategies among desert plants. For instance, Halostachys caspica primarily relies on shallow soil water in spring and autumn but shifts to intermediate-depth soil water in summer. Populus euphratica predominantly uses intermediate soil water in spring, shifts to groundwater in summer, and increases its dependence on river water in autumn [60]. Similar adaptive adjustments in response to water availability have been observed in Populus simonii, which depends on deep soil water and groundwater during dry periods but significantly increases its use of shallow soil water (0–30 cm) during the rainy season [61]. In the Badain Jaran Desert, N. tangutorum also exhibits seasonal variation in water sources, utilizing groundwater, deep soil water, or mixed water from various soil layers in different months [62]. Therefore, the findings of this study primarily reflect water-use patterns specific to the late growing season. To systematically understand the seasonal adaptability of plants in arid regions, future research should incorporate continuous multi-season monitoring covering dry, wet, and freeze–thaw periods.
Spatially, the soil sampling depth in this study was set at 0–80 cm. While this range effectively covers the primary root zone of shallow-rooted species such as A. ordosica [63,64], it is inadequate for deep-rooted key species like A. mongolicus. Under drought stress, the taproots of such species can extend beyond 2 m to access deep soil water or groundwater [65]. The lack of isotopic data for soil and plant water below 80 cm in this study may lead to an underestimation of the potential utilization of deeper water sources by deep-rooted plants under extreme aridity. Moreover, relying solely on shallow soil water isotope data makes it difficult to accurately distinguish whether plant water originates from precipitation stored in the soil or from groundwater replenished via capillary rise [43]. Simply categorizing plant water sources as “soil water” or “groundwater” is overly simplistic. It is essential to consider the mixing of water from different depths within the soil profile, which requires systematic sampling across the entire root distribution zone, including deeper layers [66]. In this study, hydrogen and oxygen isotopes of soil water at 60–80 cm depth in profile PM01 already indicated a close relationship with groundwater, suggesting the presence of capillary upward recharge. However, the failure to sample below 80 cm may have resulted in missing the actual use of deeper water sources by A. mongolicus during the late growing season or in drought years, thereby introducing bias in the assessment of its water-use strategy, particularly regarding its indirect reliance on groundwater.
In summary, the temporal and spatial limitations of this study define the boundaries within which its conclusions are applicable. Nonetheless, the findings provide a valuable foundation for understanding ecohydrological processes in the Ulan Buh Desert during specific hydrological phases. Future research should integrate high-frequency sampling, deeper soil profile monitoring, and long-term stationary observations to more comprehensively reveal the dynamic adaptive mechanisms of desert vegetation water use under climate change.

5. Conclusions

(1)
The hydrochemical characteristics of groundwater in the study area are governed by multiple geohydrological processes. Piper diagram shows that its hydrochemical types are mainly HCO3− type and Cl− type. The high salinity of groundwater is mainly due to the dissolution, evaporation and concentration of carbonate minerals and ion exchange process. Rock weathering is the dominant factor, but evaporation and concentration also significantly enhanced groundwater mineralization in some areas.
(2)
Vegetation exhibits distinct depth-stratified water use strategies. Shallow-rooted species (e.g., R. soongorica, K. foliatum) primarily rely on shallow soil water (0–20 cm), while deep-rooted plants (e.g., N. tangutorum, A. mongolicus) predominantly utilize deeper soil moisture (40–80 cm). No direct groundwater dependence was observed.
(3)
Soil water isotopes exhibit significant vertical stratification, revealing a hydraulic connection between the enriched deep layer (60–80 cm) and groundwater. This suggests capillary rise recharge into the vadose zone, which vegetation subsequently accesses indirectly via the soil matrix rather than through direct uptake.
(4)
This study provides a snapshot of ecohydrological interactions during the late growing season; however, its findings are constrained by the single sampling period and limited soil sampling depth. Future work should adopt multi-season monitoring and deeper soil sampling to better capture vegetation-soil-groundwater dynamics.

Author Contributions

Conceptualization, X.L.; methodology, X.L. and Y.H.; validation, J.Z., L.M. and C.W.; formal analysis, X.L. and Y.H.; investigation, J.Z., L.M. and C.W.; resources, P.B.; data curation, X.L. and J.Z.; writing—original draft preparation, X.L.; writing—review and editing, W.Z. and P.B.; supervision, W.Z.; project administration, P.B.; funding acquisition, P.B. All authors have read and agreed to the published version of the manuscript.

Funding

This research was funded by China Geological Survey Project (No. DD20240701603).

Data Availability Statement

The original contributions presented in this study are included in the article. Further inquiries can be directed to the corresponding author.

Conflicts of Interest

The authors declare no conflicts of interest.

References

  1. D’Odorico, P.; Bhattachan, A.; Davis, K.F.; Ravi, S.; Runyan, C.W. Global desertification: Drivers and feedbacks. Adv. Water Resour. 2013, 51, 326–344. [Google Scholar] [CrossRef]
  2. Yang, X.; Zhang, K.; Jia, B.; Ci, L. Desertification assessment in China: An overview. J. Arid Environ. 2005, 63, 517–531. [Google Scholar] [CrossRef]
  3. Miyazono, S.; Patiño, R.; Taylor, C.M. Desertification, salinization, and biotic homogenization in a dryland river ecosystem. Sci. Total Environ. 2015, 511, 444–453. [Google Scholar] [CrossRef]
  4. Guillen-Cruz, G.; Rodríguez-Sánchez, A.L.; Fernández-Luqueo, F.; Flores-Rentería, D. Influence of vegetation type on the ecosystem services provided by urban green areas in an arid zone of northern Mexico. Urban For. Urban Green. 2021, 1 (Suppl. S1), 127135. [Google Scholar] [CrossRef]
  5. Liu, L.; Gou, X.; Wang, X.; Yang, M.; Qie, L.; Pang, G.; Wei, S.; Zhang, F.; Li, Y.; Wang, Q.; et al. Relationship between extreme climate and vegetation in arid and semi-arid mountains in China: A case study of the Qilian Mountains. Agric. For. Meteorol. 2024, 348, 109938. [Google Scholar] [CrossRef]
  6. XU, H.-L.; YE, M.; LI, J.-M. Changes in groundwater levels and the response of natural vegetation to transfer of water to the lower reaches of the Tarim River. J. Environ. Sci. 2007, 19, 1199–1207. [Google Scholar] [CrossRef]
  7. Zhao, M.; Wang, W.; Wang, Z.; Chen, L.; Ma, Z.; Wang, Q. Water use of Salix in the variably unsaturated zone of a semiarid desert region based on in-situ observation. J. Hydrol. 2020, 591, 125579. [Google Scholar] [CrossRef]
  8. Bhanja, S.N.; Malakar, M.; Mukherjee, A.; Rodell, M.; Mitra, P.; Sarkar, S. Using Satellite-Based Vegetation Cover as Indicator of Groundwater Storage in Natural Vegetation Areas. Geophys. Res. Lett. 2019, 46, 8082–8092. [Google Scholar] [CrossRef]
  9. Zhu, L.; Gong, H.; Dai, Z.; Xu, T.; Su, X. An integrated assessment of the impact of precipitation and groundwater on vegetation growth in arid and semiarid areas. Environ. Earth Sci. 2015, 74, 5009–5021. [Google Scholar] [CrossRef]
  10. Chen, Y.; Li, W.; Xu, C.; Ye, Z.; Chen, Y. Desert riparian vegetation and groundwater in the lower reaches of the Tarim River basin. Environ. Earth Sci. 2014, 73, 547–558. [Google Scholar] [CrossRef]
  11. Liu, B.; Zhao, Y.; Malekian, A.; Wang, X.; Zhao, W.; Manesh, M.B.; Wang, B.; Yang, C.; Sun, W.; Li, W.; et al. Interactions and feedback mechanisms in oasis wetland hydrology–soil–vegetation systems, northwestern China. Catena 2025, 258, 109220. [Google Scholar] [CrossRef]
  12. Hao, Y.; Wan, J.; Xin, Y.; Zhou, W.; Li, Y.; Mao, L.; Li, X.; Mo, L.; Li, R. Research on Ecological–Environmental Geological Survey and Evaluation Methods for the Kundulun River Basin in Baotou City. Water 2025, 17, 1926. [Google Scholar] [CrossRef]
  13. Cao, S.; Chen, L.; Shankman, D.; Wang, C.; Wang, X.; Zhang, H. Excessive reliance on afforestation in China’s arid and semi-arid regions: Lessons in ecological restoration. Earth Sci. Rev. 2010, 104, 240–245. [Google Scholar] [CrossRef]
  14. Tong, X.; Brandt, M.; Yue, Y.; Horion, S.; Wang, K.; Keersmaecker, W.D.; Tian, F.; Schurgers, G.; Xiao, X.; Luo, Y. Increased vegetation growth and carbon stock in China karst via ecological engineering. Nat. Sustain. 2018, 1, 44–50. [Google Scholar] [CrossRef]
  15. Li, D.; Liu, K.; Wang, S.; Wu, T.; Li, H.; Bo, Y.; Zhang, H.; Huang, Y.; Li, X. Four decades of hydrological response to vegetation dynamics and anthropogenic factors in the Three-North Region of China and Mongolia. Sci. Total Environ. 2022, 857, 159546. [Google Scholar] [CrossRef]
  16. Zhang, J.; Zhang, Y. Quantitative Assessment of the Impact of the Three-North Shelter Forest Program on Vegetation Net Primary Productivity over the Past Two Decades and Its Environmental Benefits in China. Sustainability 2024, 16, 3656. [Google Scholar] [CrossRef]
  17. Wang, F.; Pan, X.; Gerlein-Safdi, C.; Cao, X.; Wang, S.; Gu, L.; Wang, D.; Lu, Q. Vegetation restoration in Northern China: A contrasted picture. Land Degrad. Dev. 2020, 31, 669–676. [Google Scholar] [CrossRef]
  18. Liang, W.; Quan, Q.; Wu, B.; Mo, S. Response of Vegetation Dynamics in the Three-North Region of China to Climate and Human Activities from 1982 to 2018. Sustainability 2023, 15, 3073. [Google Scholar] [CrossRef]
  19. Ke, Q.; Jiaojun, Z.; Xiao, Z.; Geoff, W.G.; Mingcai, L. Impacts of the world’s largest afforestation program (Three-North Afforestation Program) on desertification control in sandy land of China. GISci. Remote Sens. 2023, 60, 2167574. [Google Scholar]
  20. Chen, A.; Xiong, J.; Wu, S.; Yang, Y. Changes in terrestrial water storage in the Three-North region of China over 2003–2021: Assessing the roles of climate and vegetation restoration. J. Hydrol. 2024, 637, 131303. [Google Scholar] [CrossRef]
  21. Yang, L.; Wang, C.; Liu, Y.; Wang, T.; Tian, Z.; Ding, L.; Liu, Z.; Feng, T.; Niu, Q.; Mao, X.; et al. The change pattern and spatiotemporal transition of land use carbon emissions in China’s Three-North Shelterbelt Program Region. Ecol. Eng. 2025, 219, 107680. [Google Scholar] [CrossRef]
  22. Hao, Y.; Ding, G.; Zhang, J.; Cao, J.; Zhou, J. Study on the Quantitative Relationship Between the Sand-Wind Disastrous Climate and the Construction of the Protecting Forest System on the Northeast Edge of Wulanbuh Desert. Sci. Soil Water Conserv. 2004, 2, 79–82. [Google Scholar] [CrossRef]
  23. Li, R.; Kan, S.; Zhu, M.; Chen, J.; Ai, X.; Chen, Z.; Zhang, J.; Ai, Y. Effect of different vegetation restoration types on fundamental parameters, structural characteristics and the soil quality index of artificial soil. Soil Tillage Res. 2018, 184, 11–23. [Google Scholar] [CrossRef]
  24. Li, X.; Ma, Y.; Li, X.; Gao, J.; Xing, Z.; Lu, Q. Plant community heterogeneity and its influencing factors in the Ulan Buh Desert. J. Desert Res. 2022, 42, 187–194. [Google Scholar]
  25. Lu, T.; Wu, J.; Lu, Y.; Zhou, W.; Lu, Y. Effects of Groundwater Depth on Vegetation Coverage in the Ulan Buh Desert in a Recent 20-Year Period. Water 2023, 15, 3000. [Google Scholar] [CrossRef]
  26. Chen, F.; Li, G.; Zhao, H.; Jin, M.; Chen, X.; Fan, Y.; Liu, X.; Wu, D.; Madsen, D. Landscape evolution of the Ulan Buh Desert in northern China during the late Quaternary. Quat. Res. 2014, 81, 476–487. [Google Scholar] [CrossRef]
  27. Wei, G.; Chen, F.; Ma, J.; Dong, Y.; Zhu, G.; Edmunds, W.M. Groundwater recharge and evolution of water quality in China’s Jilantai Basin based on hydrogeochemical and isotopic evidence. Environ. Earth Sci. 2014, 72, 3491–3506. [Google Scholar] [CrossRef]
  28. Dang, H.; Dong, J.; Yue, N.; Dong, Y.; Guo, Y.; Wei, G. Study of the evolution of hydrochemical properties of groundwater in Ulan Buh Desert in the north of the Helan Mountains. J. Glaciol. Geocryol. 2015, 37, 793–802. [Google Scholar]
  29. Wang, N.; Chun, X. Research progress on the quaternary environmental evolution in the Ulan Buh Desert. J. Desert Res. 2022, 42, 175–183. [Google Scholar]
  30. Niu, Y.; Ren, G.; Lin, G.; Biase, L.D.; Fattorini, S. Fine-Scale Vegetation Characteristics Drive Insect Ensemble Structures in a Desert Ecosystem: The Tenebrionid Beetles (Coleoptera: Tenebrionidae) Inhabiting the Ulan Buh Desert (Inner Mongolia, China). Insects 2020, 11, 410. [Google Scholar] [CrossRef]
  31. Yang, W.B.; Feng, W.; Jia, Z.Q.; Zhu, Y.J.; Guo, J.Y. Soil water threshold for the growth of Haloxylon ammodendron in the Ulan Buh desert in arid northwest China. S. Afr. J. Bot. 2014, 92, 53–58. [Google Scholar] [CrossRef]
  32. Han, G.; Huo, J.; Hu, R.; Gong, X.; Nan, Y.; Lian, Y.; Zhang, Z. Coupling relationships between vegetation and soil in different vegetation types in the Ulan Buh Desert and the Kubuqi Desert. Front. Plant Sci. 2025, 16, 1505526. [Google Scholar] [CrossRef]
  33. Xie, X.; Ellis, A.; Wang, Y.; Xie, Z.; Duan, M.; Su, C. Geochemistry of redox-sensitive elements and sulfur isotopes in the high arsenic groundwater system of Datong Basin, China. Sci. Total Environ. 2009, 407, 3823–3835. [Google Scholar] [CrossRef] [PubMed]
  34. Guo, H.; Jia, Y.; Wanty, R.B.; Jiang, Y.; Zhao, W.; Xiu, W.; Shen, J.; Li, Y.; Cao, Y.; Wu, Y.; et al. Contrasting distributions of groundwater arsenic and uranium in the western Hetao basin, Inner Mongolia: Implication for origins and fate controls. Sci. Total Environ. 2016, 541, 1172–1190. [Google Scholar] [CrossRef] [PubMed]
  35. Li, X.; Guo, H.; Zheng, H.; Xiu, W.; He, W.; Ding, Q. Roles of different molecular weights of dissolved organic matter in arsenic enrichment in groundwater: Evidences from ultrafiltration and EEM-PARAFAC. Appl. Geochem. 2019, 104, 124–134. [Google Scholar] [CrossRef]
  36. Dodd, M.B.; Welker, W.K.L.M. Differential water resource use by herbaceous and woody plant life-forms in a shortgrass steppe community. Oecologia 1998, 117, 504–512. [Google Scholar] [CrossRef]
  37. Li, B.; Wu, X.; Dong, X.; Man, H.; Liu, C.; Zou, S.; He, J.; Zang, S. Soil water uptake from different depths of three tree species indicated by hydrogen and oxygen stable isotopes in the permafrost region of Northeast China. Front. Plant Sci. 2024, 15, 1444811. [Google Scholar] [CrossRef]
  38. Li, P.; Wu, J.; Qian, H. Hydrochemical appraisal of groundwater quality for drinking and irrigation purposes and the major influencing factors: A case study in and around Hua County, China. Arab. J. Geosci. 2016, 9, 15. [Google Scholar] [CrossRef]
  39. Adimalla, N.; Qian, H. Hydrogeochemistry and fluoride contamination in the hard rock terrain of central Telangana, India: Analyses of its spatial distribution and health risk. SN Appl. Sci. 2019, 1, 202. [Google Scholar] [CrossRef]
  40. Güler, C.; Thyne, G.D.; McCray, J.E.; Turner, K.A. Evaluation of graphical and multivariate statistical methods for classification of water chemistry data. Hydrogeol. J. 2002, 10, 455–474. [Google Scholar] [CrossRef]
  41. Ehleringer, J.R.; Dawson, T.E. Water uptake by plants: Perspectives from stable isotope composition. Plant Cell Environ. 2010, 15, 1073–1082. [Google Scholar] [CrossRef]
  42. Stock, B.C.; Jackson, A.L.; Ward, E.J.; Parnell, A.C.; Semmens, B.X. Analyzing mixing systems using a new generation of Bayesian tracer mixing models. PeerJ 2018, 6, e5096. [Google Scholar] [CrossRef]
  43. Evaristo, J.; Jasechko, S.; Mcdonnell, J.J. Global separation of plant transpiration from groundwater and streamflow. Nature 2015, 525, 91–94. [Google Scholar] [CrossRef]
  44. Wang, R.; Kong, S.; Xu, L.; Li, Y.; Chen, W.; Zhao, E. Spatial distribution of soil salinity under different surface land cover types and micro-topography in the Yellow River Delta. Trans. Chin. Soc. Agric. Eng. 2020, 36, 132–141. [Google Scholar]
  45. Liu, Z.; Wang, L.; Qu, Z.; Zhang, R.; He, J.; Ma, G.; Li, E. The Changes in Depth and Physicochemical Properties of Groundwater in Response to Spring Irrigation in Hetao Irrigation District. J. Irrig. Drain. 2022, 41, 101–108. [Google Scholar] [CrossRef]
  46. Li, B.; Cui, X.; Zhu, Y.; Zheng, F. Hydrochemical characteristics and change of groundwater in Chaoyang District of Beijing City. Water Resour. Prot. 2012, 28, 7–12. [Google Scholar]
  47. Moussa, A.B.; Zouari, K.; Marc, V. Hydrochemical and isotope evidence of groundwater salinization processes on the coastal plain of Hammamet-Nabeul, north-eastern Tunisia. Phys. Chem. Earth 2011, 36, 167–178. [Google Scholar] [CrossRef]
  48. Saurabh, S.; Abhishek, S.; Ramsha, K.; Peiyue, L. Spatial analysis of groundwater quality and human health risk assessment in parts of Raebareli district, India. Environ. Earth Sci. 2021, 80, 800. [Google Scholar] [CrossRef]
  49. Patience, M.T.; Elumalai, V.; Rajmohan, N.; Li, P. Occurrence and distribution of nutrients and trace metals in groundwater in an intensively irrigated region, Luvuvhu catchment, South Africa. Environ. Earth Sci. 2021, 80, 752. [Google Scholar] [CrossRef]
  50. Nsabimana, A.; Li, P.; He, S.; He, X.; Alam, S.M.K.; Fida, M. Health Risk of the Shallow Groundwater and Its Suitability for Drinking Purpose in Tongchuan, China. Water 2021, 13, 3256. [Google Scholar] [CrossRef]
  51. Chen, L.; Hui, M.B.; Yang, Y.S. Analysis of Groundwater Chemical Characteristics and Spatiotemporal Evolution Trends of Influencing Factors in Southern Beijing Plain. Front. Environ. Sci. 2022, 10, 913542. [Google Scholar] [CrossRef]
  52. Gong, Z.; Tian, X.; Fu, L.; Niu, H.; Xia, Z.; Ma, Z.; Chen, J.; Zhou, Y. Chemical Characteristics and Controlling Factorsof Groundwater in Chahannur Basin. Water 2023, 15, 1524. [Google Scholar] [CrossRef]
  53. Wang, S.; Lei, S.; Zhang, M.; Hughes, C.; Crawford, J.; Liu, Z.; Qu, D. Spatial and Seasonal Isotope Variability in Precipitation across China: Monthly Isoscapes Based on Regionalized Fuzzy Clustering. J. Clim. 2022, 35, 3411–3425. [Google Scholar] [CrossRef]
  54. Zhao, Y.; Zhou, W.; Sun, B.; Yang, Y.; Li, J.; Li, J.; Cao, B.; Zhong, H. Root Distribution of Three Desert Shrubs and Soil Moisture in Mu Us Sand Land. Res. Soil Water Conserv. 2010, 17, 129–133. [Google Scholar]
  55. Jiang, L.; Li, Y. Comparison on Architecture Characteristics of Root Systems and Leaf Traits for Three Desert Shrubs Adapted to Arid Habitat. J. Desert Res. 2008, 28, 1118–1124. [Google Scholar]
  56. Yang, H.; Li, X.; Liu, L.; Jia, R.; Wang, Z.; Li, X.; Li, G. Biomass Allocation Patterns of Four Shrubs in Desert Grassland. J. Desert Res. 2013, 33, 1340–1348. [Google Scholar]
  57. Kuang, W.; Qian, J.; Ma, Q.; Liu, Z. Vertical distribution of soil organic carbon and its relation to root distribution in five desert shrub communities. Chin. J. Ecol. 2016, 35, 275–281. [Google Scholar] [CrossRef]
  58. Peng, L.; Dai, Y.; Shi, Q. Water Sources of Five Typical Plant Species in Desert in the East Junggar Basin, Xinjiang. Arid Zone Res. 2018, 35, 1146–1152. [Google Scholar] [CrossRef]
  59. Vandandorj, S.; Munkhjargal, E.; Boldgiv, B.; Gantsetseg, B. Changes in event number and duration of rain types over Mongolia from 1981 to 2014. Environ. Earth Sci. 2017, 76, 70. [Google Scholar] [CrossRef]
  60. Hao, S.; Li, F. Water sources for typical desert vegetation in the Ebinur Lake basin. J. Geogr. Sci. 2022, 32, 1103–1118. [Google Scholar] [CrossRef]
  61. Miao, B.; Meng, P.; Zhang, J.; He, F.; Sun, S. Difference of water relationships of poplar trees in Zhangbei County, Hebei, China based on stable isotope and thermal dissipation method. Chin. J. Appl. Ecol. 2017, 28, 2111–2118. [Google Scholar]
  62. Jie, Q.; Jianhua, S.; Bing, J.; Chunyan, Z.; Dongmeng, Z.; Xiaohui, H.; Chunlin, W.; Xinglin, Z. Water use strategies of Nitraria tangutorum in the lake-basin region of the Badain Jaran Desert. Front. Plant Sci. 2023, 14, 1240656. [Google Scholar] [CrossRef]
  63. Yang, H.; Auerswald, K.; Bai, Y.; Han, X. Complementarity in water sources among dominant species in typical steppe ecosystems of Inner Mongolia, China. Plant Soil 2011, 340, 303–313. [Google Scholar] [CrossRef]
  64. Wu, Y.; Zhou, H.; Zheng, X.J.; Li, Y.; Tang, L.S. Seasonal changes in the water use strategies of three co-occurring desert shrubs. Hydrol. Process. 2014, 28, 6265–6275. [Google Scholar] [CrossRef]
  65. Qi, K.; Xin, Z.; Zhang, J.; Zhu, Y. Root distribution characteristics of Ammopiptanthus mongolicus community in Ulan Buh Desert. Pratacult. Sci. 2019, 36, 1706–1715. [Google Scholar]
  66. Adrià, B.; Josep, P. Relative contribution of groundwater to plant transpiration estimated with stable isotopes. Sci. Rep. 2017, 7, 10580. [Google Scholar] [CrossRef] [PubMed]
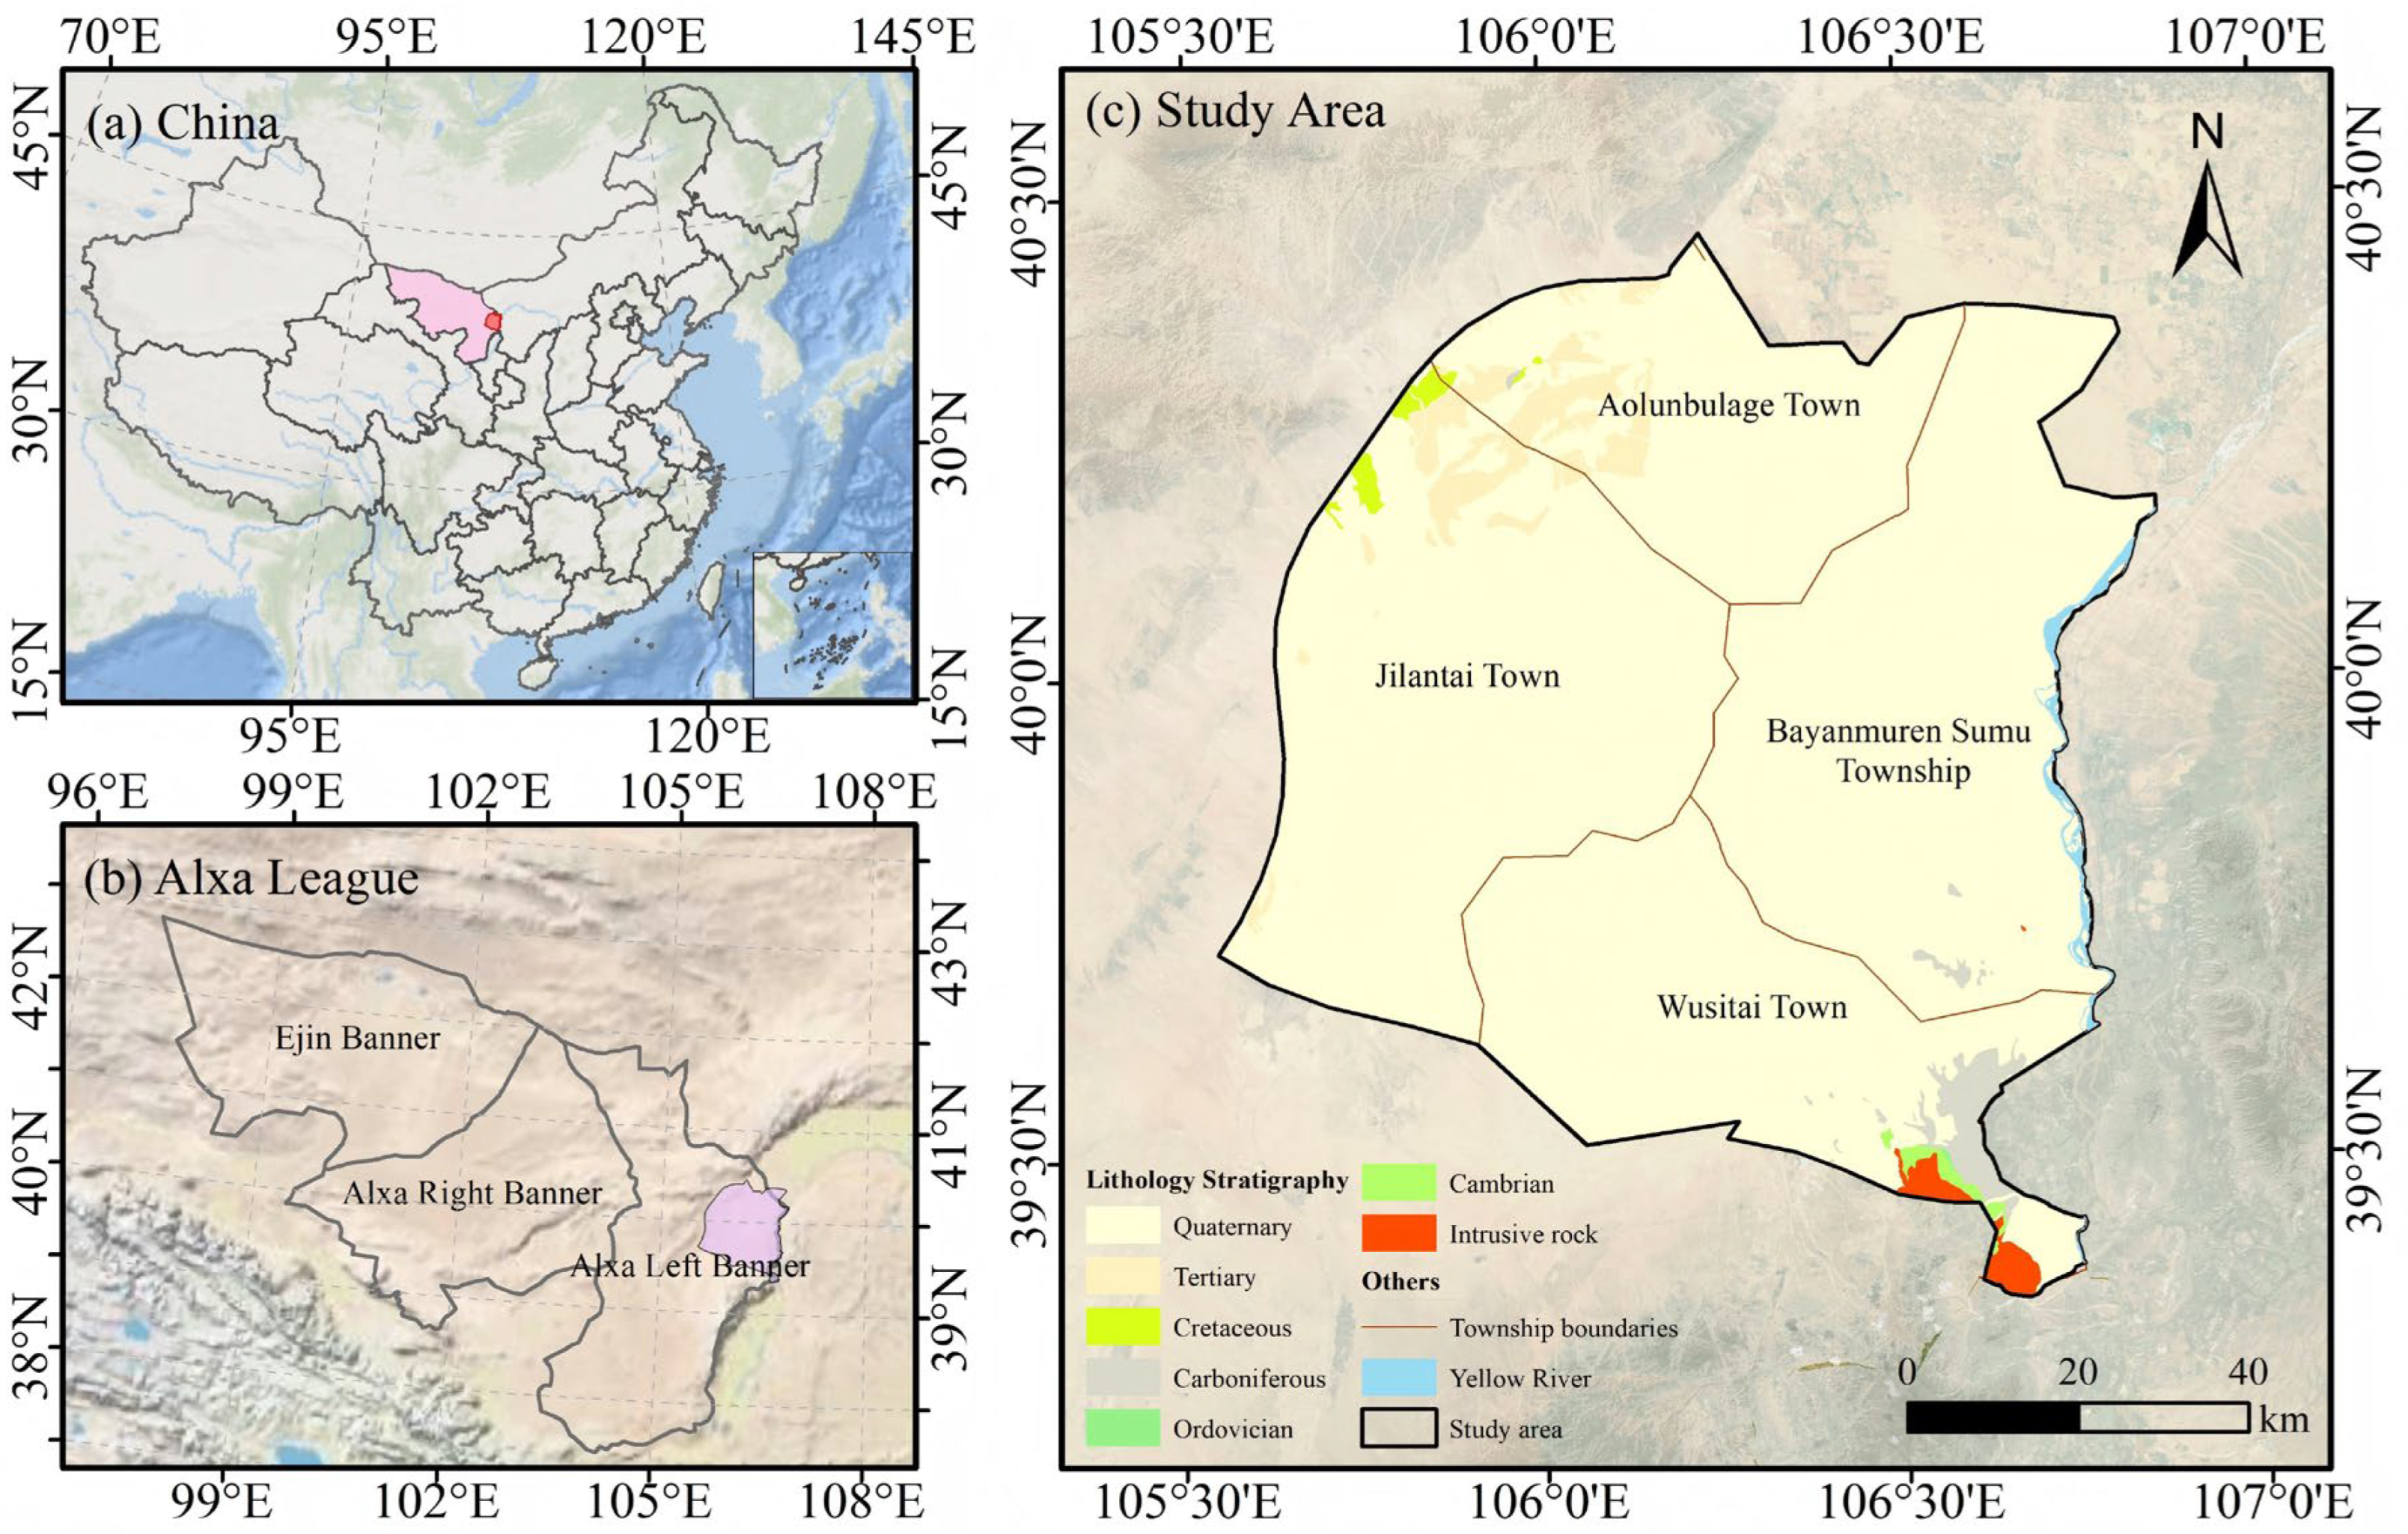
Figure 1. Overview of the study area. (a) Location of the prefecture-level city containing the study area. (b) Location of the study area. (c) Geological map of the study area.
Water 17 03058 g001
Figure 2. Annual precipitation statistics of Jilantai Meteorological Station from 1995 to 2024.
Water 17 03058 g002
Figure 3. Location of the sampling points in the study area.
Water 17 03058 g003
Figure 4. Piper diagram of shallow groundwater in the study area.
Water 17 03058 g004
Figure 5. Gibbs diagram in the study area. (a) TDS versus Na+/(Na+ + Ca2+). (b) TDS versus Cl/(Cl + HCO3).
Water 17 03058 g005
Figure 6. Diagram of the ion ratio relationship of major components in groundwater. (a) Cl versus Na+. (b) Ca2+ versus Mg2+. (c) HCO3 + SO42− versus Ca2+ + Mg2+. (d) Na+ − Cl versus (HCO3 + SO42−) − (Ca2+ + Mg2+).
Water 17 03058 g006
Figure 7. The relationship between δD and δ18O in groundwater and soil water.
Water 17 03058 g007
Figure 8. The relationship of soil water spatial scale δD-δ18O. (The box plots above and to the right represent statistical distributions of soil water δ18O and δD at varying depths.)
Water 17 03058 g008
Figure 9. Isotopic characteristics of vegetation water and soil water.
Water 17 03058 g009
Figure 10. Proportion of soil water utilized by vegetation at different depths.
Water 17 03058 g010
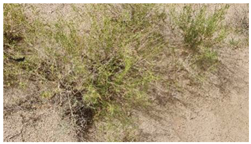
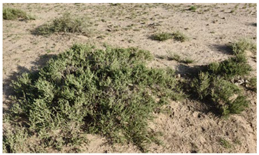
Table 1. Morphological characteristics and photographs of the six focal plant species investigated in this study.
Species NameKey CharacteristicsRepresentative Photo
Artemisia ordosicaShallow-rooted, extensive horizontal roots; dominant in fixed/semi-fixed dunes.Water 17 03058 i001
Calligonum mongolicumDeep-rooted; has a photosynthetic stem; highly drought-tolerant.Water 17 03058 i002
Nitraria tangutorumDeep-rooted; forms sand mounds; succulent berries.Water 17 03058 i003
Reaumuria soongoricaShallow-rooted; linear fleshy leaves; salt-secreting.Water 17 03058 i004
Kalidium foliatumSucculent leaves; highly salt-tolerant; often in saline areas.Water 17 03058 i005
Ammopiptanthus mongolicusDeep-rooted; thick leathery leaves; relict species.Water 17 03058 i006
Table 2. Hydrochemical characteristics of shallow groundwater in the study area.
pHTDSK+Na+Ca2+Mg2+HCO3ClSO42−NO3
g/Lmg/L
Mean7.922.036.66590.3468.2569.31287.24715.34400.0417.49
Mid7.881.06.5.77229.0046.4036.60229.00198.00223.002.84
Min7.270.341.8854.609.3911.6096.9046.6046.700.00
Max8.609.5624.002722.00341.00360.00841.004942.001517.00204.00
Std0.292.244.47678.0174.6687.64176.921168.53385.2540.60
CV0.041.100.671.151.091.260.621.630.962.32
Table 3. Characteristics of hydrogen and oxygen isotopes in water, vegetation, soil and groundwater.
ProfileNo.SamplesδD (‰)δ18O (‰)
PM01PM01-1Artemisia ordosica−38 3.2
Soil (0–20 cm)−62 −7.2
Soil (20–40 cm)−42 −6.7
Soil (40–60 cm)−49 −4.5
Soil (60–80 cm)−36 0.0
PM01-3Artemisia ordosica−41 2.8
Soil (0–20 cm)−66 −8.3
Soil (20–40 cm)−45 −6.7
Soil (40–60 cm)−45 −4.5
Soil (60–80 cm)−58 −6.0
PM01-4Artemisia ordosica−30 5.5
Soil (0–20 cm)−72 −9.3
Soil (20–40 cm)−50 −7.1
Soil (40–60 cm)−31 −3.9
Soil (60–80 cm)−49 −6.8
PM01-5Calligonum mongolicum−44 −4.2
Soil (0–20 cm)−68 −8.4
Soil (20–40 cm)−55 −6.6
Soil (40–60 cm)−57 −3.9
Soil (60–80 cm)−56 −3.4
PM01-6Nitraria tangutorum−43 −1.8
Soil (0–20 cm)−45 −6.3
Soil (20–40 cm)−38 −2.6
Soil (40–60 cm)−43 −2.5
PM01-9Artemisia ordosica−36 3.2
Soil (0–20 cm)−53 −6.2
Soil (20–40 cm)−54 −3.1
Soil (40–60 cm)−50 −3.1
Soil (60–80 cm)−29 0.9
ZQ10Groundwater−65 −7.0
ZQ11Groundwater−44 −2.6
ZQ22Groundwater−64 −7.2
PM02PM02-1Nitraria tangutorum−50 −4.2
Reaumuria soongorica−55 −4.5
Soil (0–20 cm)−54 −7.2
Soil (20–40 cm)−35 −1.3
Soil (40–60 cm)−42 −0.1
Soil (60–80 cm)−50 −2.5
PM02-4Nitraria tangutorum−72 −5.1
Kalidium foliatum−63 −5.3
Soil (0–20 cm)−53 −6.2
Soil (20–40 cm)−41 2.9
Soil (40–60 cm)−49 0.4
Soil (60–80 cm)−55 −1.7
PM02-6Ammopiptanthus mongolicus−61 0.6
Nitraria tangutorum−52 −3.1
Soil (0–20 cm)−45 −5.2
Soil (20–40 cm)−50 −0.9
Soil (40–60 cm)−63 −4.6
Soil (60–80 cm)−71 −6.6
Disclaimer/Publisher’s Note: The statements, opinions and data contained in all publications are solely those of the individual author(s) and contributor(s) and not of MDPI and/or the editor(s). MDPI and/or the editor(s) disclaim responsibility for any injury to people or property resulting from any ideas, methods, instructions or products referred to in the content.