Abstract
In the eastern part of India, specifically in the coastal districts of Odisha, the Puri central canalsystem’s Phulnakhara distributary command, which is split between the districts of Cuttack and Khurda, is where the study was taken up during 2020 and 2021. The flow modelling of the Phulnakhara distributary command, covering a 49.03 km2 area, was done by Visual MODFLOW (VMOD). The command area’s conceptual model was created by assigning various input data, and the developed model was calibrated with 1-year data (2020) and validated with 1-year data (2021) on a fortnightly basis for simulating the groundwater flow using VMOD. Both steady state and transient state circumstances were used to calibrate the hydraulic conductivity and storage coefficient for the various layers in 2020. The calibrated hydraulic conductivity values vary from 1.16 × 10⁻³ ms−1 to 4.86 × 10⁻⁴ ms−1, and the calibrated values (2.00 × 10⁻² m−1 to 4.00 × 10⁻⁶ m−1) of specific storage varied from the first to third layer in both state scenarios. The validated model could forecast the groundwater condition and the flow head for the following ten years, assuming a 0.5% annual drop in recharge by increasing the pumping rate five, six, and seven times throughout the validation period (2021). The modelling study suggested that the command area will not remain safe for 10 years from the point of future groundwater development. The model performance showed strong agreement between simulated and observed groundwater heads, with R2 values ranging from 0.68 to 0.91 and NSE values between 0.64 and 0.88. Predictive simulations indicated groundwater drawdowns of 4.82 m, 5.72 m, and 6.11 m under 5×, 6×, and 7× pumping scenarios, respectively, over the next decade, highlighting a significant risk of depletion unless conjunctive use strategies are adopted.
1. Introduction
Conjunctive water use in canal command areas involves the use of surface water and groundwater for crop production [1,2]. The integration of surface water and groundwater is governed by climate, geology, surface topology, and the ecological quantity and quality [3,4]. Groundwater is one of the most precious and dependable natural water resources in the world’s climate zones [5]. It is a renewable, but finite resource. Because of the uneven rainfall distribution, some months receive high rainfall, whereas there are water shortages in the remaining months, which can be overcome by conjunctive water use [6]. Groundwater resources irrigate 39 Mha out of India’s 140.13 Mha net sown area [7], whereas surface water resources irrigate 22 Mha area [8], while 53% of the remaining area is rainfed [9].
Groundwater depletion and irregular surface water distribution in Odisha’s Phulnakhara Canal command area pose significant challenges to sustainable water management [10]. Variability in canal water availability, especially during the Rabi season, exacerbates irrigation deficiencies. It is worth mentioning that the groundwater table is very shallow at the study site, which is located in the Mahanadi Delta. Furthermore, the groundwater development in Cuttack and Khurda districts is only 33.51% and 29.7%, respectively [11]. Thus, there is ample scope for harnessing groundwater for irrigation purposes in addition to surface water. Furthermore, frequent floods and droughts have occurred because of climate change. This has resulted in a reduction in crop productivity in both irrigated and rainfed agro-ecosystems.
The conjunctive use of canal water (surface water) and groundwater can mitigate the impact of climate change [12]. In the study canal command, because runoff-the-river irrigation systems are the most common type throughout the kharif season, more water is delivered through the canal system than is necessary. Conversely, during the rabi season, the canals do not operate at their maximum capacity, which leaves the command regions unable to meet their entire irrigation demand, leading to poor productivity and cropping intensity [13]. Therefore, it is necessary to use both canal water (surface water) and groundwater.
Developing conceptual models is crucial for simplifying the complexity of subsurface groundwater systems [14]. An accurate and well-structured conceptual model forms the foundation for any numerical groundwater flow simulation because it significantly reduces modelling errors [15]. Numerical modelling techniques are instrumental in understanding the dynamics of groundwater systems, including changes in inflow patterns, recharge, discharge, and aquifer storage capacity [16]. These models also support predictive analysis by simulating future groundwater scenarios [17]. Among the widely used tools, MODFLOW is a robust numerical model for solving groundwater flow problems [18]. Numerous studies worldwide have employed MODFLOW to investigate groundwater behavior and hydrodynamics in diverse hydrogeological settings [19,20,21,22,23].
One groundwater model, VMOD, is a three-dimensional modular groundwater flow model with finite differences that can be used for multi-aquifer modelling and large-area modeling [3]. It can simulate transient and steady-state groundwater flows under intricate hydraulic conditions, including numerous man-made or natural hydrological processes [24]. The following are the general and specific objectives: to optimize the conjunctive use of surface water and groundwater resources for sustainable irrigation management in the Phulnakhara canal command area.
- To develop and calibrate a hydrological model for simulating groundwater flow in the study area.
- To predict the impact of increased groundwater pumping on the water table over the next decade.
- To explore the impact of climate change-induced reductions in recharge on groundwater sustainability.
- To provide recommendations for water management strategies based on the model.
Based on past and present groundwater table fluctuation and pumping data, this study calibrated and validated the model at the VMOD interface. After Subsequently, it was used to forecast the flow head for the following ten years, assuming an annual 0.5% drop in recharge, and also to predict the groundwater condition by enhancing 5 times, six, and seven times pumping rate for the validation period in a canal command based on runoff from the river (Phulnakhara distributary of Puri main canal) in eastern Odisha. This study offers a novel approach by integrating surface water and groundwater management through a simulation model (VMOD) tailored to the specific needs of the Phulnakhara Canal command area. It comprehensively analyzed future water table fluctuations under various scenarios, offering critical insights for future water management and policy formulation in the region. Additionally, the use of calibrated and validated groundwater models in forecasting long-term sustainability under changing climatic conditions contributes to the originality of this approach.
2. Materials
2.1. Research Study Area
The investigation was conducted in the Puri main canal system’s Phulnakhara distributary command, which is split between the districts of Cuttack and Khurda in Odisha, having 20°19′15.6″ N to 20°14′56.4″ N latitude and 85°52′51.6″ E to 86°0′0″ E longitude (Figure 1a). The model schematization in X-Y-Z coordinates, along with different layers, is provided in Figure 1b. The geology and geomorphology landform maps of the study area are shown in Figure 1c,d. About 98% of the canal command is dominated by the quaternary type as compared to the cenozoic type (Figure 1c). The canal command is dominated by the older coastal flood plains, as compared to older fluvial flood plains (Figure 1d). The elevation of the canal command is in the range of 13 m to 28 m above the mean sea level (MSL), depicting marginal topographic variation over the study area (Figure 2). The Phulnakhara distributary originates from the Kakatpur branch canal of the Puri main canal system and spans 21.410 km. There are 33 sub-minors and seven minors in the distributary command. The cultivable command area and the geographical area of the five blocks (which fall under the research area) were provided by the offices of the Deputy Director of Agriculture (DDA), Cuttack, and Khurda. Its design discharge is 6.03 cumec, and its cultivable command area is 4903.29 ha.
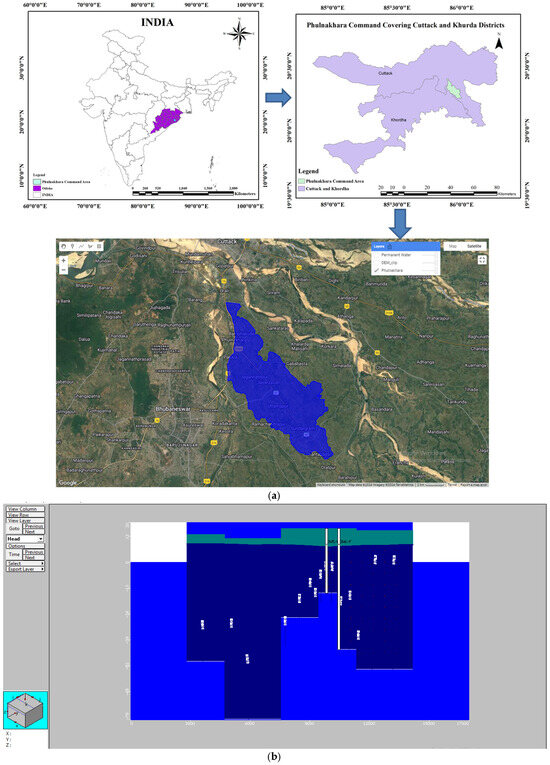
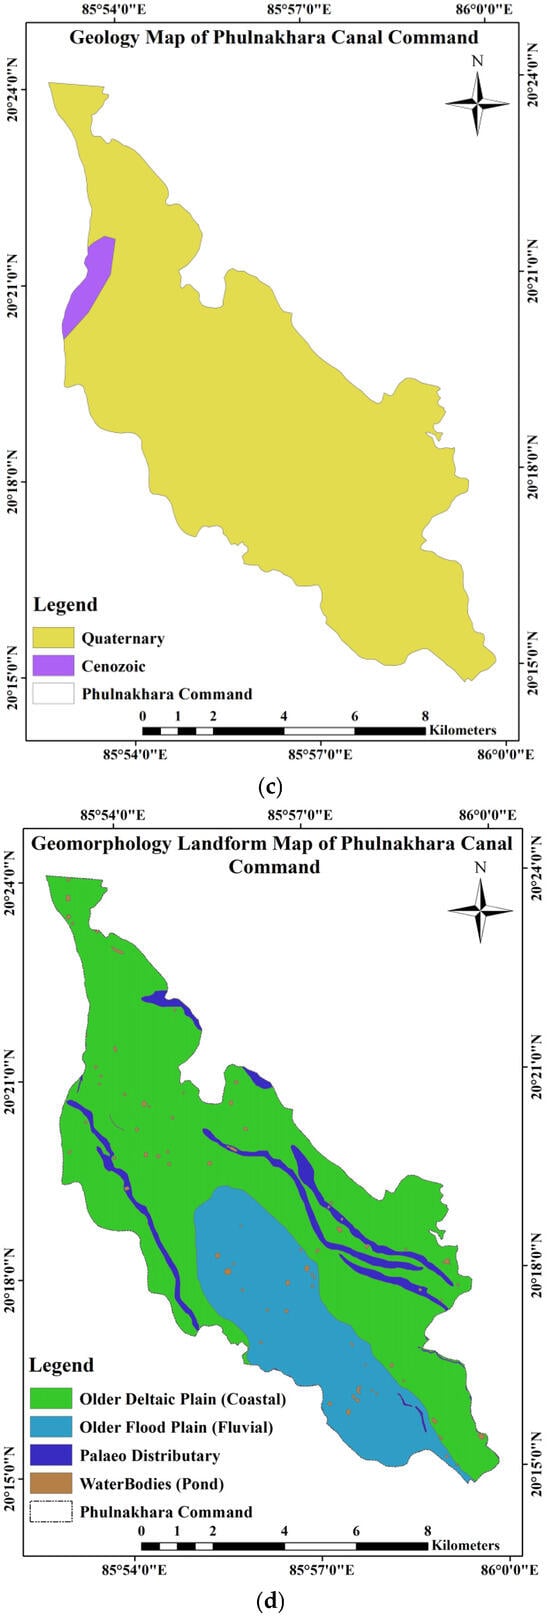
Figure 1.
(a) Location map of the study area in the Google Earth Engine (GEE) interface. (b) Model schematization in three layers of the Phulnakhara canal command. (c) Geology map of the Phulnakhara canal command. (d) Geomorphology landform map of the Phulnakhara canal command.
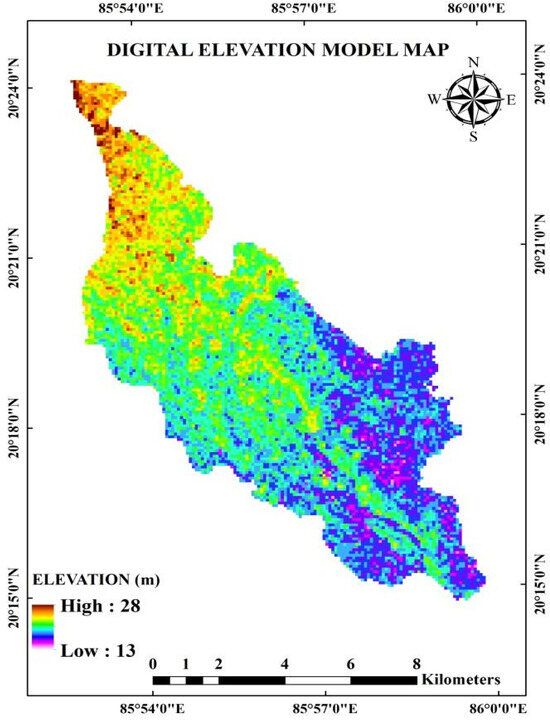
Figure 2.
Digital elevation map of the study area.
2.2. Irrigation Characteristics of the Command Area
The command area is located in three blocks, viz., Baranga, Cuttack Sadar, and Kantapada of Cuttack district, and in two blocks, viz., Balianta and Bhubaneswar of Khurda district, with a gentle slope. A slope map is shown in Figure 3. 66.45% of the area has a 1% slope, 30.15% has a 2% slope, and the remaining 3.40% has a 2–5% slope. Agricultural land (kharif, rabi, zaid, and double/triple cropland) occupied most of the total ayacut area (68%), followed by the plantation area (13%), built-up area (10%), and the current fallow area (7%) (Figure 4). The middle and tail reach of the distributary command region were primarily composed of clay loam soil. The head reaches soils heavier than the middle and tail reaches. The study region has roughly 1530 mm of yearly rainfall on average. Soil bulk density varied between 1.42 and 1.64 g/cm3. During the kharif season, more irrigation water is delivered to the Phulnakhara distributary command area than is necessary. The canal flow during the rabi season was far less than the full supply level, making it impossible to meet the irrigation needs of the crops. According to [13], a sizeable portion of the command remained fallow because the canal water throughout the Rabi and summer was insufficient to meet the crop water demand. So, there is the possibility of using the groundwater resource in conjunction with canal water to overcome the aforementioned command’s irrigation water shortage.
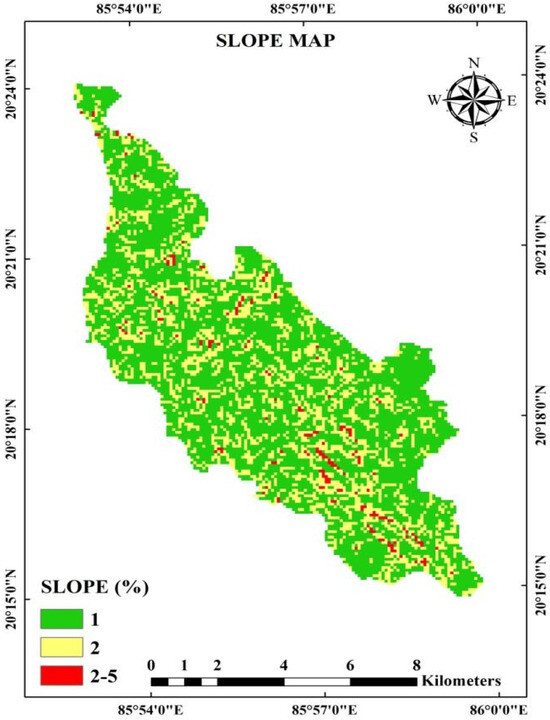
Figure 3.
Slope map of the study area.
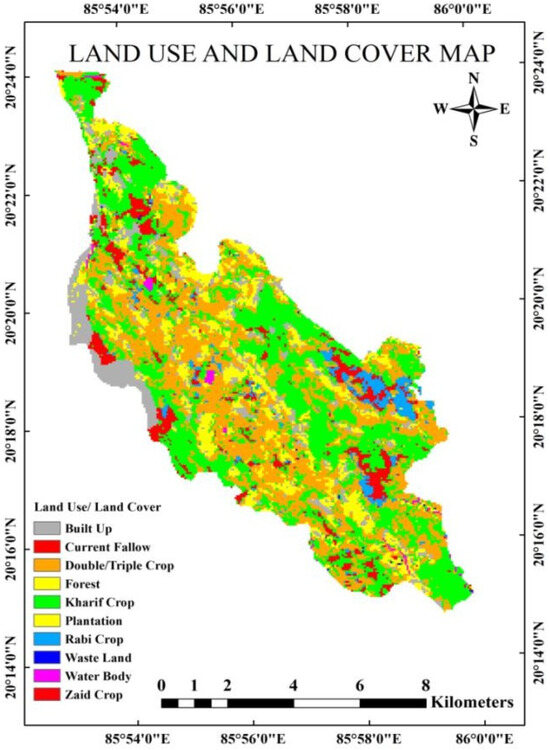
Figure 4.
Land use and land cover map of the study area.
2.3. Land Use/Land Cover
The land use and land cover maps of the command area were obtained from the National Remote Sensing Center, Hyderabad. Out of the total ayacut area in the Phulnakhara distributary canal command, kharif crops and double/triple crops covered 33.88% and 31.45% of the area, respectively. The Plantation cover (12.74%), built-up area (9.63%), current fallow (6.77%), rabi crops (3.4%), forest land (0.96%), water bodies (0.60%), and zaid crops (0.42%) were the other categories of land use and land cover of the canal command (Table 1 and Figure 4) [25].

Table 1.
Land use types and their coverage in the study area.
2.4. Soil Texture
The canal command soil map (1:250,000 scale) was derived from the harmonized world soil database (HWSD) created by the Food and Agriculture Organization (FAO) of the United Nations, Rome, Italy, and verified with the soil database of NBSS and LUP, Nagpur, India. The global soil map was clipped with the study area boundary to obtain the required soil map for the research area. Two types of soils are predominant in the catchment; among them, clay soil (OR151) has the maximum spread area, followed by loamy soil (OR152). The soil types and their extents are presented in Table 2 and Figure 5 [25].

Table 2.
Soil types and their extent in the studied command.
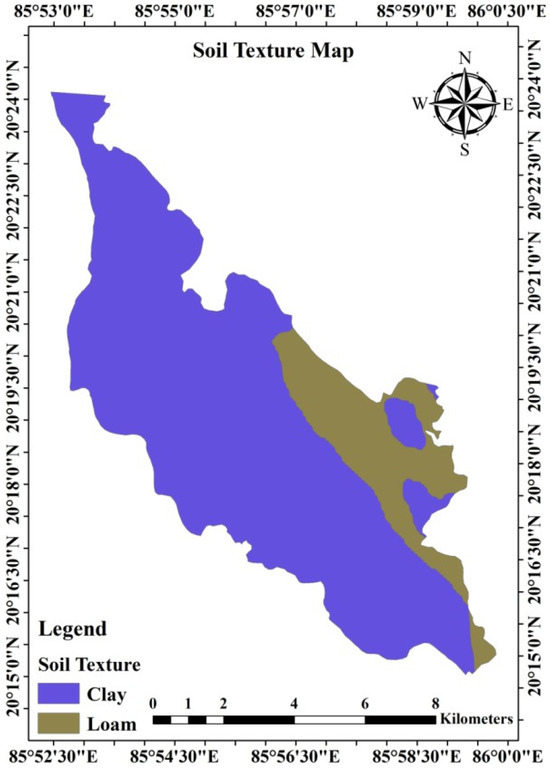
Figure 5.
Soil texture map of the study area.
2.5. Data Sets
Meteorological data, such as daily rainfall, were collected from the Agromet observatory of the Odisha University of Agriculture and Technology (OUAT), Bhubaneswar. Hydrogeological data of the study area, viz., aquifer properties (storage coefficient, hydraulic conductivity, specific yield, transmissibility, effective porosity, total porosity, initial head, recharge), well log information, or layer elevation map, that is, the average thickness of the top layer, middle layer, and bottom layer, were collected from the Central Groundwater Board (CGWB) and Groundwater Survey and Investigation (GWSI), Govt. of Odisha, Bhubaneswar, for setting up a subsurface hydrologic model. Daily discharge of pumping wells (m3/day) and pumping schedules were collected from the field in the canal command for simulation modelling. The recharge boundary conditions were estimated using the monthly rainfall of the Canal command. Constant head and evapotranspiration values are essential for providing boundary conditions in the subsurface hydrologic model, calibration, and validation. All necessary permissions for field investigations, data collection, and access to groundwater monitoring sites were duly obtained from the relevant authorities, including the Groundwater Survey and Investigation, Odisha Lift Irrigation Corporation, and the Indian Council of Agricultural Research (ICAR)-Indian Institute of Water Management. Fieldwork was carried out in accordance with institutional and governmental guidelines.
3. Methods
3.1. Development of Conceptual Model
The model used in this study, Visual MODFLOW (VMOD), is a three-dimensional groundwater flow model [26,27]. It solves the groundwater flow equation under both steady-state (Equation (1)) and transient-state conditions (Equation (2)) for the command area:
3.1.1. Steady-State Flow Equation (For VMOD)
The VMOD software 3.1 utilizes numerical representations of groundwater flow equations to simulate subsurface water movement under both steady-state and transient-state conditions. These equations are based on the finite difference method applied to Darcy’s law (Equation (1)) and the principle of conservation of mass [28,29].
where,
Kx, Ky, Kz = hydraulic conductivities along the x, y, z directions (LT−1)
h = hydraulic head (L)
x, y, z = Spatial coordinates
3.1.2. Transient-State Flow Equation (For VMOD)
Equation (2) models the dynamic changes in groundwater levels over time, accounting for both recharge and extraction (e.g., pumping). It is vital to analyze seasonal variations, future projections, and the impacts of groundwater development [28,29].
where,
S = Specific storage (m−1)
= Rate of change of hydraulic head with time
Q = Pumping rate (m3/day or similar units)
3.1.3. Assigning of Different Model Parameters
Model parameters such as evapotranspiration, groundwater level distribution, sources and sinks, pumping and head in observation wells, aquifer features (hydraulic conductivity and specific storage), and the spatial and temporal distribution of recharge were assigned to the numerical model [30].
3.1.4. Assigning of Wells
It was chosen graphically from the software’s well drop-down menu to add pumping wells with pumping rates and head observation wells with water table elevation or depth. Data from nine major pumping wells from the Odisha Lift Irrigation Corporation (OLIC) and farmers’ fields were assigned in the study area, and data from six groundwater monitoring wells from the Groundwater Survey and Investigation (GWSI) agency and farmers’ fields were assigned for this study.
3.1.5. Assigning of Hydrogeological Properties
The hydrogeological data of the study area, that is, aquifer properties (storage coefficient, hydraulic conductivity, specific yield, transmissibility, effective porosity, total porosity, initial head, and recharge), are the VMOD model inputs [31]. Zone-wise values of aquifer features, such as hydraulic conductivity (K), specific yield (Sy), and specific storage (S), were assigned for each layer. The average transmissibility (T) and thickness of each layer were considered when calculating the average hydraulic conductivity (K) [31]. The values of the hydraulic properties initially assigned to the different zones of the modelled area are listed in Table 3.

Table 3.
Hydraulic properties of the layers.
3.1.6. Assigning of Initial Head
An initial value for the head distribution during the steady-state simulation and a starting head distribution for the transient simulation were assigned to VMOD [32]. Additionally, the drawdown was determined from the initial head and provided using information on the water level gathered from the observation wells [33]. The initial groundwater level distribution during the steady and transient-state simulations is essential for the model setup. This was based on observed groundwater levels and hydraulic head values. The change in the groundwater level was calculated using Equation (3).
where:
Residual = hobserved − hsimulated
hobserved = Observed groundwater head
hsimulated = simulated groundwater head from the model
This equation was used to calibrate the model and assess the accuracy of the simulations in comparison with the actual observed values.
3.1.7. Assigning of Boundary Conditions
Boundary conditions for the model domain, such as general head, constant head, rivers, drains, recharge, and evapotranspiration, are required for the VMOD model, and here general head, constant head, and evapotranspiration were assigned [34,35]. The river serves as a physical divide between the two. In this study, the eastern and western sides of the study area were 1 to 2 km away from the Serua and Kuakhai rivers, respectively, so the river boundary condition was not incorporated here.
3.1.8. Assigning of Recharge and Evapotranspiration
Two years’ worth of data on rainfall from 2020 to 2021 was collected to calculate the recharge from rainfall, and the recharge was considered 20% of the average annual rainfall [36]. To emulate the effect of transpiration in plants through the ascent of capillaries from the saturated zone, this model requires evapotranspiration (ET). Because the ET rate for the simulation year 2020–2021 was not available, the ET rate was taken to be as much as 10% of the precipitation for the entire research area, and the values were also employed as model inputs [37,38,39]. Similar studies were conducted in the coastal area of Odisha by Rejani et al. [37]. The recharge condition is given by Equation (4).
where:
P = Precipitation (mm)
r = Recharge fraction (percentage)
3.1.9. Performance of VMOD
The aforementioned inputs were used to run the model for both steady and transient situations using a Water Hydrogeological Software (WHS) solver 3.1 [40]. A time step of one month (30 days) was selected based on the availability of groundwater level data, during which all hydrological stresses were assumed to remain constant. A steady-state run was conducted using the data from 2020. The transient run was completed over a one-year stress period using data from 2020. The simulated and observed values were compared. The groundwater model was calibrated using data from multiple observation wells. The accuracy of the model was assessed using the Root Mean Square Error (RMSE), a statistical measure used to minimize the difference between the observed and simulated groundwater levels. The performance of the VMOD was calculated using Equation (5).
where:
n = Number of observation points.
hobserved,i = observed value at the ith observation point.
hsimulated,i = simulated value at ith observation point.
3.1.10. Calibration of the Model
During calibration, the model adjusts key parameters such as hydraulic conductivity and specific storage to ensure that the simulated values match the observed groundwater levels [41]. The calibration of the model involves the minimization of residuals using Equation (6).
where:
Δh = Percentage deviation in the hydraulic head
hnew = hydraulic head after parameter modification
hbase = base hydraulic head (before modification)
Accurate calibration of a subsurface flow model is essential for its successful implementation. In the previous few years, observation well data and aquifer parameters have been used to calibrate the model for the given morphological conditions of the canal command. A groundwater flow simulation model was developed that was initially adjusted for steady-state circumstances before adjusting for the transient condition [42]. The initial condition of the transient calibration was a steady-state calibration solution. Weekly groundwater level measurements were used for transient calibration from 19 chosen sites from 1 February 2004 to 4 June 2006, according to conventional protocols [43,44,45].
The simulated and observed values of the groundwater table were compared using various graphical, mathematical, and statistical methods, such as regression (linear), calibration residual, residual mean, absolute residual mean, standard error of estimate, root mean square, normalized root mean square, correlation coefficient, and confidence interval [46]. Six statistical indicators, viz., the correlation coefficient (r), mean absolute error (MAE), Nash-Sutcliffe efficiency (NSE), normalized RMSE (NRMSE), root mean squared error (RMSE), and standard error of estimate (SEE), were utilized to assess how well the numerical model was calibrated and validated [42].
Here, the fortnightly water level data collected from six wells in the fields throughout 2020 were used for calibration. In this study, 24 stress periods of 15 days each were defined for calibration. Parameters such as hydraulic conductivity and specific storage were adjusted during calibration, and the hydraulic head was simulated and compared with the observed values. The RMSE was the key criterion for calibration, and this calibration operation was carried out until a further reduction in the RMSE value occurred.
3.1.11. Validation of the Model
Once calibrated, the model was validated by using a different dataset. The predictive ability of the model was tested by comparing simulated values with observed groundwater levels using statistical evaluation methods such as the Nash-Sutcliffe efficiency (NSE) and the Coefficient of Determination (R2). These values help assess the performance and reliability of the model for future predictions. Equation (7) was used to validate the model.
Residual = hobserved − hsimulated
This residual was calculated for each observation point and used to evaluate the accuracy of the model in predicting the groundwater head.
Validation is a vital part of the model testing after calibration. To determine the performance of the model, the calibrated model was thoroughly validated without modifying the input file; that is, the calibrated parameters remained the same, and the simulation period was changed. Data from the years after the calibration were used for model validation. The measured groundwater levels and adjusted values for several parameters for 2021 were used to validate the model. The accuracy and capacity of the model to forecast within the allowable error bounds were confirmed, which were not dependent on the calibrated data.
3.1.12. Model Prediction
The verified model was utilized to predict the water level trend over the next ten years, from 2022 to 2031, to assess groundwater table decline. This was done assuming the study area’s recharge would decrease by 0.5% annually. Owing to climate change, an increasing number of extreme events occur. The rainfall intensity during heavy downpours was high. As intense rainfall will occur in future years, more overland flow is expected to occur, thereby reducing groundwater recharge. Furthermore, to meet the irrigation water demand of the suggested optimal cropping pattern, the pumping rate must be increased several times over the existing pumping rate. Therefore, forecasting was performed by assuming an enhanced pumping rate of five, six, and seven times the pumping rate of the validated period (2021) for future years to assess the vulnerability to future groundwater drafts.
4. Results and Discussions
The VMOD generated outputs regarding head contours, head differences, drawdown, elevation, net recharge, and water table. The graphs of calculated versus measured heads, adjusted residual histogram, head versus time, NRMSE versus time, and drawdown versus time were obtained as outputs from the model. The direction of the flow with the velocity vectors was also generated as the model output.
4.1. Grid Discretization of the Canal Command
The model domain was defined and discretized using the VMOD grid module. The discretization of the study command area involved splitting it into 34 rows and 36 columns with 0.25 × 0.25 km grid spacing, that is, each row and column represents a certain distance (km), which equals the reasonable scale of 0.25 km length on the field concerning the dimensions of a single grid. Thus, the command area was discretized into 1224 grids, and the cells outside the boundary of the study area were marked as having no flow cells. The model overlooked these dormant grid cells that were not included in the flow estimates. There was a minimum and maximum elevation in the layers. Similarly, the pumping well locations, observation well locations, and fortnightly groundwater levels from the ASCII database were included in the model (Figure 6a,b).
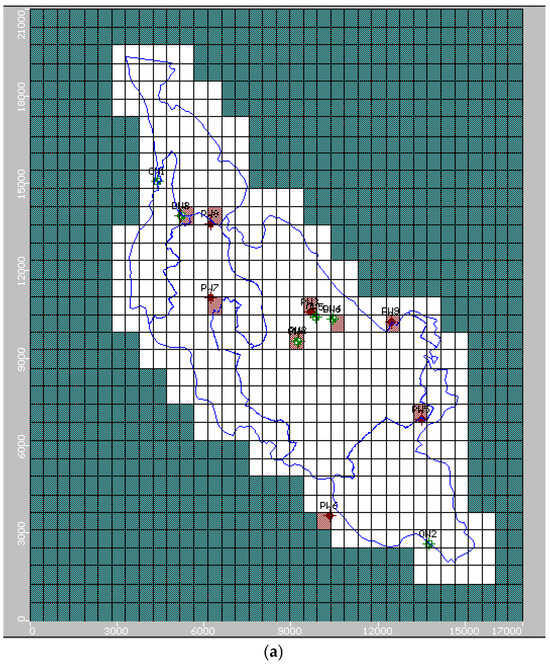
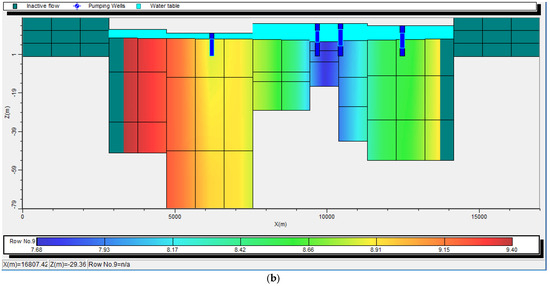
Figure 6.
(a). Location of observation and pumping well nodes of the Phulnakhara canal command. (b). Layer-wise location of pumping wells in the Phulnakhara canal command.
4.2. Steady State Calibration
Initially, the model was calibrated under steady-state conditions. The initial conditions for the steady-state model calibration were the aquifer conditions for 2020. The initial step in calibrating the steady-state model was to reduce the discrepancies between the calculated and actual field water levels for each observation well. The aquifers’ hydraulic conductivity levels were periodically changed to maintain RMSE below 0.25 m. Figure 7 shows the scatter plot produced by the model for the computed vs. observed head for six chosen observation wells. The chart shows that the calculated and measured water levels in most of the wells showed remarkably high agreement.
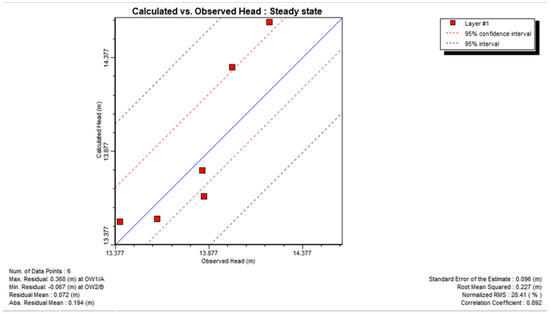
Figure 7.
Model computed vs. observed hydraulic head in 2020 for steady-state.
4.3. Transient State Calibration
A hydrogeological profile characterized the aquifer of the canal command, and the profile revealed definite layer separations and ranges in texture from fine to coarse sand, followed by clay with sand (sandy clay), black clay, or hard clay with gravel in most of the canal command areas. The underlying aquifer in the study area is mainly alluvial with a very low Gondwana formation. They formed unconfined layers and confined aquifers. Recent alluvial deposits are distributed in most of the blocks in the study area. The alluvium mainly consists of river-drifted sediments such as sand, gravel, silt, and clay [11]. Therefore, the canal command aquifer system for simulation purposes was considered isotropic, multilayered, and exploited by bore wells for irrigation.
The aquifers were mainly recharged by rainfall, and the canal command was 1 to 2 km away from the Kuakhai and Serua rivers on the western and eastern sides, respectively; therefore, the river boundary condition was not provided here. The correlation coefficient was computed to examine the correlation between variations in rainfall and hydraulic head for the six observation well points (OW1–OW6), as shown in Table 4. Based on this correlation, the prediction of future water-level trends was evaluated.

Table 4.
Correlation coefficient between rainfall and water table.
The transient model calibration started with the hydraulic conductivity, boundary conditions, and water levels determined from the steady-state model calibration. The aforementioned values were applied along with the specific storage and yield distributions. The year 2020 (360 days) was used for transient calibration. The storage coefficient values were adjusted multiple times until the computed and observed water levels matched fairly. Table 5 displays the hydraulic characteristics of the layer in both the steady-state and transient states following calibration. Figure 8a,b shows the calculated and observed groundwater level hydrographs for the chosen observation wells. The measured readings and simulated water table hydrographs were then compared. The predicted water table contour map of the research area showed that the height of the water table in the coastline region was extremely low, ranging from 0 to 15 m. Similar observations have been reported by [38,47].

Table 5.
Hydraulic properties of the layers after calibration.
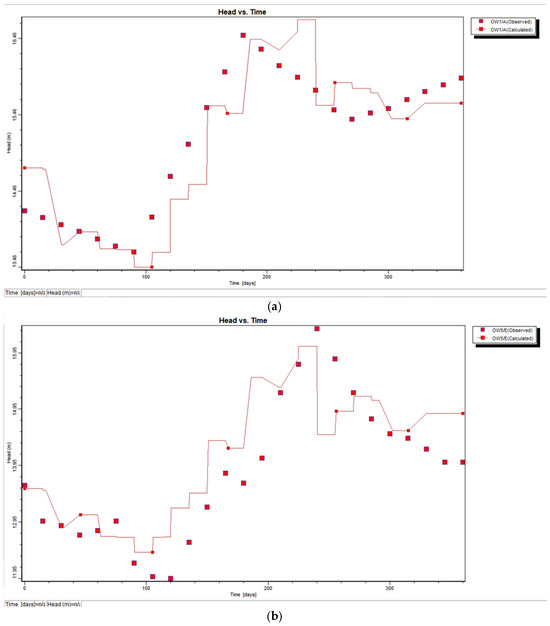
Figure 8.
(a) Model-simulated and observed hydraulic head hydrographs in 2020 for selected observation wells (OW-1) after calibration. (b) Model-simulated and observed hydraulic head hydrographs in 2020 for selected observation wells (OW-5) after calibration.
The initial and calibrated values of hydraulic conductivity were different. However, other aquifer properties, being insensitive in nature, did not change before and after calibration.

Table 6.
Observed and calculated hydraulic head values for selected observation wells.
The statistical parameters of the six observation wells during calibration are listed in Table 7.

Table 7.
Statistical parameters obtained during calibration.
4.4. Model Validation
The model was validated using the properties of the calibrated aquifer parameters. The water level data and scatter plot for the simulated vs. observed heads for the six chosen observation wells are shown in Figure 9a–c. The figures mentioned above clearly show that practically all the wells during validation had RMSEs that were within an acceptable range and were fairly low. Figure 10a,b displays the hydrographs of the simulated and observed water levels for the chosen observation wells following validation. They were in good agreement with the observed heads.
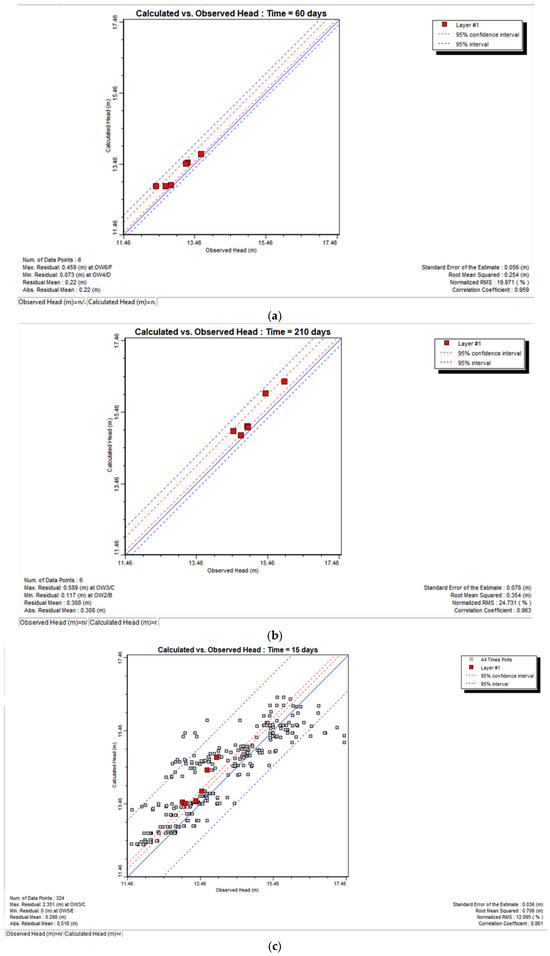
Figure 9.
(a) Model-simulated and observed hydraulic head in 2021 after validation for a time duration of 60 days. (b) Model simulated and observed hydraulic head in 2021 after validation for a time duration of 210 days. (c) Model simulated and observed hydraulic head in 2021 after validation for all time points.
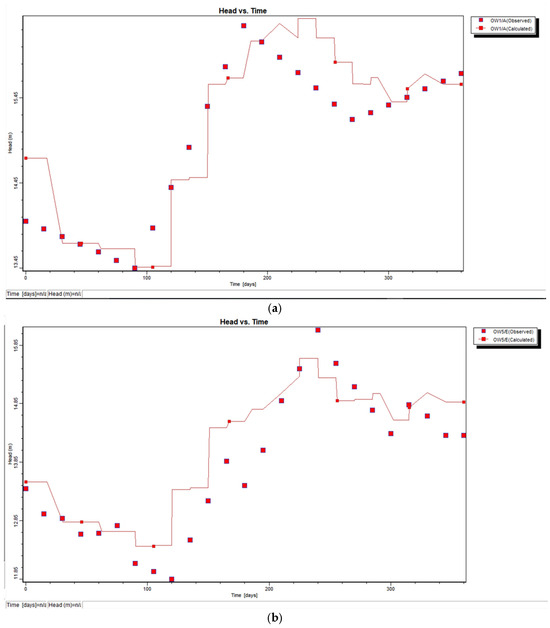
Figure 10.
(a) Model simulated and observed groundwater level elevation or hydraulic head hydrographs for selected observation wells (OW-1) after validation in 2021. (b) Model simulated and observed groundwater level elevation or hydraulic head hydrographs for selected observation wells (OW-5) after validation in 2021.
The graph between the observed and simulated heads during the validation period (2021) for observation wells 1 and 5 is plotted and shown in Figure 11 and Figure 12, respectively. Similarly, the scatter plots for the computed vs. observed heads for selected observation wells (OW-1 and OW-5) are shown in Figure 13 and Figure 14, respectively.
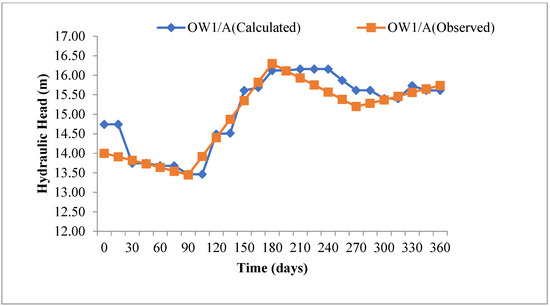
Figure 11.
Comparison between observed and simulated heads of OW-1 (transient state condition).
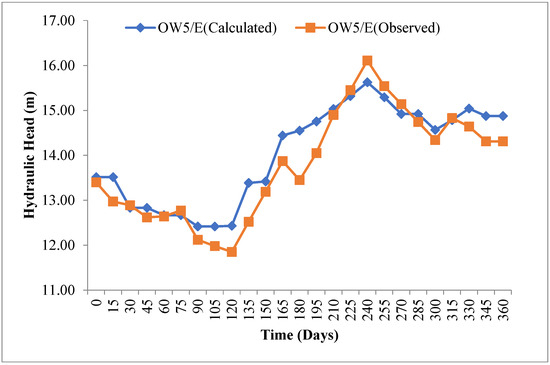
Figure 12.
Comparison between observed and simulated heads of OW-5 (transient state condition).
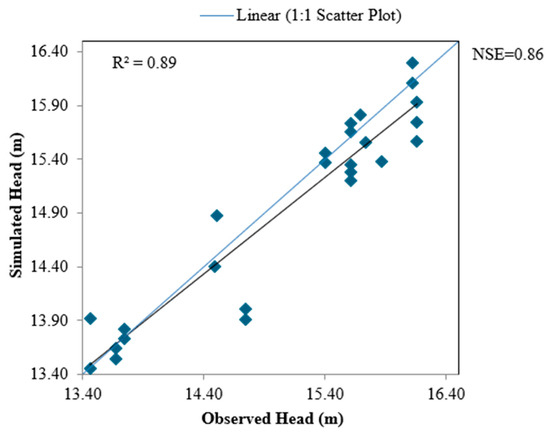
Figure 13.
Scatter plot between observed and simulated heads of OW-1 (transient state condition).
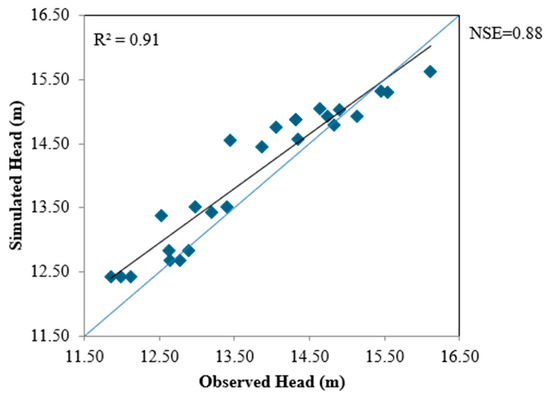
Figure 14.
Scatter plot between observed and simulated heads of OW-5 (transient state condition).
As shown in Figure 13, the coefficients of determination (R2), Nash-Sutcliffe efficiency (NSE), and percentage bias (PBIAS) were 0.89, 0.86, and −0.91, respectively.
As shown in Figure 14, the coefficients of determination (R2), Nash-Sutcliffe efficiency (NSE), and percentage bias (PBIAS) were 0.91, 0.88, and −1.83, respectively. The statistical parameters of the six observation wells are listed in Table 8.

Table 8.
Statistical parameters obtained during validation.
4.5. Model Evaluation Criteria
In the calibration process of groundwater modelling, various evaluation criteria, such as the correlation coefficient (r), coefficient of determination (R2), mean absolute error (MAE), root mean squared error (RMSE), Nash-Sutcliffe efficiency (NSE), and percentage bias (PBIAS), are typically employed. The mean absolute error is a more accurate calibration indicator than the mean error because it assesses the average magnitudes of the residuals. Hydrological model performance is also frequently evaluated using the Nash-Sutcliffe efficiency, which is another widely used evaluation index. The best fit between the simulated and observed groundwater levels produced MAE = 0, RMSE = 0, r = 1, and NSE = 1 under perfect circumstances. As shown in Figure 13, the coefficients of determination (R2), Nash-Sutcliffe efficiency (NSE), and percentage bias (PBIAS) were 0.89, 0.86, and −0.91, respectively. As shown in Figure 14, the coefficients of determination (R2), Nash-Sutcliffe efficiency (NSE), and percentage bias (PBIAS) were 0.91, 0.88, and −1.83, respectively. It was found from the study that, by increasing the number of cells, or by making the grid spacing finer, i.e., from 1 × 1 km to 0.25 × 0.25 km, the output result (the head) has been changed significantly, particularly the NSE values.
4.6. Sensitivity Analysis
The sensitivity analysis addresses the uncertainty in the modelling results. A sensitivity analysis was simultaneously conducted while the model was calibrated [48,49]. A sensitivity analysis, which was performed using different aquifer properties, is presented below. The parameters considered for the sensitivity analysis were the hydraulic conductivity, recharge, and storage properties (specific storage). In Case 1, recharge from rainfall was not considered; hence, it was considered a no-recharge condition. Case 2 is where the upper aquifer’s hydraulic conductivity is reduced by 50%. Case 3 is where the upper aquifer’s hydraulic conductivity is enhanced by 50%. Case 4, the hydraulic conductivity is decreased by 50% in the middle aquifer. Case 5 is where the specific storage is reduced by 50% in the top, middle, and bottom aquifers.
The observed and computed head values and the steady-state deviations (%) of the hydraulic head values (Dv) in the six observation wells for the different cases are presented in Table 9.

Table 9.
Percentage deviation of hydraulic head values for different cases.
From Table 9, it was observed that in most cases (OW1, OW2, OW3, and OW6), the model over-predicted the hydraulic heads, and in the remaining two cases (OW4 and OW5), the model under-predicted the hydraulic heads, barring Cases 3 and 4. A low Dv value (−3.69%) indicated that the model was accurately validated for prediction. It was concluded that there was no significant difference in the means at the 95% confidence level because the t-calculated was less than the t-critical (2.57), barring case-4, where the t-calculated was 3.24. The coefficient of determination (R2) value of 0.64 suggested that the relationship between the simulated and measured heads was not very close. A close association between the simulated and measured heads was revealed by the high coefficient of determination (R2) of 0.81. The sensitivity analysis results are given in Table 10 to conclude that hydraulic conductivity was found to be a more sensitive parameter among the different parameters for the studied command. Recharge and specific storage (storage properties) were less sensitive parameters.

Table 10.
Results of sensitivity analysis of calibrated VMOD model.
4.7. Water Level Fluctuation
Of the six observation wells, 100% had water levels less than 5 m below ground level (m BGL). The average head differences for the years 2020 and 2021 for different observation wells are given in Table 11 and Table 12, respectively, and in Figure 15 and Figure 16, respectively.

Table 11.
Observation of well water level fluctuation in the year 2020.

Table 12.
Observation of the well water level fluctuation in the year 2021.
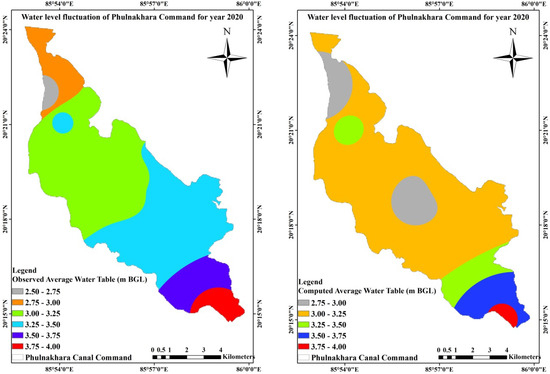
Figure 15.
Comparison between observed and computed water table depth for 2020.
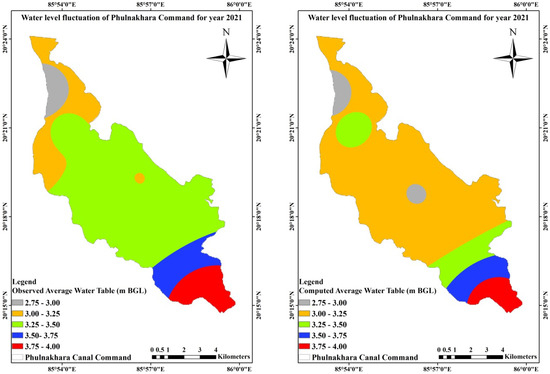
Figure 16.
Comparison between observed and computed water table depth for 2021.
The average difference between the observed and computed groundwater level fluctuations during the rabi (pre-monsoon) and kharif (post-monsoon) seasons is shown in Table 13. The average difference values ranged from 0.07 to 0.36 m BGL during the 2020 rabi (pre-monsoon) season, whereas the values ranged from 0.00 to 0.33 m BGL during the 2020 kharif (post-monsoon) season. Similarly, the average difference values ranged from 0.12 to 0.43 m BGL in the 2021 rabi (pre-monsoon) season, whereas the values ranged from 0.00 to 0.36 m BGL during the 2021 kharif (post-monsoon) season.

Table 13.
Average difference between observed and calculated groundwater level fluctuation (m BGL) during the pre- and post-monsoon seasons.
A comparison between the average observed and computed groundwater table and areal extent for the calibration and validation periods is given in Table 14.

Table 14.
Comparison between the average observed and computed groundwater table with the areal extent for the calibration and validation period.
It can be seen from Table 15 that most of the area in the command area is coming under safe areas, as the depth to the water table is above 3 m, and a very small area comes under potentially waterlogged areas during 2020 and 2021.

Table 15.
Groundwater table fluctuation (m BGL) for future years during the rabi season for optimal cropping pattern.
4.8. Model Predictive Simulation for Groundwater Management in the Study Canal Command
The validated model was used for various future management and planning scenarios. The optimized parameters during the validation were used to predict the system response for upcoming occurrences in a predictive simulation. A predictive simulation was performed for three different pumping levels to study the response of aquifers to variations in groundwater level. The verified model was used to forecast the head of flow trend for the future 10-year period (2022 to 2031) on the assumption that climate change will cause the recharge rate of the study area to decrease by 0.5% in each year. It is expected that due to climate change, there will be more extreme events and intense rainfall, causing more overland flow, that is, the hydrological cycle, along with global warming, is expected to intensify, which would probably increase the intensity of extreme precipitation events and flooding risk [50]. This, in turn, leads to a reduction in the recharge rate. Earlier, from the optimization routine, we required an average of 18.23 Mm3 of groundwater to fulfill the rabi season irrigation water demand and available surface water [51]. Therefore, a simulation was performed to observe the groundwater table status by enhancing the pumping rate of the validation period (2021) five, six, and seven times (henceforth considered as scenarios 2 and 3, respectively).
The predictive simulation was run for 244 stress periods, using the data for 24 stress periods for calibration and 24 stress periods for validation. Fluctuation of the groundwater table in the observation wells for the next 10 years, from 2022 to 2031, was predicted using an adequately calibrated and validated VMOD. Predicted groundwater table contour maps considering the average values of the years 2022–2031 of the Phulnakhara Canal command are shown in Figure 17, Figure 18, and Figure 19, respectively, for different scenarios, that is, 1, 2, and 3.
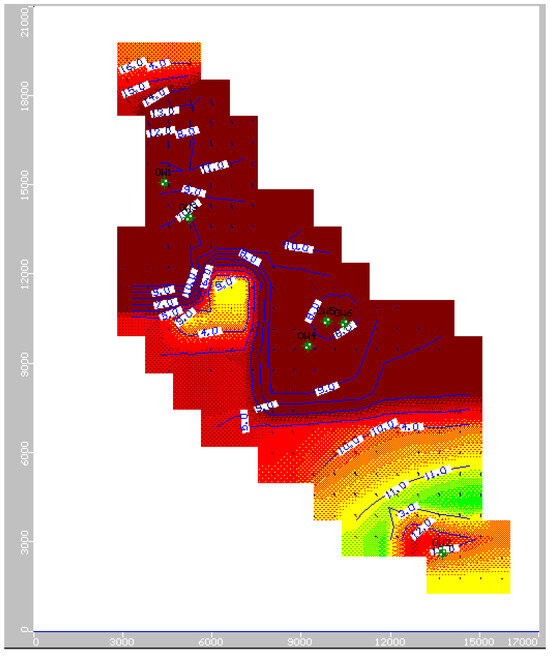
Figure 17.
Average water table elevation (m) map of Phulnakhara command area from 2022 to 2031 with 5 times pumping.
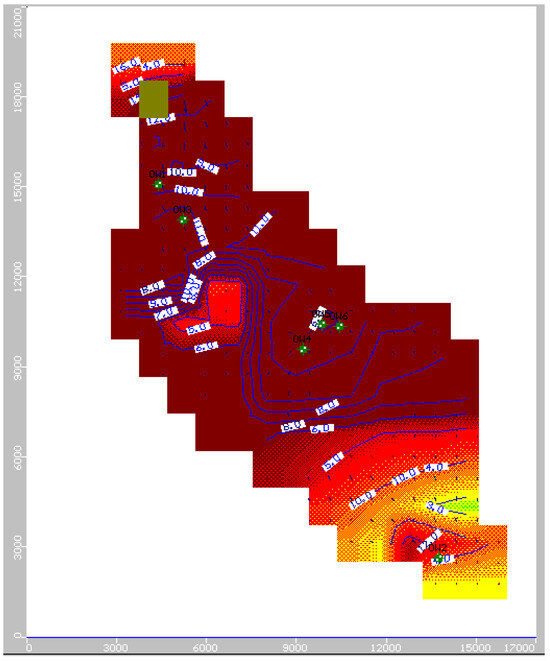
Figure 18.
Average water table elevation (m) map of Phulnakhara command area from 2022 to 2031 with 6 times of pumping.
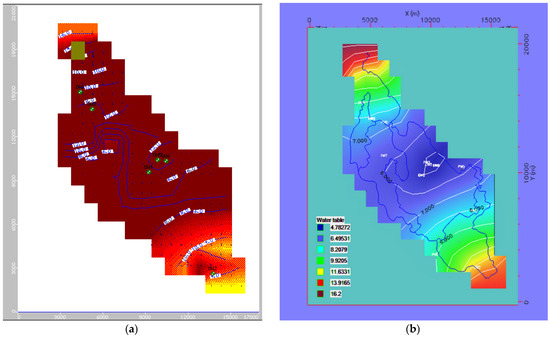
Figure 19.
(a) Average water table elevation (m) map of Phulnakhara command area from 2022 to 2031 with 7 times of pumping. (b) Average water table elevation (m) map of Phulnakhara command area from 2022–2031 with 7 times pumping.
From Figure 17, Figure 18 and Figure 19, it is presumed that there could be a fluctuation in the water table (from 3.80 to 10.43 m BGL) during scenario 1. During scenario 2, the fluctuation will be more (from 4.00 to 12.41 m BGL). During scenario 3, the reduction in the water table will vary from 4.09 to 13.44 m BGL. The water table elevation ranged from 10.09 to 14.08 m, 12.71 to 13.79 m, 9.05 to 13.70 m, 7.16 to 13.24 m, 6.57 to 13.20 m, and 6.67 to 13.16 m in scenario-1 for Cuttack Sadar, Kantapada, Nakhara, Kuranga pradhan, Raepur, and Rahura areas of the study command, respectively. Similarly, the water table elevation ranged from 8.89 to 13.52 m, 12.41 to 13.70 m, 7.62 to 13.05 m, 5.34 to 12.53 m, 4.59 to 12.48 m, and 4.71 to 12.61 m in scenario-2, indicating that a major part of the study area was under a slightly less range of water table elevation than scenario-1 for the respective areas. Likewise, the water table elevation ranged from 8.39 to 13.25 m, 12.29 to 13.61 m, 7.03 to 12.76 m, 4.50 to 12.18 m, 3.56 to 12.18 m, and 3.69 to 12.15 m in scenario-3 for the respective areas. It was predicted from the model that, during scenario-1, the inflow (recharge) of 26.82 Mm3 was obtained against the outflow (pumping) of 28.16 Mm3. Similarly, during scenario 2, an inflow (recharge) of 33.25 Mm3 was obtained against an outflow (pumping) of 34.59 Mm3. Finally, during scenario-3, an inflow (recharge) of 35.68 Mm3 was obtained against an outflow (pumping) of 36.96 Mm3. Therefore, in all three scenarios, the withdrawal is greater than the recharge volume, indicating that there will be a gradual lowering of the groundwater table as we move from scenarios 1 to 3. Thus, the sustainability of the groundwater level will be a future issue [52]. The groundwater table fluctuation in different observation wells for all three scenarios is given in Table 15 and Figure 20, Figure 21 and Figure 22.
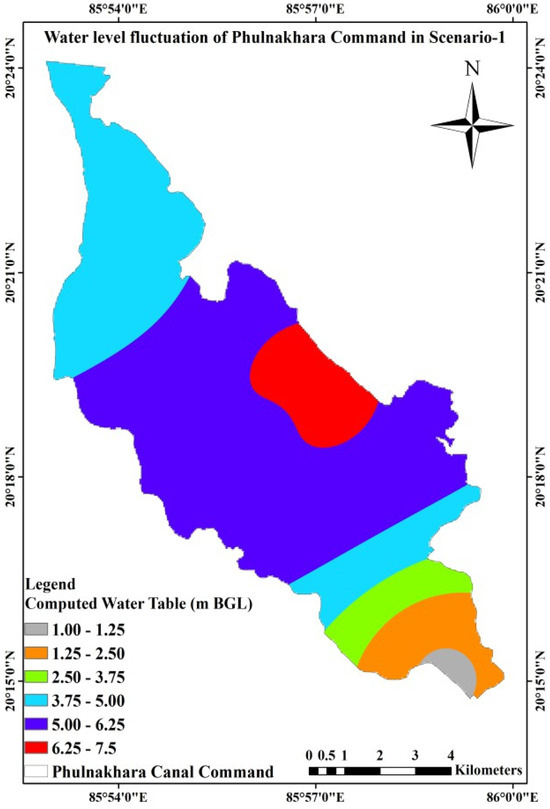
Figure 20.
Groundwater table fluctuation in scenario-1 for the Phulnakhara command.
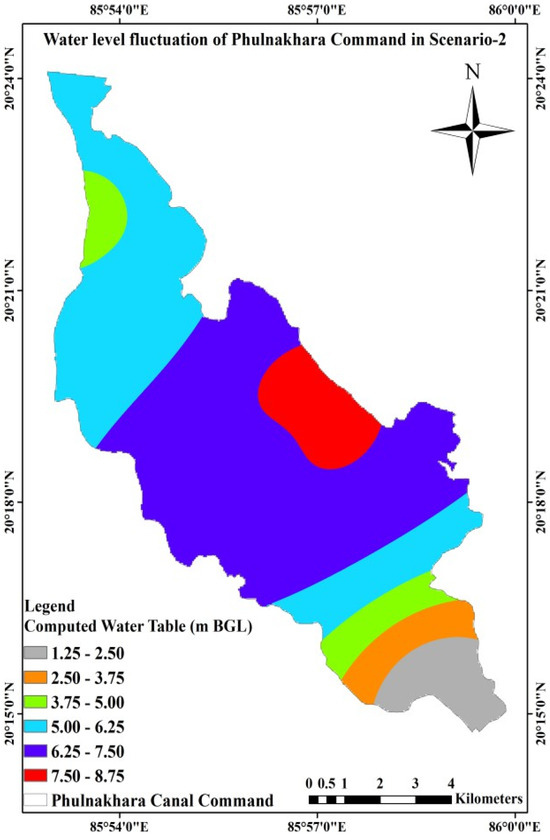
Figure 21.
Groundwater table fluctuation in scenario 2 for the Phulnakhara command.
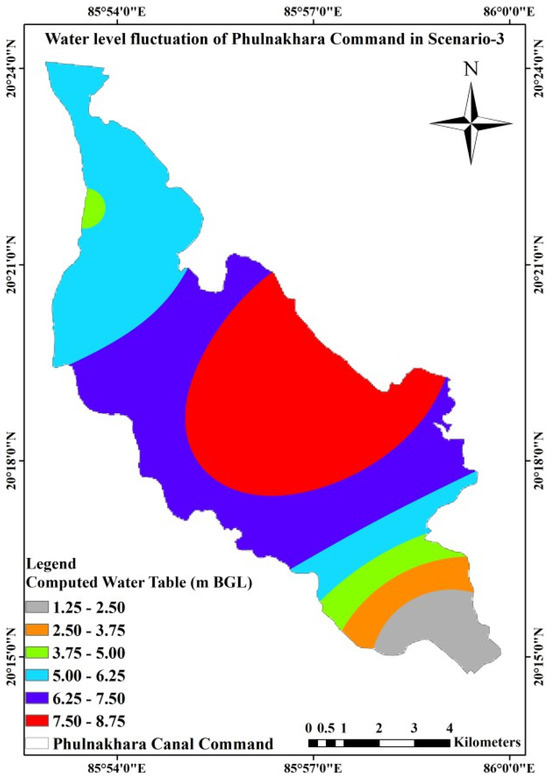
Figure 22.
Groundwater table fluctuation in scenario-3 for Phulnakhara command.
It is found from Table 15 that, in the case of scenario-1, the highest water table fluctuation will be 6.62 m BGL for OW5, whereas the lowest water table fluctuation will be 1.08 m BGL for OW2. Similarly, scenario 2’s highest water table fluctuation will be 7.90 m BGL for OW6, whereas the lowest water table fluctuation will be 1.29 m BGL for OW2. Likewise, in scenario 3, the highest water table fluctuation will be 8.62 m BGL for OW5, whereas the lowest will be 1.32 m BGL for OW2. Therefore, the highest fluctuation is noted in Scenario 3 in comparison to Scenarios 1 and 2. The weighted average value indicated a higher fluctuation in Scenario 3 than in the other two scenarios [52]. A comparison between the average computed groundwater table fluctuation and the actual extent for the three different scenarios is given in Table 16.

Table 16.
Average groundwater table fluctuation with the areal extent in different scenarios.
As per Table 16, the maximum command area of about 46% (2527 ha) has the average computed water table fluctuation ranging from 5.00 to 6.25 m BGL for scenario 1. Similarly, for scenario 2, the maximum area of the command area of about 46% (2245 ha) has the average computed water table fluctuation ranging from 6.25 to 7.50 m BGL, and the minimum area of the command area of about 4% (209 ha) has the average computed water table fluctuation ranging from 2.50 to 3.75 m BGL. Then, for scenario 3, the maximum area of the command area of approximately 31% (1529 ha) has an average computed water table fluctuation ranging from 6.25 to 7.50 m BGL, and the minimum area of the command area of approximately 4% (192 ha) has an average computed water table fluctuation ranging from 2.50 to 3.75 m BGL. Table 17 presents the irrigation water demand for optimal cropping patterns during the Rabi season.

Table 17.
Future groundwater requirement during Rabi due to the optimal cropping pattern.
It is found from Table 17 that, in the case of scenario-1, 15.27 Mm3 (83.77%) of groundwater is required to be pumped during the rabi season, and the simulated recharge (due to rainfall and constant head) is found to be 5.85 Mm3. In scenario 2, 18.74 Mm3 (102.81%) of groundwater was required to be pumped during the rabi season, and the simulated recharge (due to rainfall and constant head) was found to be 7.18 Mm3. Similarly, in the case of scenario 3, 20.07 Mm3 (110.09%) of groundwater is required to be pumped during the rabi season of a normal year, out of the total irrigation water requirement (IWR) obtained from the optimization model, and the simulated recharge (due to rainfall and constant head) is found to be 8.54 Mm3 [52]. Both the duration and intensity of pumping play a vital role. Groundwater potential and susceptible zones were predicted using VMOD on the assumption that the pumping rate increased by five, six, and seven times with decreasing recharge and other aquifer properties. From Figure 17, it can be seen that there are no deficits or dry zones in the research area due to a five-fold increase in the pumping of groundwater draft by 5 times. However, there are dry zones in the research area due to an increase in the pumping of the groundwater draft by six and seven times, respectively (Figure 18 and Figure 19). The water table elevation would decrease from 14.08 to 6.57 m with a 5 times increase of pumping for 10 years, the elevation would decrease from 13.70 to 4.59 m with 6 times increase of pumping for 10 years, and the elevation would decrease from 13.61 to 3.56 m with 7 times increase of pumping for 10 years, which suggests that the aquifer formation’s thickness of this Phulnakhara command area is more. Hence, there is ample scope for future groundwater development.
5. Discussions
The Visual MODFLOW groundwater model was calibrated and validated with high accuracy under steady-state and transient conditions across the Phulnakhara Canal command. The model demonstrated a good fit between the observed and simulated groundwater head. During calibration (2020), the root-mean-square error values remained within acceptable limits (≤0.5 m), indicating the reliability of the assigned hydraulic parameters. Transient calibration showed strong agreement between the measured and simulated groundwater levels across all six observation wells, confirming that the model effectively captured the temporal dynamics of groundwater fluctuation [53,54]. Statistical indicators during validation (2021), such as the Coefficient of Determination (R2 ranging from 0.68 to 0.91), Nash–Sutcliffe Efficiency (NSE ranging from 0.64 to 0.88), and low PBIAS values, further validated the robustness of the model. These metrics indicate a strong correlation between the observed and simulated values, reaffirming the model’s predictive capacity for future scenarios [55].
The calibrated model revealed that the groundwater table in the study region varied primarily between 2.5 and 4.5 m below the ground level. The hydraulic conductivity and storage coefficients across different layers ranged from 1.16 × 10⁻³ ms−1 to 2.35 × 10⁻⁴ ms−1 and from 0.000003 to 0.020000 m−1, respectively. These values are consistent with the alluvial nature of the aquifer system of the Mahanadi Delta [56,57]. Groundwater flow direction is predominantly influenced by topographic gradients and aquifer permeability [58]. The model accurately simulated seasonal variations in groundwater levels, with deeper levels observed in the rabi (pre-monsoon) season owing to higher pumping and shallower levels in the kharif (post-monsoon) season owing to rainfall recharge [59].
Sensitivity analysis indicated that hydraulic conductivity was the most influential parameter affecting the simulation results [60]. When the hydraulic conductivity of the upper and middle aquifers was altered by ±50%, a noticeable deviation in hydraulic head was observed. In contrast, changes in the recharge and specific storage parameters had a relatively minimal impact on the model output. This highlights the critical importance of accurately estimating conductivity values for reliable groundwater simulations in deltaic regions [61].
Predictive simulations were performed for 2022–2031 under three different groundwater abstraction scenarios: pumping rates increased by 5, 6, and 7 times the current rate. Each scenario assumed an annual recharge reduction of 0.5%, simulating climate change effects such as intense rainfall and increased overland flow. Scenario 1 (5× pumping): The groundwater table was predicted to fluctuate between 3.80 and 10.43 m BGL, with a weighted average drawdown of 4.82 m. Scenario 2 (6× pumping): Fluctuation ranged from 4.00 to 12.41 m BGL, with an increased weighted drawdown of 5.72 m. Scenario 3 (7× pumping): The most extreme scenario, with predicted drawdowns ranging from 4.09 to 13.44 m BGL and a weighted average of 6.11 m. These results show a trend of deepening groundwater levels with increased pumping, particularly under declining recharge conditions [62]. The simulated groundwater draft for scenario 3 during the rabi season was 20.07 Mm3, exceeding the estimated recharge of 8.54 Mm3, suggesting an unsustainable extraction regime.
The simulation outcomes demonstrate that under current practices and future demand projections, the Phulnakhara Canal command is at risk of groundwater depletion within the next decade. Notably, the command area will face a significant water deficit with increasing abstraction and decreasing recharge, unless effective management practices are implemented. Spatial analysis also revealed the formation of dry zones under higher pumping scenarios, particularly in the tail-end regions of the canal command, indicating unequal stress distribution across the aquifer.
Despite the comprehensive nature of this research and the reliability of the Visual MODFLOW simulations, several limitations were encountered, which may affect the interpretation and generalization of the results. The number of groundwater monitoring wells used may not be sufficient to capture the spatial variability of the groundwater levels across the entire command area. This could lead to local inaccuracies in the model predictions. Groundwater abstraction data are primarily based on estimates from field observations, which may introduce uncertainty due to unrecorded or variable pumping schedules.
Building upon the insights and limitations of this research, several directions for future studies are recommended to enhance the accuracy, applicability, and policy relevance of groundwater management in the Phulnakhara Canal command and similar agroecological regions. Future research should utilize long-term historical and real-time hydroclimatic data, including multiyear rainfall records, evapotranspiration trends, and river discharge fluctuations. This would improve the temporal resolution of the model and enable a more robust simulation of droughts, floods, and inter-annual recharge variability. Expanding the observation and pumping well network across the command area would allow for better spatial calibration and validation of the groundwater levels. Advanced monitoring systems, such as piezometers integrated with telemetry, can provide near real-time data for dynamic model updating. Socioeconomic drivers, such as population growth, changes in cropping patterns, irrigation practices, and water pricing policies, should be incorporated into groundwater demand forecasting models. Agent-based or system dynamics models can complement hydrological modelling to capture human-environment interactions more effectively.
Study Limitations
- Identification of appropriate sites for groundwater recharge to enhance conjunctive use is not included in the current study.
- Based on the climate change impact, the future irrigation water requirement, which is dependent on optimized crop coverage, the future water table fluctuation can be predicted from the VMOD.
- Long-term prediction for future years’ water table fluctuation and water balance study is not attempted here.
6. Conclusions
This study employed the Visual MODFLOW (VMOD) platform to develop a calibrated and validated groundwater flow model for the Phulnakhara Canal command area in coastal Odisha. The simulation accurately represented the groundwater dynamics and provided valuable insights into recharge, pumping influence, and future sustainability under various extraction scenarios. The results from predictive modelling indicate that a continued increase in groundwater abstraction, especially in conjunction with a declining recharge rate due to climate change, will lead to a significant decline in water table levels. Under the most severe scenario (7× pumping rate), the system becomes increasingly vulnerable, with drawdowns reaching unsustainable depths across several observational wells. Sensitivity analysis also identified hydraulic conductivity as the most critical parameter influencing the model outcomes, reinforcing the importance of accurate aquifer characterization. Based on these findings, the following recommendations are proposed to promote sustainable groundwater management in the region. Encourage the combined use of surface water and groundwater to balance demand and reduce pressure on aquifers, especially during the dry (rabi) season. Micro-irrigation techniques, such as drip and sprinkler systems, are used to improve water-use efficiency and reduce groundwater extraction. Promote low-duty, water-efficient crops in the rabi season to minimize irrigation water demand. Develop managed aquifer recharge systems, such as check dams, recharge wells, and infiltration trenches, to augment groundwater storage during the monsoon. Additional observation wells should be installed with telemetry systems to enable real-time tracking of groundwater levels and trends. Overall, the VMOD model demonstrated strong performance, with RMSE values ≤ 0.25 m during calibration and validation, and high correlation between observed and simulated heads (R2 up to 0.91). Predictive analysis revealed that groundwater abstraction already exceeds recharge under intensified pumping, with future drawdowns projected at 4.82 m (5× pumping), 5.72 m (6× pumping), and 6.11 m (7× pumping). These findings confirm that the Phulnakhara command area will not remain groundwater safe for the next decade without implementing integrated water management measures.
Author Contributions
All authors contributed to the work. Writing—original manuscript draft, data preparation and analysis, visualization, A.D.; supervision and review, M.P.T.; conceptualization and editing, A.M., M.J. and S.K.J.; final review and editing, B.V., S.C. and J.K.N. All authors have read and agreed to the published version of the manuscript.
Funding
This research received no external funding.
Data Availability Statement
The original contributions presented in this study are included in the article. Further inquiries can be directed to the corresponding author.
Acknowledgments
The authors are very grateful to the Indian Council of Agricultural Research (ICAR)-Indian Institute of Water Management, Bhubaneswar, and SVCAET and RS, FAE, IndiraGandhi Krishi Viswavidyalaya, Raipur, for providing logistical assistance during this research. The authors also acknowledge GWSI, CGWB, and OLIC for their valuable assistance in field investigations, providing information, field data, and helpful discussions.
Conflicts of Interest
The authors declare no conflict of interest.
References
- An-Vo, D.; Mushtaq, S.; Nguyen-Ky, T.; Bundschuh, J.; Tran-Cong, T.; Maraseni, T.; Reardon-Smith, K. Nonlinear optimisation using production functions to estimate economic benefit of conjunctive water use for multi crop production. Water Resour. Manag. 2015, 29, 2153–2170. [Google Scholar] [CrossRef]
- Mishra, C.; Tiwari, Y.; Nema, A.; Singh, G.; Nema, R.; Kumar, R. Impact of conjunctive use of water resources on crop production in canal command area—Acase study. Indian J. Dryland Agric. Res. Dev. 2015, 30, 37–43. [Google Scholar] [CrossRef]
- Ahmadi, A.; Olyaei, M.; Heydari, Z.; Emami, M.; Zeynolabedin, A.; Ghomlaghi, A.; Daccache, A.; Fogg, G.; Sadegh, M. Groundwater level modeling with machine learning: A systematic review and meta-analysis. Water 2023, 14, 949. [Google Scholar] [CrossRef]
- Petpongpan, C.; Ekkawatpanit, C.; Bailey, R.; Kositgittiwong, D.; Saraphirom, P. Evaluating surface water-groundwater interactions in consequence of changes in climate and groundwater extraction. Water Resour. Manag. 2022, 36, 5767–5783. [Google Scholar] [CrossRef]
- Awadh, S.; Al-Mimar, H.; Yaseen, Z. Groundwater availability and water demand sustainability over the upper mega aquifers of Arabian Peninsula and west region of Iraq. Environ. Dev. Sustain. 2020, 23, 1–21. [Google Scholar] [CrossRef]
- Jha, M.; Singh, L.; Nayak, G.; Chowdary, V. Optimization modeling for conjunctive use planning in Upper Damodar River basin, India. J. Clean. Prod. 2020, 273, 123098. [Google Scholar] [CrossRef]
- Directorate of Economics and Statistics. Land Use Statistics, Agricultural Statistics Ata Glance; Government of India; Directorate of Economics and Statistics: New Delhi, India, 2018; pp. 287–307.
- Dhawan, V. Water and Agriculture in India, Background Paper for the South Asia Expert Panel During the Global Forum for Food and Agriculture (GFFA); OAV-German Asia-Pacific Business Association: Hamburg, Germany, 2017; pp. 1–27. [Google Scholar]
- Deshpande, T. Vital Stats: Status of Water Availability for Agriculture in India; PRS Legislative Research, Institute for Policy Research Studies: New Delhi, India, 2016; pp. 1–2. [Google Scholar]
- Dangar, S.; Asoka, A.; Mishra, V. Causes and implications of groundwater depletion in India: A review. J. Hydrol. 2021, 596, 129103. [Google Scholar] [CrossRef]
- Central Ground Water Board (CGWB). Ground Water Information Booklet of Cuttack District, Orissa; Central Ground Water Board (CGWB): Faridabad, India, 2013; pp. 1–27.
- Sahuquillo, A.; Cassiraga, E.; Gomez-Hernandez, J.; Andreu, J.; Pulido-Velazquez, M.; Pulido-Velazquez, D.; Alvarez-Villa, O.; Estrela, T. Management alternatives of aquifer storage, distribution, and simulation in conjunctive use. Water 2022, 14, 2332. [Google Scholar] [CrossRef]
- Mishra, A.; Verma, H.C.; Singh, R. Alternative rotational delivery scheduling for better water regime in canal command. J. Irrig. Drain. Eng. 2008, 134, 175–184. [Google Scholar] [CrossRef]
- Gao, Y.; Du, E.; Yi, S.; Han, Y.; Zheng, C. An improved numerical model for groundwater flow simulation with MPFA method on arbitrary polygon grids. J. Hydrol. 2021, 603, 127399. [Google Scholar] [CrossRef]
- Mengistu, H.A.; Demlie, M.B.; Abiye, T.A.; Xu, Y.; Kanyerere, T. Conceptual hydrogeological and numerical groundwater flow modelling around the MoabKhutsong deep gold mine, South Africa. Groundw. Sustain. Dev. 2019, 9, 100266. [Google Scholar] [CrossRef]
- Zeng, J.; Yang, J.; Zha, Y.; Shi, L. Capturing soil-water and groundwater interactions with an iterative feedback coupling scheme: New HYDRUS package for MODFLOW. Hydrol. Earth Syst. Sci. 2019, 23, 637–655. [Google Scholar] [CrossRef]
- Zhou, Y.; Li, W. A review of regional groundwater flow modeling. Geosci. Front. 2011, 2, 205–214. [Google Scholar] [CrossRef]
- Post, V.E.A.; Galvis, S.C.; Sinclair, P.J.; Werner, A.D. Evaluation of management scenarios for potable water supply using script-based numerical groundwater models of a freshwater lens. J. Hydrol. 2019, 571, 843–855. [Google Scholar] [CrossRef]
- Bizhanimanzar, M.; Leconte, R.; Nuth, M. Modelling of shallow water table dynamics using conceptual andphysically based integrated surface-water–groundwater hydrologic models. Hydrol. Earth Syst. Sci. 2018, 23, 2245–2264. [Google Scholar] [CrossRef]
- Gebere, A.; Kawo, N.S.; Karuppannan, S.; Aster, T.F.; Paolo, P. Numerical modeling of groundwater flow system in the Modjo River catchment, Central Ethiopia. Model. Earth Syst. Environ. 2020, 6, 2151–2164. [Google Scholar] [CrossRef]
- Hassen, I.; Slama, F.; Bouhlila, R. Groundwater recharge assessment in an arid region through chloride mass balance and unsaturated numerical modelling: The Kasserine Aquifer System. Arab. J. Geosci. 2021, 14, 2282. [Google Scholar] [CrossRef]
- Jafarzadeh, A.; Khashei-Siuki, A.; Pourreza-Bilondi, M. Performance assessment of model averaging techniques to reduce structural uncertainty of groundwater modeling. Water Resour. Manag. 2021, 35, 3941–3956. [Google Scholar] [CrossRef]
- Raazia, S.; Dar, A.Q. Insights into the hydrogeological framework of the NW Himalayan Karewas (India). Environ. Chall. 2021, 4, 100086. [Google Scholar] [CrossRef]
- Chakraborty, S.; Maity, P.; Das, S. Investigation, simulation, identification andprediction of groundwater levels in coastal areas of Purba Midnapur, India, using MODFLOW. Environ. Dev. Sustain. 2019, 22, 3805–3837. [Google Scholar] [CrossRef]
- Dalai, A.; Tripathi, M.P.; Mishra, A.; Chand, S.; Venkataramana, B.; Nayak, J.K. Assessing the Impact of Climate Change on Irrigation Water Needs Through Conjunctive Water Use: Future Prospectives. Water 2025, 17, 2622. [Google Scholar] [CrossRef]
- Mishra, S.; Tripathi, S.; Tiwary, D.; Ohri, A.; Agnihotri, A.; Vishwakarma, A. Application of Visual MODFLOW in groundwater flow modeling at the left crescent of the Ganga River, Varanasi, India. In Groundwater Environment in Asian Cities; Springer: Berlin/Heidelberg, Germany, 2020; pp. 105–124. [Google Scholar]
- Lyazidi, R.; Hessane, M.; Moutei, J.; Bahir, M. Developing a methodology for estimating the groundwater levels of coastal aquifers in the Gareb-Bourag plains, Morocco embedding the Visual MODFLOW techniques in groundwater modeling system. Groundw. Sustain. Dev. 2020, 11, 100471. [Google Scholar] [CrossRef]
- Vazquez-Baez, V.; Rubio-Arellano, A.; Garcia-Toral, D.; Rodríguez-Mora, I. Modeling an aquifer: Numerical solution to the groundwater flow equation. Math. Probl. Eng. 2019, 2019, 1613726. [Google Scholar] [CrossRef]
- Klammler, H. Introduction to the Mechanics of Flow and Transport for Groundwater Scientists; The Groundwater Project: Guelph, ON, Canada, 2023. [Google Scholar]
- Maier, R.; Leven, C.; Sanchez-León, E.; Strasser, D.; Stoll, M.; Cirpka, O. Revealing vertical aquifer heterogeneity and hydraulic anisotropy by pumping partially penetrating wells. Hydrogeol. J. 2022, 30, 463–477. [Google Scholar] [CrossRef]
- Ikard, S.; Minsley, B.; Rigby, J.; Kress, W. A model of transmissivity and hydraulic conductivity from electrical resistivity distribution derived from airborne electromagnetic surveys of the Mississippi River Valley Alluvial Aquifer, Midwest USA. Hydrogeol. J. 2023, 31, 313–334. [Google Scholar] [CrossRef]
- Feng, J.; Cui, W.; Cortés, J.; Shi, Y. Bridging transient and steady-state performance in voltage control: A reinforcement learning approach with safe gradient flow. IEEE Control Syst. Lett. 2023, 7, 2845–2850. [Google Scholar] [CrossRef]
- Jeannot, B.; Schaper, L.; Habets, F. Water level in observation wells simulated from fracture and matrix water heads outputted by dual-continuum hydrogeological models: POWeR-FADS. Water Resour. Res. 2023, 59, e2023WR034652. [Google Scholar] [CrossRef]
- Doble, R.; Crosbie, R. Review: Current and emerging methods for catchment-scale modeling of recharge and evapotranspiration from shallow groundwater. Hydrogeol. J. 2017, 25, 3–23. [Google Scholar] [CrossRef]
- Gaiolini, M.; Colombani, N.; Busico, G.; Rama, F.; Mastrocicco, M. Impact of boundary conditions dynamics on groundwater budget in the Campania Region (Italy). Water 2022, 14, 2462. [Google Scholar] [CrossRef]
- Central Ground Water Board. Report of the Groundwater Resource Estimation Committee (GEC-2015); Central Ground Water Board: Haryana, India, 2017; pp. 1–137.
- Rejani, R.; Jha, M.K.; Panda, S.N.; Mull, R. Simulation modelling for efficient groundwater management in Balasore coastal basin, India. Water Resour. Manag. 2008, 22, 23–50. [Google Scholar] [CrossRef]
- Sajeena, S.; Kurien, E.K. Studies on groundwater resources using Visual MODFLOW–A case study of Kadalundi river basin, Malappuram, Kerala. Indian J. Soil Conserv. 2019, 47, 21–29. [Google Scholar]
- Gilsha Bai, E.B.; Rema, K.P.; Sajeena, S.; Sasikala, D. Simulation of groundwater flow using Visual MODFLOW: A case study for the command area of Chalakudy River diversion scheme. Indian J. Soil Conserv. 2022, 50, 29–37. [Google Scholar] [CrossRef]
- Waterloo Hydrogeologic Inc. Visual MODFLOW v.3.1 User’s Manual; Waterloo Hydrogeologic Inc.: Waterloo, ON, Canada, 2003; pp. 1–436. [Google Scholar]
- Tsai, J.; Yeh, T.; Cheng, C.; Zha, Y.; Chang, L.; Hwang, C.; Wang, Y.; Hao, Y. Fusion of time-lapse gravity survey and hydraulic tomography for estimating spatially varying hydraulic conductivity and specific yield fields. Water Resour. Res. 2017, 53, 8554–8571. [Google Scholar] [CrossRef]
- Mohanty, S.; Jha, M.K.; Gupta, V.; Chaudhari, S.K.; Mal, B.C. Numerical analysis of a deltaic aquifer system for sustainable management of groundwater. Indian J. Soil Conserv. 2018, 46, 151–159. [Google Scholar]
- Anderson, M.P.; Woessner, W.W. Applied Groundwater Modeling: Simulation of Flow and Advective Transport, 2nd ed.; Academic Press: Cambridge, MA, USA, 2002; pp. 1–373. [Google Scholar]
- Zheng, C.; Bennett, G.D. Applied Contaminant Transport Modeling, 2nd ed.; John Wiley & Sons, Inc.: Hoboken, NJ, USA, 2002; pp. 1–613. [Google Scholar]
- Bear, J.; Cheng, A.H.D. Modeling Groundwater Flow and Contaminant Transport; Springer: Berlin/Heidelberg, Germany, 2010; pp. 1–834. [Google Scholar]
- Java, O.; Kohv, M.; Lohmus, A. Performance of a bog hydrological system dynamics simulation model in an ecological restoration context: Sooma a case study, Estonia. Water 2021, 13, 2217. [Google Scholar]
- Sajeena, S.; Kurien, E.K. Hydrogeological characteristics and groundwater scenario of Kadalundi river basin, Malappuram District, Kerala. J. Trends Biosci. 2017, 10, 2193–2200. [Google Scholar]
- Duran, L.; Gill, L. Modeling spring flow of an Irish karst catchment using MODFLOW-USG with CLN. J. Hydrol. 2021, 597, 125971. [Google Scholar] [CrossRef]
- Perdikaki, M.; Chrysanthopoulos, E.; Markantonis, K.; Kallioras, A. Groundwater flow model calibration using variable density modeling for coastal aquifer management. Hydrology 2024, 11, 59. [Google Scholar] [CrossRef]
- Tabari, H. Climate change impact on flood and extreme precipitation increases with water availability. Sci. Rep. 2020, 10, 13768. [Google Scholar]
- Dalai, A.; Mishra, A.; Tripathi, M.P.; Pandey, V.K.; Mohanty, R.R. Maximizing net income and economic water productivity in a canal command through conjunctive use of canal water and groundwater. Indian J. Soil Conserv. 2023, 51, 18–26. [Google Scholar]
- Dalai, A. Conjunctive Use Assessment Using Optimization-Simulation Modeling. Ph.D. Thesis, IGKV, Raipur, India, 2023; pp. 1–199. [Google Scholar]
- Omar, P.; Gaur, S.; Dikshit, P. Conceptualization and development of multi-layered groundwater model in transient condition. Appl. Water Sci. 2021, 11, 147. [Google Scholar] [CrossRef]
- Kihm, J.; Kim, J.; Kim, Y.; Kim, S.; Yeh, G. Hydrogeologic framework model-based numerical simulation of groundwater flow and salt transport and analytic hierarchy process-based multi-criteria evaluation of optimal pumping location and rate for mitigation of seawater intrusion in a complex coastal aquifer system. Water Resour. Res. 2024, 60, e2023WR035486. [Google Scholar]
- Singh, L.; Saravanan, S. Assessing streamflow modeling using single and multi-site calibration approach on Bharathpuzha catchment, India: A case study. Model. Earth Syst. Environ. 2022, 8, 4135–4148. [Google Scholar] [CrossRef]
- Sahoo, S.; Jha, M. Numerical groundwater-flow modeling to evaluate potential effects of pumping and recharge: Implications for sustainable groundwater management in the Mahanadi delta region, India. Hydrogeol. J. 2017, 25, 2489–2511. [Google Scholar] [CrossRef]
- Behera, A.; Pradhan, R.; Kumar, S.; Chakrapani, G.; Kumar, P. Assessment of groundwater flow dynamics using MODFLOW in shallow aquifer system of Mahanadi Delta (East Coast), India. Water 2022, 14, 611. [Google Scholar] [CrossRef]
- Abdullah, T.; Ali, S.; Al-Ansari, N.; Knutsson, S.; Laue, J. Magnitude and direction of groundwater seepage velocity in different soil and rock materials. Engineering 2020, 12, 320–333. [Google Scholar] [CrossRef]
- Anand, B.; Karunanidhi, D.; Subramani, T.; Srinivasamoorthy, K.; Suresh, M. Long-term trend detection and spatiotemporal analysis of groundwater levels using GIS techniques in Lower Bhavani River Basin, Tamil Nadu, India. Environ. Dev. Sustain. 2019, 22, 2779–2800. [Google Scholar] [CrossRef]
- Fang, Z.; Bogena, H.; Kollet, S.; Vereecken, H. Scale dependent parameterization of soil hydraulic conductivity in 3D simulation of hydrological processes in a forested head water catchment. J. Hydrol. 2016, 536, 365–375. [Google Scholar] [CrossRef]
- Ajjur, S.; Al-Ghamdi, S. Quantifying the uncertainty in future groundwater recharge simulations from regional climate models. Hydrol. Process. 2022, 36, e14645. [Google Scholar] [CrossRef]
- Alqahtani, A.; Sale, T.; Ronayne, M.; Hemenway, C. Demonstration of sustainable development of groundwater through aquifer storage and recovery (ASR). Water Resour. Manag. 2021, 35, 429–445. [Google Scholar] [CrossRef]
Disclaimer/Publisher’s Note: The statements, opinions and data contained in all publications are solely those of the individual author(s) and contributor(s) and not of MDPI and/or the editor(s). MDPI and/or the editor(s) disclaim responsibility for any injury to people or property resulting from any ideas, methods, instructions or products referred to in the content. |
© 2025 by the authors. Licensee MDPI, Basel, Switzerland. This article is an open access article distributed under the terms and conditions of the Creative Commons Attribution (CC BY) license (https://creativecommons.org/licenses/by/4.0/).