Abstract
Rainfall deficits and erratic dry spells pose major challenges in rainfed ecosystem. In-situ moisture conservation practices (MCP) like ridge–furrow methods, improve soil moisture but are inadequate during 2–3 week dry spells at critical crop stages (flowering and maturity), leading to yield loss. Supplemental irrigation (SI) using an ex-situ rainwater harvesting (RWH) pond can mitigate these effects, but optimizing the pond design is challenging due to limited runoff and storage losses. This study aims to design RWH pond for small farm holders with a 1.0 ha area and evaluate its efficient use for SI during intermittent dry spells and critical crop stages. The design volume was estimated using the SCS-CN method based on daily rainfall data (1974–2010) for the northeast monsoon. A pond with a capacity of 487.5 m3, constructed for a 1 ha micro-watershed, was used to observe the runoff for design validation. The harvested runoff can be used as SI for a cultivable area of 0.4 ha, based on the watershed-to-cultivable area ratio. Statistical analysis of observed and estimated runoff data from 2011 to 2023 revealed a strong correlation (r = 0.87), confirming the pond design. Harvested rainwater, applied through micro-irrigation (rain gun) at a depth of 50 mm during moisture stress periods, significantly improved cotton productivity. The combined use of harvested rainwater and MCP increased yield in the range of 3.8 to 25.3%, improved rainwater use efficiency (1.52 to 3.13 kg ha−1 mm−1), and had a higher benefit-cost ratio (1.15 to 2.43) over a 13-year period. This study concludes that integrating in-situ MCP with ex-situ RWH with micro-irrigation significantly improves rainfed crop productivity in vertisols.
1. Introduction
According to the latest estimates, global rainfed croplands covered about 1.75 billion ha by the end of the last millennium—approximately 5.5 times larger than the world’s irrigated areas [1]. Rainfed agriculture thus plays a critical role in global food production, constituting 80% of the world’s cropland and contributing more than 60% of global cereal grain output. It not only supports rural livelihood but also supplies food to growing urban populations [2,3,4].
Globally, India ranks first in both land area and the production of rainfed crops. Of the estimated net cultivated area of 140.3 million ha, approximately 79.44 million ha (57%) are rainfed, contributing significantly to 44% of the total food grain production [5]. Rainfed agriculture is vital for supporting nearly 40% of India’s population, 80% of its horticulture, and 60% of its livestock [6]. Coarse cereals, pulses, oilseeds, and cotton are the main crops grown in these rainfed regions.
Rainfed agriculture, despite its significant potential for crop production, faces several challenges. These include inadequate soil moisture, suboptimal field practices, uneven rainfall distribution, limited cultivation of high-yielding varieties, slow adoption of advanced technologies, high cultivation costs, and migration of labor. Soil-related issues such as high soil temperature, soil degradation, poor water infiltration, low water retention capacity, excessive surface runoff, and high evaporation losses further exacerbate the situation [7]. Even a slight deflection of one standard deviation from the average annual rainfall can lead to complete crop failure [8]. Hence, rainwater management is considered essential for the sustainability of rainfed agriculture. Research shows that only 10 to 30% of rainfall is efficiently utilized for plant transpiration and growth [9,10]. To achieve optimal crop yields in rainfed regions, it is crucial to effectively harvest rainwater, either by capturing moisture within the soil profiles (in-situ method) or by storing excess surface runoff for later use (ex-situ method). To improve the utilization of rainfall and enhance crop productivity within the field, a variety of in-situ soil moisture conservation practices (MCP), such as the ridge–furrow method, broad bed and furrow, compartmental bunding, mulching, contour farming, and water retention techniques are employed at the farm level. These practices help to maximize the benefits of rainwater and reduce the vulnerability of crops to water stress [4,11,12].
The ex-situ rainwater harvesting (RWH) system through ponds is a highly effective practice for boosting productivity in rainfed agriculture. Studies have shown that collecting on-farm runoff in excavated ponds and providing supplemental irrigation can significantly improve crop yields and stabilize production [13]. These ponds enable farmers to manage dry spells by utilizing stored water during critical periods [14]. The design of pond capacity is determined by factors such as design rainfall, crop water needs during critical growth stages, and potential losses from seepage and evaporation. For regions with an average annual rainfall of 500 to 750 mm, farm ponds with a capacity of 500 m3 are recommended [15]. In areas with rainfall exceeding 750 mm, especially in black soil regions, farm ponds with capacities ranging from 500 to 1000 m3 can be built without lining [14]. There are significant opportunities to capture excess runoff in rainfed areas across various states in India [16].
The primary cause of crop failure or reduced yields in rainfed agriculture is the occurrence of mid-season and terminal dry spells, lasting 1 to 3 weeks, which disrupt soil moisture profiles. Supplemental irrigation (SI) provides small amounts of water to rainfed crops using micro-irrigation systems during dry spells, ensuring sufficient moisture in the root zone for steady growth and yield stability [17,18,19]. This practice is employed to mitigate the adverse effects of irregular rainfall on rainfed crops [20,21,22]. SI relies on water stored in small ponds near the fields. By capturing surplus rainfall and storing it in ponds during the rainy season, this water can be used for SI, combined with better agronomic practices to improve agricultural productivity in rainfed areas [23]. This approach helps to mitigate the impact of prolonged dry spells and creates opportunities for regions vulnerable to rainfall variability [9]. Using SI in combination with rainwater not only increases crop yields but also improves water productivity [17,20,24]. Research shows that SI ranging from 50 to 200 mm per season (equivalent to 500 to 2000 m3 per ha) is effective in reducing yield losses caused by dry spells in most years under rainfed conditions [16]. Pandey et al. found that developing smaller ponds for dry spell mitigation significantly boosted crop yields [25].
Studies have shown that providing SI during dry periods at various crop growth stages can improve yields by 29% to 114% for different crops [1,26]. Panigrahi et al. indicated that SI in a rice–mustard cropping system in India is an economically viable strategy for enhancing the livelihood of smallholder farmers [27]. Ilbeyi et al. found that applying a cubic meter of water through SI at the optimal time with proper management could result in an additional 2.0–3.5 kg of grain compared with solely rainfed production [28]. Additionally Osman et al. concluded that small brick and cement mortar-lined ponds are ideal for small farmers with up to two ha of land, offering the potential for a 30% increase in net income through SI for tobacco cultivation [29].
While SI has proven effective in alleviating the effects of dry spells, it also faces several challenges. These include difficulties in accurately planning the timing and depth of water application, the absence of a fixed irrigation schedule due to reliance on rainfall, and the challenge of retaining water amid significant seepage and evaporation losses [30,31]. Also, understanding meteorological factors such as dry spells, late onset, early cessation, and length of growing period at the local level is essential for effectively planning SI [32]. The depth of water provided through SI alone is insufficient to fully sustain economic crop production. Nonetheless, SI helps reduce the impact of critical water shortages. Although there is extensive research on runoff harvesting, there is limited data focusing specifically on SI for rainfed crops. This study investigates potential solutions to these challenges, particularly for small-scale farmers in rainfed agriculture. When a pond is constructed in the field of a small-scale farmer, it occupies a portion of the land, making it unavailable for cultivation. Narsimlu et al. designed RWH ponds for semi-arid regions of Rajasthan, India, to support SI for maize during the kharif and coriander during the rabi season [33]. They emphasized that designing location specific RWH ponds for small-scale farmers involves significant challenges, with up to 2 to 4% of the land being allocated for the RWH structure. Hence, designing a RWH pond suitable for a small agricultural watershed, assessing water availability, and ensuring the effective utilization of harvested water is essential to address the critical research gap in managing moisture stress during dry spells, particularly where in-situ rainwater is insufficient to support the rainfed crops through to maturity.
Among the rainfed crops, cotton is predominantly cultivated in the rainfed regions of Southern Tamil Nadu. In India, the average cotton yield is about 500–600 kg ha−1, while in Tamil Nadu, it ranges from 450 to 550 kg ha−1. However, the potential yield can reach 1500 kg ha−1 in India and 1200 kg ha−1 in Tamil Nadu with the adoption of improved cultivation practices [34]. Rainfed cotton, typically grown in areas receiving 500–1200 mm of annual rainfall, has a crop duration of 150–180 days. Although yields under rainfed conditions are generally lower, adopting climate-resilient seed varieties, efficient irrigation, and integrated pest management can enhance productivity by 30–50%. SI during critical growth stages has also been shown to significantly improve yield outcomes in these regions [34].
With this background in view, the present study aimed to (i) design a RWH pond for an agricultural micro-watershed, (ii) validate the design using observed runoff data, and (iii) evaluate the effectiveness of an integrated approach that combines in-situ MCP with ex-situ harvested water application for SI. The focus of this study was also on assessing the impact of this strategy on crop yield and water productivity for rabi cotton grown in the vertisols of Southern Tamil Nadu, India.
2. Materials and Methods
2.1. Concept of This Study
The conceptual model of this study focuses on harvesting surface runoff from a small agricultural watershed and storing it in a RWH pond located within the same micro-watershed. After accounting for storage and conveyance losses, the stored water is evaluated for its potential reuse as SI in the cultivable areas, aiming to reduce soil moisture stress and enhance crop yield and water productivity. To ensure effective rainwater management, in-situ moisture conservation is practiced during the rainy season, while ex-situ harvested water is used during dry spells. This integrated approach, combining in-situ and ex-situ strategies, is designed to improve water use efficiency and support sustainable crop production. The feasibility of this system is assessed by quantifying runoff for pond design, which includes determining the suitable watershed and cultivable area sizes. The cultivable land falls within the same micro-watershed, following methodologies by Shirahatti et al. [35] and Narsimlu et al. [33]. The conceptual framework for the RWH system is depicted in Figure 1.
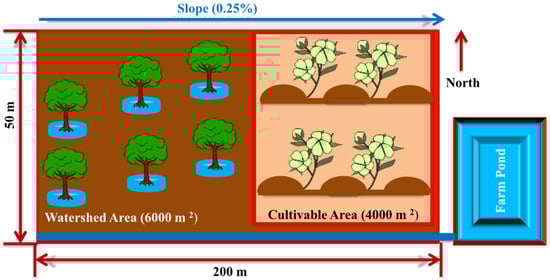
Figure 1.
Conceptual model of rainwater harvesting, storage, and cultivable area for the agricultural micro-watershed. Watershed area 1.0 ha out of which F. No. 36 is 6000 m2 with tree crops and F. No. 35 is 4000 m2 with cultivable area.
2.2. Research Framework
The research framework comprises several key components as follows: (i) analyzing rainfall pattern in the study area; (ii) determining design rainfall through probability and frequency analysis of seasonal rainfall occurrence; (iii) estimating runoff using the Soil Conservation Society-Curve Number (SCS-CN) method based on long-term daily rainfall data; (iv) establishing watershed-to-cultivable area ratios; (v) designing and constructing a RWH pond, measuring runoff directed into the pond during various rainfall events, comparing estimated and observed runoff using the statistical measure; (vi) analyzing the water balance components of the pond and soil water content, and reusing stored water from the pond for cotton cultivation during soil moisture deficit periods. Figure 2 shows the flow diagram outlining the research stages involved in the design of RWH pond and its reuse strategy.
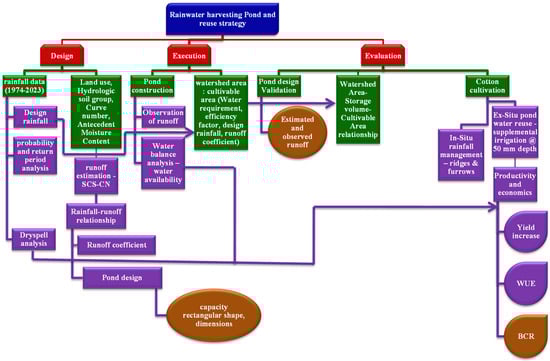
Figure 2.
Flow diagram for rainwater harvesting pond design and reuse strategy.
2.3. Study Area and Climate
This study was carried out at the Agricultural Research Station (ARS) in Kovilpatti, located in the Thoothukudi district of Tamil Nadu, India, representing the southern zone of Tamil Nadu, with a semi-arid (hot dry) climate, and vertisols under the major production system of dryland cotton. Kovilpatti is a distinctive location known for its dryland agriculture, making it an ideal site for research in semi-arid crops (Figure 3). It is situated at latitude of 9°10′2.69″ N, longitude of 77°52′36.29″ E, and an average elevation of 90 m above mean sea level. Most of the crops are cultivated under a rainfed situation during NEM (rabi season). The agro-climatic region of Kovilpatti is characterized by a semi-arid tropical climate. The long-term average annual rainfall is 720.2 mm, with NEM accounting for the main contribution of 388.8 mm. The annual maximum temperature during the year ranges from 30.4 °C to 38.2 °C and minimum temperature from 19.0 °C to 25.2 °C. The annual maximum and minimum mean daily temperature are 35 °C and 22.9 °C, respectively. The mean annual relative humidity is 79% and the annual mean duration of sunshine is 7.1 hour day−1. The mean annual evaporation rate is 7 to 8 mm day−1 and the annual mean daily wind velocity is 9 km hour−1 [36].
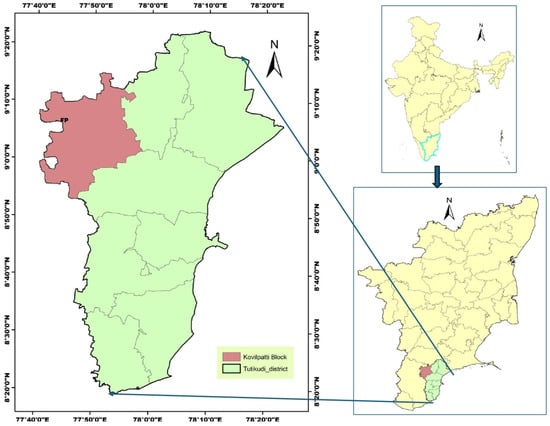
Figure 3.
Location of the study area.
2.4. Description of Agricultural Watershed
This study considers an agricultural micro-watershed covering an area of 10,000 m2, and estimates the runoff received from this watershed for the construction of RWH pond. This watershed is situated in field no. 35 and 36 at the northern boundary of Black Soil Farm at ARS in Kovilpatti. It is an elongated rectangular shape measuring 200 m in length and 50 m in width. The specific characteristics of this agricultural micro-watershed are detailed in Table 1.

Table 1.
Characteristics of the agricultural micro-watershed.
A shape factor of 0.25 indicates a more elongated watershed, often associated with higher peak flow and faster runoff potential. Lower values of watershed relief, relief ratio, and relative relief suggest a reduced potential for soil erosion. An elongation ratio of 0.564 indicates a moderately elongated watershed shape, while a compactness coefficient of 1.41 confirms that the watershed is somewhat elongated, differing from a perfectly circular form.
2.5. Rainfall Pattern in the Study Area
To understand the rainfall pattern, monthly rainfall data collected from the ARS, Kovilpatti over a period of 50 years (1974–2023) were utilized for this study. The monthly rainfall series was further categorized into the southwest monsoon (SWM) from June to September, the northeast monsoon (NEM) from October to December, winter from January to February, and summer from March to May, as well as an annual rainfall series for analysis purposes. The basic statistical properties, including mean, standard deviation, coefficient of variation, skewness, and kurtosis were computed [37].
2.6. Design Rainfall
Design rainfall is the amount of rainfall during the cropping season that ensures enough surface runoff to satisfy crop water requirements [7]. If actual rainfall falls below this amount, crops may face moisture stress. Conversely, if rainfall exceeds the design amount, excess runoff could damage water harvesting structures. The design rainfall is determined through probability analysis, which calculates the likelihood of certain rainfall levels. A higher probability indicates a more reliable chance of generating runoff for farm ponds [7]. The percent chances of expected rainfall for different time series with different probability by using the Weibull technique and the return period were calculated for seasonal rainfall [38,39]. Since NEM rainfall is more critical than annual rainfall for pond design, all the analyses were conducted on a NEM basis.
2.7. Runoff Computation by SCS-CN Method
The SCS-CN method [40] is used to estimate runoff for designing small soil and water conservation structures. Runoff is calculated using daily rainfall data, land use and its distribution, the hydrologic groups of soils based on infiltration rates within the micro-watershed, and the antecedent moisture condition (AMC) of the watershed. The AMC is determined by the total rainfall over the five days preceding the considered rainfall event [40].
This method estimates direct runoff (depth) (Q) or rainfall excess on a storm basis. It relies on the watershed’s potential maximum retention (S), which is influenced by the watershed’s wetness—specifically AMC and the physical characteristics of the watershed. Runoff depth is estimated by Equation (1) [14].
where Q is the runoff depth, mm. P is the daily rainfall, mm. S is the potential maximum retention of soil, mm. It is determined by selecting the curve number for different land uses in a micro-watershed. Equation (2) estimates S by selecting CN from the standard Table [14].
Initial abstraction in mm is related to S for different soil types. For black soils, the initial abstraction is 0.2S.
CN values are selected based on different land use types and hydrologic soil groups, and are applied to AMC II, which represents average moisture conditions. Correction factors are then applied to adjust CN values for AMC I and AMC III, corresponding to dry and wet conditions, respectively. Long-term daily rainfall data for October, November, and December from 1974 to 2010 are used to estimate runoff during the NEM season. The runoff calculation procedures follow the methodology outlined by Reddy et al. [14], with a similar approach adopted from USDA, Maheshwarababu et al., and Rai and Dubey [41,42,43].
2.8. Determination of Cultivable Area
The cultivable area refers to the portion of watershed that can be irrigated using runoff water harvested from within the 10,000 m2 watershed. The rainfall multiplication factor is used to scale the watershed area to determine the size of the cultivable area. This factor defines the relationship between the watershed area and the cultivable area, thereby determining the ratio between them [44].
The cultivable area was determined based on factors that included the availability of runoff water in the pond, crop water requirement, design rainfall, runoff coefficient, and an efficiency factor. Crop water requirements were calculated using pan evaporation data for the crop period and design rainfall was estimated through probability analysis. Black soils with mini catchments of 1 to 5 ha typically exhibit a runoff coefficient of 10 to 20% under mild to medium slopes (1–10%) [15]. However, in this study, the runoff coefficient was determined based on rainfall that generated runoff, calculated using the CN method. An efficiency factor of 0.75 was applied to account for the uneven distribution of water in micro-catchments [14]. It adjusted the calculation to reflect actual water availability, considering variations in soil, topography, and water collection systems.
2.9. Design and Construction of RWH Pond
To design a pond, information on the hydrological characteristics of the micro-watershed area, the rainfall–runoff relationship, water requirement, and expected seepage and evaporation losses is essential. The primary consideration in design is to ensure adequate water for SI at minimal cost. Generally, in the black soil regions of the Deccan Plateau, a storage capacity of 250 m3 per 10,000 m2 of catchment area is recommended [15].
In this study, the average seasonal runoff during the NEM season was estimated based on a 50% probability with a 2-year return period, accounting for 10% water loss due to evaporation and seepage. The total harvestable rainwater was then calculated. Accordingly, the pond’s dimensions, shape, side slopes, and water control structures, including the inlet, silt trap, and outlet, were designed and the pond was subsequently constructed.
To validate the design capacity of the RWH pond, observed runoff data were collected from 2011 to 2023 by monitoring changes in water levels and the volume of runoff entering the pond. These observations were used to compare with the estimated runoff derived using the CN method. The comparison was evaluated using statistical measures including mean absolute error (MAE), root mean square error (RMSE), relative absolute error (RAE), and correlation coefficient (r). The graphical representation of estimated and observed runoff compares predicted and measured values over time. A significant positive correlation (e.g., values closer to 1) indicates that the estimated runoff closely matches the observed runoff, suggesting model accuracy. Conversely, a lower correlation may point to discrepancies or areas for model improvement. A rainfall–runoff relationship was developed to predict runoff for forecasted seasonal rainfall aiding in crop planning and assessing the feasibility of providing SI during periods of moisture stress.
2.10. Reuse of Harvested Rainwater Water Through Supplemental Irrigation (SI)
To evaluate the feasibility of providing SI from the pond for reutilization of harvested rainwater and enhancing water productivity, an experiment was conducted in the cultivable area within the agricultural micro-watershed from 2011 to 2023. The size of the cultivable area, initially determined using the watershed-to-cultivable area ratio, was further validated by cultivating a crop and assessing water availability in the pond. This assessment was based on a water balance analysis that accounted for key components, including evaporation and seepage losses.
2.10.1. Water Balance Analysis of RWH Pond
To assess the availability of harvested runoff in the pond, a daily water balance analysis was conducted for RWH pond within a micro-watershed after runoff water was collected in the pond. The key components of the water balance equation include rainfall as input, water losses as output, and the resulting water availability [45,46]. The pond water balance Equation (3) is as follows:
where R is the harvested runoff water in the pond (m3); E is the quantity of water lost through evaporation (m3); S is the quantity of water lost through seepage (m3); U is the quantity of water used for irrigation (m3); D is the dead storage in the pond at the end of the season/crop period (m3); O is the overflow from the pond (m3).
Due to the small size of the pond, direct rainfall was not considered because its contribution was minimal. Daily evaporation data from a pan evaporimeter were used to estimate daily evaporation losses, calculated by multiplying the daily evaporation rate by the pond’s surface area. Changes in water level, daily evaporation (in mm), water availability in the pond, and water used for SI were recorded. Based on these records, the water balance components were calculated.
2.10.2. Field Evaluation and Experimental Details for Reusing Harvested Water
The experiment involved cotton cultivation with two distinct treatments: (i) providing SI to the rainfed crop and (ii) maintaining a purely rainfed crop. Cotton was grown with a seed rate of 20 kg ha−1 and a spacing of 45 × 15 cm with the cultivable area sized at 80 m in length and 50 m in width. Prior to cultivation, the field was thoroughly prepared with one round of disc ploughing, followed by two rounds of tilling with a cultivator. An in-situ MCP of ridges and furrows was formed, with 45 cm spacing, forming 10 m long rows using a ridger. Seeds were manually dibbled at a depth of 3–5 cm, and placed along the ridge at two-thirds of the ridge height to maintain the recommended row-to-row and seed-to-seed distances. Crop management and crop protection measures were adopted following the guidelines of crop production of the State Department of Agriculture [47].
2.10.3. Initial Soil Properties of the Experimental Area
The experimental site is located in Kovilpatti, a region characterized by vertisol tracts that cover approximately 70% of the total area in Thoothukudi district, Southern Tamil Nadu. Taxonomically, this soil is classified under the USDA system as fine, smectitic, and isohyperthermic, belonging to the Typic Haplusterts family [48]. These soils are very deep, with depths ranging from 110 to 150 cm. During periods of moisture stress, the soil develops typical cracks that are at least 1 cm wide and extend to a depth of more than 50 cm. The soil exhibits a sub-angular blocky structure, and a clayey structure with neutral to slightly alkaline pH at lower depths. The soil is characterized by low available nitrogen (N), with values less than 280 kg ha−1, medium available phosphorus (P) ranging between 11 and 22 kg ha−1, and high available potassium (K) exceeding 280 kg ha−1. The soil characteristics of the study area are listed in Table 2.
Table 2.
Soil characteristics of the study area.
2.10.4. Pumping Device and Irrigation Equipment
A 5 HP diesel engine was used to pump harvested runoff water from the pond, with the pump securely fixed at the pond boundary. A 75 mm diameter HDPE suction pipe with a foot valve at its base, along with a 63 mm diameter discharge pipe, was used for pumping. The pump had a discharge rate of 4 L s−1, with a pressure range of 2.5 to 3 kg cm−2. A rain gun irrigation system, mounted on a tripod, discharged water at 3.2 L s−1, with a wetted diameter of 20 m, covering about 1000 m2 per placement. To irrigate the entire 4000 m2 cultivable area, the rain gun was moved four times, allowing full coverage within 10 to 12 h to achieve a 5 cm irrigation depth. The 5 cm depth of irrigation water was ensured based on the discharge rate of the sprinkler system and its operating duration, allowing correct estimation of the total volume applied to the field.
2.10.5. Soil Sampling
To assess soil water content (SWC) throughout the cotton cropping period, samples were collected at specific growth stages, viz., initial stage (1–10 days), vegetative stage (11–44 days), flowering stage (45–87 days), and maturity stage (88–145 days). Samples were taken at depths of 0–15 cm, 15–30 cm, and 30–45 cm, collected at the midpoint of each stage, regardless of rainy days. SWC was measured using the gravimetric method [49], which involved recording the initial and final weights of soil samples after oven drying. SWC was also measured before and after the application of SI.
2.10.6. Cotton Response to Supplemental Irrigation
Crop responses to SI from the RWH pond during moisture deficits were recorded by recording cotton yield and calculating rainwater use efficiency. As the crops are cultivated in rainfed regions without any additional irrigation apart from rainwater, the rainwater use efficiency (RWUE) serves as a measure of water productivity or efficiency for a specific treatment. Calculating RWUE involved considering the total rainwater utilized by the crops throughout the entire growing season and its impact on crop yield for the given treatment [50]. The calculation of RWUE follows Equation (4)
Cumulative depth of rainfall (mm) refers to the total depth of rainfall received by the crop throughout the crop period, from sowing to harvest. In scenarios where SI was applied, the depth of the SI would be added to the cumulative depth of rainfall.
To evaluate the economic feasibility, the benefit-cost (B-C) ratio was computed for cotton cultivation. The cost of cultivation (CoC) includes expenses related to field preparation, inputs such as seeds, fertilizers, and plant protection chemicals, labor charges for operations like sowing, weeding, and harvesting, as well as the cost of SI. The benefit was calculated as the gross income, which was obtained by multiplying the cotton yield with the market price per kg. The B-C ratio was then computed as the ratio of gross income to CoC for the years in which SI was applied to the rainfed cotton crop.
2.10.7. Statistical Analysis
The results of field experiments were statistically analysed and treatment means were compared using the least significant difference (LSD) test (p = 0.05). All analyses were performed using Microsoft Excel.
3. Results and Discussion
The graphical presentation of annual and seasonal rainfall series for Kovilpatti is given in Figure 4a–e. The statistical analysis of rainfall data is presented in Table 3. From the table it can be seen that the average annual rainfall of Kovilpatti was 720.2 mm in 41 rainy days. The maximum rainfall of 1175.6 mm (52 rainy days) was recorded in 2023 and minimum rainfall of 199.6 mm (15 rainy days) was recorded in 2016. Among the different seasons, the NEM recorded the highest rainfall with 388.8 mm over 21 rainy days, followed by the SWM with 157.5 mm over 9 rainy days. The summer season received 141.7 mm of rainfall across 9 rainy days, while the winter season recorded the lowest, with 32.3 mm over 2 rainy days.
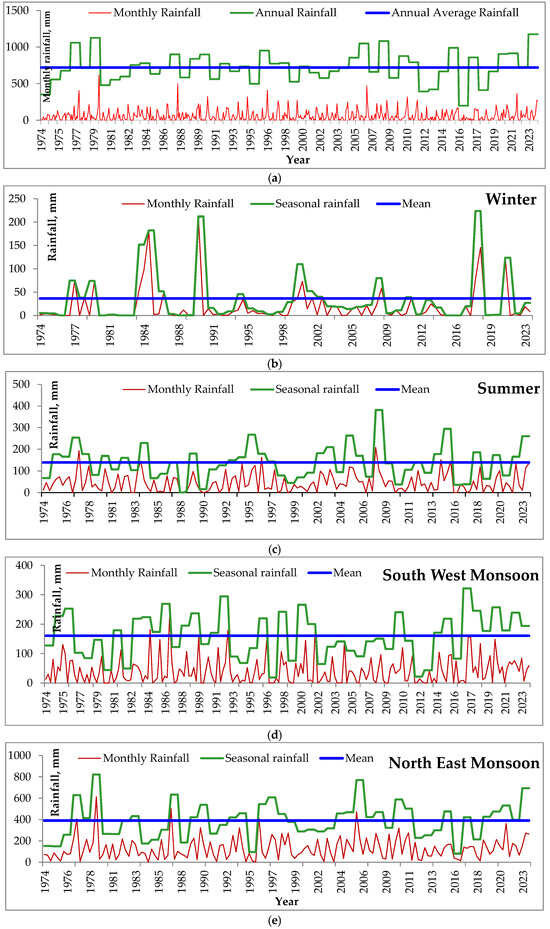
Figure 4.
(a) Distribution of annual rainfall from 1974 to 2023. (b) Distribution of winter rainfall from 1974 to 2023. (c) Distribution of summer rainfall from 1974 to 2023. (d) Distribution of southwest monsoon rainfall from 1974 to 2023. (e) Distribution of northeast monsoon rainfall from 1974 to 2023.
Table 3.
Statistical properties of annual and seasonal rainfall series of Kovilpatti.
The maximum (220 mm) and minimum (39.2 mm) annual one-day maximum rainfalls were recorded on 28 October 2006 and 12 September 1991, respectively. The average one-day maximum rainfall over these 50 years was found to be 86 mm. It was observed that 11 years (22%) experienced a one-day maximum rainfall exceeding 100 mm; however, no general trend in rainfall occurrence was noted during these years. October received the highest amount of one-day maximum rainfall (28%), followed by November (28%). Most of the one-day maximum rain occurred during NEM.
The coefficient of variation (CV) for annual rainfall was 28.7, indicating relatively low variability in total rainfall over time. The CV values for summer and winter rainfall series were higher. To assess whether the annual and seasonal rainfall data follow a normal distribution, skewness and kurtosis were calculated. Positive skewness values in all rainfall series indicate that the data are skewed to the right. The coefficients of skewness for the monsoon season and annual rainfall are nearly zero, suggesting a near-normal distribution. In contrast, the rainfall data for winter and summer seasons show greater skewness compared with the monsoon season. Kurtosis measures the peakedness or flatness of a data series relative to a normal distribution. The positive kurtosis of the annual rainfall time series indicates a peaked distribution, while the negative kurtosis of the SWM indicates a flatter distribution.
The annual and seasonal rainfall during the period from 1974 to 2023 showed clear decadal variability (Figure 4a–e). From 1974 to 1983, the mean annual rainfall was moderate, with significant contributions from both SWM and NEM. In the next decade, 1984 to 1993, annual rainfall slightly increased, mainly due to a stronger NEM contribution. From 1994 to 2003, the annual rainfall remained stable but showed occasional peaks, with SWM slightly weakening and NEM continuing as a major contributor. From 2004 to 2013, there was a slight decline in annual rainfall, primarily due to reduced SWM rainfall, while NEM maintained consistent levels. The decade from 2014 to 2023 experienced an overall increase in annual rainfall, largely driven by intense NEM rainfall events, whereas SWM showed irregular trends with high year-to-year variability. Winter and summer rainfall remained relatively low across all decades, with minor fluctuations and occasional high rainfall events in isolated years.
3.1. Design Rainfall
Small RWH structures, such as ponds, tend to fill more significantly during the monsoon season compared with other times of the year [14]. Using annual rainfall data for designing such ponds may lead to an overestimation of storage needs, so seasonal rainfall data are more appropriate for accurately sizing ponds. In Kovilpatti, most of the rainfall occurs during NEM, which is the primary contributor to seasonal rainfall. The design’s rainfall was determined using probability analysis with the Weibull method and frequency analysis for NEM rainfall, as shown in Figure 5. From the analysis, the following rainfall values were observed: 266.5 mm at 75% probability (1.34-year return period), 297.3 mm at 67% probability (1.49-year return period), which is to be considered for the design of the RWH pond, and 385.4 mm at 50% probability (2-year return period) as the design’s rainfall. The 2-year return period, commonly recommended in rainfed regions, offers a balanced, cost-effective, and reliable basis for the RWH design, ensuring optimal storage under average monsoon conditions; hence, it was selected as the design rainfall for this study [14].
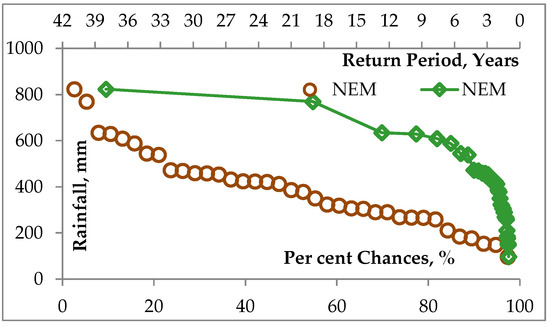
Figure 5.
Probability and frequency analysis of NEM rainfall series.
3.2. Estimation of Runoff by Curve Number
For the calculation of runoff by the SCS-CN method, the 5-day antecedent consecutive rainfall amounts were calculated, and the antecedent moisture condition (AMC) was determined based on seasonal categories, viz., dormant season (AMC II = 12.7 to 27.9 mm) and growing season (AMC II = 35.6 to 53.3 mm). Correction factors were applied for AMC I (0.80) and AMC III (1.13). For AMC II, a CN of 81 was used, corresponding to seeded legumes in straight rows, classified as hydrologic soil Group D, with low infiltration and clay soil. For AMC I and AMC III, CN values of 64.6 and 91.8 were calculated, respectively. Runoff-causing rainfall (RCRF) refers to the amount of daily rainfall, measured in mm, that generates runoff during various rainfall events. The runoff coefficient was calculated as the ratio of runoff to rainfall.
In this study, daily runoff was calculated using daily rainfall data for October, November, and December from 1974 to 2010. The NEM seasonal runoff was obtained by summing the monthly runoff values. Table 4 presents the seasonal rainfall, runoff-causing rainfall, runoff in mm, and runoff coefficient for the period from 1974 to 2010. Runoff-causing rainfall (RCRF) is the rainfall total that exceeds infiltration and storage depressions resulting in direct surface runoff. From the table, it can be seen that the long-term average of NEM rainfall from 1974 to 2010 was 392.3 mm; of this, 284.2 mm, or 72.4% of the total NEM rainfall, was runoff-causing rainfall. The resulting runoff was 73.5 mm, which yielded a runoff coefficient of 0.20. This indicates that 20% of the runoff-causing rainfall contributes to actual runoff during the monsoon period.
Table 4.
Estimation of runoff by the SCS-CN method from 1974 to 2010.
The rainfall–estimated runoff relationship was established using Equation (5), with a maximum regression coefficient (R2) value of 0.83. Figure 6 illustrates this relationship, based on the SCS-CN method.
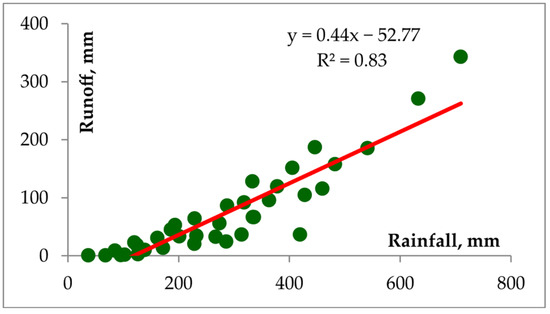
Figure 6.
The rainfall–runoff relationship based on the SCS-CN method.
In this equation, represents the runoff-producing seasonal rainfall in mm, and represents the seasonal runoff in mm. This equation can be used to calculate the expected runoff for a seasonal rainfall allowing for the determination of the design storage capacity of a RWH pond.
3.3. Determination of Cultivable Area
The crop water requirement for cotton is considered 500 mm, while the design rainfall at a 50% probability is 385.4 mm. The runoff coefficient is 0.2 and an efficiency factor of 0.75 is applied for the micro-catchment area. The catchment area to command area ratio is 1 ha: 0.4 ha. This implies that the catchment area (1 ha) can provide sufficient runoff to meet the water requirements of the cultivable area (0.4 ha) considering the efficiency and runoff coefficient values.
3.4. Determination of Pond Capacity
The pond capacity was determined based on long-term seasonal runoff values. To estimate runoff, probability and frequency analysis was conducted [42], with the results for runoff in cubic meters presented in Figure 7. Based on a 50% probability (2-year return period), the harvestable rainwater was calculated to be 453 m3. After accounting for 10% losses, the total harvestable rainwater increased to 500 m3. Similar to this work, Kulkarni et al. standardized farm pond size with a storage capacity of 417 m3 for a 1 ha catchment area in the Latur division of the Marathwada region, India [51].
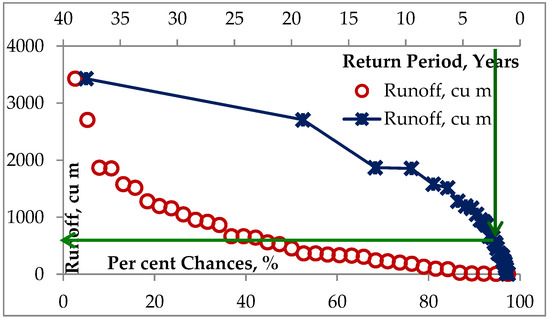
Figure 7.
Probability and frequency analysis of estimated runoff (cubic m) from 1974 to 2010.
3.5. Construction of RWH Pond
The RWH pond was constructed during 2011. It is located at the lower most point of the watershed in field no. 35 of ARS, Kovilpatti, so that all the runoff water drains into the pond after satisfying abstraction losses. Based on the estimated runoff volume of 500 m3, pond capacity and dimensions were decided. A rectangular shape pond with the dimensions of 25 m in length, 13 m in width, and 1.5 m in depth with a storage volume of 487.5 m3 was constructed with a concrete inlet and a silt trap to ensure the smooth entry of runoff water from one ha watershed area into the RWH pond, and an outlet weir was constructed for the safe disposal of excess runoff. The pond was lined on all sides and at the bottom with stone and concrete in a random rubble masonry design to prevent seepage losses (Figure 8).
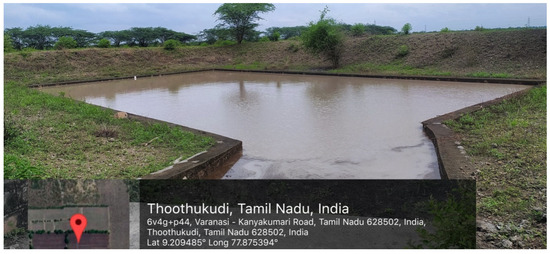
Figure 8.
Concrete-lined RWH pond.
The watershed considered in this study is a micro-sized area primarily used for agriculture. It includes a total catchment area of 1 ha of which 0.4 ha serves as a cultivable area. From 2011 to 2021, the watershed area was planted with fodder crops after which it was converted to tree crops. The cultivable area meanwhile is primarily used for cotton cultivation. During rainfall periods, particularly during NEM, in-situ moisture conservation practices, such as field bunds for fodder crops and ridges and furrows for cotton, help conserve rainwater within the watershed. Any runoff generated beyond these conservation measures flows to the inlet of the RWH pond.
The cost of constructing the RWH pond included expenses for excavation, random rubble masonry lining, and the provision of inlet and outlet structures. A detailed cost of construction of the RWH pond is presented in Table 5, highlighting the key components and their respective expenditures.
Table 5.
Cost of construction of RWH pond.
3.6. Observed Runoff
Runoff from the micro-watershed area enters the pond, with adjustments for soil infiltration, interception, and natural depressions. Throughout the rainy season, the pond’s water level rises incrementally with each rainfall event, allowing runoff volume to be assessed based on these observed runoff increases. The analysis of observed runoff into the pond includes the number of runoff-producing rainfall events, seasonal rainfall, and the resulting rainfall–runoff relationship and runoff coefficient calculated for the years 2011 to 2023.
The details of rainfall, rainy days, and deviation from normal rainfall (%) for annual and NEM series from 2011 to 2023 is presented in Table 6. During this period, six years experienced excessive annual rainfall, ranging from 6.69% to 59.29% deviations above the normal rainfall, while seven years saw excessive seasonal rainfall, with deviations ranging from 5.99% to 75.52% above normal. In contrast, seven years recorded deficit annual rainfall, with the highest deficit reaching 72.96%. Notably, in 2016, only 80.2 mm of NEM rainfall was recorded, which was 79.83% below the normal rainfall and was a drought year.
Table 6.
Rainfall details for annual and NEM series from 2011 to 2023.
The rainfall patterns directly impact the runoff generated from the micro-watershed area which flows into the pond. Table 7 provides the estimated and observed runoff data for the period from 2011 to 2023. Figure 9 illustrates the runoff causing rainfall–observed runoff relationship for the period 2011–2023.
Table 7.
Estimated and observed runoff for the period from 2011 to 2023.
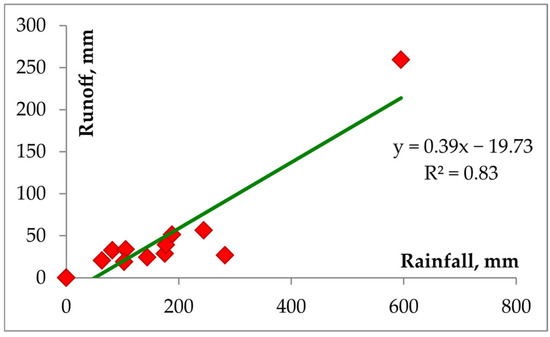
Figure 9.
Rainfall–observed runoff relationship for the period 2011–2023.
The actual storage capacity of the RWH pond was 487.5 m3. Table 7 shows that the seasonal average runoff recorded was 455 m3, with the maximum runoff amount of 2594 m3 recorded in 2023. This runoff was associated with a seasonal NEM rainfall of 693.9 mm, marking a wet year with rainfall 74.52% above the long-term average. The lowest runoff volume of 188 m3 was recorded in 2015, despite an evenly distributed seasonal rainfall of 476.1 mm, which was 19.67% above the seasonal average. In 2011 and 2021, the runoff volume almost reached the pond’s full capacity, while, in 2022, the pond was nearly 80% full. During 2012 and 2013, the pond averaged 68% of its storage capacity, and in 2014, 2017, 2019, and 2020, the pond was filled to about 50% of its capacity. In two years (2016 and 2018), no runoff water was harvested into the pond. Over the years, it has been observed that the pond typically fills only once during a normal rainfall year. In rare instances, such as in wet years like 2023, the pond has filled more than once, achieving its highest runoff volume of 2594 m3. However, in years with low or poorly distributed runoff such as 2016 and 2018, the pond remained unutilized. Despite the pond’s seasonal average runoff being close to its capacity, it typically fills only once in normal rainfall years. Variability in rainfall distribution significantly affects water harvesting, as seen in 2015, where above average rainfall generated the lowest runoff volume.
Excluding extreme rainfall occurrences between 2011 and 2023, the minimum runoff-causing seasonal rainfall was 63.6 mm (NEM = 301.2 mm), producing a runoff volume of 204 m3. The maximum runoff recorded was 487.5 m3, generated by a seasonal rainfall of 188.3 mm (NEM = 532.3 mm). Based on the rainfall–runoff relationship, the runoff coefficient for observed and estimated runoff was 0.22 and 0.18.
The rainfall–observed runoff relationship was established using Equation (6), with a maximum regression coefficient (R2) value of 0.83 (Figure 9).
In this equation, represents the runoff-producing seasonal rainfall in mm, and represents the seasonal runoff in mm. Based on the rainfall–runoff relationship, the runoff coefficient for the observed runoff was 0.22. The graph shows a strong positive correlation (R2 = 0.83) between rainfall and runoff, with runoff generation starting after a threshold rainfall (~50 mm). Higher rainfall generally results in higher runoff, with occasional variability due to external factors. This equation can be used to calculate the expected runoff for a predicted seasonal rainfall, enabling farmers to plan crops and provide supplemental irrigation if additional soil moisture is needed.
The RWH pond used in this study was designed to collect runoff from a 1.0 ha agricultural watershed area, with a storage capacity of 487.5 m3, sufficient to capture the runoff generated. The pond was designed based on the assumption of a single filling per monsoon season, aligning its size with the watershed’s runoff potential and required storage volume. In rare cases, such as in 2023, the maximum expected runoff from the watershed may exceed the pond’s capacity, allowing for occasional overflow. However, this is uncommon, and the designed capacity of 487.5 m3 is typically adequate for storing the generated runoff. Equation (6), developed using observed runoff data over 13 years (2011–2023), confirms that a pond volume of 487.5 m3 with dimensions of 25 × 13 × 1.5 m with a single filling per season is well-suited for a 1 ha micro-watershed area in the semi-arid vertisol regions of Tamil Nadu. Therefore, the existing size of pond has justified this concept of micro-watershed area with storage volume.
3.7. Comparison of Estimated and Observed Runoff
To evaluate the accuracy of the estimated runoff values compared with the observed values, statistical measures such as mean absolute error (MAE), root mean square error (RMSE), relative absolute error (RAE), and correlation coefficient (r) were used. The MAE and RMSE values suggest that the SCS-CN model’s estimates are reasonably close to the observed data. The RAE value being less than 1 indicates a good match with observed runoff values. Additionally, the high correlation coefficient (r = 0.8725) shows a strong relationship between estimated and observed runoff values. A scatter plot of these values, shown in Figure 10, displays a high coefficient of determination (R2 = 0.81) indicating a strong alignment between estimated and observed runoff. The relatively high MAE, RMSE, and RAE values are due to the SCS-CN model’s simplified assumptions, which do not fully account for spatial variability in soil, land use, and infiltration. MAE and RMSE are influenced by errors in individual events, especially extremes, while RAE reflects cumulative deviations from observed values. These are typical in applying generalized models to complex heterogeneous field conditions. These findings suggest that the CN method is effective for estimating runoff and can be positively used in designing pond storage volume. Maheshwarababu et al. and Sarkar et al. applied the SCS-CN method to estimate runoff from small watersheds, reporting a strong agreement between predicted and observed runoff values [42,52].
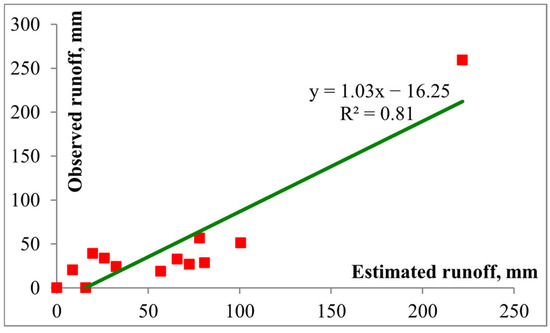
Figure 10.
Scatter plot of estimated and observed runoff data from 2011 to 2023.
3.8. Reuse of Harvested Rainwater for Enhancing Water Productivity
This study presents results from an experiment conducted between 2011 and 2023 to assess the efficient use of harvested rainwater applied through micro-irrigation equipment (rain gun) in comparison with a purely rainfed crop during the rabi season. The runoff water that was stored within the RWH pond was utilized to provide SI to a designated area of 0.4 ha during the water-stressed phases of the crop. To facilitate SI, a 5 HP diesel engine with a sprinkler irrigation system fixed with a high-volume rain gun was utilized. The pond’s stored water was harnessed for irrigation purposes when dry spells persisted for over 7 days during the active growth stages of the crop.
A dry spell is referred to as a period of more than five days without rainfall, leading to a soil water deficit that can cause crop water stress [33,53]. Table 8 provides details of the dry spells that occurred during the study period from 2011 to 2023. SI was provided to cotton when a dry spell occurred, resulting in a soil moisture deficit for the crop. In 2011, a dry spell occurred during the first standard meteorological week (SMW) at the boll formation stage. In 2013, a dry spell was recorded from the 43rd to 46th SMW during the vegetative stage. In 2017, a dry spell took place from the 50th to 52nd SMW, impacting the crop from the vegetative to flowering stage. In 2020, a dry spell occurred in the first SMW, again during the boll formation stage. Finally in 2023, a prolonged dry spell from the first to the third SMW affected the boll formation to bursting stage. Although the remaining excess and normal years also experienced some dry spells, SI was not required as sufficient moisture was retained in the soil or rainwater was not available in the pond.
Table 8.
Details of the dry spells occurring from 2011 to 2023 for cotton.
3.8.1. Water Balance Analysis of RWH Pond
The detailed water balance analysis of the RWH pond is provided in Table 9. During the season, runoff was directed into the pond by 4–5 major rainfall events. The last runoff-causing rainfall events for the years when SI was applied occurred on 27-11-2011, 22-10-2013, 08-12-2017, 19-11-2020, and 18-12-2023. Following these events, SI was provided during critical crop growth stages subject to the water availability in the pond. In 2011, 200 m3 of SI was applied on 02-01-2012 and 07-02-2012, covering the boll formation to bursting stage. In 2013, 176 m3 was provided on 25-10-2013 and 11-11-2013 during the vegetative stage. In 2017, 100 m3 was applied on 27-12-2017 at the flowering stage. In 2020, 200 m3 was provided on 18-01-2020 during the boll formation stage, and, in 2023, 200 m3 was given on 24-01-2024, again covering the boll formation to bursting stage.
Table 9.
Water balance analysis of RWH pond.
Between the first runoff event and the time of SI, continuous water losses occurred primarily through evaporation, at a rate of 4–10 cm day−1, and seepage, estimated based on changes in water level, and evaporation accounting for 2 mm day−1. Seepage losses were found to range from 10.3 to 28.7% of total water storage. In some years, water was available at the end of the season or the crop period, or after the application of SI. In 2016 and 2018, no runoff water was collected in the pond. In the years when SI was not applied, the pond still received runoff, with the storage volume percentages being 67% in 2012, 44% in 2014, 53% in 2019, 98% in 2021, and 80% in 2022. Further details are discussed in the chapter on the impact of SI on cotton yield and WUE.
3.8.2. Soil Water Content at Different Depths During Crop Period
Ensuring a good yield in rainfed cotton relies on maintaining an adequate soil water content (SWC) in the soil profile from the crop establishment to maturity stage. Monitoring SWC at the root zone depth throughout the crop’s growth period provides valuable insights into the timing of SI. During the kharif season, the land use pattern involves green manuring and compartmental bunding is implemented to conserve moisture. This practice depends on the seasonal rainfall received during the southwest monsoon. As a result, residual moisture is typically available at the end of the season, extending into the subsoil profiles.
SWC at different growth stages and soil depths for rainfed cotton is presented in Table 10. SWC varies in response to fluctuating rainfall levels, with the sampling depth significantly influencing observed moisture content. The main characteristic of vertisols in relation to soil depth, is that they retain more SWC in the soil profile. As evaporation occurs, the topsoil water content is depleted first, followed by the subsoil water content. The surface layers, especially up to 15 cm depth, experienced greater water loss due to higher evaporation rates from the exposed surface. In contrast, higher moisture content was observed at the 30–45 cm depth compared with the 15–30 cm depth. The details of SWC in response to SI are discussed in the chapter on the impact of SI on cotton yield. In certain years, such as 2015, 2019, 2021, and 2022, ample moisture was retained in the subsoil, making SI unnecessary. In 2012 and 2014, rainfall deficits led to insufficient soil moisture levels. In 2016, soil moisture levels reached the permanent wilting point. During 2016 and 2018, rainfall distribution during NEM was below normal, resulting in insufficient soil moisture retention to meet the crop’s needs. In all years, moisture levels were deficient during the maturity stage of cotton. Harvested rainwater can be effectively utilized through micro-irrigation systems, provided sufficient water is available in the pond. Otherwise, a reduction in yield is inevitable.
Table 10.
Vertical distribution pattern of soil water content for different crop growth stages.
3.8.3. Impact of Supplemental Irrigation on Cotton Yield
The details of application of SI on cotton, including crop stages, number of irrigations, depth of irrigation (mm), treatment-wise yield (kg ha−1), and the percentage increase in yield of cotton receiving SI over purely rainfed cotton are presented in Table 11. Due to the nature of vertisols, higher soil water content was retained in the soil profile compared with the surface layer during dry spells, particularly when the dry period extended beyond two weeks. SI was applied to crops experiencing soil moisture stress at critical growth stages. The number and amount of SIs were determined based on the length of the dry spell (Table 8), the availability of harvested water in the pond (Table 9), and the soil water content (Table 10).
Table 11.
Impact of supplemental irrigation on cotton production.
During the study period (2011 to 2023), SI was provided for cotton using a rain gun-type of micro-irrigation system in five years, viz., 2011, 2013, 2017, 2020, and 2023. Cotton crops showed positive responses to SI in these years. In 2011, 2020, and 2023, SI was applied at a depth of 50 mm during the boll formation to bursting stage. In 2013, SI was applied at a depth of 44 mm during the vegetative stage. In 2017, SI was applied at a depth of 25 mm during the flowering stage. After application of SI, soil water content (SWC) increased at depths of 0–15 cm and 15–30 cm, ranging from 15.5% to 32.4% and 10.3% to 38.1%, respectively (Table 11). SI increased SWC in the upper soil layers compared with the 15–30 cm depth, consistent with observations by Dai et al. [54]. The ridge–furrow method, one of the most effective in-situ moisture conservation practices, was followed in the cultivable areas where cotton was grown. Runoff water was channelled into RWH pond after ensuring sufficient water retention within the field.
Applying SI with harvested rainwater during moisture-stress periods at different growth stages significantly increased cotton yield across years with yield gains ranging from 3.8% to 25.8% compared with purely rainfed crops. The integrated use of rainwater stored in ridges and furrows, combined with harvested rainwater for SI, resulted in higher cotton yield per unit of water compared with the use of rainwater alone.
SI was not applied in the remaining years due to one or more of the following reasons: (i) rainfall deficits, (ii) unavailability of harvested water, or (iii) no need for SI. The years 2015, 2019, and 2021 experienced excess rainfall, while 2012, 2016, 2018, and 2022 were deficit years. In 2012, there was a deficit of −42.6% in NEM rainfall. A single rainfall event during the year filled the pond to 67% of its capacity, and stored water was available until the 2nd week of November (45th week). However, due to insufficient rainfall and soil moisture for the remaining crop season, a poor yield of 195 kg ha−1 was recorded. In 2014, the pond received runoff equivalent to 42% of its storage capacity, despite a −24.3% NEM rainfall deficit. During this period, cotton was not cultivated. In 2016, a NEM rainfall deficit of −79.8%, the lowest recorded between 1974 and 2023, resulted in insufficient runoff into the pond. Due to this insufficient rainfall, the cotton crop failed. In 2018, the NEM rainfall deficit of −46.2% led to the pond receiving no runoff water. However, during this season, cotton survived on rainwater with a recorded yield of 674 kg ha−1, reflecting a −30.3% reduction compared with the average yield. Uneven rainfall distribution during the monsoon season was a significant factor affecting crop yield.
In 2015, 2019, and 2021, the yield for pure rainfed cotton crop was recorded as 940, 938, and 912 kg ha−1, respectively. During these years, surplus monsoon rainfall ensured sufficient soil water retention throughout all crop stages, eliminating the need for SI. In rabi 2015, despite a 19.7% excess rainfall during the NEM season, runoff collection in the RWH pond was only 38% of its capacity due to low runoff-producing events. Frequent well-distributed light rains throughout the crop period were sufficient, eliminating the need for SI. In rabi 2019, runoff collection reached 53% of capacity as the well-distributed NEM rainfall of 426.4 mm over 28 rainy days (7.24% excess) prevented moisture stress throughout the crop growth period. Similarly, in rabi 2021, the pond reached full capacity due to a 33.9% excess NEM rainfall in 29 rainy days, ensuring adequate soil water content and alleviating crop moisture stress. In 2022, the pond received 80% of its storage capacity from three runoff-causing rainfall events, despite a recorded rainfall deficit of −20%. During this period, cotton yield reached 832 kg ha−1, supported solely by rainwater, as adequate soil moisture was retained thus eliminating the need for supplementary irrigation (SI). The results show that the application of SI from the RWH pond during the maturity and boll formation stages is highly effective in enhancing cotton yield. This underscores the critical role of SI during key growth stages ensuring optimal water availability to maximize crop productivity and resilience.
3.8.4. Impact of Supplement Irrigation on Rainwater Use Efficiency and Economics
The main focus of rainfed crop production at the farm level is to maximize the efficient use of rainwater. This is assessed by the production of economic biomass in relation to the available rainwater, typically expressed as a higher crop yield per unit of rainfall or harvested water (including both rainfall and harvested runoff). Combining in-situ MCP (ridge–furrow method), which enhances soil infiltration and water retention, with ex-situ RWH pond for SI can improve rainwater utilization and, in turn, increase crop production.
The impact of SI on rainwater use efficiency is presented in Table 12. The total rainwater utilized due to the ridge–furrow method of MCP and the total depth of SI from harvested runoff is also provided in Table 11. The RWUE is calculated across different years, highlighting that rainfed crops receiving SI exhibit a slightly higher RWUE compared with crops under purely rainfed conditions. Specifically, purely rainfed cotton displayed an RWUE ranging from 1.43 to 3.13 kg ha−1mm−1. However, adding SI to purely rainfed cotton further raised RWUE, ranging from 1.52 to 3.13 kg ha−1mm−1. In 2013, for instance, SI was applied at a depth of 44 mm during the vegetative stage of cotton, and yield differences between treatments were minimal, resulting in a similar impact on RWUE. Sharma et al. estimated RWUE (kg ha−1mm−1) for various crops under both traditional practices and improved technologies in India’s primary rainfed crop districts [50]. This estimation was based on long-term on-farm data from the national rainfed agriculture network. For cotton, estimated RWUE was 0.38 kg ha−1mm−1 (ranging from 0.17 to 1.52) under traditional practices and 1.60 kg ha−1mm−1 (ranging from 1.23 to 1.97) under improved technologies. The present findings are consistent with results reported in the AICRPDA, 2011–2021 [55].
Table 12.
Impact of supplemental irrigation on rainwater use efficiency and economics of cotton production.
Table 12 presents the impact of SI on economic returns, measured as benefit-cost (B-C) ratios. The data indicate that cotton crops receiving SI exhibited significantly higher B-C ratios compared with purely rainfed cotton. Specifically, cotton receiving SI had B-C ratios ranging from 1.15 to 2.43 while purely rainfed cotton showed B-C ratios from 1.13 to 2.16. Overall, crops with SI generated higher income than purely rainfed crops.
This research focuses on designing a water harvesting pond for an agricultural watershed to promote the effective reuse of stored water, mitigate dry spells for rainfed crops, and reduce yield losses. The RWH pond was designed to store runoff from a 1 ha micro-watershed area in a pond with a capacity of 487.5 m3. The stored water can be used as SI to rainfed cotton crop at an irrigation depth of 50 mm for a cultivable area of 0.4 ha. These results align with previous studies of Patode et al., who found that, in vertisols with an average regional rainfall of 817 mm, a catchment–storage–command relationship was observed, where rainwater harvested from a 5 ha catchment area and stored in a farm pond with a capacity of 2014.8 m3 could irrigate approximately 4 ha primarily for crops like cotton and soybean [56]. Narsimlu et al. developed a catchment–storage–command area relationship for the semi-arid tropical region of Rajasthan, India, under a diversified farming system [33]. Their study revealed that rainwater harvested from a 2 ha agricultural micro-watershed could be stored in RWH structure, such as a farm pond, with a capacity of 560 m3 providing an irrigation supply of 5 cm to a command area of 1 ha.
There is significant potential for harvesting excess runoff in rainfed regions across various states in the country [16]. Research has shown that collecting on-farm runoff in dugout farm ponds and using SI can enhance and stabilize crop production [13]. Applying SI during critical crop growth stages has significantly increased grain yield [50]. Vora et al. stated that farm pond technology is effective in improving crop productivity in the Bhal region of Gujarat [57]. Pendke et al. observed that providing one SI using sprinkler from farm pond to crop during the critical growth stage in the rabi season, resulted in a 57% increase in yield [58]. An impact analysis of farm ponds in Adilabad (Telangana), and Anantapur and Chittoordistricts (Andhra Pradesh), India, highlighted substantial yield increases in crops like sorghum, groundnut, and soybean in Adilabad District following the adoption of farm pond technology. In Anantapur, groundnut yield increased by 25.4% due to additional irrigation from farm ponds. Similarly, in the Punganur Mandal of Chittoor District, crops such as cotton, bajra, chilli, and maize showed improved yields due to farm pond construction [6]. These findings are consistent with the results observed in the present study. The increased productivity resulting from supplemental irrigation (SI) can lead to higher incomes, which farmers can reinvest beneficially by purchasing livestock or modern equipment [59,60].
The main challenges in RWH ponds are minimizing evaporation and seepage losses [33] to ensure that stored water is retained for extended periods and can be reused during dry spells if needed. Although concrete lining, as used in our study, can help reduce these losses, the high cost of such a lining remains a limiting factor. Using HDPE polythene lining for ponds, as suggested by Narsimlu et al., provides a more economical alternative to cement, brick, and concrete linings, making efficient water use more affordable [61]. Munyasya et al. reported that integrating on-site and off-site RWH systems significantly enhances rainfed maize production, offering a more resilient adaptation strategy to climate change [62].
Rainfed crops are generally grown using rainwater alone or alongside in-situ MCP. In vertisols, the subsoil profiles (up to a depth of 45 cm) retain more soil water than the surface layer (up to 15 cm). Under these conditions, rainfed crops can survive if a dry spell lasts not more than 15 days. However, if a dry spell extends for longer, soil moisture stress occurs, and SI from a pond can alleviate this stress. The combined use of rainwater through in-situ MCP (ridges and furrows) and SI as an ex-situ method (water harvesting pond) has not only boosted crop production but also improved RWUE, enhancing water utilization in rainfed agriculture. Anantha et al. reviewed that combining in-situ and ex-situ interventions offers considerable potential to strengthen the resilience of smallholder farming systems, supporting faster advancement toward the United Nations sustainable development goals [12]. Harvesting rainwater in ponds and applying it as SI through modern micro-irrigation equipment has proven to be an economically viable solution at the farm level for resource-poor rainfed farmers. This approach is especially beneficial for rainfed crops such as cotton, maize, pulses, minor millets, and oilseeds.
4. Conclusions
The southern zone of Tamil Nadu, comprising the districts of Virudhunagar, Tirunelveli, Tenkasi, and Thoothukudi, is characterized by medium-depth vertisols and a semi-arid hot dry climate, with cotton as the predominant crop. Major crops in this zone include cotton, millets, pulses, and sunflower. During NEM, rainfed crops such as cotton, maize, sorghum, pulses, and sunflower are cultivated, relying on an average rainfall of about 400 mm. In these regions, where water availability is limited, the primary objective of crop production is to maximize yield per unit of rainwater. This can be achieved by integrating in-situ MCP with ex-situ RWH ponds. This study specifically explored the feasibility of using SI from RWH during moisture stress periods in cotton cultivated in ridge–furrow MCP. To achieve this, the ex-situ RWH pond was designed based on the long-term NEM rainfall. The watershed area–storage volume–cultivable area relationship achieved in this study was 1 ha–487.5 m3–0.4 ha. The observed runoff from the RWH pond with a capacity of 487.5 m3 was validated against the estimated runoff from 2011 to 2023 with statistical measures. Based on the rainfall–runoff relationship, the runoff coefficients for the observed and estimated runoff were 0.22 and 0.18, respectively. Statistical comparison of observed and estimated runoff data from 2011 to 2023 revealed a strong correlation (r = 0.87), confirming the pond design. Harvested rainwater was applied to cotton through micro-irrigation at critical growth stages during moisture stress by dry spell, including vegetative, flowering, and boll formation, leading to significant yield increase, higher RWUE, and higher benefit-cost ratio. This study proves the effectiveness of the practical method of pond design, determination of cultivable area size based on runoff harvested from the watershed, and the adoption of SI. Hence it can be concluded that the integration of in-situ MCP (ridge–furrow) along with ex-situ RWH and SI significantly enhances crop productivity in rainfed ecosystems, particularly within agricultural micro-watersheds. This integrated approach recommends a practical adaptation strategy for farmers facing the challenges of climate change and erratic rainfall, ensuring water availability during dry spells, reducing the risk of crop failure, and contributing to food security.
Author Contributions
Conceptualization: M.M., B.B.S., B.N., J.V.N.S.P., G.R.C., K.V.R. and R.R.; Methodology: B.N., J.V.N.S.P., G.R.C., K.V.R. and R.R.; Software: M.M., K.B., V.S., S.M. and G.G.; Validation: M.M., V.S. and S.M.; Data analysis: M.M., B.B.S., B.N., K.B. and G.G.; Investigation: M.M., B.B.S. and B.N.; Resources: M.M., B.B.S. and K.B.; Data curation: M.M., B.B.S. and B.N.; Manuscript writing—original draft preparation: M.M., B.B.S. and B.N.; Writing—review and editing: K.B., V.S., S.M. and G.G.; Visualization: M.M., B.B.S. and B.N.; Supervision: B.N., J.V.N.S.P., G.R.C., K.V.R., R.R. and V.K.S.; Project administration: B.B.S., K.B. B.N., J.V.N.S.P., G.R.C., K.V.R. and V.K.S.; Funding acquisition: B.B.S., K.B. B.N., J.V.N.S.P., G.R.C., K.V.R. and V.K.S. All authors have read and agreed to the published version of the manuscript.
Funding
This study was funded by the Indian Council of Agricultural Research, New Delhi, India, through AICRPDA, ICAR-CRIDA, Hyderabad, India.
Data Availability Statement
Data will be made available on request.
Acknowledgments
The authors fully acknowledge the financial help received from ICAR, New Delhi through ACRPDA, ICAR-CRIDA Hyderabad. Research was supported by the Indian Council of Agricultural Research (ICAR), Department of Agricultural Education and Research, Government of India, New Delhi. The authors also acknowledge Tamil Nadu Agricultural University, Coimbatore, Tamil Nadu for carrying out this research at Agricultural Research Station, Kovilpatti, Toothukudi district, Tamil Nadu, India.
Conflicts of Interest
The authors declare no conflicts of interest.
Abbreviations
The following abbreviations are used in this manuscript:
| SI | Supplemental Irrigation |
| RWH | Rainwater Harvesting |
| ha | Hectares |
| NEM | Northeast Monsoon |
| SWM | Southwest Monsoon |
| MCP | Moisture Conservation Practice |
| SCS-CN | Soil Conservation Service Curve Number |
| AMC | Antecedent Moisture Condition |
| CV | Coefficient of Variation |
| LSD | Least Significant Difference |
| RWUE | Rainwater Use Efficiency |
| SWC | Soil Water Content |
| B-C | Benefit–Cost |
| MAE | Mean Absolute Error |
| RMSE | Root Mean Square Error |
| RAE | Relative Absolute Error |
| RCRF | Runoff Causing Rainfall |
| RO | Runoff |
| RC | Runoff Coefficient |
| INR | Indian Rupee |
References
- Sharma, B.R.; Rao, K.V.; Vittal, K.P.R.; Upali, A.A. Realizing the Potential of Rainfed Agriculture in India. IWMI Report 2006. Available online: http://nrlp.iwmi.org/PDocs/DReports/Phase_01/11%20Potential%20of%20Rainfed%20Agriculture%20-%20Sharma%20et%20al.pdf (accessed on 3 November 2024).
- Molden, D.; Vithanage, M.; de Fraiture, C.; Faures, J.M.; Gordon, L.; Molle, F.; Peden, D. Water Availability and Its Use in Agriculture. Treatise Water Sci. 2011, 4, 707–732. [Google Scholar] [CrossRef]
- Food and Agriculture Organization of the United Nations. The State of the World’s Land and Water Resources for Food and Agriculture (SOLAW)—Managing Systems at Risk; Food and Agriculture Organization of the United Nations: Rome, Italy, 2011. [Google Scholar]
- Rockström, J.; Karlberg, L.; Wani, S.P.; Barron, J.; Hatibu, N.; Oweis, T.; Bruggeman, A.; Farahani, J.; Qiang, Z. Managing Water in Rainfed Agriculture—The Need for a Paradigm Shift. Agric. Water Manag. 2010, 97, 543–550. [Google Scholar] [CrossRef]
- Sharma, K.D. Rain-fed Agriculture Could Meet the Challenges of Food Security in India. Curr. Sci. 2011, 100, 1615–1616. [Google Scholar]
- Rao, C.S.; Rejani, R.; Rama Rao, C.A.; Rao, K.V.; Osman, M.; Reddy, K.S.; Kumar, M.; Kumar, P. Farm Ponds for Climate-Resilient Rainfed Agriculture. Curr. Sci. 2017, 112, 471–477. [Google Scholar] [CrossRef]
- Lal, R. Managing Soil Water to Improve Rainfed Agriculture in India. J. Sustain. Agric. 2008, 32, 51–75. [Google Scholar] [CrossRef]
- Rockström, J.; Falkenmark, M. Semi-Arid Crop Production from a Hydrological Perspective—Gap Between Potential and Actual Yields. Crit. Rev. Plant Sci. 2000, 19, 319–346. [Google Scholar] [CrossRef]
- Rockström, J. Green Water Security for the Food Makers of Tomorrow: Windows of Opportunity in Drought-prone Savannahs. Water Sci. Technol. 2001, 43, 71–78. [Google Scholar] [CrossRef]
- Oweis, T.; Hachum, A. Reducing Peak Supplemental Irrigation Demand by Extending Sowing Dates. Agric. Water Manag. 2001, 50, 109–123. [Google Scholar] [CrossRef]
- Ghosh, P.K.; Wani, S.P.; Sreedevi, T.K.; Singh, H.P.; Pathak, P. Impact of Integrated Watershed Management Programs on Productivity and Sustainability of Rainfed Agriculture: Experiences from India. In Rainfed Agriculture: Unlocking the Potential; Wani, S.P., Rockström, J., Oweis, T., Eds.; CAB International: Oxfordshire, UK, 2010; pp. 117–146. [Google Scholar]
- Anantha, K.H.; Garg, K.K.; Barron, J.; Dixit, S.; Venkataradha, A.; Singh, R.; Whitbread, A.M. Impact of Best Management Practices on Sustainable Crop Production and Climate Resilience in Smallholder Farming Systems of South Asia. Agric. Syst. 2021, 194, 103276. [Google Scholar] [CrossRef]
- Krishna, J.H.; Arkin, G.F.; Martin, J.R. Runoff Impoundment for Supplemental Irrigation in Texas. Water Resour. Bull. 1987, 23, 1057–1061. [Google Scholar] [CrossRef]
- Reddy, K.S.; Kumar, M.; Rao, K.V.; Maruthi, V.; Reddy, B.M.K.; Umesh, B.; Babu, R.G.; Reddy, K.S.; Vijayalakshmi; Venkateswarlu, B. Farm Ponds: A Climate Resilient Technology for Rainfed Agriculture; Central Research Institute for Dryland Agriculture: Hyderabad, India, 2012. [Google Scholar]
- Adhikari, R.N.; Mishra, P.K.; Muralidhar, W. Dugout Farm Pond—A Potential Source of Water Harvesting in Deep Black Soils in the Deccan Plateau Region. In National Workshop Cum Brain Storming on Rainwater Harvesting and Reuse Through Farm Ponds; Rao, K.V., Venkateswarlu, B., Sahrawath, K.L., Wani, S.P., Mishra, P.K., Dixit, S., Reddy, K.S., Kumar, M., Saikia, U.S., Eds.; ICAR-CRIDA and ICRISAT: Hyderabad, India, 2010. [Google Scholar]
- Wani, S.P.; Pathak, P.; Sreedevi, T.K.; Singh, H.P.; Singh, P. Efficient Management of Rainwater for Increased Crop Productivity and Groundwater Recharge in Asia. In Water Productivity in Agriculture: Limits and Opportunities for Improvement; Kijne, J.W., Barker, R., Molden, D., Eds.; CABI: Wallingford, UK, 2003; pp. 199–215. [Google Scholar]
- Oweis, T.; Zhang, H.; Pala, M. Water Use Efficiency of Rainfed and Irrigated Bread Wheat in a Mediterranean Environment. Agron. J. 2000, 92, 231–238. [Google Scholar] [CrossRef]
- Wang, D. Water Use Efficiency and Optimal Supplemental Irrigation in a High-Yield Wheat Field. Field Crops Res. 2017, 213, 213–220. [Google Scholar] [CrossRef]
- Nangia, V.; Oweis, T. Supplemental Irrigation: A Promising Climate-Resilience Practice for Sustainable Dryland Agriculture. In Innovations in Dryland Agriculture; Farooq, M., Siddique, K., Eds.; Springer: Cham, Switzerland, 2016; pp. 549–564. [Google Scholar]
- Oweis, T.; Pala, M.; Ryan, J. Stabilizing Rain-Fed Wheat Yields with Supplemental Irrigation and Nitrogen in a Mediterranean-Type Climate. Agron. J. 1998, 90, 672–681. [Google Scholar] [CrossRef]
- Zhang, H.; Oweis, T. Water-Yield Relations and Optimal Irrigation Scheduling of Wheat in the Mediterranean Region. Agric. Water Manag. 1999, 38, 195–211. [Google Scholar] [CrossRef]
- Oweis, T.; Hachum, A. Water Harvesting and Supplemental Irrigation for Improved Water Productivity of Dry Farming Systems in West Asia and North Africa. Agric. Water Manag. 2006, 80, 57–73. [Google Scholar] [CrossRef]
- Pathak, P.; Sahrawat, K.L.; Wani, S.P.; Sahan, R.C.; Sudi, R. Opportunities for Water Harvesting and Supplemental Irrigation for Improving Rainfed Agriculture in Semi-Arid Areas. In Rainfed Agriculture: Unlocking the Potential; Wani, S.P., Rockström, J., Oweis, T., Eds.; CABI: Wallingford, UK, 2009; pp. 197–221. [Google Scholar]
- Panigrahi, B.; Panda, S.N.; Mull, R. Simulation of Water Harvesting Potential in RainfedRicelands Using Water Balance Model. Agric. Syst. 2001, 69, 165–182. [Google Scholar] [CrossRef]
- Pandey, P.K.; Panda, S.N.; Panigrahi, B. Sizing On-Farm Reservoirs for Crop-Fish Integration in Rainfed Farming Systems in Eastern India. Biosyst. Eng. 2006, 93, 475–489. [Google Scholar] [CrossRef]
- Wani, S.P.; Joshi, P.K.; Raju, K.V.; Sreedevi, T.K.; Wilson, M.; Shah, A.; Diwakar, P.G.; Palanisami, K.; Marimuthu, S.; Ramakrishna, Y.S.; et al. Community Watershed as a Growth Engine for Development of Dryland Areas—Executive Summary: A Comprehensive Assessment of Watershed Programmes in India; ICRISAT: Patancheru, India, 2008. [Google Scholar]
- Panigrahi, B.; Panda, S.N.; Agrawal, A. Water Balance Simulation and Economic Analysis for Optimal Size of On-farm Reservoir. Water Resour. Manag. 2005, 19, 233–250. [Google Scholar] [CrossRef]
- Ilbeyi, A.; Ustun, H.; Oweis, T.; Pala, M.; Benli, B. Wheat Water Productivity in a Cool Highland Environment: Effect of Early Sowing with Supplemental Irrigation. Agric. Water Manag. 2006, 82, 399–410. [Google Scholar] [CrossRef]
- Osman, M.; Sreenivasulu, R.; Prasad, L.K.; Rao, K.V.; Panda, A.R.; Haffis, S. Economic Evaluation of Lined Farm Pond for Supplemental Irrigation to FCV Tobacco in Southern Andhra Pradesh. Indian J. Dryland Agric. Res. Dev. 2013, 28, 38–42. [Google Scholar]
- Oweis, T.; Hachum, A. Optimizing Supplemental Irrigation: Tradeoffs Between Profitability and Sustainability. Agric. Water Manag. 2009, 96, 511–516. [Google Scholar] [CrossRef]
- Oweis, T.; Hachum, A. Supplemental Irrigation—A Highly Efficient Water-Use Practice; ICARDA: Aleppo, Syria, 2012. [Google Scholar]
- Gebremedhin, T.; Haile, G.G.; Gebremicael, T.G.; Libsekal, H.; Reda, K.W. Balancing Crop Water Requirements through Supplemental Irrigation under Rainfed Agriculture in a Semi-Arid Environment. Heliyon 2023, 9, e18727. [Google Scholar] [CrossRef]
- Narsimlu, B.; Prasad, J.V.N.S.; Reddy, A.A.; Chary, G.R.; Gopinath, K.A.; Sridhar, K.B.; Balyan, J.K.; Kothari, A.K.; Singh, V.K. Catchment Storage Command Relationship for Sustainable Rainfed Agriculture in the Semi-Arid Regions of Rajasthan, India. Sustainability 2024, 16, 3996. [Google Scholar] [CrossRef]
- ICAR (Indian Council of Agricultural Research). Cotton Research and Development in India; ICAR: New Delhi, India, 2018. [Google Scholar]
- Shirahatti, M.S.; Patode, R.S.; Yousuf, A.; Narsimlu, B.; Halidoddi, R.R.; Sonowal, A.; Rejani, R. Farm Pond: Resilient Technology for Higher Productivity in Rainfed Farming. Indian Farming 2022, 72, 12–15. Available online: https://epubs.icar.org.in/index.php/IndFarm/article/view/131369 (accessed on 25 November 2024).
- AICRPDA (All India Coordinated Research Project for Dryland Agriculture, Kovilpatti). All India Coordinated Research Project for Dryland Agriculture Reports; ICAR—Agricultural Research Station: Hyderabad, India; Tamil Nadu Agricultural University, Kovilpatti Main Centre: Tamil Nadu, India, 2021. [Google Scholar]
- Rangaswamy, R. A Textbook of Agricultural Statistics, 1st ed.; New Age International Publishers: New Delhi, India, 1995. [Google Scholar]
- Chow, V.T. Handbook of Applied Hydrology; McGraw-Hill Book Company: New York, NY, USA, 1964. [Google Scholar]
- Bhakar, S.R.; Iqbal, M.; Devanda, M.; Chhajed, N.; Bansal, A.K. Probability Analysis of Rainfall at Kota. Indian J. Agric. Res. 2008, 42, 201–206. [Google Scholar]
- USDA, Soil Conservation Service. Hydrology, Section 4, National Engineering Handbook, Revised ed.; USDA: Washington, DC, USA, 1964. [Google Scholar]
- USDA, Natural Resources Conservation Service. Ponds—Planning, Design, Construction, Agric. Handbook 590, Revised ed.; USDA: Washington, DC, USA, 1997. Available online: https://nrcspad.sc.egov.usda.gov/distributioncenter/pdf.aspx?productID=115 (accessed on 5 December 2024).
- Maheshwarababu, B.; Muthuchamy, I.; Shirahatti, S.S. Assessment of Water Resource Potential for Rainwater Harvesting through Farm Ponds in an Agricultural Watershed. Indian J. Dryland Agric. Res. Dev. 2013, 28, 43–47. [Google Scholar]
- Rai, P.; Dubey, A. Design and Construction of Rainwater Harvesting Plastic Lined Pond. Environ. Ecol. 2022, 40, 806–814. [Google Scholar]
- Critchley, W.; Siegert, K.; Chapman, C. Water Harvesting: A Manual Guide for the Design and Construction of Water Harvesting Schemes for Plant Production; Food and Agriculture Organization of the United Nations: Rome, Italy, 1991; Available online: www.fao.org/docrep/u3160e/u3160e07.htm (accessed on 17 November 2024).
- Sharma, K.K.; Mohapatra, B.C.; Das, P.C.; Sarkar, B.; Chand, S. Water Budgets for Freshwater Aquaculture Ponds with Reference to Effluent Volume. Agric. Sci. 2013, 4, 353–359. [Google Scholar] [CrossRef][Green Version]
- Hutchinson, S.L. Water Budgets for Sustainable Water Management. In Introduction to Biosystems Engineering; Holden, N.M., Wolfe, M.L., Ogejo, J.A., Cummins, E.J., Eds.; Virginia Tech Publishing: Blacksburg, VA, USA, 2020. [Google Scholar] [CrossRef]
- CPG (Crop Production Guide); Department of Agriculture, Government of Tamil Nadu: Tamil Nadu, India, 2020.
- Soil Survey Staff. Soil Taxonomy: A Basic System of Soil Classification for Making and Interpreting Soil Surveys, 2nd ed.; USDA, Natural Resources Conservation Service: Denver, CO, USA, 1999. [Google Scholar]
- Gardner, W.H. Water Content. In Methods of Soil Analysis, Part 1: Physical and Mineralogical Methods, 2nd ed.; Klute, A., Ed.; ASA and SSSA: Madison, WI, USA, 1986; pp. 493–544. [Google Scholar]
- Sharma, B.R.; Rao, K.V.; Vittal, K.P.R.; Ramakrishna, Y.S.; Amarasinghe, U. Estimating the Potential of Rainfed Agriculture in India: Prospects for Water Productivity Improvements. Agric. Water Manag. 2010, 97, 23–30. [Google Scholar] [CrossRef]
- Kulkarni, A.; Pendke, M.S.; Gourkhede, P.; Bhuibhar, B. Runoff Potential-Based Farm Pond Designs for Latur Division of Maharashtra under Changing Climatic Conditions. Int. J. Curr. Microbiol. App. Sci. 2023, 12, 48–55. [Google Scholar] [CrossRef]
- Sarkar, M.K.; Behera, S.; Panda, R.K.; Chowdary, U.M. Evaluation of Composite and Distributed Curve Number Techniques Using Remote Sensing and GIS. In Proceedings of the International Conference on Emerging Technologies in Agricultural and Food Engineering (ETAE), IIT, Kharagpur, India, 14–17 December 2004; pp. 73–77. [Google Scholar]
- Barron, J.; Rockström, J.; Gichuki, F.; Hatibu, N. Dry Spell Analysis and Maize Yields for Two Semi-Arid Locations in East Africa. Agric. For. Meteorol. 2003, 117, 23–37. [Google Scholar] [CrossRef]
- Dai, Y.; Fan, J.; Liao, Z.; Zhang, C.; Yu, J.; Feng, H.; Zhang, F.; Li, Z. Supplemental Irrigation and Modified Plant Density Improved Photosynthesis, Grain Yield and Water Productivity of Winter Wheat under Ridge-Furrow Mulching. Agric. Water Manag. 2022, 274, 107985. [Google Scholar] [CrossRef]
- AICRPDA (All India Coordinated Research Project for Dryland Agriculture). Annual Reports of AICRP on Dryland Agriculture; Central Research Institute for Dryland Agriculture: Hyderabad, India, 2011. [Google Scholar]
- Patode, R.; Nagdeve, M.; Gabhane, V.V.; Ganvir, M.; Turkhede, A.; Gajjala, R. Relationship of Catchment, Storage Capacity and Command Area for Rainwater Harvesting in the Farm Pond. In Water Management and Water Governance; Springer: Berlin/Heidelberg, Germany, 2020; pp. 449–462. ISBN 978-3-030-58050-6. [Google Scholar]
- Vora, M.D.; Solanki, H.B.; Bhoi, K.L. Farm Pond Technology for Enhancing Crop Productivity in Bhal Area of Gujarat. J. Agric. Eng. 2008, 45, 40–46. [Google Scholar] [CrossRef]
- Pendke, M.S.; Narkhede, W.N.; Gourkhede, P.H. Farm Pond Technology for Crop Productivity Enhancement in Rainfed Ecosystem of Marathwada Region of Maharashtra. Agropedology 2023, 33, 57–62. [Google Scholar] [CrossRef]
- Falkenmark, M.; Patrick, F.; Gunn, P.; Rockström, J. Water Harvesting for Upgrading Rainfed Agriculture: Problem Analysis and Research Needs; Stockholm International Water Institute: Stockholm, Sweden, 2001. [Google Scholar]
- Kumar, S.; Ramilan, T.; Ramarao, C.A.; Rao, C.; Whitbread, A. Farm-Level Rainwater Harvesting across Different Agro-Climatic Regions of India: Assessing Performance and Determinants. Agric. Water Manag. 2016, 176, 55–66. [Google Scholar] [CrossRef]
- Narsimlu, B.; Kishore, N.; Sahadeva Reddy, G.; Chary, R.; Sridhar, K.B.; Gopinath, K.A. Enhancing Water Productivity in the Scarce Rainfall Zone of Andhra Pradesh through Farm Ponds with Seepage Control. In Proceedings of the First International Conference on Reimagining Rainfed Agro-Ecosystems, ICAR-CRIDA, Hyderabad, India, 20–22 December 2022. [Google Scholar]
- Munyasya, A.N.; Koskei, K.; Zhou, R.; Liu, S.T.; Indoshi, S.N.; Wang, W.; Zhang, Z.C.; Cheruiyot, W.K.; Mburu, D.M.; Nyende, A.B.; et al. Integrated On-Site and Off-Site Rainwater-Harvesting System Boosts Rainfed Maize Production for Better Adaptation to Climate Change. Agric. Water Manag. 2022, 269, 107672. [Google Scholar] [CrossRef]
Disclaimer/Publisher’s Note: The statements, opinions and data contained in all publications are solely those of the individual author(s) and contributor(s) and not of MDPI and/or the editor(s). MDPI and/or the editor(s) disclaim responsibility for any injury to people or property resulting from any ideas, methods, instructions or products referred to in the content. |
© 2025 by the authors. Licensee MDPI, Basel, Switzerland. This article is an open access article distributed under the terms and conditions of the Creative Commons Attribution (CC BY) license (https://creativecommons.org/licenses/by/4.0/).