Abstract
Proactive management of groundwater resources is hindered by the static nature of conventional vulnerability assessments, which provide only a single temporal snapshot and lack predictive capability. To address this limitation, we developed a coupled dynamic–spatial modeling framework to forecast the spatio-temporal evolution of groundwater vulnerability. The framework integrates a βSARMA time-series model for precipitation forecasting with an enhanced M-DRASTIC-LAaRd model, which incorporates Land use, Anthropogenic activity, and River network density, weighted via the Analytical Hierarchy Process (AHP) to better capture hydrogeological complexity. The βSARMA model consistently outperformed conventional SARIMA models across the five subregions of Beijing, achieving the lowest RMSE values (0.0832–0.1617) and MAE values (0.0922–0.1372), with an average RMSE reduction of 15.3% relative to the best SARIMA baseline. These results ensure highly reliable dynamic precipitation inputs for the time-varying Net Recharge (R) parameter. Model validation against historical observations yielded a coefficient of determination (R2) of 0.87, confirming the framework’s robustness and predictive accuracy. Applied to the Beijing metropolitan area (1980–2027), the model projects a marked spatial restructuring of groundwater vulnerability: high-vulnerability zones are expected to expand from 38.65% to 46.18%, while low-vulnerability areas will decline from 42.53% to 34.63%. Emerging “hotspots” are concentrated in the southern urban plains, where urbanization and reduced recharge converge. Overall, 27.9% of the region is predicted to experience intensified vulnerability, whereas only 11.5% will show improvement. This study advances groundwater vulnerability assessment from static mapping toward dynamic forecasting, providing a quantitatively validated and spatially explicit framework that supports more informed groundwater management under future environmental change.
1. Introduction
Groundwater constitutes the world’s largest accessible freshwater reserve and plays an indispensable role in sustaining both natural ecosystems and human societies, particularly in arid and semi-arid regions [1,2]. Ensuring its sustainable management has therefore become a global priority, especially for rapidly expanding megacities such as Beijing. Globally, more than two billion people rely on groundwater as their principal source of drinking water [3,4,5], yet depletion rates in major aquifer systems—from the North China Plain [6] to the Indo-Gangetic and Central Valley basins—have reached alarming levels. In northern China, decades of excessive groundwater extraction have resulted in a continuous decline of water tables, widespread land subsidence, and significant ecological degradation. Situated within the Hai River Basin, Beijing exemplifies these compounded challenges: limited natural recharge, increasing urbanization, and mounting water demand have placed unprecedented pressure on the city’s aquifer systems. Under these circumstances, effective groundwater management demands not only accurate assessment of current conditions but also forward-looking scientific strategies capable of guiding sustainable exploitation and long-term protection. As the capital of China, Beijing faces a dual challenge of severe water scarcity and escalating contamination risks, making the city heavily dependent on its underlying aquifer systems [7,8,9,10]. This precarious dependence underscores the urgent need to shift from reactive remediation toward proactive, predictive protection strategies. A fundamental component of this approach is the scientific assessment of groundwater vulnerability, which evaluates the intrinsic susceptibility of an aquifer to potential degradation. Reliable vulnerability assessments provide the basis for delineating protection zones, optimizing monitoring networks, and formulating sound land-use policies.
In response, the scientific community has developed a spectrum of methodologies for vulnerability assessment, which can be broadly categorized according to their underlying principles: process-based numerical simulation [11,12], statistical [13,14,15] and machine learning models, and overlay-and-index methods [16]. Process-based models solve the governing equations of groundwater flow and solute transport, offering high-fidelity simulations of contaminant movement but requiring extensive hydrogeological data and significant computational resources, which often limit their applicability to regional-scale assessments. Statistical and machine learning approaches establish empirical relationships between observed vulnerability indicators, such as nitrate concentration, and hydro-environmental factors, allowing identification of complex, non-linear patterns from large datasets [13,17,18,19]. However, their predictive reliability depends heavily on the availability of extensive, high-quality monitoring data. Overlay-and-index methods, exemplified by the widely used DRASTIC model, provide a pragmatic compromise. By rating, weighting, and aggregating key hydrogeological parameters, these methods generate a relative, spatially explicit vulnerability index suitable for regional-scale applications. Over time, the DRASTIC model has been modified to incorporate additional factors, such as land use, aquifer thickness, and lineament density, to better reflect local conditions.
However, despite substantial methodological progress, translating groundwater vulnerability theory into reliable and predictive tools for practical management remains a formidable challenge. Existing approaches have improved the conceptual understanding of aquifer susceptibility, yet their application often falls short when confronted with the complexity of real-world hydrogeological systems. As a result, several critical knowledge gaps persist, particularly concerning the ability to capture spatial heterogeneity, temporal dynamics, and the influence of evolving anthropogenic and climatic factors on groundwater vulnerability. First, conventional DRASTIC applications rely on a fixed set of parameters and predefined weights [20], which may not capture the unique drivers of vulnerability in specific hydrogeological and anthropogenic contexts. Second, most existing assessments are inherently static, providing a single “snapshot” of vulnerability and failing to predict how conditions may evolve under future environmental stressors, including climate change. Third, while precipitation is a primary driver of groundwater recharge [21], existing forecasting methods often struggle to capture its non-linear, bounded, and non-stationary behavior, limiting the ability to integrate dynamic hydro-climatic information into vulnerability assessment.
To address these gaps, this study develops a novel, dynamic groundwater vulnerability assessment framework tailored to the Beijing plain. Methodologically, the conventional DRASTIC model is enhanced by systematically incorporating three additional factors: land use (L), a forward-looking anthropogenic activity indicator (Aa), and river network density (Rd). The relative importance of these factors, along with the original DRASTIC parameters, is determined using the Analytic Hierarchy Process, resulting in a robust M-DRASTIC-LAaRd model. Conceptually, this framework overcomes the static limitation of traditional assessments by coupling the spatial vulnerability index with a high-fidelity Beta Seasonal Autoregressive Moving Average (βSARMA) time-series model for precipitation forecasting. The predicted precipitation sequences are used to dynamically update the Net Recharge parameter, transforming the assessment from a static snapshot into a forward-looking simulation of hydrogeological risk. Integrating βSARMA-based precipitation forecasting with the enhanced M-DRASTIC-LAaRd model represents a methodological advancement that effectively bridges the gap between conventional static mapping and dynamic, data-driven groundwater vulnerability prediction. By coupling time-varying climatic inputs with spatially explicit hydrogeological factors, the proposed framework refines the representation of groundwater vulnerability evolution and enhances its scientific robustness. It also provides a reliable decision-support tool for adaptive urban water management and ecological protection under future climate uncertainty. Ultimately, this dynamic framework enables the early identification of emerging spatial and temporal hotspots of groundwater vulnerability, supporting proactive and sustainable groundwater governance.
2. Study Area
The study area is mainly concentrated in Beijing, the capital of China, located at the northern end of the North China Plain (Figure 1). The city covers approximately 16,410 km2 and comprises 16 administrative districts, including both core urban areas and suburban regions. The climate is warm temperate semi-humid continental monsoon, characterized by seasonal variability, with hot and rainy summers, cold and dry winters, and moderate spring and autumn conditions. The terrain generally slopes from the northwest to the southeast, resulting in surface runoff and river networks that naturally drain towards the plains. Elevation varies from low-lying plains in the southeast to mountainous areas in the northwest, influencing local hydrology and aquifer recharge patterns.
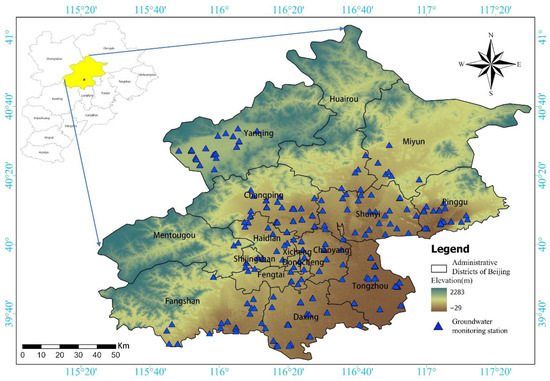
Figure 1.
The study area in Beijing, indicating topography (DEM) and the network of groundwater sampling sites.
Groundwater resources in the study area are primarily distributed across two main types of aquifers: Quaternary porous aquifers in the southeastern plains and bedrock karst-fissure aquifers in the mountainous northwest. These are further subdivided into five principal hydrostratigraphic units, each characterized by distinct lithological and hydraulic properties. The Quaternary systems comprise a highly productive unconfined phreatic aquifer and a deeper confined aquifer, while the bedrock systems include three main units—Ordovician, Cambrian, and Qingbaikouan—whose productivity is largely governed by the degree of karstification and fracture development. Table 1 summarizes the key hydrogeological characteristics of these five aquifer units, including their lithology, thickness, single-well yield, hydraulic conductivity, transmissivity, and storativity, providing a comprehensive overview of aquifer properties and potential groundwater availability.

Table 1.
Key Hydrogeological Characteristics of the Main Aquifer Systems in the Study Area.
As China’s capital and a global megacity, Beijing relies on groundwater for up to 70% of its water supply [22]. Decades of urbanization have caused both depletion and deterioration of shallow aquifers, shifting residential supply since 2004 to deeper confined aquifers [23], which recharge more slowly.
Traditional vulnerability assessments offer static spatial maps, but they cannot capture the dynamic, time-varying risks that climate change and erratic precipitation introduce. To address this, we integrate a predictive rainfall model with a groundwater vulnerability framework, enabling forecasts of “when and where” vulnerability will intensify, supporting more realistic risk assessment and adaptive protection strategies.
Detailed spatial data on rainfall, land use, geomorphology, hydrography, and aquifer systems are provided in the Supplementary Material (Figures S1–S4), keeping the main text concise while providing comprehensive reference data.
3. Methodology and Materials
To capture the dynamic evolution of groundwater vulnerability, this study integrates the M-DRASTIC-LAaRd model with the βSARMA time-series forecasting model. The former enhances the conventional DRASTIC framework by incorporating geomorphological and anthropogenic factors, while the latter enables future climate scenario prediction. Their integration facilitates quantitative comparison between present and projected vulnerability, providing a holistic and predictive tool for evaluating groundwater responses to hydro-climatic change. The complete workflow, from data collection to validation, is shown in Figure 2.
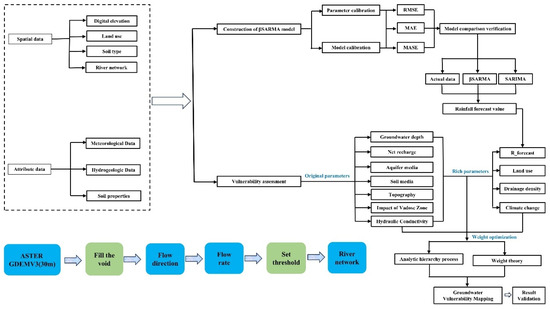
Figure 2.
Study method framework applied in the present work.
3.1. The M-DRASTIC-LAaRd Vulnerability Model
Groundwater vulnerability in Beijing was initially assessed using the classic DRASTIC model framework [24]. which quantifies vulnerability by exponentially weighting seven key hydrogeological parameters: groundwater depth (D), net recharge (R), aquifer media (A), soil media (S), topography (T), impact of the unsaturated zone (I), and aquifer hydraulic conductivity (C). Each parameter is assigned a rating (1–10) and a fixed weight (1–5) to reflect its relative influence on pollution potential (see Table S1 in the Supplementary Material) [25]. The comprehensive DRASTIC index is calculated as:
Higher index values indicate greater vulnerability. For practical interpretation, vulnerability maps are generated by classifying index values into discrete categories using statistical methods [26,27,28].
3.1.1. Key Hydrogeological Parameters
Depth to Water (D): Measured at 288 monitoring stations from 2005 to 2025. Deeper water tables reduce vulnerability; rated 1–10 with weight 5.
Net Recharge (R): Represents natural precipitation-driven infiltration to the saturated zone. Anthropogenic inputs were excluded to isolate climatic effects. Net Recharge is derived from long-term mean annual precipitation (2017–2022, 600 mm) using:
where is the precipitation infiltration coefficient. Spatially, R is classified into five discrete levels.
The focus on precipitation-driven recharge (excluding direct anthropogenic inputs) is motivated by the study’s objective to isolate and quantify the impact of climate change on groundwater vulnerability in Beijing. By defining net recharge (R) strictly as natural infiltration, the βSRAMA time-series model acts as a pure climatic driver, enabling accurate assessment of rainfall variability on vulnerability. Anthropogenic influences are not ignored but are accounted for separately through the enhanced Land use (L) and Anthropogenic activities (Aa) parameters, which represent human-induced risks such as pollution sources or artificial recharge.
Aquifer Media (A) & Soil Media (S): Hydrogeological units (e.g., unconsolidated sediments, fractured bedrock, karstified carbonates) and soils (clay, silt, loam, sand) were rated according to permeability.
Vadose Zone (I): Assesses natural attenuation; fine-grained materials reduce vulnerability, while coarse-grained deposits increase it.
Hydraulic Conductivity (C): Interpolated from pumping test data using Kriging; higher conductivity corresponds to higher vulnerability.
3.1.2. Geomorphological Parameters
Topography (T): Terrain slope influences runoff and infiltration. Computed from ASTER GDEM V3 data, reclassified into five classes (0–2°, 2–6°, 6–12°, 12–18°, >18°).
River Network Density (Rd): Represents surface drainage efficiency. Derived from hydrologically conditioned DEM using D8 flow direction, flow accumulation, and kernel density estimation. High-density networks increase vulnerability.
3.1.3. Climate and Anthropogenic Parameters
Land Use (Lu): Evaluates pollutant input from cropland, urban areas, wetlands, and forests; rated according to potential impact.
Anthropogenic Activities (Aa): Includes groundwater extraction and land management changes. Long-term groundwater level trends over the past 20 years were classified into four vulnerability classes.
The final parameterization of the M-DRASTIC-LAaRd vulnerability index is summarized in Table S2 in the Supplementary Material. This integrated framework incorporates refined scoring ranges and weights, particularly for the three newly introduced parameters—Land Use (L), Anthropogenic Activities (Aa), and River Network Density (Rd). These additions were specifically designed and calibrated to capture their dominant influence within the highly urbanized hydrogeological setting of the Beijing metropolitan area.
3.1.4. Model Formulation and Weight Determination
The relative importance of parameters in the M-DRASTIC-LAaRd framework was objectively determined using the Analytic Hierarchy Process (AHP), with final weights presented in Tables S3 and S4 (Supplementary Material). The pairwise comparison matrix yielded a Consistency Ratio (CR) of 0.0167, confirming strong internal consistency.
Weights were assigned based on expert judgment and regional hydrogeological context. Depth to Water (D) and Impact of the Vadose Zone (I) were given the highest weights due to their primary control on contaminant migration, whereas Land Use (Lu) and Anthropogenic Activities (Aa) reflected the influence of urban and industrial pressures. Moderate weights were applied to Net Recharge (R), Aquifer Media (A), Soil Media (S), and Hydraulic Conductivity (C), while Topography (T) and Road Density (Rd) were assigned lower weights, consistent with their relatively limited impact.
By integrating these weighted parameters, the M-DRASTIC-LAaRd framework combines hydrogeological, geomorphological, climatic, and anthropogenic factors (Table 2), maintaining the rigor of the conventional DRASTIC model while enhancing its applicability to urban–rural settings and dynamic environmental conditions.
Table 2.
Summary of Parameters, Final Weights, and Rating Ranges for the M-DRASTIC-LAaRd Vulnerability Assessment.
3.2. Future Climate Scenario Generation via βSRAMA Model
Accurate projections of key climatic drivers, especially precipitation, are critical for forward-looking groundwater vulnerability assessments, as precipitation governs the Net Recharge (R) in the M-DRASTIC-LAaRd model. Conventional SARIMA models assume Gaussian innovations, which conflict with bounded, non-negative, and skewed hydrological data, potentially producing biased forecasts.
To overcome this, the Beta Seasonal Autoregressive Moving Average (βSARMA) model is employed [29,30]. By modeling precipitation with a Beta distribution, βSARMA preserves temporal and seasonal dependencies while accommodating the data’s statistical properties, enabling physically consistent and credible climate scenario generation. The following section details the model formulation, conditional distribution, and parameter estimation for precipitation forecasting.
Let y = (y1, y2, …, yₙ) be a time series of n observations. The fundamental assumption of the model is that each observation yₜ, for t = 1, 2, …, n, is a random variable that follows a conditional beta distribution. Specifically, the conditional density function of yₜ, given the information set available up to time t − 1, is defined as:
In the formula, the conditional distribution of yₜ is a beta distribution, parameterized by its mean μₜ, and a precision parameter φ. Γ(·) denotes the standard gamma function. Base this parameterization, the conditional mean and variance of yₜ, given the information set are expressed as follows:
The dynamic structure of the time series is modeled using the Beta Seasonal Autoregressive Moving Average (βSARMA) model. The model, denoted as βSARMA(p, q) × (P, Q)S is specified by the following equation:
In this model, is a twice-differentiable, strictly monotonic link function, where . The model residual is defined as rt = g(yt) − g(μt). Its dynamic structure is determined by autoregressive and moving-average coefficients, along with their seasonal counterparts . Here, p and q represent the non-seasonal autoregressive and moving-average orders, P and Q denote the corresponding seasonal orders, and S defines the seasonal period, typically indicating the number of observations per cycle.
The model parameters are estimated via maximum likelihood by numerically maximizing the conditional log-likelihood function [31]. For the model defined in Equation (3), this function is given by:
In the formula:
and
In this study, the logit function is adopted as the link function, and the conditional log-likelihood is numerically maximized using the Broyden–Fletcher–Goldfarb–Shanno (BFGS) quasi-Newton algorithm [32].
The non-seasonal (p, q) and seasonal (P, Q) orders of the model were determined through diagnostic analysis of the Autocorrelation Function (ACF) and Partial Autocorrelation Function (PACF), which characterize the temporal dependence structure of the series:
and
In these equations, and represent the theoretical Autocorrelation Function (ACF) and Partial Autocorrelation Function (PACF) at the Kth lag, respectively. The term yt denotes tth data sample [33].
The optimal model was selected by minimizing the Akaike Information Criterion (AIC) [34]. Parameters were estimated via conditional maximum likelihood, and model adequacy was verified through residual diagnostics, including Q–Q plots for normality and the Ljung–Box test for serial correlation.
3.3. Validation of Groundwater Vulnerability
The credibility of groundwater vulnerability models, such as DRASTIC, relies on validation against empirical hydrochemical data [35,36]. Since aquifer contamination is typically multi-factorial, single-parameter validation is often insufficient [37]; thus, a multi-parameter approach offers a more robust assessment [38]. In this study, Magnesium (Mg2+), Nitrate (NO3−), and Chloride (Cl−) were used to quantitatively validate the model [39,40,41]. While Mg2+ is a natural groundwater constituent, its concentration in the study area is significantly influenced by human activities, including industry and agriculture, making it a sensitive tracer of groundwater perturbation. Mg2+ complements conventional indicators by reflecting both natural and anthropogenic impacts. Model validation employed Receiver Operating Characteristic (ROC) curve analysis [42,43], with the Area Under the Curve (AUC) quantifying predictive accuracy. An AUC near 1.0 indicates strong agreement between predicted vulnerability and observed contamination [44,45,46,47,48]
3.4. Data Sampling and Analysis
The study area was delineated through field surveys, and groundwater samples from 210 shallow wells across six systems in the Beijing Plain were collected following national standards (DZ/T0288-2015) [49]. between June and October 2022. Detailed data are listed in Table S5 in the Supplementary Material.
4. Results and Discussion
Assessing groundwater vulnerability under future climate change requires robust characterization of upcoming precipitation patterns. Here, we apply a validated statistical forecasting framework to project future precipitation and integrate it into our vulnerability model, quantifying the spatiotemporal evolution of hydrogeological risk. This approach advances conventional static assessments toward a dynamic, forward-looking evaluation.
4.1. Projecting the Primary Climatic: Future Precipitation Scenarios
4.1.1. Historical Data Analysis and Model Specification
Projections were based on the historical annual precipitation (1980–2022) from the Chinese Meteorological Administration, which shows notable interannual variability. Figure 3 illustrates monthly rainfall patterns across five Beijing regions (E-BJ, W-BJ, S-BJ, N-BJ, M-BJ), with the west recording the maximum monthly rainfall (616.9 mm). Ensuring reliable time series modeling requires stationarity, assessed here using the Augmented Dickey–Fuller test. Results (p < 0.05) confirm the series is stationary, supporting its suitability for forecasting.
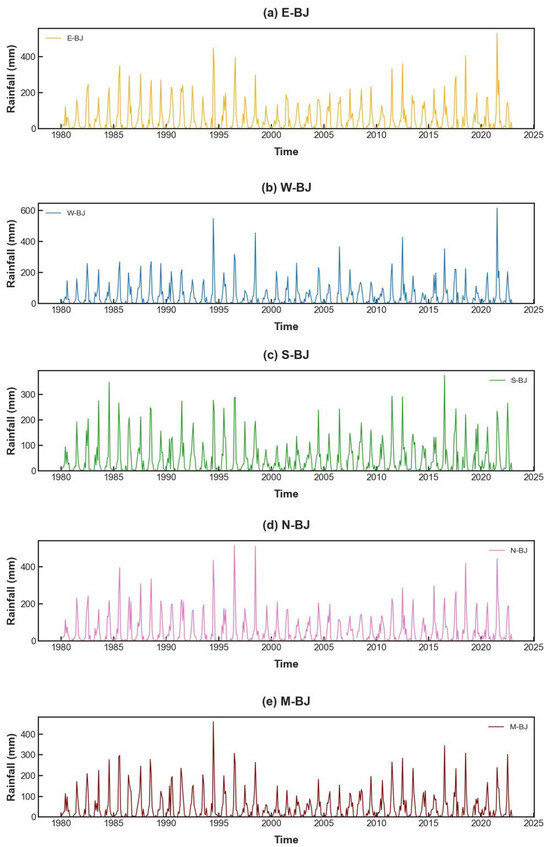
Figure 3.
Time series plot of southwest monsoon rainfall data in five homogeneous region during the period 1980–2022.
Analysis of the ACF and PACF for monthly rainfall across Beijing’s five sub-regions (Figure S5 in the Supplementary Material) reveals a uniform temporal structure with strong annual seasonality (s = 12). The decaying oscillatory patterns in both ACF and PACF indicate a mixed ARMA process, requiring model selection via information criteria. Both nonseasonal (AR/MA) and seasonal (SAR/SMA) parameters capture short-term persistence and robust annual cycles. Candidate βSAR-MA models were evaluated using the AIC to identify the optimal structure for each region (Table 3).
Table 3.
Best-fit βSARMA model specifications and their parameter estimates for monthly rainfall in the five sub-regions of Beijing.
4.1.2. Diagnostic Checking and Performance Evaluation
Model accuracy was evaluated through residual diagnostics for all five Beijing sub-regions. ACF and PACF plots of residuals (Figure S6 in the Supplementary Material) show nearly all spikes within 95% confidence intervals, and Ljung–Box tests (p > 0.05, Table 3) indicate residuals are statistically indistinguishable from white noise. QQ plots (Figure S7 in the Supplementary Material) confirm residuals closely follow normality, with minor deviations in N-BJ and M-BJ being negligible. These results collectively verify that the models are well specified, statistically sound, and robust, supporting the predictive reliability of the proposed M-DRASTIC-LAaRd framework.
4.1.3. Precipitation Projection
The predictive capability of the βSARMA framework was validated through hindcast testing and future projection (Figure 4a–e). Models trained on 1980–2017 data were used to predict the withheld 2018–2022 period, demonstrating strong agreement between forecasts and observations and confirming structural reliability across all five zones.
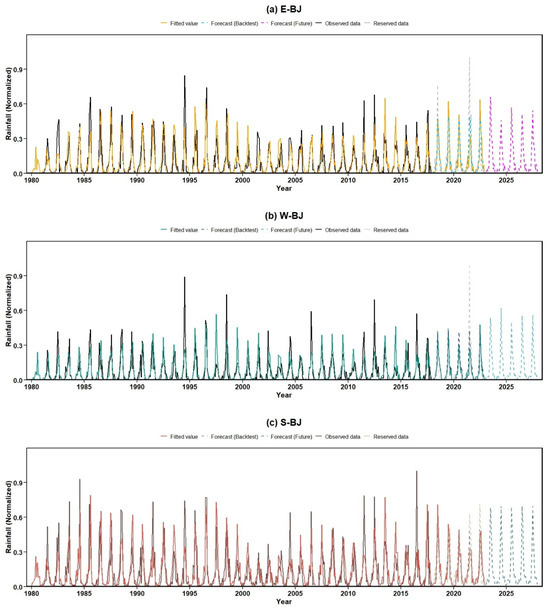
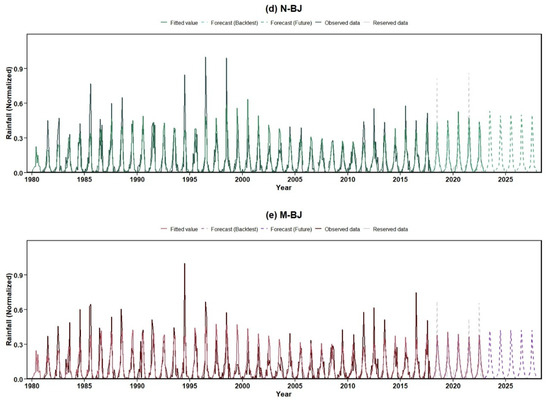
Figure 4.
Fitted values, observed and reserved values and 60-step-ahead (5-year) forecasts for the rainfall in different sub-regions in Beijing.
Subsequently, the models were recalibrated using the full 1980–2022 record to produce robust five-year forecasts (2023–2027). These projections (Figure 4) provide a quantitative outlook of near-term hydroclimatic conditions in Beijing, forming the climatic foundation for the ensuing groundwater vulnerability assessment.
4.2. Development and Validation of an Enhanced Vulnerability Framework: The M-DRASTIC-LAaRd Model
4.2.1. Baseline Vulnerability Under Current Climatic Conditions
To establish the baseline vulnerability for the study area under current climatic conditions, the widely used DRASTIC model was implemented [24]. The seven parameters were reclassified (Figure 5) and combined using their respective weights to generate the Groundwater Vulnerability Index (GVI) map (Figure 6). For quantitative assessment, GVI was categorized into five classes using the Natural Breaks method: Very Low (56–98), Low (98–119), Medium (119–139), High (139–162), and Very High (162–206), covering 16.93%, 22.85%, 24.33%, 23.87%, and 12.02% of the study area, respectively (Table 4).
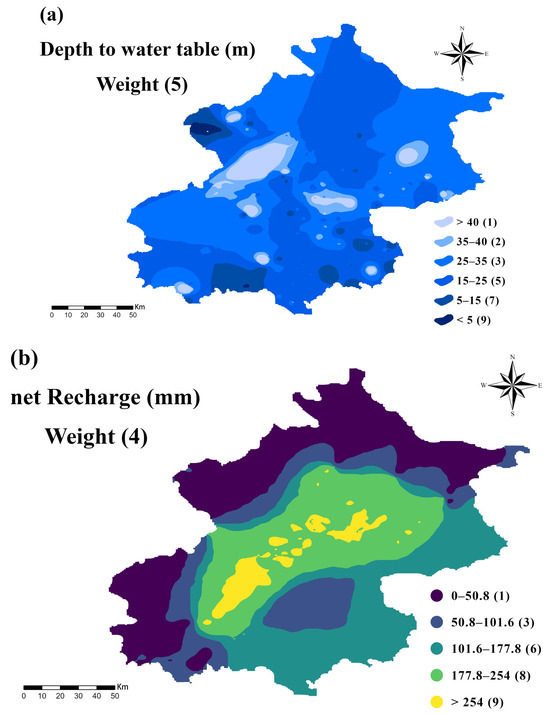
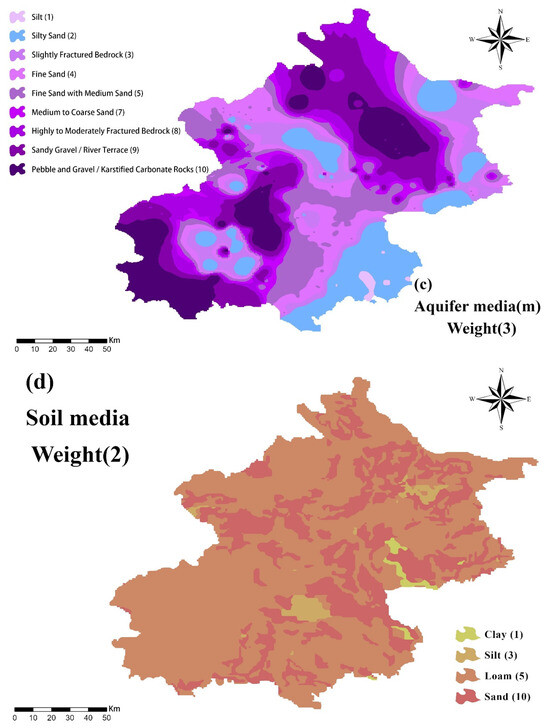
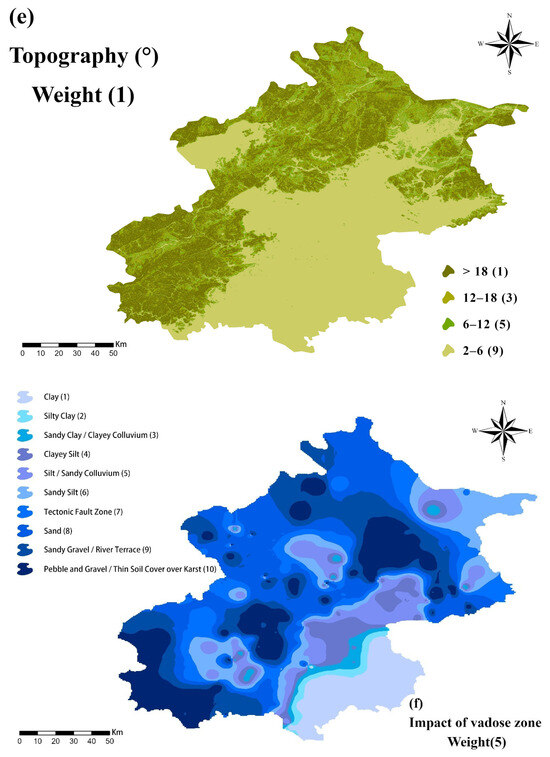
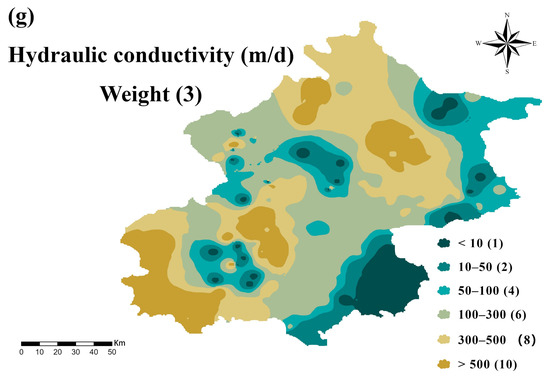
Figure 5.
The thematic maps of DRASTIC model parameters: (a) depth to water, (b) net recharge, (c) aquifer media, (d) soil media, (e) topography, (f) impact of vadose zone, and (g) hydraulic conductivity.
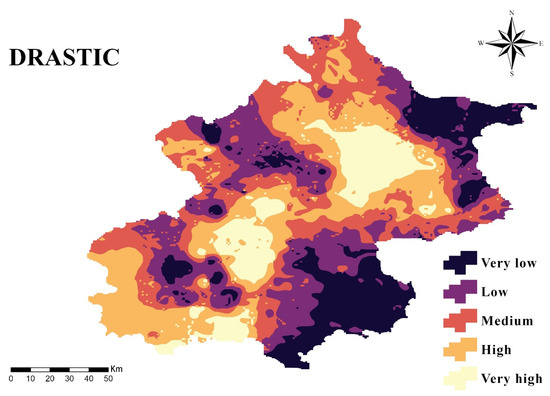
Figure 6.
Groundwater vulnerability based on the DRASTIC method. Classification ranges: Very Low (56–98), Low (98–119), Medium (119–139), High (139–162), and Very High (162–206).
Table 4.
Spatial distribution of groundwater vulnerability classes.
The spatial distribution forms a funnel-shaped pattern reflecting the Beijing basin’s flow system. The piedmont plain at the apex, with high recharge (R), coarse alluvial deposits (S), and a shallow water table (D), exhibits High to Very High vulnerability, serving as the main pathway for surface contaminants. The funnel walls show lower vulnerability: the northwest mountains display Low to Medium vulnerability due to steep slopes (T) and low-permeability bedrock (A), while the southeastern distal plain remains Low, protected by fine-grained silts and clays that impede vertical contaminant migration.
4.2.2. The “Optimization for Local Conditions” Approach (AHP)
Building on the baseline assessment, groundwater vulnerability was re-evaluated using the AHP to better reflect local hydrogeological conditions. The recalibration emphasized the dominant roles of Depth to water (D) and Impact of the vadose zone (I), with the consistency check confirming reliable weighting (CI < 0.1) (Table 5). The resulting AHP-DRASTIC map (Figure 7) shows higher susceptibility in the northern and southwestern regions and lower vulnerability in the southeast. As with the baseline, the index serves as a comparative indicator of potential contamination risk rather than a measure of actual pollution [50,51].
Table 5.
Pairwise comparison matrix and derived weights for the DRASTIC model parameters.
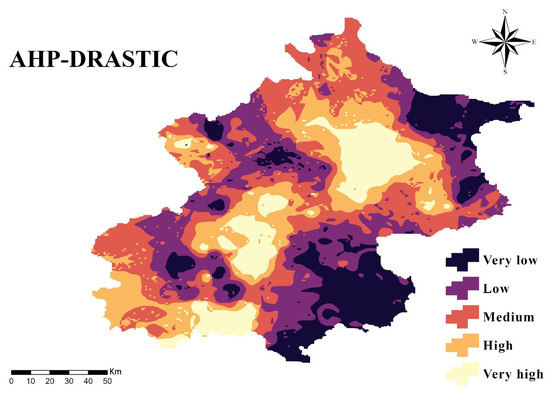
Figure 7.
Groundwater vulnerability based on AHP-DRASTIC. Classification ranges: Very Low (2.3–3.8), Low (3.8–4.7), Medium (4.7–5.4), High (5.4–6.3), and Very High (6.3–8.0).
Using the natural breaks (Jenks) method, the calculated results were reclassified into five categories: Very Low (2.3–3.8), Low (3.8–4.7), Medium (4.7–5.4), High (5.4–6.3), and Very High (6.3–8.0). Incorporating the Analytic Hierarchy Process (AHP) markedly reshaped the spatial expression of vulnerability across the basin. By recalibrating the relative importance of DRASTIC parameters, the AHP-based weighting better reflects actual hydrogeological conditions (Figure 7). The revised AHP-DRASTIC framework reveals a distinct redistribution, with the Medium vulnerability class becoming dominant (Table 5) and High to Very High zones contracting—particularly where deeper groundwater levels (D) and thicker vadose zones (I) provide natural protection (Table 6).
Table 6.
Comparison of vulnerability class distributions before and after AHP optimization.
The expansion of Low vulnerability zones and reduction in Very Low areas shows that AHP adjustment balances the index, revealing subtle susceptibilities in otherwise resilient terrains. This refined map provides a more realistic, interpretable depiction of hydrogeological risk, enhancing its utility for groundwater management. As the AHP-DRASTIC model mainly reflects natural conditions, further refinement requires incorporating anthropogenic factors, as realized in the subsequent M-DRASTIC-LAaRd framework.
4.2.3. Towards a Socio-Hydrogeological Assessment: The Impact of Human Activities in Shaping Vulnerability
Building on the AHP-DRASTIC framework, the M-DRASTIC-LAaRd model explicitly incorporates anthropogenic stressors—Land Use (Lu), Anthropogenic Activities (Aa), and Road Density (Rd)—to capture socio-hydrogeological dynamics shaping groundwater vulnerability [52]. Land use serves as a key integrative indicator, linking spatial pollutant sources to subsurface risk: cultivated lands and barren areas receive the highest ratings due to intensive agrochemical inputs and weak soil protection (Figure 8a). Temporal anthropogenic stress, represented by groundwater level change, reflects the aquifer’s response to pumping and managed recharge (Figure 8b), while river network density (Figure 8c) quantifies surface–groundwater connectivity and potential pollutant transport pathways [53].
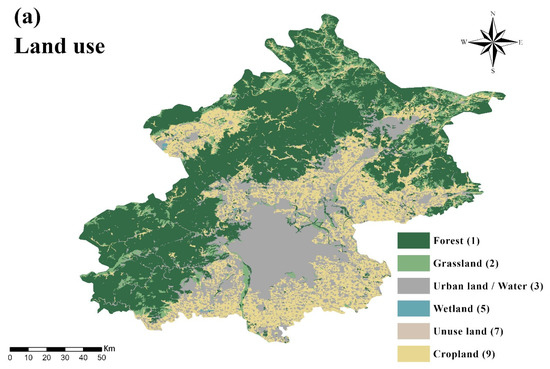
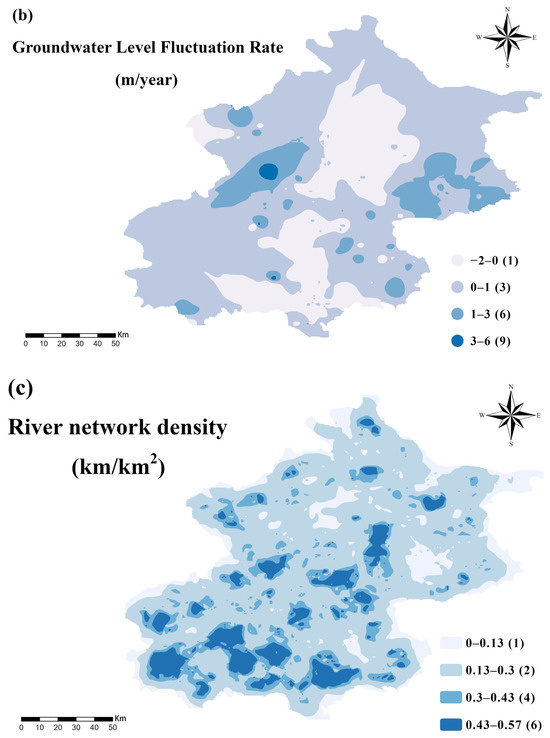
Figure 8.
Modified parameters thematic maps of (a) Land use, (b) Groundwater level fluctuation rate, and (c) River network density.
The integration of these factors produces a more granular and realistic risk landscape. Compared with the AHP-DRASTIC baseline, the M-DRASTIC-LAaRd model (Figure 9) increases the combined High and Very High vulnerability zones from 31.69% to 42.53% of the basin, particularly in the mountainous northwest and distal southeastern plains. These spatial shifts highlight how concentrated human activities can compromise natural geological protection.
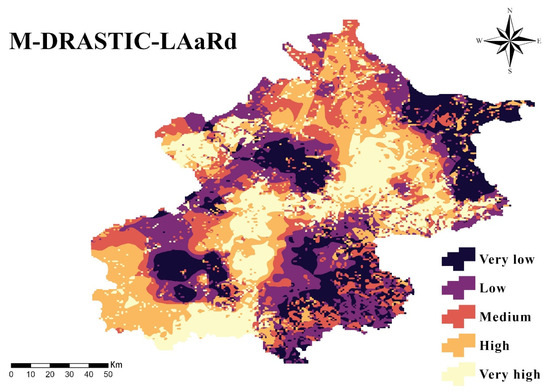
Figure 9.
Groundwater vulnerability based on M-DRASTIC-LAaRd method. Classification ranges: Very Low (2.2–3.6), Low (3.6–4.2), Medium (4.2–4.6), High (4.6–5.2), and Very High (5.2–7.3).
Classified using the natural breaks (Jenks) method into five vulnerability categories (Very Low–Very High), the refined model reveals previously unrecognized hotspots and a systematic amplification of anthropogenic risk. As shown in Figure 10, the progressive incorporation of socio-hydrological parameters leads to a marked rise in High and Very High zones, illustrating the model’s enhanced capacity to detect human-induced vulnerability. Overall, the M-DRASTIC-LAaRd framework transcends static, geology-based assessment, offering a dynamic and management-oriented understanding of groundwater susceptibility in intensively developed basins.
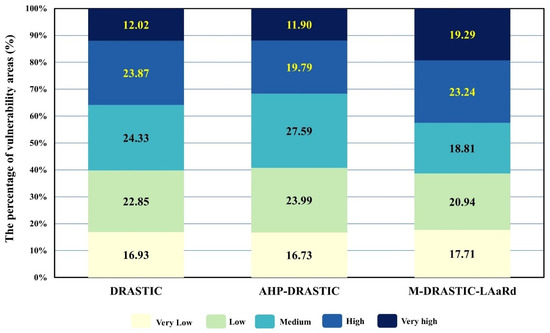
Figure 10.
Percentage of vulnerability class areas (%) by different method.
4.2.4. Model Validation and Sensitivity Analysis
The ultimate test of a vulnerability model lies in its ability to accurately predict real-world contamination patterns. Recognizing the inherent limitations and potential biases of single-indicator validation [37,39], our assessment framework was designed for greater robustness. We utilized field-measured concentrations of three distinct geochemical indicators—nitrate (NO3−), magnesium (Mg2+), and chloride (Cl−)—to validate the models via Receiver Operating Characteristic (ROC) curve analysis [46,54,55].
The results present a compelling narrative of model improvement (Figure 11). A distinct and consistent performance ranking emerged across all three chemical parameters: M-DRASTIC-LAaRd > AHP-DRASTIC > DRASTIC. The M-DRASTIC-LAaRd model, which explicitly accounts for the socio-hydrological dynamics of the region, consistently produced ROC curves positioned closest to the ideal top-left corner of the plot, signifying the highest predictive accuracy.
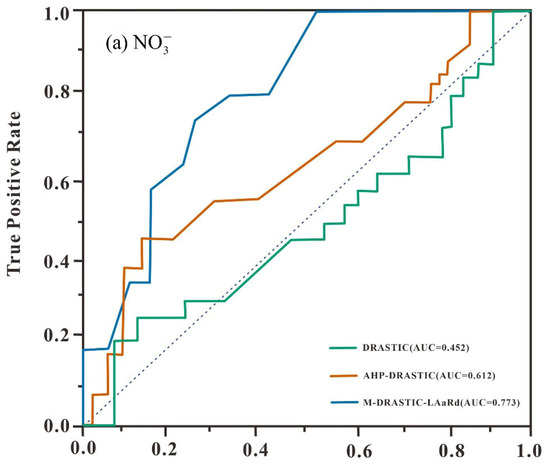
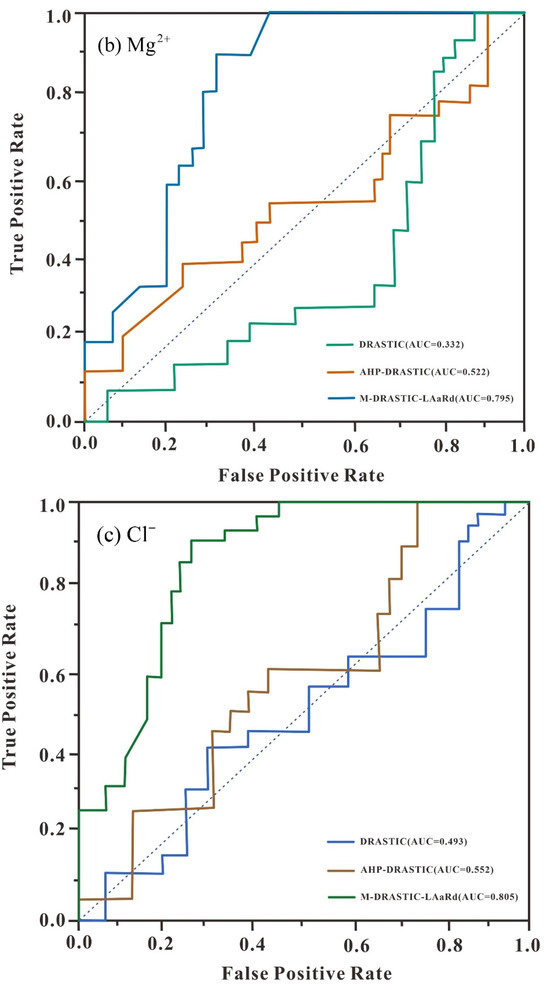
Figure 11.
Model validation results based on samples hydrochemical parameters: (a–c) using ROC and AUC technique.
The conventional DRASTIC model underperformed, with ROC curves for all three indicators below the diagonal and AUC values < 0.5, highlighting its inability to capture the complex hydrogeological and anthropogenic processes. The AHP-DRASTIC model showed intermediate performance, partially aligning with observed contamination patterns.
By incorporating the LAaRd parameters, the M-DRASTIC-LAaRd framework achieves the highest predictive accuracy, with AUC improvements of 0.321 (NO3−) and 0.463 (Mg2+) over the conventional model. These results demonstrate that explicitly accounting for socio-hydrogeological factors is crucial for reliable, actionable groundwater vulnerability assessments in heavily developed basins.
4.3. Spatiotemporal Evolution of Groundwater Vulnerability Under Climate Change
4.3.1. Vulnerability Projections Under Future Climatic Forcing
Our forward-looking groundwater vulnerability assessment relied on generating a high-resolution precipitation scenario for 2023–2027. Using a 43-year historical dataset (Figure 12), a βSARMA model was applied to forecast temporal trends and spatially distribute precipitation across the basin (Figure 13). The projected rainfall was then converted into future net recharge (R_future)—the key driver of aquifer replenishment—through Equation (2) (Figure 14). Integrating this dynamic R_future into the validated M-DRASTIC-LAaRd model produced a predictive map of groundwater vulnerability (Figure 15).
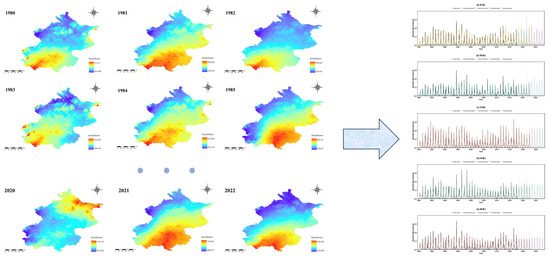
Figure 12.
Conceptual framework and application of the dynamic spatio-temporal precipitation forecasting model.
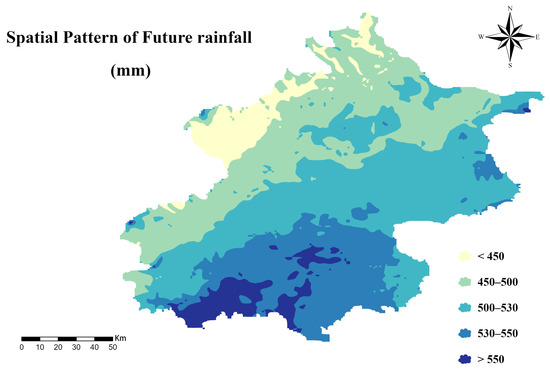
Figure 13.
Projected spatial pattern of future mean annual precipitation in Beijing under a representative climate scenario.
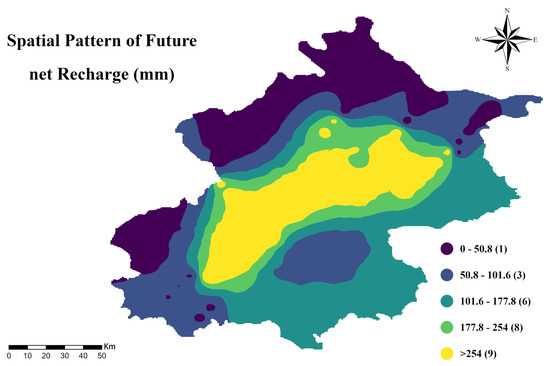
Figure 14.
Projected spatial distribution of mean annual net recharge in Beijing, illustrating the hydrogeological response to a future precipitation scenario.
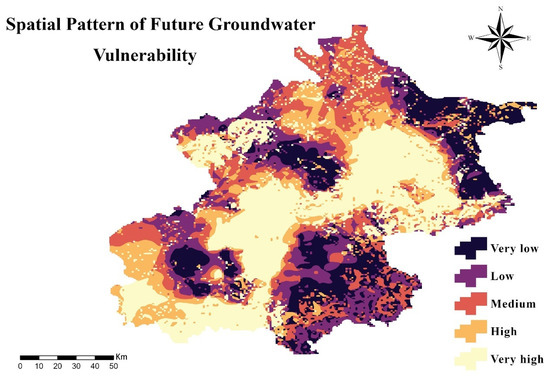
Figure 15.
A projected groundwater vulnerability map of Beijing, assessed using the dynamic M-DRASTIC-LAaRd framework. Classification ranges: Very Low (2.1–3.7), Low (3.7–4.5), Medium (4.5–4.8), High (4.8–5.4), and Very High (5.4–7.3).
In this integration, all other parameters (D, A, S, T, I, C, Lu, Aa, and Rd) were held constant, isolating the hydrometeorological influence of precipitation. While this approach clarifies the climate-driven response, it does not account for possible future changes in land use, human activity, or hydrogeological conditions. Thus, the projection should be viewed as a rainfall-controlled scenario rather than a fully coupled socio-hydrogeological forecast.
Comparing baseline (Figure 9) and future (Figure 15) maps reveals a distinct intensification and reorganization of vulnerability. The index was reclassified using the natural breaks (Jenks) method into five categories—Very Low (2.1–3.7), Low (3.7–4.5), Medium (4.5–4.8), High (4.8–5.4), and Very High (5.4–7.3)—ensuring temporal consistency and comparability. The central high-vulnerability ridge persists but expands markedly toward the northeastern and southwestern sectors, indicating basin-wide degradation even under static anthropogenic conditions.
These results highlight the system’s pronounced sensitivity to precipitation variability and reinforce the need for adaptive groundwater management strategies capable of addressing evolving recharge dynamics under future climate change.
4.3.2. Identification and Attribution of Vulnerability Hotspots
A spatial differencing analysis between future and baseline scenarios delineated the spatio-temporal evolution of groundwater vulnerability, revealing a heterogeneous pattern with 27.93% of the basin projected to experience increased risk (Figure 16). To quantify uncertainty, 95% confidence intervals were calculated for each grid cell, with hotspots in southwestern (Fangshan) and northeastern (Miyun) districts showing narrow intervals (±0.05–0.08), indicating high reliability, while peripheral zones exhibited wider intervals (±0.12–0.18).
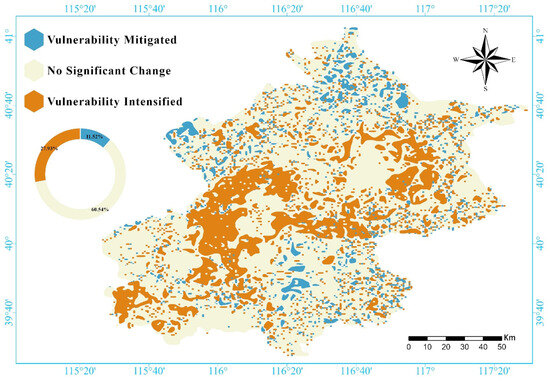
Figure 16.
Projected future trends in groundwater vulnerability and the identification of emerging risk hotspots.
Within the M-DRASTIC-LAaRd framework, which integrates socio-hydrological factors (land use, agricultural intensity) with hydrogeological parameters, sensitivity analysis identified precipitation and groundwater recharge as dominant contributors to model variability, while land use and agricultural intensity had moderate influence. Areas with increased precipitation, particularly under intensive agriculture or urban expansion, showed elevated vulnerability, whereas 11.52% of the basin experienced reduced risk where rainfall decreased.
These findings highlight that nearly one-third of the basin may face rising vulnerability, underscoring the need for targeted management: Fangshan should focus on controlling groundwater abstraction and industrial discharge, while Miyun requires stricter land-use regulation as a key water-source protection zone. Similar precipitation-driven vulnerability increases have been reported in other monsoon-affected regions [56,57], supporting the broader applicability of M-DRASTIC-LAaRd. Overall, the analysis links future precipitation dynamics to contamination potential and demonstrates that integrating socio-hydrological factors enables a more realistic and actionable understanding of vulnerability evolution.
5. Conclusions
This study advances groundwater vulnerability assessment by developing and validating the M-DRASTIC-LAaRd model, which goes beyond conventional hydrogeological parameters. By integrating socio-hydrological factors—land use, river network density, and groundwater level variations—and recalibrating weights via AHP, the model produces spatially heterogeneous maps that better reflect complex on-the-ground conditions. Its robustness is confirmed by significant AUC improvements for three hydrochemical tracers (nitrate, magnesium, chloride), demonstrating its suitability for guiding targeted groundwater protection.
Building on this advancement, we integrate time-series forecasting with dynamic vulnerability assessment, establishing a forward-looking framework. Coupling the βSARMA model with M-DRASTIC-LAaRd translates projected climate scenarios into spatially explicit vulnerability maps. Notably, future vulnerability hotspots closely align with areas of increased projected precipitation, providing direct attribution of risk to climatic drivers and validating the methodology for anticipating groundwater responses to climate change.
These findings carry profound implications for water resource management and chart a clear path for future research. The identification of future vulnerability hotspots provides actionable intelligence for preemptive management, underscoring the urgent need for targeted interventions and robust monitoring networks in these high-risk zones to build resilience against climate-induced pressures. While the AHP method provided a structured approach for weighting, we recognize that future work should explore more advanced optimization techniques, such as machine learning algorithms, to further refine the model. Moreover, we acknowledge that the current mapping approach, which averages concentrations across different groundwater types, may overlook certain hydrochemical variations. In future research, we plan to refine the spatial analysis by distinguishing vulnerability distributions according to salinity class or water type, thereby capturing hydrochemical heterogeneity more accurately. Such endeavors will not only address the limitations of the present study but will also enhance the predictive power of integrated vulnerability models, paving the way for more precise and adaptive groundwater management strategies in an era of unprecedented environmental change.
Supplementary Materials
The following supporting information can be downloaded at: https://www.mdpi.com/article/10.3390/w17213033/s1, Figure S1: Spatial distribution of the multi-year average annual rainfall across the administrative districts of Beijing; Figure S2: Land use and land cover (LULC) map of Beijing for the year 2020; Figure S3: Geomorphological zonation map of the study area in Beijing. Figure S4: The hydrographic network of the study area in Beijing. Figure S5. Autocorrelation Function (ACF) and Partial Autocorrelation Function (PACF) plots for the monthly precipitation time series from different sub-regions in Beijing (The blue shaded area represents the 95% confidence interval). Figure S6. Residual ACF and PACF plots of best-fitted βSARMA model for rainfall data in different sub-regions in Beijing. Figure S7. QQ-plots of best fitted BSARMA model for rainfall data in different sub-regions in Beijing. Table S1: Range and rating values used in original DRASTIC framework title. Table S2. The DRASTIC-LAaRd Model: Parameter Classification and Rating System. Table S3. Scale of relative importance of DRASTIC model given by Saaty. Table S4. Pairwise comparison matrix and derived weights for the M-DRASTIC-LAaRd model parameters. Table S5. Key data types and sources used for groundwater vulnerability modeling. Table S6. Performance evaluation of the βSARMA forecasting models for monthly rainfall in five zones of Beijing (1980–2022). References [58,59,60,61,62] are citied in the Supplementary Materials.
Author Contributions
Conceptualization, J.Z.; methodology, Y.Y.; software, Y.Y.; validation, Y.Y.; investigation, Y.Y.; resources, Y.Y.; data curation, Y.Y.; writing—original draft preparation, Y.Y.; writing—review and editing, J.Z.; visualization, J.Z.; supervision, J.Z.; project administration, J.Z.; funding acquisition, J.Z. All authors have read and agreed to the published version of the manuscript.
Funding
This work is supported by Science Fund for Creative Research Groups of the National Natural Science Foundation of China (No. 42321002).
Data Availability Statement
The original contributions presented in this study are included in the article/Supplementary Material. Further inquiries can be directed to the corresponding author.
Acknowledgments
We would like to express our gratitude to the two anonymous reviewing experts for their valuable comments and feedback on this manuscript.
Conflicts of Interest
The authors declare no conflicts of interest.
References
- Liu, S.; Yang, X.; Hou, G.; Dang, X.; Gao, M. Analysis of multiple salinization processes and quality of shallow and deep groundwater in coastal delta using hydrochemical approaches: A case study in Luanhe River Delta. J. Hydrol. 2024, 637, 131325. [Google Scholar] [CrossRef]
- Nugraha, G.U.; Bakti, H.; Lubis, R.F.; Nur, A.A. Jakarta groundwater modeling: A review. Appl. Water Sci. 2024, 14, 186. [Google Scholar] [CrossRef]
- Chen, Y.; Zhang, Y.; Tian, J.; Tang, Z.; Wang, L.; Yang, X. Understanding the Propagation of Meteorological Drought to Groundwater Drought: A Case Study of the North China Plain. Water 2024, 16, 501. [Google Scholar] [CrossRef]
- Cital, F.; Rodríguez-Burgueño, J.E.; Carreón-Diazconti, C.; Ramírez-Hernández, J. Valuating Hydrological Ecosystem Services Provided by Groundwater in a Dryland Region in the Northwest of Mexico. Water 2025, 17, 2221. [Google Scholar] [CrossRef]
- Perović, M.; Zuber-Radenković, V.; Zorić, M. Feasibility of Groundwater Extraction in Nitrate-Impacted Groundwater Source in Serbia: Hydrodynamic Modeling and Nitrate Tracing. Water 2024, 16, 2105. [Google Scholar] [CrossRef]
- Du, J.; Laghari, Y.; Wei, Y.-C.; Wu, L.; He, A.-L.; Liu, G.-Y.; Yang, H.-H.; Guo, Z.-Y.; Leghari, S.J. Groundwater Depletion and Degradation in the North China Plain: Challenges and Mitigation Options. Water 2024, 16, 354. [Google Scholar] [CrossRef]
- Jin, Z.; Tang, S.; Yuan, L.; Xu, Z.; Chen, D.; Liu, Z.; Meng, X.; Shen, Z.; Chen, L. Areal artificial recharge has changed the interactions between surface water and groundwater. J. Hydrol. 2024, 637, 131318. [Google Scholar] [CrossRef]
- Li, Y.; Wang, R.; Ma, H.; Zhang, J.-M. Rising groundwater table due to restoration projects amplifies earthquake induced liquefaction risk in Beijing. Nat. Commun. 2025, 16, 1466. [Google Scholar] [CrossRef] [PubMed]
- Liu, S.; Zhou, Y.; Eiman, F.; McClain, M.E.; Wang, X.-S. Towards sustainable groundwater development with effective measures under future climate change in Beijing Plain, China. J. Hydrol. 2024, 633, 130951. [Google Scholar] [CrossRef]
- Sun, J.; Hu, L.; Zhang, J.; Yin, W. Providing Enhanced Insights into Groundwater Exchange Patterns through Downscaled GRACE Data. Remote Sens. 2024, 16, 812. [Google Scholar] [CrossRef]
- Cello, P.A.; Kröhling, D.M.; Brunetto, E.; Marizza, M.; Zalazar, M.C.; García, R.; Nalesso, M.; Artigas, J.; Córdoba, J.R. Modeling of non-floodplain wetlands in an upstream basin of the Pampa Plain, Argentina, during current hydro-climatic extreme conditions: Geomorphological thresholds controlling hydrodynamics. Glob. Planet. Chang. 2025, 248, 104768. [Google Scholar] [CrossRef]
- Kumar, M.; Hayano, K. Variation of the Groundwater Table within Indian Railway Embankments in Consideration of Climate Change. Sustainability 2024, 16, 6143. [Google Scholar] [CrossRef]
- Lyu, K.; Dong, Y.; Lyu, W.; Zhou, Y.; Wang, S.; Wang, Z.; Cui, W.; Zhang, Y.; Zhang, Q.; Cui, Y. Data-driven and numerical simulation coupling to quantify the impact of ecological water replenishment on surface water-groundwater interactions. J. Hydrol. 2025, 649, 132508. [Google Scholar] [CrossRef]
- Shang, H.M.; Wang, W.K.; Dai, Z.X.; Duan, L.; Zhao, Y.Q.; Zhang, J. An ecology-oriented exploitation mode of groundwater resources in the northern Tianshan Mountains, China. J. Hydrol. 2016, 543, 386–394. [Google Scholar] [CrossRef]
- Yao, L.; He, P.; Song, S. A perturbation stochastic finite-element method for groundwater flow models based on an undetermined-coefficients approach. Hydrogeol. J. 2010, 18, 1603–1609. [Google Scholar] [CrossRef]
- Meng, X.M. Study on Process Based Assessment Method for the Confined Aquifer Vulnerability in Leakage Area. Ph.D. Thesis, Peking University, Beijing, China, 2010. [Google Scholar]
- Felfelani, F.; Hughes, J.; Chen, F.; Dugger, A.; Schneider, T.; Gochis, D.; Traylor, J.; Essaid, H. Simulation of groundwater-flow dynamics in the U.S. Northern High Plains driven by multi-model estimates of surficial aquifer recharge. J. Hydrol. 2024, 630, 130703. [Google Scholar] [CrossRef]
- Hossen, H.; Nour-Eldeen, A.S.; Abd-Elaty, I.; Hamdan, A.M.; Negm, A.; Elsahabi, M. Innovative management strategies for groundwater logging in Aswan city and maximization of its benefits using modeling techniques. Appl. Water Sci. 2024, 14, 253. [Google Scholar] [CrossRef]
- Indhanu, N.; Chalermyanont, T.; Chub-Uppakarn, T. Spatial assessment of land use and land cover change impacts on groundwater recharge and groundwater level: A case study of the Hat Yai basin. J. Hydrol. Reg. Stud. 2025, 57, 102097. [Google Scholar] [CrossRef]
- Jang, C.-S.; Chen, S.-K.; Chang, L.-F. Erratum to Evaluation of groundwater vulnerability to nitrate-nitrogen by using probability-based modssified DRASTIC models with source and attenuation factors. J. Hydrol. 2025, 655, 132951. [Google Scholar] [CrossRef]
- Afridi, M.Z.; Santha, N.; Taweelarp, S.; Ploymaklam, N.; Khebchareon, M.; Qamar, M.S.; Saenton, S. Groundwater Recharge Assessment and Recharge Zonation of the Intermontane Groundwater Basin, Chiang Mai, Thailand, Using a Groundwater Flow Model and Stable Isotopes. Sustainability 2025, 17, 5560. [Google Scholar] [CrossRef]
- Zheng, S.S.; Suo, Y.; Kou, Z.M.; Yang, D.F.; Zheng, Z.L. Research on the optimization strategy of cultivated land and water resources allocation in Beijing from the perspective of food security. Plan. Constr. Beijing 2025. Available online: https://kns.cnki.net/kcms2/article/abstract?v=krTYG2tdvzp3vsxX30MOUYi48BI-iw3a-47EKgIAR6_f8Bun6wZPTxC6c_g3WTB7TfCwcyaLYmBSiS-Z9v5Aq3iLM2oduUW8vd114rn1Bg40LoVo5kFcjXc5BH8Uo_0RjeuPiJdBJAUbpDK8hX8_RYYfIGGKY3PWw7TuF798_QK0SfT9vpp_3jEx7ecv7dWf85FQ_e_TSiU=&uniplatform=NZKPT (accessed on 22 September 2025). [CrossRef]
- Kong, G.L.; Hai, L.; Zhen, L.; Zhang, X.; Sun, R. Study on the change of long-term groundwater resources development and utilization degree in Daxing District. Groundw. Resour. Assess. 2022. [Google Scholar]
- Aller, L.; Lehr, J.H.; Petty, R.; Bennett, T. Drastic: A standardized system for evaluating groundwater pollution potentials using hydrogeological settings. J. Geol. Soc. India 1987, 29, 23–37. [Google Scholar] [CrossRef]
- Saaty, R.W. The analytic hierarchy process—What it is and how it is used. Math. Model. 1987, 9, 161–176. [Google Scholar] [CrossRef]
- Kumar, P.; Thakur, P.K.; Bansod, B.K.; Debnath, S.K. Multi-criteria evaluation of hydro-geological and anthropogenic parameters for the groundwater vulnerability assessment. Environ. Monit. Assess. 2017, 189, 564. [Google Scholar] [CrossRef]
- Varol, S.; DAVRAZ, A.; Şener, E.; Şener, Ş.; Aksever, F.; Kirkan, B.; Tokgözlü, A. Determining the lake protected zones using GIS-based DRASTIC model to groundwater vulnerability in Salda Lake basin (Burdur/Turkey). Turk. J. Earth Sci. 2020, 29, 747–763. [Google Scholar] [CrossRef]
- Wang, Z.; Xiong, H.; Ma, C.; Zhang, F.; Li, X. Assessment of groundwater vulnerability by applying the improved DRASTIC model: A case in Guyuan City, Ningxia, China. Environ. Sci. Pollut. Res. 2023, 30, 59062–59075. [Google Scholar] [CrossRef]
- Eni, D.; Adeyeye, F.J. Seasonal ARIMA Modeling and Forecasting of Rainfall in Warri Town, Nigeria. J. Geosci. Environ. Prot. 2015, 3, 91–98. [Google Scholar] [CrossRef]
- Murthy, K.V.N.; Saravana, R.; Kumar, K.V. Modeling and forecasting rainfall patterns of southwest monsoons in North–East India as a SARIMA process. Meteorol. Atmos. Phys. 2018, 130, 99–106. [Google Scholar] [CrossRef]
- Andersen, E.B. Asymptotic Properties of Conditional Maximum-Likelihood Estimators. J. R. Stat. Soc. Ser. B Stat. Methodol. 1970, 32, 283–301. [Google Scholar] [CrossRef]
- Bayer, F.M.; Cintra, R.J.; Cribari-Neto, F. Beta seasonal autoregressive moving average models. J. Stat. Comput. Simul. 2018, 88, 2961–2981. [Google Scholar] [CrossRef]
- McLeod, A.I.; Li, W.K. Diagnostic checking ARMA time series models using squared-residual autocorrelations. J. Time Ser. Anal. 1983, 4, 269–273. [Google Scholar] [CrossRef]
- Akaike, H. A new look at the statistical model identification. IEEE Trans. Autom. Control 1974, 19, 716–723. [Google Scholar] [CrossRef]
- Jamrah, A.; Al-Futaisi, A.; Rajmohan, N.; Al-Yaroubi, S. Assessment of groundwater vulnerability in the coastal region of Oman using DRASTIC index method in GIS environment. Environ. Monit. Assess. 2008, 147, 125–138. [Google Scholar] [CrossRef]
- Srinivasamoorthy, K.; Vijayaraghavan, K.; Vasanthavigar, M.; Sarma, V.S.; Rajivgandhi, R.; Chidambaram, S.; Anandhan, P.; Manivannan, R. Assessment of groundwater vulnerability in Mettur region, Tamilnadu, India using drastic and GIS techniques. Arab. J. Geosci. 2011, 4, 1215–1228. [Google Scholar] [CrossRef]
- Hamza, S.M.; Ahsan, A.; Imteaz, M.A.; Rahman, A.; Mohammad, T.A.; Ghazali, A.H. Accomplishment and subjectivity of GIS-based DRASTIC groundwater vulnerability assessment method: A review. Environ. Earth Sci. 2015, 73, 3063–3076. [Google Scholar] [CrossRef]
- Hasan, M.; Islam, A.; Hasan, M.A.; Alam, J.; Peas, M.H. Groundwater vulnerability assessment in Savar upazila of Dhaka district, Bangladesh—A GIS-based DRASTIC modeling. Groundw. Sustain. Dev. 2019, 9, 100220. [Google Scholar] [CrossRef]
- Yu, H.; Wu, Q.; Zeng, Y.; Zheng, L.; Xu, L.; Liu, S.; Wang, D. Integrated variable weight model and improved DRASTIC model for groundwater vulnerability assessment in a shallow porous aquifer. J. Hydrol. 2022, 608, 127538. [Google Scholar] [CrossRef]
- Ale, T.O.; Ogunribido, T.H.; Ademila, O.; Akingboye, A.S. Soil pollution status due to potentially toxic elements in active open dumpsites: Insights from different Nigerian geological environments. Environ. Earth Sci. 2024, 83, 535. [Google Scholar] [CrossRef]
- Ale, T.O.; Ogunribido, T.H.; Ademila, O.; Akingboye, A.S. Soil–water contamination assessment due to dumpsite-impacted leachates in a metamorphic environment. J. Afr. Earth Sci. 2024, 216, 105312. [Google Scholar] [CrossRef]
- Metz, C.E. Basic principles of ROC analysis. Semin. Nucl. Med. 1978, 8, 283–298. [Google Scholar] [CrossRef]
- Pham, B.T.; Prakash, I. Evaluation and comparison of LogitBoost Ensemble, Fisher’s Linear Discriminant Analysis, logistic regression and support vector machines methods for landslide susceptibility mapping. Geocarto Int. 2019, 34, 316–333. [Google Scholar] [CrossRef]
- Torkashvand, M.; Neshat, A.; Javadi, S.; Pradhan, B. New hybrid evolutionary algorithm for optimizing index-based groundwater vulnerability assessment method. J. Hydrol. 2021, 598, 126446. [Google Scholar] [CrossRef]
- Torkashvand, M.; Neshat, A.; Javadi, S.; Yousefi, H. DRASTIC framework improvement using stepwise weight assessment ratio analysis (SWARA) and combination of genetic algorithm and entropy. Environ. Sci. Pollut. Res. 2021, 28, 46704–46724. [Google Scholar] [CrossRef]
- Mouhoumed, R.M.; Ekmekcioğlu, Ö.; Özger, M. An integrated groundwater vulnerability and artificial recharge site suitability assessment using GIS multi-criteria decision making approach in Kayseri region, Turkey. Environ. Sci. Pollut. Res. 2024, 31, 39794–39822. [Google Scholar] [CrossRef]
- Sarwar, A.; Ali, M. GIS-DRASTIC integrated approach for groundwater vulnerability assessment under soil erosion hot spot areas in Northern Pakistan. Environ. Earth Sci. 2024, 83, 532. [Google Scholar] [CrossRef]
- Zhang, Y.; Chen, J.; Zhang, D.; Dong, X.; Su, H.; Li, Z.; Chen, W. Based on AHP–VW–PSR for groundwater vulnerability assessment and pollution prevention in industrial–agricultural regions: A case study of the Zhongyuan oilfield. Geocarto Int. 2025, 40, 2509138. [Google Scholar] [CrossRef]
- Wang, S.-Y.; Ma, Z.-H.; Chang, M.; Chen, Y.-Y.; Xi, Y.; Chen, J.-J.; Cui, D.; Tao, L.; Jing, H.-W.; Lu, H.-F.; et al. Hydrochemical characteristics and cause analysis of shallow groundwater in Beijing Plain Area. Environ. Sci. 2025, 46, 833–842. [Google Scholar] [CrossRef]
- Deka, D.; Ravi, K.; Nair, A.M. Impact of urbanisation on groundwater vulnerability in shallow aquifer system of Assam: A DRASTIC approach. Urban Clim. 2025, 59, 102299. [Google Scholar] [CrossRef]
- Li, B.; Wu, P.; Li, M.; Chen, L.; Yang, L.; Long, J. An improved groundwater vulnerability evaluation model based on random forest algorithm and spatio-temporal change prediction method. Process Saf. Environ. Prot. 2025, 195, 106781. [Google Scholar] [CrossRef]
- Williams, S.A.; Megdal, S.B.; Zuniga-Teran, A.A.; Quanrud, D.M.; Christopherson, G. Mapping Groundwater Vulnerability in Arid Regions: A Comparative Risk Assessment Using Modified DRASTIC Models, Land Use, and Climate Change Factors. Land 2024, 14, 58. [Google Scholar] [CrossRef]
- Qi, Y.; Bai, M.; Song, L.; Wang, Q.; Tian, G.; Wang, C. Research on Risk Assessment Method for Land Subsidence in Tangshan Based on Vulnerability Zoning. Appl. Sci. 2023, 13, 12678. [Google Scholar] [CrossRef]
- Yuan, W.; Wang, Z.; Zhang, T.; Liu, Z.; Ma, Y.; Xiong, Y.; An, F. Assessment and prediction of groundwater vulnerability based on land use change—A case study of the central urban area of Zhengzhou. Water 2024, 16, 3716. [Google Scholar] [CrossRef]
- Liang, Y.; Zhang, X.; Sun, Y.; Yao, L.; Gan, L.; Wu, J.; Chen, S.; Li, J.; Wang, J. Enhanced groundwater vulnerability assessment to nitrate contamination in Chongqing, Southwest China: Integrating novel explainable machine learning algorithms with DRASTIC-LU. Hydrol. Res. 2024, 55, 663–682. [Google Scholar] [CrossRef]
- Akingboye, A.S.; Bery, A.A.; Kayode, J.S.; Ogunyele, A.C.; Adeola, A.O.; Omojola, O.O. Groundwater-yielding capacity, water–rock interaction, and vulnerability assessment of typical gneissic hydrogeologic units using geoelectrohydraulic method. Acta Geophys. 2023, 71, 697–721. [Google Scholar] [CrossRef]
- Omeje, E.T.; Obiora, D.N.; Okeke, F.N.; Ibuot, J.C.; Ugbor, D.O.; Omeje, V.D. Investigation of aquifer vulnerability and sensitivity analysis of modified drastic and sintacs models: A case study of Ovogovo Area, Eastern Nigeria. Acta Geophys. 2023, 71, 2439–2464. [Google Scholar] [CrossRef]
- Huang, D. Research on the Vulnerability of Groundwater in Plain Areas of Beijing. Ph.D. Thesis, Capital Normal University, Beijing, China, 2003. [Google Scholar]
- Hao, J.; Zhang, Y.; Jia, Y.; Wang, H.; Niu, C.; Gan, Y.; Gong, Y. Assessing groundwater vulnerability and its inconsistency with groundwater quality, based on a modified DRASTIC model: A case study in Chaoyang District of Beijing City. Arab. J. Geosci. 2017, 10. [Google Scholar] [CrossRef]
- Liu, Y.; Lan, S.-S.; Zhang, Y.-X.; Li, F.-C. Spatio-temporal Evolution of Groundwater Vulnerability Based on Spatial Autocorrelation. Huan Jing Ke Xue (Huanjing Kexue) 2017, 38, 4236–4244. [Google Scholar]
- Niu, X.Z.; Zhu, M.; Xin, L.; Xing, L.; Wu, J.; Li, X.; Song, D.; An, H.; Gong, L. Vulnerability assessment of groundwater in the first aquifer rock formation in plain areas based on improved DRASTIC model. Environ. Monit. China 2024, 40, 7. [Google Scholar]
- Saaty, T.L. The Analytic Hierarchy Process; McGraw-Hill: New York, NY, USA, 1980. [Google Scholar]
Disclaimer/Publisher’s Note: The statements, opinions and data contained in all publications are solely those of the individual author(s) and contributor(s) and not of MDPI and/or the editor(s). MDPI and/or the editor(s) disclaim responsibility for any injury to people or property resulting from any ideas, methods, instructions or products referred to in the content. |
© 2025 by the authors. Licensee MDPI, Basel, Switzerland. This article is an open access article distributed under the terms and conditions of the Creative Commons Attribution (CC BY) license (https://creativecommons.org/licenses/by/4.0/).