Article

Groundwater Suitability for Irrigation in the Hennaya Region, Northwest Algeria: A Hydrochemical and GIS-Based Multi-Criteria Assessment

by
Abderrahim Badraoui
1,2,
Chérifa Abdelbaki
1,2,
Madani Bessedik
1,2,
Sidi Mohamed Tiar
1,2,
Yacine Abdelbaset Berrezel
1,2,
Mahdi Ziane
1,2,
Amaria Slimani
3,
Ahmed Souafi
4,
Nourredine Boudadi
5,
Bernhard Tischbein
6 and
Navneet Kumar
6,7,*
1
Department of Hydraulics, Faculty of Technology, University of Tlemcen, P.O. Box 230, Tlemcen 13000, Algeria
2
Laboratoire Eau et Ouvrages dans Leur Environnement (EOLE), University of Tlemcen, P.O. Box 230, Tlemcen 13000, Algeria
3
National Office of Sanitation, Tlemcen 13000, Algeria
4
National Office of Irrigation and Drainage, Tlemcen 13000, Algeria
5
National Agency for Water Resources, Tlemcen 13000, Algeria
6
Divison of Ecology and Natural Resources Management, Center for Development Research (ZEF), University of Bonn, Genscherallee 3, 53113 Bonn, Germany
7
Institute for Environment and Human Security (UNU-EHS), United Nations University, UN Campus, Platz der Vereinten Nationen 1, 53113 Bonn, Germany
*
Author to whom correspondence should be addressed.
Water 2025, 17(20), 3025; https://doi.org/10.3390/w17203025
Submission received: 6 September 2025 / Revised: 15 October 2025 / Accepted: 17 October 2025 / Published: 21 October 2025

Abstract

This study investigated groundwater suitability for irrigation in the Hennaya Irrigated region of Northwest Algeria. The research pursued two primary objectives: first, to establish the hydrochemical origin of the groundwater through comprehensive analyses including hydrochemical parameters, diagrams, and hierarchical clustering; and second, to assess its suitability for irrigation based on key criteria such as the Water Quality Index (WQI), Wilcox, and US Salinity diagrams. The analysis revealed a high level of groundwater suitability for irrigation, as indicated by various indices: Sodium Adsorption Ratio (SAR) values ranged from 1.69 to 2.55 (Excellent), Sodium Percentage (Na%) ranged from 24.22% to 36.98% (Good), and the Residual Sodium Carbonate (RSC) was negative, falling between −8.91 to −1.70 meq/L (Safe). Kelly’s Ratio (KR) ranged from 0.32 to 0.59 (Good), and the Permeability Index (PI) was between 62% and 99% (Moderate). Supported by the Analytic Hierarchy Process (AHP) and spatial analysis, the Water Quality Index (WQI) values ranged from 69.25 to 88.71, categorizing the groundwater in the study area as ‘Good’ quality. While suitable for irrigation, the groundwater showed slight salinity (EC 1247–2010 μS/cm) and alkalinity (pH 7.09–8.02), with elevated total dissolved solids (TDSs) ranging from 990 to 1930 mg/L, approaching the permissible limits for optimal agricultural use. The dominant ion concentrations (Ca2+ > Na+ > Mg2+ > K+; HCO3 > Cl > SO42− > NO3) indicate a mixed hydrochemical facies influenced by both water–rock interactions and evaporative processes. Although these findings are promising, they highlight the necessity for preventive measures. Ongoing proactive management and continuous monitoring are essential to ensure the long-term sustainability and protection of groundwater resources in the region.

1. Introduction

Groundwater plays a crucial role in global water resource management, constituting approximately 99% of the world’s liquid freshwater reserves [1]. On a global scale, about 31% of extracted groundwater is utilized by commercial, industrial, and municipal sectors, while the remaining 69% is allocated for agricultural use [2]. In semi-arid regions, where precipitation levels are low and irregular (ranging from 200 to 400 mm annually), groundwater becomes an essential resource for meeting agricultural, industrial, ecological, and domestic demands, thereby ensuring water and food security [3,4,5]. Furthermore, the increasing variability in surface water availability due to climate change is likely to heighten reliance on groundwater, a trend further exacerbated by rising demand.
This growing dependence on groundwater raises significant threats from anthropogenic factors, including aquifer overuse and agricultural pollution [1]. In semi-arid regions, these challenges are intensified by aquifer overexploitation to meet escalating water demands [2]. Factors such as population growth, agricultural intensification, and urbanization further strain water resources, exacerbating quality degradation and sustainability concerns [3,4]. As an illustration, excessive use of nitrogen-based fertilizers, pesticides, and agricultural chemicals has led to notable contamination of aquifers with nitrates, sulfates, and trace metals [5].
Moreover, the overexploitation of aquifers to meet increasing water demands has exacerbated issues of salinization and seawater intrusion in many coastal areas worldwide [6,7] These issues, combined with the artificial recharge of aquifers using treated wastewater, highlight the urgent need for a systematic investigation of groundwater quality [8]. This is particularly critical, as this practice can introduce residual contaminants into local hydrological systems, potentially altering the chemical composition of groundwater [9].
Groundwater quality hinges on physicochemical parameters (e.g., pH, electrical conductivity, major ions: Na+, Ca2+, Cl, HCO3; pollution indicators: nitrates, sulfates) and biological factors, quantified and assessed via hydrochemical analysis [10]. Hydrochemistry proves to be a powerful tool for gaining an understanding of the complex interactions between natural and anthropogenic factors that influence groundwater composition. By analyzing physicochemical parameters and pollution indicators, it is possible to assess the suitability of water for various uses, including irrigation and human consumption [6,11].
Recently, studies have emphasized the importance of integrating Water Quality Indices (WQIs) to synthesize complex hydrochemical data into a simple and interpretable indicator [7,12]. WQI, pioneered by [13] and refined through weighted parameter models, consolidates complex hydrochemical data into a single metric, enabling rapid assessment of groundwater suitability for drinking and irrigation [14].
These indices not only enable the evaluation of overall water quality but also assist in prioritizing intervention measures for the sustainable management of water resources [15]. Studies analyzing water quality indices across northern Algeria have highlighted significant concerns regarding groundwater quality. The results indicate the presence of contamination in several regions, emphasizing the need for corrective measures to ensure the sustainable use of groundwater resources [16,17,18,19].
Coupling WQI with Multi-Criteria Decision Analysis (MCDA), particularly the Analytic Hierarchy Process (AHP), enhances resource management by prioritizing interventions based on hydrochemical, environmental, and socio-economic criteria [20].
Developed by [21], AHP has been widely applied in groundwater studies to evaluate aquifer vulnerability and optimize monitoring strategies, especially in data-scarce semi-arid regions [22]. In addition, Geographic Information Systems (GISs) further amplify WQI utility by mapping spatial variations in groundwater quality using interpolation techniques such as Inverse Distance Weighting [23].
This integrated approach, combining hydrochemical analysis with WQI-AHP-GIS methods for spatial mapping, has been successfully applied in numerous groundwater studies [24,25,26,27,28,29,30,31,32,33,34,35].
The mapping of quality parameters and the Irrigation Water Quality Index (IWQI) intends to provide a clear understanding of irrigation water adequacy. By creating an IWQI map using GIS-based Analytic Hierarchy Process (AHP), decision-makers, water distributors, and managers can achieve easy, rapid interpretation and a better understanding of water quality for various uses [27].
In the Hennaya Irrigated region of semi-arid northwestern Algeria, limited surface water resources drive a heavy dependence on groundwater for irrigated agriculture. Extracting water from wells is essential for maintaining agricultural productivity and supporting the livelihoods of the local population [36].
The Hennaya agricultural area, which spans approximately 1900 hectares and is vital for irrigated farming, uses a dual water source system. It primarily relies on groundwater from wells, supplemented by treated wastewater that is delivered through a municipal treatment plant network [37]. However, this region faces significant challenges in the sustainable management of its water resources and soils.
The practice of mixed irrigation—combining groundwater and treated wastewater—has been in place for about 15 years. While this approach helps alleviate water stress, it risks the gradual deterioration of groundwater and soil quality over time due to the potential accumulation of contaminants and dissolved salts [38]. These cumulative effects highlight the need for a comprehensive analysis to ensure the sustainable and balanced management of these critical resources [39].
Therefore, this study aims to understand the hydrochemical origin of groundwater by analyzing hydrochemical parameters, hydrochemical diagrams, and hierarchical clustering. Additionally, it assesses groundwater suitability for irrigation using irrigation-specific indicators. The study applies the Water Quality Index (WQI) for groundwater quality evaluation and employs the Analytic Hierarchy Process (AHP) in conjunction with Geographic Information System (GIS) techniques to develop detailed groundwater quality maps, thereby providing a comprehensive framework for assessment. This investigation is part of a scientific effort to promote the sustainability of local water resources while addressing the socio-economic needs of the region.

2. Materials and Methods

2.1. Study Area

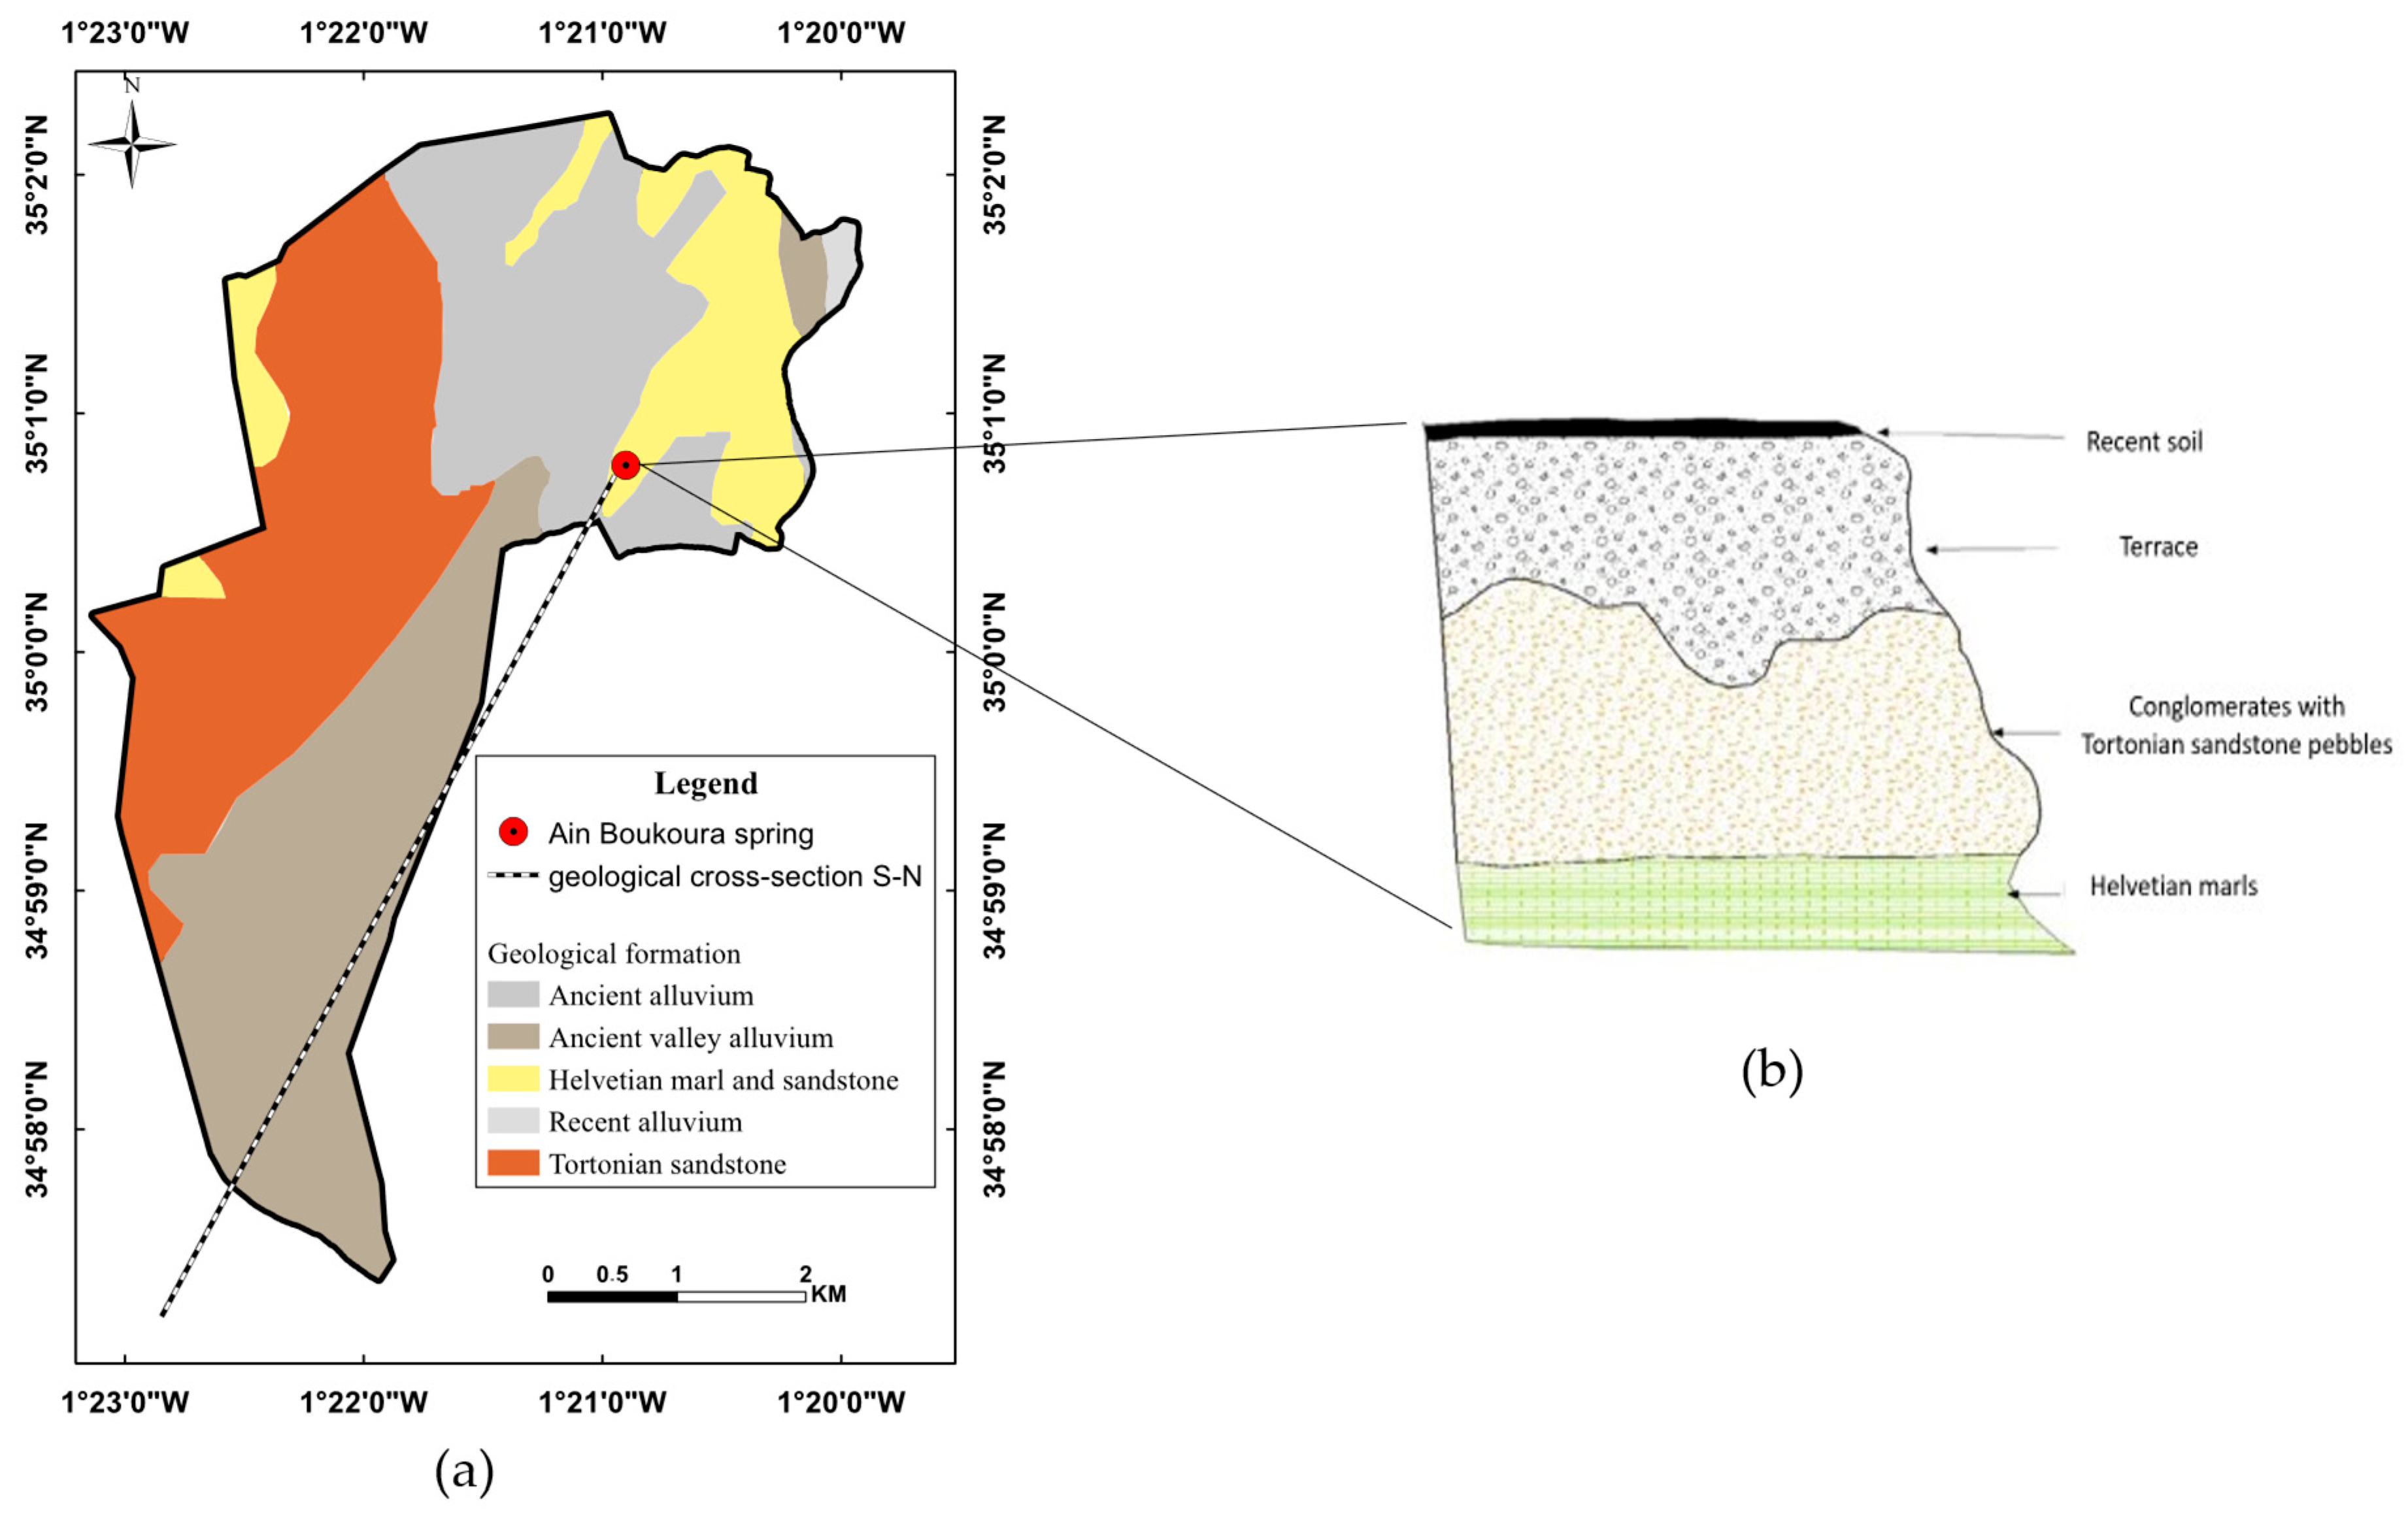
The Irrigated region of Hennaya, located in the north of Tlemcen province in Algeria, lies between 34°57′ to 35°30′ N latitude and 1°19′ to 1°24′ E longitude (Figure 1), with an altitude of 200 to 400 m above mean sea level (msl). It is a rural area with some village settlements where agriculture is the main activity and the predominant agricultural activities are arboriculture (olive trees, citrus fruits and various fruit trees) and cereal cultivation.
The region is characterized by a semi-arid climate with an average annual rainfall of 395.5 mm, with the highest precipitation occurring in November. Notably, the winter season contributes significantly to the total rainfall. The average winter temperatures tend to be around 9.9 °C, while in the summer they average around 24.7 °C, resulting in an annual average temperature of 16.7 °C for the period between 2003 and 2023.
The study area spans a total of 1900 hectares. Of this, 912 hectares are irrigated using a collective network that relies solely on treated wastewater supplied by the Ain Houtz municipal wastewater treatment plant, located 11 km upstream. This facility provides an annual volume of 2 million cubic meters, which is distributed through a gravity-fed irrigation system managed by the National Office for Irrigation and Drainage (see Figure 1). Within the Hennaya Irrigated region, some farmers enhance their irrigation by supplementing the treated wastewater with groundwater extracted from wells or boreholes, utilizing their own independent irrigation systems. In areas outside this collective irrigation zone, irrigation is conducted exclusively through the autonomous use of groundwater resources.
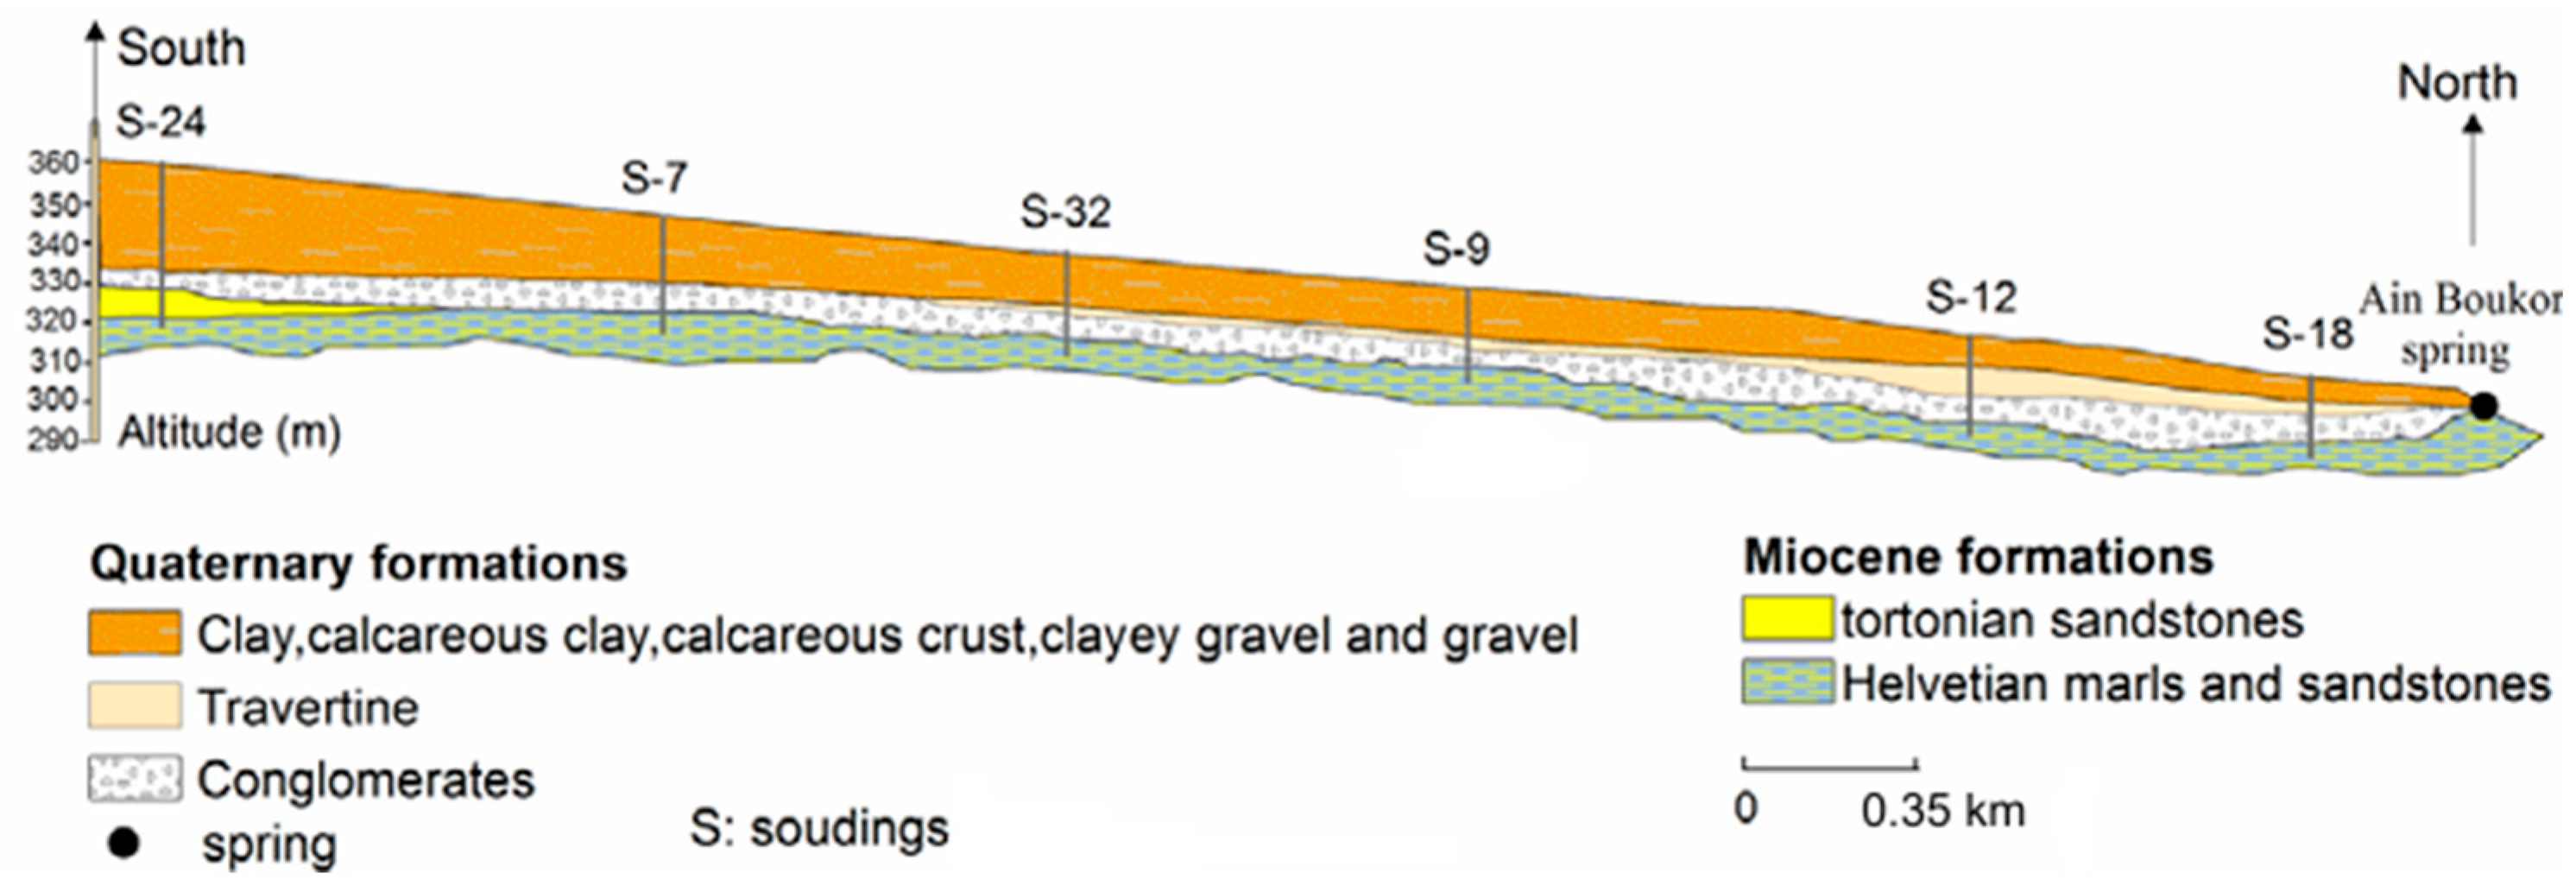
The Hennaya aquifer covers an area of approximately 29 km2. This aquifer is of Plio-Quaternary age, featuring a Tortonian horizon in the north and alluvial deposits in the south. Its thickness reaches a maximum of 17.8 m. The marl substratum varies in depth, from approximately 400 m in the south to 200 m in the north, and extends toward the outlet [40], which consists of a series of emerging springs that flow toward the Sikkak dam and the associated watercourse. At this outlet, a lithological contact facilitates groundwater flow, enhancing connectivity between the aquifer and surface water systems [41,42,43].
Geological studies show the presence of Tortonian sandstones and Quaternary sediments. The impermeable bedrock formations are represented by Helvetian marl with thin layers of sandstone (Figure 2a,b), which outcrop on the surface to the east and west, encouraging runoff [40].
This south-to-north cross-section illustrates Miocene formations (marl and sandstone) with a gentle northward dip, overlain by varied Quaternary deposits (conglomerates, travertines, clays, and gravels) [44] (Figure 3).
The soils in the region are predominantly clay and silt, hence the clayey-silty to clayey tendency. Limestone is also well-represented in the region [38].

2.2. Methodology Framework

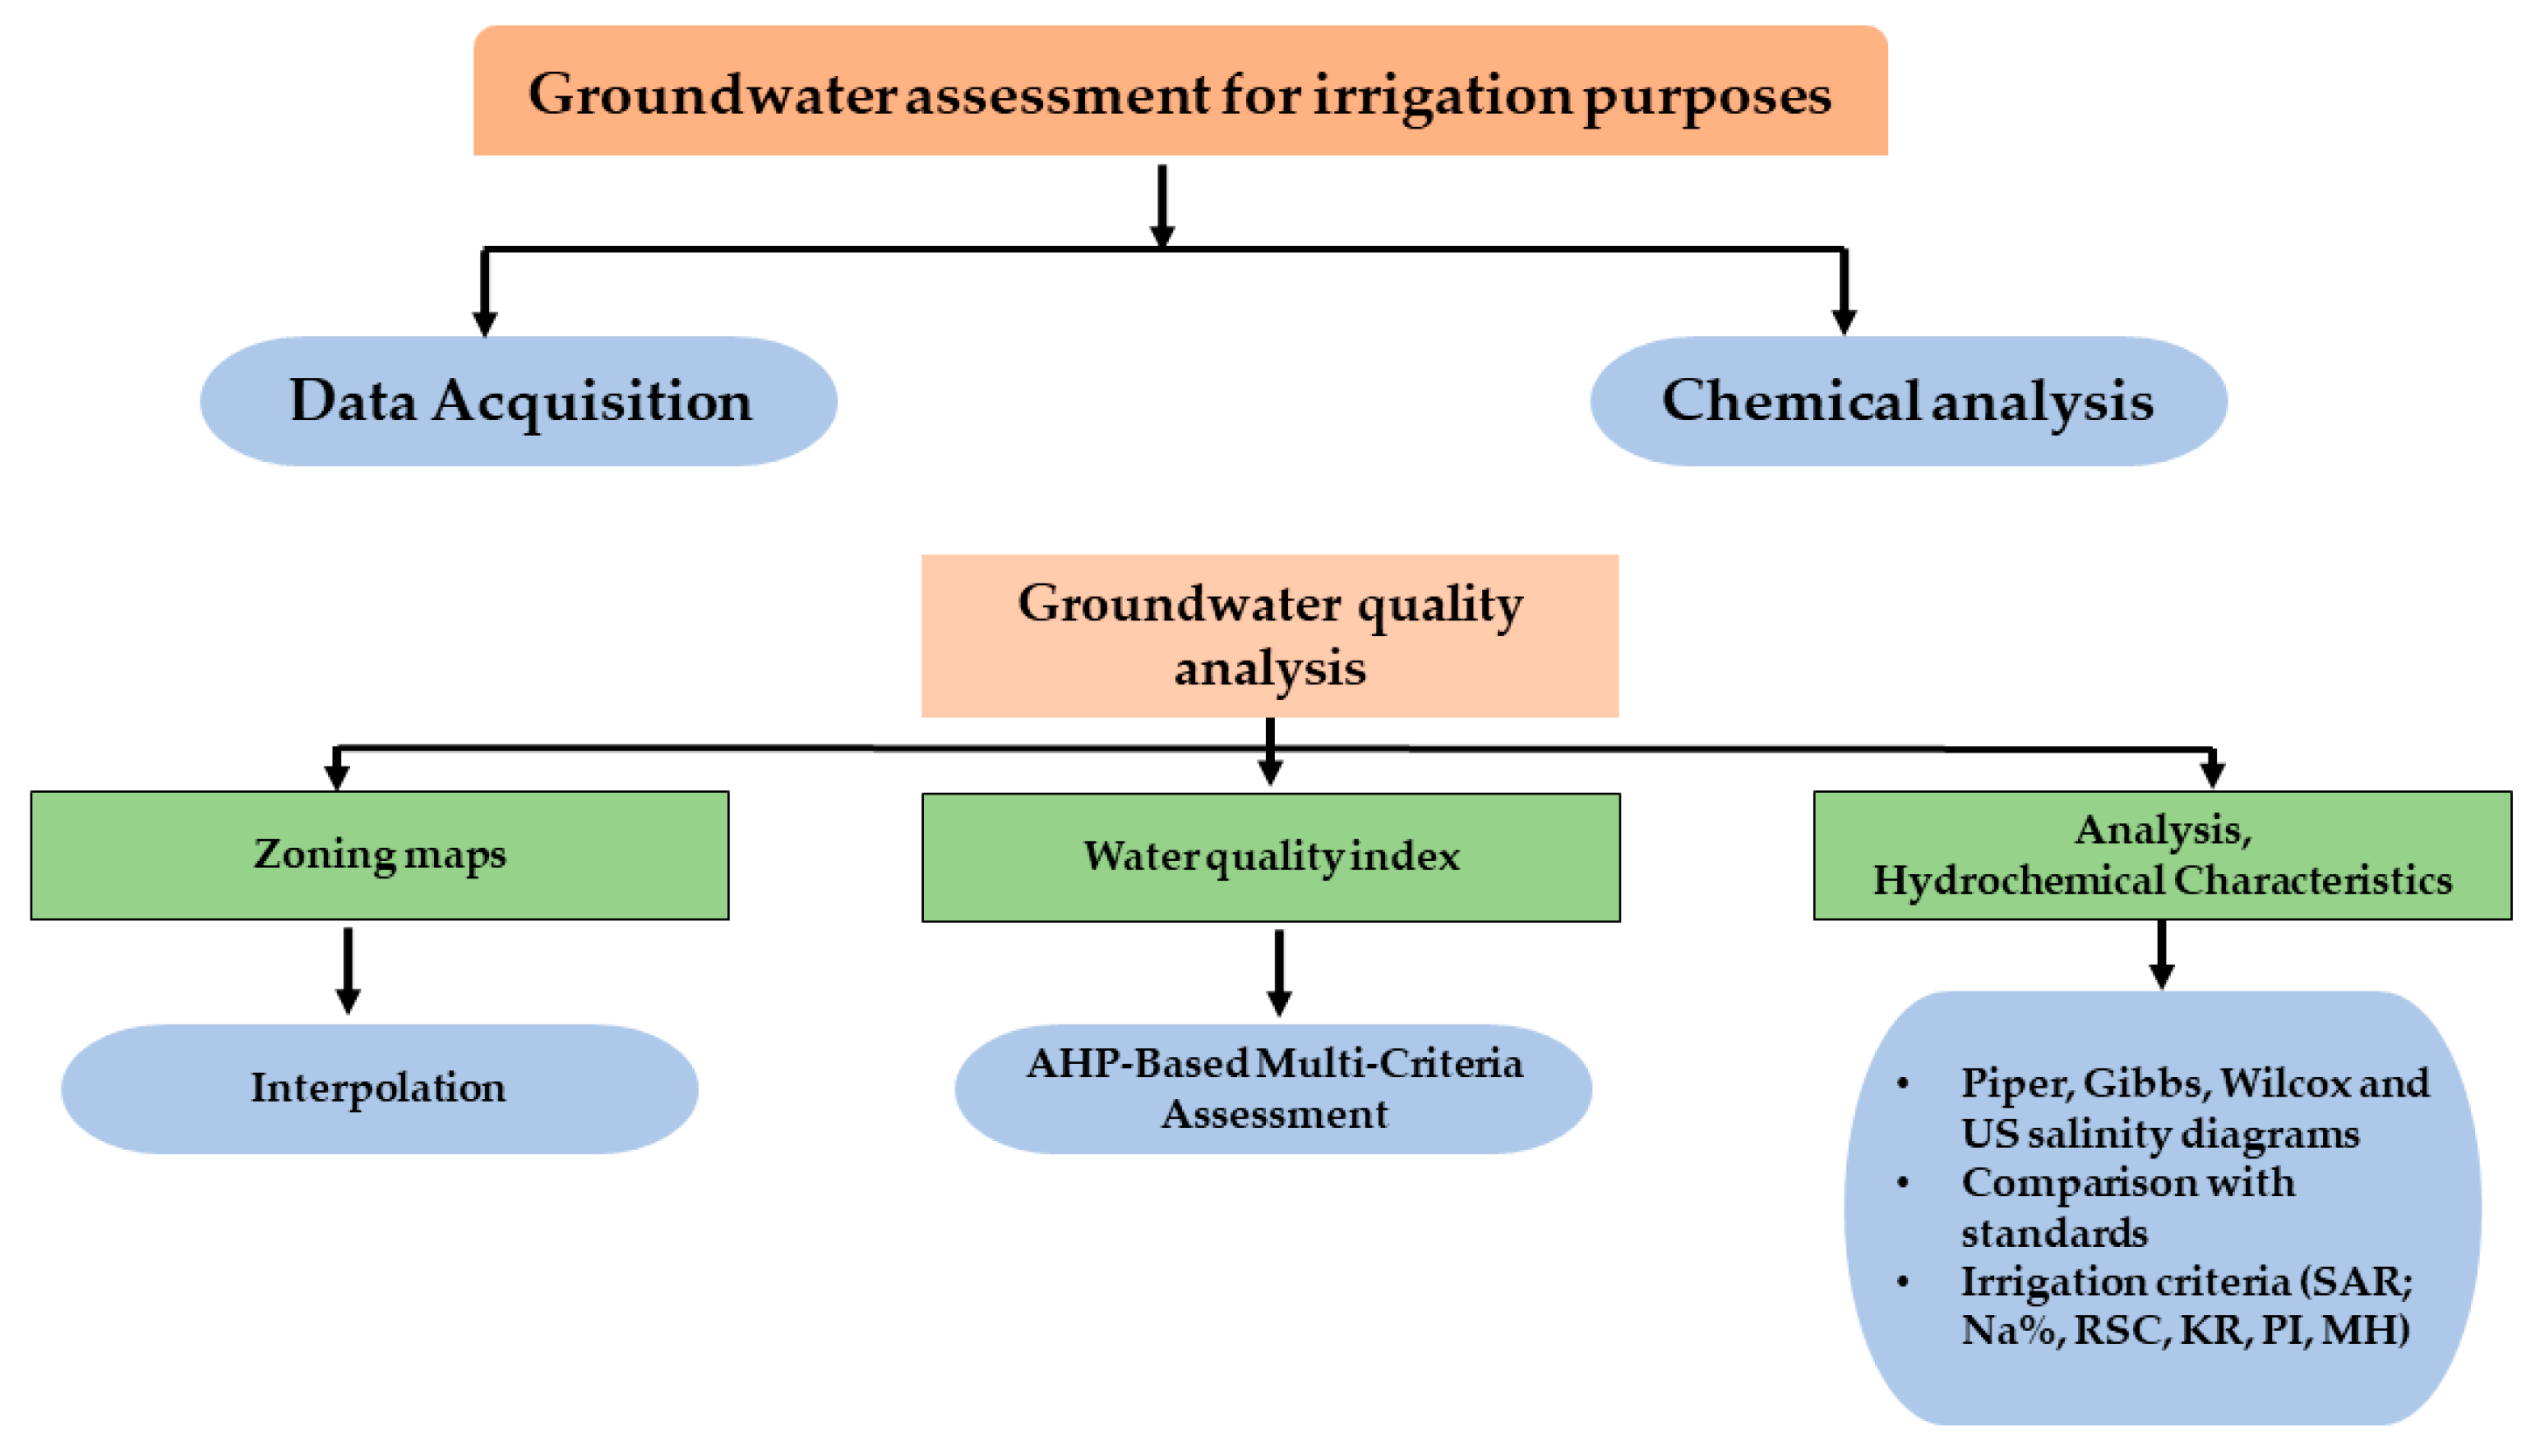
The applied method is structured in the methodology flow diagram (Figure 4) and discussed in detail in the specific sections below.
In general, the methodological approach consists of the following:
Step 1 details the initial measurements and characterization (Data Acquisition), where data for 15 physicochemical parameters were collected from the Hennaya Irrigated region. These acquired data were subsequently utilized to generate spatial distribution maps for each parameter.
In Step 2, the complete set of these 15 measured parameters (including pH, CE, TDS, major cations, anions, and nutrients) was used for the calculation of the Water Quality Index (WQI).
Step 3 focused on plotting key hydrochemical diagrams. Parameters such as TDS, Ca2+, Mg2+, K+, Na+, HCO3, SO4, and Cl were used to construct Piper, Gibbs, Wilcox, and US salinity diagrams to discern water types and their suitability.
Finally, Step 4 constituted the comprehensive analysis phase. This involved utilizing all measured physicochemical parameters along with the derived indices (WQI, SAR, RSC, Na%, KR, PI, MH). The Water Quality Index (WQI), which was calculated based on the Analytic Hierarchy Process (AHP), was further elucidated by generating a WQI map using spatial interpolation. This visual representation is crucial as maps offer an intuitive and readily understandable means of communicating the spatial variations in groundwater quality and the overall findings.

2.3. Groundwater Data Acquisition and Analysis

To assess groundwater quality, water samples were collected from twenty-five (25) wells and boreholes and two (2) springs representing the aquifer system’s outlet in the study area (Figure 1). The sampling points were selected based on a previous survey conducted with local irrigation area managers and complemented by a field trip to identify operational and equipped water points, ensuring representative coverage of active sources used for irrigation. Sampling was carried out once during the first 10 days of October 2022, at the end of the irrigation campaign and just before the rainy season. This timing minimized the influence of rainfall on groundwater quality, capturing baseline conditions unaffected by seasonal recharge. Due to the absence of prior water quality analysis reports for these locations, sample collection was conducted as a single event without parallel replicates or repeated collections. Fifteen (15) water quality parameters were analyzed. Polypropylene (PP) bottles were used for sample collection; these were rinsed several times with sampling water before collecting representative samples, which were then stored at 4 °C in portable coolers. Subsequently, all samples were sent to the Open LAB laboratory [45], the service provider, for analysis. This methodology reflects a practical compromise given resource constraints and the limited availability of historical data, while providing an initial comprehensive snapshot of groundwater quality relevant to irrigation in the Hennaya region. Future monitoring campaigns should consider sampling repetitions and quality control replicates to confirm temporal variability and ensure data reliability.
This research delves into the comprehensive analysis of groundwater samples, examining a range of physicochemical parameters to assess their quality and uncover the interplay of natural and anthropogenic influences on the studied aquifer. Key parameters include hydrogen potential (pH), electrical conductivity (EC), total dissolved solids (TDSs), Complete alkalimetric title (CAT), major cations such as calcium (Ca2+), magnesium (Mg2+), potassium (K+), and sodium (Na+), major anions like bicarbonate (HCO3), sulfate (SO42−), and chloride (Cl), total hardness (TH), as well as nitrogen and phosphorus compounds including nitrate (NO3), nitrite (NO2), and phosphorus (P). These parameters were carefully chosen due to their critical role in evaluating groundwater quality and their ability to reflect both environmental and human-induced impacts on the aquifer system.
The determination of the concentrations of physicochemical elements is done according to the international methods and standards (Table 1).
To obtain the spatial distribution of physicochemical parameters, fifteen groundwater quality maps were generated using the ArcGIS 10.8.2 tool. For intuitive and accurate visualization of groundwater hydrochemical parameters, spatial interpolation was performed using Kriging as a geostatistical interpolation. This approach enabled the identification of spatial variability and potential hotspots of groundwater contamination or suitability across the study area.

2.3.1. Gibbs Diagram

The Gibbs diagram is used to infer the mechanisms controlling groundwater chemistry, distinguishing between three primary processes: precipitation dominance, rock (lithological) dominance, and evaporation–crystallization dominance [46].
The Gibbs diagram illustrates the relationship between the lithological properties of aquifers and the composition of water. It consists of three main domains: the interaction between water and rock, evaporation, and precipitation [47]. However, this diagram does not explicitly account for the effects of human activities on hydrochemical components. The Gibbs diagram deals with the relationship between the lithological properties of aquifers and the water composition [48].
In a Gibbs diagram, scatter plots were represented on the abscissa, while Total Dissolved Solids (TDSs) were on the ordinate. Gibb’s ratios are calculated using the following equations (Equations (1) and (2)):
R a t i o   f o r   c a t i o n s = ( N a + + K + ) ( N a + + K + + C a + + )
R a t i o   f o r   a n i o n s = C l ( C l + H C O 3 )
Note that the units of representation for all ionic concentrations are meq/L [47].
Unlike most surface waters, groundwater has the ability to span the entire range of Na+/(Na+ + Ca2+) values (i.e., from <0.1 to >0.9) at mid-range TDS levels [49].

2.3.2. Piper Diagram

Understanding groundwater geochemical dynamics was achieved through the use of the Piper plot or diagram. Various groundwater facies were classified using this Piper diagram, which is a widely recognized trilinear graphical representation [50,51]. The Piper diagram categorizes and interprets water types based on the relative concentrations of major cations (such as Ca2+, Mg2+, Na+, and K+) and anions (such as Cl, SO42−, and HCO3, CO32−).
This diagram is composed of two triangular sections and a field with a diamond shape. The cations are represented as a single point in the left triangle based on their total cations, while the anions are positioned in the opposite triangle [19]. For each parameter, a parallel line is projected into the top field. The intersection of this parallel with the upper border demonstrates the interaction between cations and anions, which characterizes the water. Piper diagrams can be used to illustrate the general chemical properties of water samples as well as the proportion of different ions. Furthermore, by combining Piper diagrams with geological and hydrogeological data from the study area, it is possible to analyze the evolution of the chemical composition of groundwater [52].
All hydrochemical diagrams, including Piper, Gibbs, Wilcox, and US Salinity diagrams, were constructed by plotting the relative concentrations of major cations and anions using DIAGRAMMES software (version 6). The Piper diagram combines cation and anion ternary plots into a diamond-shaped field to classify hydrochemical facies. The Gibbs diagram distinguishes water formation mechanisms based on ion ratios and total dissolved solids. Wilcox and US Salinity diagrams assess irrigation suitability using established plot criteria. This software enabled precise visualization and standardized classification of groundwater quality and irrigation suitability.

2.4. Hierarchical Clustering Analysis

Hierarchical clustering analysis is an unsupervised pattern identification method that reveals inherent structures within a dataset without prior assumptions, categorizing objects into clusters based on their similarity [53]. This multivariate statistical method is very useful for figuring out the quality of water because it shows how samples and factors naturally group together. In this study, we used Ward’s method and Euclidean distances to find the most similar items in the normalized dataset and then did hierarchical agglomerative clustering on them. The Euclidean distance quantifies the similarity between two samples. The ‘distance’ represents the ‘difference’ between analytical values from both samples [54]. Ward’s method uses an analysis of variance approach to assess distances between clusters, seeking to minimize the sum of squares of any two clusters generated at each phase, resulting in compact, spherical clusters [55]. To discover regional variability patterns, we used this approach with our water quality dataset, which included 15 physicochemical characteristics collected from multiple distinct sample sites. In the resulting dendrogram, the linkage distance is displayed as Dlink/Dmax, representing the quotient of the linkage distance for a specific example divided by the maximal distance, multiplied by 100 to standardize the linkage distance represented on the y-axis [56,57]. The hierarchical clustering results were visualized through dendrograms, heatmaps, and radar charts to facilitate the interpretation of the identified water quality patterns and their potential relationships with hydrogeological processes and anthropogenic influences.

2.5. Groundwater Quality Evaluation for Irrigation

2.5.1. Groundwater Quality Criteria for Irrigation Purpose

(1) The Sodium Adsorption Ratio (SAR): developed by the U.S. Salinity Laboratory Staff [58], and can be calculated using Equation (3):
S A R   ( m e q L ) = N a + ( Ca 2 +   +   Mg 2 + ) 2    
Purpose of using SAR is to assess the potential damage to soil structure, specifically permeability reduction, caused by excessive sodium relative to calcium and magnesium in irrigation water [58].
(2) Residual Sodium Carbonate (RSC): proposed by [59], uses Equation (4).
R S C   ( m e q L ) = ( CO 3 2   +   HCO 3 ) ( Ca 2 +   +   Mg 2 + )
This parameter evaluates the hazard posed by high carbonate and bicarbonate levels which can precipitate calcium and magnesium, effectively increasing the relative sodium concentration [59]. Ref. [60] noted that CO32− concentrations are generally low at pH below 8.3.
(3) Sodium Percentage (Na%): calculated as:
N a % = N a + N a + + K + + C a 2 + + M g 2 +     100
It is a widely used index in irrigation water assessment, often used in classifications such as that by [61]. It indicates the proportion of sodium relative to total cations to evaluate potential sodium hazards [58].
(4) Kelly’s Ratio (KR): this index serves as a key metric for evaluating the suitability of groundwater for irrigation purposes. A KR value below one signifies low salinity, making the water safe for irrigation use. Conversely, groundwater with a KR value exceeding one is deemed unsuitable for irrigation [62]. KR can be estimated using the following Equation (6)
K R = N a + C a 2 + + M g 2 +
(5) Permeability Index (PI): serves as an important indicator for assessing water quality and its potential impacts on agricultural soil degradation [63]. Following the classification system established by [64], groundwater samples were categorized into three suitability classes: Class I (suitable), Class II (doubtful), and Class III (unsuitable). This parameter is calculated using:
P I = N a + + H C O 3 C a 2 + + M g 2 + + N a +   × 100
(6) Magnesium Hazard (MH): calcium (Ca2+) and magnesium (Mg2+) typically exist in equilibrium in groundwater. While both ions contribute to soil structure and serve as essential plant nutrients, elevated concentrations can adversely affect soil properties. Excessive Ca2+ and Mg2+ levels may raise soil pH, potentially leading to soil salinization [65]. Notably, agricultural studies demonstrate that high Mg2+ concentrations particularly degrade soil quality and reduce crop yields [66]. This phenomenon, known as the magnesium hazard (MH), serves as a critical water quality parameter for irrigation. When present in excess, magnesium can alkalinize soil and diminish agricultural productivity [67]. The magnesium hazard is quantitatively assessed using Equation (8).
M H = M g 2 + C a 2 + + M g 2 + × 100

2.5.2. Water Quality Index

The Water Quality Index (WQI), a critical tool for environmental management [68,69,70], integrates multiple physicochemical parameters into a single value to assess and compare groundwater quality [71,72], enabling decision-makers to evaluate the combined impact of water quality criteria and support effective policy-making in the study area.
WQIs may have become more popular recently, but the concept in its major basic form was first introduced more than 150 years ago, in 1848 in Germany, where the presence or absence of certain organisms in water was used as an indicator of the quality of a water source [73]. WQIs are used extensively in research assessing water quality and are becoming more crucial in the management of water resources [74].
Suitability for irrigation has been a central focus of numerous studies. These investigations thoroughly assess water quality, relying on quality indices that incorporate various diagrams and specific parameters of irrigation water to determine if it is appropriate for agricultural use [75,76,77,78].
Horton formulated an early Water Quality Index (WQI) model in the 1960s, based on ten water quality criteria considered essential for most aquatic environments [13], a new WQI akin to Horton’s index was also created in 1970 by the Brown group [79], Following Horton’s initial work, Brown et al., supported by the National Sanitation Foundation, developed the influential NSF-WQI by employing a large expert panel to refine parameter selection and weighting. This model became a foundation for subsequent indices [80]. The Scottish Research Development Department (SRDD) developed the SRDD-WQI. This model led to derivatives such as the Bascaron Index, House Index, and Dalmatian Index [81]. In 1982, the Environmental Quality Index was created for the Great Lakes [82], and in the mid-1990s, the British Columbia Water Quality Index (BCWQI) was established to evaluate water quality in British Columbia [83]. The Canadian Council of Ministers of the Environment later introduced the CCME WQI in 2001, based on the BCWQI model [83]. Since then, numerous other models, including the Liou Index, Malaysian Index, and Almeida Index, have been developed, resulting in over 35 WQI models worldwide for assessing surface water quality [80].
The construction of any WQI typically involves the following four processes [73,84,85,86]:
  • Selecting a parameter and allocating a weight:
Grasping the applications of WQIs relies on comprehending the parameters. There might be a lot of components in a sample of water [87]. If the WQIs had information on every possible ingredient, it would get complicated. Rather, one ought to choose a set of standards that represent the whole WQIs [73]. An index’s defined parameters might range from 4 to 26, and selecting parameters is an essential step in the index-building process [73,88]. Three distinct systems exist for choosing parameters: fixed, open, and mixed systems [87].
The researcher’s individual experiences and knowledge backgrounds influence the weight determination process, which may have some subjective consequences [89]. Therefore, to create a more realistic WQI model, the weights should be chosen and modified based on a thorough review of the literature, the measured data, and the background of the object [90].
Since SAR, %Na, EC, and TDS have a significant impact on irrigation groundwater quality, they were given the highest weighting rates. Due to its minimal impact on assessing the quality of water [19], the other parameters have the lowest weighting rate.
  • Proportional weight calculation. Equation (9) was applied to calculate the proportional weight (Wi) in this phase.
W i = w i i = 1 n w i
Wi is the proportional weight, n is the total number of parameters, and wi represents the weight of each parameter [91].
  • Rating scale for quality assignment quality. Equation (10) was used to establish the quality rating scale (qi) for each parameter.
q i = C i S i × 100
where qi represents the quality rating scale, and for each water sample, the concentration of each parameter (Ci) is divided by its respective standard or guideline value (Si) to calculate the quality rating scale (Table 1).
  • Sub-index value determination WQI calculation. In this phase, the sub-index values (SIi) for all chemical properties are calculated by multiplying the proportional weight, as given in Equation (11) [72], then summing all the sub-indices from all samples of the study area together to get the final WQI (Equation (4)).
S I i = W i × q i
where SIi, i is the parameter’s subindex [91]
W Q I = S I i  
The quality of groundwater can be classified according to the values obtained from the WQI.

2.5.3. The Analytic Hierarchy Process (AHP)

AHP, which [21] proposed and developed, is one of the most widely used Multi-Criteria Decision Analysis (MCDA) techniques. Pairwise parameter comparisons and expert opinions serve as the foundation for this methodology [92]
To make a decision in a guided way, Saaty has created four steps [93,94,95]
  • Defining and elucidating the context of the problem;
  • Dividing the decision-making problem into levels, starting at the top with the decision’s objective, moving down to specify criteria and options, and ending with a collection of alternatives;
  • Making pairwise comparison matrices and determining the relative weights;
  • Assessing the accuracy of the pairwise comparisons can be done by computing the consistency index (CI) and the consistency ratio (CR).
AHP is based on pairwise comparisons to determine each criterion’s relative weight. Decision-makers can use a verbal scale and pairwise comparisons to communicate their judgments on the scope of criteria. In multi-criteria situations, decision makers make subjective decisions [20].
To assess the extent of water quality for irrigation purposes within the Hennaya Irrigated region, the Analytic Hierarchy Process (AHP) was employed to establish the weights of the contributing water quality factors. The determination of these weights was conducted through a systematic process:
The pairwise comparison matrix necessitates a decision-making phase. A scale ranging from 1 to 9 is utilized to create the pairwise comparisons, where 1 indicates equal significance and 9 represents the utmost importance [21] according to the following table (Table 2):

3. Results and Discussion

3.1. Hydrochemical Analysis Results

The data collected in the study area concern 15 physicochemical parameters that were determined in the laboratory. The table provides a statistical description of the analysis results (Table 3).

3.2. Hydrogeochemical Evaluation

Groundwater experimental analysis conducted in the Hennaya irrigated region, in accordance with international standards, generated valuable data for the characterization of the aquifer and the evaluation of regional groundwater quality.
The spatial distribution of physico-chemical parameters was delineated using Kriging interpolation, a geostatistical method implemented in ArcGIS software. Figure 5 illustrates these distributions.
The case study is an alkaline zone, defined as having a potential of hydrogen (pH) greater than 7.0. It has an average pH of 7.73 and a minimum and a maximum of 7.09 and 8.02, respectively. These results are in line with those of the Hennaya Irrigated region research [43], which found a mean pH of 7.47.
Alkalinity is the groundwater’s capacity to neutralize acids, which represents a buffer capacity to maintain pH balance. This characteristic is associated with the presence of essential compounds in the water, such as carbonates, bicarbonates, and hydroxides. Alkalinity is expressed in CAT (Complete alkalimetric title). All values range from 321 to 369 mg/L as CaCO3. Excessive alkalinity in irrigation water causes carbonates to precipitate out and degrade soil structure, blocking nutrient uptake by plants, and leading to the risk of scaling up irrigation systems [96], which requires management strategies to prevent soil pH increases, especially since the FAO recommends a threshold of 200 mg/L as CaCO3 for irrigation water [97].
Total dissolved solids (TDSs) are the residue left behind from the evaporation of a filtered water sample. TDS in natural water is made up of significant ions such as Ca2+, Mg2+, K+, Na+, HCO3, SO42−, Cl, and other minerals and nutrients that have dissolved in the water [67].
For irrigation use, the FAO recommends 2000 mg/L as an acceptable threshold. Admissible [98], because dissolved salts increase the osmotic pressure of the soil, requiring more energy for plant absorption, leading to increased respiration and a gradual decrease in plant growth and yield.
The TDS concentrations in the samples from our research area vary from 990 to 1930 mg/L. All TDS values obtained are adequate for agricultural use (<2000 mg/L according to [97]). For human consumption, the TDS values remain far from the preferred value of 1000 [99] except for one sample (S26; 990 mg/L), and this situation can be explained by the use of irrigation with treated and sometimes raw sewage water. This is due to the leaching of salts from the soil and also domestic sewage that may percolate into groundwater, leading to an increase in TDS values [100].
The samples from the study area have an EC ranging from 1247 to 2010 (μS/cm), with an average value of 1622 (μS/cm). According to the results of [101], the EC values are below 3000 (μS/cm). These results allow us to classify the groundwater in the study region as slightly saline water according to the FAO classification [97].
Calcium concentrations range from 105.2 to 188.8 mg/L, which falls within the range allowed by Algerian standards, setting a maximum value of 200 mg/L [102]. These values are significantly lower than those observed in the Ain Sefra region, located 300 km south of our study area, where [19] reported a range between 12 and 427 mg/L. [103] reports an average of 80 mg/L in the Maghnia region (60 km to the west). The values obtained in our study confirm the extent of the limestone environment, where the most common concentrations range between 70 and 120 mg/L [104].
The study area exhibits magnesium concentrations ranging from 46.48 mg/L to 75.64 mg/L. 89% of the magnesium results exceed the standard set by the [105] (with the exception of samples S7, S8, S9) are within the standard limits (around 50 mg/L [99]). In reality, these values are strongly correlated with the flow of water through geological formations, as there is a predominance of carbonate rocks (such as calcite and dolomite) across the study area [106].
Sodium is a widely occurring element in nature. The values at the water sampling points in our study area range from 95.24 to 141.26 mg/L (the highest permissible concentration in drinking water being 200 mg/L). These values differ from those of the groundwater in the Ain Oussera plain (center of the country), which range from 19 mg/L to 528 mg/L [16,17] found in their study a range of sodium between 218.5 and 330.3 mg/L. Moving south from our study area, elevated sodium levels were reported in the Naama region [107], where sodium ranged from 5 to 1114 mg/L. Similar values (below the Algerian standard of 200 mg/L) were found in Tunisia [108]. The risk of stroke increases linearly with the increase in dietary sodium intake; according to [109], 20% of all stroke deaths are attributable to high-sodium diets.
The average potassium concentration ranges from 1.17 mg/L in sample S19 to 4.52 mg/L in sample S1, with all samples remaining below the standard recommended by Algerian law, which sets the threshold at 12 mg/L [110].
Situated between previous studies, we find that the Bouhanifia plain records a range between 22.31 and 44.22 [17], the Adrar region between 7 and 28.6 [111], the Ouessara region between 2 and 52 [16], and in Tunisia [108] a potassium range between 3 and 90.2 mg/L.
Potassium concentrations in irrigation water typically pose minimal risk, as potassium is both an essential plant nutrient and rarely exceeds levels harmful to soils or crops. Furthermore, health-based limits for potassium in drinking water are unnecessary, given that common beverages naturally contain significantly higher potassium levels than groundwater. Establishing stringent regulatory thresholds based on beverage standards would be nutritionally unsound [112].
The order of cation concentration is descending in the following order: Ca2+ > Na+ > Mg2+ > K+, with average concentrations of 188.78, 141.26, 75.64, and 4.52 mg/L, respectively.
The average chloride values in this study area ranged from 154.25 mg/L in sample S3 to 349.54 mg/L in sample S1. All water points comply with Algerian standards (500 mg/L) [110]. According to [113], the western region of Algeria (Oranie Chott Chergui hydrographic basin) shows chloride concentrations up to 3600 mg/L. In the same region, [17] found concentrations between 258 and 344 mg/L. For the Naama region, the chloride range is 9.92–2815.3 mg/L [107].
The presence of bicarbonates in water is due to the dissolution of carbonate formations. The concentration of bicarbonates in water depends on the lithological nature of the traversed terrains [114]. Bicarbonate concentrations range from 390 to 470 mg/L. These values are higher compared to the bicarbonate levels found in the Naama watershed, where they ranged from 190 to 272 mg/L [115].
The toxicity of nitrate to aquatic animals increases with rising nitrate concentrations and exposure times. However, nitrate toxicity may decrease with larger body size, water salinity, and environmental adaptation. The main sources of nitrates in groundwater are chemical fertilizers and treated wastewater in the irrigated area [116]. Our study area encompasses approximately 900 hectares irrigated with treated wastewater from the sewage treatment plant of Tlemcen city, in addition to residential domestic waste and chemical fertilizers, leading to nitrate excess [116]. Despite nitrogen pollution decreasing with groundwater depth [117].
The nitrate concentration in the groundwater of the study ranges from 46.72 mg/L at sampling point S8 to 145.38 mg/L at sampling point S1, with an average value of 85.45 mg/L. The Algerian standard sets the limit at 50 mg/L as the threshold [110]. Only 3 samples met this standard (S7, S8, and S23).
These values significantly differ from results reported in other regions: Adrar with 15–29.28 mg/L [111]. Djelfa region with 0.07–72.9 mg/L [118], and Bouhnifia with 0.47–0.96 mg/L [17]. This notably reflects the impact of irrigation with treated or raw wastewater on groundwater in terms of nitrogen-related pollution.
Nitrites, like nitrates, should be considered of anthropogenic origin [119]. Nitrites formed by the reduction of nitrates are likely to bind to hemoglobin [120], reducing the red blood cells’ ability to transport oxygen [121]. The nitrate values expressed previously justify the nitrite values detected in the analyzed samples; an average of 0.77 mg/L was found with a maximum of 1.45 mg/L and a minimum of 0.41 mg/L, all wells exceeded the threshold defined by Algerian standards (0.2 mg/L) [110] and remain around the limit set by the World Health Organization [99].
Sulfates, the most common form of dissolved sulfur in natural waters, mainly originate from two sources: geochemical and atmospheric [122]. Due to the high solubility of sulfates, groundwater can contain up to 1.5 g/L under normal conditions [123]. The groundwater samples show an average sulfate concentration ranging from 69.43 to 153.54 mg/L, with an average of 98.16 mg/L. These levels remain below the threshold recommended by Algerian standards (400 mg/L) [102]. These sulfate levels are significantly lower than those obtained in the study conducted by [18] in the Ouargla Basin, in southern Algeria, where the minimum value of sulfates is 476.00 mg/L, or in the Merdja plain (Far East of the country) [124], where sulfate levels range between 204 and 900 mg/L.
The average concentration of anions follows a descending order: HCO3 > Cl > SO42− > NO3, with respective values of 430.78, 213.85, 98.16, and 85.45 mg/L.
The study of the occurrence and fate of phosphorus has often been limited to surface water rather than groundwater [125]. P in groundwater has been increasingly recognized in recent years, and it is increasingly accepted that groundwater can have phosphorus concentrations exceeding thresholds of ecological relevance [126].
In their study, [127,128] focus on mass transfer between groundwater and surface water by quantifying the amounts of phosphorus transported by groundwater to a lake.
In our study area, phosphorus values are relatively high due to excessive irrigation with treated wastewater, but remain largely below the Algerian standard (5 mg/L) [110]. The laboratory values obtained oscillate between 0.02 and 0.4 mg/L.

3.3. Origin of Hydrogeochemistry

3.3.1. Gibbs Plot

Figure 6a,b present the Gibbs distribution plots—specifically the Na+/(Na+ + Ca2+) versus TDS and Cl/(Cl + HCO3) versus TDS diagrams. Analyzing these plots enables us to reveal several noteworthy hydrogeochemical characteristics:
(a)
Position and Distribution of Samples
All samples are located in the upper parts of both diagrams, aligned with the central part where the geochemical process is controlled by water–rock exchange. The samples cluster with TDS values ranging between 1000 and 2000 mg/L, and Na+/(Na+ + Ca2+) ratios between 0.4 and 0.6. This distribution is characteristic of rock dominance with a trend toward evaporation processes.
(b)
Dominant Geochemical Processes
Rock–Water Interaction: The central positioning of the groundwater samples indicates that the weathering of minerals and ionic exchanges with the aquifer’s rock matrix are the dominant processes governing the chemical composition of the groundwater. This interaction leads to the dissolution of silicate and carbonate minerals, releasing calcium, sodium, and bicarbonate ions into the water.
Evaporation Influence: The upper position of the samples in the diagram represents the domain of evaporation. This can be explained by the high drainage characteristics of the aquifer, particularly evidenced by samples S26 and S27, which are two discharge sources of the aquifer characterized by perpetual flow. The relatively high TDS values further support this evaporation influence.
Minimal Precipitation Influence: The absence of samples in the lower regions of the diagram (low TDS) indicates that direct precipitation has only a minor influence on the chemical composition of these groundwater samples.
(c)
Hydrogeological Implications: as outlined below:
i.
Aquifer Characteristics: The wells and boreholes studied are at medium depths (between 35 to 110 m), which contributes to the observed water–rock interaction patterns. The intermediate Na+/(Na++ Ca2+) ratios (around 0.5) likely indicate a mixed aquifer, composed of both carbonate formations (calcium source) and silicate formations containing sodium feldspars (sodium source).
ii.
Residence Time and Flow Dynamics: The dominance of rock–water interaction processes suggests a moderate to long residence time of water in the aquifer. The perpetual flow characteristics of discharge sources (S26 and S27) indicate active groundwater circulation within the system, which influences the overall hydrochemistry.
iii.
Climatic and Drainage Influence: The evaporation signature in the upper part of the diagram, combined with the high drainage characteristics of the aquifer, suggests a complex interplay between climatic conditions and hydrogeological factors in determining the final water chemistry.
iv.
Relative Homogeneity: The clustering of samples in a relatively restricted area of the diagram suggests a certain homogeneity in the geochemical processes controlling water chemistry across the studied aquifer, despite variations in well depths.
The consistency between both diagrams (cation and anion ratios), Figure 6a,b, respectively, strengthens the validity of this interpretation and confirms the significant mineralization of groundwater samples, resulting from substantial water–rock interaction and evaporative processes within this medium-depth aquifer system with its characteristic drainage patterns.

3.3.2. Piper Plot

The Piper diagram analysis reveals that groundwater samples in the study area predominantly plot in the “Chloride and sulfated calcium and magnesium” facies (Figure 7), indicating a mixed water type with no single dominant ion. The samples cluster near the calcium corner in the cation triangle with moderate magnesium content, while showing a mixed distribution between bicarbonate and chloride + Nitrate in the anion triangle. This composition of chloride, sulfate, calcium, magnesium, and bicarbonate, without abundant anions and cations, reflects the significant influence of the lithological factor in the region. The tight clustering of samples indicates a relatively homogeneous hydrochemical signature across the aquifer, confirming that water–rock interaction is the dominant process controlling groundwater chemistry, as also evidenced in the Gibbs diagram analysis. This mixed water type further supports the interpretation that the groundwater chemistry is primarily shaped by interactions with the local geological formations rather than by precipitation or extensive evaporation processes.
The analysis of groundwater in the study area reveals a composition of chloride, sulfate, calcium, magnesium, and bicarbonate, without abundant anions and cations. This classification indicates a mixed type of water, once again reflecting the effect of the lithological factor in the region.

3.4. Hierarchical Clustering Analysis Results

3.4.1. Parameter Clustering

The hierarchical clustering analysis of water quality parameters revealed distinct groupings based on their behavior across sampling sites (Figure 8). The dendrogram shows that the 15 parameters clustered into several meaningful groups with varying degrees of similarity. The first major cluster consists of EC, Ca2+, SO42−, and Cl, indicating strong correlations among these parameters. This association suggests that these parameters are influenced by similar hydrogeochemical processes, primarily related to water–rock interactions and dissolution of evaporitic minerals. The second notable cluster comprises Mg2+, NO3, and NO2, which points to a potential anthropogenic influence, particularly from agricultural activities in the watershed. The clustering of nitrogen compounds (NO3, NO2) with Mg2+ suggests possible co-contamination from agricultural fertilizers and soil leaching processes.
Parameters Na+, HCO3, and TH (total hardness) formed separate clusters, reflecting their distinct behavior in the hydrochemical system. The pH parameter formed an independent cluster, demonstrating its unique variability pattern compared to other parameters. This separation is expected as pH is controlled by multiple equilibrium processes and can be influenced by both natural and anthropogenic factors. The TDS (total dissolved solids) and CAT (complete alkalimetric title) parameters also formed individual clusters, indicating their composite nature that integrates multiple ionic contributions.

3.4.2. Sample Clustering

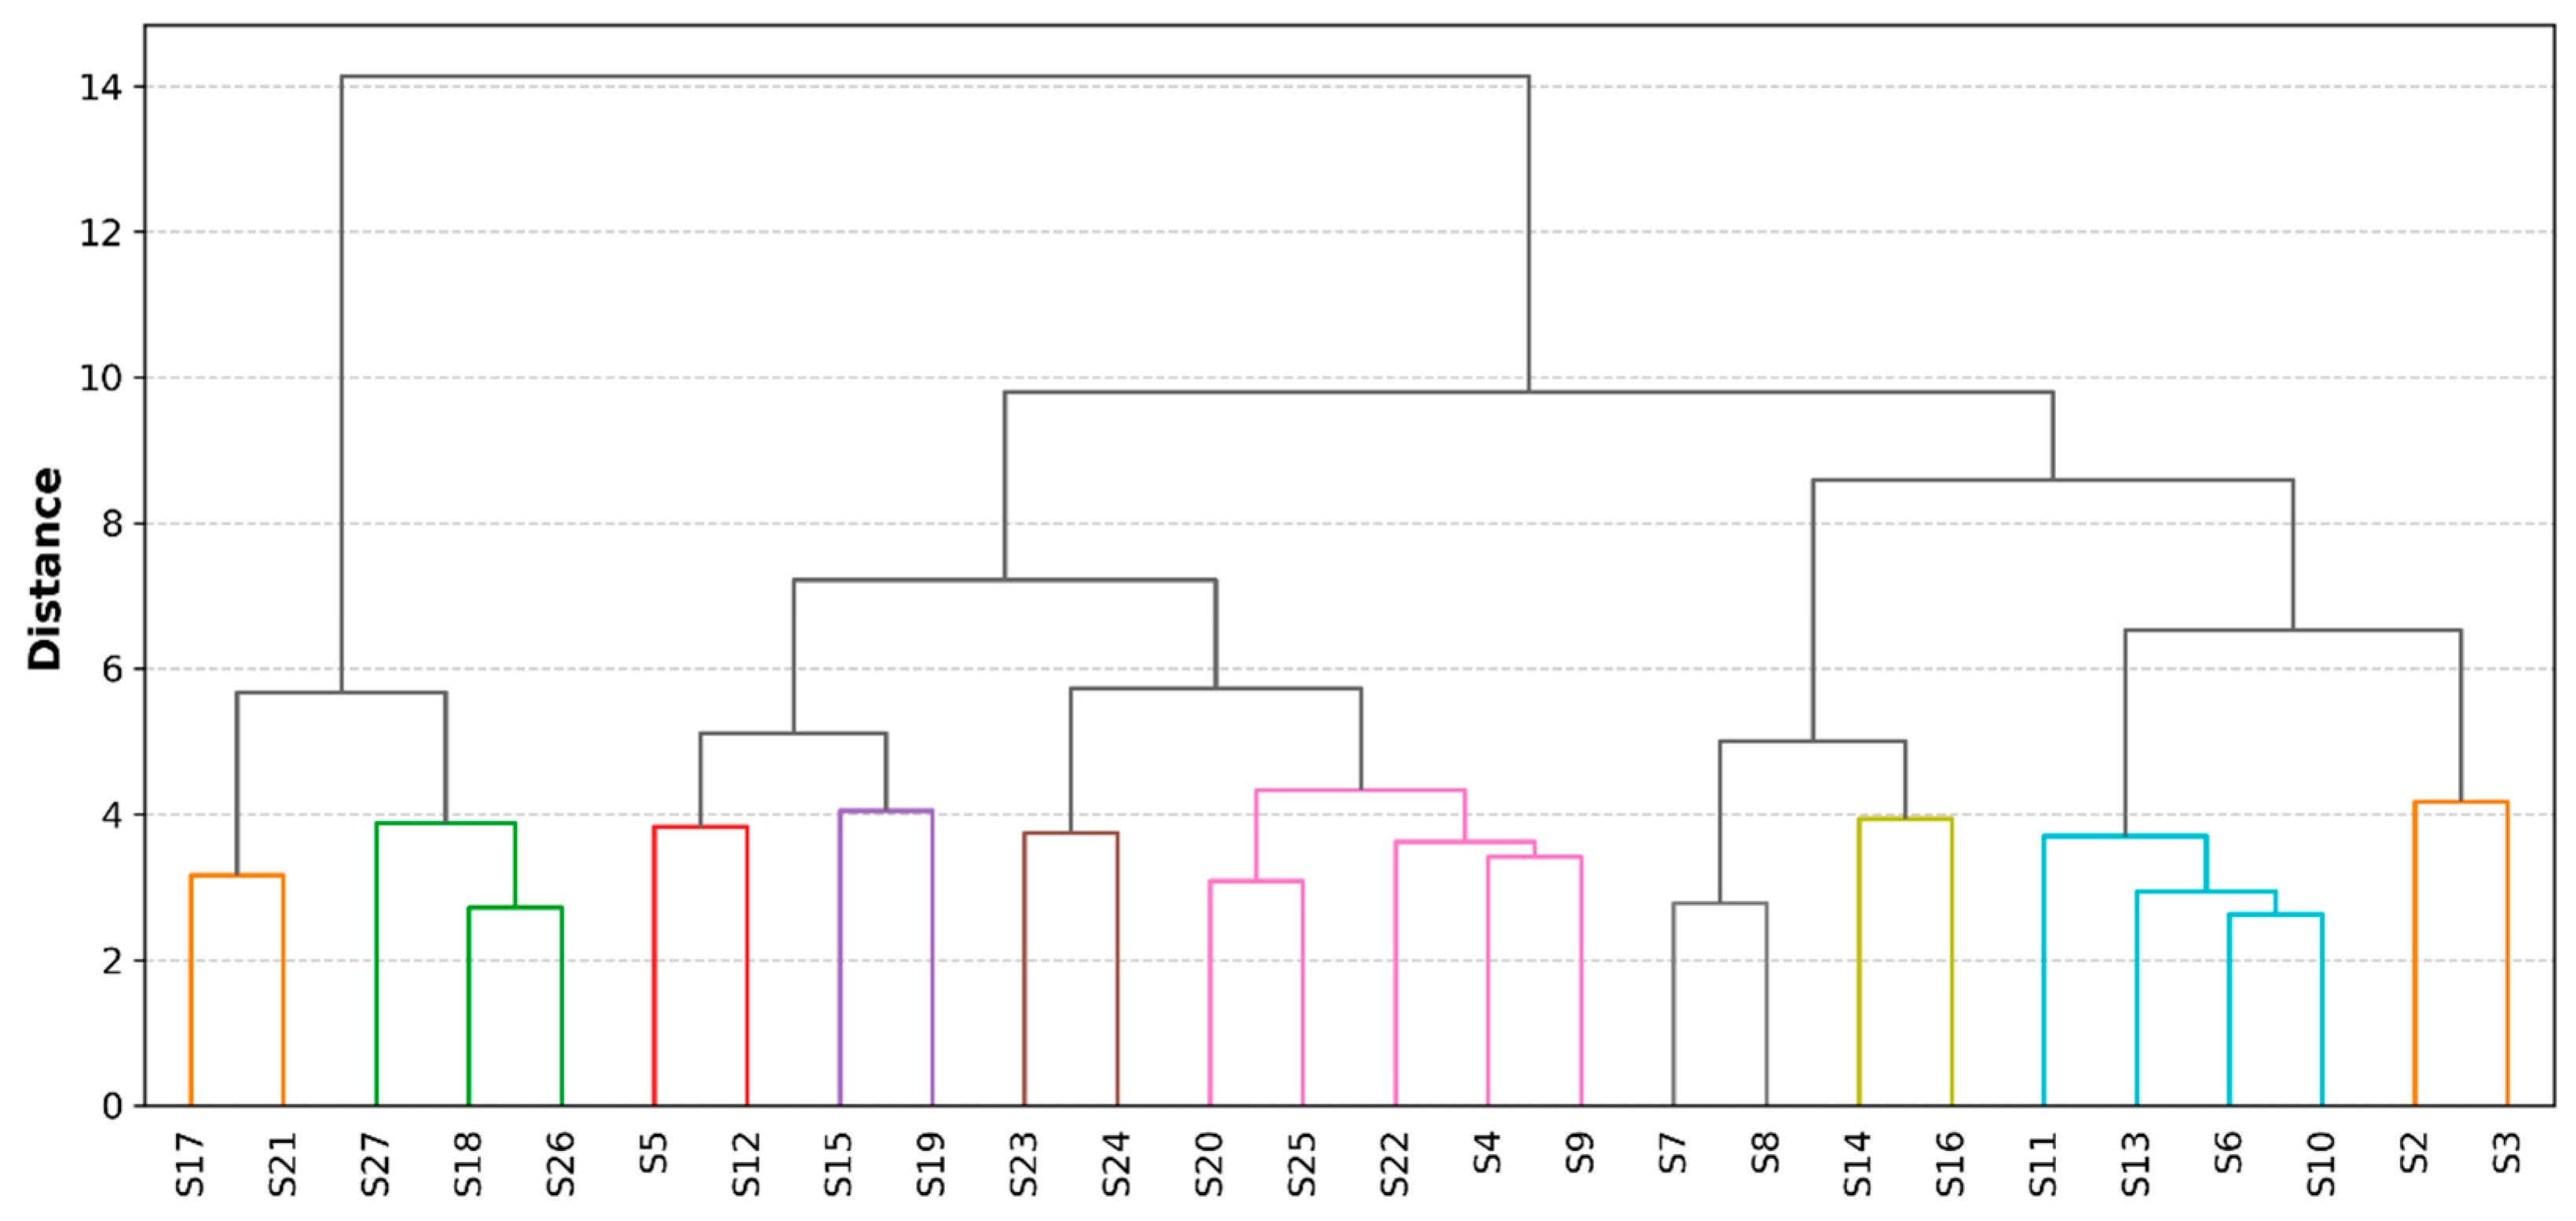
The hierarchical clustering of water samples identified 10 distinct clusters (Figure 9), revealing spatial patterns in water quality across the study area. Cluster 1, comprising samples S17 and S21, exhibited the highest concentrations of Ca2+ (184.00 ± 6.76 mg/L), Cl (282.88 ± 20.00 mg/L), and electrical conductivity (1947.50 ± 88.39 μS/cm), suggesting a strong influence of evaporitic mineral dissolution. This cluster also showed elevated nitrate levels (118.53 ± 15.73 mg/L), indicating potential anthropogenic contamination superimposed on the natural hydrogeochemical signature.
Cluster 2 (samples S18, S26, S27) displayed moderately high concentrations of major ions but was distinguished by a more balanced ionic composition compared to Cluster 1. The mean electrical conductivity (1764.00 ± 38.04 μS/cm) and calcium content (154.28 ± 10.90 mg/L) suggest intermediate mineralization, possibly reflecting a transition zone between different hydrogeological units.
Clusters 3 through 10 showed progressively decreasing mineralization, with Cluster 10 (samples S2, S3) exhibiting the lowest electrical conductivity (1309.50 ± 88.39 μS/cm) and chloride content (168.18 ± 19.69 mg/L). Interestingly, Cluster 7 (samples S7, S8) showed the lowest nitrate concentrations (47.93 ± 1.71 mg/L) despite moderate mineralization, suggesting these sampling points may be less affected by agricultural pollution compared to other sites with similar overall mineralization.
The hydrochemical interpretation identified distinct groundwater quality patterns across the study area, with some clusters exhibiting high mineralization and elevated concentrations of calcium, chloride, sulfate, and nitrates, likely due to evaporite deposits, water–rock interactions, and agricultural activities [129]. Other clusters showed more balanced or lower levels of mineralization and contamination, reflecting areas with greater recharge or less anthropogenic influence. These differences highlight the need for targeted management: highly mineralized and nitrate-rich zones require priority pollution control and monitoring, while less impacted areas should focus on preventive measures to maintain their current water quality [130].

3.5. Groundwater Quality Evaluation for Irrigation

Table 4 summarizes the main groundwater quality indices for irrigation in the study area. The results show moderate variability across parameters, with SAR and KR displaying the greatest consistency, while RSC and MH exhibit higher variability. Mean values for all indices are generally centered between their minimum and maximum, indicating a balanced distribution of groundwater quality characteristics throughout the region.

3.5.1. Irrigation-Specific Indicators

Sodium Adsorption Ratio (SAR)
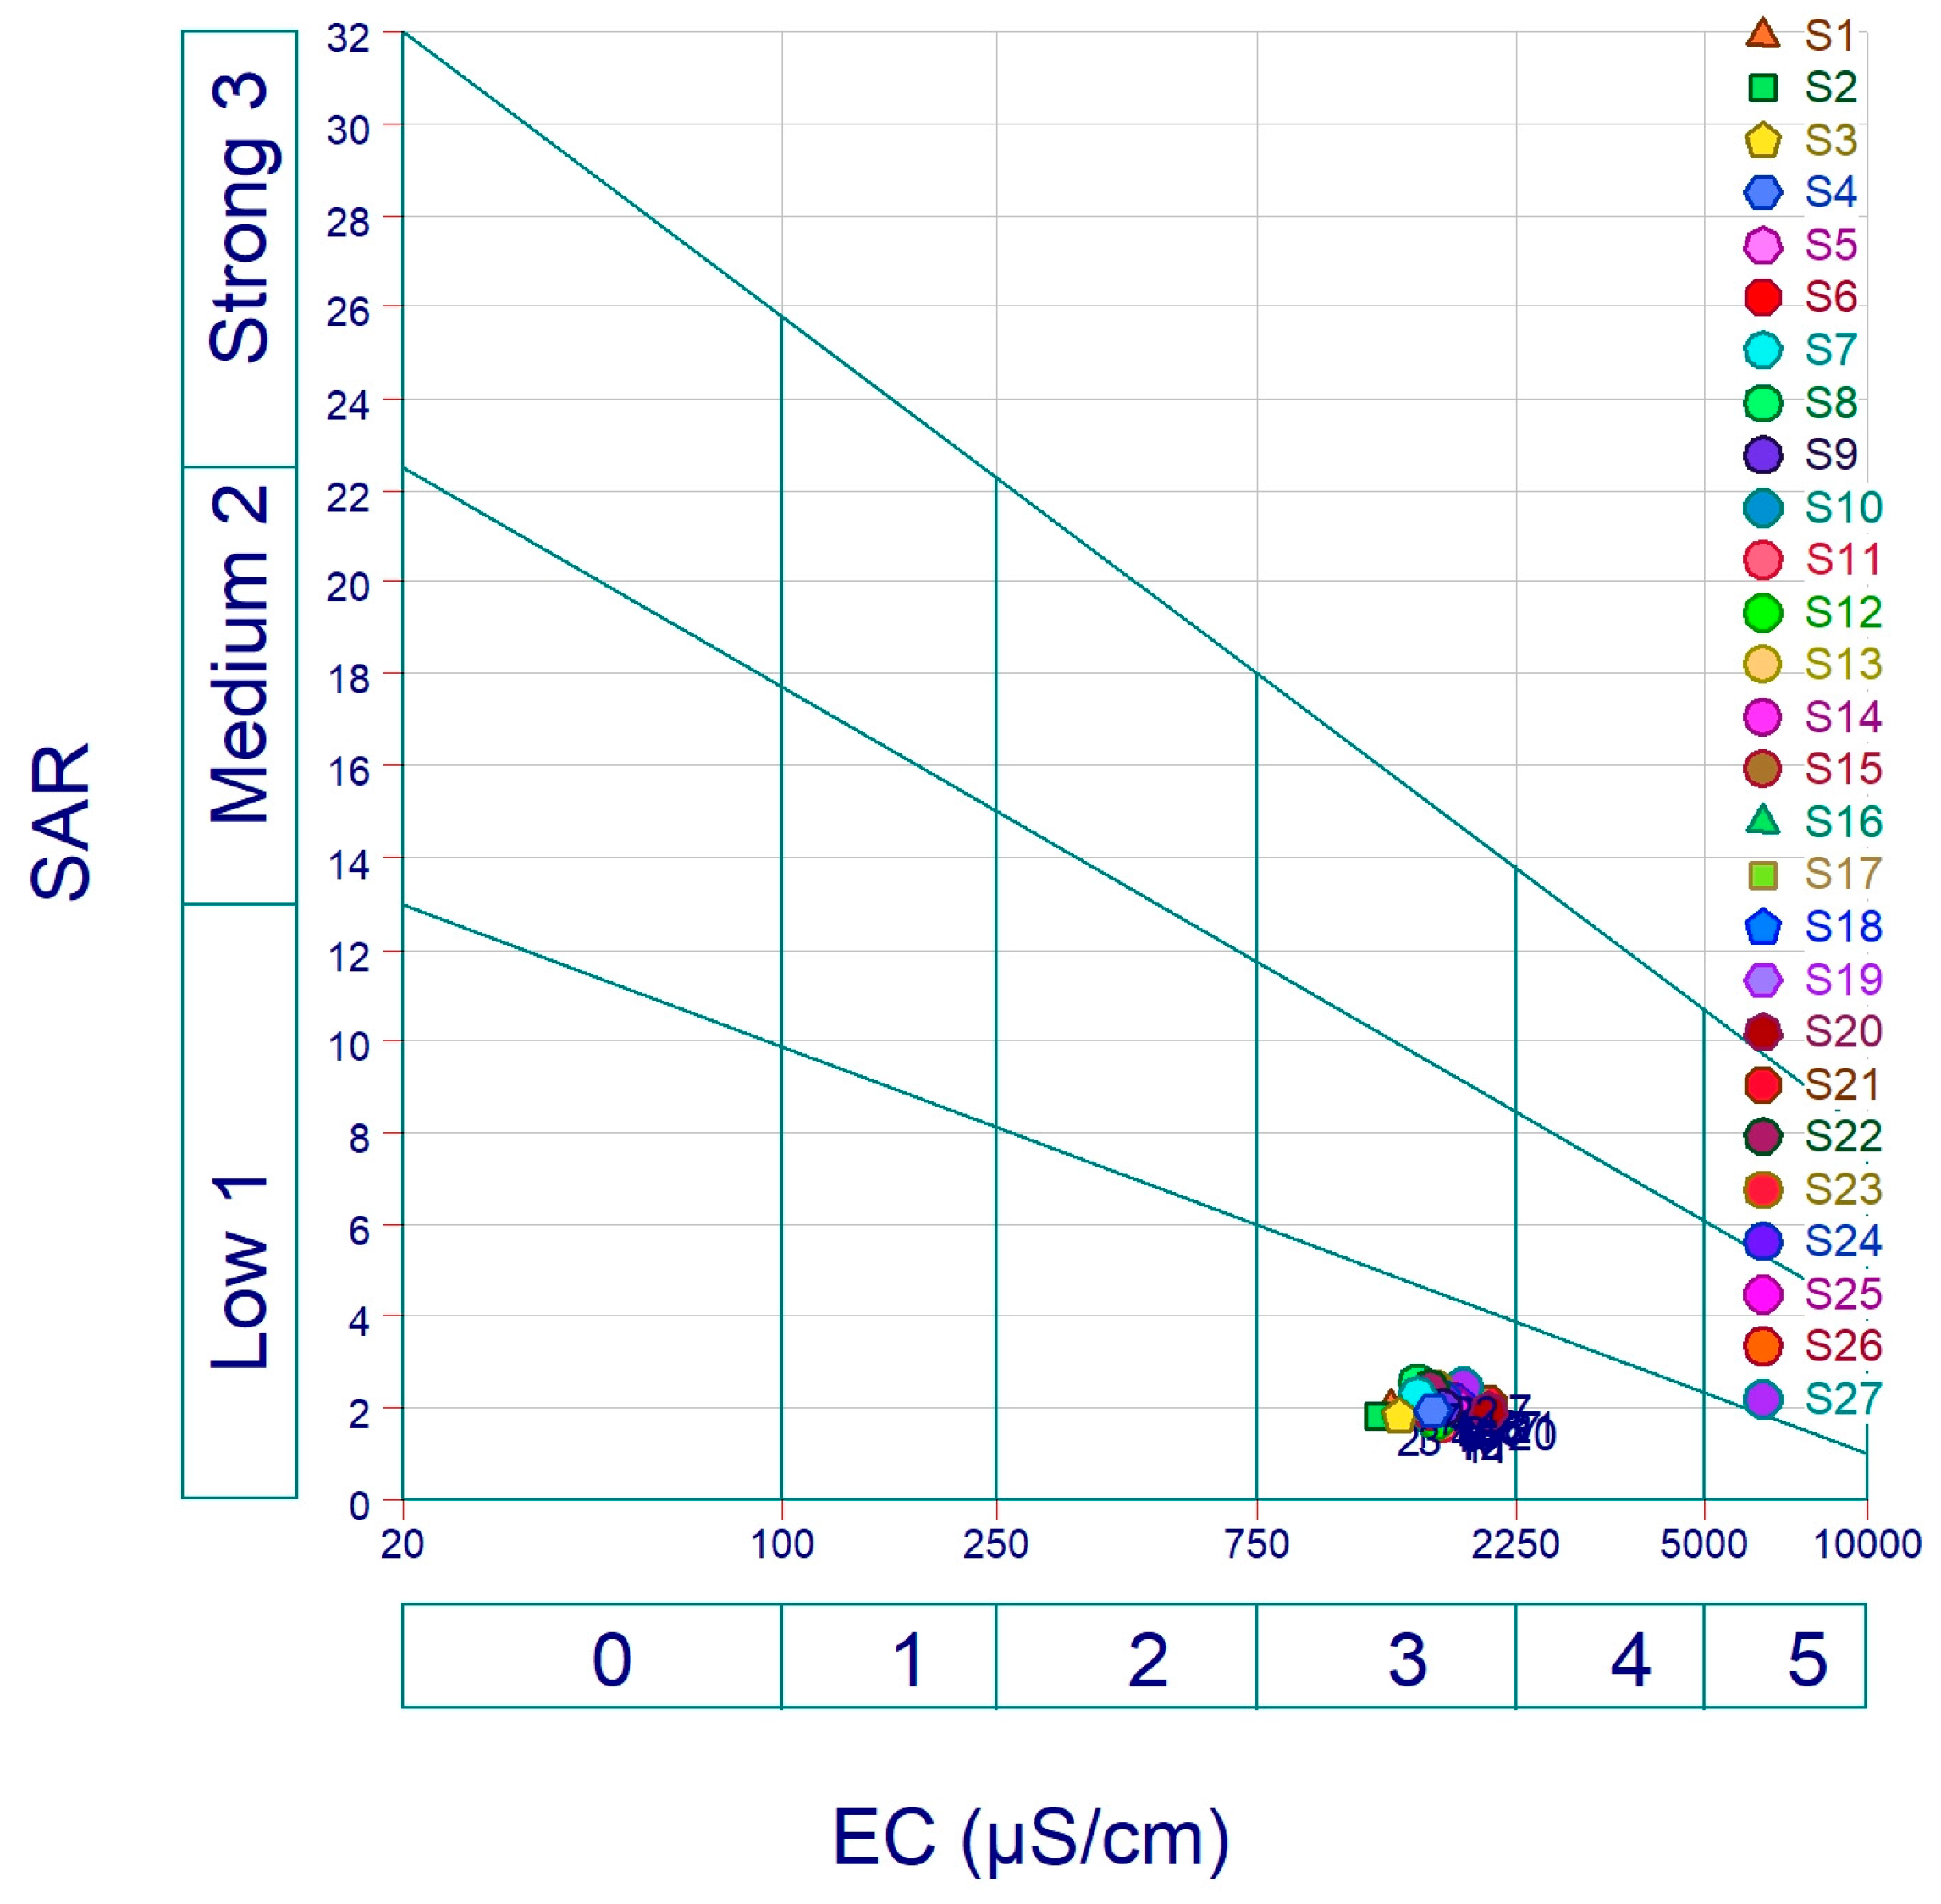
The SAR values range from 1.69 to 2.55 across the samples. As these values are all significantly below the threshold of 10, the groundwater is classified as having an ‘Excellent’ quality or ‘Low Sodium Hazard’ regarding SAR (Table 5). This suggests a minimal risk of soil permeability reduction or structural degradation due to sodium when using this water for irrigation. These results are confirmed after projection onto the Wilcox and US salinity diagram (Figure 10 and Figure 11).
Residual Sodium Carbonate (RSC)
All calculated RSC values are negative, ranging from −8.91 meq/L to −1.70 meq/L. Negative RSC values indicate an excess of Ca2+ + Mg2+ over carbonates and bicarbonates, falling well within the ‘Safe’ or ‘Good’ category (<1.25 meq/L). Therefore, there is no hazard associated with carbonate precipitation leading to increased sodium problems in the soil (Table 5).
Sodium Percentage (Na%)
The Na% varies between 24.22% and 36.98% for the groundwater samples analyzed. These percentages fall entirely within the 20–40% range, which is generally considered ‘Good’ for irrigation water quality. This classification suggests the proportion of sodium relative to other major cations is acceptable for most irrigation purposes without causing significant harm; these findings are validated by plotting on the Wilcox and US salinity diagrams (Figure 10 and Figure 11).
Kelly’s Ratio (KR)
The assessment using Kelly’s Index (KI) revealed that all groundwater samples were unsuitable for irrigation purposes. The recorded KI values, which ranged from 0.3208 to 0.5912 (Table 4), fell significantly below the permissible threshold of 1, reflecting low to moderate salinity conditions.
Permeability Index (PI)
The Permeability Index (PI) values for groundwater in the Hennaya irrigation zone ranged from 62% to 99% (Table 4), with all samples classified as suitable. These results indicate optimal water quality for maintaining soil permeability, showing no signs of potential soil degradation.
Magnesium Hazard (MH)
Elevated magnesium concentrations in soil can impair water infiltration and reduce crop yields [67]. While irrigation water with a Magnesium Hazard (MH) value >50% is considered unsuitable, the current study recorded MH values ranging from 38% to 48% (Table 4). Although these values remain below the threshold, they approach critical levels—particularly notable as 16 samples exceeded 42%, nearing the permissible limit.

3.5.2. AHP-Based Water Quality Index

In the Analytic Hierarchy Process (AHP), expert opinion is a fundamental component for assigning weights to the criteria used in decision-making. The pairwise comparison matrix is built based on expert judgments regarding the relative importance of each water quality parameter. These experts, typically professionals in hydrogeology, environmental science, water resources, or agriculture, contribute domain-specific knowledge that allows for a more contextualized and informed evaluation. Several previous studies have similarly prioritized parameters like Electrical Conductivity (EC), Total Dissolved Solids (TDSs), Sodium Adsorption Ratio (SAR), for evaluating groundwater suitability for irrigation using AHP [92,131,132,133].
The matrix proposed, which yielded 66 pairwise comparisons (Table 6), is presented in the table below.
Derive Weights: The weights for each criterion were derived from the pairwise comparison matrix. For each criterion, the relative importance is calculated based on the comparisons made. The following steps are typically involved:
  • Normalize the pairwise comparison matrix by dividing each element by the sum of its column.
  • Calculate the average of each row to derive the weight for each criterion.
  • Ensure that the weights sum to 1.
After determining the criterion weights, we assess the consistency of the pairwise comparisons used to derive them. This begins with calculating the Consistency Index (CI) using the following equation:
C I = λ n n 1
where λ = the mean value of the consistency vector and n = the number of criteria.
Subsequently, the Consistency Ratio (CR) is computed (CR = CI/RI) to validate the overall consistency of the judgments. A consistency ratio (CR) below 0.1 signifies an acceptable level of consistency, while a CR of 0.1 or higher suggests inconsistency (Table 7) [134].
The consistency of the comparisons was verified with a Consistency Ratio (CR) of 2.4%, which, being below the 0.1 threshold, indicates an acceptable level of consistency in the weighting process.
The average of each row is calculated to determine the corresponding criterion weight (Table 8).
Table 9 presents the Water Quality Index (WQI) values of the groundwater samples, calculated using weights derived from the AHP method in accordance with the methodology described in Section 2.5.2.
To assess the irrigation suitability of groundwater, the Water Quality Index (WQI) scores were systematically categorized employing a framework derived from analogous studies on groundwater quality evaluation in semi-arid environments. This structured classification schema, delineated in Table 10, organizes WQI scores into discrete intervals, each corresponding to a specific water quality category and its respective implications for irrigation applicability, thus effectively elucidating the spectrum of WQI scores.
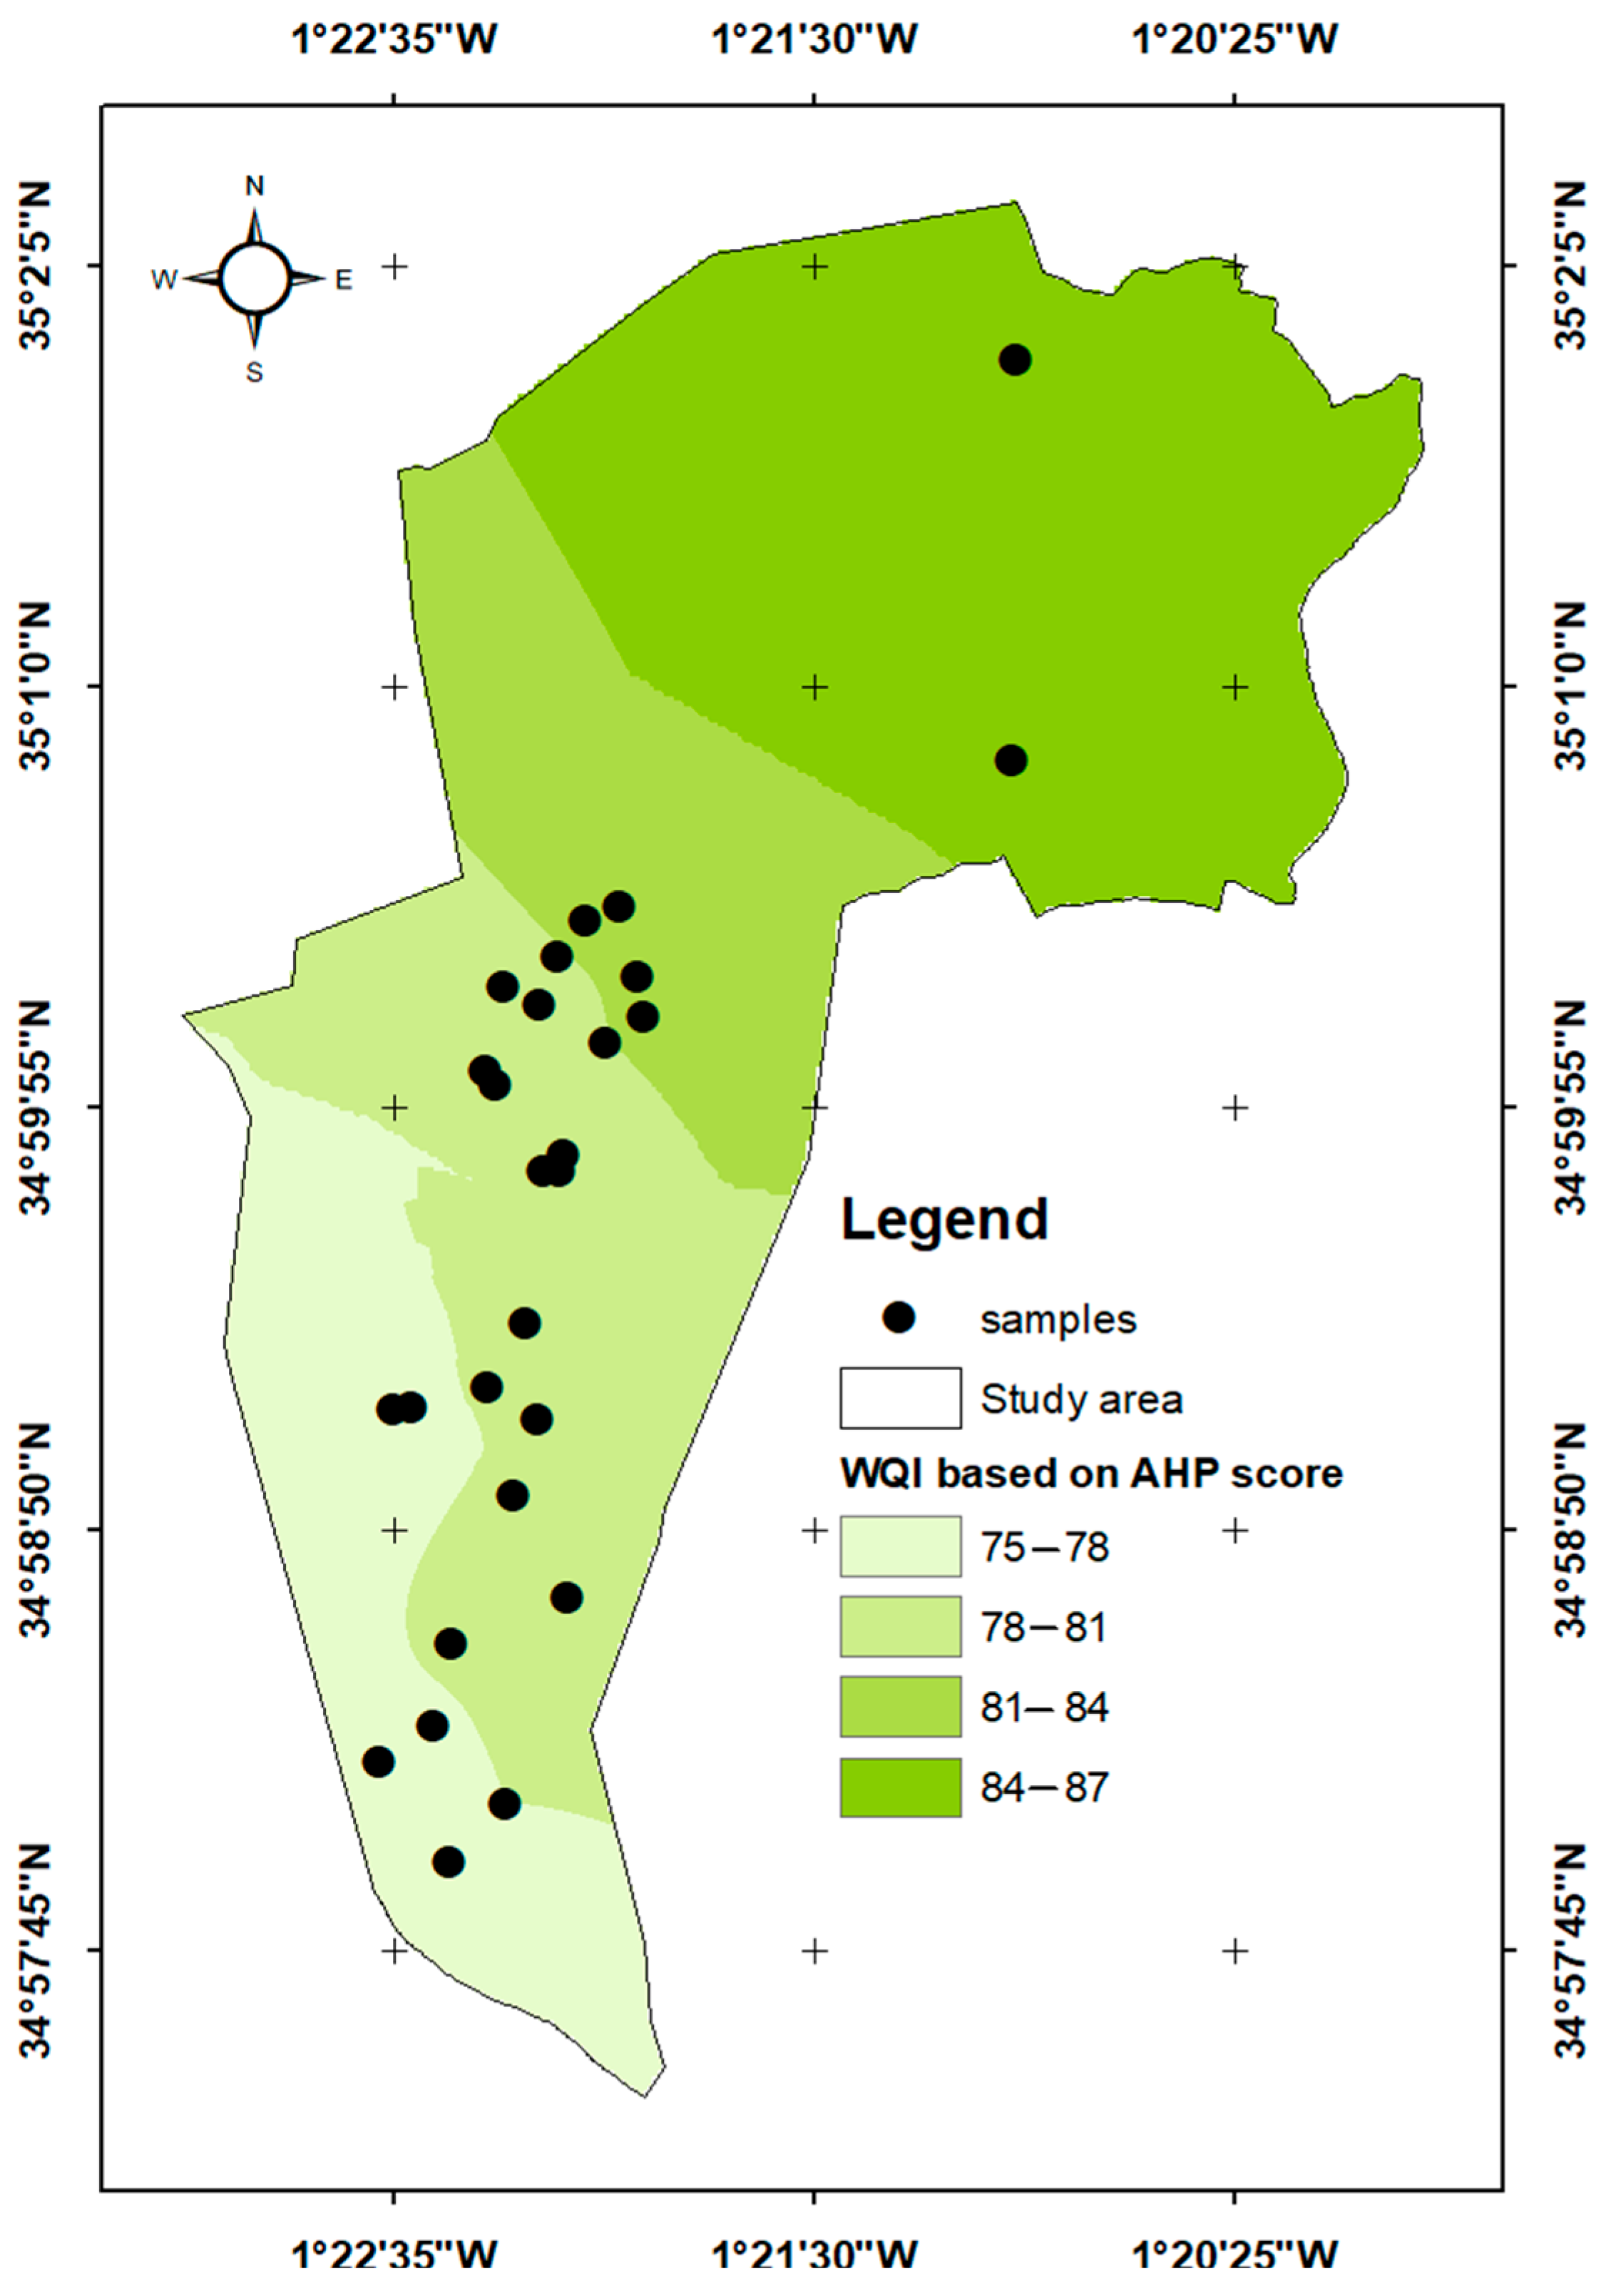
The Water Quality Index (WQI) scores for the study area, which range from 69.26 to 88.71, classify the groundwater as ‘Good’ (notably, the samples from the southern region stand out, as they exhibit the highest values within the ‘Good’ range, approaching the upper limit of the ‘Excellent’ category, e.g., S3: 69,628, S7: 69,259) (Figure 12). The consistent WQI values across all sampling locations demonstrate uniform and reliable water quality throughout the study area. These findings confirm that the irrigation water maintains excellent overall quality, with all parameters meeting optimal agricultural requirements, characterized by optimal values for Electrical Conductivity (EC), Total Dissolved Solids (TDSs), Sodium Adsorption Ratio (SAR), Kelly’s Ratio (KR), Permeability Index (PI), and Magnesium Hazard (MH). This ensures low salinity, good soil infiltration, and structural stability. The balanced pH, along with controlled levels of bicarbonate (HCO3) and chloride (Cl), minimizes the risk of plant toxicity and prevents damage to irrigation systems. These properties make this water highly suitable for sustainable irrigation across most crop types. However, regular monitoring of nitrate (NO3) levels, which range between 46.72 and 145.38 mg/L, is recommended to mitigate potential risks of over-fertilization for plants and groundwater contamination. Only minor adjustments to fertilization and periodic soil monitoring are needed to sustain this favorable balance over the long term.
The Water Quality Index (WQI) spatial distribution was modeled using geostatistical interpolation in the ArcGIS tool (Figure 12). The Ordinary Kriging method was applied to predict WQI values across the study area, optimizing spatial autocorrelation based on sampled point data, with the southern sector exhibiting superior quality. This spatial pattern, particularly pronounced in the southern sector of the study area, reflects (1) effective crop rotation mitigating soil depletion despite intermittent cultivation intensification in arboriculture zones; (2) naturally efficient drainage from the region’s highly permeable aquifer, preventing waterlogging and salt accumulation; and (3) balanced cation ratios (Na+/Ca2+/Mg2+) that optimize soil permeability. The tiered classification pinpoints areas where water quality approaches ideal conditions (84–87), enabling strategic crop planning (e.g., salt-sensitive crops in high-WQI zones), while marginally suitable areas (75–78) could benefit from adopting the south’s integrated soil-water management practices to sustain long-term agricultural productivity.
Northward progression through the study area reveals a consistent increase in WQI scores across most sampling locations, culminating in a maximum value of 88.71 at Sample 27. This peak measurement, recorded at the aquifer outlet, corroborates the earlier hypothesis of efficient drainage characteristics within the system.
Although Total Dissolved Solids (TDSs) (990–1930 mg/L) and Electrical Conductivity (EC) (1247–2010 μS/cm) are within FAO limits (<2000 mg/L and <3000 μS/cm, respectively), intensive irrigation with these waters may still lead to progressive soil salinization and structural degradation unless managed through corrective measures such as drainage or leaching. While the region’s carbonate-rich lithology naturally contributes to elevated calcium, magnesium, and bicarbonate levels, anthropogenic activities remain the primary driver of water quality variability.

4. Conclusions

This study provides a comprehensive assessment of groundwater suitability for irrigation in the Hennaya irrigated region in northwestern Algeria. It examines the quality parameters and spatial variations in groundwater using an integrated methodology that combines hydrochemical analysis, the Water Quality Index (WQI), the Analytic Hierarchy Process (AHP), and Geographic Information Systems (GIS). The hydrochemical assessment reveals a groundwater profile marked by slight salinity and high alkalinity (CAT), with Total Dissolved Solids (TDSs) approaching the threshold for optimal agricultural use. Despite encouraging irrigation indicators—such as a Sodium Adsorption Ratio (SAR) (excellent), a Sodium Percentage (Na%) of (rated good), and a Residual Sodium Carbonate (RSC), the Kelly’s Index and the Permeability Index values for the groundwater samples fall within a very acceptable range (considered secure)—the groundwater grapples with substantial challenges posed by elevated nitrate and nitrite levels, primarily attributable to treated wastewater, fertilizers, and pesticides. The prevailing ion sequences (Ca2+ > Na+ > Mg2+ > K+ for cations; HCO3 > Cl > SO42− > NO3 for anions), corroborated by Piper and Gibbs diagrams, delineate a blended water type shaped by the region’s carbonate-rich geology, water–rock interactions, evaporation, and human-induced pollution, with the latter emerging as the predominant force behind quality decline.
The WQI scores, oscillating between 69.25 and 88.71, categorize the groundwater as ‘Good’. Spatial analysis reveals a clear gradient across the study area: notably, groundwater samples collected from the southern region demonstrated the most favorable quality within this category. While these results are informative, they do not preclude the necessity for corrective action. Considering the anthropogenic activities that have contributed to abnormal nitrate concentrations, it is imperative to adopt comprehensive measures to mitigate and reverse this contamination.
This research has markedly enriched the comprehension of the physicochemical characteristics of water within the Hennaya irrigated region. The integration of WQI and GIS has proven instrumental in generating detailed maps that depict the spatial distribution of water quality parameters. These maps serve as an invaluable resource for identifying pollution hotspots and guiding strategic management efforts. The findings of this study furnish actionable guidance for policymakers, local, and regional authorities to bolster groundwater management and ensure the secure utilization of irrigation water, fostering sustainable agricultural practices and long-term resource preservation to meet the socio-economic demands in the study region. Thereby, the findings contribute to increasing and enlarging the scale to raise water productivity for coping with expected water scarcity situations, conserve groundwater resources and contribute to protecting the population against health risks caused by water pollution impacting drinking water provision and food chains.

Author Contributions

Conceptualization, A.B., C.A. and M.B.; methodology, A.B., C.A., M.B. and N.K.; software, A.B., Y.A.B. and M.Z.; validation, A.B., C.A., M.B. and Y.A.B.; formal analysis, C.A., M.B., S.M.T., B.T. and N.K.; investigation, A.B. and S.M.T.; resources, A.B., A.S. (Amaria Slimani), A.S. (Ahmed Souafi), N.B. and S.M.T.; data curation, A.B., S.M.T. and Y.A.B.; writing—original draft preparation, A.B. and S.M.T.; writing—review and editing, C.A., A.B., M.B., S.M.T., B.T. and N.K.; visualization, C.A., M.B. and N.K.; supervision, C.A., M.B. and N.K.; project administration, C.A., M.B. and N.K. All authors have read and agreed to the published version of the manuscript.

Funding

This research was funded by the Laboratoire Eau et Ouvrages dans leur Environnement (EOLE) and the DGRSDT as part of the project entitled “Irrigation with reused wastewater in Algeria: Environmental impacts and socio-economic aspects—Case of the Hennaya irrigated region” (Project No. DGRSDT/EMIE/2025).

Data Availability Statement

The original contributions presented in this study are included in the article. Further inquiries can be directed to the corresponding author.

Acknowledgments

The authors wish to express their sincere appreciation to the National Office of Irrigation and Drainage, Tlemcen Unit, as well as to the Irrigators’ Association of the Hennaya Plain, for their invaluable assistance and for providing essential data and insights that contributed significantly to the completion of this study.

Conflicts of Interest

The authors declare no conflicts of interest.

Abbreviations

The following abbreviations are used in this manuscript:
AHPAnalytic Hierarchy Process
Ca2+Calcium
CATComplete alkalimetric title
CEElectrical Conductivity
CIConsistency Index
ClChloride
CRConsistency Ratio
FAOFood and Agriculture Organization
GISGeographic Information System
HaHectare
HCO3Bicarbonate
K+Potassium
MAXMaximum
MCDAMulti-Criteria Decision Analysis
MEANArithmetic Mean
Mg2+Magnesium
MINMinimum
Na+Sodium
Na%Sodium Percentage
NO2Nitrite
NO3Nitrate
PPhosphorus
pHPotential of Hydrogen
qiQuality Rating Scale
RIRandom Index
RSCResidual Sodium Carbonate
SARSodium Adsorption Ratio
SDStandard Deviation
SO42−Sulfate
TDSTotal Dissolved Solids
THTotal Hardness
WHOWorld Health Organization
WiProportional Weight
WQIWater Quality Index

References

  1. Lapworth, D.; Boving, T.; Brauns, B.; Dottridge, J.; Hynds, P.; Kebede, S.; Kreamer, D.; Misstear, B.; Mukherjee, A.; Re, V.; et al. Groundwater Quality: Global Challenges, Emerging Threats and Novel Approaches. Hydrogeol. J. 2023, 31, 15–18. [Google Scholar] [CrossRef]
  2. Derdour, A.; Abdo, H.G.; Almohamad, H.; Alodah, A.; Al Dughairi, A.A.; Ghoneim, S.S.M.; Ali, E. Prediction of Groundwater Quality Index Using Classification Techniques in Arid Environments. Sustainability 2023, 15, 9687. [Google Scholar] [CrossRef]
  3. Dozier, A.Q.; Arabi, M.; Wostoupal, B.C.; Goemans, C.G.; Zhang, Y.; Paustian, K. Declining Agricultural Production in Rapidly Urbanizing Semi-Arid Regions: Policy Tradeoffs and Sustainability Indicators. Environ. Res. Lett. 2017, 12, 085005. [Google Scholar] [CrossRef]
  4. Fertas, L.; Alouat, M.; Benmahamed, H. The Emergence of Irrigated Agriculture in Semi-Arid Zones in the Face of Climate Change and Urbanization in Peri-Urban Areas in Setif, Algeria. Sustainability 2024, 16, 1112. [Google Scholar] [CrossRef]
  5. Malki, M.; Bouchaou, L.; Hirich, A.; Ait Brahim, Y.; Choukr-Allah, R. Impact of Agricultural Practices on Groundwater Quality in Intensive Irrigated Area of Chtouka-Massa, Morocco. Sci. Total. Environ. 2017, 574, 760–770. [Google Scholar] [CrossRef]
  6. Bar, S.; Kumari, B.; Gupta, S.K. Salinization of Coastal Groundwater Resource in the Perspective of Climate Change. In Fate and Transport of Subsurface Pollutants; Gupta, P.K., Bharagava, R.N., Eds.; Microorganisms for Sustainability; Springer: Singapore, 2021; Volume 24, pp. 315–326. ISBN 9789811565632. [Google Scholar]
  7. Jarraya-Horriche, F.; Benabdallah, S.; Ayadi, M. Groundwater Monitoring for Assessing Artificial Recharge in the Mediterranean Coastal Aquifer of Korba (Northeastern Tunisia). Environ. Monit. Assess. 2020, 192, 442. [Google Scholar] [CrossRef] [PubMed]
  8. Akhtar, N.; Syakir Ishak, M.I.; Bhawani, S.A.; Umar, K. Various Natural and Anthropogenic Factors Responsible for Water Quality Degradation: A Review. Water 2021, 13, 2660. [Google Scholar] [CrossRef]
  9. Belkhiri, L.; Mouni, L. Hydrochemical Analysis and Evaluation of Groundwater Quality in El Eulma Area, Algeria. Appl. Water Sci. 2012, 2, 127–133. [Google Scholar] [CrossRef]
  10. Hailu, H.; Haftu, S. Hydrogeochemical Studies of Groundwater in Semi-Arid Areas of Northern Ethiopia Using Geospatial Methods and Multivariate Statistical Analysis Techniques. Appl. Water Sci. 2023, 13, 86. [Google Scholar] [CrossRef]
  11. Nassri, I.; Harmouzi, H.; Tahri, L.; El Ouali, A.; Khattabi Rifi, S. Hydrogeochemical Assessment and Spatial Analysis of Groundwater Quality Parameters in North West of Morocco. J. Saudi Soc. Agric. Sci. 2024, S1658077X24000705. [Google Scholar] [CrossRef]
  12. Howladar, M.F.; Al Numanbakth, A.; Faruque, M.O. An Application of Water Quality Index (WQI) and Multivariate Statistics to Evaluate the Water Quality around Maddhapara Granite Mining Industrial Area, Dinajpur, Bangladesh. Environ. Syst. Res. 2018, 6, 13. [Google Scholar] [CrossRef]
  13. Chidiac, S.; El Najjar, P.; Ouaini, N.; El Rayess, Y.; El Azzi, D. A Comprehensive Review of Water Quality Indices (WQIs): History, Models, Attempts and Perspectives. Rev. Env. Sci. Biotechnol. 2023, 22, 349–395. [Google Scholar] [CrossRef]
  14. Horton, R.K. An Index-Number System for Rating Water Quality. J. Water Pollut. Control. Fed. 1965, 37, 300–306. [Google Scholar]
  15. Mohammed, S.E.; Adel Abdulrazzaq, K. Developing Water Quality Index to Assess the Quality of the Drinking Water. CivileJournal 2018, 4, 2345. [Google Scholar] [CrossRef]
  16. Banda, T.; Kumarasamy, M. Development of a Universal Water Quality Index (UWQI) for South African River Catchments. Water 2020, 12, 1534. [Google Scholar] [CrossRef]
  17. Azlaoui, M.; Zeddouri, A.; Haied, N.; Nezli, I.E.; Foufou, A. Assessment and Mapping of Groundwater Quality for Irrigation and Drinking in a Semi-Arid Area in Algeria. J. Ecol. Eng. 2021, 22, 19–32. [Google Scholar] [CrossRef]
  18. Lakrout, A.; Meddah, B.; Ali Rahmani, S.E. Geochemical Assessment of Thermal Water in Bouhanifia Aquifer System: Suitability for Touristic Therapeutic Treatment. Appl. Water Sci. 2022, 12, 204. [Google Scholar] [CrossRef]
  19. Mansouri, Z.; Leghrieb, Y.; Kouadri, S.; Al-Ansari, N.; Najm, H.M.; Mashaan, N.S.; Eldirderi, M.M.A.; Khedher, K.M. Hydro-Geochemistry and Groundwater Quality Assessment of Ouargla Basin, South of Algeria. Water 2022, 14, 2441. [Google Scholar] [CrossRef]
  20. Abdessamed, D.; Jodar-Abellan, A.; Ghoneim, S.S.M.; Almaliki, A.; Hussein, E.E.; Pardo, M.Á. Groundwater Quality Assessment for Sustainable Human Consumption in Arid Areas Based on GIS and Water Quality Index in the Watershed of Ain Sefra (SW of Algeria). Environ. Earth Sci. 2023, 82, 510. [Google Scholar] [CrossRef]
  21. Akhtar, N.; Ishak, M.I.S.; Ahmad, M.I.; Umar, K.; Md Yusuff, M.S.; Anees, M.T.; Qadir, A.; Ali Almanasir, Y.K. Modification of the Water Quality Index (WQI) Process for Simple Calculation Using the Multi-Criteria Decision-Making (MCDM) Method: A Review. Water 2021, 13, 905. [Google Scholar] [CrossRef]
  22. Saaty, T.L. The Analytic Hierarchy Process: Planning, Priority Setting, Resource Allocation; McGraw-Hill International Book Co.: London, UK; New York, NY, USA, 1980; ISBN 978-0-07-054371-3. [Google Scholar]
  23. Karakuş, C.B. Evaluation of Groundwater Quality in Sivas Province (Turkey) Using Water Quality Index and GIS-Based Analytic Hierarchy Process. Int. J. Environ. Health Res. 2019, 29, 500–519. [Google Scholar] [CrossRef]
  24. Ram, A.; Tiwari, S.K.; Pandey, H.K.; Chaurasia, A.K.; Singh, S.; Singh, Y.V. Groundwater Quality Assessment Using Water Quality Index (WQI) under GIS Framework. Appl. Water Sci. 2021, 11, 46. [Google Scholar] [CrossRef]
  25. Karbassi, A.R.; Mir Mohammad Hosseini, F.; Baghvand, A.; Nazariha, M. Development of Water Quality Index (WQI) for Gorganrood River. Int. J. Environ. Res. 2011, 5. [Google Scholar] [CrossRef]
  26. Semiromi, F.B.; Hassani, A.H.; Torabian, A.; Karbassi, A.R.; Lotfi, F.H. Evolution of a New Surface Water Quality Index for Karoon Catchment in Iran. Water Sci. Technol. 2011, 64, 2483–2491. [Google Scholar] [CrossRef] [PubMed]
  27. Huang, R.; Han, L.X.; Zhang, H.; Peng, H. Evaluation and Analysis of Water Quality at the Dahuofang Reservoir Based on the Fuzzy Evaluation and Analytical Hierarchy Process. AMM 2013, 316–317, 748–753. [Google Scholar] [CrossRef]
  28. Bozdağ, A. Combining AHP with GIS for Assessment of Irrigation Water Quality in Çumra Irrigation District (Konya), Central Anatolia, Turkey. Environ. Earth Sci. 2015, 73, 8217–8236. [Google Scholar] [CrossRef]
  29. Minh, H.; Avtar, R.; Kumar, P.; Tran, D.; Ty, T.; Behera, H.; Kurasaki, M. Groundwater Quality Assessment Using Fuzzy-AHP in An Giang Province of Vietnam. Geosciences 2019, 9, 330. [Google Scholar] [CrossRef]
  30. Rajkumar, H.; Naik, P.K.; Rishi, M.S. A Comprehensive Water Quality Index Based on Analytical Hierarchy Process. Ecol. Indic. 2022, 145, 109582. [Google Scholar] [CrossRef]
  31. Maqbool, S.; Singh, V.; Patley, M.K.; Kinattinkara, S.; Arumugam, T. Evaluation of Groundwater Quality Potential Zones Using AHP and WIOA Models in Shopian District, Jammu and Kashmir, India: A GIS. J. Hazard. Mater. Adv. 2024, 16, 100488. [Google Scholar] [CrossRef]
  32. Kumar, A.; Tripathi, M.P.; Khalkho, D.; Dewangan, R.; Baghel, S.; Kuriqi, A. Groundwater Quality Evaluation for Drinking and Irrigation Using Analytical Hierarchy Process with GIS in Semi Critical Block of Chhattisgarh, India. Environ. Earth Sci. 2024, 83, 334. [Google Scholar] [CrossRef]
  33. Naz, I.; Fan, H.; Aslam, R.W.; Tariq, A.; Quddoos, A.; Sajjad, A.; Soufan, W.; Almutairi, K.F.; Ali, F. Integrated Geospatial and Geostatistical Multi-Criteria Evaluation of Urban Groundwater Quality Using Water Quality Indices. Water 2024, 16, 2549. [Google Scholar] [CrossRef]
  34. Loganathan, S.; Sathiyamoorthy, M. Assessing Groundwater Contamination Risk in Industrial Zone of Ranipet District, Southern India: A Modified DRASTIC and Fuzzy-AHP Approach. Results Eng. 2024, 23, 102772. [Google Scholar] [CrossRef]
  35. Cheng, Z.; Lu, G.; Wu, M.; Li, Z.; Deng, Y.; Wu, J.; Hao, Y.; Mo, C.; Li, Q.; Wu, J.; et al. Quantification and Visualization of Groundwater Contamination Prevention Regionalization Based on Analytic Hierarchy Process Method (AHP) in Guangdong-Hong Kong-Macao Greater Bay Area, South China. J. Hydrol. 2024, 628, 130521. [Google Scholar] [CrossRef]
  36. Patoni, K.; Esteller, M.V.; Expósito, J.L.; Fonseca, R.M.G. Spatial Design of Groundwater Quality Monitoring Network Using Multicriteria Analysis Based on Pollution Risk Map. Environ. Earth Sci. 2024, 83, 286. [Google Scholar] [CrossRef]
  37. Allaoua, N.; Hafid, H.; Chenchouni, H. Exploring Groundwater Quality in Semi-Arid Areas of Algeria: Impacts on Potable Water Supply and Agricultural Sustainability. J. Arid. Land 2024, 16, 147–167. [Google Scholar] [CrossRef]
  38. DHWT. Bilan de L’hydraulique Agricole 2024; Hydraulics Directorate of the Wilaya of Tlemcen: Tlemcen, Algeria, 2024. [Google Scholar]
  39. INSID. Projet D’utilisation Des Eaux Usées Traitées Pour L’irrigation Du Périmètre de Hennaya (Tlemcen), Institut National Des Sols, de l’Irrigation et Du Drainage; Institut National des Sols, de l’Irrigation et du Drainage (INSID): Algiers, Algeria, 2014. [Google Scholar]
  40. Jezdan, O. Evaluation of Irrigation Water Quality and Soil Fertility. In Proceedings of the Training Course on Management and Methods of Using Treated Saline Water in Agricultural Irrigation and International Standards for Soil, Water, and Plant Analysis, Algiers, Algeria, 2–6 December 2012. [Google Scholar]
  41. Bemmoussat, A. Impact of Agricultural Activity on the Quality of Groundwater in the Tafna Basin. Master’s Thesis, University of Abou Bekr Belkaid, Tlemcen, Algeria, 2012. [Google Scholar]
  42. Hayane, S.M. Contribution à L’étude Géologique et Hydrogéologique Du Bassin Versant de L’oued Sikkak (Région de Tlemcen); University of Oran: Oran, Algeria, 1983. [Google Scholar]
  43. Baba Hamed, K.; Bouanani, A.; Terfous, E.; Bekkouche, A. Modele transitoire de la nappe des alluvions de la plaine d’hennaya (Tlemcen, NW-Algérie) transitory model of the alluvium aquifer of hennaya plaine (Tlemcen, NW-Algeria). LJEE 2005, 4, 7–17. [Google Scholar]
  44. Bemmoussat, A.; Adjim, M.; Bensaoula, F. Irrigation with Treated Wastewaters and the Protection of Hennaya Groundwater—Tlemcen, Algeria. J. Water Land Dev. 2019, 43, 19–27. [Google Scholar] [CrossRef]
  45. OPEN LAB. Laboratoire D’analyses et Contrôle de Qualité et Conformité Agriculture et Agroalimentaire, Détergents, Cosmétique et Parfums, Parapharmaceutique, Matériaux Polymères, Analyse Environnementale et d’Eaux—BULLETIN D’ANALYSE; OPEN LAB: Tokyo, Japan, 2023. [Google Scholar]
  46. Shankar, K.; Aravindan, S.; Rajendran, S. Hydrochemical Profile for Assessing the Groundwater Quality of Paravanar River Sub-Basin, Cuddalore District, Tamil Nadu, India. Curr. World Env. 2006, 1, 45–52. [Google Scholar] [CrossRef]
  47. Gibbs, R.J. Mechanisms Controlling World Water Chemistry. Science 1970, 170, 1088–1090. [Google Scholar] [CrossRef]
  48. Marandi, A.; Shand, P. Groundwater Chemistry and the Gibbs Diagram. Appl. Geochem. 2018, 97, 209–212. [Google Scholar] [CrossRef]
  49. Piper, A.M. A Graphic Procedure in the Geochemical Interpretation of Water-Analyses. Eos Trans. Am. Geophys. Union 1944, 25, 914–928. [Google Scholar] [CrossRef]
  50. Karmegam, U.; Chidambaram, S.; Prasanna, M.V.; Sasidhar, P.; Manikandan, S.; Johnsonbabu, G.; Dheivanayaki, V.; Paramaguru, P.; Manivannan, R.; Srinivasamoorthy, K.; et al. A Study on the Mixing Proportion in Groundwater Samples by Using Piper Diagram and Phreeqc Model. Chin. J. Geochem. 2011, 30, 490–495. [Google Scholar] [CrossRef]
  51. Liu, J.; Wang, M.; Gao, Z.; Chen, Q.; Wu, G.; Li, F. Hydrochemical Characteristics and Water Quality Assessment of Groundwater in the Yishu River Basin. Acta Geophys. 2020, 68, 877–889. [Google Scholar] [CrossRef]
  52. Singh, K.P.; Malik, A.; Mohan, D.; Sinha, S. Multivariate Statistical Techniques for the Evaluation of Spatial and Temporal Variations in Water Quality of Gomti River (India)—A Case Study. Water Res. 2004, 38, 3980–3992. [Google Scholar] [CrossRef] [PubMed]
  53. Shrestha, S.; Kazama, F. Assessment of Surface Water Quality Using Multivariate Statistical Techniques: A Case Study of the Fuji River Basin, Japan. Environ. Model. Softw. 2007, 22, 464–475. [Google Scholar] [CrossRef]
  54. Ward, J.H. Hierarchical Grouping to Optimize an Objective Function. J. Am. Stat. Assoc. 1963, 58, 236–244. [Google Scholar] [CrossRef]
  55. Simeonov, V.; Stratis, J.A.; Samara, C.; Zachariadis, G.; Voutsa, D.; Anthemidis, A.; Sofoniou, M.; Kouimtzis, T. Assessment of the Surface Water Quality in Northern Greece. Water Res. 2003, 37, 4119–4124. [Google Scholar] [CrossRef]
  56. Zhao, Y.; Xia, X.H.; Yang, Z.F.; Wang, F. Assessment of Water Quality in Baiyangdian Lake Using Multivariate Statistical Techniques. Procedia Environ. Sci. 2012, 13, 1213–1226. [Google Scholar] [CrossRef]
  57. Richard, L.A. Diagnosis and Improvement of Saline and Alkali Soils; Agricultural Handbook No. 60; US Department of Agriculture: Washington, DC, USA, 1954. [Google Scholar]
  58. Eaton, F.M. Significance of Carbonates in Irrigation Waters. Soil Sci. 1950, 69, 123–134. [Google Scholar] [CrossRef]
  59. Appelo, C.A.J.; Postma, D. Geochemistry, Groundwater and Pollution, 2nd ed.; CRC Press: Boca Raton, FL, USA, 2005; ISBN 978-0-415-36428-7. [Google Scholar]
  60. Wilcox, L.V. Classification and Use of Irrigation Water; US Department of Agriculture, Circular 969: Washington, DC, USA, 1955. [Google Scholar]
  61. Mansouri, Z.; Dinar, H.; Belkendil, A.; Bakelli, O.; Drias, T.; Assadi, A.A.; Khezami, L.; Mouni, L. Integrated Groundwater Quality Assessment for Irrigation in the Ras El-Aioun District: Combining IWQI, GIS, and Machine Learning Approaches. Water 2025, 17, 1698. [Google Scholar] [CrossRef]
  62. Obiefuna, G.; Sheriff, A. Assessment of Shallow Ground Water Quality of Pindiga Gombe Area, Yola Area, NE, Nigeria for Irrigation and Domestic Purposes. Res. J. Environ. Earth Sci. 2011, 3, 131–141. [Google Scholar]
  63. Doneen, L.D. Notes on Water Quality in Agriculture; Water Science and Engineering Paper 4001; Department of Water, University of California: Davis, CA, USA, 1964. [Google Scholar]
  64. Imad, H.U.; Akhund, M.A.; Ali, M.; Pathan, A.A.; Ahmed, A. Non-Volumetric Pricing Is a Threat to Water Reserves. Civ. Eng. J. 2019, 5, 422. [Google Scholar] [CrossRef]
  65. Ramesh, K.; Elango, L. Groundwater Quality and Its Suitability for Domestic and Agricultural Use in Tondiar River Basin, Tamil Nadu, India. Env. Monit Assess 2012, 184, 3887–3899. [Google Scholar] [CrossRef]
  66. Çadraku, H.S. Groundwater Quality Assessment for Irrigation: Case Study in the Blinaja River Basin, Kosovo. Civ. Eng. J. 2021, 7, 1515–1528. [Google Scholar] [CrossRef]
  67. Pusatli, O.T.; Camur, M.Z.; Yazicigil, H. Susceptibility Indexing Method for Irrigation Water Management Planning: Applications to K. Menderes River Basin, Turkey. J. Environ. Manag. 2009, 90, 341–347. [Google Scholar] [CrossRef]
  68. Song, T.; Kim, K. Development of a Water Quality Loading Index Based on Water Quality Modeling. J. Environ. Manag. 2009, 90, 1534–1543. [Google Scholar] [CrossRef] [PubMed]
  69. Sadiq, R.; Haji, S.A.; Cool, G.; Rodriguez, M.J. Using Penalty Functions to Evaluate Aggregation Models for Environmental Indices. J Env. Manag. 2010, 91, 706–716. [Google Scholar] [CrossRef] [PubMed]
  70. Vasanthavigar, M.; Srinivasamoorthy, K.; Vijayaragavan, K.; Rajiv Ganthi, R.; Chidambaram, S.; Anandhan, P.; Manivannan, R.; Vasudevan, S. Application of Water Quality Index for Groundwater Quality Assessment: Thirumanimuttar Sub-Basin, Tamilnadu, India. Env. Monit Assess 2010, 171, 595–609. [Google Scholar] [CrossRef]
  71. Chakraborty, B.; Roy, S.; Bera, A.; Adhikary, P.P.; Bera, B.; Sengupta, D.; Bhunia, G.S.; Shit, P.K. Geospatial Assessment of Groundwater Quality for Drinking through Water Quality Index and Human Health Risk Index in an Upland Area of Chota Nagpur Plateau of West Bengal, India. In Spatial Modeling and Assessment of Environmental Contaminants; Shit, P.K., Adhikary, P.P., Sengupta, D., Eds.; Environmental Challenges and Solutions; Springer International Publishing: Cham, Switzerland, 2021; pp. 327–358. ISBN 978-3-030-63421-6. [Google Scholar]
  72. Abbasi, T. Water Quality Indices; Elsevier Science: Amsterdam, The Netherlands, 2012; ISBN 978-0-444-54304-2. [Google Scholar]
  73. Bessedik, M.; Abdelbaki, C.; Badr, N.; Tiar, S.M.; Megnounif, A. Application of Water Quality Indices for Assessment of Influent and Effluent Wastewater from Wastewater Treatment Plant of Oran City, Algeria. DWT 2021, 236, 306–317. [Google Scholar] [CrossRef]
  74. Tejashvini, A.; Subbarayappa, C.T.M.; Chowdappa, H.D.; Ramamurthy, V. Assessment of Irrigation Water Quality for Groundwater in Semi-Arid Region, Bangalore, Karnataka. Water Sci. 2024, 38, 548–568. [Google Scholar] [CrossRef]
  75. Nageswara Rao, K.; Swarna Latha, P.; Ramesh Kumar, P.V. Groundwater Quality Assessment for Irrigation Use in the Godavari Delta Region of East Coast India Using IRWQI and GIS. Water Supply 2022, 22, 2612–2629. [Google Scholar] [CrossRef]
  76. Kawo, N.S.; Karuppannan, S. Groundwater Quality Assessment Using Water Quality Index and GIS Technique in Modjo River Basin, Central Ethiopia. J. Afr. Earth Sci. 2018, 147, 300–311. [Google Scholar] [CrossRef]
  77. Amalraj, A.; Pius, A. Assessment of Groundwater Quality for Drinking and Agricultural Purposes of a Few Selected Areas in Tamil Nadu South India: A GIS-Based Study. Sustain. Water Resour. Manag. 2018, 4, 1–21. [Google Scholar] [CrossRef]
  78. Brown, R.M.; McClelland, N.I.; Deininger, R.A.; Tozer, R.G. A Water Quality Index-Do We Dare. Water Sew. Work. 1970, 117, 339–343. [Google Scholar]
  79. Uddin, M.G.; Nash, S.; Olbert, A.I. A Review of Water Quality Index Models and Their Use for Assessing Surface Water Quality. Ecol. Indic. 2021, 122, 107218. [Google Scholar] [CrossRef]
  80. Ŝtambuk-Giljanović, N. Comparison of Dalmatian Water Evaluation Indices. Water Environ. Res. 2003, 75, 388–405. [Google Scholar] [CrossRef]
  81. Steinhart, C.E.; Schierow, L.; Sonzogni, W.C. An environmental quality index for the great lakes1. J. Am. Water Resour. Assoc. 1982, 18, 1025–1031. [Google Scholar] [CrossRef]
  82. Bernie, N.; Saffran, K.; Cash, K.; Serge, H.; Haseen, K.; Saffran, K.; Williamson, D. Canadian Water Quality Guidelines for the Protection of Aquatic Life CCME WATER QUALITY INDEX 1 0 User’s Manual. Quality 1–5; Canadian Council of Ministers of the Environment: Winnipeg, MB, Canada, 2001. [Google Scholar]
  83. Dunn, G.W. Trends in Water Quality Variables at the Alberta/Saskatchewan Boundary; Report Prepared For: The Committee on Water Quality; Alberta Environmental Protection: Red Deer, AB, Canada, 1995. [Google Scholar]
  84. Abrahão, R.; Carvalho, M.; da Silva, W.R., Jr.; Machado, T.; Gadelha, C.; Hernandez, M. Use of Index Analysis to Evaluate the Water Quality of a Stream Receiving Industrial Effluents. Water SA 2007, 33. [Google Scholar] [CrossRef]
  85. Lumb, A.; Sharma, T.C.; Bibeault, J.-F. A Review of Genesis and Evolution of Water Quality Index (WQI) and Some Future Directions. Water Qual. Expo. Health 2011, 3, 11–24. [Google Scholar] [CrossRef]
  86. Sutadian, A.D.; Muttil, N.; Yilmaz, A.G.; Perera, B.J.C. Development of a Water Quality Index for Rivers in West Java Province, Indonesia. Ecol. Indic. 2018, 85, 966–982. [Google Scholar] [CrossRef]
  87. Kumar, D.; Kumar, R.; Sharma, M.; Awasthi, A.; Kumar, M. Global Water Quality Indices: Development, Implications, and Limitations. Total Environ. Adv. 2024, 9, 200095. [Google Scholar] [CrossRef]
  88. Syeed, M.M.M.; Hossain, M.S.; Karim, M.R.; Uddin, M.F.; Hasan, M.; Khan, R.H. Surface Water Quality Profiling Using the Water Quality Index, Pollution Index and Statistical Methods: A Critical Review. Environ. Sustain. Indic. 2023, 18, 100247. [Google Scholar] [CrossRef]
  89. Noori, R.; Berndtsson, R.; Hosseinzadeh, M.; Adamowski, J.F.; Abyaneh, M.R. A Critical Review on the Application of the National Sanitation Foundation Water Quality Index. Environ. Pollut. 2019, 244, 575–587. [Google Scholar] [CrossRef] [PubMed]
  90. Nong, X.; Shao, D.; Zhong, H.; Liang, J. Evaluation of Water Quality in the South-to-North Water Diversion Project of China Using the Water Quality Index (WQI) Method. Water Res. 2020, 178, 115781. [Google Scholar] [CrossRef]
  91. Brown, R.M.; McClelland, N.I.; Deininger, R.A.; O’Connor, M.F. A Water Quality Index—Crashing the Psychological Barrier. In Indicators of Environmental Quality; Thomas, W.A., Ed.; Springer: Boston, MA, USA, 1972; pp. 173–182. ISBN 978-1-4684-2858-2. [Google Scholar]
  92. Nourbakhsh, Z.; Mehrdadi, N.; Moharamnejad, N.; Hassani, A.H.; Yousefi, H. Evaluating the Suitability of Different Parameters for Qualitative Analysis of Groundwater Based on Analytical Hierarchy Process. Desalination Water Treat. 2016, 57, 13175–13182. [Google Scholar] [CrossRef]
  93. Saaty, T.L. What Is the Analytic Hierarchy Process? In Proceedings of the Mathematical Models for Decision Support; Mitra, G., Greenberg, H.J., Lootsma, F.A., Rijkaert, M.J., Zimmermann, H.J., Eds.; Springer: Berlin/Heidelberg, Germany, 1988; pp. 109–121. [Google Scholar]
  94. Saaty, T.L. Fundamentals of the Analytic Hierarchy Process. In The Analytic Hierarchy Process in Natural Resource and Environmental Decision Making; Schmoldt, D.L., Kangas, J., Mendoza, G.A., Pesonen, M., Eds.; Springer: Dordrecht, The Netherlands, 2001; pp. 15–35. ISBN 978-94-015-9799-9. [Google Scholar]
  95. Saaty, T.L. Decision Making with the Analytic Hierarchy Process. IJSSCI 2008, 1, 83. [Google Scholar] [CrossRef]
  96. Ayers, R.S.; Westcot, D.W. Water Quality for Agriculture, FAO Irrigation and Drainage, Paper 29, Food and Agriculture Organization, Rome; FAO: Rome, Italy, 1985. [Google Scholar]
  97. FAO. The Quality of Water in Irrigation, FAO Irrigation and Drainage Paper No. 29; FAO: Rome, Italy, 1996. [Google Scholar]
  98. WHO. Water Quality in Agriculture: Risks and Risk Mitigation; FAO: Rome, Italy; IWMI: Colombo, Sri Lanka, 2023; ISBN 978-92-5-138072-7. [Google Scholar]
  99. World Health Organization. Guidelines for Drinking-Water Quality: Fourth Edition Incorporating First Addendum, 4th ed.; + 1st add.; World Health Organization: Geneva, Switzerland, 2017; ISBN 978-92-4-154995-0. [Google Scholar]
  100. Sarath Prasanth, S.V.; Magesh, N.S.; Jitheshlal, K.V.; Chandrasekar, N.; Gangadhar, K. Evaluation of Groundwater Quality and Its Suitability for Drinking and Agricultural Use in the Coastal Stretch of Alappuzha District, Kerala, India. Appl. Water Sci. 2012, 2, 165–175. [Google Scholar] [CrossRef]
  101. Bemmoussat, A.; Adjim, M.; Bensaoula, F. Etude Des Eaux Souterraines de La Plaine d’Henaya (Bassin de La Tafna-NW Algerien). LARHYSS J. 2014, 11, 63–76, P-ISSN 1112-3680/E-ISSN 2521-9782. [Google Scholar]
  102. JORADP. Executive Decree No. 11–125 of 22 March 2011 on the Quality of Water for Human Consumption in Algeria. JORADP Off. J. Alger. Repub. 2011, 18, 6–9. [Google Scholar]
  103. ANRH. National Agency of Water Resources: Monitoring of Water Quality in the Watershed of the Hammam Boughrara Dam. Internal Report; ANRH: Algiers, Algeria, 2022. [Google Scholar]
  104. Nisbet, M.; Verneaux, J. Composantes chimiques des eaux courantes. Discussion et proposition de classes en tant que bases d’interprétation des analyses chimiques. Annls Limnol. 1970, 6, 161–190. [Google Scholar] [CrossRef]
  105. Thomas, M.P. Calcium and Magnesium in Drinking-water: Public Health Significance. Int. J. Environ. Stud. 2010, 67, 612–613. [Google Scholar] [CrossRef]
  106. Bouanani, A. Hydrologie, Transport Solide et Modélisation. Etude de Quelques Sous Bassins de La Tafna (NW Algérie). Ph.D. Thesis, Université Abou Bekr Belkaid Tlemcen, Tlemcen, Algérie, 2004. [Google Scholar]
  107. Hussein, E.E.; Derdour, A.; Zerouali, B.; Almaliki, A.; Wong, Y.J.; Ballesta-de los Santos, M.; Minh Ngoc, P.; Hashim, M.A.; Elbeltagi, A. Groundwater Quality Assessment and Irrigation Water Quality Index Prediction Using Machine Learning Algorithms. Water 2024, 16, 264. [Google Scholar] [CrossRef]
  108. Belhouchette, H.; Boughariou, E.; Larayedh, O.; Bouri, S. Groundwater Quality Evaluation and Human Health Risks Assessment Using the WQI, NPI and HQnitrate Models: Case of the Sfax Intermediate Aquifer, Sahel Tunisia. Env. Geochem. Health 2022, 44, 2629–2647. [Google Scholar] [CrossRef]
  109. Scheelbeek, P.F.; Chowdhury, M.A.H.; Haines, A.; Alam, D.S.; Hoque, M.A.; Butler, A.P.; Khan, A.E.; Mojumder, S.K.; Blangiardo, M.A.G.; Elliott, P.; et al. Drinking Water Salinity and Raised Blood Pressure: Evidence from a Cohort Study in Coastal Bangladesh. Env. Health Perspect 2017, 125, 057007. [Google Scholar] [CrossRef]
  110. JORADP. Executive Decree No. 14–96 of 2 Jumada El Oula 1435 Corresponding to 4 March 2014 Amending and Supplementing Executive Decree No. 11–125 of 22 March 2011 Concerning the Quality of Drinking Water; JORADP: El-Mouradia, Alger, 2014. [Google Scholar]
  111. Bendida, A.; Kendouci, M.A.; Tidjani, A.E.-B. Characterization of Algerian Sahara groundwater for irrigation and water supply: Adrar region study case. J. Water Land Dev. 2021, 49, 235–243. [Google Scholar] [CrossRef]
  112. IPI. Potassium in Ecosystems Biogeochemical Fluxes of Cations in Agro- and Forest- Systems; International Potash Institute: Prague, Czechoslovakia, 1992. [Google Scholar]
  113. Hamlat, A.; Guidoum, A. Assessment of Groundwater Quality in a Semiarid Region of Northwestern Algeria Using Water Quality Index (WQI). Appl. Water Sci. 2018, 8, 220. [Google Scholar] [CrossRef]
  114. Bakouri, A.E. Hydrogeochemical characterization of groundwater of the middle ouerrha, taounate (RIF, MOROCCO). J. Water Sci. Environ. Technol. 2018, 3, 2. [Google Scholar]
  115. Derdour, A.; Mahamat Ali, M.M.; Chabane Sari, S.M. Evaluation of the Quality of Groundwater for Its Appropriateness for Drinking Purposes in the Watershed of Naâma, SW of Algeria, by Using Water Quality Index (WQI). SN Appl. Sci. 2020, 2, 1951. [Google Scholar] [CrossRef]
  116. Nejatijahromi, Z.; Nassery, H.R.; Hosono, T.; Nakhaei, M.; Alijani, F.; Okumura, A. Groundwater Nitrate Contamination in an Area Using Urban Wastewaters for Agricultural Irrigation under Arid Climate Condition, Southeast of Tehran, Iran. Agric. Water Manag. 2019, 221, 397–414. [Google Scholar] [CrossRef]
  117. Baumont, S.; Camard, J.P.; Lefranc, A. Réutilisation Des Eaux Usées Épurées: Risques Sanitaires et Faisabilité En Île-de-France; ORS Ile-de-France: Saint-Denis, France, 2004; p. 80. [Google Scholar]
  118. Koussa, M. Étude Comparative Entre Les Méthodes d’interpolation Pour La Cartographie Des Nitrates: Cas d’application Les Eaux Souterraines de Djelfa, Algérie. Agric. For. J. 2018, 2, 18–25. [Google Scholar]
  119. Bouchard, D.C.; Williams, M.K.; Surampalli, R.Y. Nitrate Contamination of Groundwater: Sources and Potential Health Effects. J. AWWA 1992, 84, 85–90. [Google Scholar] [CrossRef]
  120. Hill, M.J. 8-Nitrates and Nitrites from Food and Water in Relation to Human Disease. In Nitrates and Nitrites in Food and Water; Hill, M., Ed.; Woodhead Publishing Series in Food Science, Technology and Nutrition; Woodhead Publishing: Cambridge, UK, 1996; pp. 163–193. ISBN 978-1-85573-282-7. [Google Scholar]
  121. Scippo, M.-L.; Badot, P.-M.; Bornert, G.; Desriac, N.; Dubois-Brissonnet, F.; Escobar-Gutiérrez, A.; Kesse-Guyot, E.; Mselli-Lakhal, L.; Lognay, G.C.; Martin, O.C.B.; et al. Évaluation des risques liés à la Consommation de Nitrates et Nitrites; Anses: Cedex, France, 2022; p. 275. [Google Scholar]
  122. Deliste, C.E.; et Schmidt, J.W. The Effects of Sulphur on Water and Aquatic Life in Canada in “‘Sulphur and Its Inorganic Derivatives in the Canadian Environment’”; National Research Council of Canada, NRC Associate Committee on Scientific Criteria for Environmental Quality: Ottawa, Ontario, 1977. [Google Scholar]
  123. Nouayti, N.; Khattach, D.; Hilali, M. Evaluation de la qualité physico-chimique des eaux souterraines des nappes du Jurassique du haut bassin de Ziz (Haut Atlas central, Maroc) Assessment ofphysico-chemical quality of groundwaterof the Jurassic aquifers inhigh basin of Ziz (Central High Atlas, Morocco). J. Mater. Environ. Sci. 2015, 6, 1068–1081. [Google Scholar]
  124. Houria, B.; Mahdi, K.; Zohra, T.F. Hydrochemical Characterisation of Groundwater Quality: Merdja Plain (Tebessa Town, Algeria). Civ. Eng. J. 2020, 6, 318–325. [Google Scholar] [CrossRef]
  125. Huang, G.; Liu, C.; Zhang, Y.; Chen, Z. Groundwater Is Important for the Geochemical Cycling of Phosphorus in Rapidly Urbanized Areas: A Case Study in the Pearl River Delta. Environ. Pollut. 2020, 260, 114079. [Google Scholar] [CrossRef] [PubMed]
  126. Meinikmann, K.; Hupfer, M.; Lewandowski, J. Phosphorus in Groundwater Discharge—A Potential Source for Lake Eutrophication. J. Hydrol. 2015, 524, 214–226. [Google Scholar] [CrossRef]
  127. Nisbeth, C.S.; Jessen, S.; Bennike, O.; Kidmose, J.; Reitzel, K. Role of Groundwater-Borne Geogenic Phosphorus for the Internal P Release in Shallow Lakes. Water 2019, 11, 1783. [Google Scholar] [CrossRef]
  128. Nisbeth, C.S.; Kidmose, J.; Weckström, K.; Reitzel, K.; Odgaard, B.V.; Bennike, O.; Thorling, L.; McGowan, S.; Schomacker, A.; Kristensen, D.L.; et al. Dissolved Inorganic Geogenic Phosphorus Load to a Groundwater-Fed Lake: Implications of Terrestrial Phosphorus Cycling by Groundwater. Water 2019, 11, 2213. [Google Scholar] [CrossRef]
  129. Rattray, G. Geochemical Evolution of Groundwater in the Mud Lake Area, Eastern Idaho, USA. Environ. Earth Sci. 2015, 73, 8251–8269. [Google Scholar] [CrossRef]
  130. Foster, S.; Pulido-Bosch, A.; Vallejos, Á.; Molina, L.; Llop, A.; MacDonald, A.M. Impact of Irrigated Agriculture on Groundwater-Recharge Salinity: A Major Sustainability Concern in Semi-Arid Regions. Hydrogeol. J. 2018, 26, 2781–2791. [Google Scholar] [CrossRef]
  131. Abdelkarim, B.; Telahigue, F.; Abaab, N.; Boudabra, B.; Agoubi, B. AHP and GIS for Assessment of Groundwater Suitability for Irrigation Purpose in Coastal-Arid Zone: Gabes Region, Southeastern Tunisia. Environ. Sci. Pollut. Res. 2022, 30, 15422–15437. [Google Scholar] [CrossRef]
  132. Moghadam, E.A.; Derikvand, E.; Eslami, H.; Kharazi, H.G.; Razaz, M. Water Quality Studies Using Fuzzy-Analytic Hierarchical Procedure Method to Identify Their Suitability for Drinking, Industry, and Agriculture—A Case Study. Desalination Water Treat. 2021, 226, 25–36. [Google Scholar] [CrossRef]
  133. Saraswat, A.; Nath, T.; Omeka, M.E.; Unigwe, C.O.; Anyanwu, I.E.; Ugar, S.I.; Latare, A.; Raza, M.B.; Behera, B.; Adhikary, P.P.; et al. Irrigation Suitability and Health Risk Assessment of Groundwater Resources in the Firozabad Industrial Area of North-Central India: An Integrated Indexical, Statistical, and Geospatial Approach. Front. Environ. Sci. 2023, 11, 1116220. [Google Scholar] [CrossRef]
  134. Chy, T.J.; Hasan, K.; Seum, A.B.A.; Mitu, K.N. Integrating Surface and Subsurface Influences to Assess Groundwater Potential in a Rapidly Urbanizing Temperate Region: A Geographic Information System-Analytical Hierarchy Process (GIS-AHP) Case Study of Shelby County, Tennessee. Green Technol. Sustain. 2025, 3, 100204. [Google Scholar] [CrossRef]
  135. Madhav, S.; Ahamad, A.; Kumar, A.; Kushawaha, J.; Singh, P.; Mishra, P.K. Geochemical Assessment of Groundwater Quality for Its Suitability for Drinking and Irrigation Purpose in Rural Areas of Sant Ravidas Nagar (Bhadohi), Uttar Pradesh. Geol. Ecol. Landsc. 2018, 2, 127–136. [Google Scholar] [CrossRef]
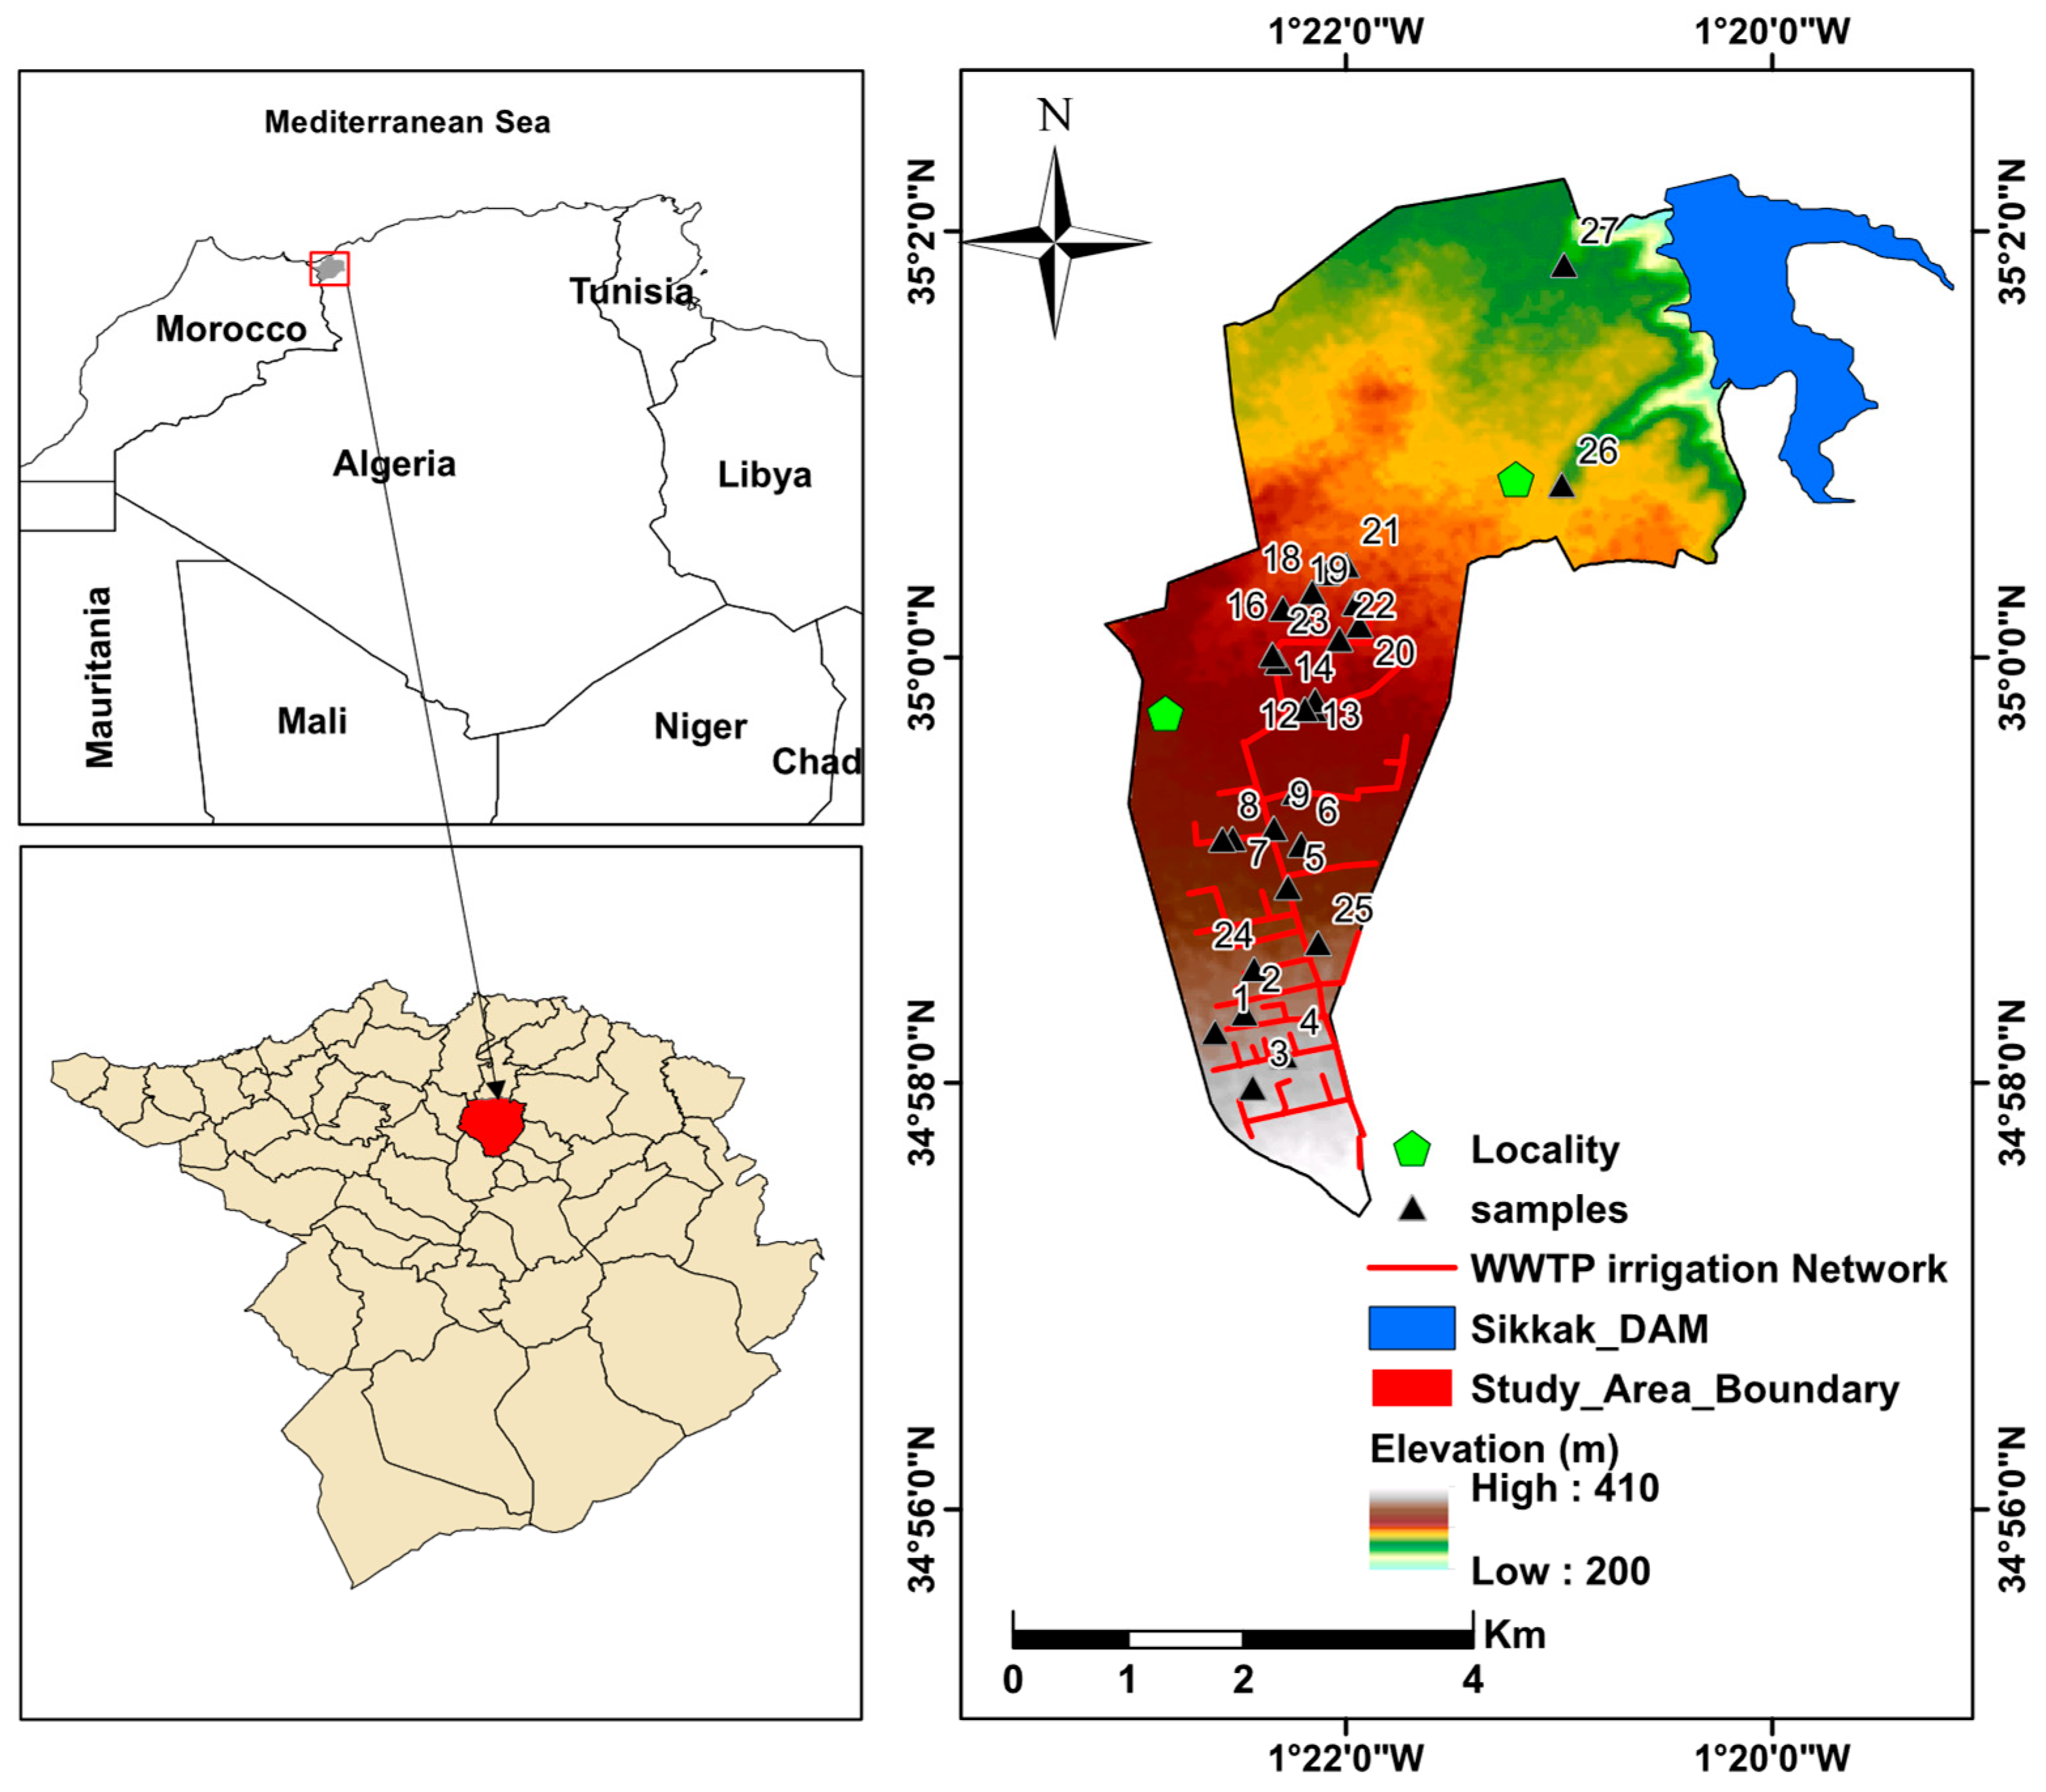
Figure 1. Geographical location of the study area and spatial distribution of groundwater samples.
Water 17 03025 g001
Figure 2. (a) Geologic Map of the study area. (b) Conglomerates at the outlet of the aquifer studied [40,43].
Water 17 03025 g002
Figure 3. South–north geologic cross-section of the studied area [43].
Water 17 03025 g003
Figure 4. Flowchart of the Research Methodology.
Water 17 03025 g004
Figure 5. Spatial distribution of quality parameters.
Water 17 03025 g005
Figure 6. Gibbs distribution plots: (a) cation ratio and (b) anion ratio.
Water 17 03025 g006
Figure 7. Piper diagram for groundwater in the study area.
Water 17 03025 g007
Figure 8. Hierarchical Clustering of Water Quality Parameters.
Water 17 03025 g008
Figure 9. Hierarchical Clustering of Samples.
Water 17 03025 g009
Figure 10. Wilcox diagram for the study area samples.
Water 17 03025 g010
Figure 11. US salinity diagram for classification of irrigation waters of the study area.
Water 17 03025 g011
Figure 12. Spatial distribution of WQI in the Hennaya irrigated region.
Water 17 03025 g012
Table 1. Overview of International Water Quality Standards and Analytical Methods used in this Study [45].
ParametersUnitAnalysis Protocol Desirable Limits
(FAO, WHO)
Hydrogen Potential (pH)-ISO 10523:2008 [45]6.5–8.5
Electrical Conductivity (EC) µS/cmISO 7888:1985 [45]0–2800
Total Dissolved Solids (TDSs)mg/LRodier [45]0–2000
Complete Alkalimetric Title (CAT)mg as CaCO3ISO 9963-2/1994 [45]0–500
Calcium (Ca2+)mg/LNFT 90-016 [45]0–200
Magnesium (Mg2+)mg/LNFT 90-005 [45]0–50
Potassium (K+)mg/LNFT 90-020 [45]0–12
Sodium (Na+)mg/LNFT 90-019 [45]0–200
Bicarbonates (HCO3)mg/LGravimetric Method [45]0–125
Sulphates (SO42−)mg/LNFT 90-009 [45]0–400
Chlorides (Cl)mg/LNFT 90-014 [45]0–500
Total Hardness (TH)mg as CaCO3ISO 6059:1984 [45]0–200
Nitrates (NO3)mg/LNFT 90-012 [45]0–50
Nitrites (NO2)mg/LNFT 90-012 [45]0–3
Phosphorus (P)mg/LISO 6878:2004 [45]0–5
Table 2. Evaluation scale for the Analytic Hierarchy Process [21].
Significance ValuesValue Definitions
1Both factors have equal deduction
3Factor 1 is more important than factor 2
5Factor 1 is very important than factor 2
7Factor 1 has a stronger proposition than factor 2
9Factor 1 has absolute superiority over factor 2
2, 4, 6, 8Intermediate values
Table 3. Statistical summary of groundwater quality parameters.
ParameterUnitMaxMinMeanStandard Deviation Coefficient of Variation
pH-8.027.097.730.152%
ECµS/cm201012471622.07125.048%
TDSmg/L19309901504.07282.1419%
CATmg/L as CaCO3369321344.8911.293%
Ca2+mg/L188.78105.26138.3814.7911%
Mg2+mg/L75.6446.4861.396.2010%
K+mg/L4.521.172.040.5427%
Na+mg/L141.2695.24116.139.478%
HCO3mg/L470390430.7823.816%
SO42−mg/L153.5469.4398.1615.1215%
Clmg/L349.54154.25213.8528.0613%
THmg/L as CaCO3550334432.3758.2113%
NO3mg/L145.3846.7285.4520.7024%
NO2mg/L1.450.410.770.2228%
Pmg/L0.40.020.080.09118%
Table 4. Values of SAR, Na%, RSC, KR, PI and MH in the groundwater samples.
SARNa%RSCKRPIMH
MIN1.69224.221−8.9100.320899%48%
MAX2.55036.976−1.7010.591262%39%
MEAN2.07429.732−4.9090.427879%42%
SD0.1732.4101.3750.0500.0711.877
Table 5. Standard Values for Irrigation Water Quality Parameters [96].
ParameterRangeSuitability
SAR<10Excellent
10–18Good
18–26Doubtful
>26Unsuitable
RSC<1.25Safe
1.25–2.5Marginal
>2.5Unsuitable
Na%<20Excellent
20–40Good
40–60Permissible
60–80Doubtful
>80Unsuitable
KR<1Suitable
1–2Marginal
>2Unsuitable
PI>75Suitable
25–75Marginal
<25Unsuitable
MH<50Suitable
50–60Marginal
>60Unsuitable
Table 6. AHP Criteria Pairwise Comparison Matrix.
pHECTDSHCO3ClNO3SAR%NaRSCKRPIMH
pH1.000.200.250.500.331.000.200.330.330.500.501.00
EC5.001.002.004.003.005.001.003.003.004.004.004.00
TDS4.000.501.003.002.004.000.502.002.003.003.003.00
HCO32.000.250.331.000.502.000.250.500.501.001.001.00
Cl3.000.330.502.001.002.000.331.001.002.002.002.00
NO31.000.200.250.500.501.000.330.501.001.001.001.00
SAR5.001.002.004.003.003.001.001.001.002.002.002.00
%Na3.000.330.502.001.002.001.001.001.001.001.001.00
RSC3.000.330.502.001.001.001.001.001.002.002.002.00
KR2.000.250.331.000.501.000.501.000.501.001.001.00
PI2.000.250.331.000.501.000.501.000.501.001.001.00
MH1.000.250.331.000.501.000.501.000.501.001.001.00
Table 7. Random Index (RI) Values for AHP Consistency Assessment [21].
n123456789101112131415
RI000.580.901.121.241.321.411.451.491.511.481.561.571.58
Table 8. Criteria weight values of water quality parameters.
CriterionpHECTDSHCO3ClNO3
Weight3.10%20.22%13.62%4.87%8.14%4.34%
CriterionSAR%NaRSCKRPIMH
Weight14.38%7.65%8.57%5.13%5.13%4.87%
Table 9. Classification of each sample using the Water Quality Index (WQI).
S. No.WQI ValueWater Quality ClassificationS. No.WQI ValueWater Quality Classification
181.463Good1574.322Good
275.701Good1679.084Good
369.628Good1784.243Good
482.215Good1881.025Good
579.883Good1980.665Good
676.342Good2085.044Good
769.259Good2186.479Good
880.509Good2282.261Good
983.469Good2376.876Good
1080.557Good2479.515Good
1179.118Good2582.952Good
1279.353Good2681.910Good
1379.385Good2788.713Good
1482.101Good
Table 10. Classification of Water Quality Based on WQI scores [135].
GWQI RangeWater Quality ClassSuitability for Irrigation
<50ExcellentHighly suitable; no restrictions
50–100GoodSuitable; minor precautions
100–200PoorMarginally suitable; requires management (e.g., leaching, crop selection)
>300Unsuitable for drinkingHighly unsuitable
Disclaimer/Publisher’s Note: The statements, opinions and data contained in all publications are solely those of the individual author(s) and contributor(s) and not of MDPI and/or the editor(s). MDPI and/or the editor(s) disclaim responsibility for any injury to people or property resulting from any ideas, methods, instructions or products referred to in the content.