Article

A Data-Driven Framework for Flood Mitigation: Transformer-Based Damage Prediction and Reinforcement Learning for Reservoir Operations

by
Soheyla Tofighi
1,*,
Faruk Gurbuz
2,
Ricardo Mantilla
3 and
Shaoping Xiao
1,*
1
Department of Mechanical Engineering, Iowa Technology Institute, University of Iowa, Iowa City, IA 52242, USA
2
Turkish Water Institute, Libadiye Caddesi, Kucukcamlica, No:52, Uskudar, Istanbul 34696, Türkiye
3
Department of Civil Engineering, University of Manitoba, Winnipeg, MB R3T 5V6, Canada
*
Authors to whom correspondence should be addressed.
Water 2025, 17(20), 3024; https://doi.org/10.3390/w17203024
Submission received: 13 September 2025 / Revised: 13 October 2025 / Accepted: 15 October 2025 / Published: 21 October 2025

Abstract

Floods are among the most destructive natural hazards, with damages expected to intensify under climate change and socio-economic pressures. Effective reservoir operation remains a critical yet challenging strategy for mitigating downstream impacts, as operators must navigate nonlinear system dynamics, uncertain inflow forecasts, and trade-offs between competing objectives. This study proposes a novel end-to-end data-driven framework that integrates process-based hydraulic simulations, a Transformer-based surrogate model for flood damage prediction, and reinforcement learning (RL) for reservoir gate operation optimization. The framework is demonstrated using the Coralville Reservoir (Iowa, USA) and two major historical flood events (2008 and 2013). Hydraulic and impact simulations with HEC-RAS and HEC-FIA were used to generate training data, enabling the development of a Transformer model that accurately predicts time-varying flood damages. This surrogate is coupled with a Transformer-enhanced Deep Q-Network (DQN) to derive adaptive gate operation strategies. Results show that the RL-derived optimal policy reduces both peak and time-integrated damages compared to expert and zero-opening benchmarks, while maintaining smooth and feasible operations. Comparative analysis with a genetic algorithm (GA) highlights the robustness of the RL framework, particularly its ability to generalize across uncertain inflows and varying initial storage conditions. Importantly, the adaptive RL policy trained on perturbed synthetic inflows transferred effectively to the hydrologically distinct 2013 event, and fine-tuning achieved near-identical performance to the event-specific optimal policy. These findings highlight the capability of the proposed framework to provide adaptive, transferable, and computationally efficient tools for flood-resilient reservoir operation.

1. Introduction

Floods are among the most devastating and widespread natural hazards worldwide [1,2]. Under socio-economic change only, average global flood losses are forecast to grow from $6 billion annually in 2005 to $52 billion by 2050 [3]. Reservoir operation is widely recognized as one of the most effective strategies for mitigating flood disasters [4,5]. Despite reservoirs’ role in attenuating peak flows, flood-control dams can exacerbate downstream flooding when forecasts are inaccurate and storage is mismanaged. For example, during the 2018 Kerala floods (India), the concurrence of extreme rainfall with high reservoir storage contributed to more than 400 fatalities, affected 56,844.44 ha of cropland, and caused economic losses exceeding USD 3 billion [6]. This underscores the need for reliable and adaptive operation policies.
Stochasticity, nonconvexity, nonlinearity, and high dimensionality are the primary sources of complexity in reservoir-operation optimization. In uncertain settings with complex and partially unknown relationships among system variables, approximation-based methods are often used to improve tractability [7]. Effective reservoir management requires accurate upstream inflow forecasting and robust modeling of downstream dynamics [8]. Reservoir flood-control operations have been the focus of extensive research [9,10]. Numerous optimization approaches have been applied to regulate reservoir operations [11,12]. Common approaches include (i) hedging- and operation rule-based methods, typically solved with evolutionary or other optimization algorithms [13,14]; (ii) dynamic programming frameworks grounded in the Bellman equation, in both deterministic (DP) and stochastic forms (SDP) [15,16,17]; and (iii) data-driven techniques such as decision trees [18,19] and artificial neural networks [20]. Developed primarily offline, these methods generally struggle to update operating policies in response to dynamically changing flow conditions [21]. Moreover, DP and SDP are hampered by the dual curse of dimensionality and modeling, which hinders implementation in relatively complicated reservoir systems [22,23].
To overcome these limitations, reinforcement learning (RL) has recently gained traction as an alternative paradigm for reservoir operation. Unlike rule-based or dynamic programming approaches, RL provides a model-free and adaptive optimization framework, where agents iteratively improve their decision policies through interaction with the environment. This has motivated a growing body of research applying RL to water-resources management, ranging from single- and multireservoir flood control to hydropower scheduling and irrigation systems [7,24,25]. Early RL work on reservoir control includes the application of Q-learning to the day-to-day operation of a single Italian reservoir by Castelletti et al. [26]. The authors introduced Q-learning with planning (QLP), an offline planning augmentation designed to mitigate shortcomings of both SDP and standard model-free Q-learning. In a comparative study for a two-reservoir multipurpose system in South Korea, Lee and Labadie [27] reported that Q-learning delivered better long-term performance than both implicit and sampling variants of SDP.
More recent studies have introduced deep reinforcement-learning (DRL) methods such as Deep Q-Networks (DQN), deep deterministic policy gradient (DDPG), soft Actor–Critic (SAC), and proximal policy optimization (PPO), demonstrating potential for single and multireservoir management. For instance, Riemer Sørensen and Rosenlund [28] applied the SAC algorithm to a week-level scheduling problem for hydropower reservoirs. Using historical inflow and pricing data, their SAC agent learns when to release water for immediate generation or to withhold it in anticipation of higher future prices. Although the setup is simplified, the study highlights deep RL’s potential as a complementary tool—especially attractive for data-rich, long-term hydropower scheduling contexts. Wang et al. [29] constructed offline simulators using real inflow data and explored DDPG, TD3 (Twin Delayed Deep Deterministic Policy Gradient), and SAC for dam operation policy learning. They found that models based on dynamic linear model inflow dynamics enabled effective policy training, with RL-derived strategies notably outperforming human-generated rules. While DDPG converged quickly, TD3 offered superior stability and better real-world performance, indicating a favorable balance between learning speed and generalization.
Xu et al. [30] present the application of Deep Q-Networks (DQN) to hydropower reservoir operation, using a dual-network architecture to map reservoir state to release decisions. Trained on 400-year synthetic and 30-year observed inflow sequences from the Huanren Reservoir, their DQN framework outperforms decision-tree, DP, and SDP approaches. Tian et al. [31] explored both DQN and PPO algorithms to manage flooding and overflow scenarios in water systems. This work shows how DQN can be leveraged for real-time control to minimize overflow and augment flood mitigation performance.
Wu et al. [32] presented a Transformer-based Deep Reinforcement-Learning (T-DRL) framework for multiobjective optimization of cascade hydropower reservoirs. Their model couples a multihead attention encoder with a reservoir decoder to generate joint release schedules, while a reward function integrates power generation, ecological stability, and water-supply benefits. Their model achieves superior performance, boosting power output by 10%, reducing ecological deviations by nearly 40%, and raising water-supply revenue by 4%. Sadeghi Tabas and Samadi [33] introduced the Fill-and-Spill framework, which is the first application of multiple continuous-action policy-gradient DRL algorithms—DDPG, TD3, SAC18, and SAC19—to reservoir operation. Focusing on the Folsom Reservoir in California, their study demonstrates that TD3 and SAC consistently delivered more robust operational policies across competing objectives—such as hydropower production, environmental flow, urban demand, and flood control—compared to DDPG and traditional operating strategies.
Luo et al. [34] proposed an innovative EVHER–SAC framework for joint scheduling of cascade hydropower reservoirs. By integrating evolutionary hindsight experience replay (EVHER) with the SAC algorithm, the method significantly accelerates learning and improves reliability. In single-objective benchmarks, EVHER–SAC outperforms EVHER–TD3 and conventional HER–SAC, achieving higher cumulative rewards and precise water level targets. In multi-objective scenarios, it achieves system-wide coordination with total load deviations contained below 3%, underscoring its potential for robust cascade management. Xu et al. [24] introduced a deep RL framework that couples an LSTM-based runoff forecaster with a PPO policy network for mid- to long-term scheduling of cascade reservoirs; the method explicitly incorporates inflow uncertainty and jointly optimizes hydropower generation, flood-risk mitigation, and storage objectives.
Castro-Freibott et al. [35] tackle the intraday economic optimization of multireservoir hydropower systems with a reinforcement-learning framework tailored to fine temporal dynamics. Evaluating PPO and SAC across continuous, discrete, and adjustment-based action spaces, they benchmark RL agents against greedy heuristics and MILP. Their results revealed RL—particularly PPO with discrete actions—demonstrates robust performance when scaled to six-reservoir systems, achieving fast decision-making and highlighting RL’s scalability and real-time potential. Phankamolsil et al. [36] developed a multi-agent DDPG framework for the Chao Phraya River Basin’s multireservoir system. The objective function balances flood mitigation and drought resilience in the study area, enabling cooperative policies that raised reservoir storage by 10–15% while enhancing both flood mitigation and irrigation capacity. They concluded that the DRL approach outperformed historical operations and optimization tools such as Fmincon and ANFIS in both realism and convergence speed.
Despite notable progress in reservoir operation and flood mitigation, significant gaps remain in existing methodologies. Conventional approaches such as DP, SDP, rule curves, and evolutionary algorithms are constrained by dimensionality and limited adaptability, restricting their effectiveness under complex and uncertain flood conditions. While recent RL frameworks have shown promise for adaptive reservoir operation, they often rely on simplified settings that exclude high-fidelity hydrodynamic and flood damage modeling, limiting their applicability to realistic flood scenarios. Furthermore, most studies overlook inflow uncertainty and variability in initial storage conditions, both of which critically influence gate operation decisions. As a result, there remains a lack of integrated, end-to-end frameworks that couple process-based hydrodynamic simulations, surrogate modeling of flood damages, and adaptive RL control within a unified decision-support system for flood mitigation.
In this study, we address these gaps by developing a novel Transformer-integrated DQN framework for flood-control reservoir operation. Unlike prior DRL and surrogate-based approaches, our framework explicitly optimizes the minimization of downstream flood damage through a reward function informed by a Transformer-based flood damage surrogate trained on physics-based hydrodynamic simulations. This approach differs fundamentally from existing DRL studies that emphasize hydropower generation, multiobjective trade-offs, or urban drainage control by directly embedding flood damage into the optimization objective. By coupling a physics-informed Transformer surrogate with an adaptive DQN agent, our study introduces, to our knowledge, the first end-to-end, damage-focused decision-support framework that integrates hydrodynamic simulation, Transformer-based surrogate modeling, and RL–based reservoir operation for effective flood mitigation planning and control.
This study makes the following four key contributions to flood-resilient reservoir management. First, we introduce an end-to-end workflow that seamlessly integrates process-based hydraulic modeling (HEC-RAS/HEC-FIA), a Transformer-based flood damage-prediction surrogate, and RL for optimizing real-time reservoir operations. Second, we design a novel Transformer-based regression model that serves as a highly accurate and computationally efficient surrogate for high-fidelity hydraulic simulations. This model enables the rapid prediction of time-varying flood damages directly from reservoir states and gate operations, making iterative RL training feasible. Third, we demonstrate that our Transformer-based RL framework generates anticipatory and adaptive gate operation strategies. These strategies significantly outperform both expert-designed policies and passive benchmarks (e.g., zero-opening), while rigorously adhering to operational constraints to ensure feasibility. Fourth, we show the practical robustness of our approach by proving that policies trained under inflow uncertainty can be directly deployed or efficiently fine-tuned for specific, unforeseen flood events. Together, these contributions establish a novel, practical, and transferable paradigm for intelligent reservoir management, effectively bridging the gap between high-fidelity process-based modeling and modern data-driven optimization techniques.
The remainder of the paper is organized as follows. Section 2 introduces a data-driven framework that couples process-based hydrodynamic/impact modeling, transformer-based models, and a reinforcement-learning formulation for reservoir operation. Section 3 describes the data-generation workflow. Section 4 develops and validates the damage-prediction model. Section 5 formulates the policy-optimization problem and learning algorithm. Section 6 deploys the learned operating policy and evaluates its performance against established baselines, and contrasts it with alternative optimization approaches. Section 7 evaluates the robustness and adaptivity of the learned policy across varying initial storage conditions and inflow uncertainties, and further examines its generalization to an out-of-sample flood event. Section 8 distills contributions and outlines future extensions.

2. Materials and Methods

2.1. A Data-Driven Framework for Flood Mitigation

This study proposes a comprehensive data-driven framework for optimizing flood mitigation strategies, with a specific focus on reservoir operation during extreme hydrologic events. Floods are among the most devastating natural disasters, causing significant economic losses, infrastructure damage, and threats to human safety. Traditional flood management approaches often rely on static rule curves or simplified hydrological models, which may not adequately capture the dynamic and complex nature of extreme flood events. To address these limitations, our framework synergistically integrates process-based hydraulic simulations with machine learning techniques to enhance flood prediction and decision support in vulnerable river basins. Without loss of generality, Figure 1 outlines the following key components of the proposed workflow.
  • Data Generation: The first phase of our framework focuses on process-based data generation. Advanced hydraulic models, such as HEC-RAS, after calibration can be employed to simulate reservoir water levels, releases, and downstream inundation under alternative gate operation strategies. To ensure sufficient coverage of operational scenarios, A Greedy Sampling scheme is employed to systematically generate a diverse set of gate operation strategies. The resulting hydraulic outputs (e.g., flood depth and extent) are merged with geospatial and socio-economic datasets in consequence models (e.g., HEC-FIA) to estimate economic losses. This component provides the critical input data for subsequent stages of the framework, including machine learning-driven optimization and decision support, enabling end-to-end evaluation of mitigation strategies.
  • Damage Prediction: Process-based hydraulic simulations are computationally expensive, hindering flood mitigation strategy optimization. To overcome this, a machine learning (e.g., Transformers or recurrent neural networks) model is developed in this phase as a surrogate to predict flood damages using pre-generated simulation data. The model shall process time-series inputs, such as reservoir storage, release rates, and gate operations, capturing long-range dependencies efficiently. This component enables rapid and accurate estimation of downstream flood impacts, especially economic losses, which serves as feedback for optimizing reservoir gate operation strategies in the next phase. By replacing iterative process-based simulations, the damage predictive model reduces computational costs without sacrificing fidelity.
  • Policy Optimization: Model-free control and optimization methods, such as reinforcement learning (RL) or genetic algorithms (GAs), can be employed to train an AI agent (i.e., the computer program) to discover optimal flood mitigation strategies, i.e., the reservoir gate operation policy in this phase. The agent learns through iterative interactions with a virtual environment, specifically, the damage-prediction surrogate model developed earlier. The problem needs to be formulated as a partially observable Markov decision process (POMDP), where the agent observes historical hydrologic states (e.g., reservoir storage and water release), takes actions (gate adjustments), and receives a penalty or negative reward based on predicted flood damage. The learning objective is to maximize cumulative reward, ultimately deriving an optimal control policy that minimizes flood damage during extreme events.
  • Policy Deployment and Evaluation: The optimized flood mitigation policy from the previous component is deployed by integrating it with the process-based hydraulic model, where it autonomously generates a sequence of gate operations during simulated flood events. Simultaneously, the system calculates the evolution of flood damage, enabling direct performance comparisons against conventional baseline operations (e.g., human operator decisions and a zero-open alternative). Rigorous validation using historical and synthetic flood scenarios can quantify improvements in damage reduction, evaluated through both peak damage (the maximum instantaneous impact) and time-integrated damage (the cumulative losses over the event duration). The deployment component also allows fine-tuning recommendations, ensuring practical implementation in real-world reservoir management systems.
The rest of this section presents the theoretical foundations of the methods specifically employed in this study, structured within the proposed framework. These include a process-based hydraulic model, Transformers, and an RL method.

2.2. Process-Based Hydraulic Model

Hydraulic simulation and flood impact analysis are critical to process-based flood-risk assessment, enabling detailed evaluation of how flood events propagate through river systems and affect vulnerable communities and infrastructure. Hydraulic models simulate the spatial and temporal distribution of floodwaters by solving the governing equations of open-channel and overland flow, accounting for channel geometry, floodplain topography, hydraulic structures (e.g., bridges, culverts, levees), and operational interventions such as reservoir gate releases. These simulations are capable of generating high-resolution outputs of water surface elevations, flow velocities, and inundation extents over the entire floodplain, providing a physically realistic representation of floodwave propagation under varying hydrologic and management scenarios [37].
The outputs from hydraulic simulations form the basis for flood impact analysis, which estimates the potential consequences of flooding in terms of economic damages, infrastructure disruption, and societal impacts. Flood impact models integrate dynamic inundation data with spatial datasets of exposed assets, including structure inventories, land use classifications, population distribution, and critical facilities. Damage assessments are typically performed using depth-damage functions that relate water depth to economic loss for different occupancy types (e.g., residential, commercial, industrial) [38]. This coupling of hydraulic and impact models enables a comprehensive understanding of flood risks, supporting floodplain management, mitigation planning, and emergency response strategies.
In this study, hydraulic simulations are conducted using the Hydrologic Engineering Center’s River Analysis System (HEC-RAS), a widely adopted hydraulic modeling platform developed by the U.S. Army Corps of Engineers [37]. HEC-RAS is configured to perform two-dimensional (2D) unsteady flow simulations, providing detailed spatial outputs of inundation characteristics across the floodplain. The resulting hydrodynamic outputs are then processed using the Hydrologic Engineering Center’s Flood Impact Analysis (HEC-FIA) model [39], which computes economic impacts by integrating time-varying inundation data with exposure datasets and depth-damage relationships.

2.3. Transformers

Transformers have revolutionized sequence modeling in time-series analysis by introducing a self-attention mechanism that enables the model to weigh the relevance of different elements within an input sequence, regardless of their positional distance [40]. Unlike traditional Recurrent Neural Networks (RNNs), such as Long Short-Term Memory (LSTM) networks [41] and Gated Recurrent Units (GRUs) [42], which process data sequentially and struggle with vanishing gradients over long sequences, Transformers process entire sequences in parallel, offering superior scalability and a more effective means of capturing long-range dependencies. This parallelism significantly accelerates training and inference, especially on large datasets, and allows the model to learn global contextual relationships that RNN-based architectures often fail to capture [40]. Additionally, Transformers provide greater architectural flexibility, enabling them to handle complex spatiotemporal patterns and multi-dimensional time-series data more effectively [43,44,45]. However, this increased modeling capacity comes with a computational trade-off, as the self-attention mechanism introduces a quadratic memory and computational complexity with respect to sequence length, making Transformers resource-intensive compared to the more lightweight LSTM and GRU architectures [40,46].
While the original Transformer architecture was designed with an encoder-decoder structure for sequence-to-sequence tasks such as machine translation, time-series applications often do not require an explicit decoder component. For tasks like forecasting, anomaly detection, and classification, using only the encoder stack of the Transformer is sufficient and highly effective. The encoder’s self-attention mechanism enables the model to capture complex dependencies across time steps without relying on sequential computations, making it well-suited for time-series data where the input sequence is directly mapped to a future prediction or classification output [43].
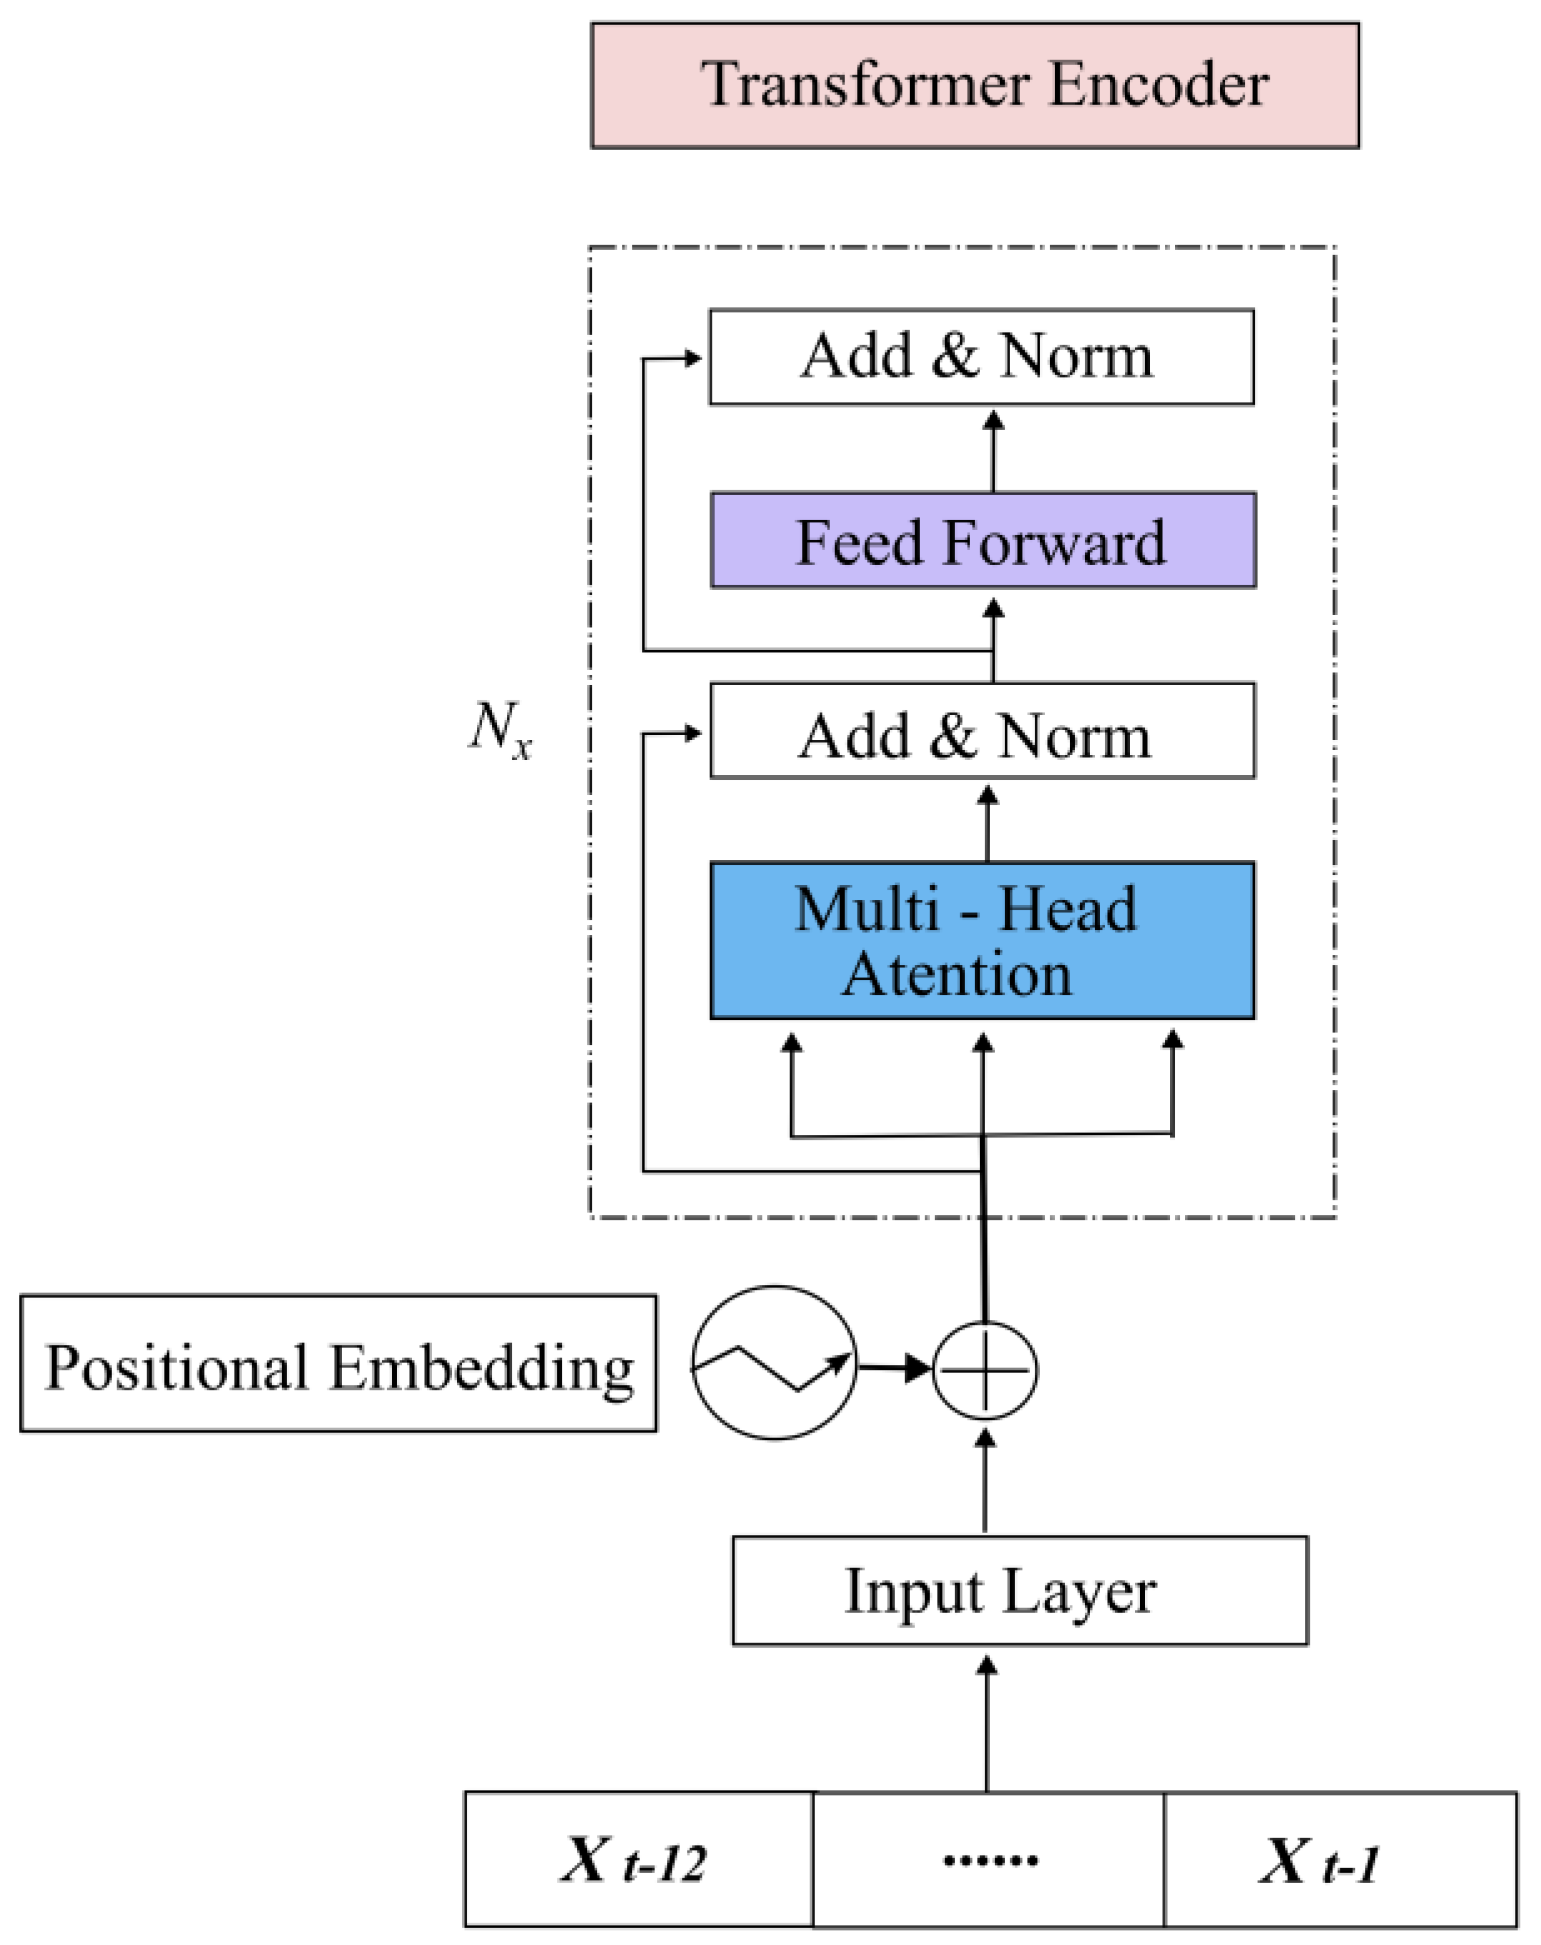
Each encoder block consists of two primary components, as depicted in Figure 2: a multihead self-attention module and a position-wise feedforward network. These layers allow the model to dynamically compute attention weights over the entire input sequence and learn contextualized representations that capture both local and global temporal patterns. The absence of recurrence and reliance on self-attention provides the Transformer encoder with the ability to process sequences in parallel, significantly improving computational efficiency compared to an RNN-based architecture.
One of the core challenges in Transformer models is the absence of inherent sequence-order awareness, which is naturally embedded in RNNs due to their sequential structure [40]. To compensate for this, positional encoding is added to the input embeddings to provide sequence-order information. In the absolute positional encoding used by the vanilla Transformer, for each position index t, the positional encoding vector is defined as:
P E ( t ) i = sin ( ω i t ) , if i is even cos ( ω i t ) , if i is odd
where ω i denotes a predefined frequency associated with each embedding dimension.
The core innovation of the Transformer is the scaled dot-product attention, which computes attention distributions as:
Attention ( Q , K , V ) = softmax Q K d k V
where Q, K, and V represent the query, key, and value matrices, and d k is the dimensionality of the key vectors. To enable the model to jointly attend to information from different representation subspaces, the Transformer employs multihead attention, which projects the input into multiple lower-dimensional subspaces and computes attention independently in each:
MultiHead ( Q , K , V ) = Concat ( head 1 , , head H ) W O
head i = Attention ( Q W i Q , K W i K , V W i V )
where W i Q , W i K , W i V , and W O are learned projection matrices. This design enables the model to capture diverse relationships within the data through multiple attention heads, thereby enhancing the model’s representational capacity.
In addition to the attention mechanisms, each Transformer encoder layer includes a position-wise feedforward network (FFN), defined as:
F F N ( H 0 ) = ReLU ( H 0 W 1 + b 1 ) W 2 + b 2
where H 0 denotes the input to the layer, and W 1 , W 2 , b 1 , b 2 are trainable parameters. To ensure stable gradient flow and facilitate the training of deep architectures, residual connections and layer normalization are applied after each sub-layer:
H 0 = LayerNorm ( SelfAttn ( X ) + X )
H = LayerNorm ( F F N ( H 0 ) + H 0 )
In recent years, Transformers have been increasingly applied in hydrology and water-resources management due to their ability to model complex spatiotemporal dependencies [47,48,49]. In this study, the data-driven framework for flood mitigation leverages Transformer architectures in two distinct capacities. First, we employ a Transformer model to establish the relationship between reservoir-operation sequences and their downstream consequences, including flood damage predictions, to generate a surrogate model for RL and optimization workflows. Second, we implement Transformers within the RL methodology itself to better model the temporal dynamics of hydrologic systems, enabling more effective learning of control strategies, i.e., policy, for complex water management scenarios.

2.4. Reinforcement Learning

RL is a subfield of machine learning where agents learn to make sequential decisions by interacting with an environment [50]. Unlike supervised learning, which relies on labeled datasets, RL employs trial-and-error learning, with agents receiving feedback in the form of rewards after executing actions. The objective is to maximize cumulative rewards by deriving an optimal policy, i.e., a strategy that selects the best action for any given state. RL problems are typically formalized as Markov Decision Processes (MDPs) or Partially Observable MDPs (POMDPs), depending on whether the environment is fully or partially observable. This subsection first introduces these mathematical frameworks (MDP/POMDP) and then details a novel deep RL method combining Deep Q-Networks (DQN) with Transformers to address observability challenges in high-dimensional state spaces. Notably, the problem formulation of flood mitigation and the policy learning procedure will be detailed in Section 5.

2.4.1. MDP and POMDP

The interaction between an RL agent and its environment is commonly formalized as an MDP, which assumes the agent has full observability of the environment’s current state [51]. Under this framework, the agent makes decisions based solely on the present state variables, which provide complete and sufficient information for optimal action selection. Formally, an MDP is defined by the tuple:
P MDP = ( S , A , T , s 0 , R ) ,
where:
  • S = { s 1 , , s n } is the finite set of environment states,
  • A = { a 1 , , a m } is the finite set of possible actions,
  • T : S × A × S [ 0 , 1 ] is the state transition probability function, satisfying s T ( s , a , s ) = 1 ,
  • s 0 S is the initial state,
  • R : S × A × S R is the reward function.
During the learning process, the agent makes decisions in the current state s t . After selecting an action a t , the environment transitions to a new state s t + 1 according to T, and the agent receives a reward R ( s t , a t , s t + 1 ) . The objective is to learn a policy that maximizes the expected return, starting from any state s:
U ( s ) = E t = 0 γ t R ( s t , a t , s t + 1 ) | s 0 = s ,
where γ [ 0 , 1 ] is a discount factor controlling the weight of future rewards.
However, in many real-world applications, the agent cannot directly observe the full state of the environment [52,53]. Instead, it receives partial observations that provide incomplete information about the true state. In such cases, the MDP framework is insufficient, necessitating the more general POMDP framework [54]. A POMDP extends the MDP by incorporating observations and is formally defined as:
P POMDP = ( S , A , T , s 0 , R , O , Ω ) ,
where:
  • O = { o 1 , , o z } is the set of possible observations,
  • Ω : S × A × O [ 0 , 1 ] is the observation function, defining the probability of receiving observation o after taking action a and arriving at state s , satisfying o O Ω ( s , a , o ) = 1 .
In this setting, the agent makes decisions not based on the current state s t , but rather on the sequence of observations up to the current time t: o t = { o t l + 1 . . . , o t 2 , o t 1 , o t } where l is the sequence length of historical observations. After executing action a t , the agent receives a new observation o t + 1 at the next state s t + 1 , and uses it to update its internal representation of the environment, o t + 1 = { o t l + 2 . . . , o t 1 , o t , o t + 1 } .
In this study, the reservoir-operation problem is formulated as a POMDP because only a limited number of state variables, including reservoir storage and release, and time since the onset of the event, are available without access to downstream hydrodynamics. This partial information requires the agent to infer temporal dependencies and risk trends from sequential data. We address this challenge using a model-free RL approach, specifically Deep Q-Learning (DQN), which does not require explicit knowledge of the transition or observation functions. The agent learns directly from interaction with a custom simulation environment that integrates flood damage estimates and operational dynamics.

2.4.2. Transformer-Based Deep Q-Learning

DQN is a value-based model-free RL algorithm designed to approximate the optimal action-value function, known as the Q-function, using deep neural networks [55]. The Q-function estimates the expected cumulative reward for taking a given action in a particular state and following a certain policy thereafter. Traditional DQN architectures rely on fully connected feedforward neural networks to approximate the Q-values. However, such architectures are limited in their capacity to model sequential dependencies when the state representation involves temporal sequences or time-series data. In environments where the true system state is only partially observable at each time step, effective decision-making requires reasoning over a history of observations [56,57].
To address this challenge, this study proposes integrating Transformers into DQN architectures to leverage the self-attention mechanism of Transformers to capture temporal dependencies within the observation sequences effectively. In this implementation, the standard feedforward Q-network is replaced with a Transformer encoder that processes historical observation sequences, enabling the agent to consider contextual relationships between past observations when estimating Q-values. This architecture is particularly advantageous in environments where the current decision depends on patterns and trends spanning multiple time steps.
The Transformer-based Q-network (Figure 3) receives a sequence of observation embeddings as input, which are first enriched with positional encodings to retain sequence-order information. These embeddings are then passed through a stack of transformer encoder blocks, each composed of multihead self-attention and position-wise feedforward networks, producing contextualized representations that serve as input to the final Q-value regression head. The output layer estimates Q-values for all possible actions given the observation sequence.
The training procedure of the Transformer-based DQN adheres to the conventional DQN framework, with the primary distinction being the use of a Transformer encoder for Q-value estimation in place of a fully connected network. Two neural networks are maintained during training: the evaluation network Q, and the target network Q T . The evaluation network is updated at every training step and is responsible for estimating Q-values used in both action selection and learning. In contrast, the target network is a periodically updated copy of the evaluation network that is used exclusively to compute target Q-values. This separation mitigates the instability that can arise from using rapidly changing estimates for target computation. The parameters of the target network are synchronized with those of the evaluation network at fixed intervals to balance stability and adaptability.
At each iteration, a batch of experience transitions ( o t , a t , r t , o t + 1 ) is sampled from a replay buffer. An experience replay buffer stores past transitions in the form of observation sequences, selected actions, and received rewards, allowing the agent to retain and reuse previous experiences during training. By sampling random mini-batches from this buffer, the agent breaks temporal correlations between consecutive samples, enhancing learning stability and improving sample efficiency. The evaluation Q-network is updated by minimizing the Bellman error loss between the predicted Q-values and the target Q-values computed using the target network. The Bellman error is defined as:
L ( θ ) = E ( o t , a t , r t , o t + 1 ) y t T Q ( o t , a t ; θ ) 2
where the target Q-value is given by:
y t T = r t + γ max a Q T ( o t + 1 , a ; θ )
Here, θ and θ represent the parameters of the evaluation network and target network, respectively, and γ is the discount factor. The target network is periodically updated to stabilize learning.
After training converges, the evaluation Q-network approximates the optimal action-value function Q * ( o , a ) . From this, the optimal policy ξ * ( o ) can be derived by selecting the action that corresponds to the highest Q-values:
ξ * ( o t ) = arg max a A Q * ( o t , a )
The Transformer architecture enhances the Q-network’s ability to model the temporal structure of the environment, enabling the agent to dynamically attend to relevant time steps. This improves policy learning in sequential decision-making tasks where the state transitions exhibit complex temporal dependencies.

3. Data Generation

3.1. 2008 Iowa Flood Event

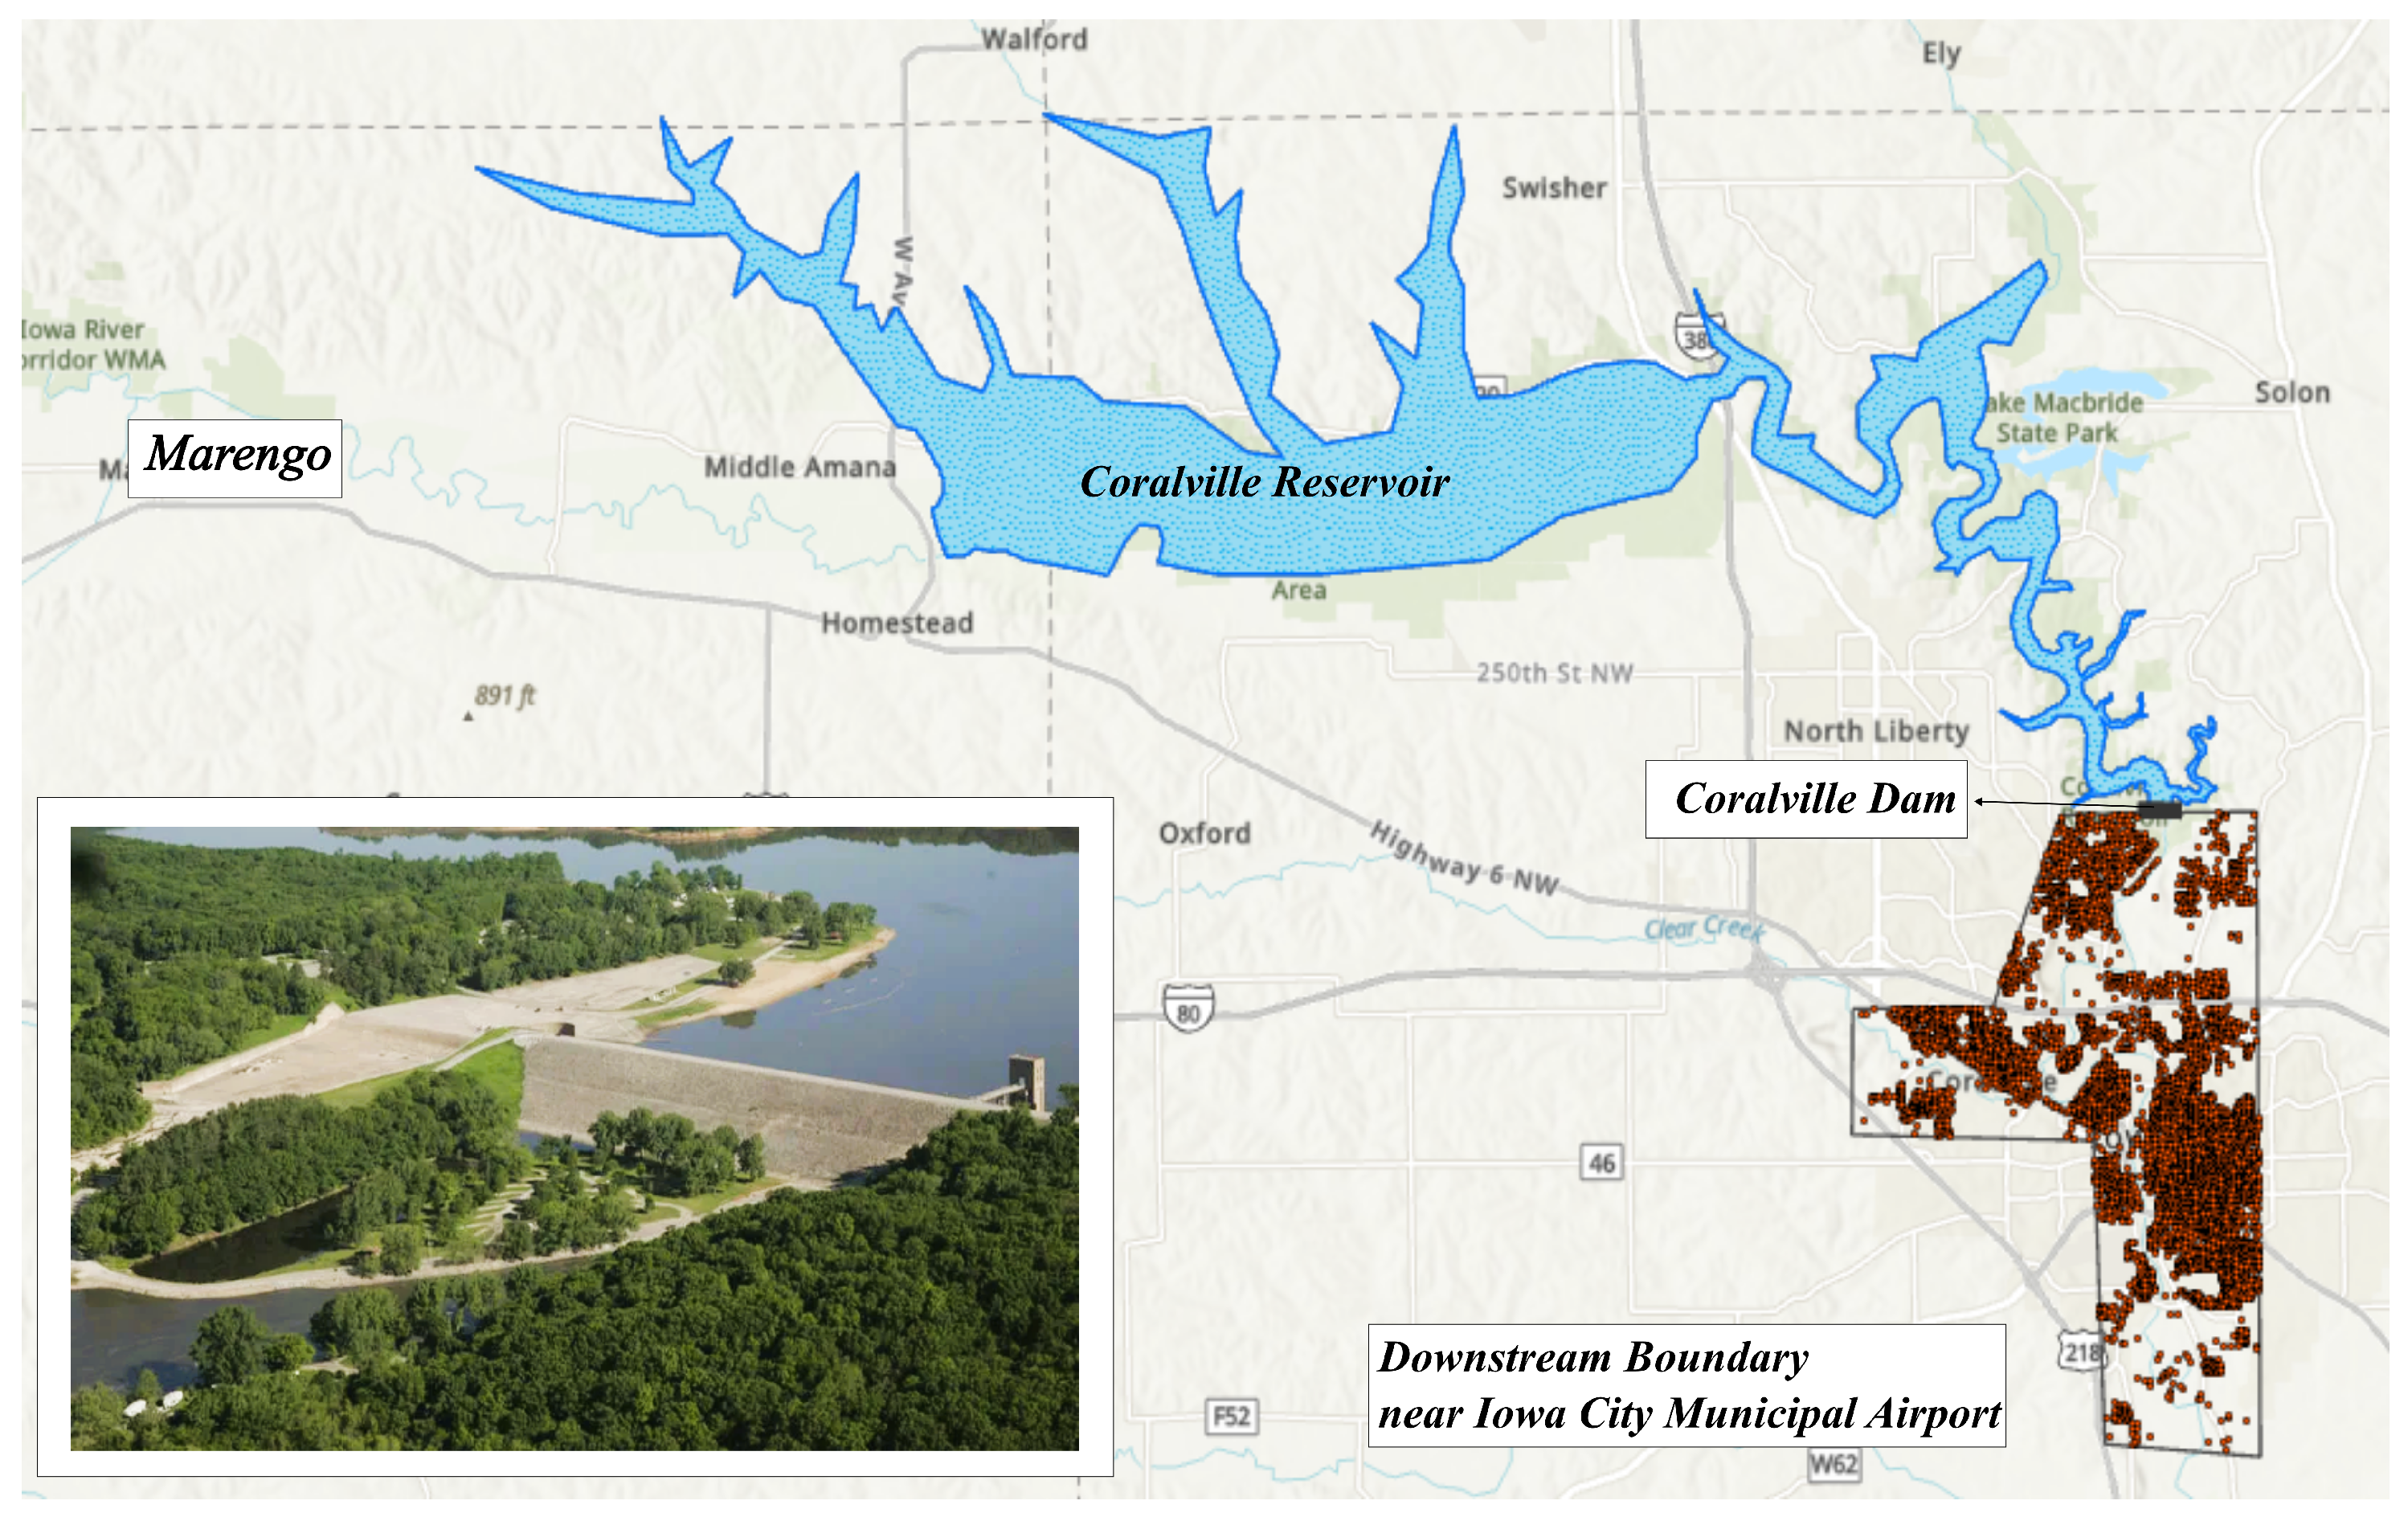
We use the 2008 Iowa flood event as a case study to demonstrate the application of the proposed data-driven framework for flood mitigation, as described in Section 2.1. The focus is on the Iowa River Basin and its internal river network, which spans central and eastern Iowa, shown in Figure 4 with the watershed boundary and the USGS stream gauges. The basin drains an area of approximately 11,140 km 2 before converging with the Mississippi River near Columbus Junction and is monitored by more than 20 USGS gauging stations. Over the past two decades, the basin has experienced multiple flood events, such as in 2008 and 2013, causing recurring damage to communities, infrastructure, and agricultural systems.
One of the most severe flood events occurred from 8 June to 1 July 2008, when widespread flooding impacted 86 Iowa counties, resulting in more than $11 billion in damages and displacing over 41,000 people [58]. A key regulatory structure within the basin is the Coralville Dam, an earthfill dam completed in 1959. Measuring 426 m in length and 30 m in height, the dam forms the Coralville Reservoir, located approximately 134 km upstream from the Mississippi River and 8 km north of Iowa City. The dam plays a critical role in flood-risk mitigation along the Iowa River corridor [59]. It regulates inflow from a drainage area of around 8068 km 2 , primarily composed of agricultural land. An additional 3052 km 2 of watershed lies downstream.
This study specifically considers the downstream reach from the Coralville Dam to an area south of the Iowa City Municipal Airport, which includes the most densely populated and flood-vulnerable urban sections downstream of the dam. Figure 5 illustrates the Coralville Reservoir system and the downstream study area, highlighting key features such as the dam location, flood-prone urban zones in Coralville and Iowa City, and individual building footprints (represented by orange dots). The downstream boundary extends to the Iowa City Municipal Airport.

3.2. Model Calibration

A two-dimensional unsteady flow model was developed in HEC-RAS [37] to simulate floodwave propagation from the Coralville Reservoir downstream to Iowa City during the 2008 flood from June 8 to June 28. We selected 8 June 2008 as the event onset because this date marks the beginning of the principal flood wave downstream of the Coralville Reservoir, when inflows and damages started to rise sharply. Using June 8 as the initial condition ensured that the simulation captured the full development, peak, and recession of the 2008 flood. The calibration of this model focused on reproducing the hydrodynamic response of the reservoir and river system under dam operation as formulated below.
Reservoir storage evolves according to the discrete water balance,
S t + 1 = S t + Q t in Q t rel Δ t ,
where Q t in is inflow and Q t rel is the total release. The latter is decomposed into controlled gated discharge and uncontrolled spillway overflow,
Q t rel = Q gate ( g t , H t , H d ) + Q spill ( H t ) ,
with gate opening g t set by the operational action a t , reservoir pool elevation H t = f SE ( S t ) given by the storage–elevation curve, and downstream tailwater elevation H d computed from the hydraulic routing.
The controlled gate discharge is computed following the HEC-RAS gate routines, which distinguish between free and submerged orifice flow. For a sluice gate of width b and opening height g t ,
Q gate = C d b g t 2 g H t E g , free orifice , C s b g t 2 g ( H t E g ) ( H d E g ) , submerged orifice ,
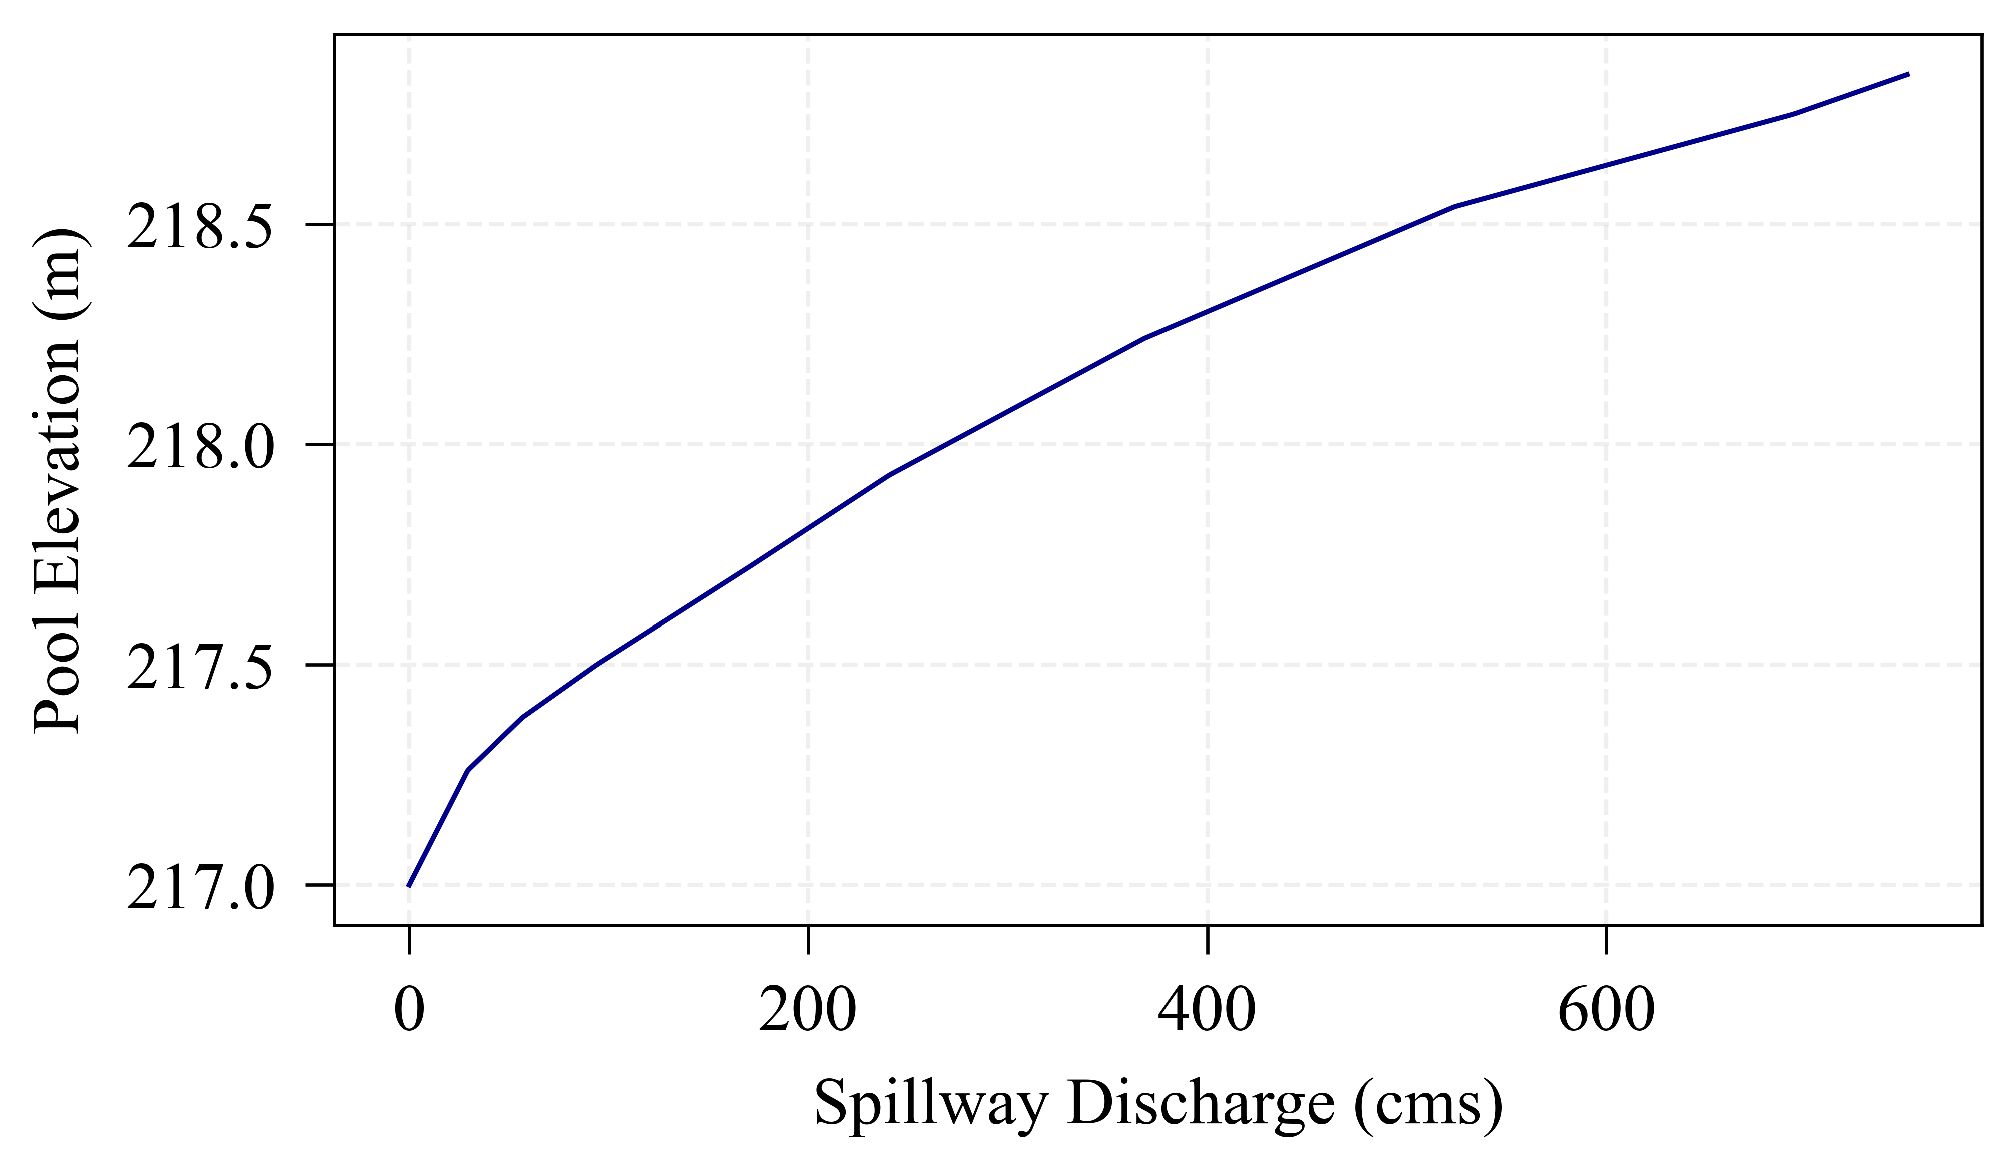
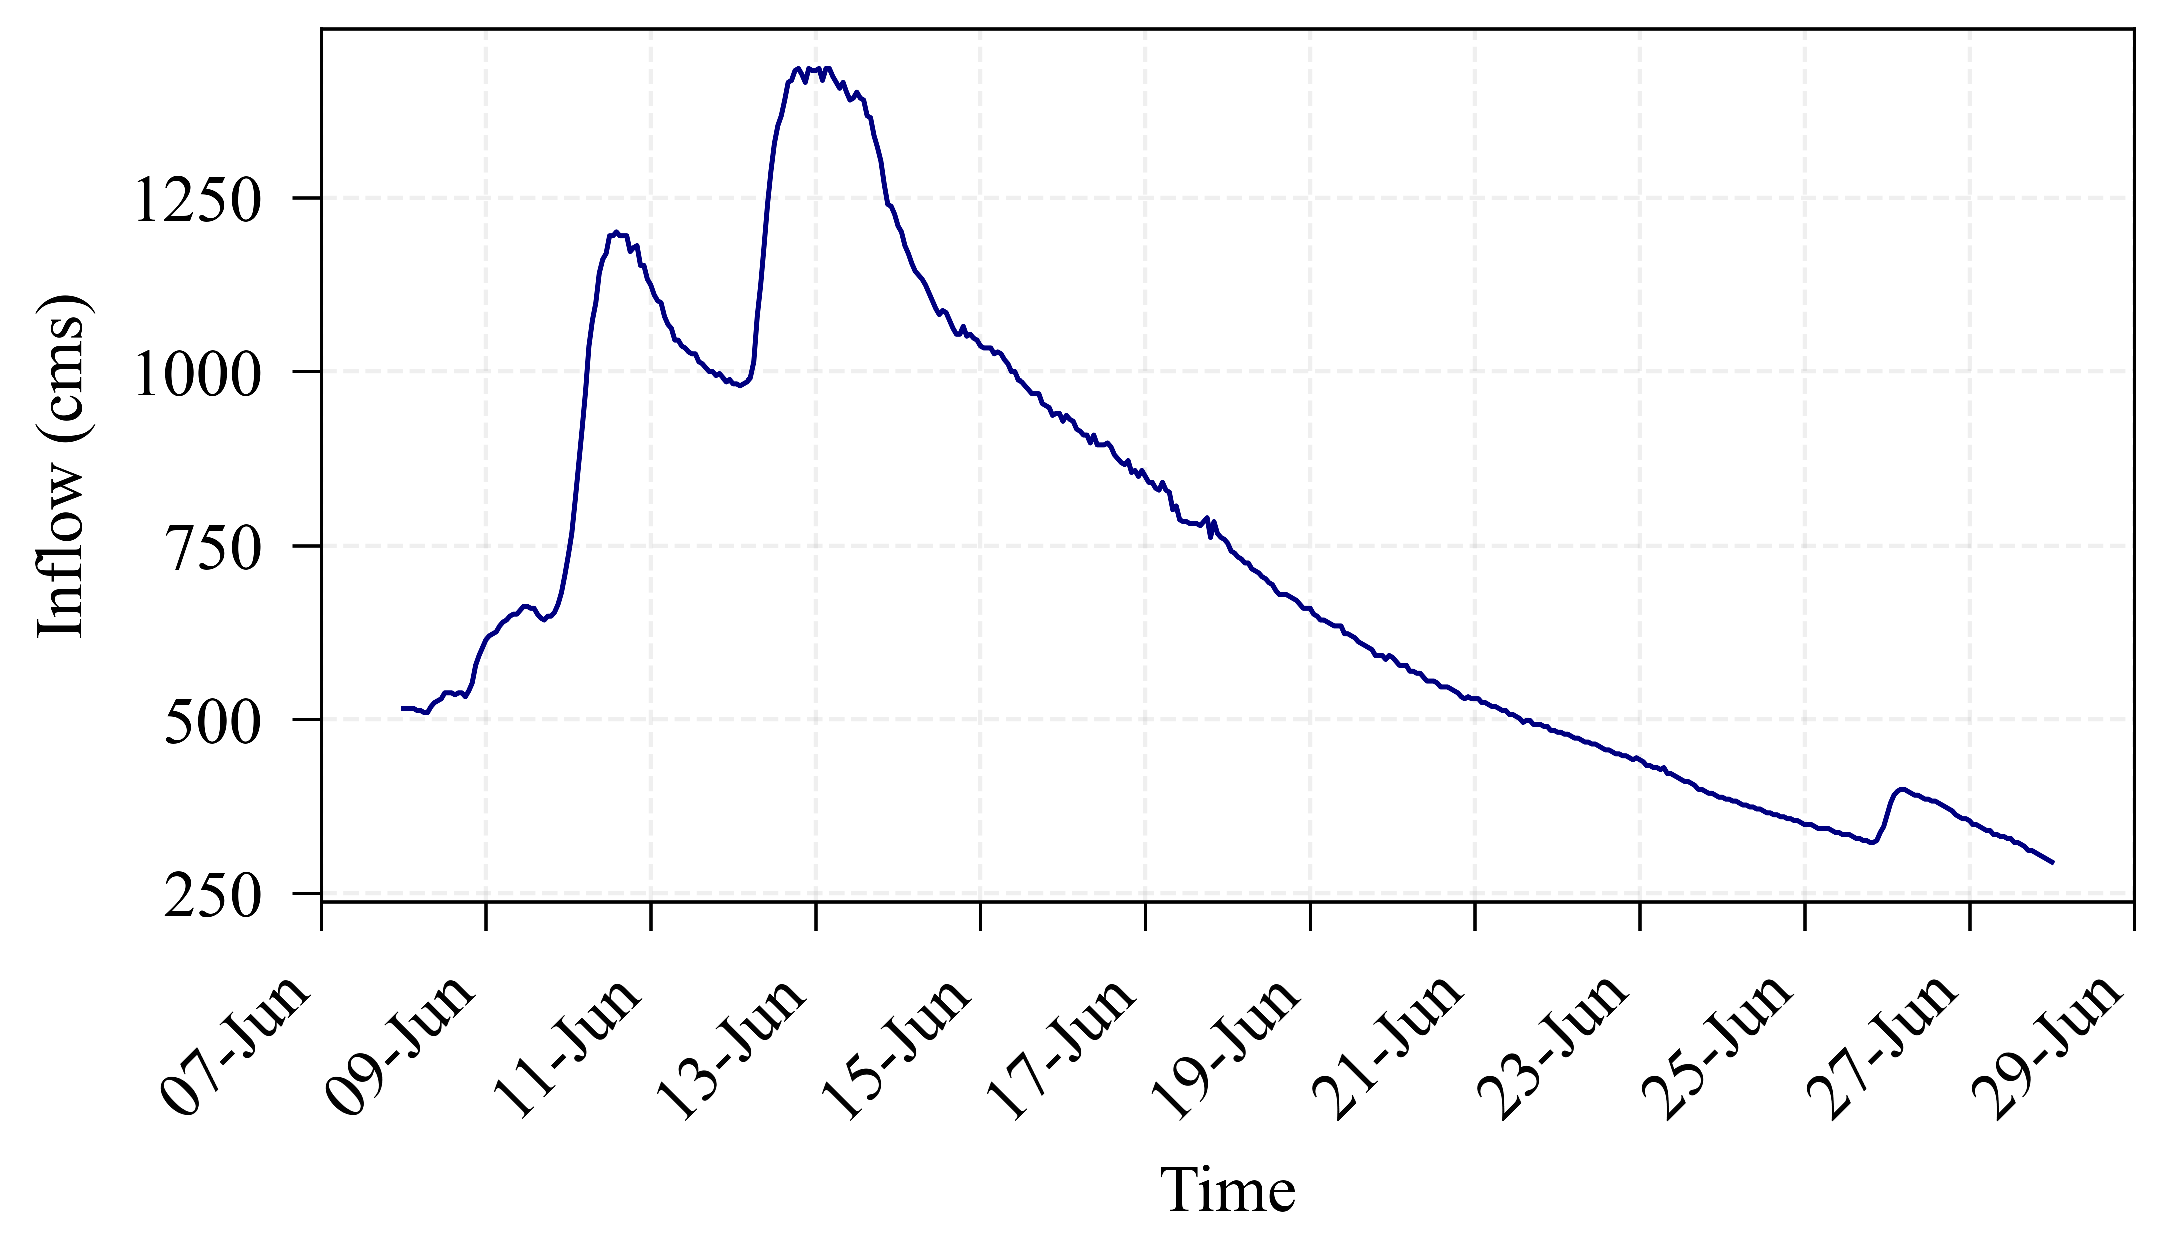
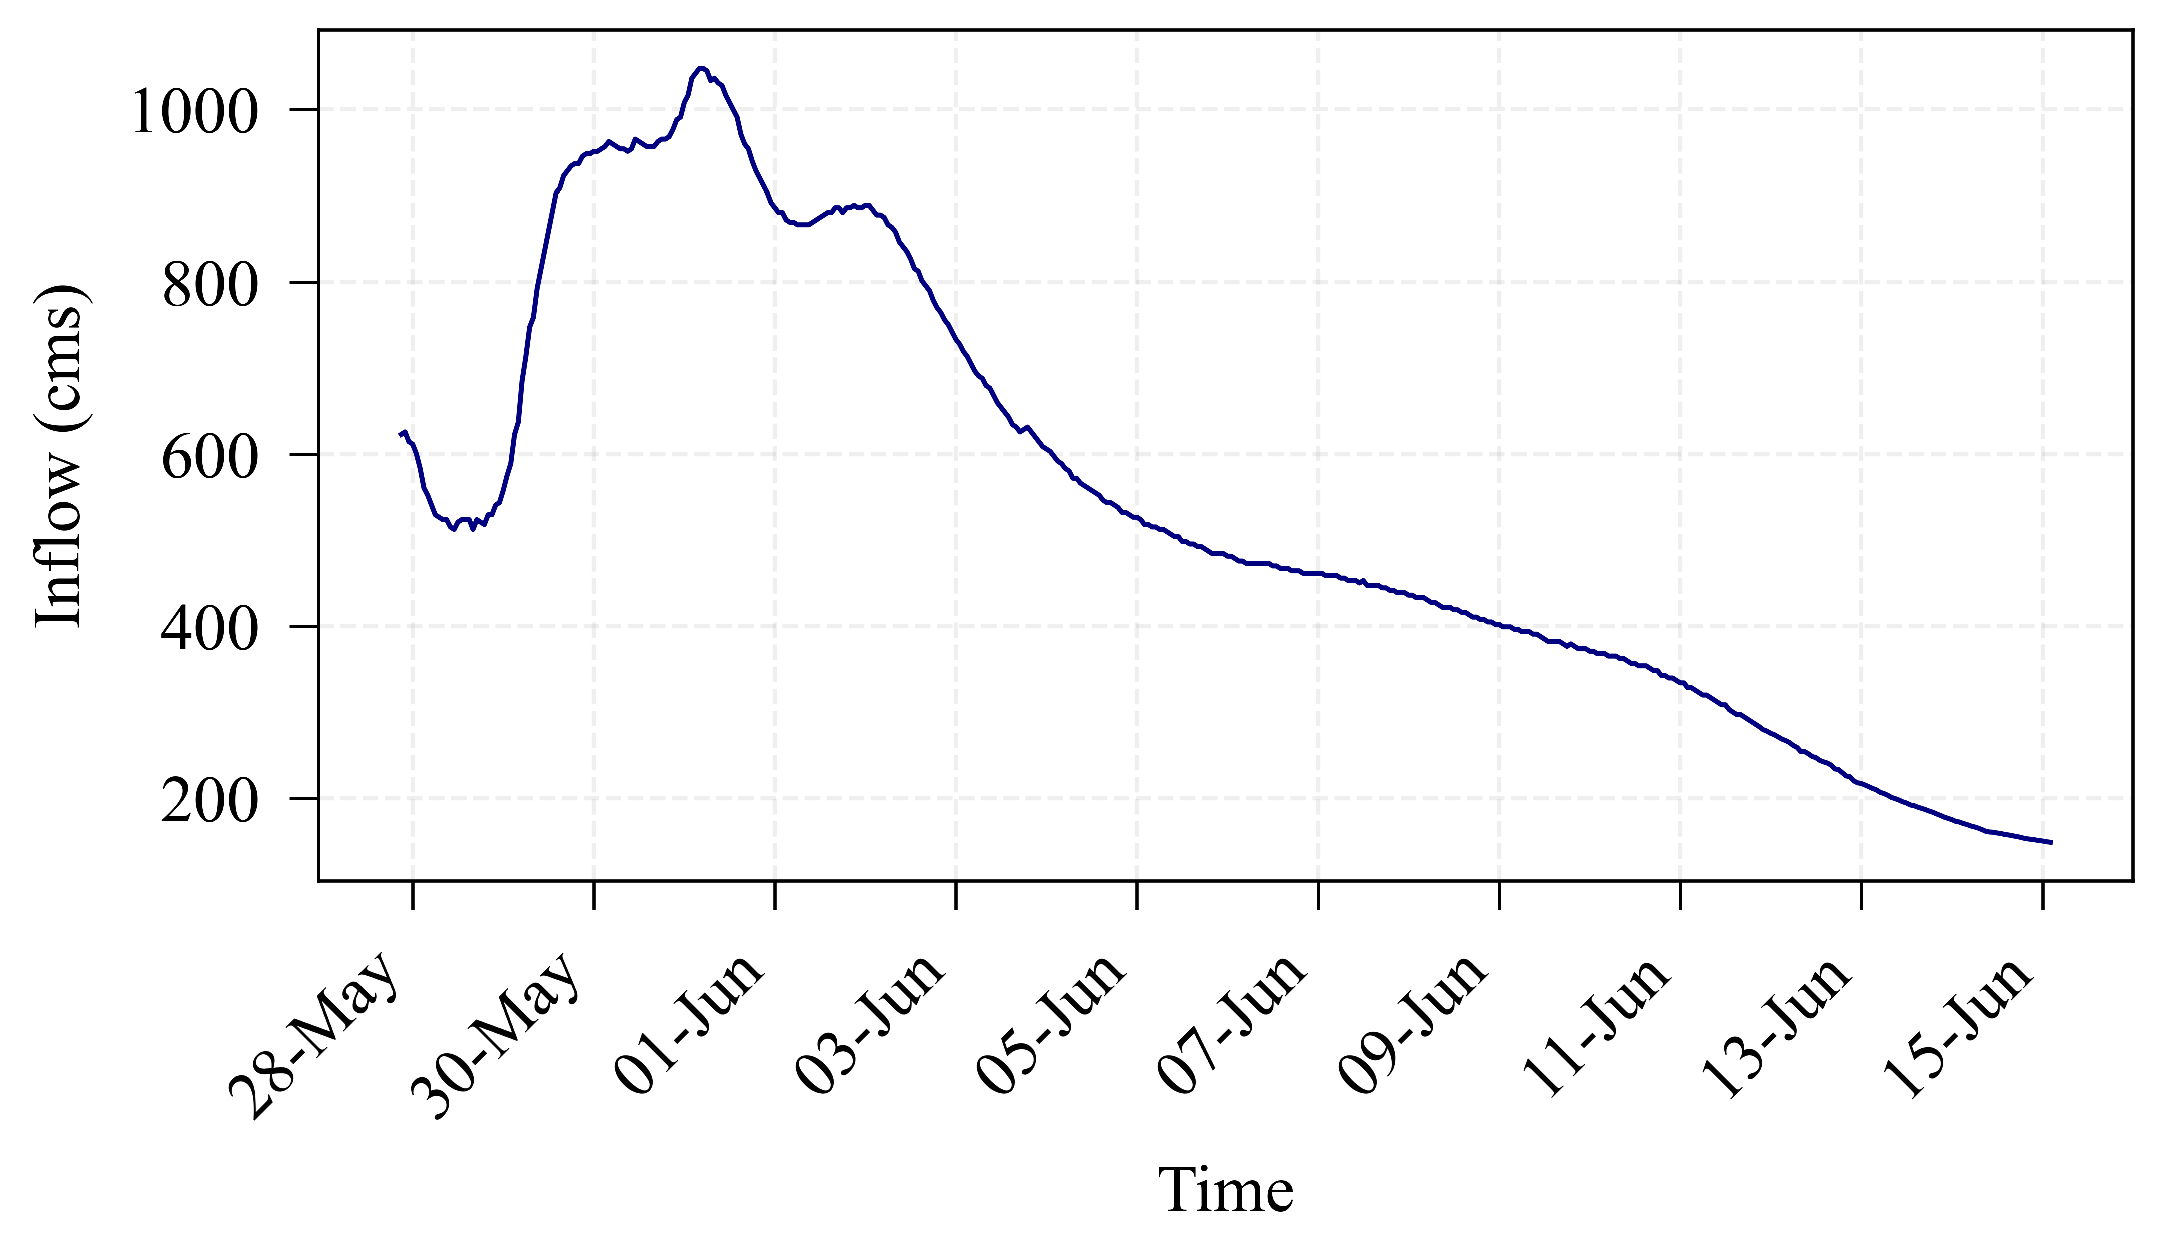
where C d and C s are the discharge coefficient estimated via calibration, b = 7.0 m is the width of the gate, g t is the gate-opening height (m), g = 9.81 m / s 2 is gravitational acceleration, and E g = 196.9 m is the gate invert elevation. The uncontrolled spillway component Q spill ( H t ) is obtained from an interpolated elevation–discharge curve specific to the Coralville spillway, shown in Figure 6, and becomes nonzero only when H t exceeds the spillway crest elevation ( 217.00 m). The observed inflow hydrograph from the USGS Marengo gauging station in Figure 7 was applied as the upstream boundary condition.
Dam operations, including both controlled gate openings and uncontrolled spillway flows, were explicitly specified to represent reservoir-controlled and uncontrolled releases. Because no direct reference for historical gate operation records was available, the actual operational sequence was reconstructed through reverse engineering using the orifice equation for gated flows and the elevation–discharge relationship for the uncontrolled spillway. The reconstructed gate operation time series, shown in Figure 8, represents the real operational pattern during the event. It can be seen that the gate remained fully open (7 m aperture) for the majority of the flood event duration, indicating sustained high-flow conditions. In this simulation, the initial condition corresponds to 66 % of maximum reservoir storage with gates set at an opening of 5.8 m .
Observed reservoir storage (pool elevation), release data, and downstream stage measurements were obtained from the USACE RiverGages database [60], with daily intervals. These observations served as the primary reference for model calibration. The calibration was performed by adjusting hydraulic parameters such as Manning’s roughness coefficients and the discharge coefficient (calibrated to C d = 0.6 and C d = 0.8), to ensure consistency between simulated and observed reservoir/river dynamics, while mesh resolution was refined to enhance numerical accuracy. Specifically, the calibration targeted:
  • Reservoir pool-elevation time series,
  • Release hydrographs from the reservoir,
  • Stage hydrographs at downstream USGS stations, particularly the Iowa City station.
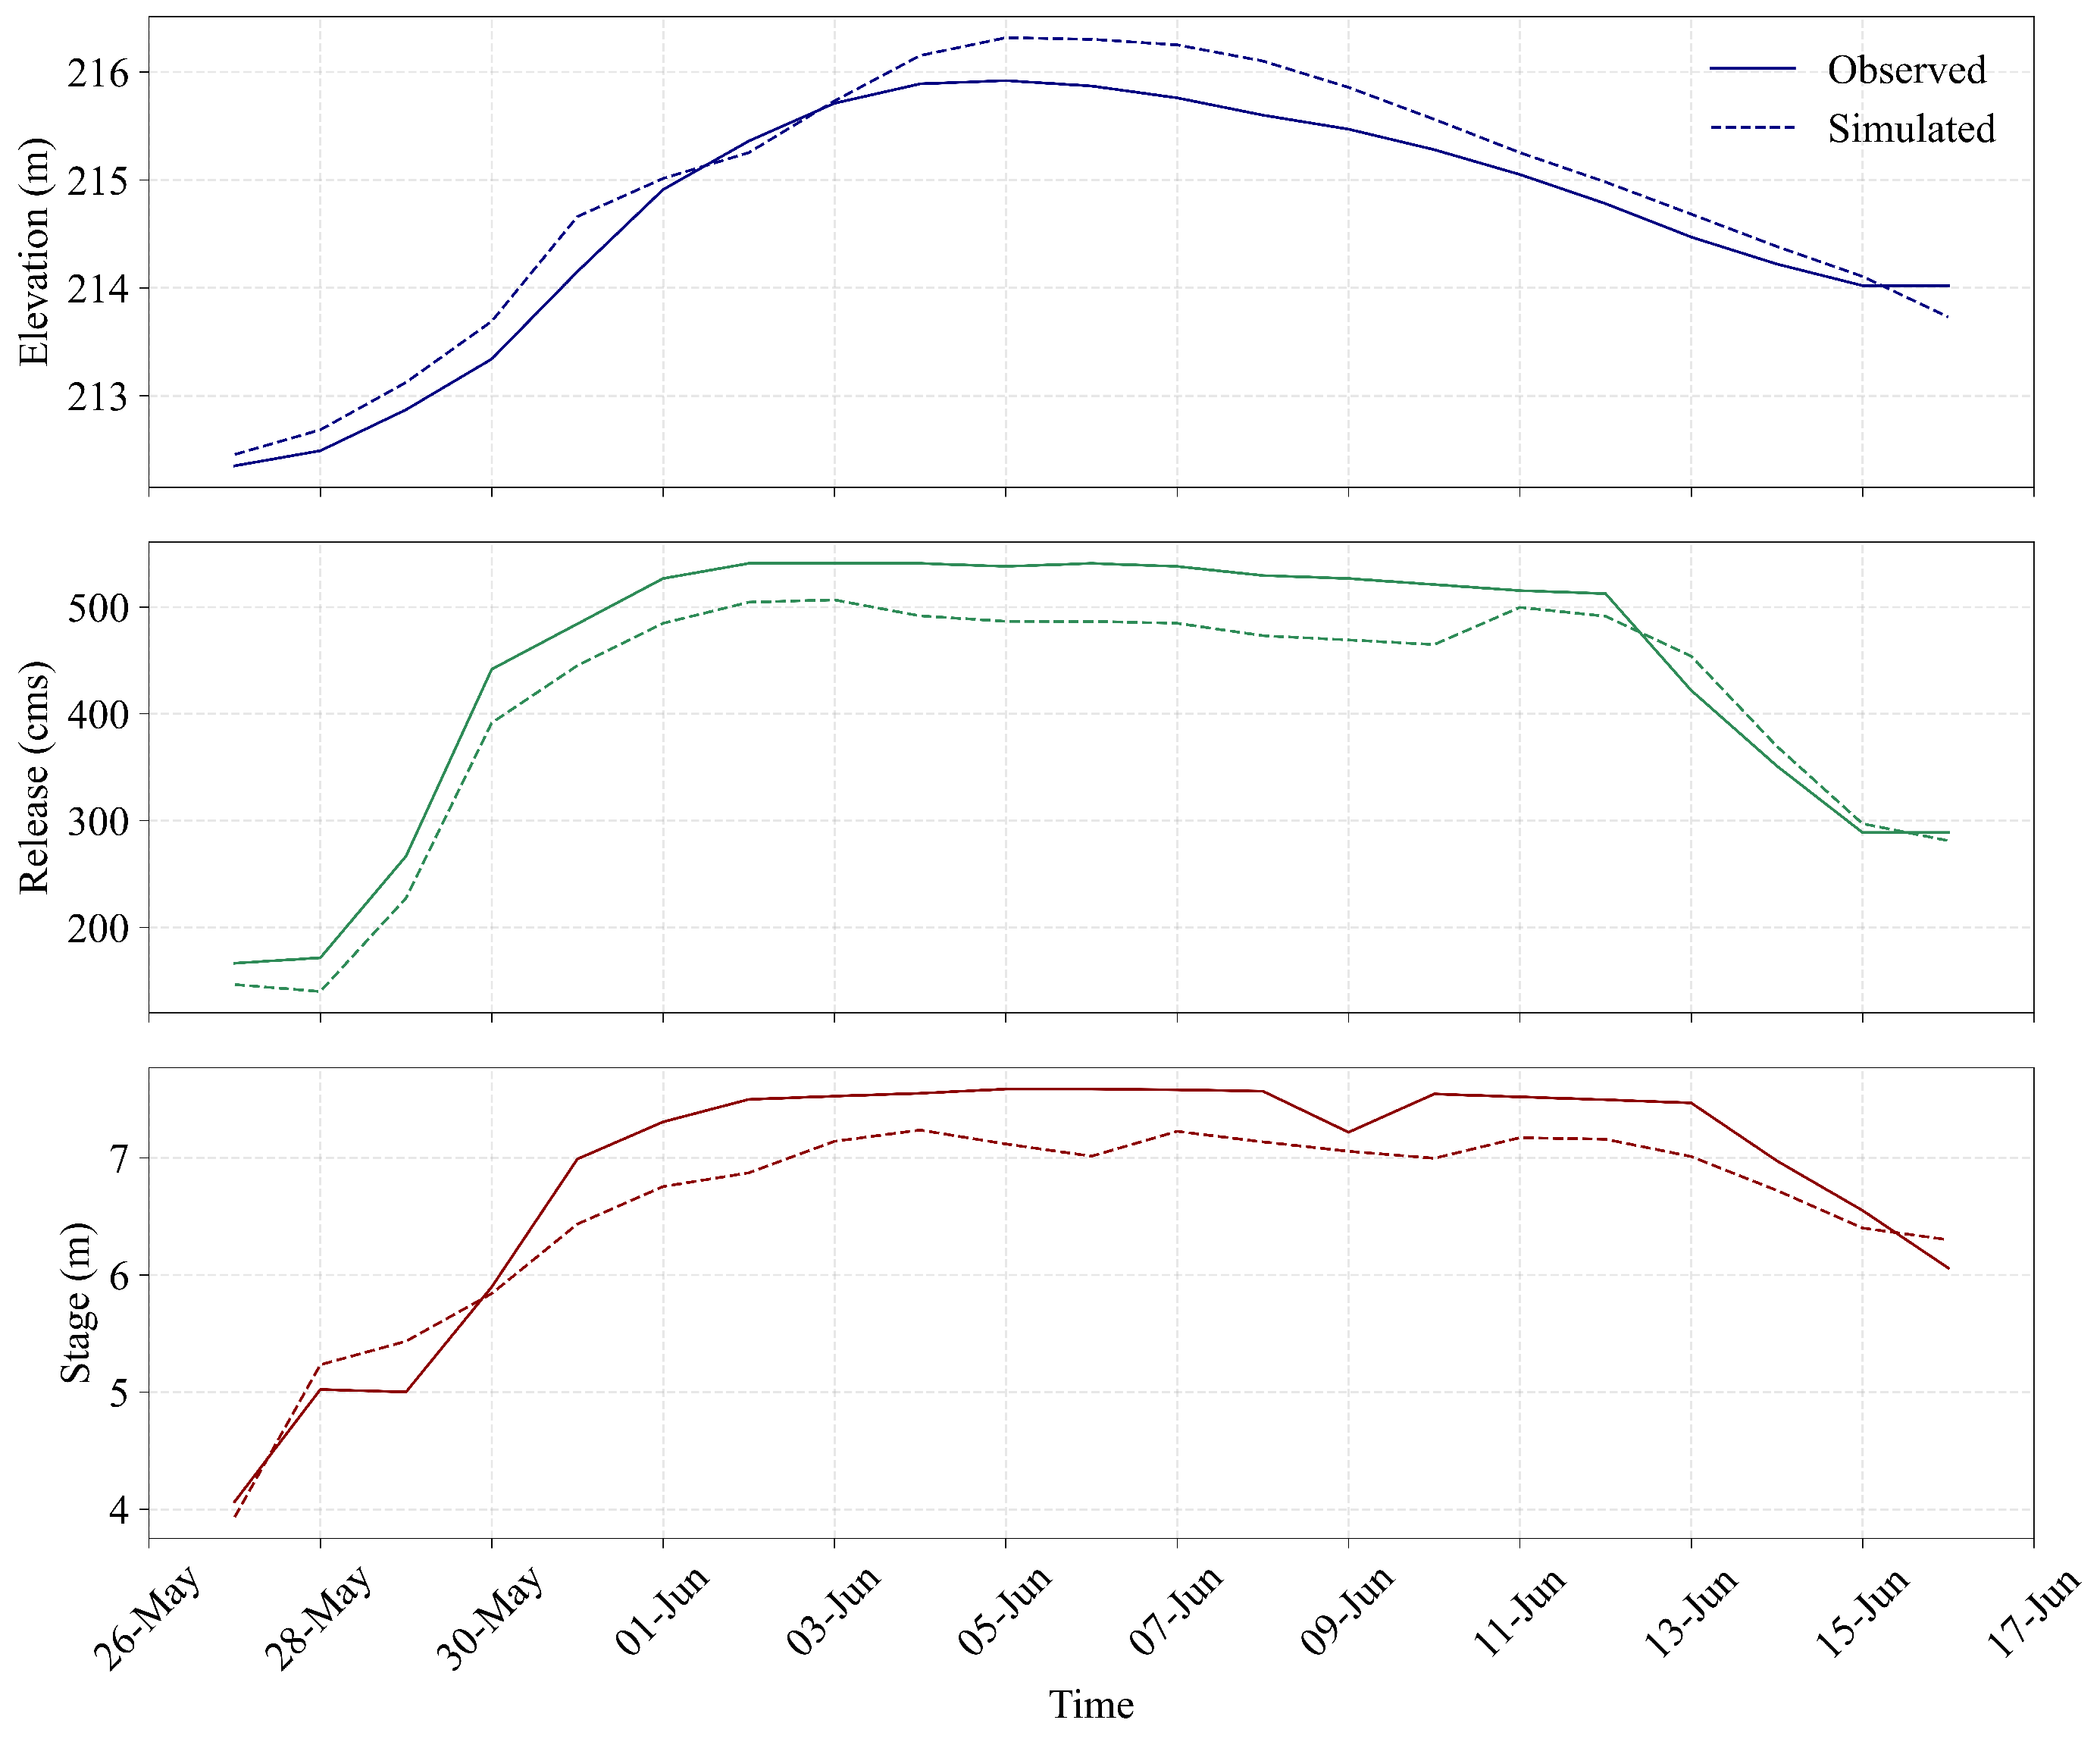
Figure 9 presents a comparison between observed and simulated results for these key variables. The model reproduces reservoir pool elevation (top plot) with high accuracy (coefficient of determination, R 2 = 0.931 , and root mean square error, RMSE = 0.199 m) and captures both the timing and magnitude of releases (middle plot) ( R 2 = 0.915 , RMSE = 59.373 cms). Furthermore, the downstream stage time series at the Iowa City USGS station (bottom plot) shows good agreement in peak timing and recession trends ( R 2 = 0.891 , RMSE = 0.241 m), with slight deviations in peak stage height attributed to localized hydraulic complexities and mesh resolution constraints.
To assess generalizability, we validated the calibrated model on the hydrologically distinct 2013 event. Keeping all calibrated hydraulic parameters fixed, the model was driven by 2013 inflows (Figure 10) and compared against daily observations from the USACE RiverGages [60]. As shown in Figure 11, the simulation reproduced the reservoir pool-elevation trajectory (top plot) with high fidelity ( R 2 = 0.913 , RMSE = 0.301 m) and captured the release dynamics (middle plot) well ( R 2 = 0.889 , RMSE = 40.181 cms). In addition, the downstream stage at the Iowa City USGS gauge (bottom plot) exhibits good agreement in peak timing and recession ( R 2 = 0.854 , RMSE = 0.395 m).
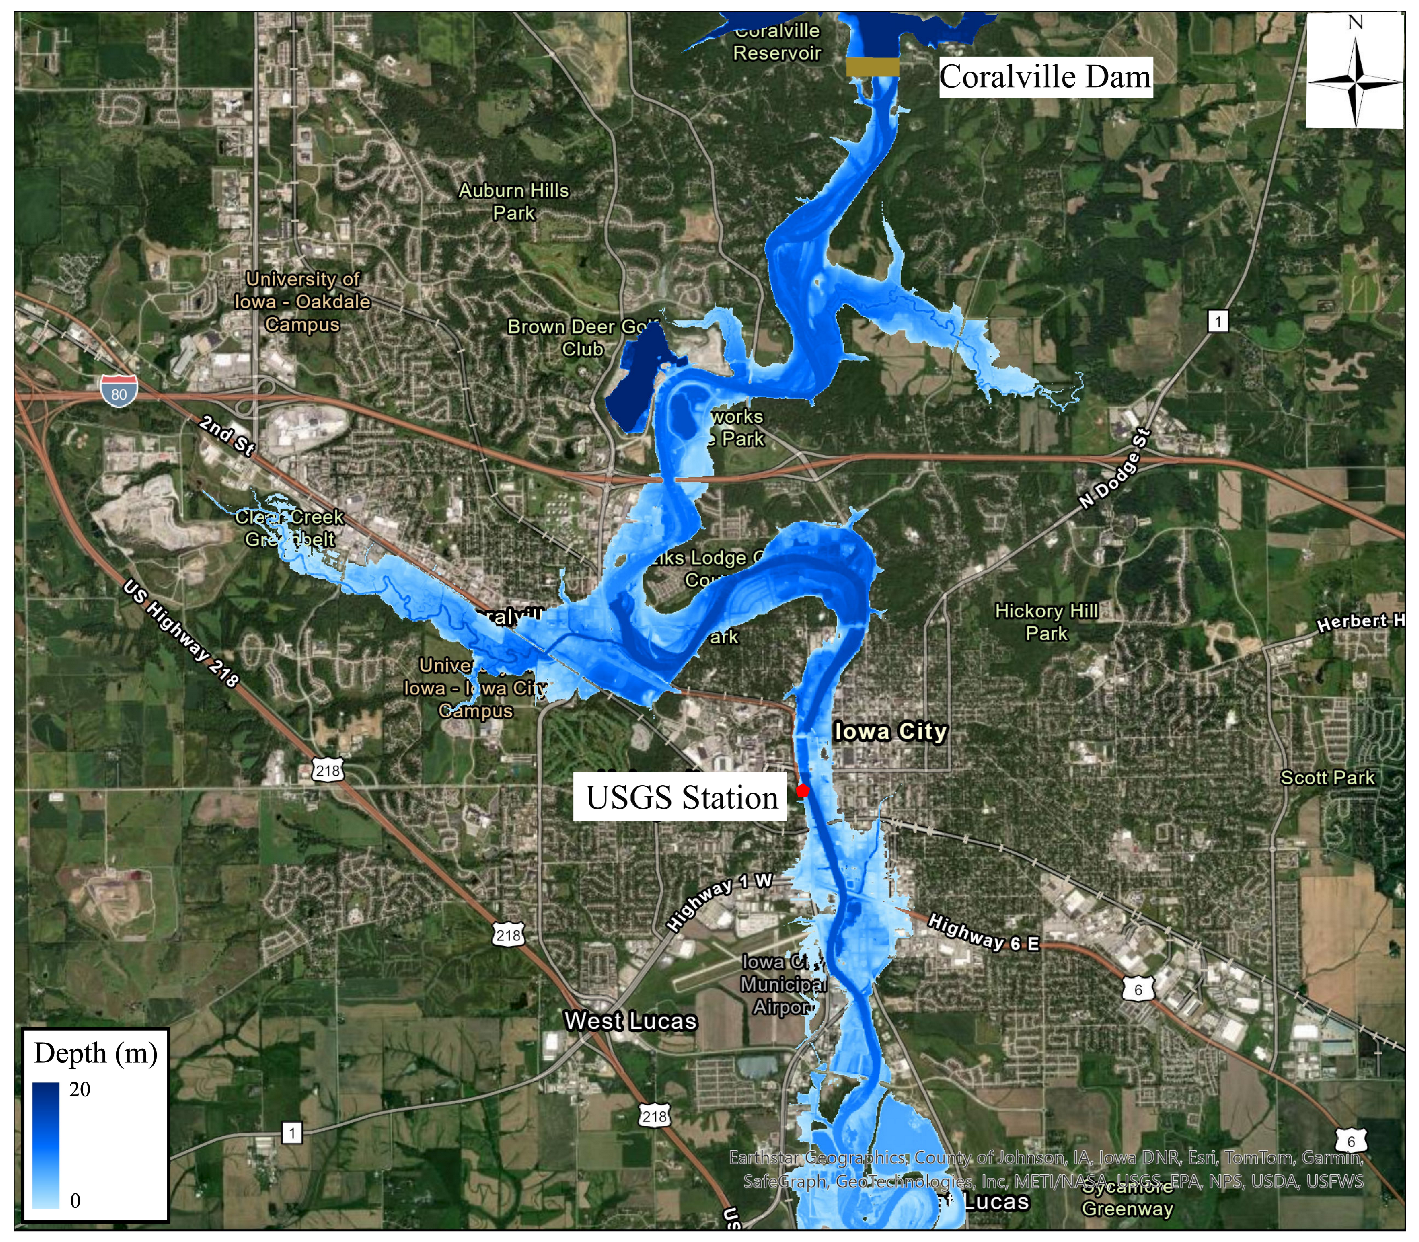
This approach ensures that the model reliably represents both the reservoir’s operational behavior and downstream river stage dynamics, providing a robust foundation for subsequent inundation mapping and impact assessments. Following calibration, the model was used to delineate inundation extents throughout the downstream floodplain. Figure 12 illustrates the spatial extent of inundation downstream of the Coralville Reservoir during the 2008 flood event, corresponding to the simulated peak inundation on 15 June 2008, which aligns with the period of maximum downstream flood depth and estimated damage. The figure highlights critical urban and residential areas in Iowa City that experienced significant flood depths, with inundation zones clearly aligned along the Iowa River corridor.
These inundation extents were subsequently utilized in the Hydrologic Engineering Center’s Flood Impact Analysis (HEC-FIA) tool to estimate flood-induced economic damages, yielding a maximum estimated loss of USD 644.4 million. HEC-FIA computes structure-specific damages by overlaying inundation depth grids onto detailed building inventories and applying depth-damage functions that consider structure type and occupancy class. The damage-estimation process accounted for both structural losses and content damages across the impacted floodplain, providing a comprehensive assessment of flood impacts at each time step. This inundation-to-damage workflow established a crucial linkage between hydraulic simulation outputs and quantitative impact assessments, forming the foundation for developing and training data-driven damage-prediction models in the subsequent subsections.

3.3. Hydraulic Simulations and Damage Estimation

To develop and train a data-driven model capable of predicting flood-induced damage, we generated a synthetic dataset by systematically simulating a range of reservoir gate operation strategies under a fixed historical inflow scenario. The inflow to the Coralville Reservoir was defined using observed streamflow data from the USGS gauge at Marengo, Iowa, covering the 2008 flood event from June 8 to 28 (Figure 7).
A total of 66 distinct gate operation strategies were created using a Greedy Sampling approach [61,62]. These sequences represent a diverse set of plausible operational strategies, with gate openings ranging from 0 to 7 feet and smoothed to reflect physically feasible transitions. Each of these gate operation policies was paired with the same fixed inflow series and used to drive hydraulic simulations in HEC-RAS, a 2D unsteady flow model. These simulations captured reservoir outflows, storage dynamics, and downstream water surface elevations over time.
For each HEC-RAS simulation, the resulting hydrodynamic outputs, particularly inundation depth and extent, were post-processed and exported in HDF format. These spatially distributed flood conditions were then imported into HEC-FIA, which estimates economic damages using structure-specific depth-damage functions and a comprehensive building inventory for the floodplain downstream of the Coralville Dam. HEC-FIA computed structural and content-related damage at each time step, yielding a time series of total economic damage for each operational scenario.
From these simulations, we extracted four key time series for each gate operation policy: reservoir storage, release, gate-opening position, and total downstream damage. These time series formed the basis of the dataset used to train a predictive damage model. To enable sequence-based learning, the data were segmented into overlapping input–output windows of fixed length. Each input sequence consisted of the past 12 hourly time steps containing three features, including storage, release, and gate opening, normalized to zero mean and unit variance. The choice of a 12-h history length was based on testing multiple input lengths and determining that 12 h yielded the best predictive performance while aligning with the decision cycle for reservoir operation in this study. At the start of the simulation, no targets were generated for the first 12 h; the first prediction target was assigned to index 12, with indices 0–11 excluded from target generation. The target variable corresponded to the total flood damage at the subsequent time step. This framing allows the model to learn temporal dependencies between operational decisions and their delayed impact on downstream damages.
In total, the final dataset contained over 30,888 data samples, representing a wide range of reservoir behaviors and downstream flood responses. Once the simulations were complete, we compiled the reservoir storage, gate-opening values, release rates, and corresponding downstream damages into a unified dataset. This dataset served as the foundation for training the Transformer-based damage-prediction model described in the following section.

4. Data-Driven Flood Damage Prediction

Following the compilation of the unified dataset described in the previous section, it served as the basis for training a Transformer-based regression model. This model was designed to predict total flood damage at each time step from the reservoir’s operational state. The resulting model serves as a fast and reliable proxy for evaluating the downstream consequences of different gate operations without rerunning hydraulic simulations.
The Transformer model developed for downstream flood damage prediction is designed to capture temporal dependencies between reservoir operations and their resulting impact. The model accepts input sequences consisting of three features, including release, storage, and gate openings, each normalized and arranged into sequences of 12 hourly time steps. These sequences represent short-term operational histories and serve as the input to the model. At the first stage of the network, a linear layer embeds each time step’s input vector into a higher-dimensional representation. This embedded sequence is then enriched with positional encoding using a sinusoidal function to preserve temporal ordering and enhance the model’s understanding of sequence structure.
Following the embedding and positional encoding, the model employs a stack of Transformer encoder layers. Each encoder layer includes multihead self-attention mechanisms and feedforward subnetworks, enabling the model to weigh the relative importance of each time step in the context of the entire input sequence. Two encoder layers with four attention heads and a feedforward hidden size of 32 using ReLU activations were used, with global average pooling applied to the encoded output to summarize temporal dynamics across the sequence. Finally, a fully connected layer with 16 input units projects the aggregated representation onto a single output neuron, yielding the predicted total flood damage in USD for the subsequent time step. The dataset was first split sequentially without shuffling into 80% for model development and 20% as a held-out test set. The development set was further divided into 80% for training and 20% for validation. The model is trained using mean squared error (MSE) loss and optimized with the Adam optimizer. Early stopping based on validation loss ensures generalization and prevents overfitting. The final model demonstrated strong predictive performance on unseen test data, providing reliable forecasts of flood-related structural damages.
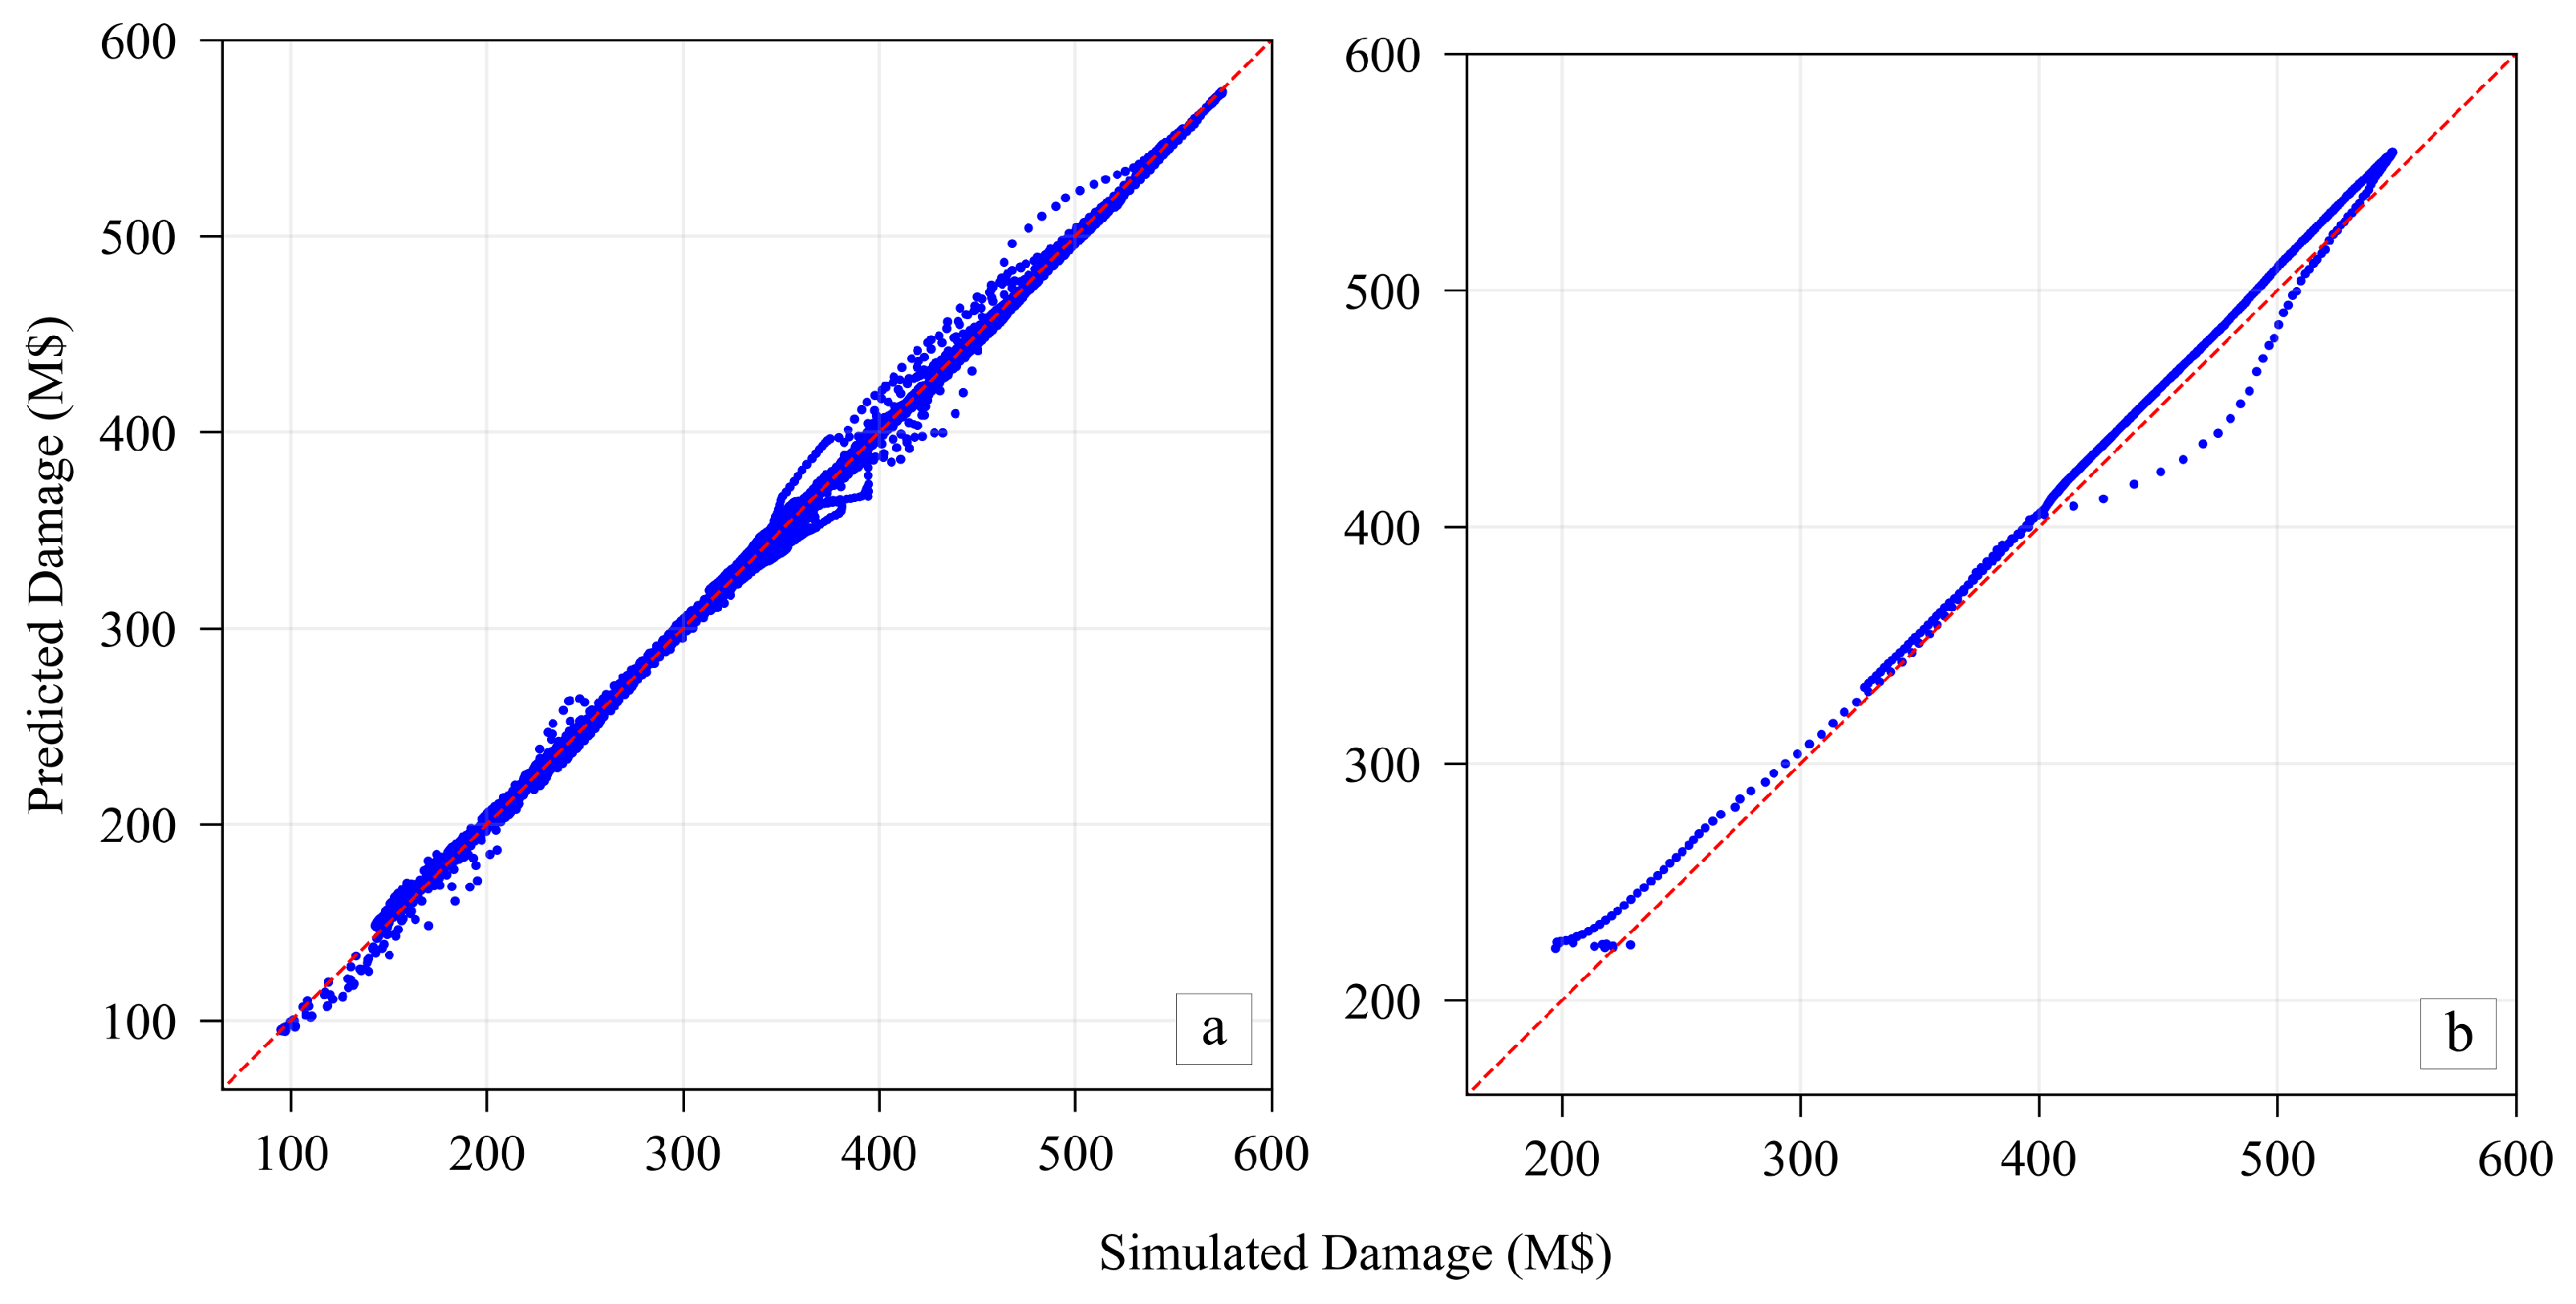
Figure 13a presents a scatter plot of predicted versus simulated flood damage values from the test dataset, evaluated at hourly intervals. The points exhibit a close alignment with the 1:1 reference line (red dashed), indicating a high degree of correspondence across the full range of damage magnitudes. R 2 = 0.98 underscores the model’s capacity to accurately replicate the magnitude and distribution of flood-induced damages within the hold-out portion of the dataset.
We further validated the Transformer-based surrogate on the 2013 flood event. Applied without any event-specific tuning, it closely reproduces HEC-FIA damages (Figure 13b): points cluster along the 1:1 line, with R 2 = 0.97 . This event-level performance indicates strong generalizability to a hydrologically distinct flood and supports using the surrogate within the RL policy experiments.

5. Policy Optimization

Reservoir operation has traditionally relied upon rule curves, expert-designed heuristics, or optimization techniques such as dynamic programming [15,16,17]. While these approaches have been widely used, they often struggle to address the challenges posed by high-dimensional inflow patterns and nonstationary hydroclimatic conditions. In this context, learning-based reservoir-operation methods have emerged as a promising alternative, leveraging data-driven frameworks to derive adaptive, near-optimal operation strategies or policies directly through interaction with simulated or historical data.

5.1. Flood Mitigation as an RL Problem

A learning-based reservoir-operation framework was developed using DQN to optimize reservoir gate operations under extreme flood events. The primary objective was to identify gate operation policies (i.e., strategies) that minimize downstream flood damages while ensuring smooth, feasible reservoir management consistent with safety constraints.
This study formulates the reservoir-operation problem as a POMDP, with the RL agent interacting with a simulated environment that represents the hydrologic, hydraulic, and damage-response dynamics of the Coralville Reservoir system. This echoes real-world scenarios in which reservoir operators cannot fully observe the true state of the system, which includes uncertain future inflows, downstream hydraulic responses, and spatially distributed flood damage potential. Instead, the agent relies on a sequence of historical observations to approximate the system’s latent state. This approach captures partial knowledge of the environment while acknowledging that critical variables, including future inflow peaks and detailed downstream responses, remain unknown at the time of decision-making. The environment was custom-built using the Gymnasium library to enable flexible state and action definitions as well as to incorporate downstream damage feedback in the reward function.
By representing the agent’s inputs as a finite sequence of past observations, the POMDP framework enables the RL agent to infer temporal patterns and dependencies that may be relevant to predicting flood risk and downstream impacts. This sequential observation window is processed through a Transformer-based encoder within the Deep Q-Network architecture, which efficiently models the temporal relationships and extracts higher-level features to support policy learning.
In this study, the state space is partially represented by reservoir storage, release, and elapsed time, providing the agent with a concise yet sufficient representation of the system’s dynamics to support tractable policy learning. Additionally, the action space is discretized into five levels corresponding to gate openings from 0 (fully closed) to 7 m (fully open), allowing the agent to explore a practical range of feasible operational strategies. In this setup, actions are applied at fixed 12-h intervals ( L = 12 ), during which the selected gate setting is held constant before the next decision is made.
Within the DQN framework adopted in this study, each observation vector, consisting of reservoir release, storage, and elapsed time, is linearly embedded into a 16-dimensional latent space. A sinusoidal positional encoding, defined over a history length of 12 time steps, is added to preserve temporal order. The resulting sequence is then processed by two stacked Transformer encoder layers, each employing multihead self-attention with four attention heads and a feedforward network of 32 hidden units with ReLU activation. These encoder layers enable the model to assign variable attention to relevant time steps, thereby capturing temporal dependencies across the observation window. From the encoded sequence, the final time-step representation is extracted to summarize the most recent system state in its historical context. This latent representation is then passed through a fully connected output layer that produces | A | Q-values, corresponding to the discrete set of gate-opening actions available to the agent. Through this design, the DQN agent leverages historical information to anticipate the consequences of alternative gate operations.
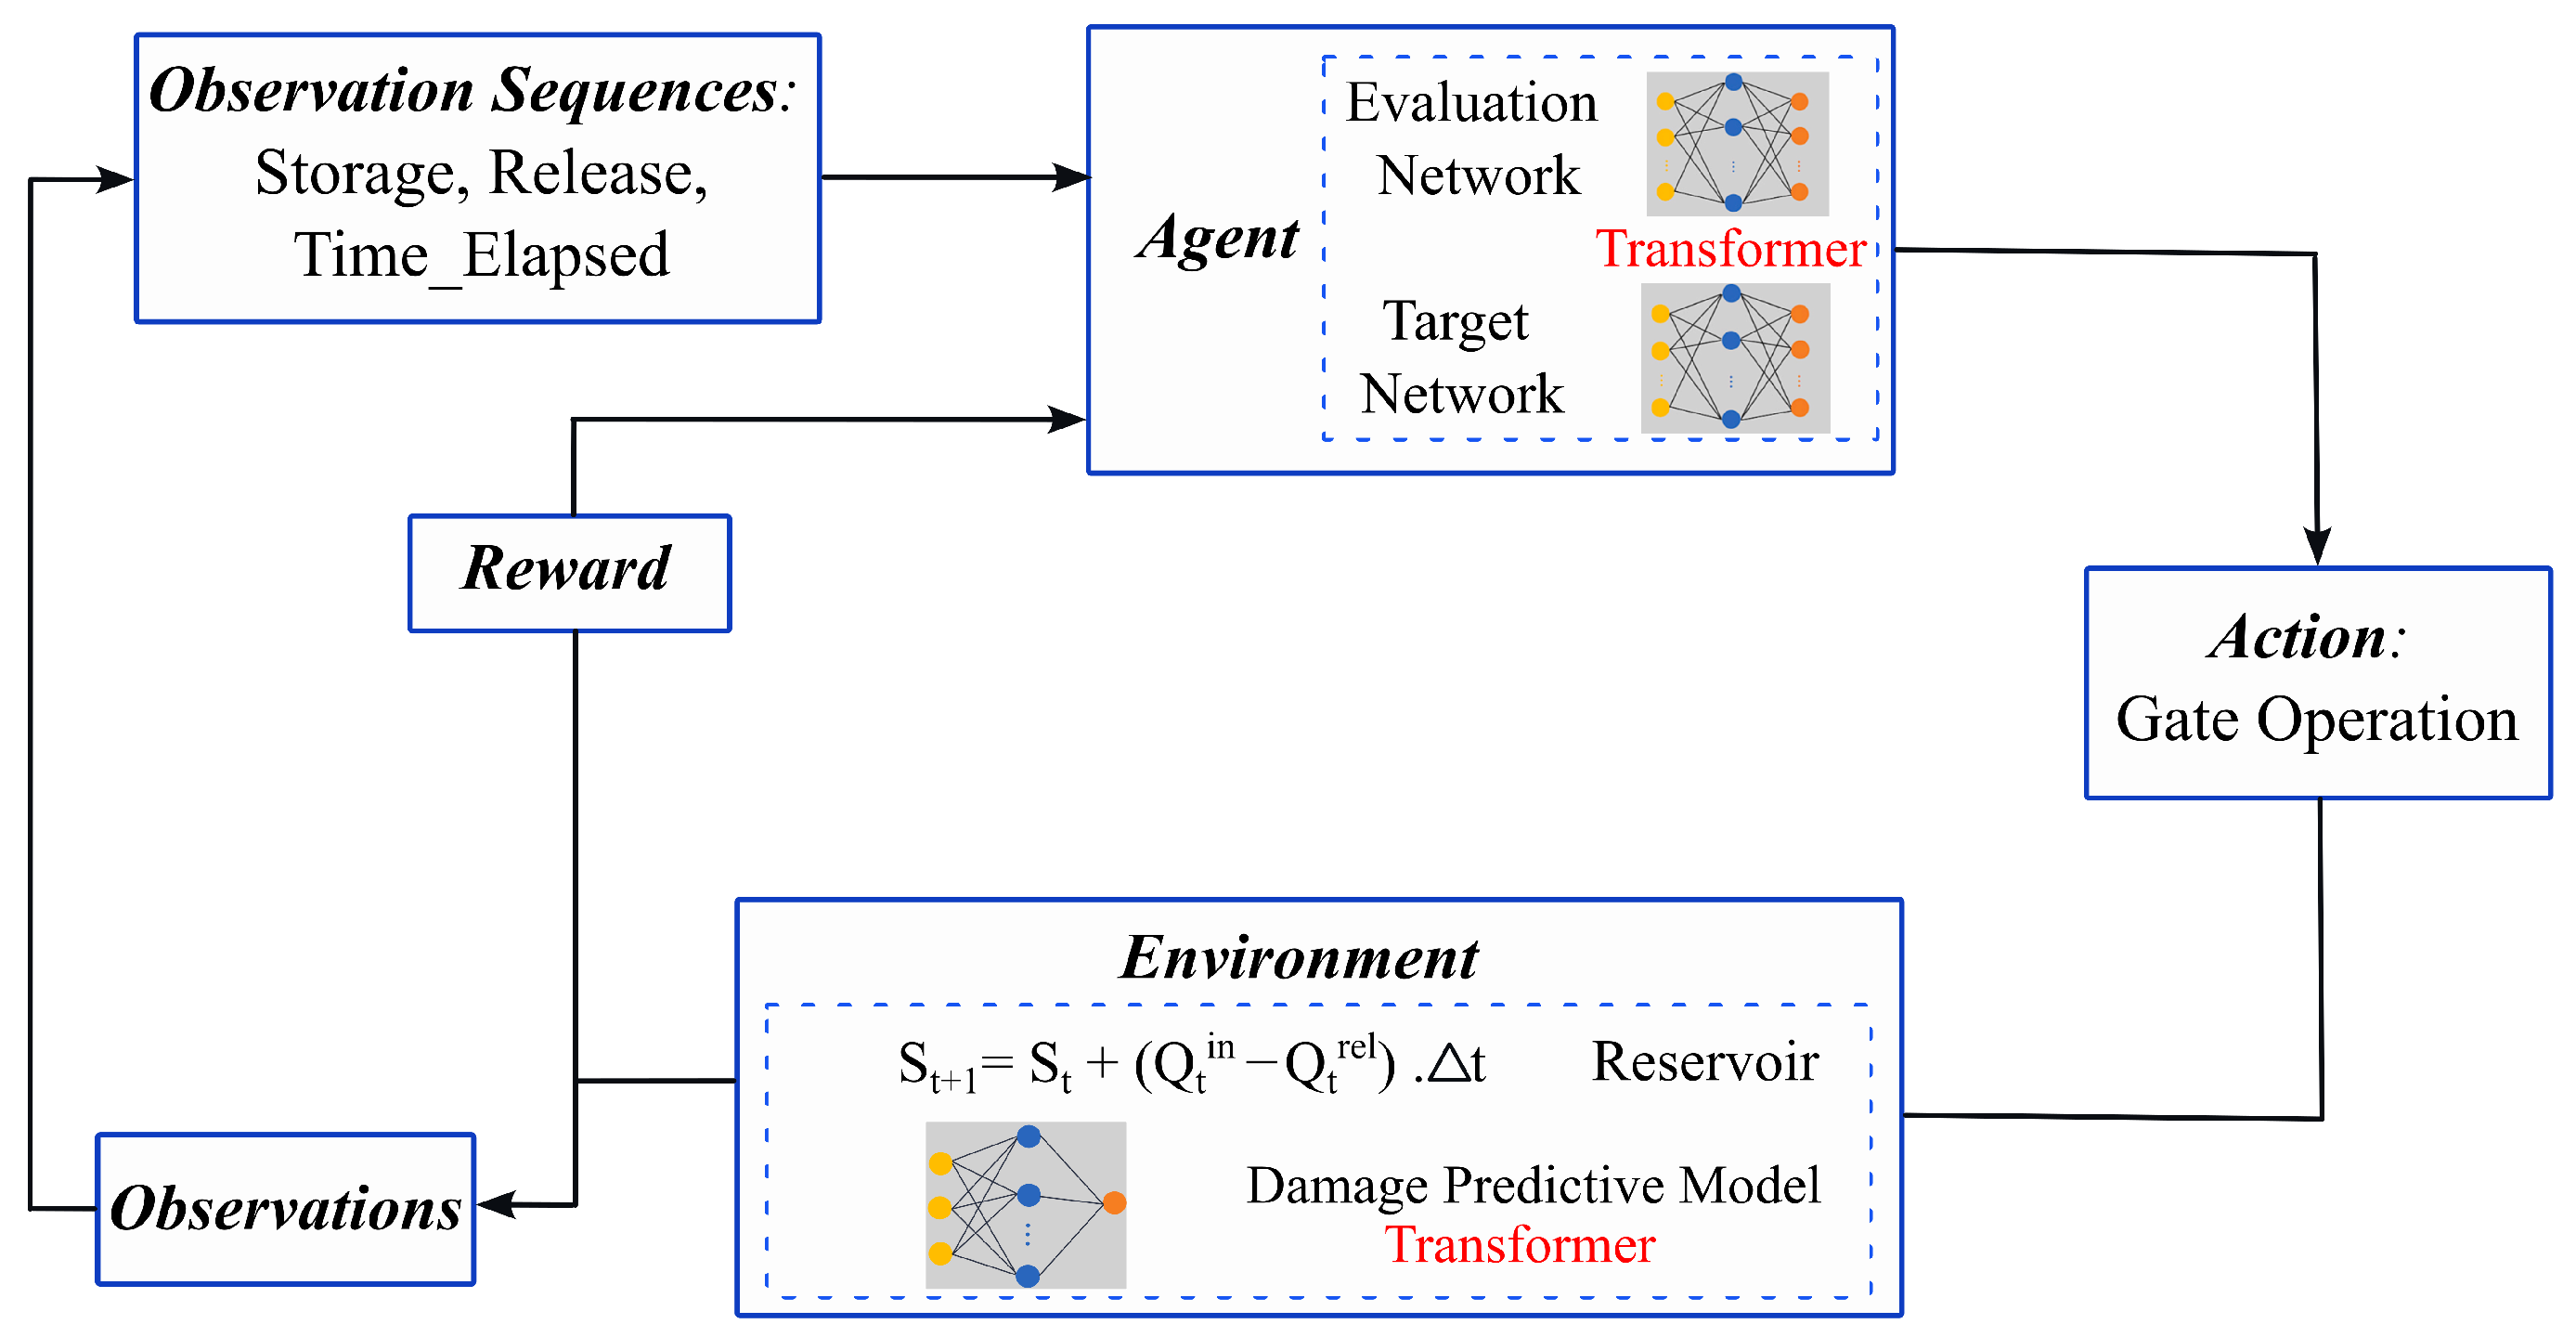
During the learning process, the reservoir system’s state evolves dynamically at each simulation time step t according to the governing equations (Equations (11)–(13)). The agent, however, interacts with this system by making decisions only at discrete decision steps τ . The relationship between the simulation steps and decision steps is defined by t = L τ , where L = 12 is the duration of the interval between adjacent decisions, t [ 0 , 480 ] , and τ [ 0 , 40 ] . The formulated RL problem for flood mitigation is depicted in the Figure 14.
At each decision step τ , the agent receives an observation sequence o τ , which encapsulates a rolling history of the reservoir’s storage, releases, and elapsed time. Based on this sequence, the agent selects an action a τ A to adjust the gate operations. This action is applied immediately and then held constant until the next decision point. During the intervening simulation steps, the environment evolves at an hourly resolution according to the governing physical equations. These state updates collectively determine the subsequent observation sequence, o τ + 1 . Upon reaching the next decision step, the agent receives this new observation along with a scalar reward r τ , thereby completing a single cycle of the learning process.
The reward function we used in this study is carefully designed to balance flood damage mitigation, operational smoothness, and proactive flood release. At each decision step τ , the reward r τ is composed of four key terms:
r τ = α D τ 2 β max D τ D τ 1 , 0 λ G τ G τ 1 + δ max I τ I 75 , 0 1 { G τ > 0 } ,
where
  • D τ is the predicted downstream damage (M$) at the current decision step, obtained as the maximum of the hourly damage predictions within the current 12-h action interval,
  • D τ 1 is the damage at the previous decision step,
  • G τ and G τ 1 are the gate openings at the current and previous decision steps, respectively,
  • I τ is the mean inflow during the current decision step,
  • I 75 is the 75th percentile inflow threshold computed from the inflow series,
  • 1 { G τ > 0 } is an indicator function equal to 1 if the gate is opened during interval τ , and 0 otherwise,
  • α , β , λ , and δ are weighting coefficients reflecting the trade-offs among objectives.
In the implemented system, these coefficients were empirically set as:
α = 5 × 10 4 , β = 1 , λ = 15 , δ = 0.4
To maintain numerical stability and interpretability, the weighting coefficients were chosen so that all reward terms operated on comparable numerical scales, preventing any single component from dominating the optimization process. Damage-related terms ( α , β ) were emphasized to prioritize downstream impact reduction, the smoothness term ( λ ) limited abrupt gate adjustments to ensure operational feasibility, and the inflow term ( δ ) encouraged anticipatory releases during elevated inflow conditions.

5.2. Learning for Optimal Policy

Building on the Transformer-based DQN framework introduced in the previous section, this section details the training procedure adopted to derive the optimal reservoir-operation policy. Reinforcement learning with deep function approximators is prone to instability, particularly when the same network is used simultaneously for action evaluation and target value estimation. To mitigate this issue and ensure convergence, the training framework incorporated additional mechanisms to stabilize learning; a separate target network is maintained alongside the evaluation Q-network. This target network has the same Transformer-based architecture and parameter structure as the evaluation network but is updated less frequently to serve as a stable reference for temporal-difference learning. In practice, the target network parameters are synchronized with those of the evaluation network every 100 time steps. By decoupling the target from the evaluation network in this way, the framework reduces instability in Q-value estimates and prevents divergence during the training process, thereby improving the robustness of policy learning.
The DQN agent was trained over 10,000 episodes, each consisting of 40 decision steps, each corresponding to 12-h action intervals. The initial reservoir storage at the start of each episode was set to 66% of the maximum storage capacity of Coralville Reservoir, and the initial gate-opening position was fixed at about 5.8 m to represent an actual condition prior to flood operations.
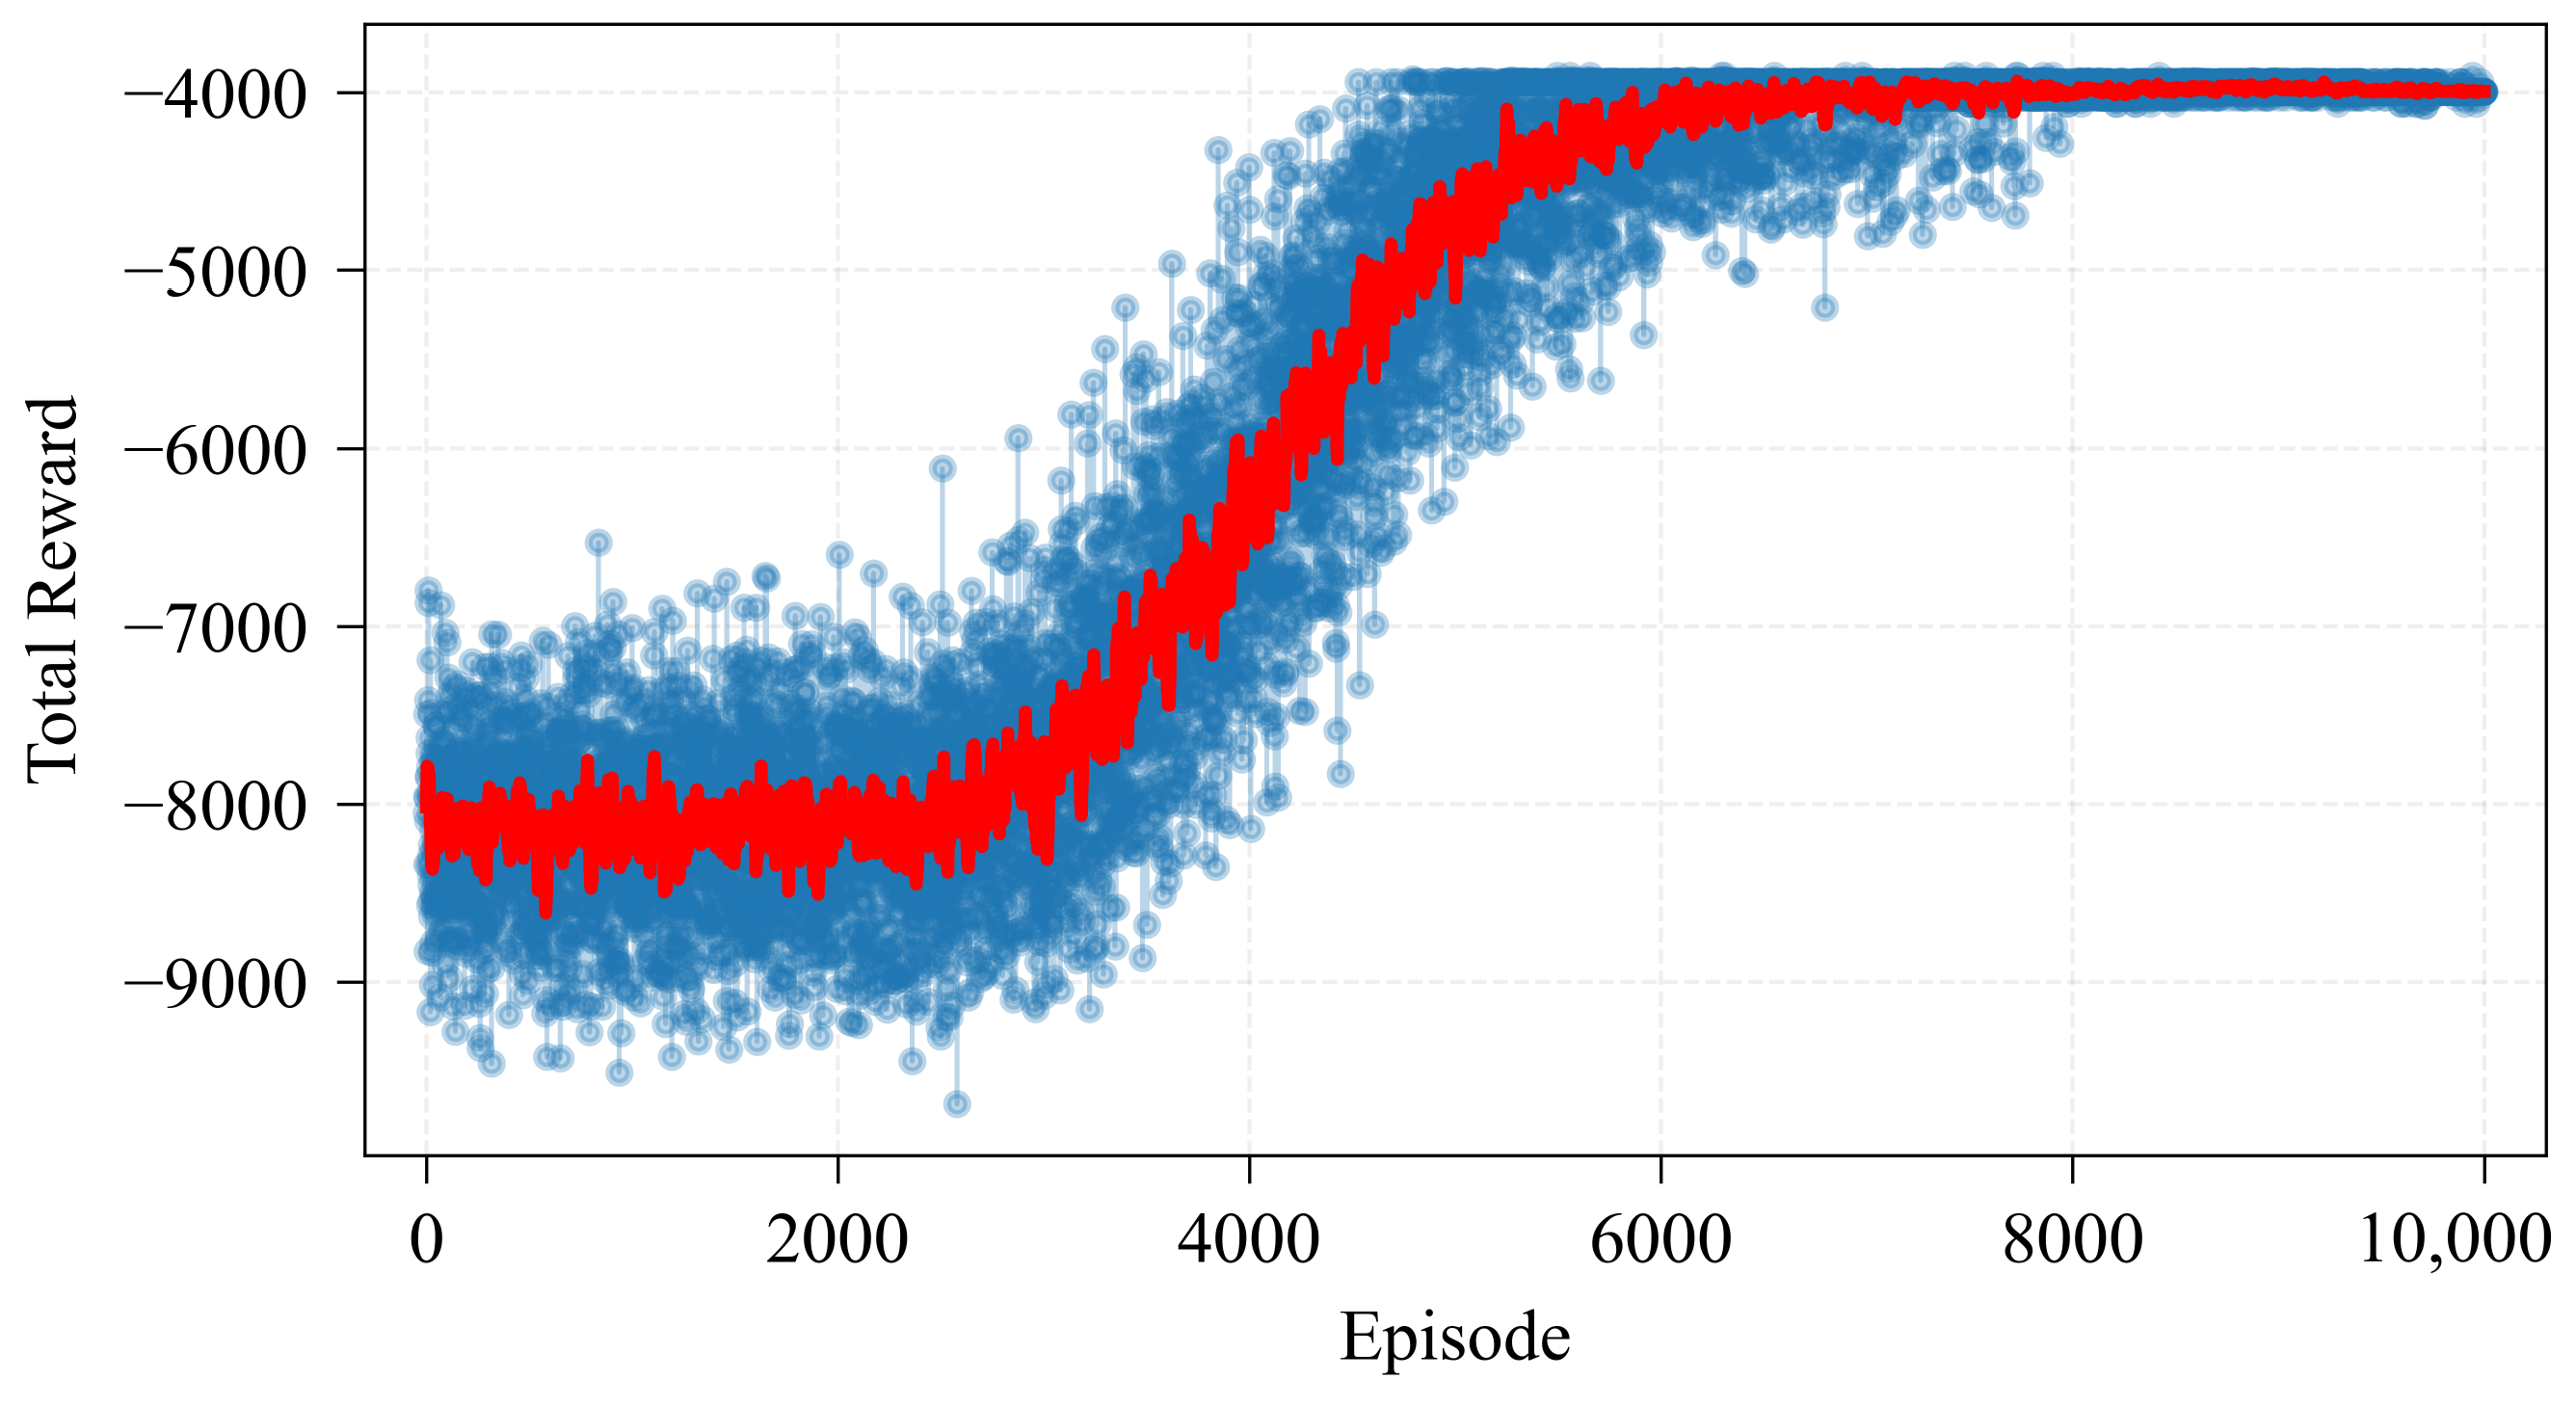
An experience replay buffer with a capacity of 72,000 transitions was employed to break temporal correlations in the training data and improve sample efficiency. Also, the ϵ -greedy exploration strategy was used to balance exploration and exploitation, with ϵ decaying exponentially from 1.0 to 0.0 over the course of training to promote early-stage exploration and a shift toward policy exploitation as training progresses. Figure 15 illustrates the evolution of ϵ throughout the training process. The Adam optimizer was employed with a learning rate of 2 × 10 3 , and a batch size of 128 was used during training.
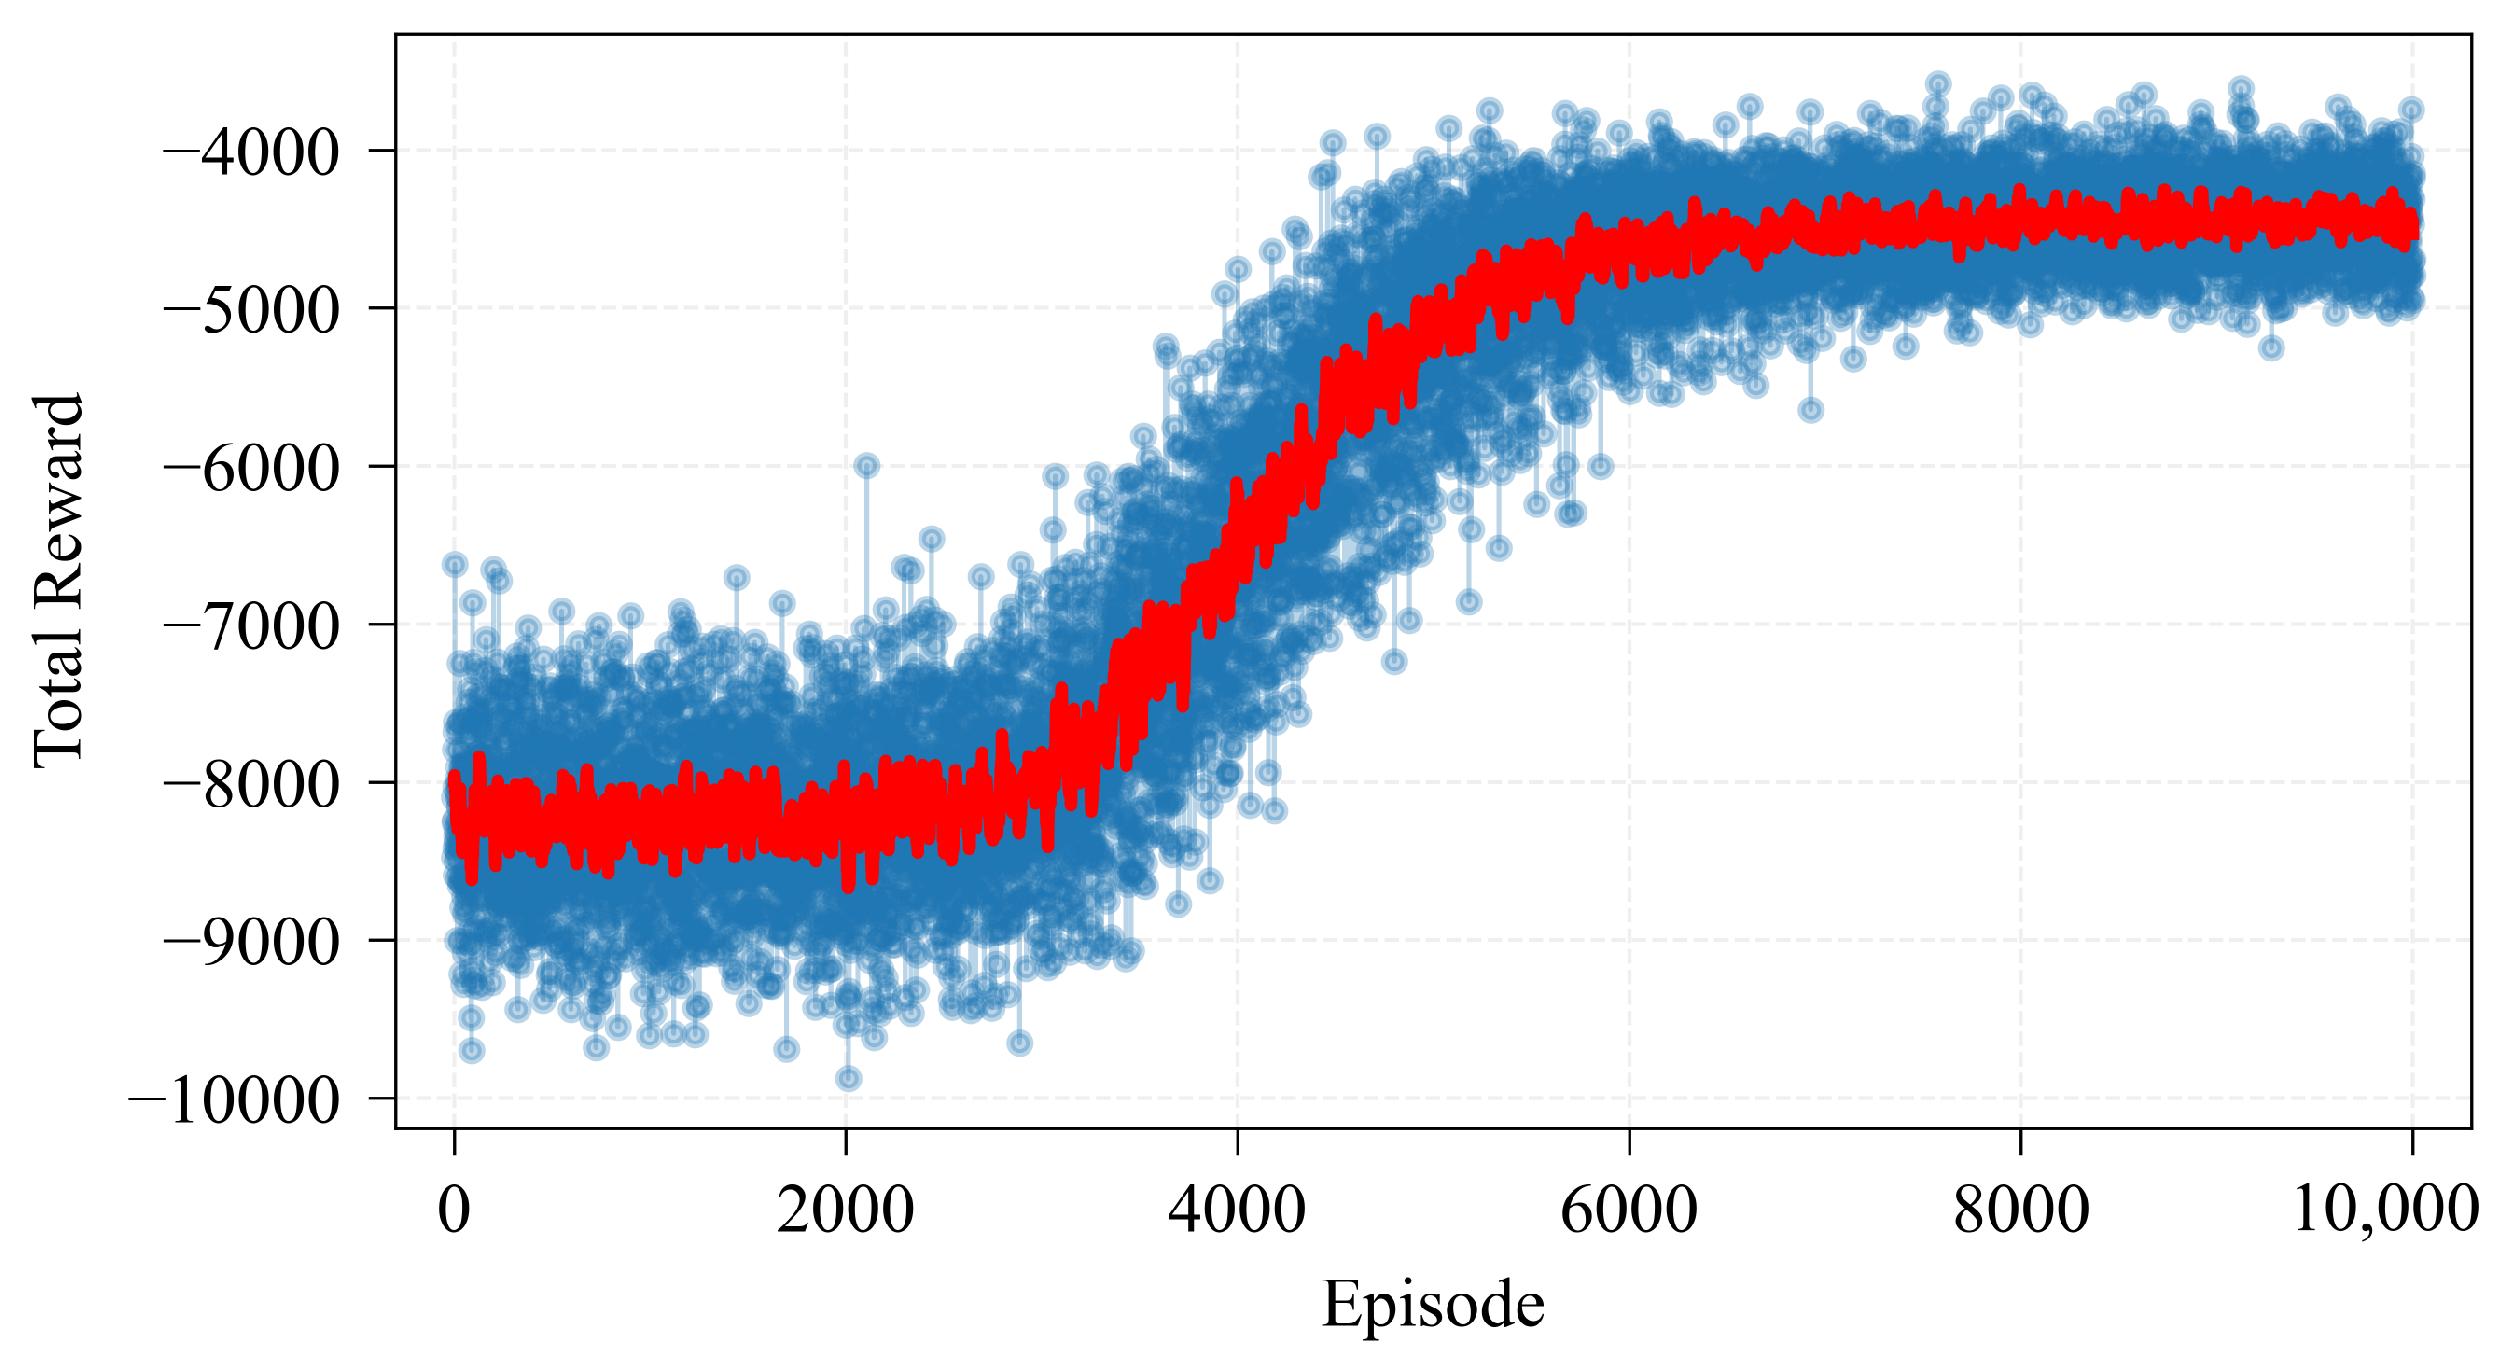
Under this configuration, the training reward trajectory demonstrated rapid initial improvement, converging after approximately 5000 episodes, as illustrated in Figure 16. This trend reflects the Transformer-enhanced DQN’s ability to iteratively refine its decision-making policy and stabilize cumulative rewards through training.

6. Policy Deployment and Evaluation

6.1. Policy Deployment

After deriving the optimal policy in the previous section, we implemented it within the process-based hydraulic model (HEC-RAS and then HEC-FIA) to simulate the 2008 Iowa flood event. For this deployment, we employed a purely greedy action selection ( ϵ = 0) based on the Q-values output by the trained evaluate Q-network. This application generated the corresponding reservoir gate operation sequence, as shown in Figure 17a. The sequence exhibits a clearly structured, monotonic behavior: the agent begins with a maximum gate opening of approximately 5.25 m, then progressively decreases the opening in discrete steps during the rising limb of the flood event. After about 100 h, the gate is fully closed and remains so for the duration of the event.
This strategy reflects a strong early-release mechanism (proactive mitigation strategy), wherein the agent rapidly creates upstream storage capacity prior to the arrival of peak inflows. The subsequent closure conserves remaining reservoir volume and mitigates downstream impact during the recession limb. Notably, the induced operation sequence demonstrates consistent and smooth transitions between actions, avoiding erratic changes and maintaining operational feasibility. This temporal structure suggests that the agent has internalized an anticipatory control logic through sequential decision-making, even under conditions of partial observability and uncertain inflow trends. Hydrologically, this learned control behavior reflects the reservoir’s inherent storage–release dynamics and flood-routing response: by initiating releases before the inflow peak, the agent effectively lowers the pool elevation and creates additional storage capacity, thereby attenuating the downstream hydrograph through both storage buffering and travel-time delay.
The downstream flood damage evolution associated with the DQN policy is illustrated in Figure 17b. It undergoes a swift initial increase, followed by a more pronounced surge between 80 and 150 h, ultimately reaching its peak damage of nearly $576 million around 175 h (or over about 7 days) into the event, after which the damage steadily recedes by the end of the event. The damage peak lags the final gate closure at t 100 h in Figure 17a, which is consistent with downstream routing delays.

6.2. Policy Evaluation

To evaluate the performance of the learned policy, we compared the downstream damages resulting from the 2008 Iowa flood under this policy to damages from two benchmark scenarios: the historically observed gate operations in Figure 8 (expert policy) and a scenario with gates permanently closed (zero-open policy). The contrasting impact of these benchmark policies, including the optimal policy learned from the previous section, is shown in Figure 18, which plots the evolution of total economic damage (structural + contents). It is critical to note that the difference between these damage curves is attributable solely to gate operations, as the underlying inflow, hydraulic, and damage-estimation models are identical for both simulations.
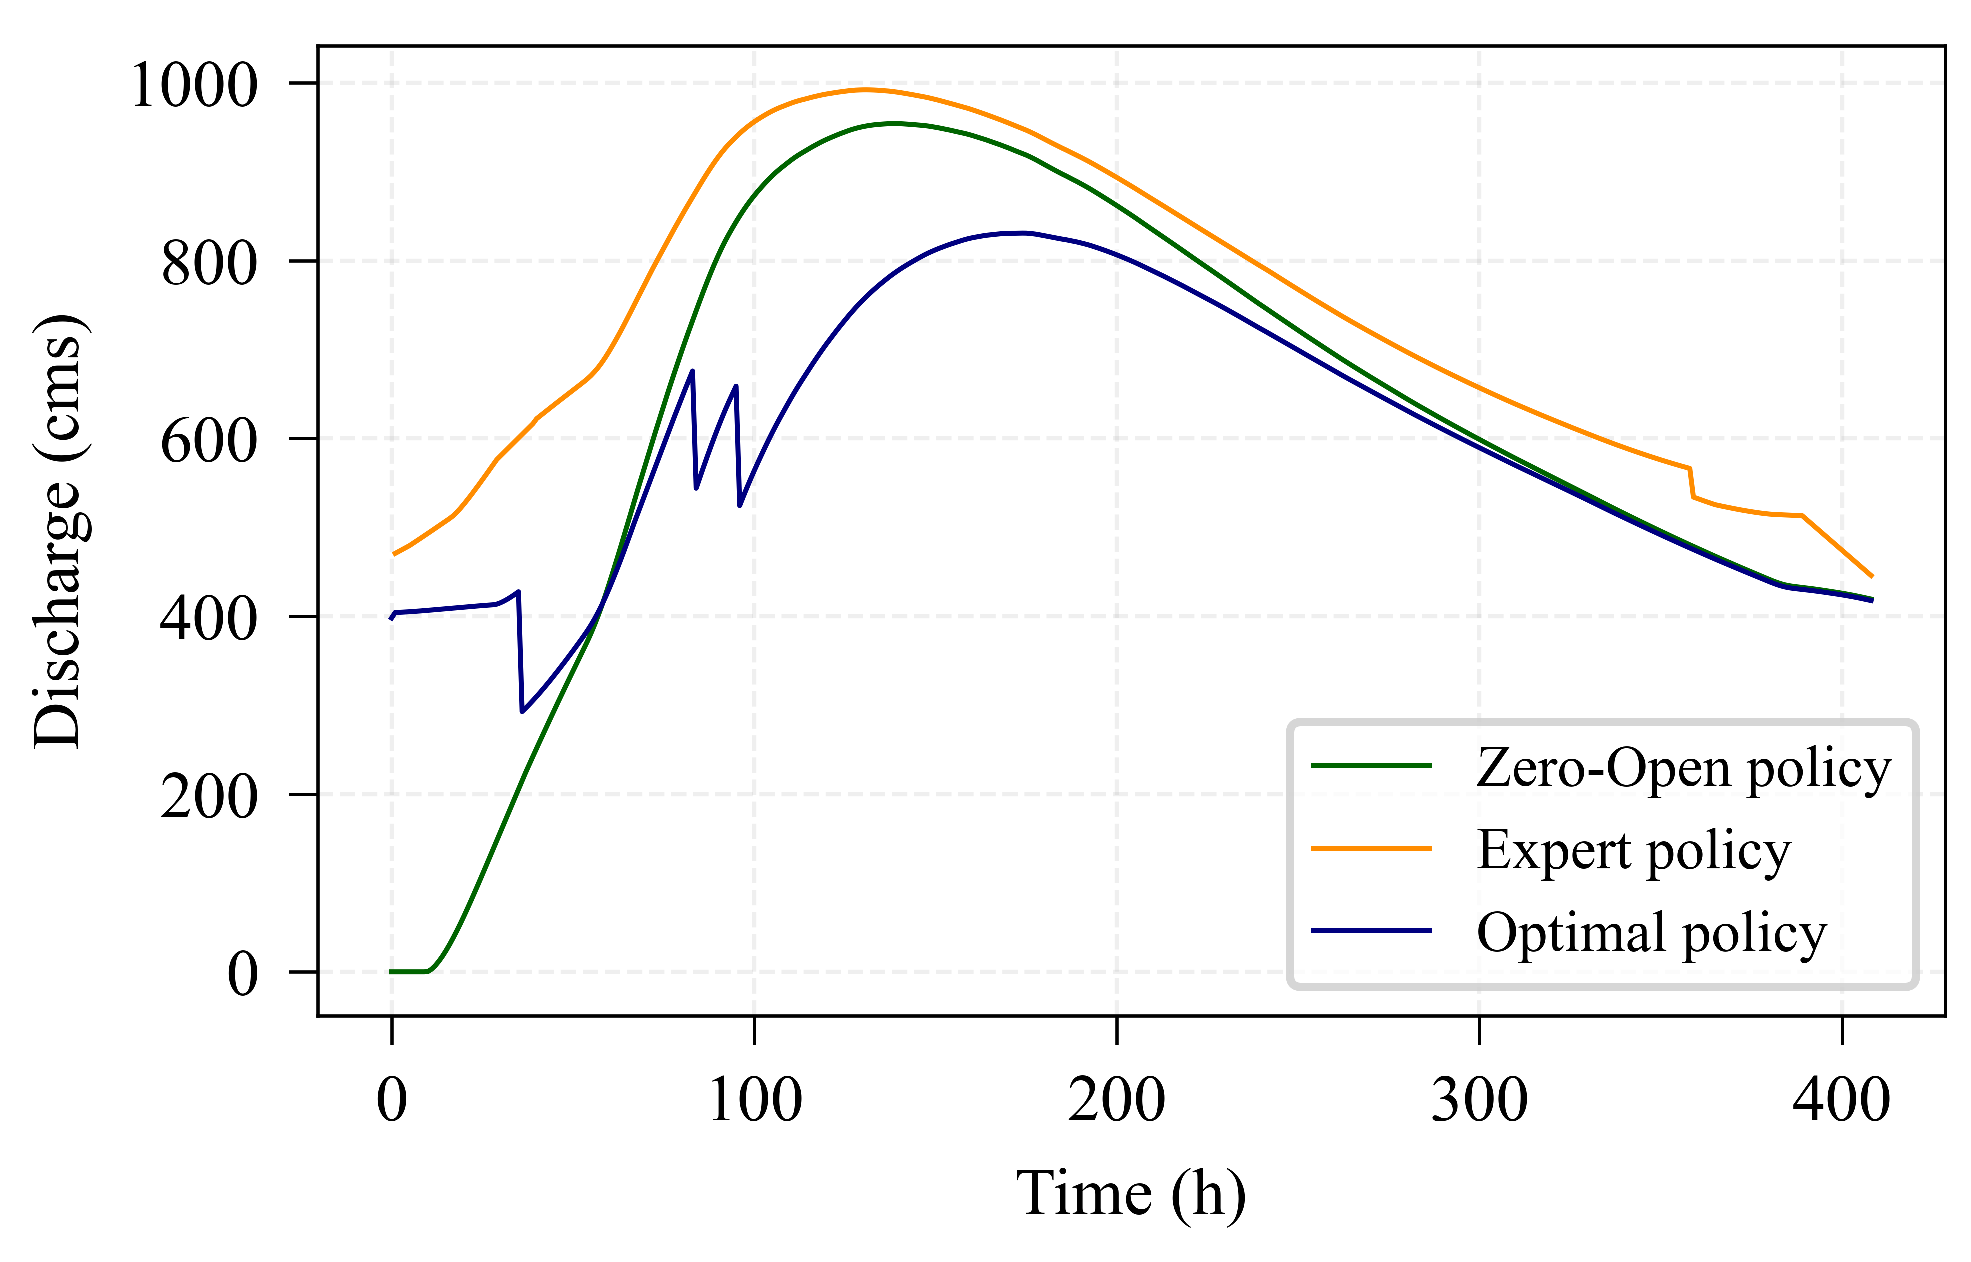
Figure 18 demonstrates that while the zero-open policy (fully closed gates) successfully maintains the flood at a minor level for the first 38 h, the flood subsequently escalates rapidly, reaching a peak damage level comparable to that of the expert policy. In contrast, the optimal policy not only achieves a significantly lower peak damage than both benchmark policies but also delays the occurrence of that peak.
To elucidate the control mechanisms behind these outcomes, we compare the discharge patterns of the three policies in Figure 19. The expert policy initiates gate openings early and sustains high releases, resulting in a hydrograph with a slightly earlier and higher peak outflow than the zero-open policy, and a markedly higher one than the optimal policy. The zero-open policy delays discharge until the reservoir overtops the spillway, thereby postponing the onset of significant downstream flooding. This delay is achieved by leveraging increased storage capacity and raising the reservoir elevation and hydraulic head. Both the expert and optimal policies, conversely, transmit inflow more immediately. The key distinction is that the optimal policy navigates the storage–release trade-off by carefully moderating and phasing its releases. This strategy yields a lower, later peak outflow instead of releasing the flood crest in a single, large surge.
From a hydrological perspective, the smoother gate operations and delayed outflow peaks achieved by the RL-derived policy result from its learned management of the storage–release balance. By initiating moderate releases early in the flood’s rising limb, the policy creates additional storage capacity that buffers the peak inflows, leading to attenuation and a delayed downstream response. This behavior demonstrates that the RL framework effectively internalizes key flood-routing dynamics—using anticipatory storage management to lower, flatten, and postpone flood peaks relative to both benchmark policies.
Consequently, the differing release hydrographs directly shape the downstream flood impact, as shown in Figure 18. Since damage is a function of the routed hydrograph, the expert policy’s earlier and higher peak release produces a correspondingly earlier and larger damage peak. The zero-open policy eventually produces a similar peak damage once uncontrolled spillway overflow begins. In contrast, the optimal policy’s flattened and delayed release hydrograph translates into a damage curve that is both attenuated and deferred relative to both benchmarks.
The further quantitative evaluation employed two metrics: time-integrated damage and peak damage recorded during the 20-day event. The peak damage captures the worst moment, while the time-integrated damage captures how long damages persist and how large they are overall—useful when policies have similar peaks but different durations or onset timings. For clarity, Table 1 compares the optimal policy’s performance against the two benchmarks, using the expert policy as the baseline. Relative to this expert baseline, the optimal policy reduces peak damage by approximately 10% (from 644 M$ to 576 M$) and time-integrated damage by 19% (from 223,853 M$·h to 181,330 M$·h). The zero-open policy yields a similar peak damage but a significantly lower time-integrated damage than the expert policy; however, its time-integrated damage remains higher (about 7%) than that achieved by the optimal policy. These improvements, while modest in magnitude, demonstrate the RL agent’s ability to learn anticipatory control strategies from historical data. This results in enhanced operational stability and effective downstream risk mitigation.
To complement the damage-based evaluation, key hydrologic indicators were compared among the three policies. As summarized in Table 2, the RL-derived policy achieved a lower peak discharge ( Q peak = 825 cms) and a later peak timing ( T peak = 176 h) compared to the expert and zero-open policies. These results correspond to a 16.8% and 13.2% reduction in peak discharge and a 27.5% and 21.4% delay in peak timing, relative to the expert and zero-open benchmarks, respectively. This consistency between hydrologic and damage-based outcomes confirms that the RL framework captures the underlying storage–release trade-offs and flood-routing dynamics responsible for peak attenuation and delay.
Overall, the gate operations derived from the optimal policy demonstrated more resilient and operationally stable behavior than the benchmark strategies, highlighting the potential of RL to support robust decision-making in complex, partially observable hydrologic systems.

6.3. GA Optimization

To further validate the effectiveness of our learning-based policy-optimization framework, we implemented a GA approach for the same 2008 Iowa flood event. This comparative analysis generated both optimal reservoir-operation strategies and flood damage evolution patterns, enabling direct performance evaluation against our proposed method.
In the implemented GA, each chromosome encodes a length-40 sequence of gate openings discretized into five levels spanning 0 to 7 m consistent with the RL formulation. The GA is initialized with 100 individuals and evolved for 800 generations using truncation selection with 20% elitism; parents are drawn from the elite set. Offspring are produced via deterministic single-point crossover, and each child is mutated with probability 0.10 by randomly replacing one gene. The fitness function is defined as the cumulative episodic return obtained from the simulator, which is the same reward function employed in the RL framework. To enhance reproducibility in this stochastic search, the random seed is fixed; in multiple runs, the best solution is selected to represent the GA outcome.
The corresponding gate operation sequence is presented in Figure 20a. The solution initiates the flood event with a high gate opening (5.25 m), sustaining it over multiple intervals before progressively reducing the opening to zero during the second half of the event. A notable difference emerges between the GA-optimized gate operations and those derived from the learning-based optimal policy. First, the timing of closures differs substantially: under the optimal policy, the gate is closed earlier, with the final closure occurring around 100 h, whereas the GA strategy delays the final closure until approximately 180 h. In addition, the operational strategy implied by each method is distinct. The optimal policy adopts earlier gate reductions, prioritizing downstream risk mitigation by proactively reducing peak flood damages. In contrast, the GA strategy maintains larger openings for longer, enabling greater early releases and delayed closures, which helps lower reservoir storage but carries the risk of amplifying downstream peak damages.
Figure 20b illustrates the total downstream damage time series under this GA-optimized gate operation strategy. Damage accumulates rapidly during early hours, peaks near the midpoint of the event, and gradually declines thereafter. The early gate opening helps moderate flood peaks but does not entirely eliminate sharp increases in damage, particularly during the peak inflow period.
Quantitative results in Table 3 show the GA strategy attains normalized damage ratios of 0.941 (peak) and 0.818 (time-integrated). These correspond to absolute values of 606 M$ (peak damage) and 183,112 M$·h (time-integrated damage), representing reductions of 38 M$ (5.9%) and 40,741 M$·h (18.2%) versus the expert baseline (644 M$ and 223,853 M$·h). While the time-integrated damage is comparable to that of the optimal policy, the optimal policy achieves a further 5% decrease in peak damage (a 606 M$ reduction) over the GA-optimized strategy.

7. Adaptive Policies

A fundamental advantage of RL over GA is its capacity to learn adaptive control policies that generalize across environmental uncertainties. While GAs generate optimized solutions for specific scenarios, RL agents develop transferable decision-making rules through environmental interaction. To evaluate this capability, our analysis proceeds in three parts: First, we assess sensitivity to initial conditions by retraining the RL agent across a range of reservoir storage levels, determining their impact on flood damage, and identifying the best initial state for the 2008 Iowa flood. Second, we introduce inflow forecast uncertainty during training to develop a more adaptive policy. The performance of this adaptive policy is then compared to the event-specific optimal policy for the 2008 flood. Finally, we conduct a generalization test by applying the adaptive policy to the hydrologically distinct 2013 Iowa flood event.

7.1. Initial Reservoir Storage Variation

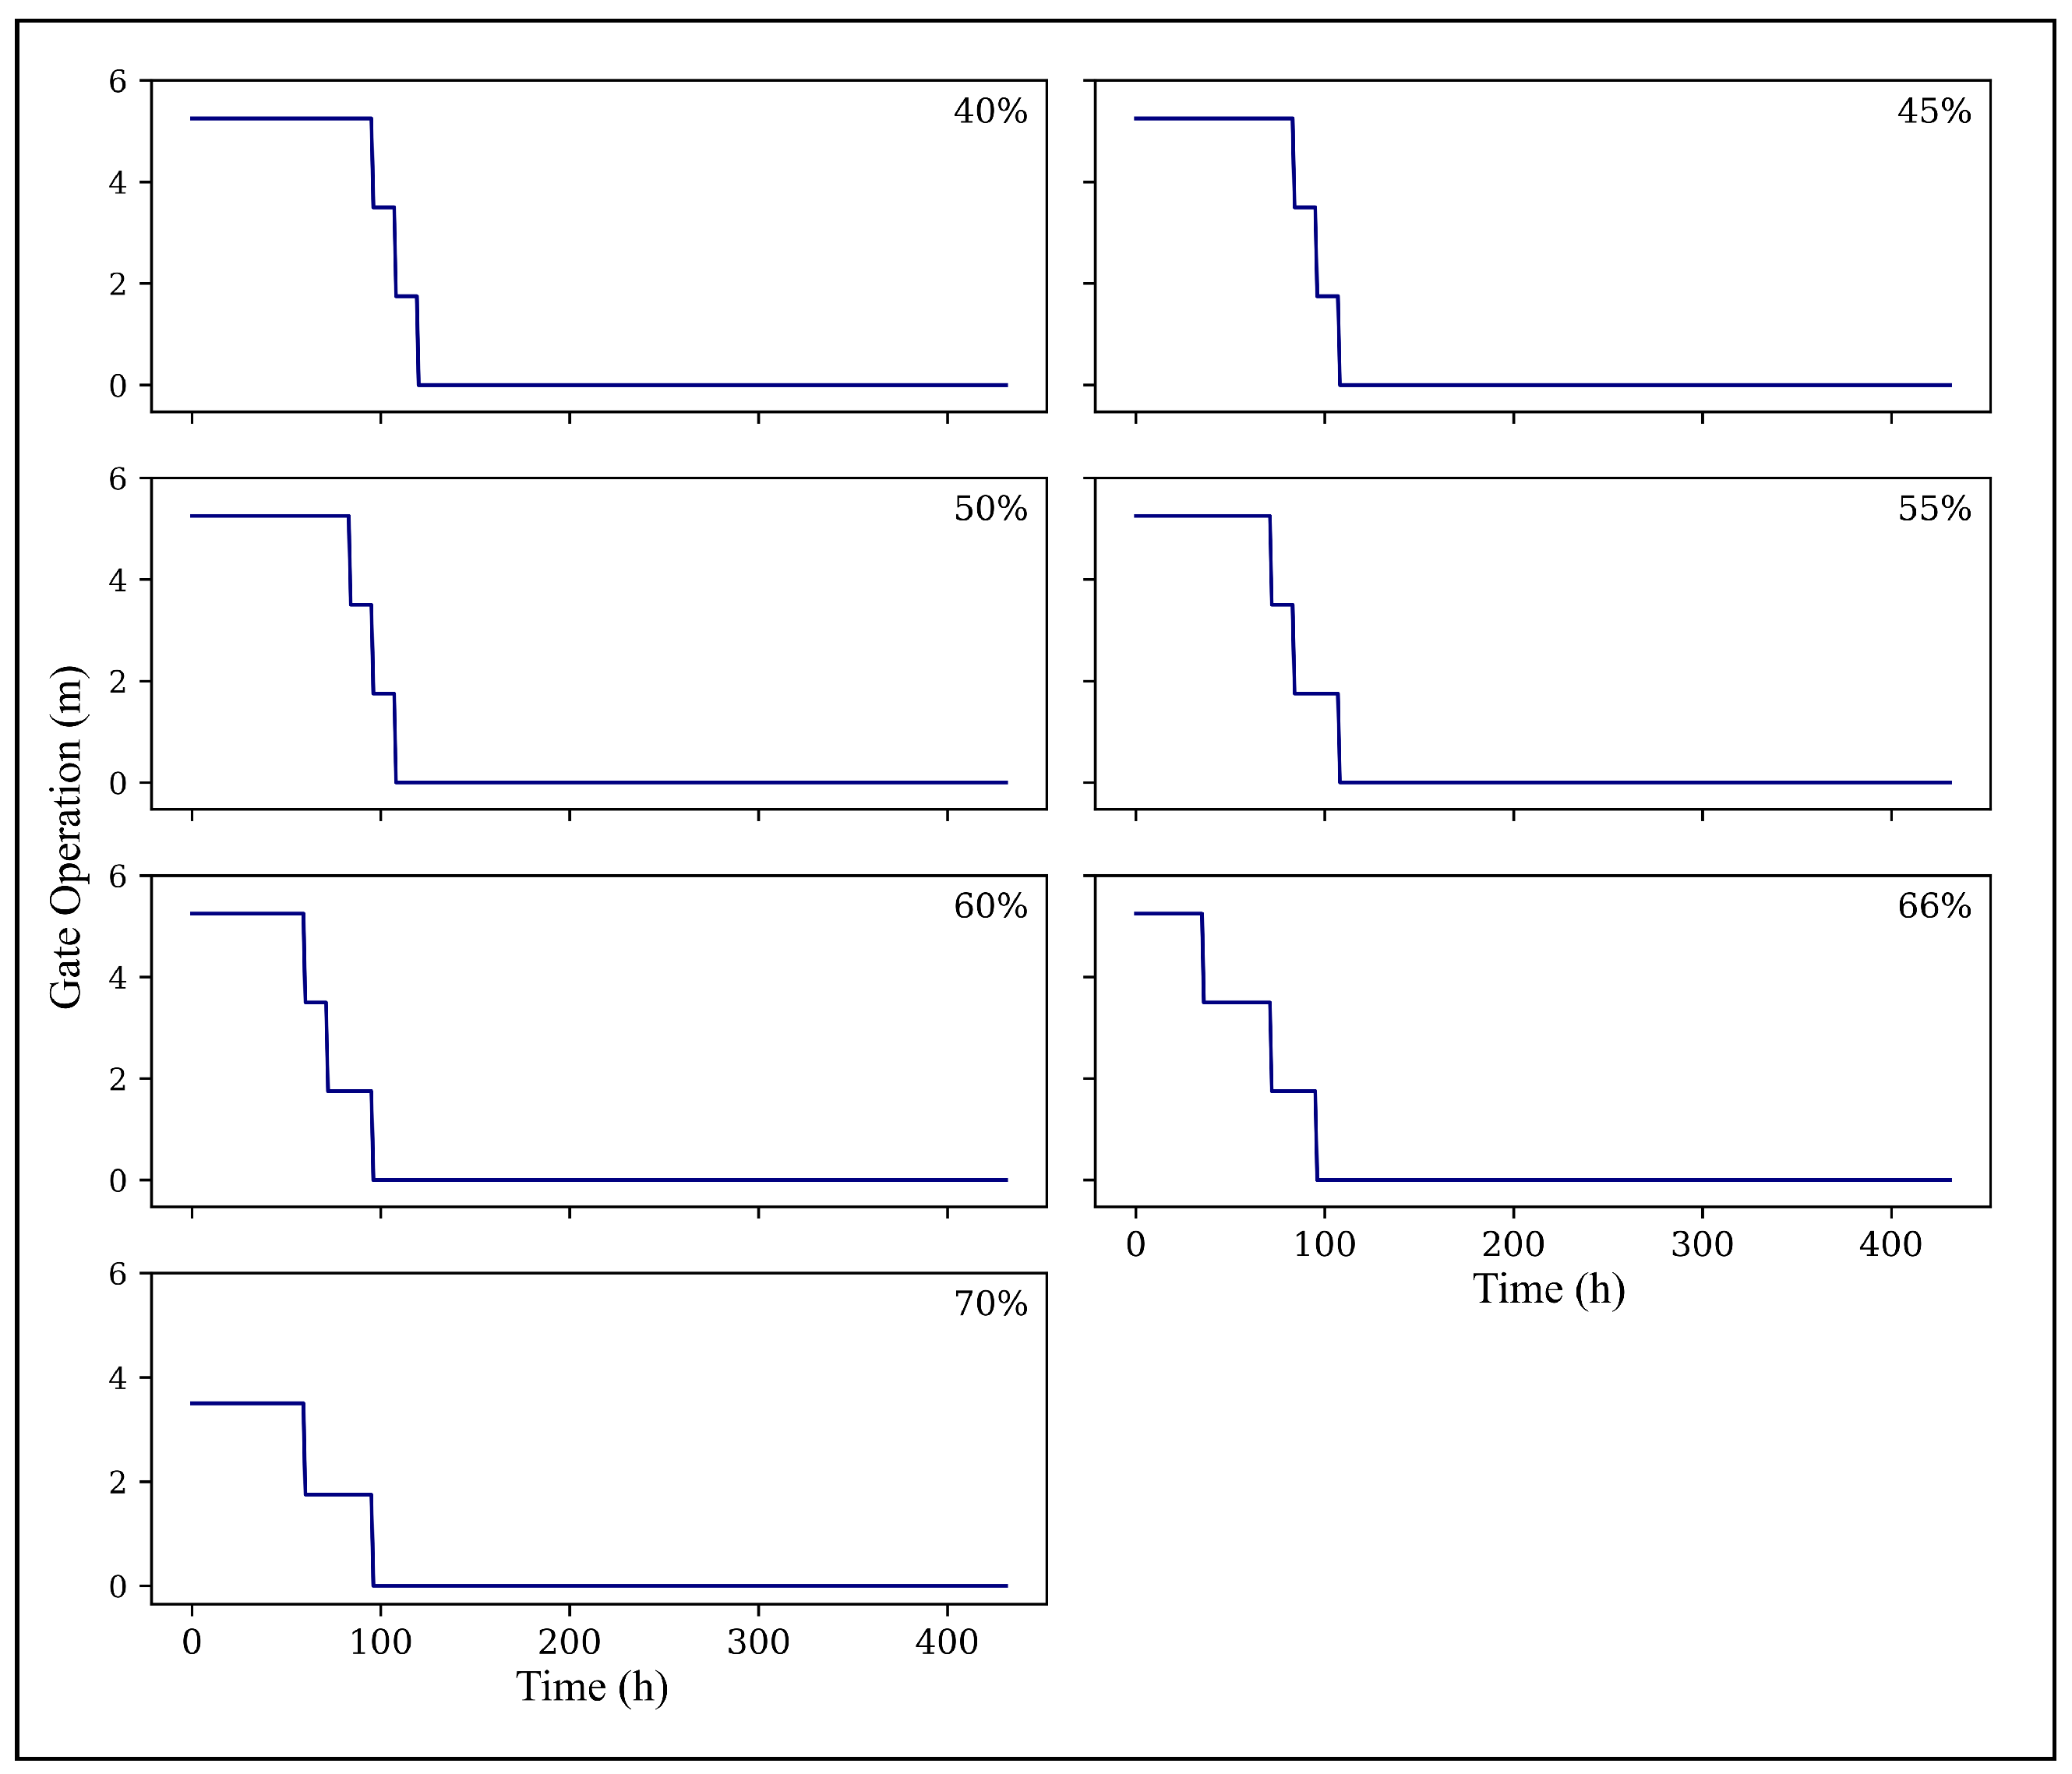
To consider the robustness of the RL-derived policy under diverse pre-flood reservoir conditions, we retrain the RL agent by varying the initial storage levels at the beginning of each episode. During the learning process, the agent encountered initial storage values randomly sampled from a uniform range spanning 40% to 70% of maximum reservoir capacity, thereby encouraging the development of a generalized policy adaptable to various hydrologic states.
For evaluation, the learned policy was tested deterministically ( ϵ = 0 ) under fixed initial storage levels of 0.40, 0.45, 0.50, 0.55, 0.60, 0.66, and 0.70 of maximum storage. The initial storage level of 66% was used instead of 65% because it reflects the actual initial storage condition of Coralville Reservoir at the onset of the 2008 flood event, which we adopted in our RL problem setup previously. For each case, we analyzed the resulting gate operation sequence, the downstream damage trajectory, and final performance metrics compared to the expert policy, which is taken as the baseline.
Across all initial storage conditions, the RL-derived policy produced a consistent gate operation structure: an initial high release, followed by stepwise reductions culminating in complete closure during later intervals, as illustrated in Figure 21. The magnitude and duration of this initial release phase, however, were modulated by the available storage capacity. For instance:
  • At 0.40–0.50 storage, the policy maintained higher gate openings for longer durations, taking advantage of surplus capacity to reduce downstream risk aggressively.
  • At 0.65–0.70 storage, the agent initiated gate closures earlier to preserve control, yet still outperformed benchmark policies by carefully modulating releases before peak inflow.
Table 4 summarizes the normalized peak and time-integrated flood damage for each initial storage condition, comparing the RL-derived policy to the expert baseline. The RL policy consistently outperforms the baseline, achieving time-integrated damage reductions ranging from 0.8093 to 0.8115 and peak damage reductions ranging from 0.8621 to 0.9154. The results highlight a dependence of policy effectiveness on the initial storage level. In particular, the 45–50% storage range emerges as the most favorable, yielding the lowest peak damage ratios (0.8621) and among the lowest time-integrated damages. Overall, these results suggest that maintaining reservoir storage in the moderate range of 45–50% at the onset of the 2008 Iowa flood event provides the most effective strategy for mitigating downstream flood risk.
These results underscore the robustness of the RL-derived policy to variations in initial reservoir storage. By training across diverse initial conditions, the agent learned a control strategy that remains effective under a wide range of flood preparedness states. This adaptability is critical for real-world flood management, where pre-event reservoir levels are often uncertain and highly variable between flood events. Furthermore, the sensitivity analysis can be designed to identify the optimal initial reservoir storage level for mitigating flood impact.

7.2. Adaptive Policy

Previous work in Section 5 derived an optimal policy for the specific hydrologic conditions of the 2008 Iowa flood, using observed inflow data from the Marengo USGS station (Figure 7). To enhance the policy’s generalizability under hydrologic uncertainty, we retrained the RL agent using a diverse ensemble of synthetic inflow sequences designed to mimic forecast uncertainty. Specifically, each synthetic inflow was generated by applying bounded stochastic perturbations to a representative hydrograph from the 2008 flood. For every training episode, a new inflow realization was sampled by multiplying the baseline hydrograph with lognormally distributed random factors, smoothed with a moving average filter to preserve realistic hydrograph shapes while introducing variability in peak magnitude and timing. This procedure ensured that each episode presented the agent with a distinct yet physically plausible inflow sequence.
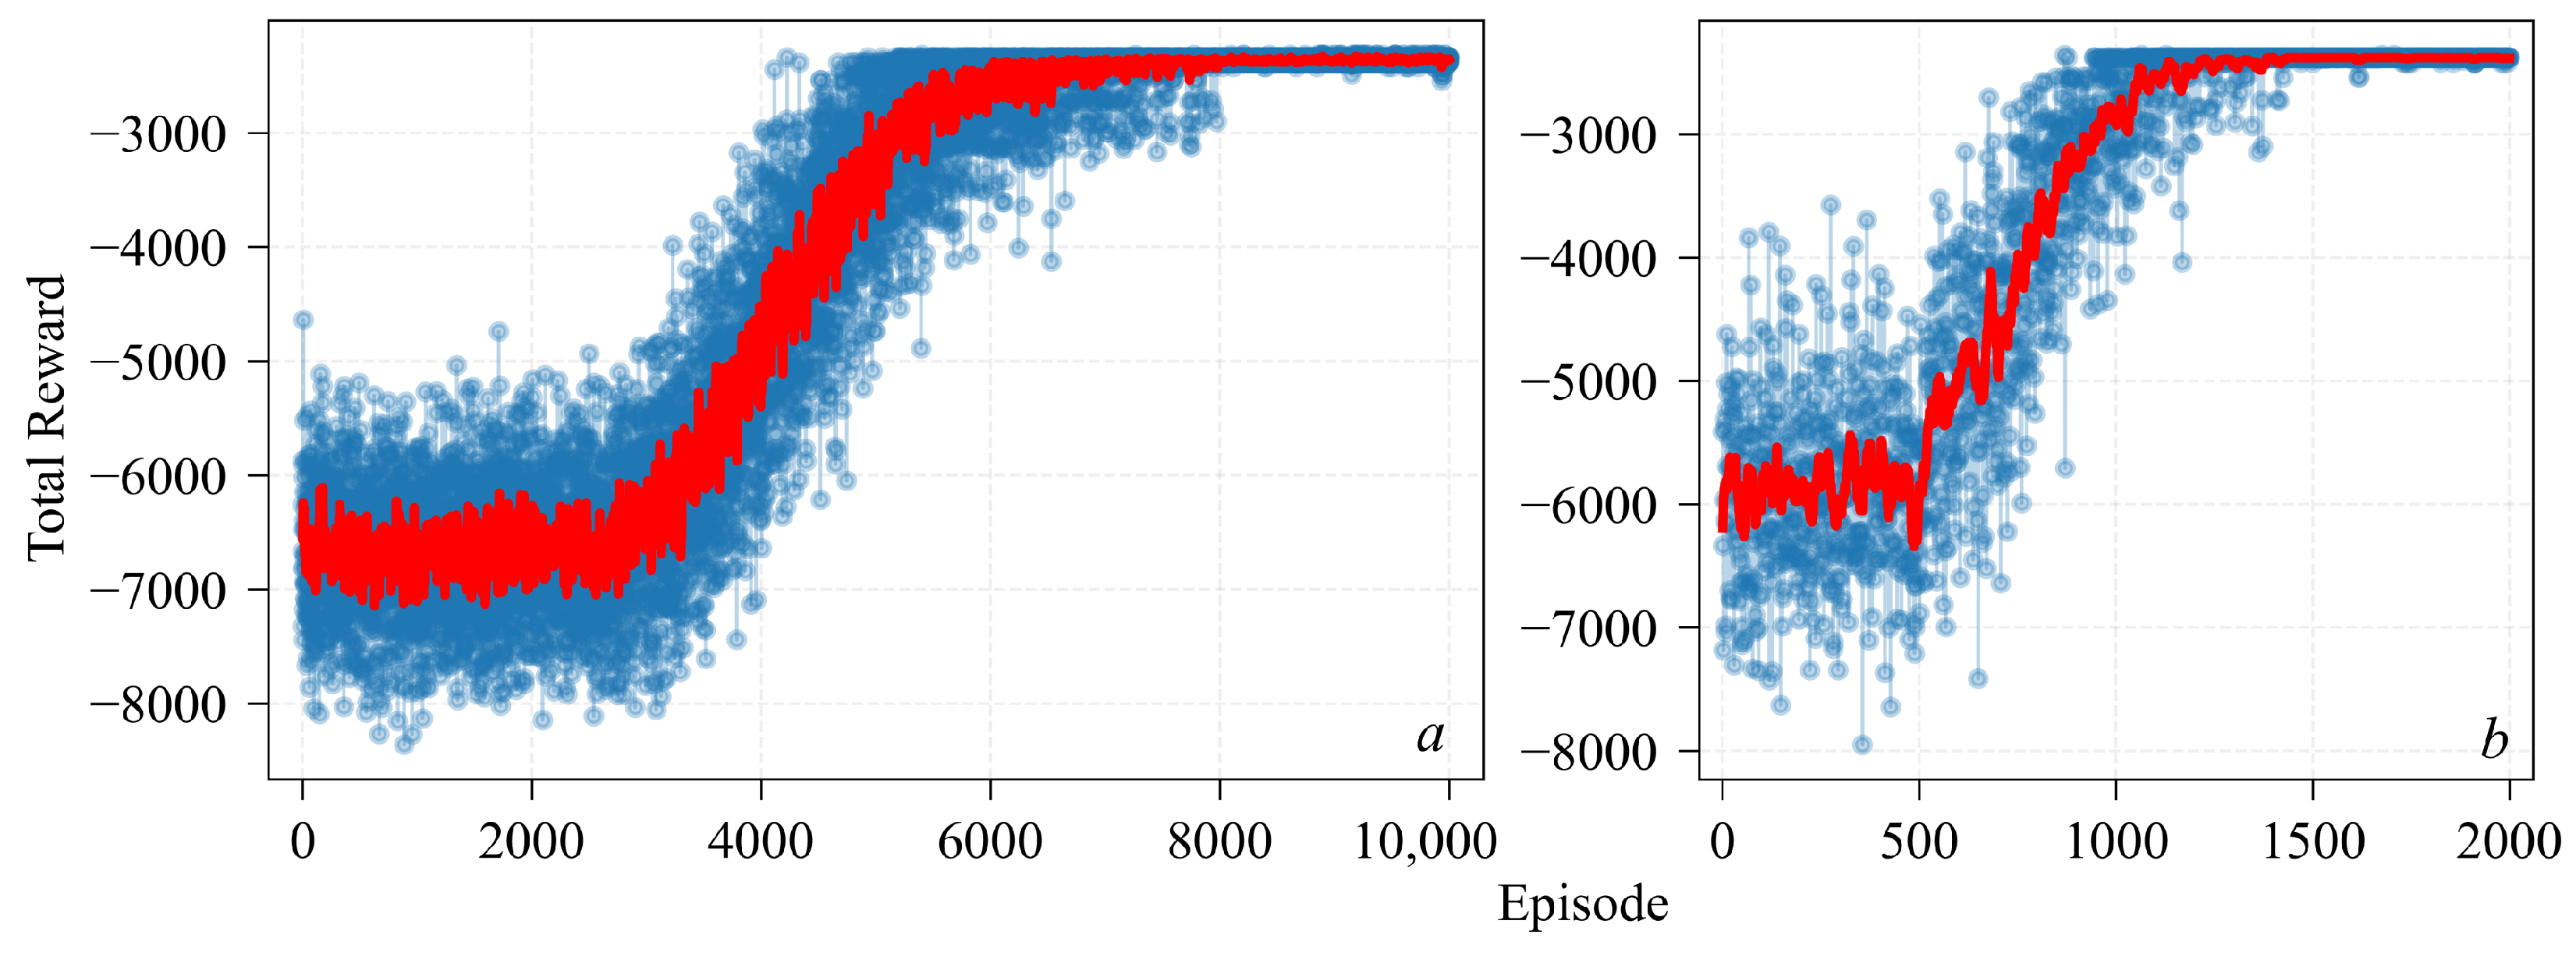
This diversity enabled the RL agent to encounter a broad spectrum of flood scenarios during training, fostering the development of an adaptive policy capable of anticipating and mitigating a wide range of operational challenges. By learning under these varied conditions, the model exhibited enhanced robustness and flexibility when applied to both known and unseen flood events. During the training phase, the progression of accumulated rewards is shown in Figure 22, which demonstrates a clear upward trend as the agent gradually improves its policy through interaction with the varied inflow environments.
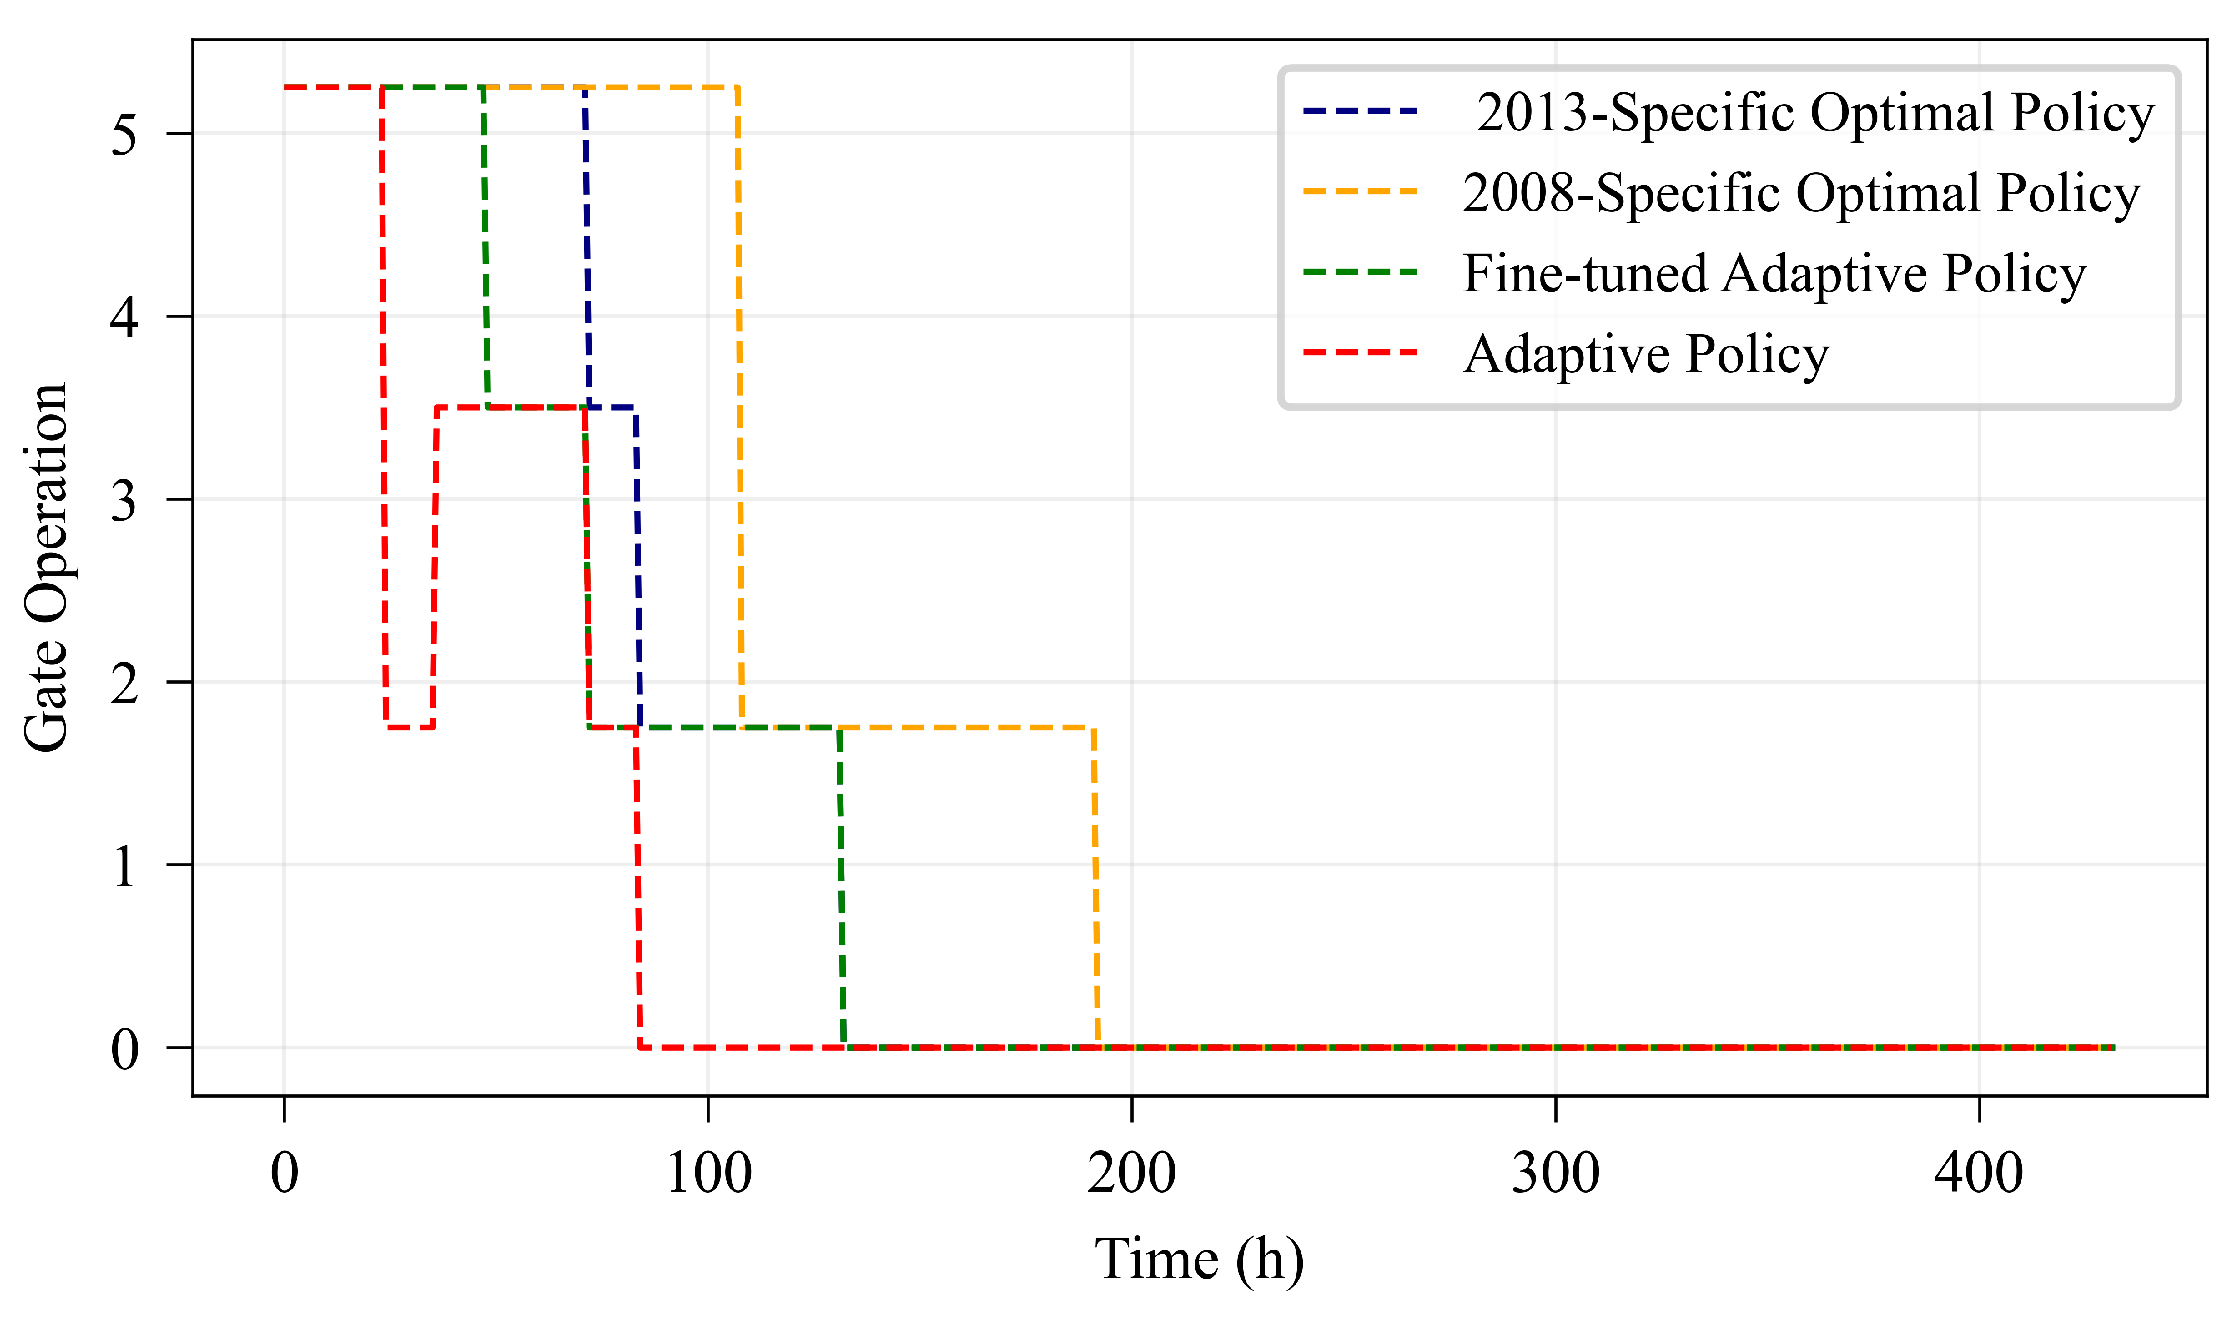
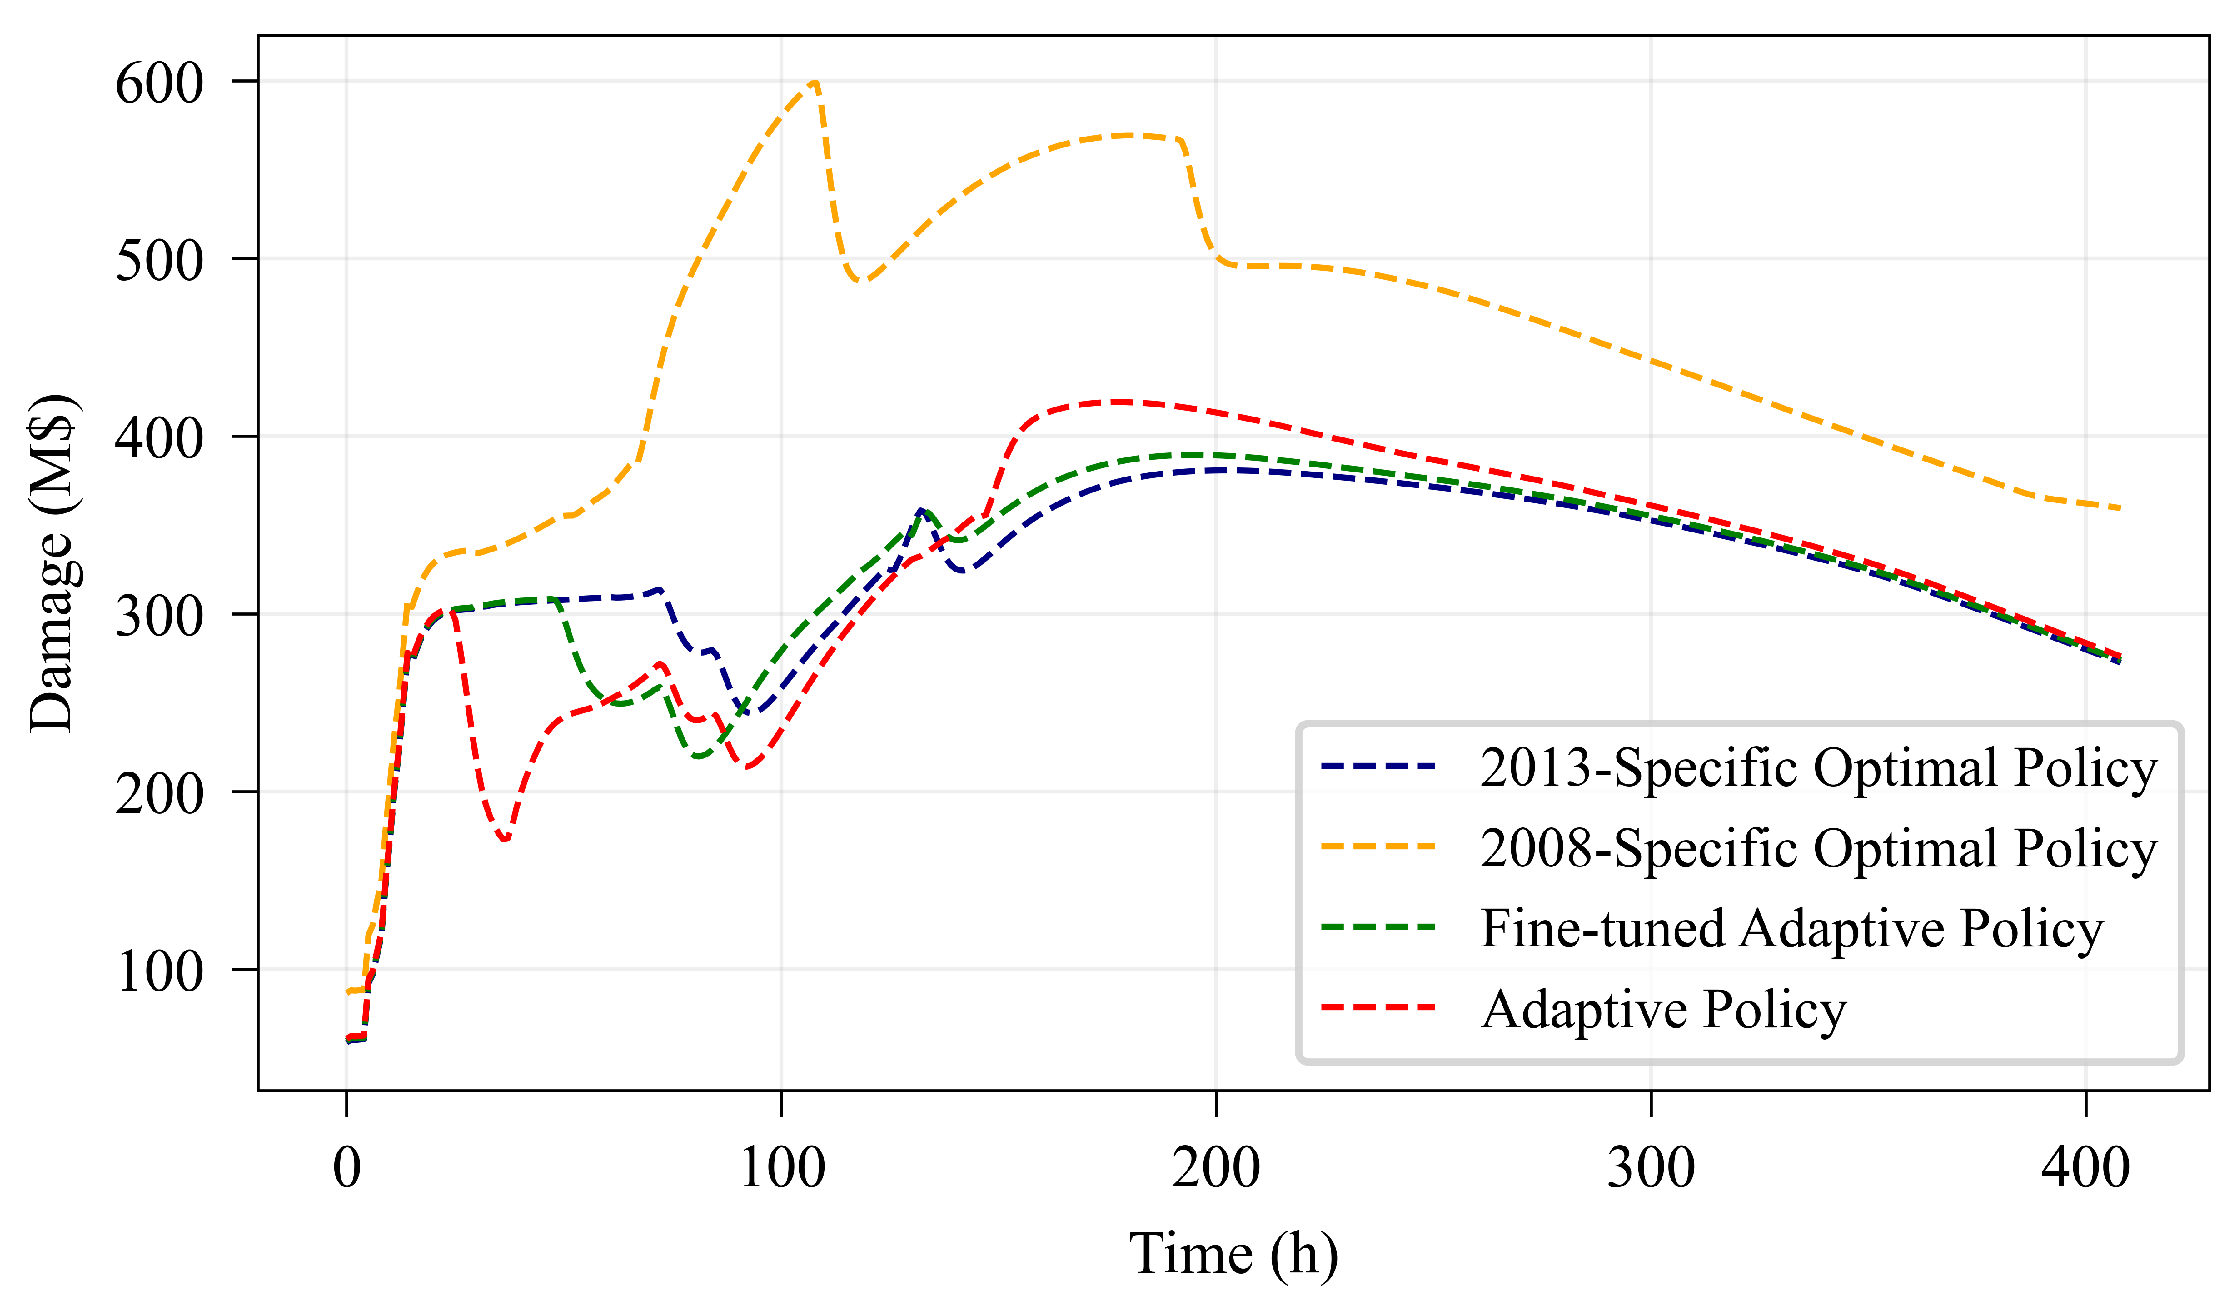
We assessed the performance of the adaptive policy in Figure 23 by comparing it against the optimal policy trained exclusively on the 2008 flood event (Section 6), hereafter referred to as the 2008-specific optimal policy. The evaluation of the adaptive policy demonstrates performance closely aligned with the 2008-specific optimal policy. The adaptive policy (Figure 23a) produces a staged and anticipatory gate operation sequence, with multiple intermediate adjustments that gradually reduce openings. By contrast, the 2008-specific optimal policy follows a more abrupt trajectory, transitioning quickly from large openings to complete closure. Despite these operational differences, both approaches yield nearly identical downstream damage trajectories Figure 23b.
The quantitative comparison in Table 5 confirms this similarity, with the adaptive policy on the 2008 inflow achieving damage indices nearly equivalent to the 2008-specific optimal policy. This comparison demonstrates that the adaptive policy, although not trained on the 2008 inflow, generalizes well to the event, while the event-specific policy represents a solution tailored exclusively to that flood.

7.3. Mitigation of the 2013 Iowa Flood

To further validate the transferability of the adaptive policy, we repeated the same evaluation using the 2013 Iowa flood event in Iowa City as an independent test case. Compared to the 2008 flood, the 2013 event represents a more moderate hydrologic scenario, providing a complementary benchmark for assessing the robustness of learned policies under varying flood intensities. Inflow rates observed from 27 May to 16 June 2013, at the Marengo USGS station, are depicted in Figure 10. As demonstrated in Section 3.2, the calibrated hydraulic model is generalizable for studying the impact of other flood events downstream of the Coralville Reservoir; therefore, recalibration for the 2013 flood event is unnecessary.
For the 2013 Iowa flood, the gate operation sequence corresponding to the expert (baseline) policy was reconstructed using the same reverse-engineering procedure applied to the 2008 flood. Specifically, controlled releases were estimated using Equation (13) for gated flows, while uncontrolled spillway discharge was obtained from the established elevation–discharge rating curve (Figure 6). This ensured consistency across events and provided a physically defensible representation of historical dam operations. During the 2013 event, the expert policy ramped the gates up more gradually to a near-fully open position (≈ 7 m ) over several days, held that setting through the peak, and then stepped down during recession, whereas in 2008 the gates reached the fully open state much faster—within about a day—were maintained there through most of the high-flow period, and then reduced toward the end; despite differing inflow hydrographs, both sequences share the same overall pattern of openings rising to ∼6–7 m with sustained high releases at peak, followed by a gradual drawdown.
The HEC-FIA simulation of the expert policy’s downstream impacts revealed a peak damage of approximately $520 M$ and a time-integrated damage of 165,827 M·h. This confirms that the 2013 event, while less extreme than the 2008 flood in terms of peak inflow, still generated substantial economic losses. As validated in Section 4, the Transformer-based damage predictive model generalizes well to hydrologically distinct inflow scenarios, despite being trained and validated solely on the 2008 event. Consequently, we integrated this surrogate model into the RL framework, where it provides rapid damage estimates for reward calculation, enabling the learning of optimal gate operation policies for the 2013 flood.
We evaluated four distinct operational policies for the Coralville Reservoir during the 2013 Iowa flood: (1) a new optimal policy trained specifically for the 2013 event; (2) the adaptive policy from the previous section; (3) a fine-tuned version of that adaptive policy for the 2013 event; and (4) the optimal policy trained solely on the 2008 event. In particular, Figure 24a shows the learning curve for the 2013-specific policy, where the accumulated reward over 10,000 episodes demonstrates gradual improvement and eventual convergence.
In contrast, Figure 24b shows the training curve for the fine-tuned adaptive model over 2000 episodes, which achieves rapid convergence and reward stabilization within a significantly shorter training horizon. This fine-tuning step aimed to better align the learned strategy with the hydrologic dynamics of the 2013 flood while preserving the generalization capabilities acquired during training on perturbed inflows. The process involved continued training with the fixed observed 2013 inflow while maintaining the original model architecture and replay buffer to ensure continuity in learning.
Figure 25 shows the gate operation sequences for the 2013 Iowa flood event derived from the four policies. The fine-tuned adaptive policy and the 2013-specific optimal policy produced nearly identical gate operation sequences, aligning closely in both the timing and magnitude of gate openings. This indicates a consistent operational response to the 2013 inflow hydrograph. While the other two policies result in a similar gate operation pattern, the 2008-specific optimal policy delays the gate closing, and the adaptive policy expedites it.
Figure 26 shows the resulting damage evolutions. Both the fine-tuned adaptive policy and the 2013-specific optimal policy yield nearly identical results, achieving the lowest and most stable damage evolution throughout the event. The adaptive policy also performs competitively, closely following the 2013-specific optimum with only minor deviations, which highlights its strong generalization capability. In contrast, the 2008-specific optimal policy optimized specifically for the 2008 event produces significantly higher and more variable damages, with pronounced peaks exceeding those of other policies. This performance degradation occurs because the policy overfits to the 2008 event and fails to generalize to a distinct flood scenario.
The corresponding quantitative metrics in Table 6 further support this observation: the 2013-specific optimal policy achieves the lowest peak (0.7265) and time-integrated (0.7987) damage ratios, confirming its effectiveness as the event-specific policy. The fine-tuned adaptive policy produces nearly identical outcomes (0.7451 and 0.7994), demonstrating that modest adaptation enables the adaptive framework to reach event-specific optimal performance. Importantly, even the adaptive policy performs competitively, with damage ratios (0.8020 and 0.7989) only slightly higher than the event-specific optimum, underscoring its ability to generalize effectively to unseen inflows. By contrast, the 2008-specific optimal policy performs poorly when transferred to the 2013 conditions, yielding significantly higher ratios (1.0998 and 1.1457) that exceed the expert baseline. Together, these results highlight that adaptive policies not only generalize across diverse hydrologic events but, when fine-tuned, can closely match event-specific optima.
This agreement underscores the effectiveness of the adaptive policy in generalizing from synthetic to real inflows, while the fine-tuning step ensures that the strategy remains tailored to specific historical conditions. The close match in operational patterns and outcome metrics validates the adaptive training framework as a reliable and transferable approach to flood-resilient reservoir operation.
This consistency across both the 2008 and 2013 floods confirms the generalization capability of the adaptive policy and its capacity to be rapidly fine-tuned to historical events. The close agreement in policy behavior and performance metrics further reinforces the robustness of this learning framework as a practical tool for real-world, flood-resilient reservoir operation.

8. Conclusions

This study developed and evaluated a comprehensive data-driven framework for flood mitigation that integrates process-based hydraulic modeling, Transformer-based flood damage prediction, and reinforcement learning for reservoir-operation optimization. Using the Coralville Dam and the 2008 and 2013 Iowa floods as case studies, the framework demonstrated its ability to capture complex hydrologic–hydraulic interactions while enabling computationally efficient optimization of gate operations.
Our findings show that the Transformer-based surrogate model effectively predicts downstream flood damages with high accuracy, significantly reducing reliance on computationally intensive hydraulic simulations. The reinforcement-learning agent, enhanced with Transformer encoders, successfully learned anticipatory and adaptive gate operation strategies that minimized both peak and time-integrated damages relative to expert and zero-opening benchmarks. Comparative analysis with a genetic algorithm confirmed the robustness of the RL framework, with RL showing superior performance in reducing peak damages and, more importantly, in developing adaptive policies capable of generalizing across varying initial conditions and inflow uncertainties.
Overall, the proposed framework represents a promising advancement toward resilient and adaptive flood management.
Although the proposed framework demonstrates strong adaptability and transferability for flood-resilient reservoir operation, several limitations should be acknowledged. The analysis was confined to a single reservoir and employed a fixed decision interval, which may restrict its applicability to multireservoir systems or real-time operations. The reinforcement-learning policy relies on a surrogate model trained on deterministic hydraulic simulations and uncertainties in inflow forecasts; the model structure was not explicitly quantified. Furthermore, the optimization focused solely on minimizing downstream flood damage, without incorporating additional operational objectives or stakeholder trust considerations. Future research will extend this framework toward multi-objective, uncertainty-aware, and trust-integrated reservoir management applicable across diverse hydrologic and operational settings.

Author Contributions

Conceptualization, S.T., F.G., R.M. and S.X.; methodology, S.T., F.G. and S.X.; software, S.T.; validation, S.T.; formal analysis, S.T., F.G., R.M. and S.X.; investigation, S.T. and S.X.; resources, S.T.; data curation, S.T.; writing—original draft preparation, S.T. and S.X.; writing—review and editing, S.T., F.G., R.M. and S.X.; visualization, S.T.; supervision, R.M. and S.X.; project administration, S.X.; funding acquisition, S.X. All authors have read and agreed to the published version of the manuscript.

Funding

This research was funded by the U.S. Department of Education under Grant Number ED#P116S210005 and the National Science Foundation under Grant Number 2226936. Any opinions, findings, and conclusions or recommendations expressed in this material are those of the author(s) and do not necessarily reflect the views of the U.S. Department of Education and the National Science Foundation.

Data Availability Statement

The raw data supporting the conclusions of this article will be made available by the authors on request.

Acknowledgments

The authors have reviewed and edited the output and take full responsibility for the content of this publication.

Conflicts of Interest

The authors declare no conflicts of interest. The funders had no role in the design of the study; in the collection, analyses, or interpretation of data; in the writing of the manuscript; or in the decision to publish the results.

References

  1. Rentschler, J.; Salhab, M.; Jafino, B.A. Flood Exposure and Poverty in 188 Countries. Nat. Commun. 2022, 13, 3527. [Google Scholar] [CrossRef]
  2. Tellman, B.; Sullivan, J.A.; Kuhn, C.; Kettner, A.J.; Doyle, C.S.; Brakenridge, G.R.; Erickson, T.A.; Slayback, D.A. Satellite Imaging Reveals Increased Proportion of Population Exposed to Floods. Nature 2021, 596, 80–86. [Google Scholar] [CrossRef] [PubMed]
  3. Hallegatte, S.; Green, C.; Nicholls, R.J.; Corfee-Morlot, J. Future Flood Losses in Major Coastal Cities. Nat. Clim. Change 2013, 3, 802–806. [Google Scholar] [CrossRef]
  4. Gong, Y.; Liu, P.; Liu, D.; Zhang, X.; Xu, W.; Xiang, D. An analytical two-stage risk analysis model in the real-time reservoir operation. J. Hydrol. 2024, 645, 132256. [Google Scholar] [CrossRef]
  5. Li, H.; Liu, P.; Guo, S.; Cheng, L.; Yin, J. Climatic Control of Upper Yangtze River Flood Hazard Diminished by Reservoir Groups. Environ. Res. Lett. 2020, 15, 124013. [Google Scholar] [CrossRef]
  6. Mishra, V.; Aaadhar, S.; Shah, H.; Kumar, R.; Pattanaik, D.R.; Tiwari, A.D. The Kerala Flood of 2018: Combined Impact of Extreme Rainfall and Reservoir Storage. Hydrol. Earth Syst. Sci. Discuss. 2018, 2018, 1–13. [Google Scholar] [CrossRef]
  7. Mahootchi, M.; Tizhoosh, H.R.; Ponnambalam, K.P. Reservoir Operation Optimization by Reinforcement Learning. J. Water Manag. Model. 2007, 15, R227-08. [Google Scholar] [CrossRef]
  8. Watts, R.J.; Richter, B.D.; Opperman, J.J.; Bowmer, K.H. Dam reoperation in an era of climate change. Mar. Freshw. Res. 2011, 62, 321–327. [Google Scholar] [CrossRef]
  9. Chen, J.; Zhong, P.a.; Liu, W.; Wan, X.Y.; Yeh, W.W.G. A Multi-objective Risk Management Model for Real-time Flood Control Optimal Operation of a Parallel Reservoir System. J. Hydrol. 2020, 590, 125264. [Google Scholar] [CrossRef]
  10. Shenava, N.; Shourian, M. Optimal Reservoir Operation with Water Supply Enhancement and Flood Mitigation Objectives Using an Optimization–Simulation Approach. Water Resour. Manag. 2018, 32, 4393–4407. [Google Scholar] [CrossRef]
  11. Lai, V.; Huang, Y.F.; Koo, C.H.; Ahmed, A.N.; El-Shafie, A. A Review of Reservoir Operation Optimisations: From Traditional Models to Metaheuristic Algorithms. Arch. Comput. Methods Eng. 2022, 29, 3435–3457. [Google Scholar] [CrossRef] [PubMed]
  12. Huang, K.; Ye, L.; Chen, L.; Wang, Q.; Dai, L.; Zhou, J.; Singh, V.P.; Huang, M.; Zhang, J. Risk Analysis of Flood Control Reservoir Operation Considering Multiple Uncertainties. J. Hydrol. 2018, 565, 672–684. [Google Scholar] [CrossRef]
  13. Wan, W.; Zhao, J.; Lund, J.R.; Zhao, T.; Lei, X.; Wang, H. Optimal Hedging Rule for Reservoir Refill. J. Water Resour. Plan. Manag. 2016, 142, 04016051. [Google Scholar] [CrossRef]
  14. Ming, B.; Liu, P.; Chang, J.; Wang, Y.; Huang, Q. Deriving Operating Rules of Pumped Water Storage Using Multiobjective Optimization: Case Study of the Han to Wei Interbasin Water Transfer Project, China. J. Water Resour. Plan. Manag. 2017, 143, 05017012. [Google Scholar] [CrossRef]
  15. Stedinger, J.R.; Sule, B.F.; Loucks, D.P. Stochastic dynamic programming models for reservoir operation optimization. Water Resour. Res. 1984, 20, 1499–1505. [Google Scholar] [CrossRef]
  16. Xu, W.; Zhang, C.; Peng, Y.; Fu, G.; Zhou, H. A Two-Stage Bayesian Stochastic Optimization Model for Cascaded Hydropower Systems Considering Varying Uncertainty of Flow Forecasts. Water Resour. Res. 2014, 50, 9267–9286. [Google Scholar] [CrossRef]
  17. Zhang, X.; Peng, Y.; Xu, W.; Wang, B. An Optimal Operation Model for Hydropower Stations Considering Inflow Forecasts with Different Lead-Times. Water Resour. Manag. 2019, 33, 173–188. [Google Scholar] [CrossRef]
  18. Xi, S.; Wang, B.; Liang, G.; Li, X.; Lou, L. Inter-basin Water Transfer-supply Model and Risk Analysis with Consideration of Rainfall Forecast Information. Sci. China Technol. Sci. 2010, 53, 3316–3323. [Google Scholar] [CrossRef]
  19. Zhang, K.; Wu, X.; Niu, R.; Yang, K.; Zhao, L. The Assessment of Landslide Susceptibility Mapping Using Random Forest and Decision Tree Methods in the Three Gorges Reservoir Area, China. Environ. Earth Sci. 2017, 76, 405. [Google Scholar] [CrossRef]
  20. Wang, Y.M.; Chang, J.X.; Huang, Q. Simulation with RBF Neural Network Model for Reservoir Operation Rules. Water Resour. Manag. 2010, 24, 2597–2610. [Google Scholar] [CrossRef]
  21. Quinn, J.D.; Reed, P.M.; Giuliani, M.; Castelletti, A. What Is Controlling Our Control Rules? Opening the Black Box of Multireservoir Operating Policies Using Time-Varying Sensitivity Analysis. Water Resour. Res. 2019, 55, 5962–5984. [Google Scholar] [CrossRef]
  22. Labadie, J.W. Optimal Operation of Multireservoir Systems: State-of-the-Art Review. J. Water Resour. Plan. Manag. 2004, 130, 93–111. [Google Scholar] [CrossRef]
  23. Giuliani, M.; Lamontagne, J.R.; Reed, P.M.; Castelletti, A. A state-of-the-art review of optimal reservoir control for managing conflicting demands in a changing world. Water Resour. Res. 2021, 57, e2021WR029927. [Google Scholar] [CrossRef]
  24. Xu, J.; Qiao, J.; Sun, Q.; Shen, K. A Deep Reinforcement Learning Framework for Cascade Reservoir Operations Under Runoff Uncertainty. Water 2025, 17, 2324. [Google Scholar] [CrossRef]
  25. Saikai, Y.; Peake, A.; Chenu, K. Deep reinforcement learning for irrigation scheduling using high-dimensional sensor feedback. PLoS Water 2023, 2, e0000169. [Google Scholar] [CrossRef]
  26. Castelletti, A.; Corani, G.; Rizzoli, A.; Soncini-Sessa, R.; Weber, E. Reinforcement learning in the operational management of a water system. In IFAC Workshop on Modeling and Control in Environmental Issues; Keio University: Yokohama, Japan, 2002; pp. 325–330. [Google Scholar]
  27. Lee, J.H.; Labadie, J.W. Stochastic Optimization of Multireservoir Systems via Reinforcement Learning. Water Resour. Res. 2007, 43, W11408. [Google Scholar] [CrossRef]
  28. Riemer-Sørensen, S.; Rosenlund, G.H. Deep reinforcement learning for long term hydropower production scheduling. In Proceedings of the 2020 International Conference on SMART Energy Systems and Technologies (SEST), Istanbul, Turkey, 7–9 September 2020; pp. 1–6. [Google Scholar]
  29. Wang, X.; Nair, T.; Li, H.; Wong, Y.S.R.; Kelkar, N.; Vaidyanathan, S.; Nayak, R.; An, B.; Krishnaswamy, J.; Tambe, M. Efficient reservoir management through deep reinforcement learning. arXiv 2020, arXiv:2012.03822. [Google Scholar] [CrossRef]
  30. Xu, W.; Meng, F.; Guo, W.; Li, X.; Fu, G. Deep reinforcement learning for optimal hydropower reservoir operation. J. Water Resour. Plan. Manag. 2021, 147, 04021045. [Google Scholar] [CrossRef]
  31. Tian, W.; Liao, Z.; Zhang, Z.; Wu, H.; Xin, K. Flooding and overflow mitigation using deep reinforcement learning based on Koopman operator of urban drainage systems. Water Resour. Res. 2022, 58, e2021WR030939. [Google Scholar] [CrossRef]
  32. Wu, R.; Wang, R.; Hao, J.; Wu, Q.; Wang, P. Multiobjective multihydropower reservoir operation optimization with transformer-based deep reinforcement learning. J. Hydrol. 2024, 632, 130904. [Google Scholar] [CrossRef]
  33. Tabas, S.S.; Samadi, V. Fill-and-spill: Deep reinforcement learning policy gradient methods for reservoir operation decision and control. J. Water Resour. Plan. Manag. 2024, 150, 04024022. [Google Scholar] [CrossRef]
  34. Luo, W.; Wang, C.; Zhang, Y.; Zhao, J.; Huang, Z.; Wang, J.; Zhang, C. A deep reinforcement learning approach for joint scheduling of cascade reservoir system. J. Hydrol. 2025, 651, 132515. [Google Scholar] [CrossRef]
  35. Castro-Freibott, R.; García-Sánchez, Á.; Espiga-Fernández, F.; González-Santander de la Cruz, G. Deep Reinforcement Learning for Intraday Multireservoir Hydropower Management. Mathematics 2025, 13, 151. [Google Scholar] [CrossRef]
  36. Phankamolsil, Y.; Rittima, A.; Sawangphol, W.; Kraisangka, J.; Tabucanon, A.S.; Talaluxmana, Y.; Vudhivanich, V. Deep Reinforcement Learning for Multiple Reservoir Operation Planning in the Chao Phraya River Basin. Model. Earth Syst. Environ. 2025, 11, 102. [Google Scholar] [CrossRef]
  37. U.S. Army Corps of Engineers, Hydrologic Engineering Center (HEC). HEC-RAS River Analysis System: Hydraulic Reference Manual; Technical Report; U.S. Army Corps of Engineers, Hydrologic Engineering Center: Davis, CA, USA, 2021. [Google Scholar]
  38. Wing, O.E.J.; Pinter, N.; Bates, P.D.; Kousky, C. New insights into US flood vulnerability revealed from flood insurance big data. Nat. Commun. 2020, 11, 1444. [Google Scholar] [CrossRef]
  39. U.S. Army Corps of Engineers, Hydrologic Engineering Center (HEC). HEC-FIA Flood Impact Analysis User’s Manual, Version 3.3 ed.; U.S. Army Corps of Engineers, Hydrologic Engineering Center: Davis, CA, USA, 2020. [Google Scholar]
  40. Vaswani, A.; Shazeer, N.; Parmar, N.; Uszkoreit, J.; Jones, L.; Gomez, A.N.; Kaiser, L.; Polosukhin, I. Attention is All You Need. In Proceedings of the 31st Conference on Neural Information Processing Systems, Long Beach, CA, USA, 4–9 December 2017. [Google Scholar]
  41. Hochreiter, S.; Schmidhuber, J. Long short-term memory. Neural Comput. 1997, 9, 1735–1780. [Google Scholar] [CrossRef]
  42. Cho, K.; van Merrienboer, B.; Gulcehre, C.; Bahdanau, D.; Bougares, F.; Schwenk, H.; Bengio, Y. Learning Phrase Representations using RNN Encoder–Decoder for Statistical Machine Translation. In Proceedings of the EMNLP, Doha, Qatar, 25–29 October 2014; pp. 1724–1734. [Google Scholar]
  43. Zerveas, G.; Jayaraman, S.; Patel, D.; Bhamidipaty, A.; Eickhoff, C. A Transformer-Based Framework for Multivariate Time Series Representation Learning. In Proceedings of the 27th ACM SIGKDD Conference on Knowledge Discovery & Data Mining, Singapore, 14–18 August 2021; pp. 2114–2124. [Google Scholar] [CrossRef]
  44. Grigsby, J.; Wang, Z.; Nguyen, N.; Qi, Y. Long-Range Transformers for Dynamic Spatiotemporal Forecasting. arXiv 2021, arXiv:2109.12218. [Google Scholar]
  45. Wang, S.; Lin, Y.; Jia, Y.; Sun, J.; Yang, Z. Unveiling the Multi-Dimensional Spatio-Temporal Fusion Transformer (MDSTFT): A Revolutionary Deep Learning Framework for Enhanced Multi-Variate Time Series Forecasting. IEEE Access 2024, 12, 115895–115904. [Google Scholar] [CrossRef]
  46. Keles, F.D.; Wijewardena, P.M.; Hegde, C. On the computational complexity of self-attention. In Proceedings of the International Conference on Algorithmic Learning Theory, Singapore, 20–23 February 2023; pp. 597–619. [Google Scholar]
  47. Liu, Y.; Xin, Y.; Yin, C. A Transformer-based Method to Simulate Multi-scale Soil Moisture. J. Hydrol. 2025, 655, 132900. [Google Scholar] [CrossRef]
  48. Jiang, M.; Weng, B.; Chen, J.; Huang, T.; Ye, F.; You, L. Transformer-enhanced Spatiotemporal Neural Network for Post-processing of Precipitation Forecasts. J. Hydrol. 2024, 630, 130720. [Google Scholar] [CrossRef]
  49. Jin, H.; Lu, H.; Zhao, Y.; Zhu, Z.; Yan, W.; Yang, Q.; Zhang, S. Integration of an Improved Transformer with Physical Models for the Spatiotemporal Simulation of Urban Flooding Depths. J. Hydrol. Reg. Stud. 2024, 51, 101627. [Google Scholar] [CrossRef]
  50. Sutton, R.S.; Barto, A.G. Reinforcement Learning: An Introduction; The MIT Press: London, UK, 2018. [Google Scholar]
  51. Howard, R.A. Dynamic Programming and Markov Processes; Technology Press and Wiley: New York, NY, USA, 1960. [Google Scholar]
  52. Li, J.; Cai, M.; Kan, Z.; Xiao, S. Model-free reinforcement learning for motion planning of autonomous agents with complex tasks in partially observable environments. Auton. Agents Multi-Agent Syst. 2024, 38, 14. [Google Scholar] [CrossRef]
  53. Wang, Z.; Jha, K.; Xiao, S. Continual reinforcement learning for intelligent agricultural management under climate changes. Comput. Mater. Contin. 2024, 81, 1319–1336. [Google Scholar] [CrossRef]
  54. Kurniawati, H. Partially Observable Markov Decision Processes and robotics. Annu. Rev. Control Robot. Auton. Syst. 2022, 5, 253–277. [Google Scholar] [CrossRef]
  55. Mnih, V.; Kavukcuoglu, K.; Silver, D.; Rusu, A.A.; Veness, J.; Bellemare, M.G.; Graves, A.; Riedmiller, M.; Fidjeland, A.K.; Ostrovski, G.; et al. Human-level Control through Deep Reinforcement Learning. Nature 2015, 518, 529–533. [Google Scholar] [CrossRef] [PubMed]
  56. Li, J.; Cai, M.; Xiao, S. Reinforcement learning-based motion planning in partially observable environments under ethical constraints. AI Ethics 2025, 5, 1047–1067. [Google Scholar] [CrossRef]
  57. Wang, Z.; Xiao, S.; Wang, J.; Parab, A.; Patel, S. Reinforcement Learning-Based Agricultural Fertilization and Irrigation Considering N2O Emissions and Uncertain Climate Variability. AgriEngineering 2025, 7, 252. [Google Scholar] [CrossRef]
  58. Alabbad, Y.; Demir, I. Comprehensive flood vulnerability analysis in urban communities: Iowa case study. Int. J. Disaster Risk Reduct. 2022, 74, 102955. [Google Scholar] [CrossRef]
  59. US Army Corps of Engineers. Coralville Lake Water Control Update Report with Integrated Environmental Assessment; Technical Report; US Army Corps of Engineers: Davis, CA, USA, 2022. [Google Scholar]
  60. U.S. Army Corps of Engineers. RiverGages.com: USACE Water Control Data. 2024. Available online: https://rivergages.mvr.usace.army.mil/WaterControl/shefgraph-historic.cfm?sid=IOWI4 (accessed on 3 August 2025).
  61. Tofighi, S.; Gurbuz, F.; Mantilla, R.; Xiao, S. Advancing Machine Learning-Based Streamflow Prediction Through Event Greedy Sampling, Asymmetric Loss Function, and Rainfall Forecasting Uncertainty; SSRN: Rochester, NY, USA, 2024. [Google Scholar] [CrossRef]
  62. Chen, Y.; Deierling, P.; Xiao, S. Exploring active learning strategies for predictive models in mechanics of materials. Appl. Phys. A Mater. Sci. Process. 2024, 130, 588. [Google Scholar] [CrossRef]
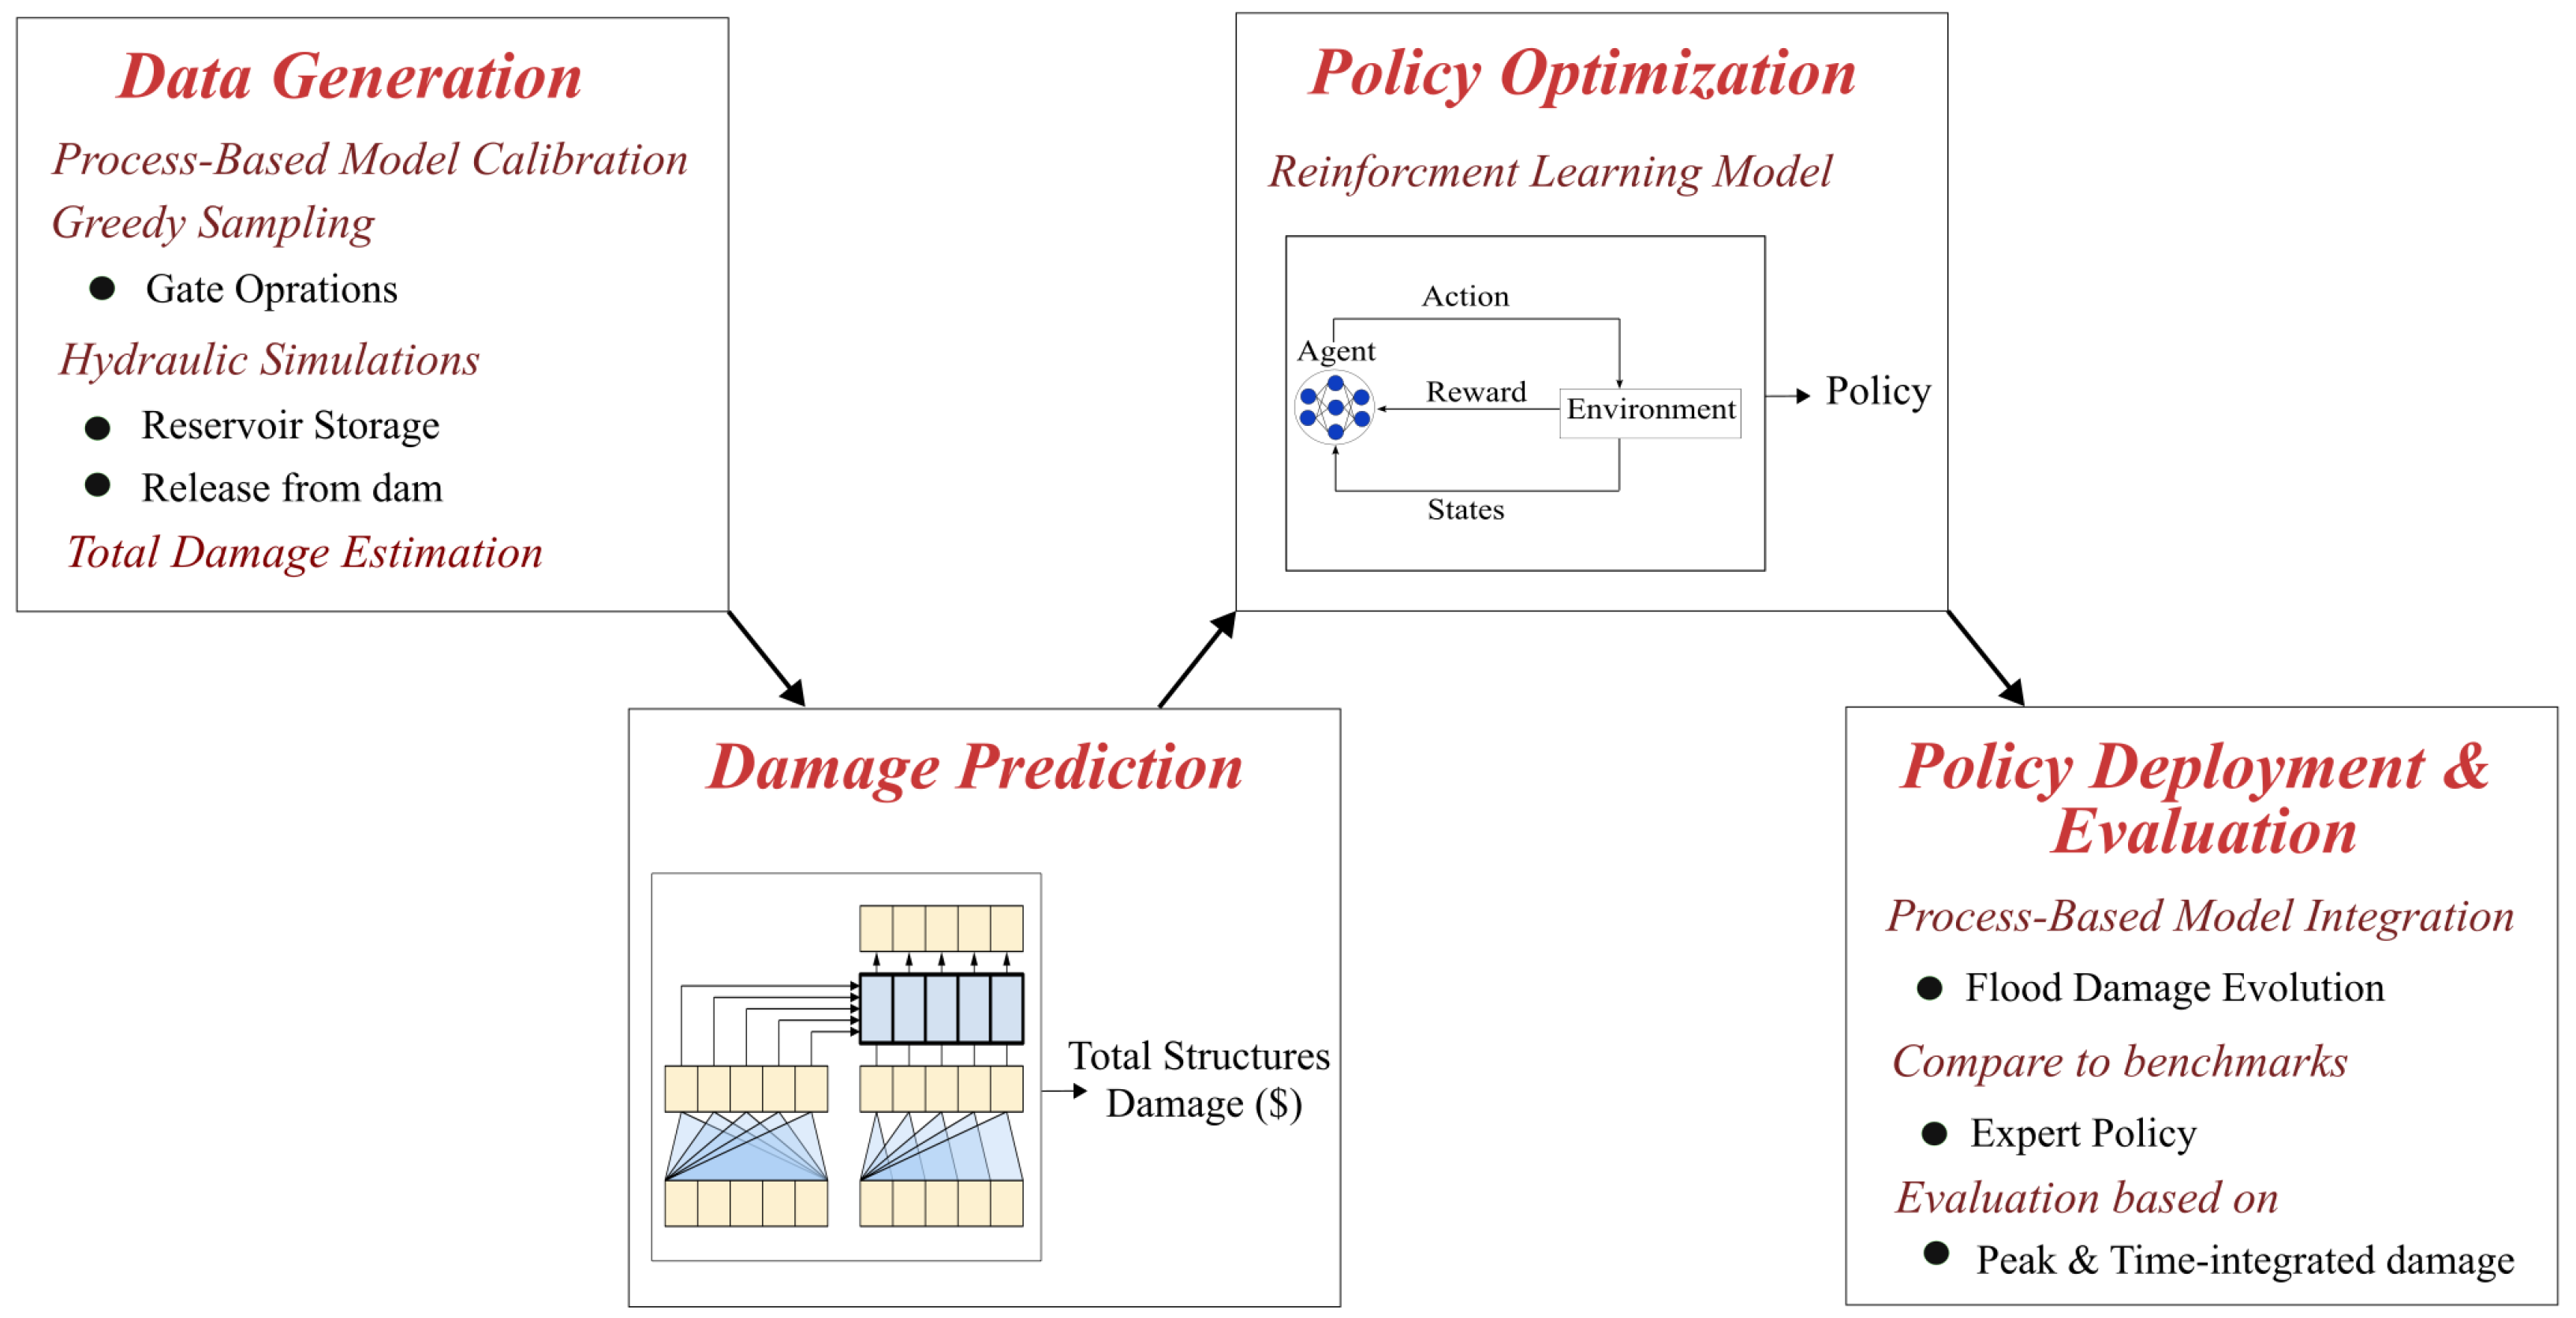
Figure 1. The schematic diagram of the data-driven framework for flood mitigation.
Water 17 03024 g001
Figure 2. Schematic architecture of the Transformer encoder model.
Water 17 03024 g002
Figure 3. Architectural diagram of transformer-based Q-network.
Water 17 03024 g003
Figure 4. Iowa River basin and points indicating locations of USGS stream gauges, all situated within the basin upstream of Lone Tree, Iowa. The shaded regions represent subbasins delineated at selected USGS gauge stations, with each color corresponding to the drainage area upstream of a particular station.
Water 17 03024 g004
Figure 5. Coralville Reservoir and downstream urban areas, with building footprints delineated for flood-prone sections of Coralville and Iowa City.
Water 17 03024 g005
Figure 6. Coralville Reservoir Spillway Discharge Rating Curve.
Water 17 03024 g006
Figure 7. Observed hourly inflow rates at the Marengo USGS station during the period of 8–28 June 2008.
Water 17 03024 g007
Figure 8. Actual gate operation sequence implemented at Coralville Reservoir, Iowa, during the 2008 flood event, representing the expert policy.
Water 17 03024 g008
Figure 9. Comparison of observed and simulated results during the 2008 flood event (top to bottom): reservoir pool elevation, reservoir release hydrograph, and stage time series at the Iowa City USGS station.
Water 17 03024 g009
Figure 10. Time series of hourly inflow rates observed from 27 May to 16 June 2013, at the Marengo USGS station.
Water 17 03024 g010
Figure 11. Comparison of observed and simulated results during the 2013 flood event. From top to bottom: reservoir pool elevation, reservoir release, and stage at the Iowa City USGS gauge.
Water 17 03024 g011
Figure 12. Map of flood inundation extent downstream of Coralville Reservoir during the peak of the 2008 Iowa flood event.
Water 17 03024 g012
Figure 13. Simulated vs. predicted flood damage: (a) test set and (b) 2013 event. The red dashed line denotes the 1:1 reference line, indicating perfect agreement.
Water 17 03024 g013
Figure 14. The RL problem for flood mitigation.
Water 17 03024 g014
Figure 15. Exponential decay of the exploration rate ( ϵ ) over the training episodes in the Transformer-based DQN algorithm.
Water 17 03024 g015
Figure 16. Learning curve for the RL agent, depicting raw episodic rewards (blue) and a smoothed moving average (red) over 10,000 training episodes. The trend illustrates the agent’s convergence towards a stable and improved policy.
Water 17 03024 g016
Figure 17. Deployment of the learned optimal policy during the 2008 Iowa flood event: (a) recommended gate operation sequence and (b) time evolution of simulated flood damage.
Water 17 03024 g017
Figure 18. Evolution of downstream flood damage for a simulation of the 2008 Iowa flood, comparing expert, zero-open, and optimal reservoir management policies.
Water 17 03024 g018
Figure 19. Reservoir release hydrographs for the 2008 Iowa flood event under expert, zero-open, and optimal operating policies.
Water 17 03024 g019
Figure 20. GA optimization results for the 2008 Iowa flood event: (a) optimized gate operation sequence and (b) resulting downstream flood damage over the event duration.
Water 17 03024 g020
Figure 21. Gate operation trajectories for the 2008 Iowa flood event derived from the optimal policy under different initial reservoir storage levels. The policy was trained using randomized initial storage in each episode.
Water 17 03024 g021
Figure 22. Training history of the adaptive optimal policy, showing raw episodic rewards (blue) and their smoothed trend (red) over 10,000 episodes.
Water 17 03024 g022
Figure 23. Comparison of adaptive and 2008-specific optimal policies during the 2008 flood event, showing (a) gate operation sequences and (b) the evolution of simulated flood damage.
Water 17 03024 g023
Figure 24. Accumulated reward during training for two different optimal policies for the 2013 Iowa flood event: (a) 2013-specific optimal policy and (b) fine-tuned adaptive optimal policy. The raw episodic rewards are shown in blue, while the moving average over the training episodes is shown in red.
Water 17 03024 g024
Figure 25. Gate operation sequences simulated for the 2013 Iowa flood event under four control policies.
Water 17 03024 g025
Figure 26. Damage evolution comparison under the four policies for the 2013 Iowa flood event.
Water 17 03024 g026
Table 1. Peak and time-integrated damages according to the optimal policy for the 2008 Iowa flood event, compared to the expert policy and the zero-open policy (Damages are normalized relative to the expert policy).
MetricOptimal PolicyExpert PolicyZero-Open Policy
Peak damage (M$)576 (0.8936)644 (1.0)649 (1.0078)
Time-integrated damage (M$·h)181,330 (0.8100)223,853 (1.0)196,798 (0.8791)
Table 2. Comparison of key hydrologic indicators for the 2008 Iowa flood event under expert, zero-open, and optimal policies.
MetricOptimal PolicyExpert PolicyZero-Open Policy
Q peak (cms)825992950
T peak (h)176138145
Table 3. Comparison of normalized peak and time-integrated damages for the 2008 Iowa flood event across gate operation strategies.
Gate OperationPeak Damage RatioTime-Integrated Damage Ratio
Expert policy1.001.00
Learning-based optimal policy0.89360.8100
GA-optimized strategy0.94100.8180
Table 4. Normalized peak and time-integrated flood damage for the RL-derived policy across initial storage conditions. All damage values are normalized relative to the expert policy baseline with 66% initial storage.
Initial Reservoir StorageOptimal Policy
(% of the Max) Peak Damage Ratio Time-Integrated Damage Ratio
400.87440.8097
450.86210.8093
500.86210.8093
550.87360.8096
600.89120.8101
660.89360.8100
700.91540.8099
Table 5. Normalized peak and time-integrated damages for the 2008 inflow under the adaptive and the event-specific optimal policies.
PolicyPeak Damage RatioTime-Integrated Damage Ratio
Expert policy1.001.00
Adaptive0.89740.8109
2008-specific0.89360.8100
Table 6. Normalized peak and time-integrated damage for the 2013 Iowa flood event, showing the performance of four optimal policies relative to an expert policy.
PolicyPeak Damage RatioTime-Integrated Damage Ratio
Expert policy1.01.0
2013-specific optimal policy0.72650.7987
Adaptive policy0.80200.7989
Fine-tuned Adaptive policy0.74510.7994
2008-specific optimal policy1.09981.1457
Disclaimer/Publisher’s Note: The statements, opinions and data contained in all publications are solely those of the individual author(s) and contributor(s) and not of MDPI and/or the editor(s). MDPI and/or the editor(s) disclaim responsibility for any injury to people or property resulting from any ideas, methods, instructions or products referred to in the content.