Article

Characteristics and Risk Assessment of Soil Salinization in the Yellow River Delta Region, China

1
Yantai Center of Coastal Zone Geological Survey, China Geological Survey, Yantai 264000, China
2
Observation and Research Station of Seawater Intrusion and Soil Salinization, Laizhou Bay, Ministry of Natural Resources, Qingdao 266061, China
3
Observation and Research Station of Land-Sea Interaction Field in the Yellow River Estuary, Yantai 264000, China
4
Shandong Yellow River Delta National Nature Reserve Management Committee, Dongying 257091, China
*
Authors to whom correspondence should be addressed.
Water 2025, 17(20), 2920; https://doi.org/10.3390/w17202920
Submission received: 22 August 2025 / Revised: 25 September 2025 / Accepted: 30 September 2025 / Published: 10 October 2025

Abstract

Analyzing the characteristics of soil salinization and conducting risk assessments are crucial for ensuring the sustainable development of agriculture and ecosystems. In order to analyze the characteristics of soil salinization and conduct a risk assessment in the Yellow River Delta region, 63 surface soil samples and 37 groundwater samples were collected from this area in August 2023. Based on the test results of the samples and using soil salt content as the criterion, the types, degrees, and risks of soil salinization in the Yellow River Delta region were analyzed separately. The results revealed a relatively high average soil salt content of 4.59 g/kg, with Na+ and Cl as the dominant ions. The primary salinization types were chloride and sulfate-chloride, covering 46.69% and 51.54% of the area, respectively. Moderate salinization was the most widespread, accounting for 45.35% of the region. Severe salinization, extremely severe salinization classes were mainly found in the coastal lowlands of the north and east, constituting 19.73% and 16.25% of the area, respectively. Groundwater exhibited transitional freshwater-saltwater characteristics, indicating widespread seawater intrusion across the region, which significantly contributed to soil salinity. Proximity to the Bohai Sea was the most critical factor influencing salinization, with areas closer to the sea showing a higher risk. High-risk zones, primarily along the coastline, covered 32.67% of the total area. The research findings can serve as valuable references for local wetland management and protection, the scientific enhancement of saline soils, rational soil utilization, effective prevention and control of soil salinization, and the sustainable development of water and soil resources.

1. Introduction

Soil is an extremely important natural resource [1,2], an integral component of the ecosystem [3,4], and the foundation upon which human survival depends [5]. Agricultural production, industrial development, and daily life all rely on soil [6]. Soil salinization is a common form and a key driver of land degradation [7]. The accumulation of salt in the soil adversely affects plant growth and development [8], leading to a decline in land productivity [9,10] and triggering a series of ecological deterioration processes [11], which severely restrict sustainable agricultural development and regional ecological security [12]. Global warming not only intensifies evapotranspiration in coastal areas but also causes sea level rise. Both factors have contributed to the further aggravation of soil salinization in these regions [13]. Currently, soil salinization is a widespread environmental issue affecting many regions worldwide [14]. Saline soil is widely distributed in over 100 countries and regions around the world, affecting more than 3% of the world’s soil resources [15], and it is growing at a rate of 104 to 105 hectares per year [16]. The coastal areas of China also have extensive areas of saline-alkali land [17]. Soil salinization significantly reduces soil productivity potential, posing a serious threat to the stability of agricultural production worldwide [18].
Soil salinization is a multifaceted process driven by a complex interplay of various factors [19]. The accumulation of salt ions in the soil is a natural cause of salinization [20]. Additionally, climate change, fluctuations in groundwater levels, improper farming practices, and seawater intrusion are significant drivers of salinization [21]. In salinized soil, a high concentration of Na+ can cause soil particles to disintegrate, expand, and disperse, leading to the destruction of soil aggregate structure and a reduction in the content of large aggregates. Consequently, the existing carbon and nitrogen are no longer protected by aggregates, making them more susceptible to decomposition. This significantly disrupts the mineralization process of soil carbon and nitrogen, thereby adversely affecting nutrient absorption by crops [22]. High concentrations of soluble salts in saline-alkali soils increase osmotic pressure, which affects the contraction of plant stomata. This leads to physiological and biochemical metabolic disorders, as well as nutritional imbalances in plants, ultimately hindering their normal growth [23]. Additionally, soil salinity has a negative effect on soil microorganisms, such as decreasing soil microbial activities, microbial biomass, and enzymatic activity through ionic toxicity and osmotic stress [24]. Overall, soil salinization has a serious impact on agricultural productivity and the ecological environment [25]. Therefore, a comprehensive understanding of the spatial distribution and the fundamental driving mechanisms of soil salinization is essential for safeguarding agricultural productivity and mitigating environmental issues [26]. Moreover, assessing the risk of soil salinization not only provides a quantitative measure of its severity but also offers a critical foundation for guiding prevention and control efforts [27].
The Yellow River Delta region represents the most extensive, well-preserved, and youngest wetland ecosystem in the warm temperate zone worldwide and is rich in saline soil resources [28]. The groundwater in this area is relatively shallow and is also affected by seawater intrusion, resulting in an uneven spatial distribution of soil salinization and complex variations in water and salt content. This has seriously hindered ecological protection and the sustainable use of land resources in the region [29,30]. Due to the long-term impact of seawater intrusion in the Yellow River Delta region, factors closely associated with seawater intrusion are likely the primary influences affecting the type, extent, and risk of soil salinization in this area. Understanding the extent and risk of salinization in this area is essential for scientifically managing resources, increasing land productivity, and enhancing the environment—all crucial steps toward sustainable development. Accordingly, this paper focuses on the Yellow River Delta region, analyzing the characteristics and influencing factors of soil salinization based on soil salinity distribution and groundwater chemical properties, and conducting a risk assessment. The research findings can serve as valuable references for local wetland management and protection, the scientific enhancement of saline soils, rational soil utilization, effective prevention and control of soil salinization, and the sustainable development of water and soil resources.

2. Materials and Methods

2.1. Study Area

The study area is located in the Yellow River Delta region, China (Figure 1), primarily encompassing five counties: Hekou, Kenli, Lijin, Dongying, and Guangrao, all under the jurisdiction of Dongying City, Shandong Province. It borders Bohai Bay and covers an area of approximately 7019.25 km2. Characterized by four distinct seasons, the region experiences a warm temperate, semi-humid continental monsoon climate, featuring dry and windy conditions in spring, high temperatures with substantial rainfall in summer, clear and crisp weather in autumn, and cold, dry conditions in winter. The climate experiences a mean yearly temperature of 12.3 °C and an average precipitation of 537.3 mm, with 70% occurring during the summer months. The annual average evaporation rate is 1962.1 mm, which is 3.6 times greater than the precipitation. The terrain mainly consists of alluvial plains, with elevations ranging from 0 to 20 m. According to the results of the second soil survey in Shandong Province, the soil in the Yellow River Delta region is primarily classified into three categories: fluvo-aquic soils, coastal solonchaks, and alluvial soils. Fluvo-aquic soils and coastal solonchaks are the predominant soil types in the Yellow River Delta, accounting for 47% and 44% of the soil area, respectively. Fluvo-aquic soils are the main cultivated soil and, after proper cultivation and improvement, are suitable for growing crops such as wheat, corn, and cotton. Coastal solonchaks can be found in coastal areas and have a relatively high salt content, making them unsuitable for agricultural cultivation. Alluvial soils mainly form from cultivation on alluvial deposits, fluvial deposits, or flood diversion silt of the Yellow River. It represents a transitional soil type between fluvo-aquic soils and coastal solonchaks, accounting for 9% of the area. The largest river in the region is the Yellow River, which extends approximately 128 km within the study area.

2.2. Sample Collection and Test Method

2.2.1. Sample Collection

To conduct this research, 63 surface soil samples and 37 groundwater samples were collected from the Yellow River Delta region in August 2023 (Figure 1).
The sampling points for the soil samples were determined by comprehensively considering factors such as natural geography, hydrogeology, the history of seawater intrusion, soil salinization, and transportation accessibility in the Yellow River Delta region. This was performed after consulting relevant materials and conducting research and evidence collection. The sampling points were approximately evenly distributed throughout the study area and covered various soil types and land use categories within it. Groundwater samples were collected from local civilian wells or hydrological monitoring wells.
Surface soil samples were taken from a depth of 0 to 20 cm. When collecting soil samples, recently accumulated soil and areas affected by human pollution were avoided. Plant roots, stones, and other debris were removed from the samples. Each sample weighed no less than 1000 g. Natural air drying, grinding, and sieving were applied to the collected soil samples for further analysis. Groundwater samples were collected using 500 mL polyethylene bottles, which were rinsed three times with the groundwater prior to sampling. Care was taken to avoid bubbles in the samples during collection. After sampling, the bottles were sealed and labeled. The samples were promptly transported to the laboratory for testing.

2.2.2. Test Method

All the surface soil samples were prepared with an extraction solution of a 1:5 soil-to-water ratio. The HCO3 was determined by the standard H2SO4 double neutralization titration method. Ca2+, Mg2+, and SO42− were measured by the EDTA complexometric titration method. Cl was measured by the standard AgNO3 titration method. K+ and Na+ were determined by the flame photometry method. The soil salt content (SSC) was determined by the method of drying and weighing.
The K+, Na+, Ca2+, and Mg2+ in the groundwater samples were determined by inductively coupled plasma atomic emission spectrometry. Cl, SO42−, and total dissolved solids (TDS) were measured by ion chromatography. HCO3 was tested by potentiometric titration.

2.3. Methods of Assessment

2.3.1. Types of Soil Salinization

According to the “Code of Practice for Coastal Soil Salinization Monitoring and Evaluation” [31] (HY/T 0320-2021) issued by the Ministry of Natural Resources of the People’s Republic of China, soil salinization types in the Yellow River Delta region can be classified into four categories based on the ratio of Cl to SO42− content in the soil. The classification details are presented in Table 1.

2.3.2. Degree of Soil Salinization

According to the “Technical Guidelines for Environmental Impact Assessment-Soil Environment (Trial)” [32] (HJ964-2018) issued by the Ministry of Ecology and Environment of the People’s Republic of China, the degree of soil salinization in the Yellow River Delta region is classified based on the level of salt content in the soil. The classification details are presented in Table 2.

2.3.3. Risk Assessment of Soil Salinization

Soil salinization risk assessment is a comprehensive evaluation system that considers multiple driving factors contributing to soil salinization [33]. The steps are as follows:
Calculate the comprehensive evaluation index C R for soil salinization risk:
C R = ( K i × Q i )
where K i represents each influencing factor, and Q i represents the value of each influencing factor.
To ensure the reliability of the C R value, standardization processing is carried out:
C R = ( C R     C R m i n ) ( C R m a x     C R m i n )
where C R represents the normalized comprehensive evaluation index of soil salinization, C R m a x and C R m i n represent the maximum and minimum values of the comprehensive evaluation index of soil salinization, respectively.
In this study, by integrating the advantages of the correlation coefficient method and the factor detection method, the comprehensive weights of the risk factors were determined. The correlation coefficient method primarily considers the linear relationship between the influencing factors of soil salinization and soil salt content. In contrast, the factor detection method measured the correlation between the independent and dependent variables, capturing both linear and nonlinear components. This integration provided a theoretical basis for accurately determining the weights of influencing factors [34]. Integrating these two methods can effectively minimize the influence of human subjectivity, accurately identify the relationships among multiple factors, and overcome the limitations of traditional analytical approaches.
A weighted average method was used in the assessments. The risk index values of soil salinization were calculated using the Raster Calculator. According to the previous research and considering the characteristics of the study area, the risk index values were classified into five risk levels [35], as detailed in Table 3. The higher the risk index is, the higher the potential risks brought about by soil salinization are.

2.4. Statistical Analysis

The data were processed and statistically analyzed using Microsoft Excel 365 and SPSS 26. The graphs were created with CorelDRAW X8, Origin 2022, and ArcGIS 10.8.

3. Results

3.1. Distribution Characteristics of Soil Salinity

3.1.1. Descriptive Statistical Analysis

Table 4 presents the content of salt ions in the surface soil. In the surface soil layer, the concentration of cations followed the order Na+ > Ca2+ > Mg2+ > K+, with Na+ accounting for 71.03% of the total cation concentration and an average content of 1.18 g/kg, making it the dominant ion. The concentration of anions was Cl > SO42− > HCO3, with Cl comprising 72.97% of the total anion concentration and an average content of 2.05 g/kg, also making it the dominant ion. The total salt content of the soil ranged from 0.497 to 14.97 g/kg, with a significant variation in the content. The average value was 4.59 g/kg, indicating that the salt content was generally at a high level, but the distribution was uneven.
The coefficient of variation (CV) is the ratio of the standard deviation to the mean. A higher CV indicates a greater degree of spatial heterogeneity for a given ion [36]. According to the statistical results, except for HCO3, which exhibited a relatively low CV of 40.00%, the CVs for the other ions ranged from 94.79% to 168.71%. This suggests that the concentration of HCO3 varied little within the soil of the study area, whereas the concentrations of other ions were unevenly distributed and exhibited greater variability, often showing elevated levels in certain localized areas. The CV of the total soil salt content was 82.89%, which was also at a relatively high level. These findings indicated that the overall soil salinity in the region was relatively high but unevenly distributed, with localized areas of concentrated salt content.

3.1.2. Zoning of Soil Salinization Types

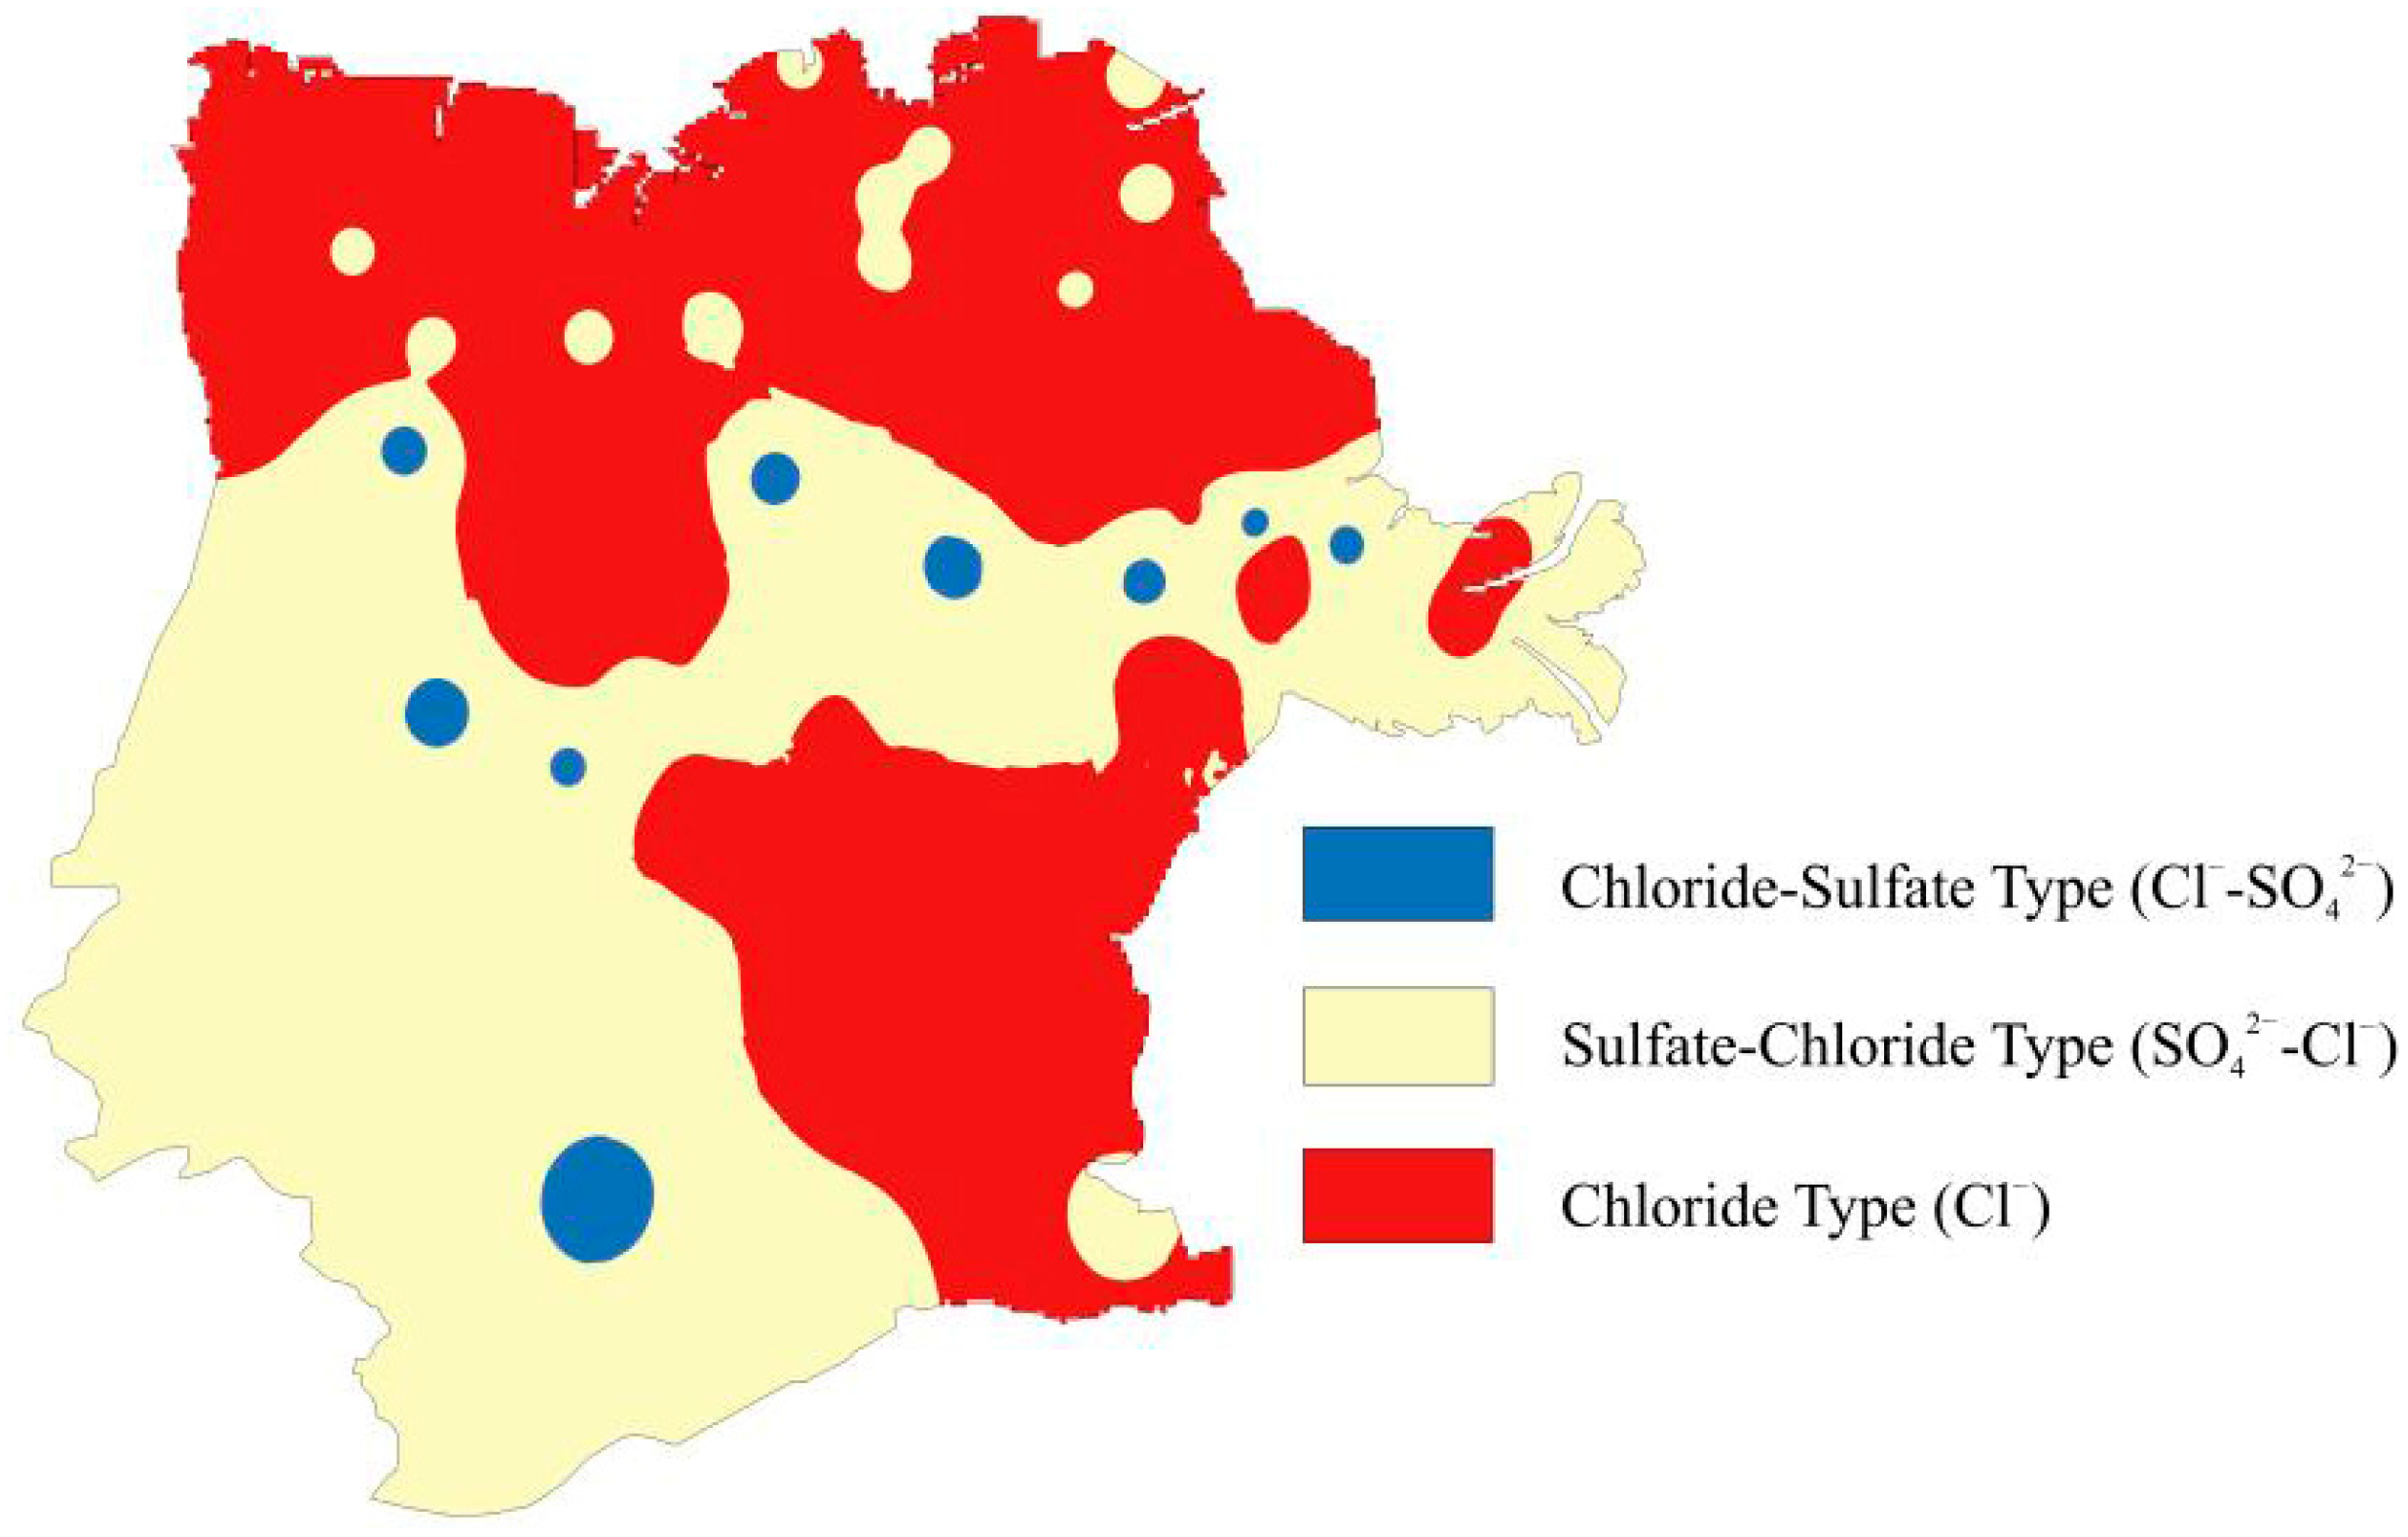
Table 5 and Figure 2 provided a detailed classification of soil salinization types in the Yellow River Delta region, identifying three categories: chloride type, chloride-sulfate type, and sulfate-chloride type. No sulfate-type soils were observed. Among these, chloride-type and sulfate-chloride-type soils were predominant, accounting for 46.69% and 51.54% of the area, respectively. The chloride-type soils were primarily distributed along the coastline, whereas sulfate-chloride-type soils were mostly found farther inland. The chloride-sulfate type soils comprised only 1.77% of the area and appeared in scattered, localized patches. These findings indicated that chloride was the dominant salt component in the soils of the study area.

3.1.3. Zoning of Soil Salinization Degree

The detailed distribution of soil salinization degrees is presented in Figure 3 and Table 6. The spatial distribution revealed that the most severely salinized soils were concentrated in the coastal lowlands of the north and east, accounting for 19.73% (extremely severe) and 16.25% (severe) of the total area, respectively. Moderately salinization soils represented the largest proportion, at 45.35%, and were mainly distributed in the inland regions. An area comprising 18.06% was characterized by mild salinization, with these soils predominantly located in the southern and central regions. Areas with no-salinization soils were scattered throughout the study area, comprising only 0.61% of the total.

3.2. Hydrochemical Characteristics

3.2.1. Piper Diagram

The Piper diagram illustrates the hydrochemical composition of water samples by displaying ion proportions [37] and can illustrate the primary ionic composition of a water body [38]. The Piper diagram for groundwater in the Yellow River Delta region is shown in Figure 4. Cations were predominantly Na+, while anions were mainly Cl. The water chemistry type was relatively stable. According to the classification of water chemistry types, the Cl-Ca type was the dominant water chemistry type, representing a transition from freshwater to saltwater, followed by the Cl-Na type, which was characteristic of seawater. Therefore, the groundwater chemical types in most areas were in the transitional stage from freshwater to saltwater, with a few areas already classified as saltwater. This indicated that the entire study area was affected by seawater intrusion, with some areas experiencing more severe impacts. When groundwater was influenced by seawater, large amounts of Na+ and Cl ions were introduced into the groundwater and subsequently into the soil, increasing the risk of soil salinization.

3.2.2. Gibbs Diagram

The Gibbs diagram utilizes the relationship between TDS and the ratio of cation mass concentration (Na+/(Na+ + Ca2+)) and the relationship between TDS and the ratio of anion mass concentration (Cl/(Cl + HCO3)) [39] to macroscopically reflect the main ion control factors in water: atmospheric precipitation, rock weathering, and evaporation–crystallization [40,41].
Figure 5 presents the Gibbs diagram of groundwater in the Yellow River Delta region. At most sampling points, the ratio of cation to anion mass concentration exceeded 0.5, with total dissolved solids (TDS) ranging from 166 to 9604 mg/L. Approximately half of the sampling points fell within the Gibbs model, located in the upper right section of the diagram. The chemistry of shallow groundwater in the Yellow River Delta was primarily influenced by oceanic factors, indicating evaporation and concentration following seawater intrusion. As the groundwater evaporated and became more concentrated, it brought salts to the surface, thereby playing a significant role in soil salinization. However, about half of the sampling points fell outside the Gibbs model, exhibiting a relatively high cation-to-anion mass concentration ratio (>0.8) but relatively low TDS (<1000 mg/L). This suggested that these groundwater samples were influenced not only by seawater intrusion but also by other factors, such as recharged from the Yellow River or atmospheric precipitation.

3.3. Influencing Factors Analysis and Risk Assessment of Soil Salinization

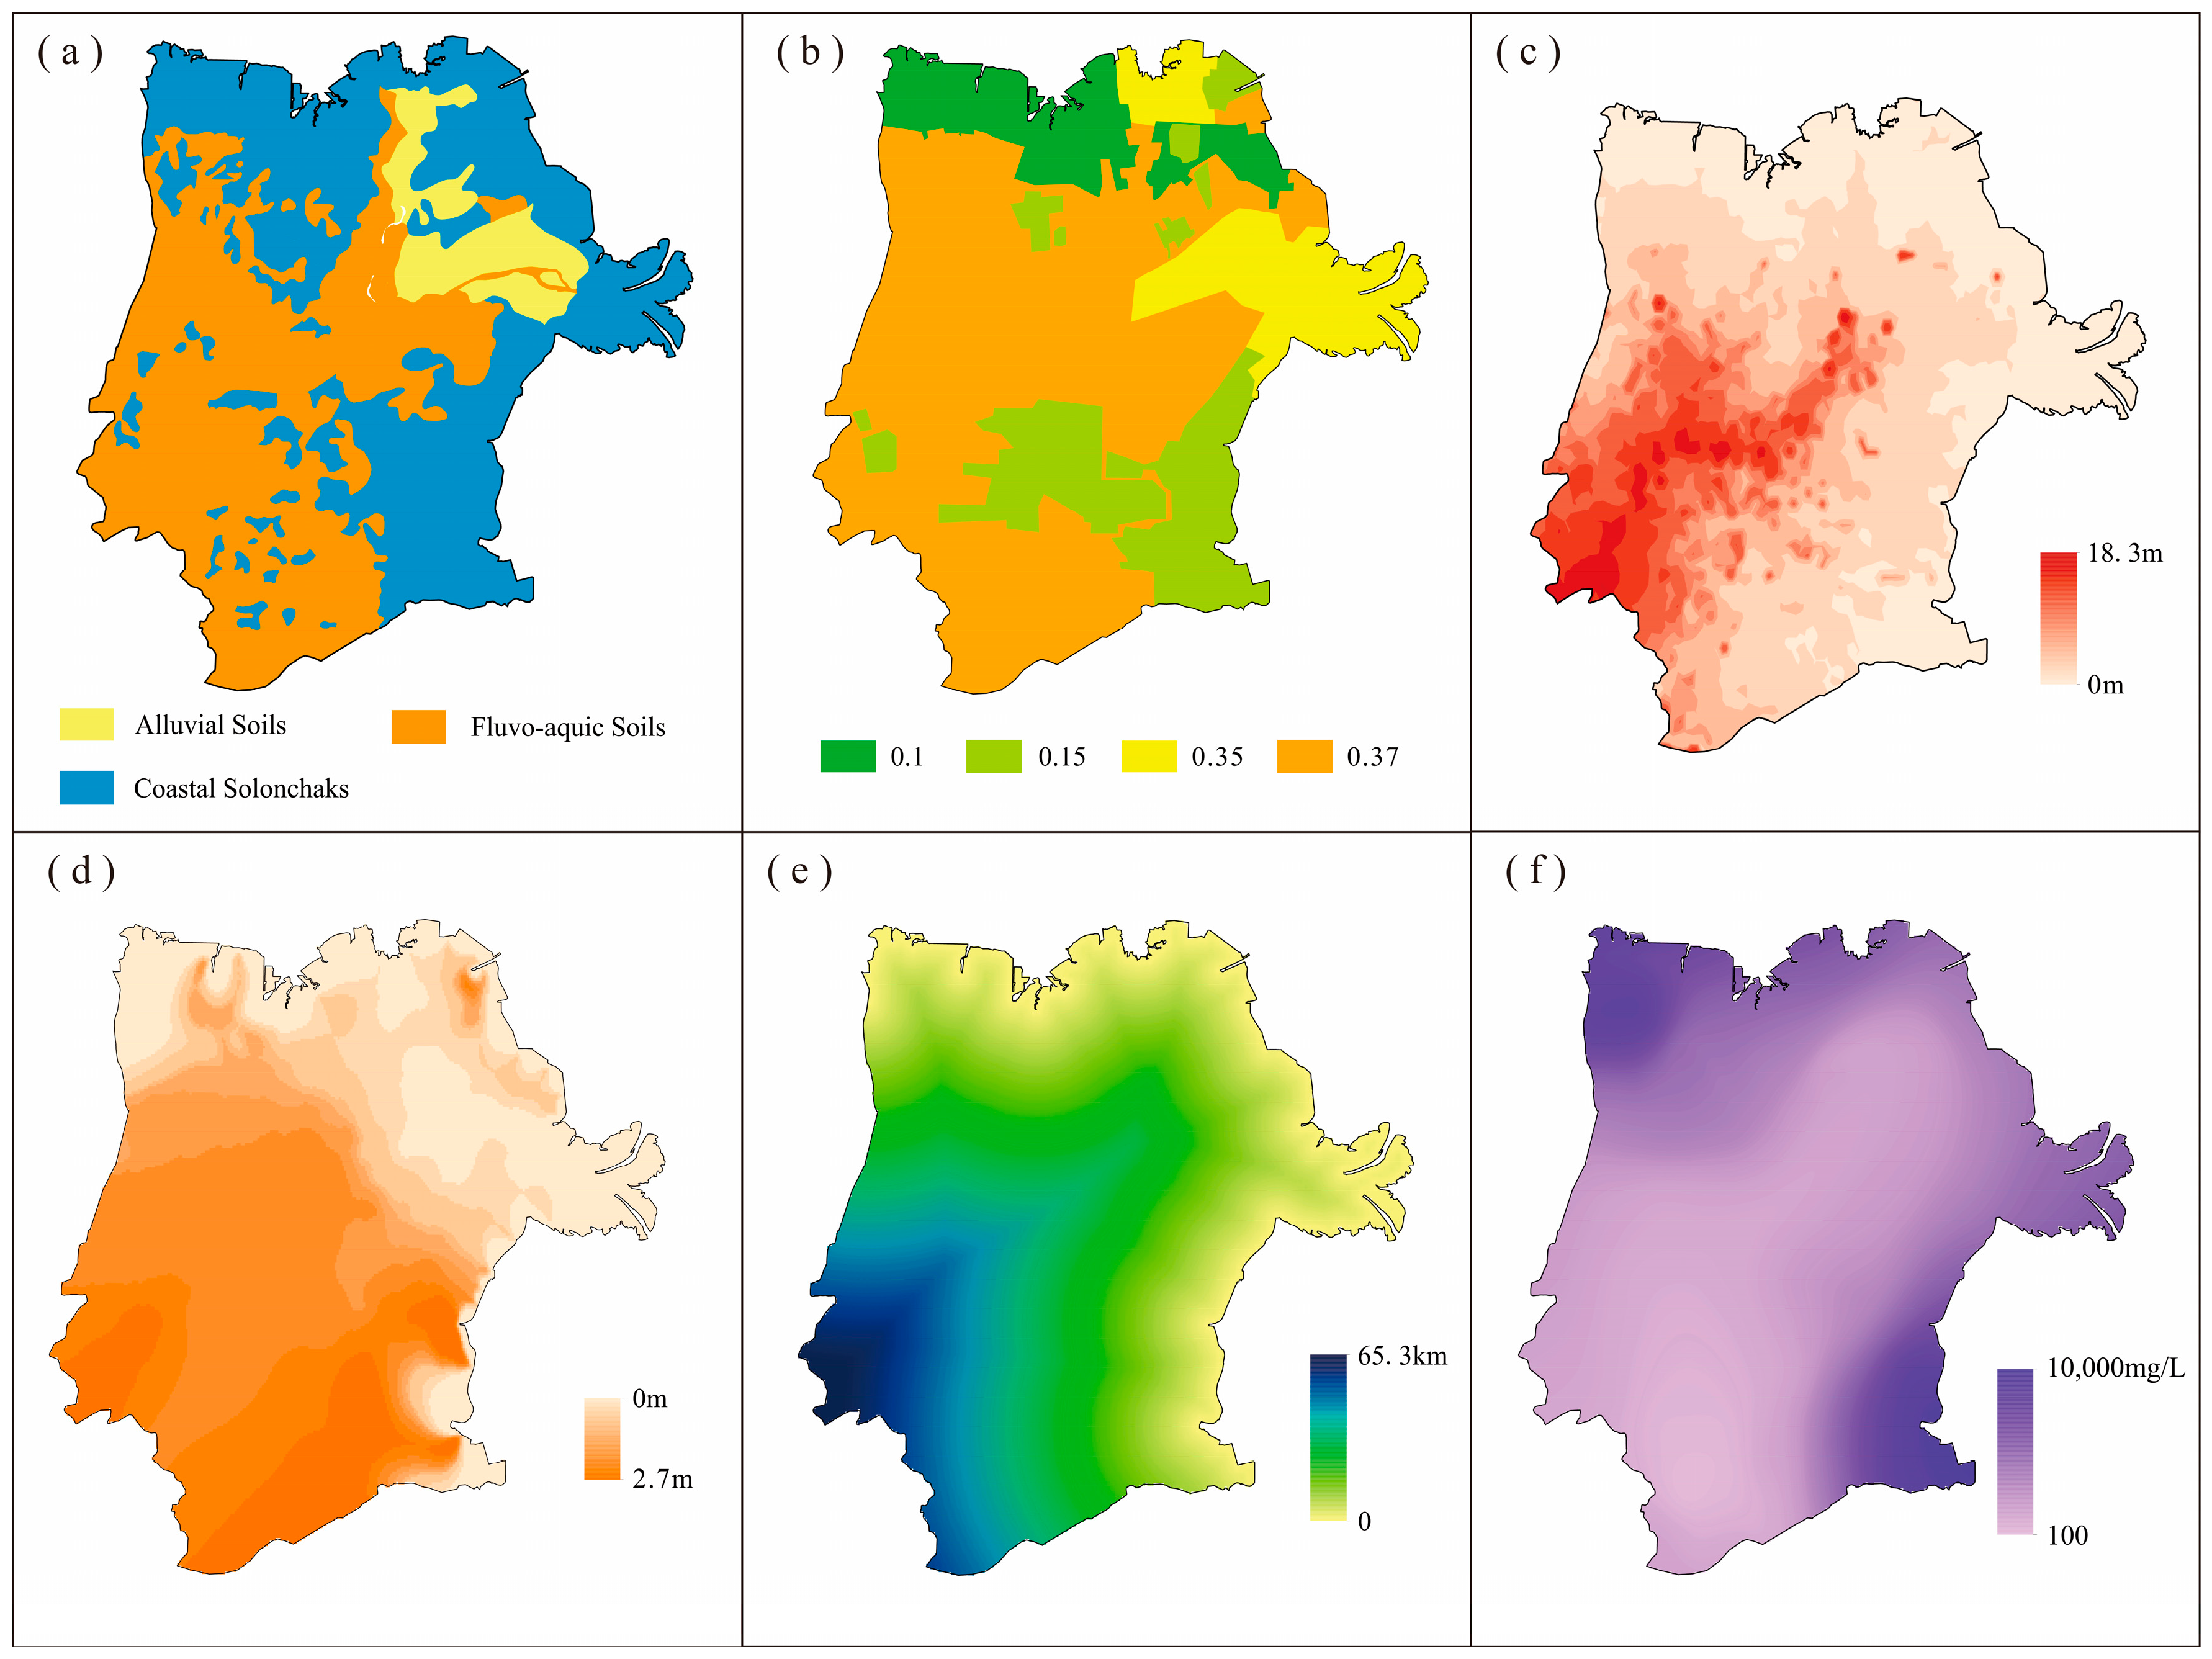
The selection of soil salinization risk assessment indicators was based on the specific environmental attributes of the Yellow River Delta region. Six factors influencing soil salinization risk were chosen as independent variables: digital elevation model (DEM), soil type (ST), distance from the Bohai Sea (Dis), groundwater depth (Dep), evaporation coefficient (ET), and total dissolved solids (TDS). Soil salt content (SSC) was selected as the dependent variable to construct a salinization risk assessment index system. The specific conditions of each evaluation factor are illustrated in Figure 6.

3.3.1. Analysis of Influencing Factors of Soil Salt Content

By combining the advantages of the correlation coefficient method and the factor detection method, the comprehensive weights of each influencing factor were determined.
Correlation analysis was conducted on SSC, ST, Dis, DEM, Dep, TDS, and ET to examine the relationships between each influencing factor and the current status of soil salinization. The results (Table 7) revealed generally strong correlations, both positive and negative, among the various indicators. Specifically, SSC was positively correlated with TDS, ST, DEM, Dep, Dis, and ET. When considering the absolute values of the correlations with SSC, the influencing factors ranked from strongest to weakest were Dis > ST > DEM > TDS > ET > Dep.
Then the factor detection method was carried out. Using SSC as the dependent variable and DEM, Dep, Dis, ET, ST, and TDS as independent variables, the influence of each independent variable on SSC was determined (denoted as q). According to the analysis results (Table 7), Dis and TDS had the greatest influence on SSC, with q values of 0.929 and 0.863, respectively. The influence values, ranked from largest to smallest, were Dis > TDS > DEM > Dep > ST > ET.
Based on the results of both correlation and influence analyses, the comprehensive weights of each dependent variable were calculated. According to the results (Table 7), the influence of each factor on soil salinity, ranked from greatest to least, was Dis > TDS > DEM > ST > Dep > ET.

3.3.2. Risk Assessment of Soil Salinization in the Yellow River Delta Region

Based on the results of the above analysis, a risk assessment of soil salinization was conducted in the Yellow River Delta region. As shown in Figure 7 and Table 8, the high-risk soil salinization zone was the largest area, distributed along the shoreline and accounting for 32.67% of the total region. The medium-high risk, medium risk, and medium-low risk zones each covered approximately 20% of the area. The low-risk zone was the smallest, comprising only 4.69%. Distance from the Bohai Sea was identified as the most significant influencing factor. It was clearly demonstrated that the closer the area is to the Bohai Sea, the higher the risk of soil salinization; conversely, the farther from the Bohai Sea, the lower the risk. This indicated that seawater intrusion was the primary driver of soil salinization in the Yellow River Delta region. The combined area of high-risk and medium–high risk zones accounted for more than 52% of the total. Therefore, it is recommended to strengthen monitoring of soil salt content in the Yellow River Delta and implement appropriate measures to control soil salinization.

4. Discussion

The findings of this study confirm that seawater intrusion is the primary driver of soil salinization in the research area. This process begins within the groundwater system: seawater intrusion initially increases groundwater salinity, shifting it toward brackish water [42]. Subsequently, through evaporative concentration, highly mineralized groundwater moves upward via capillary action, transporting dissolved salts to the soil surface, where they accumulate [43]. This mechanism effectively explains the predominance of sodium and chloride ions and the generally high salt content observed in the area’s soils. Typically, regions experiencing more severe seawater intrusion exhibit higher groundwater salinity, which in turn leads to elevated levels of sodium and chloride ions in the soil.
Zonation results of soil salinization types and degrees further support this conclusion. In the Yellow River Delta, the spatial distribution of extremely and severely salinized soils closely corresponds with that of chloride-type saline soils, which are predominantly found in coastal zones. This spatial consistency indicates that seawater intrusion is the primary factor controlling both the type and severity of soil salinization in the study area, fully aligning with the initial research hypothesis.
It is important to note that the risk of soil salinization is influenced by multiple interacting factors [44]. This study identified key variables, including soil type, distance from the Bohai Sea, surface elevation, groundwater depth, groundwater mineralization, and surface evapotranspiration coefficient. Among these, distance from the Bohai Sea and groundwater mineralization (TDS) emerged as the most significant factors, both directly linked to the intensity of seawater intrusion. Coastal areas, characterized by low-lying topography (near sea level) and shallow groundwater tables, are more susceptible to seawater influence. The continuous upward movement of salts through evaporation from mineralized groundwater leads to the formation of typical coastal saline soils, significantly increasing the risk of soil salinization.
Risk assessment results indicate that long-term seawater intrusion has impacted the Yellow River Delta, with high-risk and moderately high-risk zones together comprising more than 52% of the area. It is recommended to strengthen monitoring of soil salinity dynamics and implement targeted measures—such as regulating groundwater levels and optimizing vegetation cover—to inhibit salt migration to the surface and effectively control soil salinization.

5. Conclusions

(1)
The average salt content in the soil of the Yellow River Delta region was 4.59 g/kg, indicating a relatively high salinity overall. The dominant cation in the soil was Na+, comprising 71.03% of the total cation concentration, while the dominant anion was Cl, accounting for 72.97% of the total anion concentration. The primary types of soil salinization were chloride type and sulfate-chloride type in the study area, representing 46.69% and 51.54% of the total area, respectively. The degree of soil salinization was predominantly moderate, accounting for 45.35% of the area. Extremely severe salinization and severe salinization were mainly distributed in the coastal lowlands in the northern and eastern parts of this region, covering 19.73% and 16.25% of the area, respectively.
(2)
The results of the Piper and Gibbs diagrams indicated that the groundwater chemical types in most areas of the Yellow River Delta were in a transitional stage between freshwater and saltwater, while a few areas had already become saline. This suggested that the entire study area had been affected by seawater intrusion, with some areas experiencing more severe impacts. Therefore, seawater intrusion in this region was a significant factor contributing to the increased salt content in the soil and played a crucial role in soil salinization.
(3)
Based on the results of both correlation and influence analyses, the factors affecting soil salt content in the Yellow River Delta region, ranked from greatest to least impact, were: Dis > TDS > DEM > ST > Dep > ET. These findings indicated that the primary cause of soil salinization in the Yellow River Delta was seawater intrusion.
(4)
The results of the risk assessment for soil salinization in the Yellow River Delta region indicated that areas with high risk and medium–high risk accounted for a significant proportion, exceeding 52%. The distance from the Bohai Sea was the most influential factor, demonstrating a clear trend: the closer the area was to the Bohai Sea, the higher the risk of soil salinization. It is recommended to enhance the monitoring of soil salt content in the Yellow River Delta region and implement appropriate measures to control soil salinization.
(5)
All these findings above can provide valuable references for local wetland management and protection, the scientific enhancement of saline soils, rational soil utilization, effective prevention and control of soil salinization, and the sustainable development of water and soil resources.

Author Contributions

Conceptualization, L.Z., L.K. and X.Z.; Formal analysis, L.Z., X.H., Z.Z., Y.L., B.G., M.Z. and H.W.; Funding acquisition, L.K., B.L., Y.W., S.L. and Q.M.; Investigation, L.Z., X.H., Z.Z., Y.L., B.G., M.Z., H.W., K.S. and Y.Z.; Methodology, L.Z., L.K. and X.Z.; Project administration, L.K., X.Z. and Y.W.; Supervision, L.K. and Y.W.; Visualization, L.K., X.Z. and Y.W.; Writing—original draft, L.Z., L.K., X.Z. and Z.Z.; Writing—review and editing, L.Z., L.K., X.Z. and B.L. All authors have read and agreed to the published version of the manuscript.

Funding

This work was funded by the Open Research Fund of Observation and Research Station of Seawater Intrusion and Soil Salinization, Laizhou Bay, Ministry of Natural Resources (2024LZORS003) and the Geological Survey Programs of the People’s Republic of China (DD20230511, DD20251300107, DD20230701308, and DD20242687).

Data Availability Statement

According to the regulations of the authors’ institution, the data used in the paper must be shared upon application. Requests to access the datasets should be directed to the corresponding author, Linghao Kong.

Conflicts of Interest

The authors declare no conflicts of interest.

References

  1. Khadija, Z.; Latifa, M.; Abdelaziz, M.; Khattabi, R.S.; Ilham, N.; Salah, S. Soil metal pollution in freeway traffic (Mohammedia-Bouznika section, Morocco). Int. J. Environ. Sci. Technol. 2025, 22, 1385–1402. [Google Scholar] [CrossRef]
  2. Wu, J.; Li, P.; Qian, H.; Fang, Y. Assessment of soil salinization based on a low-cost method and its influencing factors in a semiarid agricultural area, northwest China. Environ. Earth Sci. 2014, 71, 3465–3475. [Google Scholar] [CrossRef]
  3. Li, D.; Wu, W.; Zhu, H.; Guo, W.; Liu, Y.; Li, N. Complex Resistivity Dispersion for Monitoring Soil Contaminated by Selected Organic Pollutants. Environ. Res. 2025, 279, 121756. [Google Scholar] [CrossRef] [PubMed]
  4. Fang, S.; Hua, C.; Yang, J.; Liu, F.; Wang, L.; Wu, D.; Ren, L. Combined pollution of soil by heavy metals, microplastics, and pesticides: Mechanisms and anthropogenic drivers. J. Hazard. Mater. 2025, 485, 136812. [Google Scholar] [CrossRef]
  5. Hou, D.; Jia, X.; Wang, L.; McGrath, S.P.; Zhu, Y.; Hu, Q.; Zhao, F.; Bank, M.S.; O’Connor, D.; Nriagu, J. Global soil pollution by toxic metals threatens agriculture and human health. Science 2025, 388, 316–321. [Google Scholar] [CrossRef]
  6. Yu, Y.; Liu, Y.; Zhao, Z.; Cui, H. An Auxiliary Method for Evaluating Soil Erosion and Pollution by Magnetic Susceptibility on Black Soil Farmland. Water Air Soil Pollut. 2025, 236, 1–14. [Google Scholar] [CrossRef]
  7. Shrivastava, P.; Kumar, R. Soil salinity: A serious environmental issue and plant growth promoting bacteria as one of the tools for its alleviation. Saudi J. Biol. Sci. 2015, 22, 123–131. [Google Scholar] [CrossRef] [PubMed]
  8. Song, Y.; Sun, J.; Cai, M.; Li, J.; Bi, M.; Gao, M. Effects of management of plastic and straw mulching management on crop yield and soil salinity in saline-alkaline soils of China: A meta-analysis. Agric. Water Manag. 2025, 308, 109309. [Google Scholar] [CrossRef]
  9. Xiao, Y.; Zhao, G.; Li, T.; Zhou, X.; Li, J. Soil salinization of cultivated land in Shandong Province, China-Dynamics during the past 40 years. Land Degrad. Dev. 2019, 30, 426–436. [Google Scholar] [CrossRef]
  10. Anna, O.C.; Jin, L. Chemical and hydrological controls on salt accumulation in irrigated soils of southwestern US. Geoderma 2021, 391, 114976. [Google Scholar] [CrossRef]
  11. Mao, J.; Wu, J.; Liu, Y.; Guo, C.; Xiao, C.; Lu, Y.; Zhao, L.; Zhang, R.; Zhang, H. A model for simulating evaporation from seasonally frozen saline soil. J. Hydrol. 2025, 659, 133259. [Google Scholar] [CrossRef]
  12. Feng, H.; Xing, X.; Xing, J.; Du, J.; Li, D. Performance and modeling of infiltration flow in cracked saline soils. J. Hydrol. 2025, 656, 133054. [Google Scholar] [CrossRef]
  13. Xie, X.; Pu, L.; Zhu, M.; Xu, Y.; Wang, X. Linkage between soil salinization indicators and physicochemical properties in a long-term intensive agricultural coastal reclamation area, Eastern China. J. Soils Sediments 2019, 19, 3699–3707. [Google Scholar] [CrossRef]
  14. Wang, Y.; Deng, C.; Liu, Y.; Niu, Z.; Li, Y. Identifying change in spatial accumulation of soil salinity in an inland river watershed, China. Sci. Total Environ. 2018, 621, 177–185. [Google Scholar] [CrossRef]
  15. Ajay, S. Soil salinization management for sustainable development: A review. J. Environ. Manag. 2021, 277, 111383. [Google Scholar] [CrossRef]
  16. Xia, J.; Ren, J.; Zhang, S.; Wang, Y.; Fang, Y. Forest and grass composite patterns improve the soil quality in the coastal saline-alkali land of the Yellow River Delta, China. Geoderma 2019, 349, 25–35. [Google Scholar] [CrossRef]
  17. Miao, Q.; Wu, S.; Li, J.; Zhang, J.; Wang, Y.; Wu, G.; Sun, Y.; Ying, H.; Cui, Z. Productivity of saline soils can be improved by integrating soil–crop system management. Eur. J. Agron. 2025, 168, 127618. [Google Scholar] [CrossRef]
  18. Song, Y.; Gao, M.; Li, Z. Impacts of straw return methods on crop yield, soil organic matter, and salinity in saline-alkali land in North China. Field Crops Res. 2025, 322, 109752. [Google Scholar] [CrossRef]
  19. Zhang, Y.; Hou, K.; Qian, H.; Gao, Y.; Fang, Y.; Xiao, S.; Tang, S.; Zhang, Q.; Qu, W.; Ren, W. Characterization of soil salinization and its driving factors in a typical irrigation area of northwest China. Sci. Total Environ. 2022, 837, 155808. [Google Scholar] [CrossRef]
  20. Yang, J.; Zhao, J.; Mao, X.; Zhang, Y.; Hu, F. Applicability analysis of weakly supervised semantic segmentation for identifying salinized soil boundaries. J. Arid. Environ. 2025, 229, 105372. [Google Scholar] [CrossRef]
  21. Wu, C.; Du, X.; Meng, B.; Guo, H. Characteristics and mechanisms of soil salinization in humid climate areas. J. Hydrol. Reg. Stud. 2025, 60, 102607. [Google Scholar] [CrossRef]
  22. Thangarasu, T.; Mengash, H.A.; Allafi, R.; Mahgoub, H. Spatial prediction of soil salinity: Remote sensing and machine learning approach. J. South Am. Earth Sci. 2025, 156, 105440. [Google Scholar] [CrossRef]
  23. Rath, K.M.; Fierer, N.; Murphy, D.V.; Rousk, J. Linking bacterial community composition to soil salinity along environmental gradients. ISME J. 2018, 13, 836–846. [Google Scholar] [CrossRef] [PubMed]
  24. Zhu, H.; Yang, J.; Li, Y.; Liu, X.; Jin, H.; Li, J.; Yao, R. Effects of Soil Salinity on Nitrification and Ammonia-Oxidizing Microorganisms in Coastal Reclaimed Farmland Soil. J. Soil Sci. Plant Nutr. 2022, 22, 2743–2754. [Google Scholar] [CrossRef]
  25. Sliti, A.; Singh, V.; Pande, A.; Shin, J.-H. Soil holobiont interplay and its role in protecting plants against salinity stress. Pedosphere 2025, 35, 97–115. [Google Scholar] [CrossRef]
  26. Wang, J.; Ding, J.; Wang, Y.; Ge, X.; Lizaga, I.; Chen, X. Soil salinization in drylands: Measure, monitor, and manage. Ecol. Indic. 2025, 175, 113608. [Google Scholar] [CrossRef]
  27. Gharemahmudli, S.; Sadeghi, S.H. Inhibiting soil and water loss in a saline soil through cyanobacterization. Soil Tillage Res. 2025, 248, 106446. [Google Scholar] [CrossRef]
  28. Mai, Z.; Niu, Z.; Zhao, Y.; Li, P.; Wang, Y.; Lv, Y.; Wang, B.; Zhang, M. Land use and cover change significantly enhanced evapotranspiration in the Yellow River Delta from 2000 to 2023. J. Hydrol. Reg. Stud. 2025, 58, 102220. [Google Scholar] [CrossRef]
  29. Bian, L.; Wang, J.; Liu, J.; Han, B. Spatiotemporal Changes of Soil Salinization in the Yellow River Delta of China from 2015 to 2019. Sustainability 2021, 13, 822. [Google Scholar] [CrossRef]
  30. Fang, X.; Liu, Z.; Li, J.; Lai, J.; Gong, H.; Sun, Z.; Ouyang, Z.; Dou, W.; Fa, K. Non-Synergistic Changes in Migration Processes between Soil Salt and Water in the Salt Patch of the Coastal Saline Soil. Agronomy 2023, 13, 2403. [Google Scholar] [CrossRef]
  31. HY/T 0320-2021; National Technical Committee 283 on Ocean of Standardization Administration of China. Code of Practice for Coastal Soil Salinization Monitoring and Evaluation. Ministry of Natural Resources of the People’s Republic of China: Beijing, China, 2021.
  32. HJ 964-2018; Ministry of Ecological Environment. Technical Guidelines for Environmental Impact Assessment-Soil Environment (Trial). China Environmental Science Press: Beijing, China, 2018.
  33. Zhou, D.; Lin, Z.; Liu, L.; Zimmermann, D. Assessing secondary soil salinization risk based on the PSR sustainability framework. J. Environ. Manag. 2013, 128, 642–654. [Google Scholar] [CrossRef]
  34. Wang, Z.; Zhang, F.; Zhang, X.; Chan, N.W.; Kung, H.-T.; Zhou, X.; Wang, Y. Quantitative Evaluation of Spatial and Temporal Variation of Soil Salinization Risk Using GIS-Based Geostatistical Method. Remote Sens. 2020, 12, 2405. [Google Scholar] [CrossRef]
  35. Hou, J.; Rusuli, Y. Assessment of Soil Salinization Risk by Remote Sensing-Based Ecological Index (RSEI) in the Bosten Lake Watershed, Xinjiang in Northwest China. Sustainability 2022, 14, 7118. [Google Scholar] [CrossRef]
  36. Zhao, L.; Wang, Z.; Kong, L.; Zhao, Z.; Geng, B.; Gu, S.; Li, Y.; Han, X.; Liu, S.; Li, B.; et al. Risk assessment of soil heavy metals in mining activity areas: A case study in Eastern Shandong Province, China. Environ. Earth Sci. 2023, 82, 513. [Google Scholar] [CrossRef]
  37. Piper, A.M. A graphic procedure in the geochemical interpretation of water-analyses. Eos Trans. Am. Geophys. Union 1944, 25, 914–928. [Google Scholar]
  38. Liu, J.; Gao, Z.; Wang, Z.; Xu, X.; Su, Q.; Wang, S.; Qu, W.; Xing, T. Hydrogeochemical processes and suitability assessment of groundwater in the Jiaodong Peninsula, China. Environ. Monit. Assess. 2020, 192, 1–17. [Google Scholar] [CrossRef]
  39. Gibbs, R.J. Mechanisms controlling world water chemistry. Science 1970, 170, 1088–1090. [Google Scholar] [CrossRef] [PubMed]
  40. Kong, L.; Chu, H.; Hou, G.; Zeng, J.; Zhao, L.; Han, X.; Li, Y.; Zhou, F.; Yin, M.; Zhang, X. Characteristics and mechanisms of sea (salt) water intrusion in Laizhou City, Shandong Province, China. Front. Mar. Sci. 2025, 12, 1578175. [Google Scholar] [CrossRef]
  41. Zhao, L.; Geng, B.; Zhao, M.; Li, B.; Miao, Q.; Liu, S.; Zhao, Z.; Wang, H.; Li, Y.; Jin, W.; et al. Evaluation of Groundwater Quality and Health Risk Assessment During the Dry Season in the Xin’an River Basin, China. Water 2025, 17, 2412. [Google Scholar] [CrossRef]
  42. Arslan, H.; Demir, Y. Impacts of seawater intrusion on soil salinity and alkalinity in Bafra Plain, Turkey. Environ. Monit. Assess. 2013, 185, 1027–1040. [Google Scholar] [CrossRef] [PubMed]
  43. Cui, G.; Liu, Y.; Li, X.; Wang, S.; Qu, X.; Wang, L.; Tong, S.; Zhang, M.; Li, X.; Zhang, W. Impacts of groundwater storage variability on soil salinization in a semi-arid agricultural plain. Geoderma 2025, 454, 117162. [Google Scholar] [CrossRef]
  44. Wang, H.; Wang, Z.; Bai, Y.; Wan, W.; Wang, W.; Wang, K. Risk assessment method for soil secondary salinization based on hydrological frequency analysis. Ecol. Indic. 2025, 176, 113688. [Google Scholar] [CrossRef]
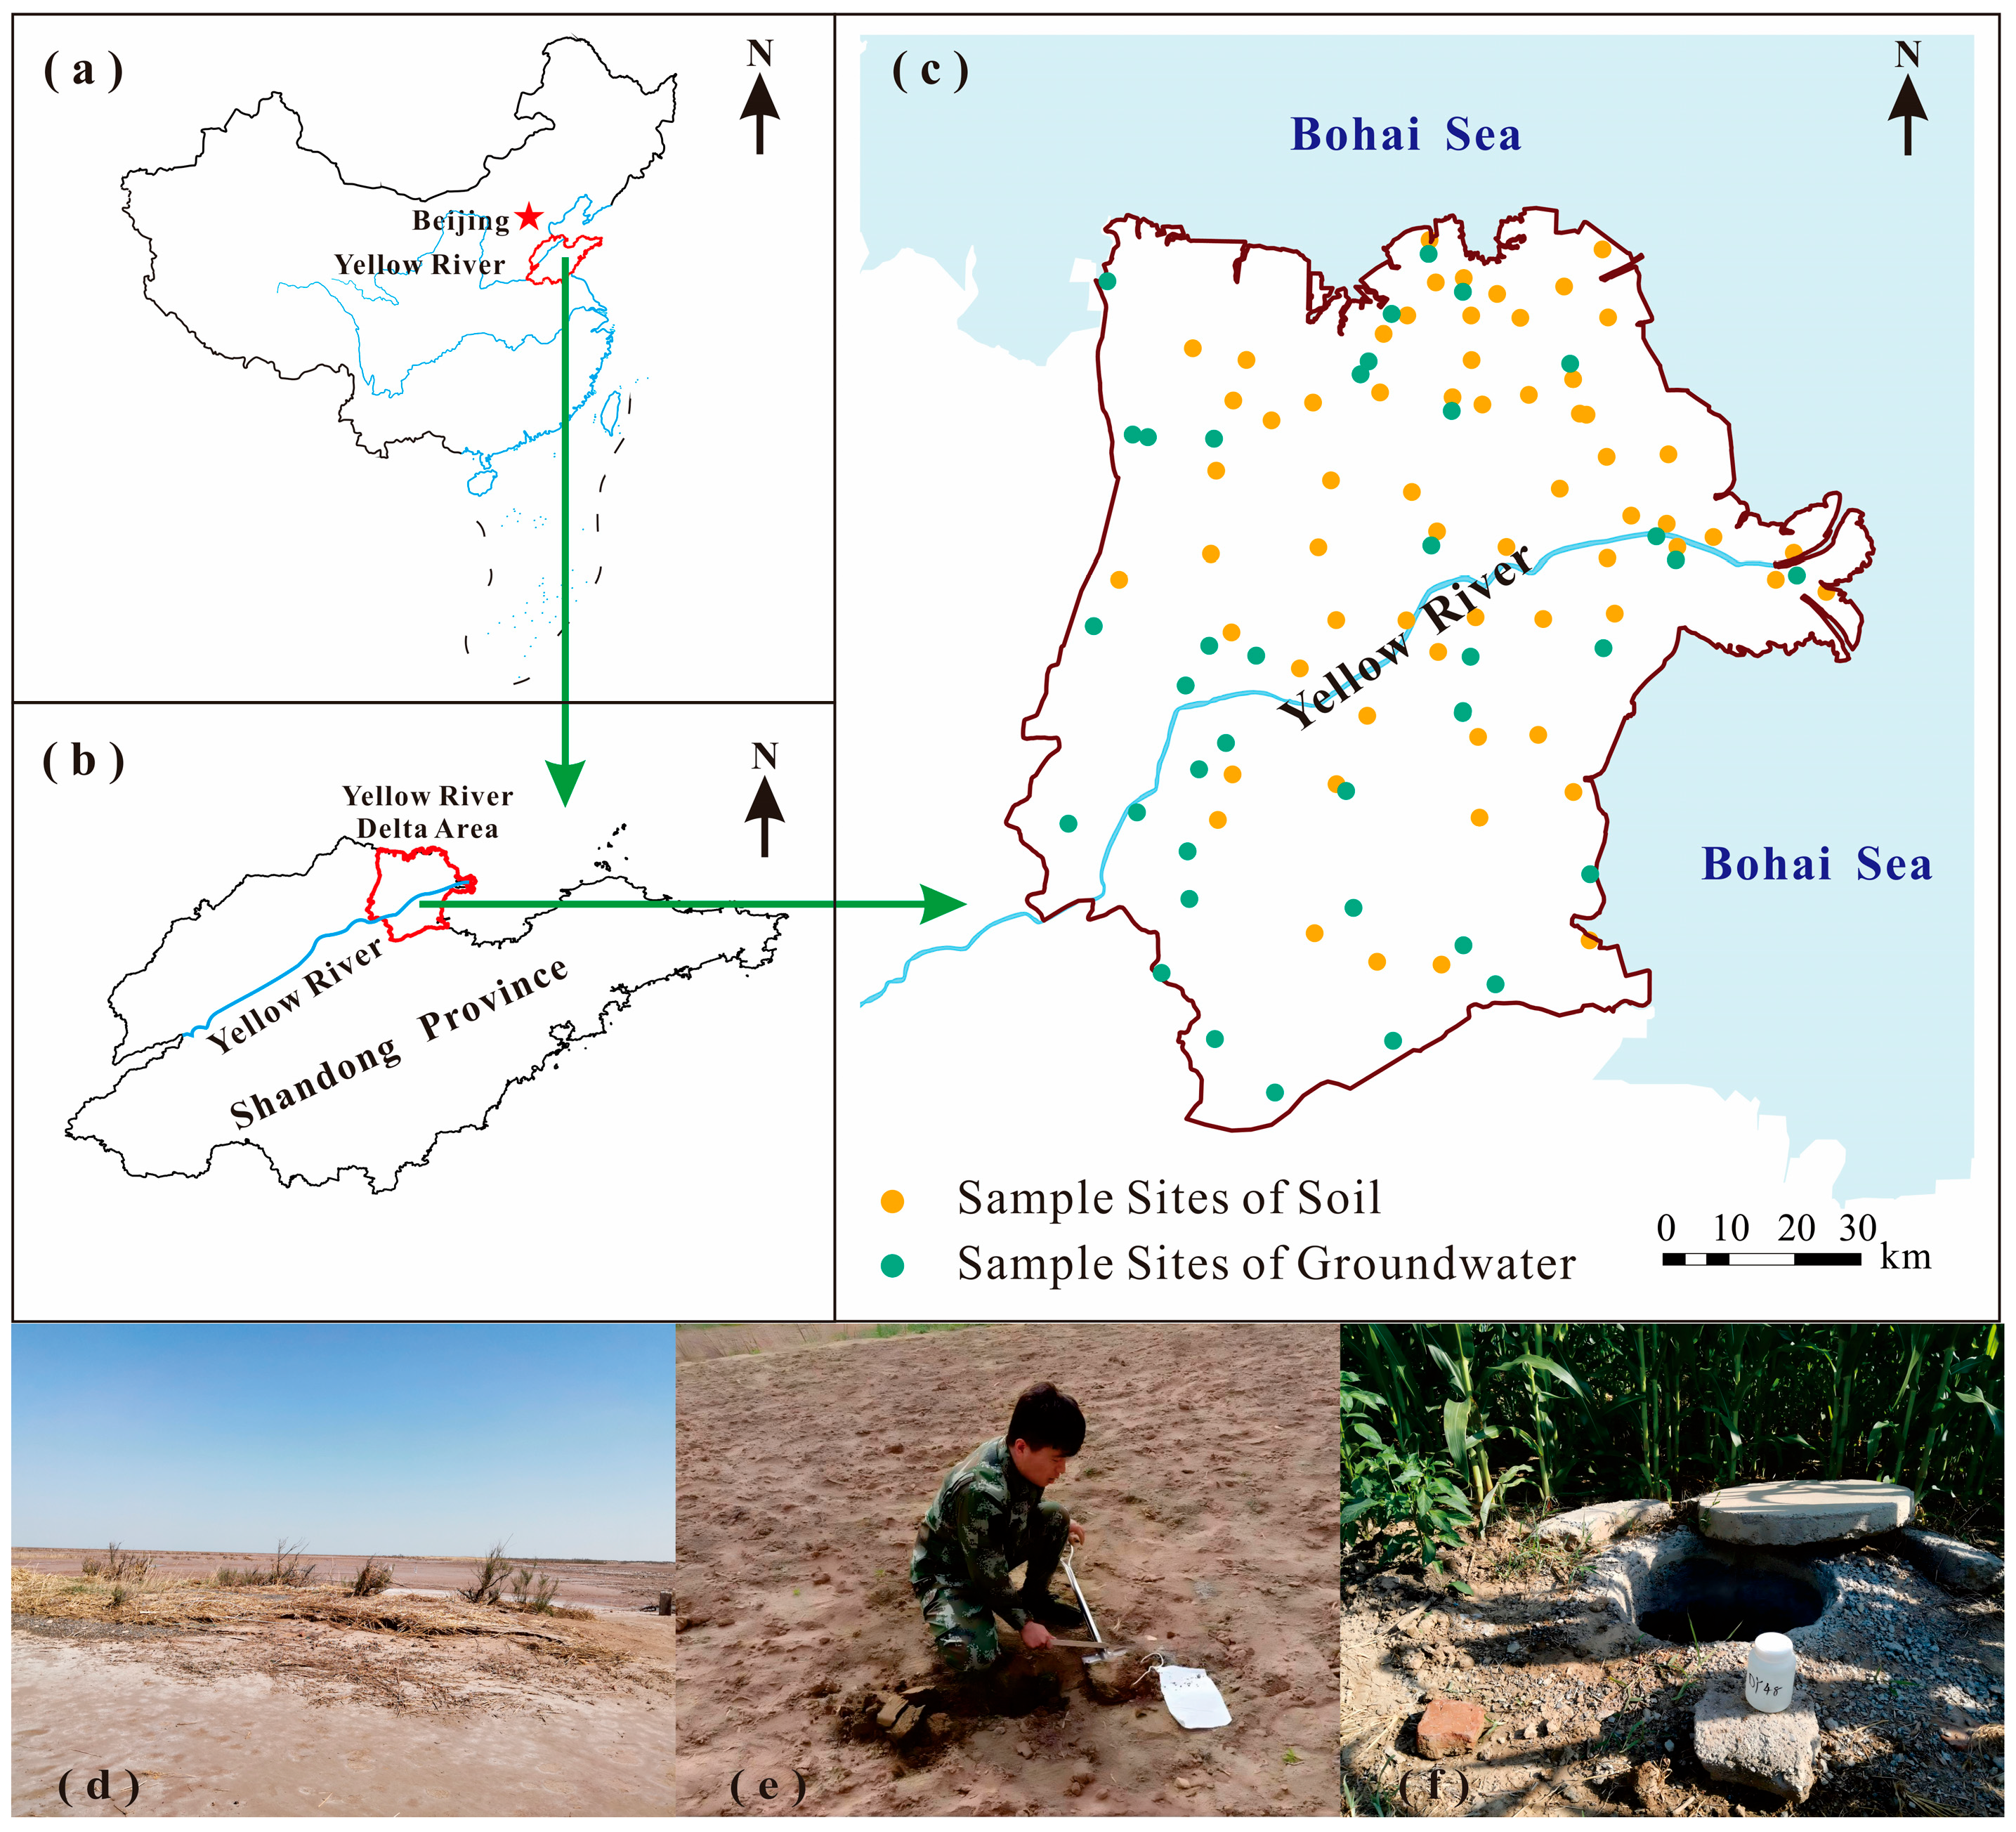
Figure 1. Map of the Yellow River Delta region. (a) Map of China; (b) Location of the Yellow River Delta region; (c) Distribution map of the sample sites; (d) The saline-alkali land of the Yellow River Delta; (e) Collection of soil samples; (f) Collection of groundwater samples.
Water 17 02920 g001
Figure 2. Zoning of soil salinization types.
Water 17 02920 g002
Figure 3. Zoning of soil salinization degree.
Water 17 02920 g003
Figure 4. Piper diagram of groundwater in the Yellow River Delta region.
Water 17 02920 g004
Figure 5. Gibbs Diagram of Groundwater in the Yellow River Delta region. (a) The relationship between TDS and Na+/(Na+ + Ca2+). (b) The relationship between TDS and Cl/(Cl + HCO3).
Water 17 02920 g005
Figure 6. Influencing factors of soil salinization. (a) Soil type; (b) Evaporation coefficient; (c) Digital elevation; (d) Depth of groundwater; (e) Distance from the Bohai Sea; (f) Total dissolved solids.
Water 17 02920 g006
Figure 7. Risk Assessment of soil salinization in the Yellow River Delta Region.
Water 17 02920 g007
Table 1. Classification of Soil Salinization Types.
Types of Soil SalinizationCl/SO42−
Sulfate type (SO42−)<0.5
Chloride-sulfate type (Cl-SO42−)0.5–1.0
Sulfate-chloride type (SO42−-Cl)1.0–4.0
Chloride type (Cl)>4.0
Table 2. Classification of Soil Salinization Degree.
Soil Salinization DegreeSoil Salt Content (SSC)/(g/kg)
No salinizationSSC < 1
Mild salinization1 ≤ SSC < 2
Moderate salinization2 ≤ SSC < 4
Severe salinization4 ≤ SSC < 6
Extremely severe salinizationSSC ≥ 6
Table 3. Classification of Soil Salinization Risk Levels.
Risk of Soil SalinizationComprehensive Evaluation Index
High risk C R ≥ 0.7
Medium–high risk0.5 ≤ C R < 0.7
Medium risk0.3 ≤ C R < 0.5
Medium–low risk0.1 ≤ C R < 0.3
Low risk C R < 0.1
Table 4. Descriptive Statistics of Salt Content in Surface Soil.
Unit: g/kg
MinMaxAverageStdevCV
Ca2+0.001 1.55 0.23 0.32 137.53%
HCO30.118 0.56 0.26 0.10 40.00%
K+0.005 0.34 0.06 0.07 124.88%
Mg2+0.001 1.74 0.19 0.32 168.71%
Na+0.010 5.11 1.18 1.35 114.53%
SO42−0.021 4.40 0.50 0.63 125.68%
Cl0.128 6.97 2.05 1.95 94.79%
SSC0.497 14.97 4.59 3.80 82.89%
Table 5. Classification of Soil Salinization Types in the Yellow River Delta Region.
Soil Salinization TypesArea (km2)Proportion (%)
Chloride type3277.3046.69%
Sulfate-chloride type (SO42−-Cl)3617.7251.54%
Chloride-sulfate type (Cl-SO42−)124.231.77%
Table 6. Area and proportion of soil salinization types.
Degree of Soil SalinizationArea (km2)Proportion (%)
No salinization43.100.61%
Mild salinization1268.3318.06%
Moderate salinization3183.8845.35%
Severe salinization1141.0216.25%
Extremely severe salinization1385.4019.73%
Table 7. Weights of each soil salinization influencing factor.
Influencing
Factors
Correlation
Index
WeightsqWeightsComprehensive WeightsRank
Dis−0.5510.220.9290.290.261
TDS0.3660.150.8630.270.212
Dem−0.4450.180.6460.200.193
ST0.4670.190.2180.070.134
Dep−0.2730.110.4210.130.125
ET−0.3490.140.1390.040.096
Table 8. Results of soil salinization risk assessment.
Risk of Soil SalinizationArea (km2)Proportion (%)
High risk2293.1032.67%
Medium–high risk1362.8319.42%
Medium risk1433.3320.42%
Medium–low risk1600.5822.80%
Low risk329.414.69%
Disclaimer/Publisher’s Note: The statements, opinions and data contained in all publications are solely those of the individual author(s) and contributor(s) and not of MDPI and/or the editor(s). MDPI and/or the editor(s) disclaim responsibility for any injury to people or property resulting from any ideas, methods, instructions or products referred to in the content.