Abstract
Due to the intense human activities and rapid development of economy, dissolved heavy metals (DHMs) pose a significant threat to urban river ecosystems. Therefore, the distribution, sources, and potential risks of DHMs in the Chaobai River (typical urban river) were investigated via ICP-MS in detail. Results revealed considerable spatial heterogeneity of heavy metals with various concentrations from the upper to lower reach. Principal component analysis (PCA) revealed that V, Ni, As, Mo, and Pb mainly originated from a mixing process of industrial input and natural process, Cr and Cu were mainly derived from urban activities, and Zn was mainly influenced by agriculture activities. Furthermore, land use types within the buffer zone near sampling points were innovatively analyzed, revealing strong correlations between DHMs and regional land use patterns. Monte Carlo simulations were employed to assess the differentiated non-carcinogenic and carcinogenic risks associated with DHMs across four age groups. This study provided scientific references for the sustainable management of urban rivers and aquatic systems in such a megacity region.
1. Introduction
Urban river water plays a vital role in socioeconomic development, providing essential ecological functions such as the transportation of terrestrial loads, aquaculture development, and ecological conservation [1,2,3]. However, urban rivers are highly vulnerable to external pollution due to its high sensitivity and quick response to various human activities [4,5,6]. Therefore, comprehensive studies on urban river water have become a pressing global need and have garnered significant attention in recent years [7,8,9,10]. Megacity represents the most urbanized city area with a high concentration of human activities. The river that drains through megacity not only provides diversified facilities for the life of urban residents, but also carries essential information on megacity pollution [11,12], since urban wastewater poses a unique and serious threat to the urban water environment [13,14]. Therefore, systematic investigations and environmental evaluation of urban water contamination levels are crucial for effective management and sustainable development.
Dissolved heavy metals (DHMs) are significant and harmful pollutants in rivers worldwide [15,16], and have received a rich body of worldwide attention according to their significant characteristics of non-degradation, persistence, bio-accumulation, and biological toxicity [17,18,19]. DHMs profoundly affect human health and urban water quality in the long run, even though their content is relatively low [20], and this situation may worsen in a megacity river system [21,22,23]. The Beijing-Tianjin-Hebei (BTH) region, one of China’s most densely populated and industrialized areas, is particularly affected by DHM contamination in its river systems [24,25]. Rapid urbanization, industrial emissions, agricultural runoff, and untreated wastewater discharge have led to the accumulation of DHMs such as Cd, Pb, and As in local water bodies [23]. These pollutants pose significant environmental and health risks, affecting both aquatic ecosystems and human populations. In response, various mitigation measures, including stricter environmental regulations, improvements in wastewater treatment, and pollution control technologies, have been implemented in the BTH region [26,27,28]. Despite these efforts, challenges remain in effectively monitoring and reducing DHMs levels across the BTH region. Inadequate enforcement of environmental laws, combined with the complexity of pollution sources and the region’s industrial activities, hampers progress. Therefore, there is a need for more comprehensive DHM pollution investigation and the better integration of industrial, agricultural, and urban management practices to ensure sustainable urban water quality [29,30,31,32,33,34,35]. For the first time, an age grouping method based on the Monte Carlo simulation was proposed to accurately evaluate the differences of non-carcinogenic and carcinogenic risks among four age groups. This approach provides new insights for precise health risk management concerning heavy metal exposure.
Previous works have provided extensive pollution information on world’s largest river systems (e.g., the Yangtze River, the Yellow River) with various lithology and natural landscapes [36,37]; however, the systematic research on DHMs pollution in urban river draining through megacities remains relatively scarce [38,39]. The BTH region is the most significant agglomeration of technology and economy in northern China with two megacities (Beijing city and Tianjin city), which has special representativeness in the sustainable development of society, economy, and environment [40]. The Chaobai River is recognized as the main water supply for urban survival in the BTH region, such as for drinking purposes and the shipping industry. In recent years, with highly concentrated urbanization, a large number of industrial and domestic sewage directly or indirectly enter the Chaobai River, resulting in poor water quality [41]. However, the limited studies of riverine pollutants in the Chaobai River are mostly centered on organic components, for example, polycyclic aromatic hydrocarbons and polychlorinated biphenyls, while the risk evaluation of DHMs in this typical megacity river is still unclear. Therefore, this study systematically collected the river water in this typical megacity river to (1) determine the content and distribution pattern of DHMs in the megacity river, (2) identify the potential DHM sources by examining their relationships with land use patterns, and (3) evaluate the health risks of DHMs in urban water via the probabilistic model. This age-group-based risk assessment method could benefit local government by proposing effective management strategies to target different risk groups more accurately and enhance public health protection.
2. Materials and Methods
2.1. Study Area
The Chaobai River covers an area of 19,354 km2 and provides water supply for the BTH metropolitan region, the most famous urban region in northern China. The Chaobai River originates from the northern Yanshan mountain, draining through Hebei Province, Beijing, and Tianjin, and finally flows into the Bohai Bay [42]. The study region is affected by temperate monsoon together with the mean temperature of 12~13 °C and an evaporation amount of 1100~1800 mm [43]. The rainfall amount increases from northwest to southeast with an average of 488.9 mm annually, and the precipitation amount from June to August generally occupies 65~75% of total precipitation [44].
More than 40 hydropower stations are constructed upon the Chaobai River basin, and the capacity of the famous Miyun reservoir is 4.38 × 10⁹ m3. Many diversion channels and dams have also been constructed. The total storage capacity of the water conservancy projects within the basin exceeds 4.8 × 10⁹ m3, and the capacity of water diversion exceeds 3.0 × 10⁸ m3 with the maximum irrigation area of 2.5 × 10⁵ hm2. The land use types include farmland, grassland, forests, water bodies, and construction land, in which the two most significant land use types are farmland and construction land. By 2016, the total population in the Chaobai River basin increased rapidly to 3.28 million. The social economy developed rapidly with the dramatically changed land use structure. The Chaobai River basin has made great efforts in developing urban construction, industrial parks, and real estate, resulting in a rapid expansion rate of construction land. Meanwhile, a large amount of cultivated land has been expropriated for the construction of real estate, development zones, and industrial parks, leading to a serious loss of cultivated land [44].
2.2. Sampling and Chemical Analysis
Samples were collected from downstream to upstream (marked as CB1~CB11) in the Chaobai River (Figure 1). All instruments were pre-cleaned in the laboratory and moistened via river water three times in the field. The basic physiochemical parameters were analyzed by YSI monitoring meter for water quality (Xylem Inc., Yellow Spring, OH, USA). After the filtering process through membrane, all samples were acidified until pH < 2 and sealed in polyethylene bottles, and then kept in the fridge for further analysis. DHMs (V, Cr, Ni, Cu, Zn, As, Mo, and Pb) were measured via ICP-MS (PerkinElmer, USA) at the IGSNRR, Chinese Academy of Sciences. To maintain the quality of accuracy, duplicates, standard references, and procedure, blanks were applied reasonably during the whole analyzing process [23]. The results of repeated samples indicated acceptable repetitiveness during the whole analysis. The MDA levels of V, Cr, Ni, Cu, Zn, As, Mo, and Pb were 0.2 ng/L, 0.6 ng/L, 2 ng/L, 0.3 ng/L, 1 ng/L, 0.6 ng/L, 0.4 ng/L, and 0.1 ng/L, respectively. The standard reference material (GSB04-1767-2004) was applied to ensure the quality of DHM analysis. A mixed standard sample of DHMs were prepared, and the concentration of V, Cr, Ni, Cu, Zn, As, Mo, and Pb in the mixed standard sample was 120:5:40:40:60:80:160:1. In this study, the recovery rate of each heavy metal was higher than 98%.
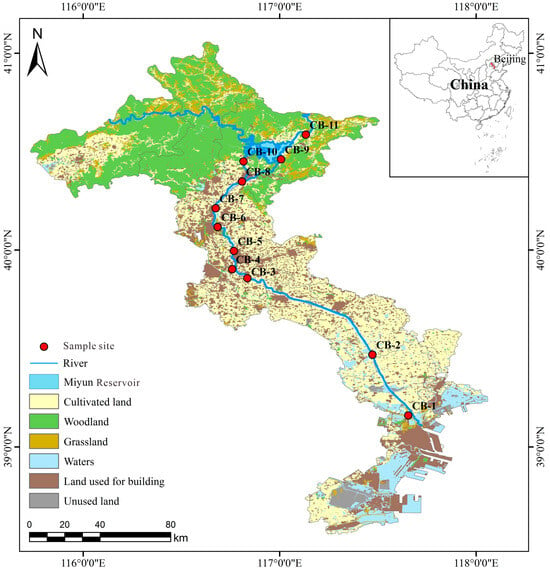
Figure 1.
Sampling sites and land use types in the Chaobai River basin.
2.3. Assessment Methods
2.3.1. Water Quality Index
Water quality index (WQI) is an essential method to evaluate water quality through multiple variables [29] WQI can be calculated via the equation below.
WQI = Σ [Wi × (Ci/Si) ×100]
Here, Wi represents the relative weight (Wi = wi/Σwi, wi = 1~5) of water parameters on both human health and water quality; Ci is the corresponding content of the parameters contained in the calculation; Si represents the drinking water standard by WHO (2011). The water quality in WQI analysis is categorized into 5 categories: “Excellent” means WQI < 50, “Good” represents the WQI range of 50~100, “Poor” means the WQI range of 100~200, “Very poor” represents the WQI range of 200~300, and “Undrinkable” means WQI > 300 [39].
2.3.2. Health Risk Assessment
To determine the exposure degree and solidification tendency of toxic elements in the human body, the health risk evaluation was applied via the Monte Carlo simulation to evaluate DHMs in this typical Chaobai River [45]. In this study, the main consideration is that the health risks of DHMs in aquatic environments typically come from direct intake and fish intake. Since the government prohibits swimming near the river, we ignore the health risks of skin absorption of river water to urban residents. Detailed calculations can be found in Supplementary Materials.
2.3.3. Statistical Methods
Correlation analysis and principal component analysis (PCA) were applied in this study to identify and quantify possible DHM sources. Monte Carlo simulation was conducted by Oracle crystal ball 11.1.34160 (10,000 repetitions) via the applied parameters in Tables S1–S3; 30 m resolution land use datasets were extracted to 8 types by ArcGIS10.6. Furthermore, the influence of upper reach on lower reach should be firstly excluded in urban river research. To do so, the individual DHM content of each site was divided by detected metal concentrations to obtain the relative proportions. Through successive subtraction of the proportions from the nearest upper point, the potential influence of the upper reach could be eliminated. The land use proportions could thus be identified via this method in Table S4.
3. Results and Discussion
3.1. Metal Content in Urban River
The physicochemical parameters of the Chaobai River are summarized in Table 1. Water temperature varied between 23.7 and 31.0 °C. The river water samples were relatively alkaline with the pH of 8.36 ± 0.47. Alkaline river water may easily speed up the physicochemical process of absorption and oxidation in DHMs [46]. The pH value in the Chaobai River water did not show significantly lower values and had no significant correlation (Table 2) with DHMs in the correlation matrix. Therefore, riverine pH may not be a major factor affecting DHM concentrations in the Chaobai River. TDS values decreased from upstream to downstream with a range of 154~591 mg/L. EC values widely varied from 277 to 1050 μS/cm and decreased from downstream to upstream. The average content (in µg/L) of the selected DHMs in the Chaobai River declined as follows: Mo (3.12 µg/L) > V (2.31 µg/L) > As (1.65 µg/L) > Zn (1.19 µg/L) > Ni (0.83 µg/L) > Cu (0.82 µg/L) > Cr (0.12 µg/L) > Pb (0.02 µg/L). Mo, V, As, and Zn were the four most abundant DHMs in the Chaobai River. All DHM content was within the allowable range for drinking water recommended by the drinking water guidelines in the World Health Organization (WHO) and China, except for V, because of a lacking limited value. Cu, Zn, Pb, and As also met the class I of China’s surface water standard. As the concentration (1.65) is the closest to the threshold of China’s drinking water guidelines, this represents potential pollution at the corresponding sampling point and high human emissions (such as industrial and agricultural emissions) in the region. Moreover, V, Zn, As, and Mo content was higher than that the world average, implying the influence of increasing population and intensive domestic inputs. However, when comparing with the average value in other typical urban rivers of the world (Table 1), the average concentration of dissolved Cr (0.12 µg/L), Ni (0.83 µg/L), Cu (0.82 µg/L), and Zn (1.19 µg/L) in the Chaobai River was generally below that in the Seine River, Thames River, and Pearl River, except As (1.65 µg/L) and Mo, which exhibited relatively higher average values than those in the Pearl River (1.65 µg/L for As and 2.41 µg/L for Mo) [47,48]. These results indicated less man-made disturbance on the DHMs of the Chaobai River water via urbanization than other typical urban rivers in the world, even though the Chaobai River flows through two megacities. The lower concentrations of heavy metals in the Chaobai River may also reflect the positive effects of the ecological water replenishment policies implemented by the regional government over the past two years. Meanwhile, when comparing these results with historical data published in the same area in 2018 and 2020, Cu (0.82 µg/L), Zn (1.19 µg/L), and Ni (0.83 µg/L) content in 2021 (this study) was relatively lower than that in 2018 and 2020 (Cu = 1.07~1.79 µg/L, Zn = 2.91~114.5 µg/L, Ni = 1.64~2.40 µg/L) [49].

Table 1.
Physiochemical parameters of the Chaobai River and other world rivers with drinking water guidelines.
Table 2.
The correlation coefficients of eight heavy metals in the Chaobai River.
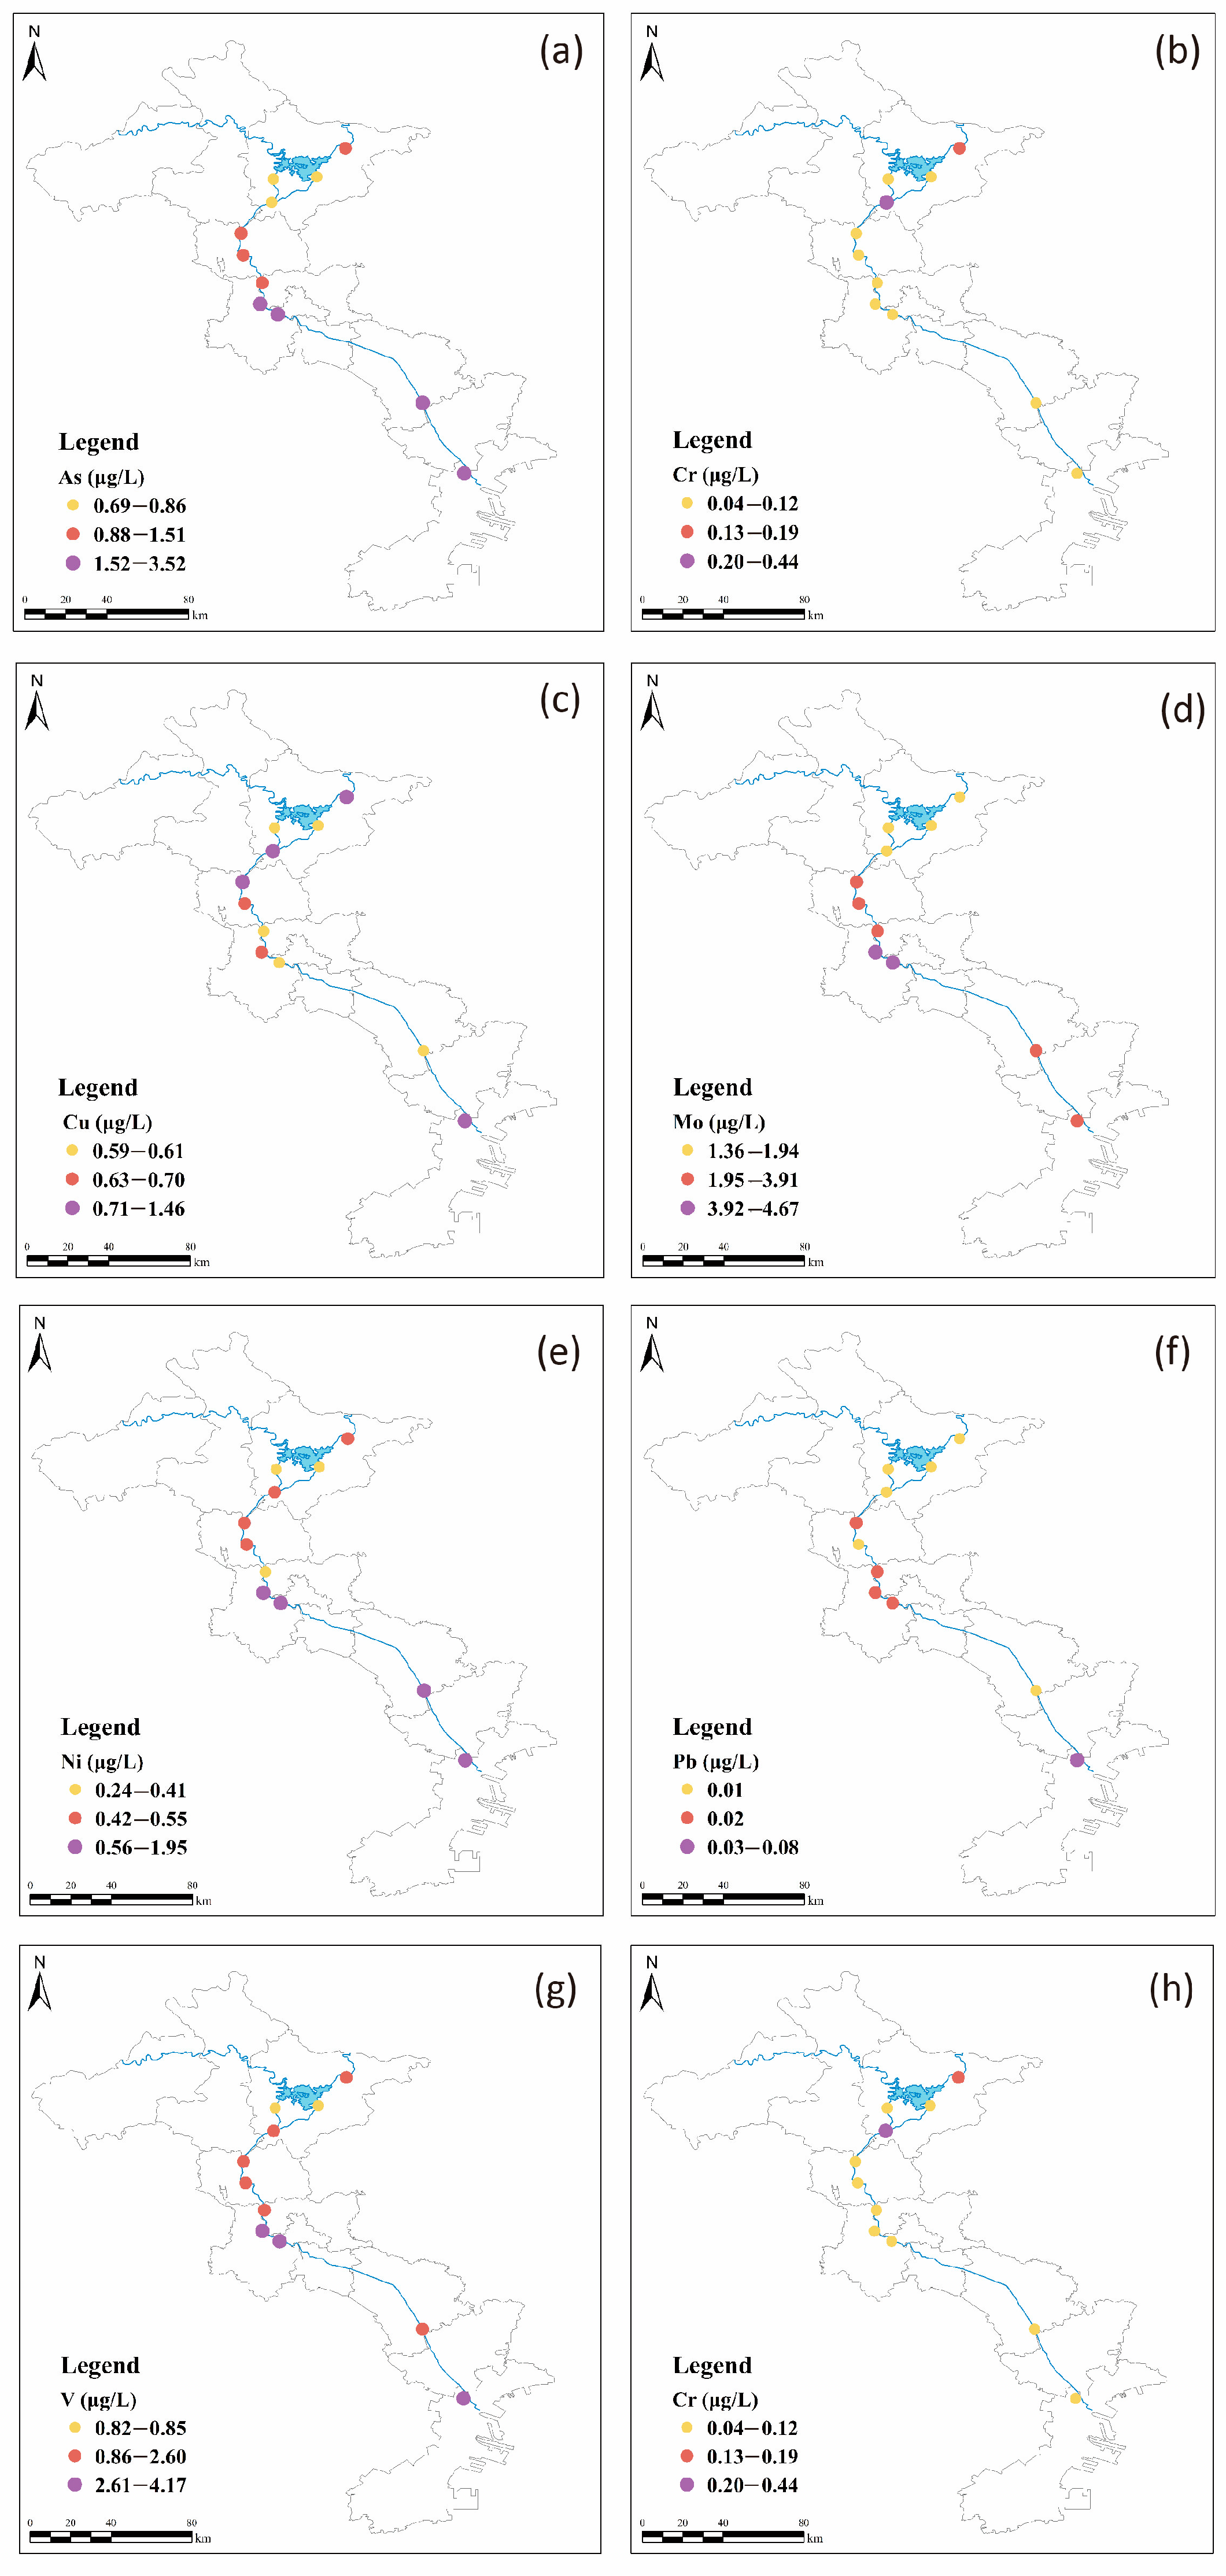
The concentrations of eight DHMs in the Chaobai River are presented in Figure 2. Overall, the distribution for each DHM exhibited wide variations. Dissolved V, As, and Mo concentrations exhibited an upward trend from the upper to lower reach. It is remarkable that Cr concentrations increased significantly at site CB-8, which may be attributed to the discharge of wastewater from the manufacturing industry in the upper reach and the inflow of the Chaohe River and Baihe River. The distribution trend of Ni, Mo, and As concentrations in the Chaobai River were roughly similar, suggesting the same origin. V, Ni, As, and Mo had higher concentrations in Tianjin city, whereas Cu had higher concentrations in Beijing city. Overall, the spatial heterogeneity observed in the distribution of DHMs can be attributed to varying anthropogenic processes, such as agriculture, industrial activities, and economic development, across different regions.
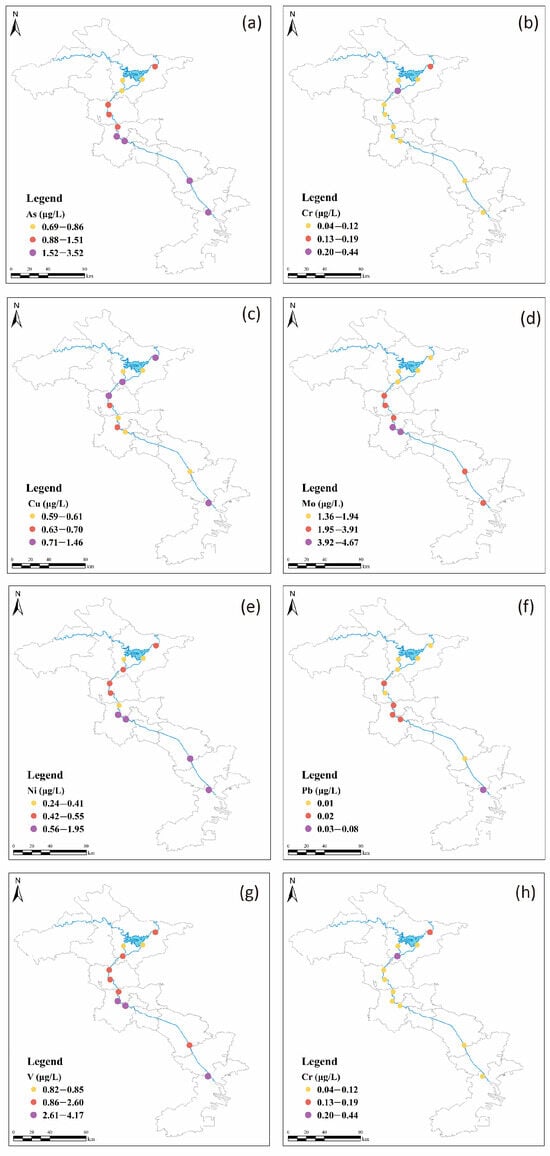
Figure 2.
Spatial variation of (a) As (b) Cr (c) Cu (d) Mn (e) Ni (f) Pb (g) V (h) Zn concentrations in the Chaobai River.
3.2. Source Identification
Pearson correlation analysis was applied to analyze associations among heavy metals and other parameters of the river water (Table 2). The significant positive relationship of Mo and T (0.870, p < 0.01) in the study area indicated possible correlations between the solubility of Mo and the temperature. Moderate positive correlations were extracted between EC and Ni (0.623, p < 0.05), As (0.669, p < 0.05), and TDS and Ni (0.625, p < 0.05), As (0.669, p < 0.05), indicating that Ni and As were closely associated with physicochemical parameters such as TDS and EC.
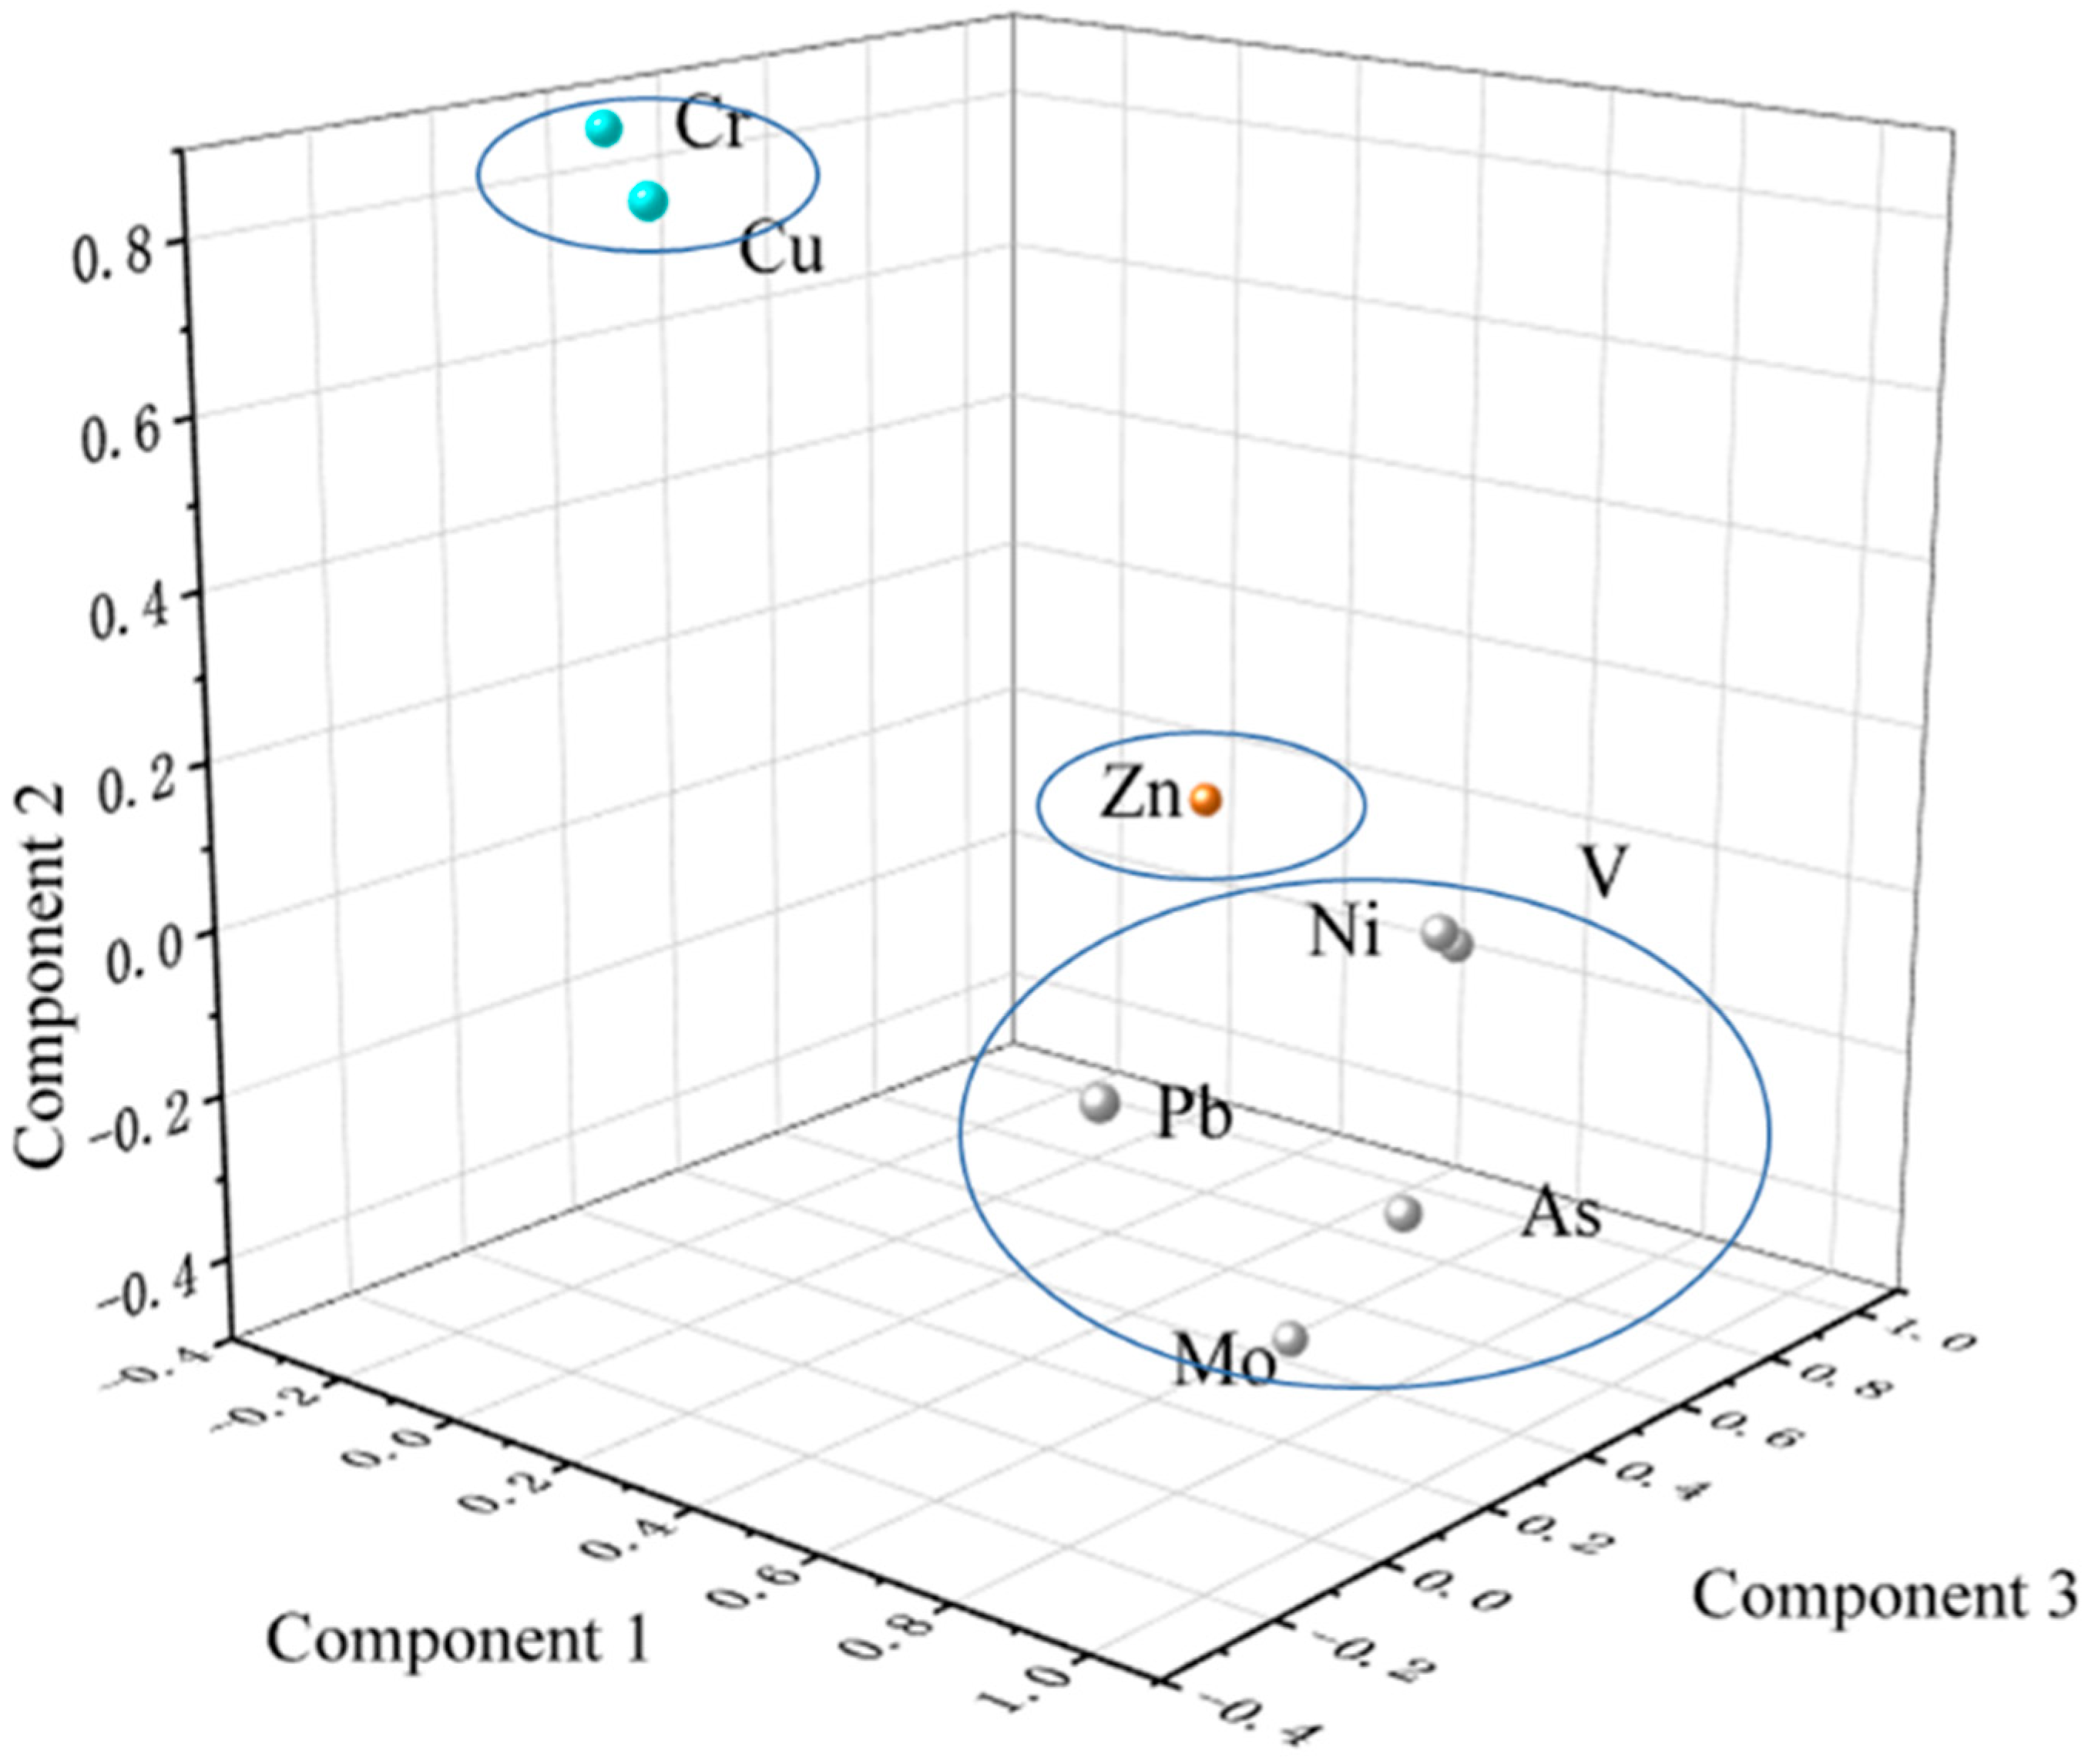
Principal component analysis (PCA) was performed to further identify the sources of dissolved heavy metals in the Chaobai River, with the results presented in Figure 3 [52,53]. Three principal components (PCs) existed in the Chaobai River in Table 3. PC1 had the primary loadings of V, Ni, As, Mo, and Pb, and contributed 51.7% of total variance, demonstrating similar sources of the five DHMs. The Beijing-Tianjin-Hebei (BTH) region is a major coal-consuming area in China, and during coal combustion, trace elements such as V, As, and Pb are often released into the environment [51,54]. Insufficient pollution control measures could lead to the atmospheric deposition or direct discharge of V, As, and Pb into water bodies, which was much more severe near large combustion facilities like thermal power plants [23,27,55,56]. The geological structure of the Beijing-Tianjin-Hebei region is complex, and nickel-containing minerals such as pyroxene and nickel iron ore are widely distributed in rocks within the basin, which are especially released during the weathering process of ultrabasic rocks and diabase [57,58,59]. Therefore, Ni may originate from natural sources. In addition to the Yanjiao national high-tech Industrial Development Zone, the Dachang Chaobai River Economic Zone, and the demonstration zone of emerging industry and the industrial estate of environmental protection, there are also several small furniture manufacturing and metal production enterprises not included in scientific statistics that may provide additional contributions to V, Ni, As, Mo, and Pb concentrations [60]. Therefore, PC1 represents a mixed origin influenced by industrial (thermal) pollution and natural processes.
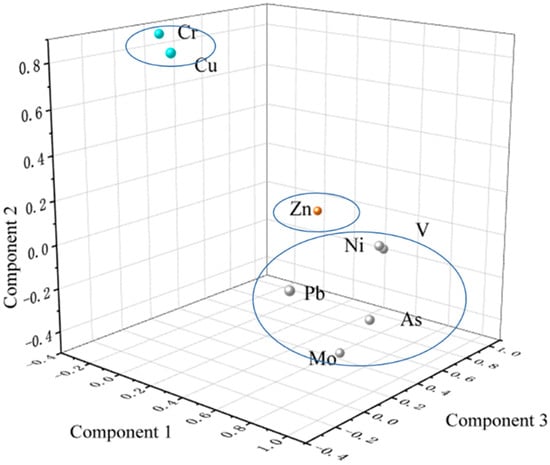
Figure 3.
The loading plot of eight DHMs in the Chaobai River.
Table 3.
Varimax-rotated component matrix for eight DHMs in the Chaobai River.
The PC2 contributed 21.9% of the total variance with the significant loading of Zn. The average Zn (1.19 µg/L) concentrations were much higher than those of the global average (Table 1), indicating that the widespread use of phosphate fertilizers in planting activities in the upper reaches of the Chaobai River is through surface runoff entering the river, as phosphate fertilizers contain an appropriate amount of Zn [23]. In addition, previous studies have indicated that the Zn concentration in the Chaobai River, which drains through the Miyun District, is primarily derived from agricultural production residues [53,61]. Therefore, PC2 is attributed to agricultural cultivation processes as the main source of Zn in the river.
The third PC contributed 17.2% of the total variance with the significant loading of Cr and Cu. Urban wastewater may also contain heavy metals such as Cr and Cu [62]. If these wastes are not strictly managed or treated, they may be directly discharged into rivers. Therefore, here, we attributed PC3 to the impact of urban activities.
The sources of anthropogenic DHMs could be revealed by land use distribution and proportions through the implementation of Spearman correlation [57]. The relationships between land use proportion and metal concentration in the mainstream of the Chaobai River were shown in Table 4. The finding demonstrated significant correlation between Cu content and water proportion variation (R = 0.73, p < 0.05), implying the possible Cu contribution of natural process, which is consistent with PCA analysis above. Meanwhile, Zn content was significantly correlated with urban land proportion variation (R = 0.82, p < 0.01), indicating the potential Zn sources of urban discharge in river water. These results underscore the importance of monitoring industrial wastewater discharges, especially considering the rapid industrialization in the Chaobai River basin.
Table 4.
Spearman correlations between land use proportion and DHM variations in the Chaobai River.
3.3. Water Quality in Megacity River
In this study, 10 parameters of water quality (pH, EC, TDS, Ni, Cr, Cu, Zn, Pb, As, and Mo) were selected for the WQI calculation in Table 5, and the WQI results are exhibited in Figure 4. The average WQI value of the Chaobai River was 23.35, indicating excellent water quality. WQI gradually declined from downstream to upstream in the Chaobai River, with the highest in site CB-2 and the lowest in site CB-7. The sampling site CB5-11 had excellent water quality (WQI < 25), and site CB1-4 had good water quality (25 < WQI < 50). Therefore, according to the WQI index, the natural water of the Chaobai River was acceptable for drinking. It is worth noting that this study only calculated WQI from the perspective of heavy metals. However, according to previous discussions about metal contents and sources, the potential risks of these ions still exist, although the WQI results of the Chaobai River are quite good. Frequent anthropogenic activities including agriculture and industry in these urban districts could lead to the increase in DHM content and the alteration of physicochemical parameters in river water [63]. According to recent governmental policies, the improved water quality in the upper reaches of the river is attributed not only to effective water resource management, but also to the dilution effects from high-flow tributaries, which help reduce impurities. Moreover, as shown in Figure 4, the primary contributions of WQI were the physicochemical parameters of EC, TDS, and pH, whereas the metal contribution is relatively lower, except for As and Mo, indicating potential health risks of As and Mo to human health.
Table 5.
The selected parameters with weights in WQI analysis.
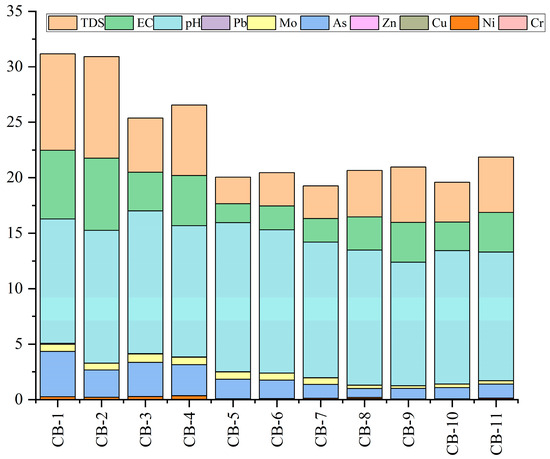
Figure 4.
The spatial variations of WQI in the Chaobai River.
3.4. Non-Carcinogenic Risks of Metals in Urban Water
Water Ingestion
As a vital ecological resource in the BTH metropolitan region, the Chaobai River basin is not only the national key area for water conservation [44], but also a critical surface water source for drinking, particularly in Beijing [28,58,64]. Therefore, the risk evaluation of metals in this region is rather crucial to ensure the safety of drinking water [65,66,67,68,69]. According to the HQ calculation, Table S5 exhibited the HQ values via water ingestion. The calculation results indicated that the HQ values of Mo, V, Zn, Ni, Fe, and Cr via water ingestion were far less than the limitation values. However, the HQ values of As via water ingestion displayed a relatively higher risk in the Chaobai River (HQingestion > 0.1). Furthermore, comparing with the 5th, 90th, 95th, and 99th percentiles of the potential As risks via water ingestion between child (0.04, 1.39, 1.78, 2.85) and adult (0.03, 0.71, 0.87, 1.24), child exhibited more potential risks than adult.
Figure 5 presented the predicted HQingestion value of As via MCS the method in the Chaobai River. As for the adult, the HQingestion value was less than 1, and 1.32% of the simulated value was higher than the USEPA standard. However, as for the child group, 19.48% of the simulation value was out of the limitation by the USEPA. Although the As value was less than the upper limitation of the WHO standard (10 μg/L), it was still much higher than the global mean value of urban rivers (0.62 μg/L), indicating potential health risks in the Chaobai River. These findings highlight the need for targeted water management policies and treatment strategies, particularly to control As contamination, in this typical megacity river. In previous studies, we used the same Monte Carlo simulation to assess the exposure risk of the Yongding River in the BTH region. Compared to the Yongding River, the average HQingestion of the study area is much lower than that of the Yongding River for both adult (0.63) and child (1.13) [26,70].
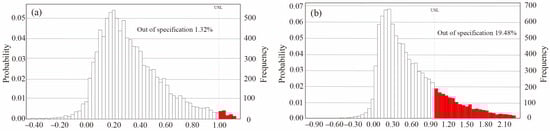
Figure 5.
Predicted HQingestion value of As via Monte Carlo simulation in the Chaobai River on (a) adult and (b) child.
3.5. Carcinogenic Risks of Metals in Urban Water
Water Ingestion
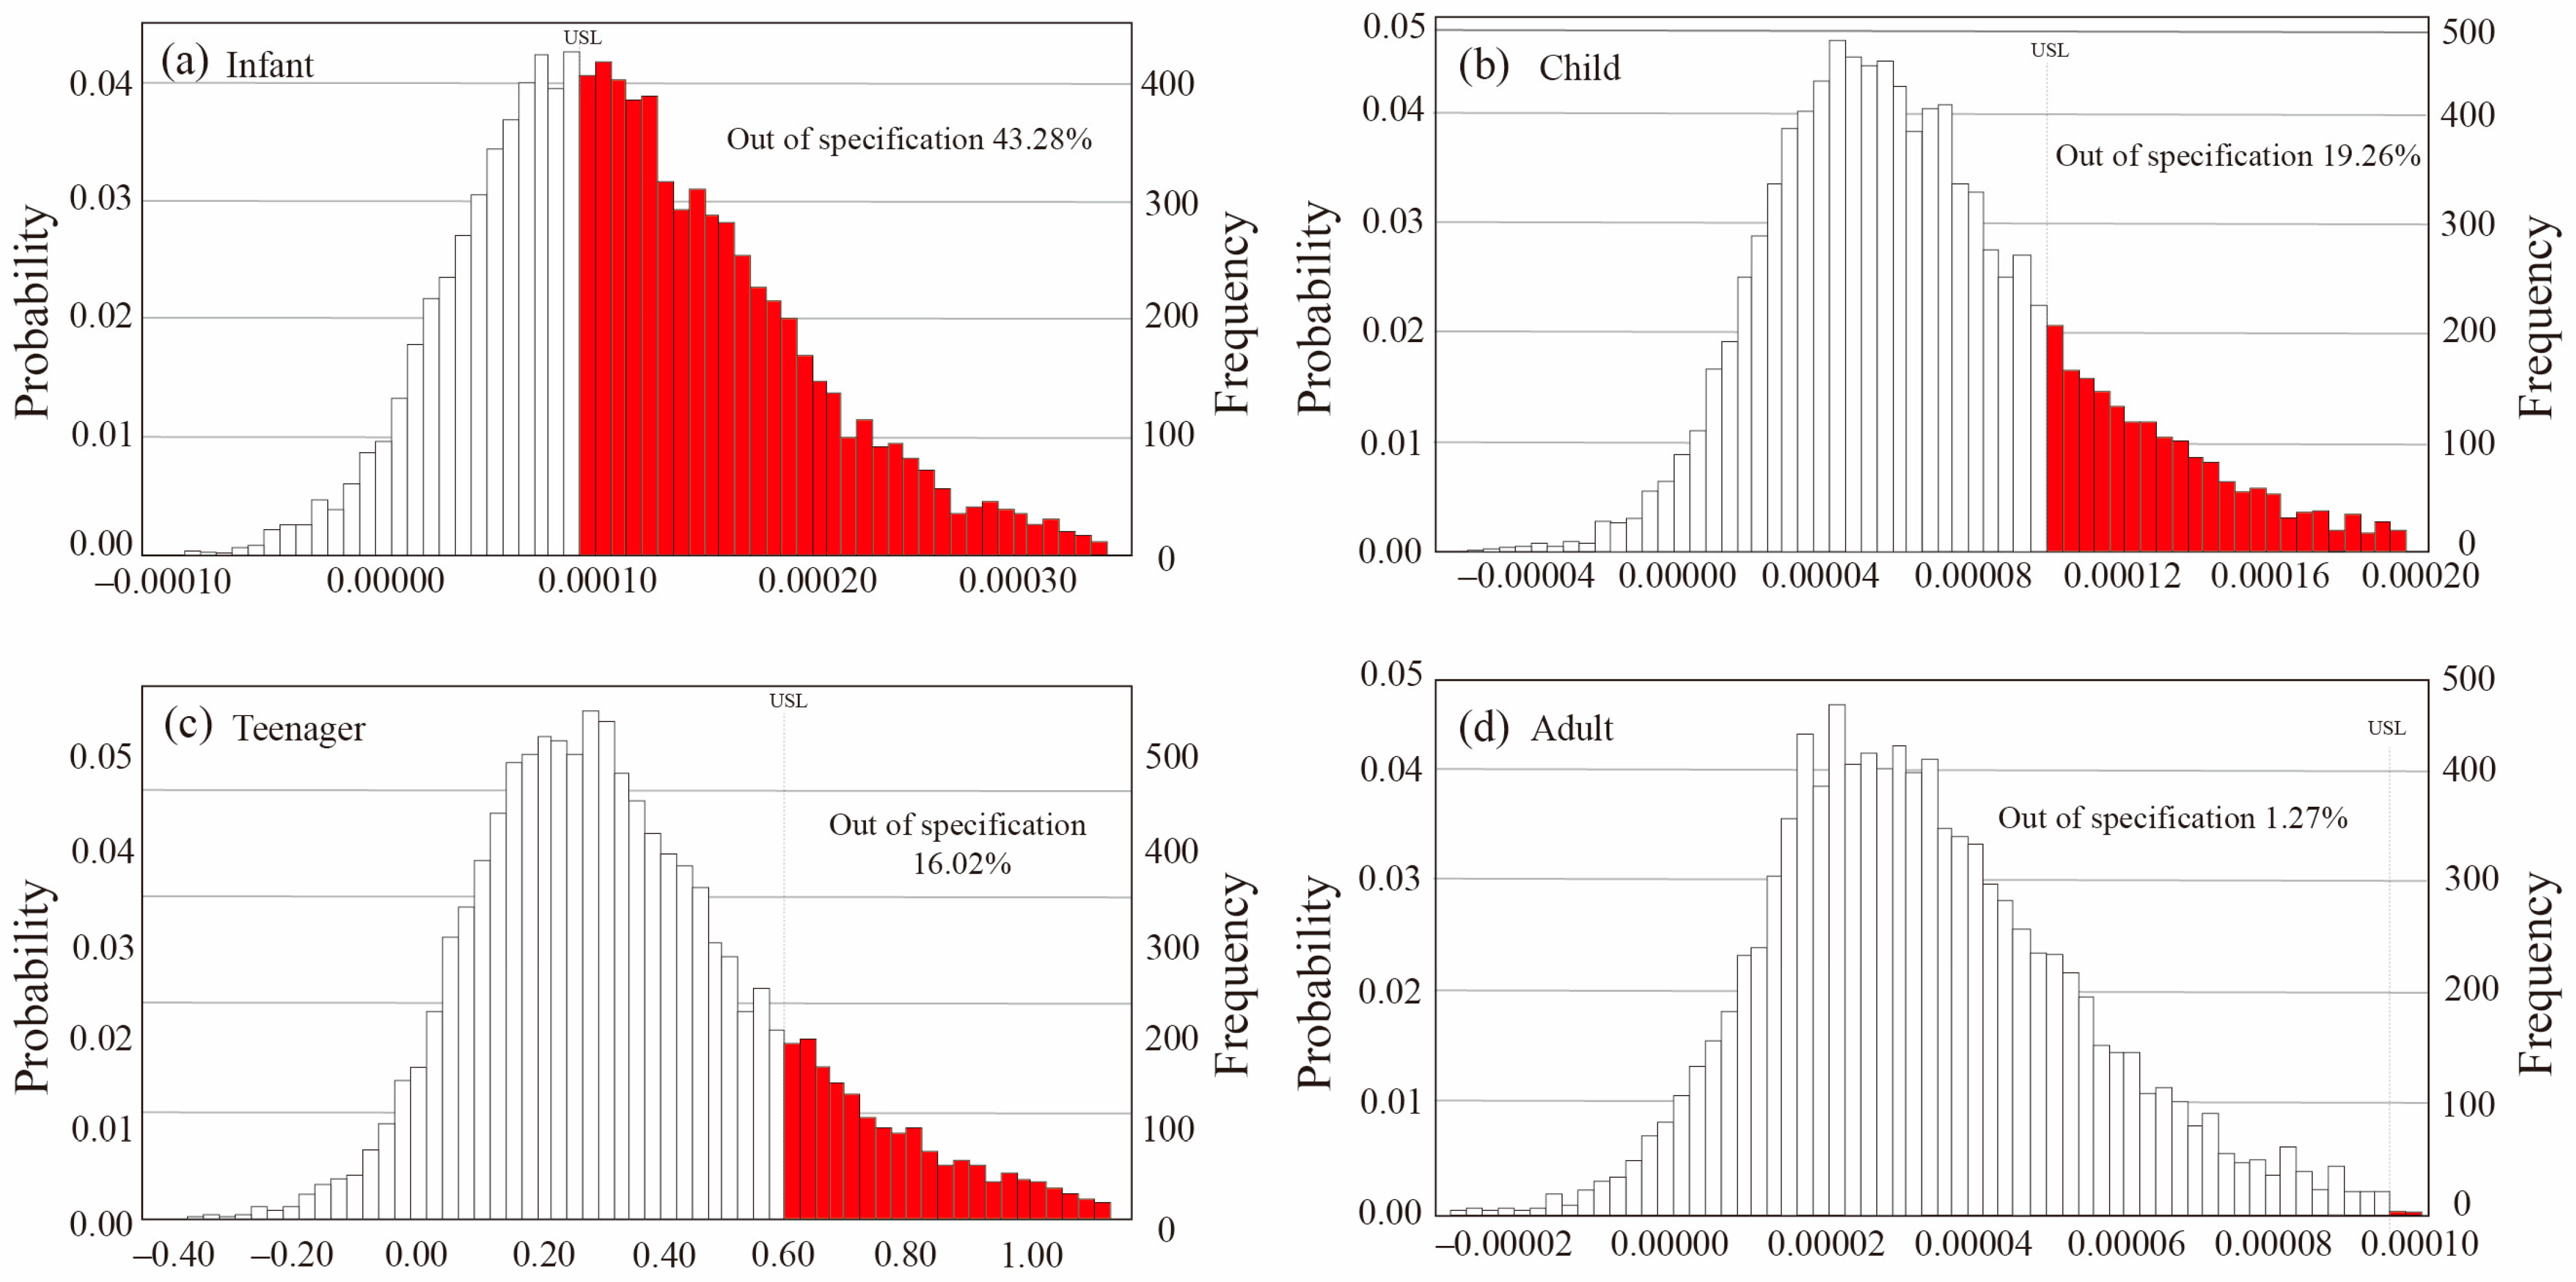
Due to the limited non-carcinogenic dermal risk of metals in the Chaobai River, the analysis excluded carcinogenic risks via skin absorption. The urban residents were divided into four age groups to reveal a more accurate carcinogenic risk evaluation: infant (0~2 years old), child (2~6), teenager (7~16), and adult (≥17). According to the calculation, the limitation range of the carcinogenic risk of As was 10−6~10−4. The predicted results are shown in Figure 6, which indicated that the average carcinogenic risks in these age groups were 1.21 × 10⁻⁴ for infant group, 6.89 × 10⁻⁵ for child group, 6.28 × 10⁻⁵ for teenager group, and 1.72 × 10⁻⁵ for adult group, respectively. Meanwhile, the 5% and 95% simulated risks were calculated as 1.50 × 10⁻⁵ and 2.61 × 10⁻⁴ for the infant group, 8.10 × 10⁻⁶ and 1.56 × 10⁻⁴ for the child group, 6.83 × 10⁻⁶ and 1.43 × 10⁻⁴ for the teenager group, and 2.38 × 10⁻⁶ and 3.70 × 10⁻⁵ for the adult group, respectively (Table S6). Furthermore, around 19.26% of As in the child group and 16.02% in the teenager group fell out of the allowable values, whereas only 1.27% of As in the adult group exceeded the acceptable ranges, implying a much lower carcinogenic risk of As in the adult group. On the contrary, 43.28% of As in the infant group far exceeded the acceptable standards, revealing a greater health threat for young ages, especially for the infant group.

Figure 6.
Predicted carcinogenic risk of As in (a) infant, (b) child, (c) teenager, and (d) adult groups in the Chaobai River.
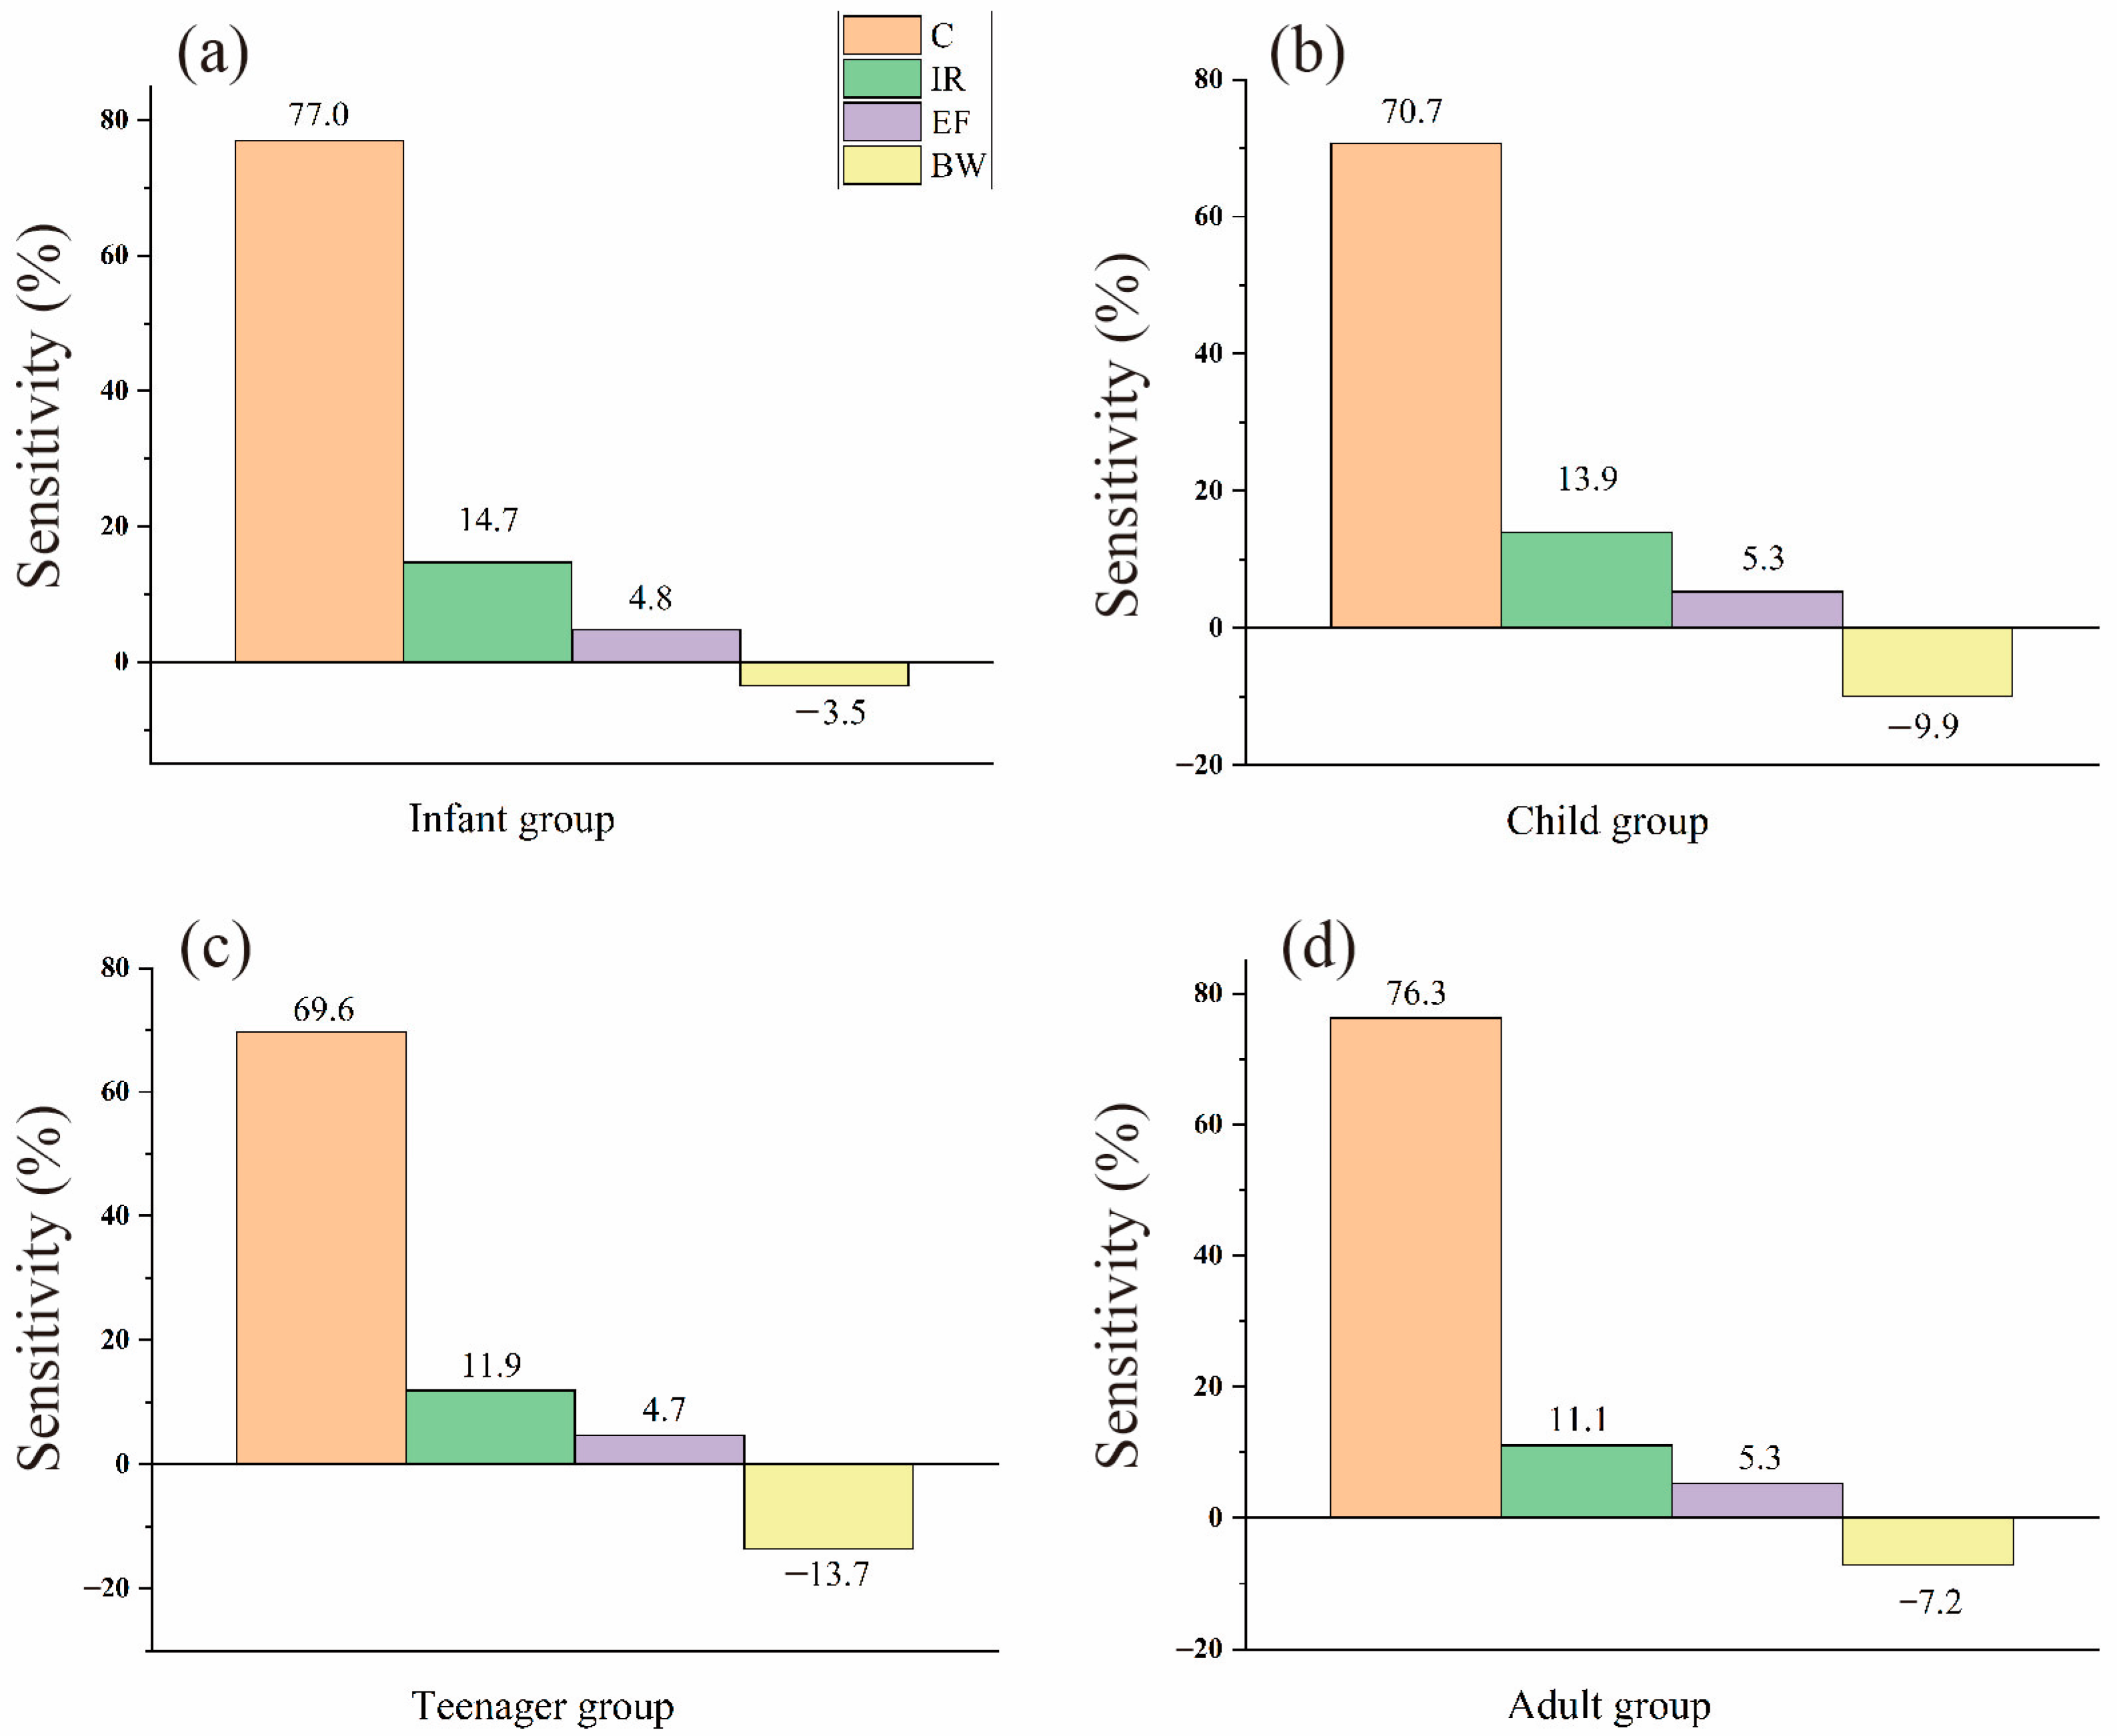
Meanwhile, in order to investigate the parameters that could affect the calculated carcinogenic risks, we performed a sensitivity test in this study. Figure 7 illustrates the parameter contributions of risk uncertainty on As, and the most significant parameters in the infant and teenager groups followed the order of As content > ingestion rate > exposure frequency > body weight. However, body weight is relatively more influential in the child and adult groups than exposure frequency.
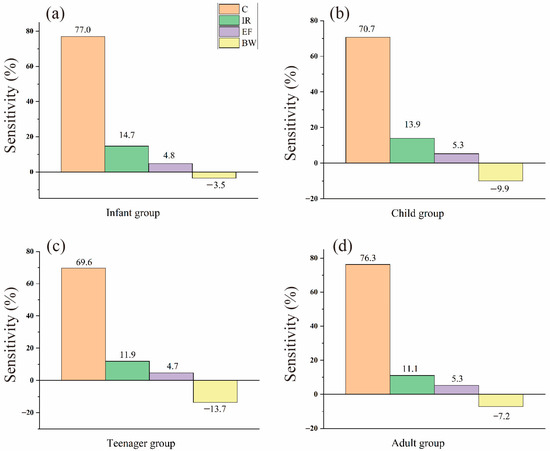
Figure 7.
Contribution of input parameters on the uncertainty of the carcinogenic risk of As in (a) infant, (b) child, (c) teenager, and (d) adult age groups (C: concentration, IR: ingestion rate, EF: exposure frequency, and BW: body weight).
4. Conclusions
The spatial distribution, origins, and potential risks of urban water collected in the typical megacity river were fully investigated in this work. The concentration of DHMs in the Chaobai River showed obvious spatial variations, and V, As, and Mo exhibited the highest concentrations with the average value exceeding 1.60 µg/L. PCA analysis indicated three major PCs, among which V, Ni, As, Mo, and Pb originated from mixed sources directly impacted by industrial pollution and natural reactions; Zn was derived from the contribution of agriculture processes, whereas Cr and Cu were constrained by urban activities. The strong relationships between DHMs and land use proportions remained consistent with the PCA results. The Chaobai River water exhibited relatively good water quality and low risk level. The Monte Carlo simulation revealed that 1.32% and 19.48% of the simulated risk value of As fell out of the range of the USEPA standards for adults and children, respectively, indicating potential risks of As through water ingestion. Even though the carcinogenic risk of As in adults, children, and teenagers is weak, the risk in infants should not be neglected, which was significantly higher than other three groups. To ensure a safe water supply, it is essential to implement effective water resource management policies and monitoring programs in the future.
Supplementary Materials
The following supporting information can be downloaded at: https://www.mdpi.com/article/10.3390/w17020224/s1. Table S1: The parameter values and units of DHMs for hazard quotient (HQ) and hazard index (HI) analysis; Table S2: Parameters and values used for the deterministic and probabilistic calculations of non-carcinogenic risks [53,54,59,60,61]; Table S3: Parameters and values used for the deterministic and probabilistic calculations of cancer risks [56,60,71,72]; Table S4: The land use proportions of each sample site in the Chaobai River (unit as %); Table S5: Probabilistic risk of DHMs on adults and children (HQingestion) in the Chaobai River; Table S6: Carcinogenic risk of As in the Chaobai River.
Author Contributions
Conceptualization, G.H. and X.G.; methodology, X.G.; software, X.G.; validation, X.G. and G.H.; formal analysis, X.G.; investigation, X.G. and J.Z.; resources, G.H.; data curation, X.G.; writing—original draft preparation, X.G.; writing—review and editing, X.G., G.H., S.Z. and J.Z.; visualization, X.G.; funding acquisition, G.H. All authors have read and agreed to the published version of the manuscript.
Funding
This work was supported by the “Deep-time Digital Earth” Science and Technology Leading Talents Team Funds for the Central Universities for the Frontiers Science Center for Deep-time Digital Earth, China University of Geosciences (Beijing) (Fundamental Research Funds for the Central Universities; grant number: 2652023001).
Data Availability Statement
Data will be made available on request.
Acknowledgments
The authors gratefully acknowledge Qian Zhang from the Institute of Geographic Sciences and Natural Resources Research, Chinese Academy of Sciences, for their assistance in the laboratory analysis.
Conflicts of Interest
The authors declare no conflicts of interest.
References
- Arslan, H.; Ayyildiz Turan, N. Estimation of spatial distribution of heavy metals in groundwater using interpolation methods and multivariate statistical techniques; its suitability for drinking and irrigation purposes in the Middle Black Sea Region of Turkey. Environ. Monit. Assess. 2015, 187, 516. [Google Scholar] [CrossRef] [PubMed]
- Kumar, S.; Islam, A.R.M.T.; Hasanuzzaman, M.; Salam, R.; Khan, R.; Islam, M.S. Preliminary assessment of heavy metals in surface water and sediment in Nakuvadra-Rakiraki River, Fiji using indexical and chemometric approaches. J. Environ. Manag. 2021, 298, 113517. [Google Scholar] [CrossRef]
- Zhuang, Q.; Li, G.; Liu, Z. Distribution, source and pollution level of heavy metals in river sediments from South China. CATENA 2018, 170, 386–396. [Google Scholar] [CrossRef]
- Custodio, M.; Peñaloza, R.; Chanamé, F.; Hinostroza-Martínez, J.L.; De la Cruz, H. Water quality dynamics of the Cunas River in rural and urban areas in the central region of Peru. Egypt. J. Aquat. Res. 2021, 47, 253–259. [Google Scholar] [CrossRef]
- Han, R.; Zhang, Q.; Xu, Z. Tracing Fe cycle isotopically in soils based on different land uses: Insight from a typical karst catchment, Southwest China. Sci. Total Environ. 2023, 856, 158929. [Google Scholar] [CrossRef] [PubMed]
- Jaffar, S.T.A.; Luo, F.; Ye, R.; Younas, H.; Hu, X.-f.; Chen, L.-z. The Extent of Heavy Metal Pollution and Their Potential Health Risk in Topsoils of the Massively Urbanized District of Shanghai. Arch. Environ. Contam. Toxicol. 2017, 73, 362–376. [Google Scholar] [CrossRef] [PubMed]
- Kumar, V.; Sharma, A.; Kumar, R.; Bhardwaj, R.; Kumar Thukral, A.; Rodrigo-Comino, J. Assessment of heavy-metal pollution in three different Indian water bodies by combination of multivariate analysis and water pollution indices. Hum. Ecol. Risk Assess. Int. J. 2020, 26, 1–16. [Google Scholar] [CrossRef]
- Liu, J.; Han, G. Tracing Riverine Particulate Black Carbon Sources in Xijiang River Basin: Insight from Stable Isotopic Composition and Bayesian Mixing Model. Water Res. 2021, 194, 116932. [Google Scholar] [CrossRef] [PubMed]
- Pekel, J.-F.; Cottam, A.; Gorelick, N.; Belward, A.S. High-resolution mapping of global surface water and its long-term changes. Nature 2016, 540, 418–422. [Google Scholar] [CrossRef] [PubMed]
- Zhang, J.; Li, X.; Guo, L.; Deng, Z.; Wang, D.; Liu, L. Assessment of heavy metal pollution and water quality characteristics of the reservoir control reaches in the middle Han River, China. Sci. Total Environ. 2021, 799, 149472. [Google Scholar] [CrossRef]
- Auerbach, D.A.; Deisenroth, D.B.; McShane, R.R.; McCluney, K.E.; Poff, N.L. Beyond the concrete: Accounting for ecosystem services from free-flowing rivers. Ecosyst. Serv. 2014, 10, 1–5. [Google Scholar] [CrossRef]
- Chen, W.Y.; Li, X.; Hua, J. Environmental amenities of urban rivers and residential property values: A global meta-analysis. Sci. Total Environ. 2019, 693, 133628. [Google Scholar] [CrossRef] [PubMed]
- Chen, D.; Chen, Y.-p.; Lin, Y. Heavy Rainfall Events Following the Dry Season Elevate Metal Contamination in Mining-Impacted Rivers: A Case Study of Wenyu River, Qinling, China. Arch. Environ. Contam. Toxicol. 2021, 81, 335–345. [Google Scholar] [CrossRef] [PubMed]
- Wan, L.; Wang, H. Control of urban river water pollution is studied based on SMS. Environ. Technol. Innov. 2021, 22, 101468. [Google Scholar] [CrossRef]
- Ali, M.M.; Rahman, S.; Islam, M.S.; Rakib, M.R.J.; Hossen, S.; Rahman, M.Z.; Kormoker, T.; Idris, A.M.; Phoungthong, K. Distribution of heavy metals in water and sediment of an urban river in a developing country: A probabilistic risk assessment. Int. J. Sediment Res. 2022, 37, 173–187. [Google Scholar] [CrossRef]
- Hossain, M.S.; Ahmed, M.K.; Sarker, S.; Rahman, M.S. Seasonal variations of trace metals from water and sediment samples in the northern Bay of Bengal. Ecotoxicol. Environ. Saf. 2020, 193, 110347. [Google Scholar] [CrossRef] [PubMed]
- Cai, L.M.; Wang, Q.S.; Wen, H.H.; Luo, J.; Wang, S. Heavy metals in agricultural soils from a typical township in Guangdong Province, China: Occurrences and spatial distribution. Ecotoxicol Environ. Saf 2019, 168, 184–191. [Google Scholar] [CrossRef] [PubMed]
- Miao, F.; Zhang, Y.; Li, Y.; Fang, Q.; Zhou, Y. Implementation of an integrated health risk assessment coupled with spatial interpolation and source contribution: A case study of soil heavy metals from an abandoned industrial area in Suzhou, China. Stoch. Environ. Res. Risk Assess. 2022, 36, 2633–2647. [Google Scholar] [CrossRef]
- Shen, L.; Zeng, J.; Guo, E.; Cheng, Y.; Li, L.; Niu, C.; Yuan, Y.; Ma, L. Source apportionment and risk assessment of heavy metals in urban soils from a central China city by using positive matrix factorization model coupled with Monte Carlo simulation. Stoch. Environ. Res. Risk Assess. 2023, 37, 291–304. [Google Scholar] [CrossRef]
- Vardhan, K.H.; Kumar, P.S.; Panda, R.C. A review on heavy metal pollution, toxicity and remedial measures: Current trends and future perspectives. J. Mol. Liq. 2019, 290, 111197. [Google Scholar] [CrossRef]
- Aghadadashi, V.; Neyestani, M.R.; Mehdinia, A.; Riyahi Bakhtiari, A.; Molaei, S.; Farhangi, M.; Esmaili, M.; Rezai Marnani, H.; Gerivani, H. Spatial distribution and vertical profile of heavy metals in marine sediments around Iran’s special economic energy zone; Arsenic as an enriched contaminant. Mar. Pollut. Bull. 2019, 138, 437–450. [Google Scholar] [CrossRef] [PubMed]
- Han, R.; Liu, W.; Zhang, J.; Zhao, T.; Sun, H.; Xu, Z. Hydrogeochemical characteristics and recharge sources identification based on isotopic tracing of alpine rivers in the Tibetan Plateau. Environ. Res. 2023, 229, 115981. [Google Scholar] [CrossRef]
- Zhang, S.; Han, G.; Gao, X. The urbanization impacts on potentially toxic metals: The distribution, sources and contamination risks in river situated in typical megacity, China. Sustain. Cities Soc. 2023, 97, 104784. [Google Scholar] [CrossRef]
- Zhi, X.; Chen, L.; Shen, Z. Impacts of urbanization on regional nonpoint source pollution: Case study for Beijing, China. Environ. Sci. Pollut. Res. 2018, 25, 9849–9860. [Google Scholar] [CrossRef]
- World Health Organization. Manganese in Drinking-Water: Background Document for Development of WHO Guidelines for Drinking-Water Quality; World Health Organization: Geneva, Switzerland, 2004. [Google Scholar]
- Gao, X.; Han, G.; Liu, J.; Zhang, S.; Zeng, J. Heavy Metal Accumulation and Source Apportionment in Urban River under Ecological Restoration: Relationships with Land Use and Risk Assessment Based on Monte Carlo Simulation. ACS Earth Space Chem. 2023, 7, 642–652. [Google Scholar] [CrossRef]
- Duan, J.; Tan, J. Atmospheric heavy metals and Arsenic in China: Situation, sources and control policies. Atmos. Environ. 2013, 74, 93–101. [Google Scholar] [CrossRef]
- Gao, X.; Han, G.; Zhang, S.; Liu, J.; Wang, D.; Ma, S.; Zhao, Y. Anthropogenic gadolinium sources and remediation in highly urbanized river in the Beijing-Tianjin-Hebei (BTH) region, China: Insights from buffer zone and three-dimensional tracer system. Process Saf. Environ. Prot. 2024, 186, 37–48. [Google Scholar] [CrossRef]
- Bitton, G.; Jung, K.; Koopman, B. Evaluation of a microplate assay specific for heavy metal toxicity. Arch. Environ. Contam. Toxicol. 1994, 27, 25–28. [Google Scholar] [CrossRef]
- De Miguel, E.; Iribarren, I.; Chacón, E.; Ordoñez, A.; Charlesworth, S. Risk-based evaluation of the exposure of children to trace elements in playgrounds in Madrid (Spain). Chemosphere 2007, 66, 505–513. [Google Scholar] [CrossRef] [PubMed]
- Qu, R.; Han, G. Potassium isotopes of fertilizers as potential markers of anthropogenic input in ecosystems. Environ. Chem. Lett. 2023, 21, 41–45. [Google Scholar] [CrossRef]
- Xia, F.; Qu, L.; Wang, T.; Luo, L.; Chen, H.; Dahlgren, R.A.; Zhang, M.; Mei, K.; Huang, H. Distribution and source analysis of heavy metal pollutants in sediments of a rapid developing urban river system. Chemosphere 2018, 207, 218–228. [Google Scholar] [CrossRef]
- Chiu, W.A.; Barton, H.A.; DeWoskin, R.S.; Schlosser, P.; Thompson, C.M.; Sonawane, B.; Lipscomb, J.C.; Krishnan, K. Evaluation of physiologically based pharmacokinetic models for use in risk assessment. J. Appl. Toxicol. 2007, 27, 218–237. [Google Scholar] [CrossRef] [PubMed]
- Jiang, C.; Zhao, Q.; Zheng, L.; Chen, X.; Li, C.; Ren, M. Distribution, source and health risk assessment based on the Monte Carlo method of heavy metals in shallow groundwater in an area affected by mining activities, China. Ecotoxicol. Environ. Saf. 2021, 224, 112679. [Google Scholar] [CrossRef] [PubMed]
- Pang, K.; Li, M.; Liu, L.; Yang, J.L.; Zhao, H.J. [Evaluation and Source Analysis of Heavy Metal Pollution in Sediments of the Yellow River Basin Based on Monte Carlo Simulation and PMF Model]. Huan Jing Ke Xue 2022, 43, 4008–4017. [Google Scholar] [CrossRef]
- Fu, J.; Zhao, C.; Luo, Y.; Liu, C.; Kyzas, G.Z.; Luo, Y.; Zhao, D.; An, S.; Zhu, H. Heavy metals in surface sediments of the Jialu River, China: Their relations to environmental factors. J. Hazard. Mater. 2014, 270, 102–109. [Google Scholar] [CrossRef]
- Li, Y.; Chen, H.; Song, L.; Wu, J.; Sun, W.; Teng, Y. Effects on microbiomes and resistomes and the source-specific ecological risks of heavy metals in the sediments of an urban river. J. Hazard. Mater. 2021, 409, 124472. [Google Scholar] [CrossRef] [PubMed]
- Paul, D. Research on heavy metal pollution of river Ganga: A review. Ann. Agrar. Sci. 2017, 15, 278–286. [Google Scholar] [CrossRef]
- Xiao, J.; Wang, L.; Deng, L.; Jin, Z. Characteristics, sources, water quality and health risk assessment of trace elements in river water and well water in the Chinese Loess Plateau. Sci. Total Environ. 2019, 650, 2004–2012. [Google Scholar] [CrossRef] [PubMed]
- Lu, W.; Zhang, G. Green development efficiency of urban agglomerations in a developing country: Evidence from Beijing-Tianjin-Hebei in China. Environ. Dev. Sustain. 2023, 25, 6939–6962. [Google Scholar] [CrossRef]
- Yang, L.; He, J.; Liu, Y.; Wang, J.; Jiang, L.; Wang, G. Characteristics of change in water quality along reclaimed water intake area of the Chaobai River in Beijing, China. J. Environ. Sci. 2016, 50, 93–102. [Google Scholar] [CrossRef] [PubMed]
- Zhang, Y.; Chen, H.; Jing, L.; Teng, Y. Ecotoxicological risk assessment and source apportionment of antibiotics in the waters and sediments of a peri-urban river. Sci. Total Environ. 2020, 731, 139128. [Google Scholar] [CrossRef] [PubMed]
- He, B.; He, J.; Wang, J.; Li, J.; Wang, F. Characteristics of GHG flux from water-air interface along a reclaimed water intake area of the Chaobai River in Shunyi, Beijing. Atmos. Environ. 2018, 172, 102–108. [Google Scholar] [CrossRef]
- Li, X.; Yu, X.; Wu, K.; Feng, Z.; Liu, Y.; Li, X. Land-use zoning management to protecting the Regional Key Ecosystem Services: A case study in the city belt along the Chaobai River, China. Sci. Total Environ. 2021, 762, 143167. [Google Scholar] [CrossRef]
- GB5749-2006; Standard for Drinking Water Quality. Standard Press of China: Beijing, China, 2006.
- Namieśnik, J.; Rabajczyk, A. The speciation and physico-chemical forms of metals in surface waters and sediments. Chem. Speciat. Bioavailab. 2010, 22, 1–24. [Google Scholar] [CrossRef]
- Neal, C.; Williams, R.J.; Neal, M.; Bhardwaj, L.C.; Wickham, H.; Harrow, M.; Hill, L.K. The water quality of the River Thames at a rural site downstream of Oxford. Sci. Total Environ. 2000, 251–252, 441–457. [Google Scholar] [CrossRef]
- Ouyang, T.P.; Zhu, Z.Y.; Kuang, Y.Q.; Huang, N.S.; Tan, J.J.; Guo, G.Z.; Gu, L.S.; Sun, B. Dissolved trace elements in river water: Spatial distribution and the influencing factor, a study for the Pearl River Delta Economic Zone, China. Environ. Geol. 2006, 49, 733–742. [Google Scholar] [CrossRef]
- Xu, X.-Y.; Pu, X.; Liu, X.-L.; Zhang, R.-N.; Zhang, Y.-H.; Gao, J.; Dong, X.; Wang, Z.-K. Tempo-spatial variations of dissolved organic carbon and heavy metals in Miyun section of Chaobai River. J. Ecol. Rural Environ. 2020, 36, 1177–1184. [Google Scholar]
- Gaillardet, J.; Viers, J.; Dupré, B. Trace Elements in River Waters. Treatise Geochem. 2003, 5, 605. [Google Scholar] [CrossRef]
- GB 3838-2002; Environmental Quality Standard for Surface Water. State Environmental Protection Administration: Beijing, China, 2006.
- Liu, S.; Pan, G.; Zhang, Y.; Xu, J.; Ma, R.; Shen, Z.; Dong, S. Risk assessment of soil heavy metals associated with land use variations in the riparian zones of a typical urban river gradient. Ecotoxicol. Environ. Saf. 2019, 181, 435–444. [Google Scholar] [CrossRef] [PubMed]
- Wang, J.; Liu, G.; Liu, H.; Lam, P.K.S. Multivariate statistical evaluation of dissolved trace elements and a water quality assessment in the middle reaches of Huaihe River, Anhui, China. Sci. Total Environ. 2017, 583, 421–431. [Google Scholar] [CrossRef] [PubMed]
- Emenike, P.C.; Tenebe, I.; Ogarekpe, N.; Omole, D.; Nnaji, C. Probabilistic risk assessment and spatial distribution of potentially toxic elements in groundwater sources in Southwestern Nigeria. Sci. Rep. 2019, 9, 1–15. [Google Scholar] [CrossRef] [PubMed]
- Zheng, F.; Guo, X.; Tang, M.; Zhu, D.; Wang, H.; Yang, X.; Chen, B. Variation in pollution status, sources, and risks of soil heavy metals in regions with different levels of urbanization. Sci. Total Environ. 2023, 866, 161355. [Google Scholar] [CrossRef]
- Fallahzadeh, R.A.; Khosravi, R.; Dehdashti, B.; Ghahramani, E.; Omidi, F.; Adli, A.; Miri, M. Spatial distribution variation and probabilistic risk assessment of exposure to chromium in ground water supplies; a case study in the east of Iran. Food Chem Toxicol. 2018, 115, 260–266. [Google Scholar] [CrossRef] [PubMed]
- Tian, H.Z.; Lu, L.; Cheng, K.; Hao, J.M.; Zhao, D.; Wang, Y.; Jia, W.X.; Qiu, P.P. Anthropogenic atmospheric nickel emissions and its distribution characteristics in China. Sci. Total Environ. 2012, 417–418, 148–157. [Google Scholar] [CrossRef]
- Wang, X.; Lu, C.; Cao, Y.; Chen, L.; Abedin, M.Z. Decomposition, decoupling, and future trends of environmental effects in the Beijing-Tianjin-Hebei region: A regional heterogeneity-based analysis. J. Environ. Manag. 2023, 331, 117124. [Google Scholar] [CrossRef] [PubMed]
- Binkowitz, B.S.; Wartenberg, D. Disparity in quantitative risk assessment: A review of input distributions. Risk Anal. 2001, 21, 75–90. [Google Scholar] [CrossRef]
- USDOE. The Risk Assessment Information System (RAIS); U.S. Department of Energy's Oak Ridge Operations Office (ORO): Washington, DC, USA, 2011. [Google Scholar]
- Wang, B.; Yu, G.; Huang, J.; Hu, H. Development of species sensitivity distributions and estimation of HC5 of organochlorine pesticides with five statistical approaches. Ecotoxicology 2008, 17, 716–724. [Google Scholar] [CrossRef] [PubMed]
- Zhao, B.; Bi, B.; Lu, S.; Liu, X.; Ni, B. Occurrence and risk assessment of heavy metals in urban water systems of Beijing, China. Desalin. Water Treat 2020, 208, 312–321. [Google Scholar] [CrossRef]
- Wang, J.; Pu, X.; Zhang, R.; Liu, X.; Zhang, Y.; Wang, J.; Wang, Y.; Meng, M.; Li, S. Spatial-temporal distribution and source apportionment of riverine dissolved organic carbon in the Miyun section of the Chaobai River in Beijing, China. Water-Energy Nexus 2023, 6, 160–166. [Google Scholar] [CrossRef]
- Zheng, F.; Liu, L.; Li, B.; Yang, Y.; Guo, M. Effects of reclaimed water use for scenic water on groundwater environment in a multilayered aquifer system beneath the Chaobai River, Beijing, China: Case study. J. Hydrol. Eng. 2015, 20, B5014003. [Google Scholar] [CrossRef]
- Gupta, S.; Gupta, S.K. Application of Monte Carlo simulation for carcinogenic and non-carcinogenic risks assessment through multi-exposure pathways of heavy metals of river water and sediment, India. Environ. Geochem. Health 2023, 45, 3465–3486. [Google Scholar] [CrossRef] [PubMed]
- Kattel, G.; Reeves, J.; Western, A.; Zhang, W.; Jing, W.; McGowan, S.; Cuo, L.; Scales, P.; Dowling, K.; He, Q. Healthy waterways and ecologically sustainable cities in Beijing-Tianjin-Hebei urban agglomeration (northern China): Challenges and future directions. Wiley Interdiscip. Rev. Water 2021, 8, e1500. [Google Scholar] [CrossRef]
- Li, X.; Yan, C.; Wang, C.; Ma, J.; Li, W.; Liu, J.; Liu, Y. PM2.5-bound elements in Hebei Province, China: Pollution levels, source apportionment and health risks. Sci. Total Environ. 2022, 806, 150440. [Google Scholar] [CrossRef]
- Liu, X.; Guo, C.; Wu, Y.; Huang, C.; Lu, K.; Zhang, Y.; Duan, L.; Cheng, M.; Chai, F.; Mei, F.; et al. Evaluating cost and benefit of air pollution control policies in China: A systematic review. J. Environ. Sci. 2023, 123, 140–155. [Google Scholar] [CrossRef]
- Ren, J.; Han, G.; Liu, J.; Gao, X. Assessing wet season water quality and health risks of Chaobai River: Impacts of natural weathering and anthropogenic activities in a small urban watershed. Urban Water J. 2024, 21, 393–405. [Google Scholar] [CrossRef]
- Yushin, N.; Jakhu, R.; Chaligava, O.; Grozdov, D.; Zinicovscaia, I. Evaluation of the potentially toxic elements and radionuclides in the soil sample of Novaya Zemlya in the Arctic Circle. Environ. Pollut. 2024, 361, 124871. [Google Scholar] [CrossRef] [PubMed]
- Fitzpatrick, J.; Schoeny, R.; Gallagher, K.; Deener, K.; Dockins, C.; Firestone, M.; Jordan, W.; McDonough, M.; Murphy, D.; Olsen, M. US environmental protection Agency's framework for human health risk assessment to inform decision making. Int. J. Risk Assess. Manag. 2017, 20, 3–20. [Google Scholar] [CrossRef]
- USEPA. Supplemental guidance for developing soil screening levels for superfund sites. US Environmental Protection Agency. 2002. Available online: https://nepis.epa.gov/ (accessed on 30 June 2022).


Disclaimer/Publisher’s Note: The statements, opinions and data contained in all publications are solely those of the individual author(s) and contributor(s) and not of MDPI and/or the editor(s). MDPI and/or the editor(s) disclaim responsibility for any injury to people or property resulting from any ideas, methods, instructions or products referred to in the content. |
© 2025 by the authors. Licensee MDPI, Basel, Switzerland. This article is an open access article distributed under the terms and conditions of the Creative Commons Attribution (CC BY) license (https://creativecommons.org/licenses/by/4.0/).