Abstract
Environmental DNA (eDNA) metabarcoding is a powerful method for monitoring aquatic biodiversity and evaluating ecosystem health. In this study, we applied eDNA metabarcoding and a multi-species biotic integrity index (Mt-IBI), constructed by selecting and screening core metrics to capture key ecological responses, to assess the Irtysh River Basin in Xinjiang, China, analyzing samples from 52 sites. The community structure showed high sensitivity to environmental stressors, with dissolved oxygen (DO), total nitrogen (TN), and elevation being key factors, while alien fish richness negatively impacted ecosystem health. These findings highlight the importance of maintaining environmental parameters and controlling invasive species, demonstrating the potential of the Mt-IBI for early detection of ecological degradation and guiding freshwater conservation.
1. Introduction
Environmental DNA (eDNA) metabarcoding is an innovative technique for monitoring biodiversity and assessing ecosystem conditions in freshwater environments [1,2]. By analyzing genetic material in water samples, eDNA metabarcoding enables the detection of organisms, from microscopic to macroscopic [3,4]. eDNA metabarcoding is less labor-intensive than traditional survey methods, is non-destructive, and provides higher taxonomic resolution across multiple groups simultaneously [5,6]. In recent years, eDNA metabarcoding has been widely used to assess aquatic biodiversity and effectively indicate the health of river ecosystems [7,8,9]. By integrating eDNA metabarcoding with a multi-species biotic integrity index, we can comprehensively assess ecosystem health and monitor changes in community composition [10,11].
Microbial communities in aquatic ecosystems are sensitive to changes in ecological health, often more so than macroinvertebrates [12], particularly in severely disturbed regions. Microorganisms play a crucial role in biogeochemical processes, and their abundance responds rapidly to environmental changes [13,14]. Consequently, microbial indices are increasingly used in the assessment of aquatic ecosystems, helping to develop new concepts of ecosystem functioning under various stressors [15,16]. Microbial indices have become reliable tools for biodiversity conservation, and the monitoring and management of aquatic ecosystems [17], especially with advances in eDNA high-throughput sequencing methods [18]. Recent advancements, such as a bacteria-based index of biotic integrity developed by Liu et al. [19,20], demonstrate the effectiveness of microbial indicators in assessing aquatic ecosystem health. Phytoplankton and zooplankton play pivotal roles in aquatic ecosystems, and environmental changes can quickly disrupt their roles, causing notable alterations in community structure and diversity [21,22,23,24]. As foundational producers, phytoplankton form the base of food networks, while zooplankton control their growth, enabling energy transfer between trophic levels and supporting ecosystem function [25].
Previous research has highlighted that index of biotic integrity (IBI) assessments, when based on distinct biological groups, often yield inconsistent results within the same region [26]. Typically, IBIs focus on individual groups, which can overlook shifts in other ecosystem elements and the environmental pressures impacting them. Studies combining biotic indices from multiple biological groups have proven useful in providing a more comprehensive assessment of aquatic ecosystem health and guiding the selection of appropriate methods [8,27,28,29]. This suggests that integrating multiple taxa into assessment frameworks provides a more holistic view of ecosystem health, especially in environments impacted by varying levels of human activity.
Therefore, the primary goal of this study is to develop a multi-species biotic integrity index (Mt-IBI) for the Irtysh River Basin, utilizing eDNA metabarcoding data from bacterial, algal, fungal, and protozoan communities. This study aims to provide a quantitative and comprehensive framework for assessing ecosystem health in this region, offering insights that can guide conservation and management efforts in a river system under varied environmental pressures.
2. Materials and Methods
2.1. Study Area
This study took place in the Altay region (Figure 1) in northern Xinjiang Uygur Autonomous Region, China, near Russia, Kazakhstan, and Mongolia. The region has two major rivers: the Irtysh River and the Ulungur River. The Irtysh River, the second-largest in Xinjiang, is uniquely China’s only river flowing toward the Arctic Ocean [30]. Within China, it spans 546 km and drains a basin covering 57,000 square kilometers, creating a distinctive comb-like water network [31]. The Ulungur River, the second-largest in the Altay region, stretches 821 km and has a basin area of 61,400 square kilometers [32]. Since 1987, a water diversion project has linked the Irtysh River to Ulungur Lake through a 3 km canal, making the Ulungur River an auxiliary water body of the Irtysh River [33].
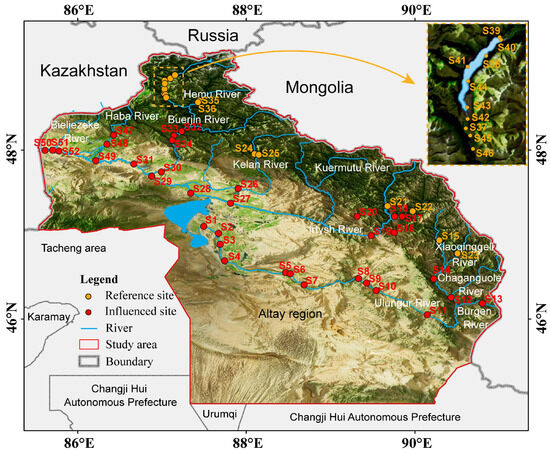
Figure 1.
Location of 52 sampling sites in the Irtysh River basin.
The Irtysh River Basin is characterized by snow cover from November to March and snow-free conditions in July and August, with no significant glacier presence. Notably, discharge from May to July accounts for approximately 70% of annual runoff in the Kayiertesi River Basin, which is a major tributary [34]. Given these hydrological patterns, summer sampling provides a representative snapshot of the basin’s ecological state.
2.2. eDNA Sample Collection and Environmental Variable Measurements
Water sampling took place in July 2023 (Table S1). At each site, we collected 1 L of surface water in a sterile bottle, which was stored on ice. The water samples were vacuum filtered with polycarbonate filters (diameter: 50 mm, pore size: 0.22 μm) within 8 h of collection. Filtration units and tools were treated with a 10% bleach solution (~1% hypochlorous acid) and rinsed twice with ddH2O between samples to remove potential eDNA contamination. Filters were stored in sterile centrifuge tubes at −20 °C until eDNA extraction.
Geographical coordinates were recorded with a GPS device. Water physicochemical properties, such as water temperature (WT), pH, conductivity (Cond), oxidation–reduction potential (ORP), dissolved oxygen (DO), and total dissolved solids (TDS), were measured using a YSI Pro Plus multiparameter instrument (YSI Incorporated, Yellow Springs, OH, USA). Water samples were taken 0.5 m below the surface and analyzed in a lab for chemical oxygen demand (COD), total nitrogen (TN), and total phosphorus (TP). All measurements followed the Environmental Quality Standards for Surface Water in China (fourth edition).
2.3. eDNA Extraction, Sequencing, and Bioinformatic
Genomic DNA was extracted from polycarbonate filters using a DNeasy Blood and Tissue Kit (QIAGEN GmbH, Hilden, Germany) following the manufacturer’s protocol. DNA quality was verified through agarose gel electrophoresis, and the extracts were preserved at −20 °C for subsequent processing. The bacterial 16S rRNA gene and the eukaryotic 18S rRNA gene were amplified with primers 515F and 806R for 16S (515F: GTGYCAGCMGCCGCGGTAA; 806R: GGACTACNVGGGTWTCTAAT) [35], and primers 1380F and 1510R for 18S (1380F: TCCCTGCCHTTTGTACACAC; 1510R: CCTTCYGCAGGTTCACCTAC) [36], respectively. After PCR, the products were purified, quantified, and evaluated prior to high-throughput sequencing on an Illumina PE250 Platform (BIOZERON Biotechnology Co., Ltd., Shanghai, China) employing a 2 × 250 bp paired-end approach.
Bioinformatics analyses followed the pipeline described in He et al. [37]. Paired sequences were imported into QIIME 2 separately [38]. Quality control of the sequences was conducted, followed by the creation of amplicon sequence variant (ASV) tables using the DADA2 plugin [39]. Based on the resulting ASV count table and sequences, de novo OTU clustering at a 97% identity threshold was performed using the vsearch plugin [40]. Taxonomy assignment was carried out via the q2-feature-classifier plugin [41] and the Greengenes2 database for bacteria [42]. Following the CRABS tool protocol [43], we constructed a non-redundant comprehensive database by extracting 18S rRNA gene sequences for algae, fungi, and protozoa from both the Nucleotide Sequence database (NT) of the National Center for Biotechnology Information (NCBI-nt, https://www.ncbi.nlm.nih.gov/, accessed on 21 August 2024) and the Barcode of Life Data System (BOLD, https://www.boldsystems.org/, accessed on 16 August 2024). This approach ensures extensive coverage and minimizes redundancy, thereby enhancing the accuracy of our taxonomic assignments.
2.4. Development of the Mt-IBI
The Mt-IBI was established following Zhu et al. [10] and adjusted for the environmental conditions of the Irtysh River Basin. The index was created in four steps: (1) categorization of reference and influenced sites, (2) selection of candidate metrics, (3) screening of core metrics, and (4) calculation of the final index.
2.4.1. Categorization of Reference and Influenced Sites
The initial phase of creating the biotic integrity index involves identifying the reference and influenced sites. Reference sites are usually chosen from river segments without human disturbances [31]. In this study, reference sites were selected based on three primary criteria to minimize anthropogenic impacts and ensure high water quality. Firstly, sites had to meet the COD Class I standard as defined by China’s National Environmental Quality Standards for Surface Water (GB 3838-2002) [44], indicating excellent water quality with minimal organic pollutants. Secondly, extensive fish sampling at these sites revealed no presence of non-native or invasive species, thereby maintaining the biological integrity of the ecosystem. Lastly, reference sites were strategically located in the upstream regions of the main river and its tributaries, which are areas presumed to experience lower human disturbances. While this study did not consider certain environmental factors, such as heavy metals and soil physicochemical properties, the upstream location of these sites was used as a proxy for reduced anthropogenic influence (Table S2).
2.4.2. Selection of Candidate Metrics
Candidate metrics were chosen to represent various aspects of community structure and function, such as diversity (e.g., Shannon and Simpson indices), composition (e.g., dominant taxa at different taxonomic levels), functional processes, and keystone species. To capture the ecological response of each species comprehensively, 235 candidate metrics were selected, covering bacteria, fungi, algae, and protozoan communities (Table S3). Diversity indices were computed in R using the vegan package, based on OTU tables [45]. Composition metrics were based on the dominant taxa at various taxonomic levels, determined by the relative abundance of OTUs. Function metrics were derived from microbial metabolic activities, phenotypic categories, and functional pathways using FAPROTAX v1.2.10 [46]. Keystone species were pinpointed by identifying high-degree nodes within the bipartite network [47].
2.4.3. Screening of the Metrics
Core metrics were screened through a three-step approach involving range, response, and redundancy tests. Metrics were excluded if they were absent in more than 30% of the sites, according to the range test. Next, Mann–Whitney U tests and boxplot comparisons were applied to identify metrics that exhibited notable differences between reference and influenced sites. Metrics that exhibited clear ecological responses to environmental stressors were retained [48]. Finally, metrics with high correlation coefficients (≥0.70) were excluded to ensure that the remaining core metrics were independent and non-redundant (Table S4).
2.4.4. Calculation of the Mt-IBI
The values for each core metric were standardized and then combined to calculate the Mt-IBI (Table S5). Metrics that increased in response to disturbance were standardized using Equation (1), while those that decreased were standardized with Equation (2) [10]. The final Mt-IBI score for each site was calculated by summing the standardized values of the core metrics.
We adopted the 25th-percentile IBI value from the reference site as a baseline for evaluating ecosystem health. Locations exceeding this threshold were categorized as healthy. Those with lower scores were classified into four categories, ranging from best to worst ecosystem health: sub-healthy, common, poor, and bad (Table S6).
2.5. Statistical Analysis
We used a constrained ordination method to examine the relationship between environmental variables and community structures. Detrended correspondence analysis (DCA) of bacterial, algal, fungal, and protozoan communities revealed axis lengths below three, suggesting that redundancy analysis (RDA) was appropriate for these groups. Total dissolved solids (TDS) were excluded from the analysis due to strong collinearity as shown by the variance inflation factor (VIF). Forward selection combined with Monte Carlo permutation tests were used to identify environmental variables strongly linked to community structures. All statistical procedures were conducted in R version 4.3.2, utilizing the stats and vegan packages [49].
We then identified five potential explanatory variables that could influence IBI: alien fish richness (unpublished data), human footprint index [50], population density [51], elevation, and river width (Table S1). These variables were selected to represent both anthropogenic impacts and natural environmental conditions. A simple linear regression analysis was conducted using the lm function in R to determine the effects of these five variables on the calculated Mt-IBI values. Regression diagnostics, including checks for multicollinearity and residual analysis, were performed to ensure the validity of the model [52]. Regression coefficients were visualized using the ggplot2 package [53]. By employing the plspm package, partial least squares path modeling (PLS-PM) was used to uncover both the direct and indirect variables influencing the Mt-IBI. Principal component analysis (PCA) was used to reduce the dimensionality of the observed variables related to water nutrients [54,55]. The first principal component was extracted to construct the path analysis (Table S7).
3. Results
3.1. Analysis of Community Composition
A total of 5,434,975 high-quality sequences were detected, with the number of sequences per sample ranging from 57,724 to 183,015 (Table S1). These eDNA data were classified into 2002 valid OTUs, including 1670 bacterial OTUs, 96 algal OTUs, 164 fungal OTUs, and 73 protozoan OTUs. These OTUs were assigned to 56 phyla, 152 classes, 370 orders, 693 families, and 1283 genera.
High-throughput 16S rRNA gene sequencing was used to analyze the species composition of prokaryotic microorganisms at both the phylum and genus levels. Pseudomonadota was the most abundant (49.5%), followed by Actinomycetota (17.3%), Bacillota_I (12.8%), and Deinococcota (8.5%), with the top eight phyla accounting for 99.2% (Figure 2a). At the family level, Moraxellaceae was the most abundant (12.8%), followed by Exiguobacteraceae (10.9%), Deinococcaceae (8.5%), and Sphingomonadaceae_486827 (8.5%), with the top ten families accounting for 70.0% (Figure 2b).
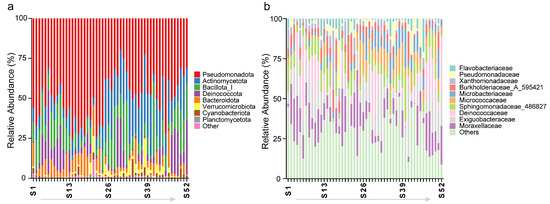
Figure 2.
Relative abundance distribution of the microbial communities at the (a) phylum and (b) family levels across 52 sampling sites. The light-colored arrow from S1 to S52 indicates that the sample points are numbered incrementally in the direction of the arrow.
Using 18S high-throughput sequencing, we analyzed the distribution of algae, fungi, and protozoa at the class and genus levels. The most abundant class was Chlorophyceae (32.5%), followed by Dothideomycetes (26.1%), Spirotrichea (8.5%), and Leotiomycetes (7.7%), with the top 10 classes accounting for 93.7% (Figure 3a). At the genus level, Mychonastes (20.9%) was the most abundant, followed by Cladosporium (13.3%), Scenedesmus (6.4%), and Halteria (5.2%), with the 10 dominant genera accounting for 61.7% (Figure 3b).
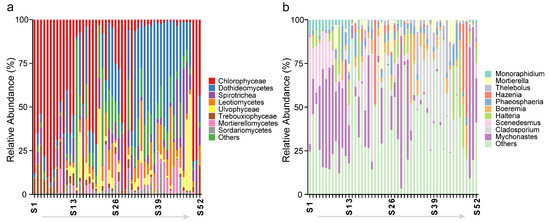
Figure 3.
Relative abundance distribution of the algal, fungal, and protozoan communities at the (a) class and (b) genus levels across 52 sampling sites. The light-colored arrow from S1 to S52 indicates that the sample points are numbered incrementally in the direction of the arrow.
3.2. Associations Between Environmental Factors and Communities in the Irtysh River Basin
RDA analyses (Figure 4) showed that certain environmental variables were significantly correlated with microbial community composition. For the bacterial community, dissolved oxygen (DO) exhibited the strongest correlation (R2 = 0.5257, p < 0.001), followed by total nitrogen (TN), conductivity (Cond), elevation (Elev), oxidation–reduction potential (ORP), pH, total phosphorus (TP), chemical oxygen demand (COD), and water temperature (WT) (Figure 4a). For algal, fungal, and protozoan communities, DO also had the highest correlation (R2 = 0.2962, p < 0.001), whereas TN, TP, ORP, pH, Elev, and Cond were weaker but still significant (Figure 4b). COD and WT did not show significant correlations in this group. These findings highlight links between environmental factors and community composition.
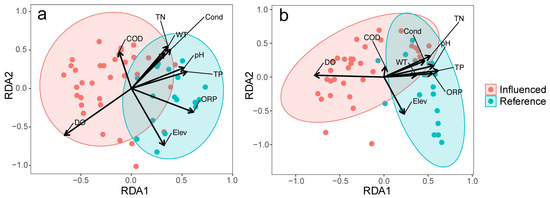
Figure 4.
RDA ordination plot illustrating the relationship between environmental factors and communities of (a) microorganisms and (b) algae, fungi, and protozoa. Abbreviations: COD, chemical oxygen demand; Cond, conductivity; DO, dissolved oxygen; Elev, elevation; TN, total nitrogen; TP, total phosphorus; WT, water temperature.
3.3. Development of the Mt-IBI Using Taxonomy-Assigned eDNA Metabarcoding Data
Four screening tests were applied to identify the core metrics. Initially, 65 candidate metrics were removed after the range test. Next, 72 metrics demonstrating significant difference between the reference and influenced sites (Mann–Whitney U test, p < 0.05) were eliminated. The third step retained 63 metrics with strong sensitivity between the two site types, confirmed by box plot analysis. Finally, 24 metrics that showed high correlation with others (Pearson’s correlation test, p < 0.01 and r > 0.70) were considered redundant and excluded (Table S4).
We identified eleven indicators (Table S3): M60 (order richness of fungi), M68 (order richness of bacteria), M78 (relative abundance of Trebouxiophyceae), M82 (relative abundance of Sphaeropleales), M93 (relative abundance of Agaricomycetes), M111 (relative abundance of Cladosporium), M120 (relative abundance of Oligohymenophorea), M147 (relative abundance of Verrucomicrobiae), M155 (relative abundance of Bacillales), M194 (relative abundance of Sphingomonas), and M224 (relative abundance of keystone species with a degree of five). Table S5 contains the formulas used to calculate these core metrics.
A consistent approach was applied to compute Mt-IBI values for each sampling site, forming the basis for an aquatic health assessment standard in our study region (Table S6). The results indicated that 30.8%, 7.8%, 13.7%, and 25.0% of the sites were classified as healthy, sub-healthy, common, and poor health categories, respectively.
Linear model results (Figure 5b) showed that the richness of alien fish species had a significant negative effect on the Mt-IBI (p < 0.001). In contrast, the human footprint index, population density, river width, and elevation had no statistically significant effect on the Mt-IBI. The estimates for these variables were −0.3614, 0.3240, 0.2611, and 0.3977, with p-values greater than 0.05. To further explore these interactions, we conducted a PLS path analysis encompassing alien fish richness, human footprint index, population density, and geographical factors (elevation and river width), as well as key water quality parameters (water organics and water nutrients). The resulting path diagram (Figure 5c) indicates that alien fish richness has a significant positive effect on water organic load (path coefficient = 0.595, p < 0.001). Notably, water organics and water nutrients both exhibit significant negative relationships with the Mt-IBI (path coefficients = −0.427, p = 0.001 and −0.257, p = 0.041, respectively).
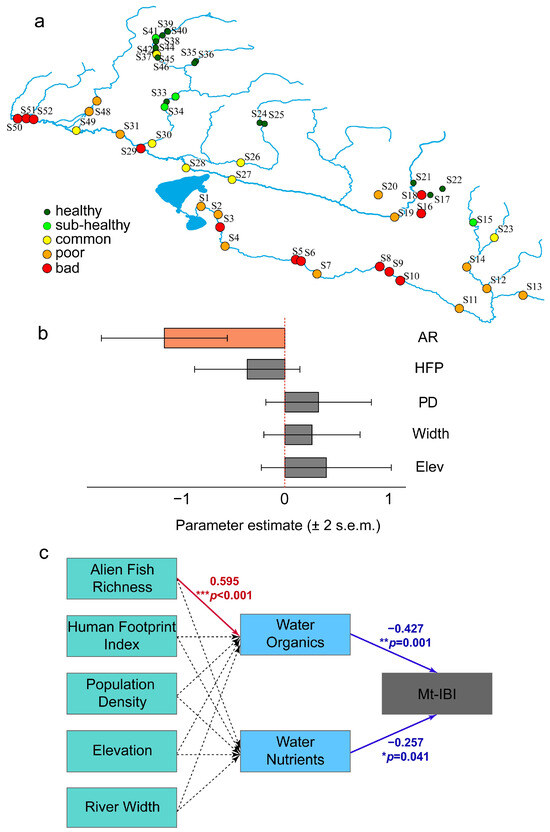
Figure 5.
(a) A health assessment result using the multi-species biotic integrity index (Mt-IBI), (b) response of the Mt-IBI to human activities determined using a linear regression model, and (c) path diagrams indicating direct and indirect pathways affecting the Mt-IBI. Solid lines represent statistically significant (p < 0.05) effects, while dashed lines denote nonsignificant relationships. Abbreviations: AR, alien fish richness; Elev, elevation; HFP, human footprint index; PD, population density; Width, river width.
4. Discussion
The development and application of the Mt-IBI in this study provide an innovative approach to assess ecosystem health based on the integration of multiple biological groups. By focusing on microbial, protozoan, fungal, and algal communities, the Mt-IBI offers a more holistic perspective compared to traditional single-taxa indices. The higher sensitivity of the Mt-IBI to changes in ecological conditions, compared to conventional indices, demonstrates its potential as a valuable tool for early detection of ecosystem degradation. The inclusion of metrics related to keystone species and functional groups further enhances the index’s ability to reflect changes in ecosystem dynamics and resilience [56,57]. Through analysis of the community composition across 52 sampling sites in the Irtysh River Basin, this research highlights the role of both environmental variables and anthropogenic factors in shaping microbial as well as algal, fungal, and protozoan communities. This approach provides a comprehensive understanding of ecosystem health, revealing new insights into how external pressures influence the structure and function of riverine biota.
The ordination analysis revealed that dissolved oxygen (DO), total nitrogen (TN), and elevation exhibited strong correlations with microbial, as well as algal, fungal, and protozoan communities. DO showed the highest correlation for both groups, suggesting its potential importance in shaping community composition and structure. This finding is consistent with earlier studies that demonstrated the sensitivity of microbial communities to oxygen availability, which directly influences metabolic activity and nutrient cycling processes [58,59]. Similarly, TN, conductivity, and elevation were significantly correlated with microbial community composition, reflecting how nutrient levels and geographic factors may shape the microbial diversity and distribution [60].
A possible explanation for the lack of significant correlation between COD and algae, fungi, and protozoa is the relatively low level of organic pollution in the watershed [61]. According to the National Environmental Quality Standards for Surface Water of China [44], COD values at 81% (42/52) of sites measured in this study were above Class I, and the total phosphorus (TP) values at all sites exceeded Class II (Table S1). Similarly, water temperature (WT) may not have had a significant effect because the temperature variations across sampling sites were relatively small, potentially falling within a tolerance range that does not substantially affect community composition. Seasonal variations in nutrient cycling and resource availability could further influence the sensitivity of various communities to COD. To fully understand these interrelationships and their effects on community composition, future studies should incorporate multi-seasonal sampling. Additionally, the environmental factors considered in this study were limited, potentially influencing the screening outcomes. Future research should incorporate factors like land use, soil quality indices, and biological interactions.
The separation between the reference and influenced sites was distinct in bacterial, algal, fungal, and protozoan RDA plots, with influenced sites closely associated with higher levels of nutrient enrichment (TN and TP) and lower levels of DO. In contrast, reference sites were generally characterized by a higher pH, ORP, and conductivity, which are factors that also contributed to the differentiation of bacterial community structure. These findings suggest that nutrient loading and changes in physical-chemical parameters associated with anthropogenic impacts are key drivers of variation in aquatic microbial communities [62]. Elevation also played a role in differentiating between reference and influenced sites, potentially due to its effect on water flow, temperature, and overall habitat characteristics, which in turn may be related to bacterial, algal, fungal, and protozoan community structures [63].
In response to fishery poverty alleviation policies, the Altay region of Xinjiang province has vigorously developed cold-water fish farming industries in the attached waters around Ulungur Lake and the Irtysh River Basin. However, certain intentional introductions (such as stocked Hucho taimen and Brachymystax lenok from the Heilongjiang River Basin) and unintentional introductions (such as Pseudorasbora parva and Abbottina rivularis) have posed threats to the survival of native fish species and the stability of ecosystems [64]. Our results indicate that the richness of alien fish was the only variable with a significant negative estimate, underscoring its dominant role in influencing river health. Although previous research has shown that non-native species can reduce biodiversity and alter community composition and ecosystem functioning [65,66], our main purpose in using alien fish richness was to represent anthropogenic factors (e.g., fish stocking and aquaculture) in the Irtysh River Basin [31]. Still, the significant relationship between alien fish richness and the Mt-IBI underscores the need to understand the specific mechanisms by which non-native fish impact native communities. Alien species can exert significant pressure on native communities through competition, predation, and habitat alteration, leading to cascading effects that disrupt ecological balance [67].
The lack of significant relationships between the Mt-IBI and other explanatory variables, such as river width, and elevation, suggests that these factors may exert subtle or indirect influence on ecosystem health. The human footprint index and population density were assessed at a regional scale, which may not capture localized impacts on aquatic ecosystems. Fine-scale variations in land use and altered hydrology might have more direct effects on ecosystem health but were not fully resolved in our dataset [68,69]. Meanwhile, industrial activities, such as the discharge of pollutants and habitat alteration, as well as agricultural practices, including runoff of fertilizers and pesticides, can directly influence water quality and ecosystem health. To clarify these impacts, future studies will incorporate detailed industrial and agricultural metrics to better assess their relationships with biotic integrity [54]. It is also important to note that the single-season design of our survey is a limitation that may influence the detection of significant relationships. Aquatic ecosystems are subject to seasonal variations that affect both biotic and abiotic components. Conducting multi-seasonal surveys would provide a more comprehensive understanding of temporal dynamics and potentially reveal significant relationships that are not apparent in a single-season snapshot.
However, there are several limitations to the present study that should be addressed in future research. One limitation is the dependence on data from a single sampling event, which may not fully capture temporal variations in community composition and environmental conditions. Seasonal fluctuations can have significant effects on microbial as well as algal, fungal, and protozoan communities, and repeated sampling across different seasons would provide a more comprehensive assessment of ecosystem health [70]. Another limitation is the potential bias introduced by the eDNA metabarcoding approach, particularly in terms of primer specificity and amplification efficiency, which could influence the detection of certain taxa [71]. Budgetary constraints have led most current studies [9,55,72,73], including ours, to use single primer sets for DNA amplification. This approach facilitates the efficient processing of large sample numbers within existing financial constraints. Future studies should consider using multiple primer sets and improving the coverage of reference databases to enhance the accuracy and reliability of biodiversity assessments. Additionally, emerging technologies, such as digital droplet PCR and quantitative PCR methods, could be incorporated in future studies to enhance the accuracy of eDNA metabarcoding [74,75]. Primer selection bias represents just one factor contributing to the uncertainty of eDNA detection. Further research is required to determine how eDNA can reliably assess biodiversity. To assess species relative abundance or biomass, eDNA metabarcoding techniques should be integrated with traditional monitoring methods to mitigate biases in eDNA-based quantitative evaluations [76].
5. Conclusions
In conclusion, the results of this study highlight the practicality of combining environmental DNA (eDNA) metabarcoding with the multi-species biotic integrity index (Mt-IBI) as an effective method for assessing the health of aquatic ecosystems. The Mt-IBI developed here is highly sensitive to changes in community composition and environmental conditions, providing a robust framework for monitoring and managing freshwater ecosystems. Our study highlights the distinct responses of bacterial as well as algal, fungal, and protozoan communities to environmental factors, with dissolved oxygen being the most significant factor for both. Other important factors include nutrient concentrations (TN and TP), redox conditions (ORP), and physical parameters such as elevation and conductivity. Our findings also emphasize the significant adverse impacts of human-induced disturbances, such as the introduction of alien fish species, on the biological integrity of river ecosystems. By integrating data from different biological groups, the Mt-IBI offers a powerful tool for understanding and conserving the ecological health of complex aquatic systems. Although the Irtysh River Basin serves as an ideal test case for this study, broader applicability should be verified through future research conducted in varied ecological contexts.
Supplementary Materials
The following supporting information can be downloaded at https://www.mdpi.com/article/10.3390/w17020246/s1: Table S1: Summary of environmental variables and human activity information of 52 sampling sites; Table S2: Mean values (±SE) and the differences between influenced sites and reference sites; Table S3: The list of candidate metrics for developing the Mt-IBI; Table S4: Correlation matrix among metrics selection to compose the Mt-IBI of the Irtysh River; Table S5: The extreme values, anchors, and formulas calculation for core metrics in Mt-IBI development; Table S6: Mt-IBI health assessment at 52 sampling sites of the study area; Table S7: Results of principal component analysis of variables group.
Author Contributions
Conceptualization, T.S., F.Z., J.C. and J.L.; methodology, T.S. and F.Z.; software, T.S.; validation, J.C. and J.L.; formal analysis, T.S., F.Z. and Y.H.; investigation, T.S., F.Z., Y.H., L.F., Y.Z. and Y.L.; data curation, T.S. and F.Z.; writing—original draft preparation, T.S. and F.Z.; writing—review and editing, J.C. and J.L.; visualization, T.S., F.Z. and Y.H.; supervision, J.C. and J.L.; project administration, T.S., J.L. and J.C.; funding acquisition, J.C. All authors have read and agreed to the published version of the manuscript.
Funding
This research was funded by the State Key Development Programs of Basic Research of China [grant number 2024YFF1307200] and the Third Xinjiang Scientific Expedition Program [grant number 2021xjkk0600].
Data Availability Statement
The data supporting this study’s findings are available from the corresponding authors upon reasonable request.
Acknowledgments
We would like to thank three anonymous reviewers who gave constructive comments on the manuscript.
Conflicts of Interest
The authors declare no conflicts of interest.
References
- Thomsen, P.F.; Kielgast, J.O.S.; Iversen, L.L.; Wiuf, C.; Rasmussen, M.; Gilbert, M.T.P.; Orlando, L.; Willerslev, E. Monitoring endangered freshwater biodiversity using environmental DNA. Mol. Ecol. 2012, 21, 2565–2573. [Google Scholar] [CrossRef] [PubMed]
- Taberlet, P.; Bonin, A.; Zinger, L.; Coissac, E. Environmental DNA: For Biodiversity Research and Monitoring; Oxford University Press: Oxford, UK, 2018. [Google Scholar] [CrossRef]
- Deiner, K.; Fronhofer, E.A.; Mächler, E.; Walser, J.-C.; Altermatt, F. Environmental DNA reveals that rivers are conveyer belts of biodiversity information. Nat. Commun. 2016, 7, 12544. [Google Scholar] [CrossRef] [PubMed]
- Valentini, A.; Taberlet, P.; Miaud, C.; Civade, R.; Herder, J.; Thomsen, P.F.; Bellemain, E.; Besnard, A.; Coissac, E.; Boyer, F.; et al. Next-generation monitoring of aquatic biodiversity using environmental DNA metabarcoding. Mol. Ecol. 2016, 25, 929–942. [Google Scholar] [CrossRef] [PubMed]
- Deiner, K.; Bik, H.M.; Mächler, E.; Seymour, M.; Lacoursière-Roussel, A.; Altermatt, F.; Creer, S.; Bista, I.; Lodge, D.M.; de Vere, N.; et al. Environmental DNA metabarcoding: Transforming how we survey animal and plant communities. Mol. Ecol. 2017, 26, 5872–5895. [Google Scholar] [CrossRef]
- Eichmiller, J.J.; Miller, L.M.; Sorensen, P.W. Optimizing techniques to capture and extract environmental DNA for detection and quantification of fish. Mol. Ecol. Resour. 2016, 16, 56–68. [Google Scholar] [CrossRef]
- Elbrecht, V.; Vamos, E.E.; Meissner, K.; Aroviita, J.; Leese, F.; Yu, D. Assessing strengths and weaknesses of DNA metabarcoding-based macroinvertebrate identification for routine stream monitoring. Methods Ecol. Evol. 2017, 8, 1265–1275. [Google Scholar] [CrossRef]
- Huang, X.; Xu, J.; Liu, B.; Guan, X.; Li, J. Assessment of Aquatic Ecosystem Health with Indices of Biotic Integrity (IBIs) in the Ganjiang River System, China. Water 2022, 14, 278. [Google Scholar] [CrossRef]
- Wang, S.; Zhang, P.; Zhang, D.; Chang, J. Evaluation and comparison of the benthic and microbial indices of biotic integrity for urban lakes based on environmental DNA and its management implications. J. Environ. Manag. 2023, 341, 118026. [Google Scholar] [CrossRef]
- Zhu, M.; Yang, N.; Li, Y.; Zhang, W.; Wang, L.; Niu, L.; Wang, L.; Zhang, H. Assessing the effects of cascade dams on river ecological status using multi-species interaction-based index of biotic integrity (Mt-IBI). J. Environ. Manag. 2021, 299, 113585. [Google Scholar] [CrossRef]
- Hu, H.; Wei, X.Y.; Liu, L.; Wang, Y.B.; Jia, H.J.; Bu, L.K.; Pei, D.S. Supervised machine learning improves general applicability of eDNA metabarcoding for reservoir health monitoring. Water Res. 2023, 246, 120686. [Google Scholar] [CrossRef]
- Lear, G.; Boothroyd, I.K.G.; Turner, S.J.; Roberts, K.; Lewis, G.D. A comparison of bacteria and benthic invertebrates as indicators of ecological health in streams. Freshw. Biol. 2009, 54, 1532–1543. [Google Scholar] [CrossRef]
- Sims, A.; Zhang, Y.; Gajaraj, S.; Brown, P.B.; Hu, Z. Toward the development of microbial indicators for wetland assessment. Water Res. 2013, 47, 1711–1725. [Google Scholar] [CrossRef] [PubMed]
- David, G.M.; López-García, P.; Moreira, D.; Alric, B.; Deschamps, P.; Bertolino, P.; Restoux, G.; Rochelle-Newall, E.; Thébault, E.; Simon, M.; et al. Small freshwater ecosystems with dissimilar microbial communities exhibit similar temporal patterns. Mol. Ecol. 2021, 30, 2162–2177. [Google Scholar] [CrossRef]
- Zhang, L.; Fang, W.; Li, X.; Lu, W.; Li, J. Strong linkages between dissolved organic matter and the aquatic bacterial community in an urban river. Water Res. 2020, 184, 116089. [Google Scholar] [CrossRef]
- Li, Y.; Wu, H.; Shen, Y.; Wang, C.; Wang, P.; Zhang, W.; Gao, Y.; Niu, L. Statistical determination of crucial taxa indicative of pollution gradients in sediments of Lake Taihu, China. Environ. Pollut. 2019, 246, 753–762. [Google Scholar] [CrossRef]
- Tamames, J.; Abellán, J.J.; Pignatelli, M.; Camacho, A.; Moya, A. Environmental distribution of prokaryotic taxa. BMC Microbiol. 2010, 10, 85. [Google Scholar] [CrossRef]
- Huang, S.; Yoshitake, K.; Watabe, S.; Asakawa, S. Environmental DNA study on aquatic ecosystem monitoring and management: Recent advances and prospects. J. Environ. Manag. 2022, 323, 116310. [Google Scholar] [CrossRef]
- Liu, Q.; Yin, S.; Yi, Y. A bacteria-based index of biotic integrity indicates aquatic ecosystem restoration. Environ. Sci. Ecotechnol. 2024, 22, 100451. [Google Scholar] [CrossRef]
- Liu, Q.; Yin, S.; Luo, Q.; Yi, Y. A bacteria-based index of biotic integrity assesses aquatic ecosystems effectively in rewetted long-term dry river channel after water replenishment. Ambio 2024. [Google Scholar] [CrossRef]
- Wang, Z.; Huang, W.; Zhu, D.; Huang, Q.; Wu, L.; Liu, X. Determining Critical Thresholds of Environmental Flow Restoration Based on Planktonic Index of Biotic Integrity (P-IBI): A Case Study in the Typical Tributaries of Poyang Lake. Int. J. Environ. Res. Public Health 2023, 20, 169. [Google Scholar] [CrossRef]
- Zhao, K.; Wang, L.; You, Q.; Zhang, J.; Pang, W.; Wang, Q. Impact of cyanobacterial bloom intensity on plankton ecosystem functioning measured by eukaryotic phytoplankton and zooplankton indicators. Ecol. Indic. 2022, 140, 109028. [Google Scholar] [CrossRef]
- Zhang, Y.; Ban, X.; Li, E.; Wang, Z.; Xiao, F. Evaluating ecological health in the middle-lower reaches of the Hanjiang River with cascade reservoirs using the Planktonic index of biotic integrity (P-IBI). Ecol. Indic. 2020, 114, 106282. [Google Scholar] [CrossRef]
- Qin, M.; Fan, P.; Li, Y.; Wang, H.; Wang, W.; Liu, H.; Messyasz, B.; Goldyn, R.; Li, B. Assessing the Ecosystem Health of Large Drinking-Water Reservoirs Based on the Phytoplankton Index of Biotic Integrity (P-IBI): A Case Study of Danjiangkou Reservoir. Sustainability 2023, 15, 5282. [Google Scholar] [CrossRef]
- Yang, J.R.; Lv, H.; Isabwe, A.; Liu, L.; Yu, X.; Chen, H.; Yang, J. Disturbance-induced phytoplankton regime shifts and recovery of cyanobacteria dominance in two subtropical reservoirs. Water Res. 2017, 120, 52–63. [Google Scholar] [CrossRef]
- Bae, M.-J.; Li, F.; Kwon, Y.-S.; Chung, N.; Choi, H.; Hwang, S.-J.; Park, Y.-S. Concordance of diatom, macroinvertebrate and fish assemblages in streams at nested spatial scales: Implications for ecological integrity. Ecol. Indic. 2014, 47, 89–101. [Google Scholar] [CrossRef]
- Young, S.S.; Yang, H.N.; Huang, D.J.; Liu, S.M.; Huang, Y.H.; Chiang, C.T.; Liu, J.W. Using Benthic Macroinvertebrate and Fish Communities as Bioindicators of the Tanshui River Basin Around the Greater Taipei Area—Multivariate Analysis of Spatial Variation Related to Levels of Water Pollution. Int. J. Environ. Res. Public Health 2014, 11, 7116–7143. [Google Scholar] [CrossRef]
- Wu, J.; Mao, R.; Li, M.; Xia, J.; Song, J.; Cheng, D.; Sun, H. Assessment of aquatic ecological health based on determination of biological community variability of fish and macroinvertebrates in the Weihe River Basin, China. J. Environ. Manag. 2020, 267, 110651. [Google Scholar] [CrossRef]
- Yang, J.; Zhang, L.; Mu, Y.; Wang, J.; Yu, H.; Zhang, X. Unsupervised biological integrity assessment by eDNA biomonitoring of multi-trophic aquatic taxa. Environ. Int. 2023, 175, 107950. [Google Scholar] [CrossRef]
- Duman, M.; Nadila, M. Analysis of the spatial and temporal variation characteristics of hydrometeorological elements in irtysh river basin. Energy Energy Conserv. 2017, 126, 119–120, (In Chinese with English abstract). [Google Scholar]
- Li, X.; Jia, P.; Niu, C.; Xing, Y.; Li, H.; Liu, H.; Tang, W.; Zhao, Y. Species diversity of freshwater fish and assessment on watershed health in the Irtysh River and Ulungur River basins in Xinjiang, China. Biodivers. Sci. 2020, 28, 422–434. [Google Scholar] [CrossRef]
- Nurlan, H. Hydrological characteristics in the ulungur river basin. Arid Zone Res. 2014, 31, 798–802, (In Chinese with English abstract). [Google Scholar]
- Liu, J. Analysis on the water amount flowing into ulungur lake. Energy Energy Conserv. 2015, 20, 103–105, (In Chinese with English abstract). [Google Scholar]
- Zhang, W.; Kang, S.-c.; Shen, Y.-p.; He, J.-q.; Chen, A.-a. Response of snow hydrological processes to a changing climate during 1961 to 2016 in the headwater of Irtysh River Basin, Chinese Altai Mountains. J. Mt. Sci. 2017, 14, 2295–2310. [Google Scholar] [CrossRef]
- Caporaso, J.G.; Lauber, C.L.; Walters, W.A.; Berg-Lyons, D.; Lozupone, C.A.; Turnbaugh, P.J.; Fierer, N.; Knight, R. Global patterns of 16S rRNA diversity at a depth of millions of sequences per sample. Proc. Natl. Acad. Sci. USA 2011, 108, 4516–4522. [Google Scholar] [CrossRef] [PubMed]
- Amaral-Zettler, L.A.; McCliment, E.A.; Ducklow, H.W.; Huse, S.M. A Method for Studying Protistan Diversity Using Massively Parallel Sequencing of V9 Hypervariable Regions of Small-Subunit Ribosomal RNA Genes. PLoS ONE 2009, 4, e6372. [Google Scholar] [CrossRef]
- He, X.; Gilmore, S.R.; Sutherland, T.F.; Hajibabaei, M.; Miller, K.M.; Westfall, K.M.; Pawlowski, J.; Abbott, C.L. Biotic signals associated with benthic impacts of salmon farms from eDNA metabarcoding of sediments. Mol. Ecol. 2021, 30, 3158–3174. [Google Scholar] [CrossRef]
- Bolyen, E.; Rideout, J.R.; Dillon, M.R.; Bokulich, N.A.; Abnet, C.C.; Al-Ghalith, G.A.; Alexander, H.; Alm, E.J.; Arumugam, M.; Asnicar, F.; et al. Reproducible, interactive, scalable and extensible microbiome data science using QIIME 2. Nat. Biotechnol. 2019, 37, 852–857. [Google Scholar] [CrossRef]
- Callahan, B.J.; McMurdie, P.J.; Rosen, M.J.; Han, A.W.; Johnson, A.J.A.; Holmes, S.P. DADA2: High-resolution sample inference from Illumina amplicon data. Nat. Methods 2016, 13, 581–583. [Google Scholar] [CrossRef]
- Rognes, T.; Flouri, T.; Nichols, B.; Quince, C.; Mahé, F. VSEARCH: A versatile open source tool for metagenomics. PeerJ 2016, 4, e2584. [Google Scholar] [CrossRef]
- Bokulich, N.; Dillon, M.; Bolyen, E.; Kaehler, B.; Huttley, G.; Caporaso, J. q2-sample-classifier: Machine-learning tools for microbiome classification and regression. J. Open Source Softw. 2018, 3, 934. [Google Scholar] [CrossRef]
- McDonald, D.; Jiang, Y.; Balaban, M.; Cantrell, K.; Zhu, Q.; Gonzalez, A.; Morton, J.T.; Nicolaou, G.; Parks, D.H.; Karst, S.M.; et al. Greengenes2 unifies microbial data in a single reference tree. Nat. Biotechnol. 2024, 42, 715–718. [Google Scholar] [CrossRef] [PubMed]
- Jeunen, G.-J.; Dowle, E.; Edgecombe, J.; von Ammon, U.; Gemmell, N.J.; Cross, H. crabs—A software program to generate curated reference databases for metabarcoding sequencing data. Mol. Ecol. Resour. 2023, 23, 725–738. [Google Scholar] [CrossRef] [PubMed]
- GB3838-2002; State Environmental Protection Administration (SEPA) of China, Beijing of Regula. Environmental Quality Standard for Surface Water. Standards Press: Beijing, China, 2002; pp. 1–8.
- Niu, L.; Li, Y.; Wang, P.; Zhang, W.; Wang, C.; Wang, Q. Understanding the Linkage between Elevation and the Activated-Sludge Bacterial Community along a 3,600-Meter Elevation Gradient in China. Appl. Environ. Microbiol. 2015, 81, 6567–6576. [Google Scholar] [CrossRef] [PubMed]
- Louca, S.; Parfrey, L.W.; Doebeli, M. Decoupling function and taxonomy in the global ocean microbiome. Science 2016, 353, 1272–1277. [Google Scholar] [CrossRef]
- Berry, D.; Widder, S. Deciphering microbial interactions and detecting keystone species with co-occurrence networks. Front. Microbiol. 2014, 5, 219. [Google Scholar] [CrossRef]
- Yang, J.; Zhang, X. eDNA metabarcoding in zooplankton improves the ecological status assessment of aquatic ecosystems. Environ. Int. 2020, 134, 105230. [Google Scholar] [CrossRef]
- R Core Team. R: A Language and Environment for Statistical Computing; R Foundation for Statistical Computing: Vienna, Austria, 2022; Available online: www.R-project.org/ (accessed on 14 November 2024).
- Venter, O.; Sanderson, E.W.; Magrach, A.; Allan, J.R.; Beher, J.; Jones, K.R.; Possingham, H.P.; Laurance, W.F.; Wood, P.; Fekete, B.M.; et al. Global terrestrial Human Footprint maps for 1993 and 2009. Sci. Data 2016, 3, 160067. [Google Scholar] [CrossRef]
- WorldPop; Center for International Earth Science Information Network (CIESIN), Columbia University. Global High Resolution Population Denominators Project-Funded by the Bill and Melinda Gates Foundation (OPP1134076). 2018. Available online: https://hub.worldpop.org/doi/10.5258/SOTON/WP00675 (accessed on 24 November 2024).
- Zuur, A.; Leno, E.; Walker, N.; Saveliev, A.; Smith, G. Mixed Effects Models and Extensions in Ecology with R; Springer: New York, NY, USA, 2009. [Google Scholar]
- Wickham, H. ggplot2: Elegant Graphics for Data Analysis; Springer: New York, NY, USA, 2016; Available online: https://ggplot2.tidyverse.org/ (accessed on 14 November 2024).
- Niu, L.; Zou, G.; Guo, Y.; Li, Y.; Wang, C.; Hu, Q.; Zhang, W.; Wang, L. Eutrophication dangers the ecological status of coastal wetlands: A quantitative assessment by composite microbial index of biotic integrity. Sci. Total Environ. 2022, 816, 151620. [Google Scholar] [CrossRef]
- Zhang, W.; Zhu, M.; Li, Y.; Wang, C.; Qian, B.; Niu, L.; Wang, P.; Gu, J.; Yang, N. How fluvial inputs directly and indirectly affect the ecological status of different lake regions: A bio-assessment framework. J. Hydrol. 2020, 582, 124502. [Google Scholar] [CrossRef]
- Jordán, F.; Liu, W.; Davis, A.J. Topological keystone species: Measures of positional importance in food webs. Oikos 2006, 112, 535–546. [Google Scholar] [CrossRef]
- Banerjee, S.; Schlaeppi, K.; van der Heijden, M.G.A. Keystone taxa as drivers of microbiome structure and functioning. Nat. Rev. Microbiol. 2018, 16, 567–576. [Google Scholar] [CrossRef] [PubMed]
- Park, Y.; Cha, J.; Song, B.; Huang, Y.; Kim, S.; Kim, S.; Jo, E.; Fortin, S.; An, S. Total Microbial Activity and Sulfur Cycling Microbe Changes in Response to the Development of Hypoxia in a Shallow Estuary. Ocean Sci. J. 2020, 55, 165–181. [Google Scholar] [CrossRef]
- Chen, J.; Hanke, A.; Tegetmeyer, H.E.; Kattelmann, I.; Sharma, R.; Hamann, E.; Hargesheimer, T.; Kraft, B.; Lenk, S.; Geelhoed, J.S.; et al. Impacts of chemical gradients on microbial community structure. ISME J. 2017, 11, 920–931. [Google Scholar] [CrossRef] [PubMed]
- Wang, J.; Soininen, J.; Zhang, Y.; Wang, B.; Yang, X.; Shen, J. Patterns of elevational beta diversity in micro- and macroorganisms. Glob. Ecol. Biogeogr. 2012, 21, 743–750. [Google Scholar] [CrossRef]
- Jiang, Y.; He, W.; Liu, W.; Qin, N.; Ouyang, H.; Wang, Q.; Kong, X.; He, Q.; Yang, C.; Yang, B.; et al. The seasonal and spatial variations of phytoplankton community and their correlation with environmental factors in a large eutrophic Chinese lake (Lake Chaohu). Ecol. Indic. 2014, 40, 58–67. [Google Scholar] [CrossRef]
- Cao, J.; Liang, H.; Zhang, Y.; Du, S.; Zhang, J.; Tao, Y. Development and Evaluation of the Plankton Biological Integrity Index (P-IBI) in Dry and Wet Seasons for Dianchi Lake. Ecologies 2024, 5, 68–82. [Google Scholar] [CrossRef]
- Yang, Q.; Zhang, P.; Li, X.; Yang, S.; Chao, X.; Liu, H.; Ba, S. Distribution patterns and community assembly processes of eukaryotic microorganisms along an altitudinal gradient in the middle reaches of the Yarlung Zangbo River. Water Res. 2023, 239, 120047. [Google Scholar] [CrossRef]
- Xie, C.; Guo, Y.; Li, Y.; Zhou, Q.; Xie, P.; Huo, B. Investigation on Water Ecological Environment and Fishery Resources of Xinjiang Transboundary Rivers: Irtysh River; Science Press: Beijing, China, 2021. [Google Scholar]
- Strayer, D.L. Alien species in fresh waters: Ecological effects, interactions with other stressors, and prospects for the future. Freshw. Biol. 2010, 55, 152–174. [Google Scholar] [CrossRef]
- Xiong, W.; Sui, X.; Liang, S.; Chen, Y. Non-native freshwater fish species in China. Rev. Fish Biol. Fish. 2015, 25, 651–687. [Google Scholar] [CrossRef]
- Dudgeon, D. Multiple threats imperil freshwater biodiversity in the Anthropocene. Curr. Biol. 2019, 29, R960–R967. [Google Scholar] [CrossRef]
- Allan, J.D. Landscapes and Riverscapes: The Influence of Land Use on Stream Ecosystems. Annu. Rev. Ecol. Evol. Syst. 2004, 35, 257–284. [Google Scholar] [CrossRef]
- Dudgeon, D.; Arthington, A.H.; Gessner, M.O.; Kawabata, Z.-I.; Knowler, D.J.; Lévêque, C.; Naiman, R.J.; Prieur-Richard, A.-H.; Soto, D.; Stiassny, M.L.J.; et al. Freshwater biodiversity: Importance, threats, status and conservation challenges. Biol. Rev. 2006, 81, 163–182. [Google Scholar] [CrossRef] [PubMed]
- Shade, A.; Gregory Caporaso, J.; Handelsman, J.; Knight, R.; Fierer, N. A meta-analysis of changes in bacterial and archaeal communities with time. ISME J. 2013, 7, 1493–1506. [Google Scholar] [CrossRef] [PubMed]
- Elbrecht, V.; Leese, F. Can DNA-Based Ecosystem Assessments Quantify Species Abundance? Testing Primer Bias and Biomass—Sequence Relationships with an Innovative Metabarcoding Protocol. PLoS ONE 2015, 10, e0130324. [Google Scholar] [CrossRef] [PubMed]
- Zhang, S.; Zhao, J.; Yao, M. A comprehensive and comparative evaluation of primers for metabarcoding eDNA from fish. Methods Ecol. Evol. 2020, 11, 1609–1625. [Google Scholar] [CrossRef]
- Xiong, W.; Huang, X.; Chen, Y.; Fu, R.; Du, X.; Chen, X.; Zhan, A. Zooplankton biodiversity monitoring in polluted freshwater ecosystems: A technical review. Environ. Sci. Ecotechnol. 2020, 1, 100008. [Google Scholar] [CrossRef]
- Doi, H.; Uchii, K.; Takahara, T.; Matsuhashi, S.; Yamanaka, H.; Minamoto, T. Use of Droplet Digital PCR for Estimation of Fish Abundance and Biomass in Environmental DNA Surveys. PLoS ONE 2015, 10, e0122763. [Google Scholar] [CrossRef]
- Takahashi, M.; Saccò, M.; Kestel, J.H.; Nester, G.; Campbell, M.A.; van der Heyde, M.; Heydenrych, M.J.; Juszkiewicz, D.J.; Nevill, P.; Dawkins, K.L.; et al. Aquatic environmental DNA: A review of the macro-organismal biomonitoring revolution. Sci. Total Environ. 2023, 873, 162322. [Google Scholar] [CrossRef]
- Shu, L.; Ludwig, A.; Peng, Z. Environmental DNA metabarcoding primers for freshwater fish detection and quantification: In silico and in tanks. Ecol. Evol. 2021, 11, 8281–8294. [Google Scholar] [CrossRef]
Disclaimer/Publisher’s Note: The statements, opinions and data contained in all publications are solely those of the individual author(s) and contributor(s) and not of MDPI and/or the editor(s). MDPI and/or the editor(s) disclaim responsibility for any injury to people or property resulting from any ideas, methods, instructions or products referred to in the content. |
© 2025 by the authors. Licensee MDPI, Basel, Switzerland. This article is an open access article distributed under the terms and conditions of the Creative Commons Attribution (CC BY) license (https://creativecommons.org/licenses/by/4.0/).