Article

An Evaluation of Eco-Environmental Quality Based on the Fused Remote Sensing Ecological Index (FRSEI) in the Jinjie Coal Mine Area, Northwest China

1
Xi’an Geological Survey Center of China Geological Survey, Xi’an 710119, China
2
School of Resources Engineering, Xi’an University of Architecture and Technology, Xi’an 710054, China
*
Authors to whom correspondence should be addressed.
Water 2025, 17(2), 223; https://doi.org/10.3390/w17020223
Submission received: 9 December 2024 / Revised: 26 December 2024 / Accepted: 13 January 2025 / Published: 15 January 2025

Abstract

:
This study focused on the Jinjie mining area by addressing the severe resource and environmental issues arising from excessive coal mining in Shenmu County, Northwest China. Multi-source remote sensing data from GF-1 and Landsat 8 OLI were utilized in this study. Specifically, the fused remote sensing ecological index (FRSEI) was constructed to conduct a detailed evaluation and analysis of the eco-environmental quality in the mining area from 2013 to 2023. The results indicated that the overall eco-environmental quality of the Jinjie mining area exhibited a trend of initial improvement, followed by degradation, and then improvement again over the decade. The eco-environmental quality of the mine pits and their surrounding areas was significantly lower than the overall level, confirming the destructive impact of coal mining on the eco-environment. Meanwhile, as the study area, Shenmu County is actively utilizing coal mining subsidence areas to develop the photovoltaic power generation industry, aiming to achieve green and low-carbon transformation. Although the construction of photovoltaic power plants initially led to the degradation of the condition of vegetation and the FRSEI, both gradually improved after the plants were operational. Furthermore, by comparing the FRSEI with the remote sensing ecological index (RSEI) calculated solely using Landsat 8 OLI data, we found a high degree of similarity between the two, thereby validating the stability and accuracy of the FRSEI. This study not only provides high-precision data support for eco-environmental monitoring in mining areas but also highlights the potential of multi-source remote sensing data fusion technology in improving monitoring accuracy, further providing a scientific basis for formulating sustainable development strategies specifically for the eco-environment in mining areas.

1. Introduction

Excessive extraction of mineral resources has increasingly impacted regional ecosystems, leading to severe resource and environmental issues, particularly in soil, water bodies, and the atmosphere [1]. China’s rapid economic growth in recent decades has led to a surge in coal consumption, making it the largest consumer globally [2]. The Shenmu County, located in Northwest China, is the largest coal-producing county and possesses abundant coal resources [3]. While the rapid development of the coal economy has improved the economic levels and consumption capabilities of local residents, the heavy reliance on coal has significantly degraded the ecological environment of the mining area, causing land destruction, dust pollution, soil degradation, and ecological disruption [4]. Recently, satellite remote sensing technology has gained popularity in studying the ecological environment of mining areas due to its advantages such as large-scale coverage, long-term monitoring, multi-information acquisition, and multi-platform capability [5,6]. Therefore, it is crucial to use remote sensing technology to monitor and evaluate the ecological environmental changes in the coal mining area of Shenmu County.
Enhancing the ecological conditions of mining regions and ensuring their sustainable growth requires significant attention to monitoring the variations in environmental quality before and after coal extraction. It is essential to quantitatively assess the effects and underlying causes of coal mining to improve the ecological environment and achieve sustainable development in these areas [7]. Consequently, it is vital to evaluate the ecological impact of coal mining through quantitative analyses of environmental quality changes pre- and post-mining. There are various evaluation indicators for ecosystem health, including the normalized difference vegetation index (NDVI), land surface temperature (LST), and the vegetation health index (VHI) [8]. In 2006, China introduced the ecological index (EI) [9], an ecological environment indicator utilizing remotely sensed data, which has been extensively applied in monitoring the ecological environment [10,11]. In 2013, considering issues such as the appropriateness of EI weights, the establishment of normalization coefficients, the simplicity of acquiring indicators, and the visualization of ecological conditions, a remote sensing ecology index (RSEI) based entirely on remotely sensed information and integrating multiple ecological factors was proposed [12]. This index evaluates the regional eco-environment using four elements (greenness, wetness, dryness, and heat) and allocates weights to each factor through principal component analysis (PCA). The results are highly objective, consistent, and easy to visualize. The RSEI transforms the one-dimensional EI value into a two-dimensional surface map, effectively illustrating the spatial distribution of the ecological environment. Consequently, the RSEI has been extensively used in regional ecological monitoring and in assessing the ecological environments of mines in humid and semi-humid climates [13,14,15]. Research on the RSEI has emerged continuously [16,17,18], but most current RSEIs are constructed utilizing MODIS data at a 250 m resolution or Landsat series imagery at a 30 m resolution [19,20,21]. These data can quickly provide multi-phase ecological environment monitoring results for macro-observation ranges of thousands or tens of thousands of square kilometers [22,23,24]. However, most mining areas cover tens of square kilometers [25]. Regarding the ecological conditions of mining regions, higher-precision data and methods are required to more detailedly reflect ecological environment information over tens of square kilometers.
To accurately reflect the ecological environment within mining areas and provide insights into their sustainable development, this study proposes the fused remote sensing ecological index (FRSEI), which integrates 2 m high-resolution remotely sensed data with medium-resolution data from the Landsat 8 OLI. This method fully utilizes the high spatial resolution of the high-resolution data and the rich spectral bands of Landsat 8 OLI [26], providing six high-resolution remote sensing ecological index observations for the 150-square-kilometer Jinjie mining area in Shenmu County over a decade, from 2013 to 2023. These observations provide precise data support for formulating ecological sustainable development strategies for coal mining areas in Shenmu County and even the central section of the Yellow River area.

2. Materials and Methods
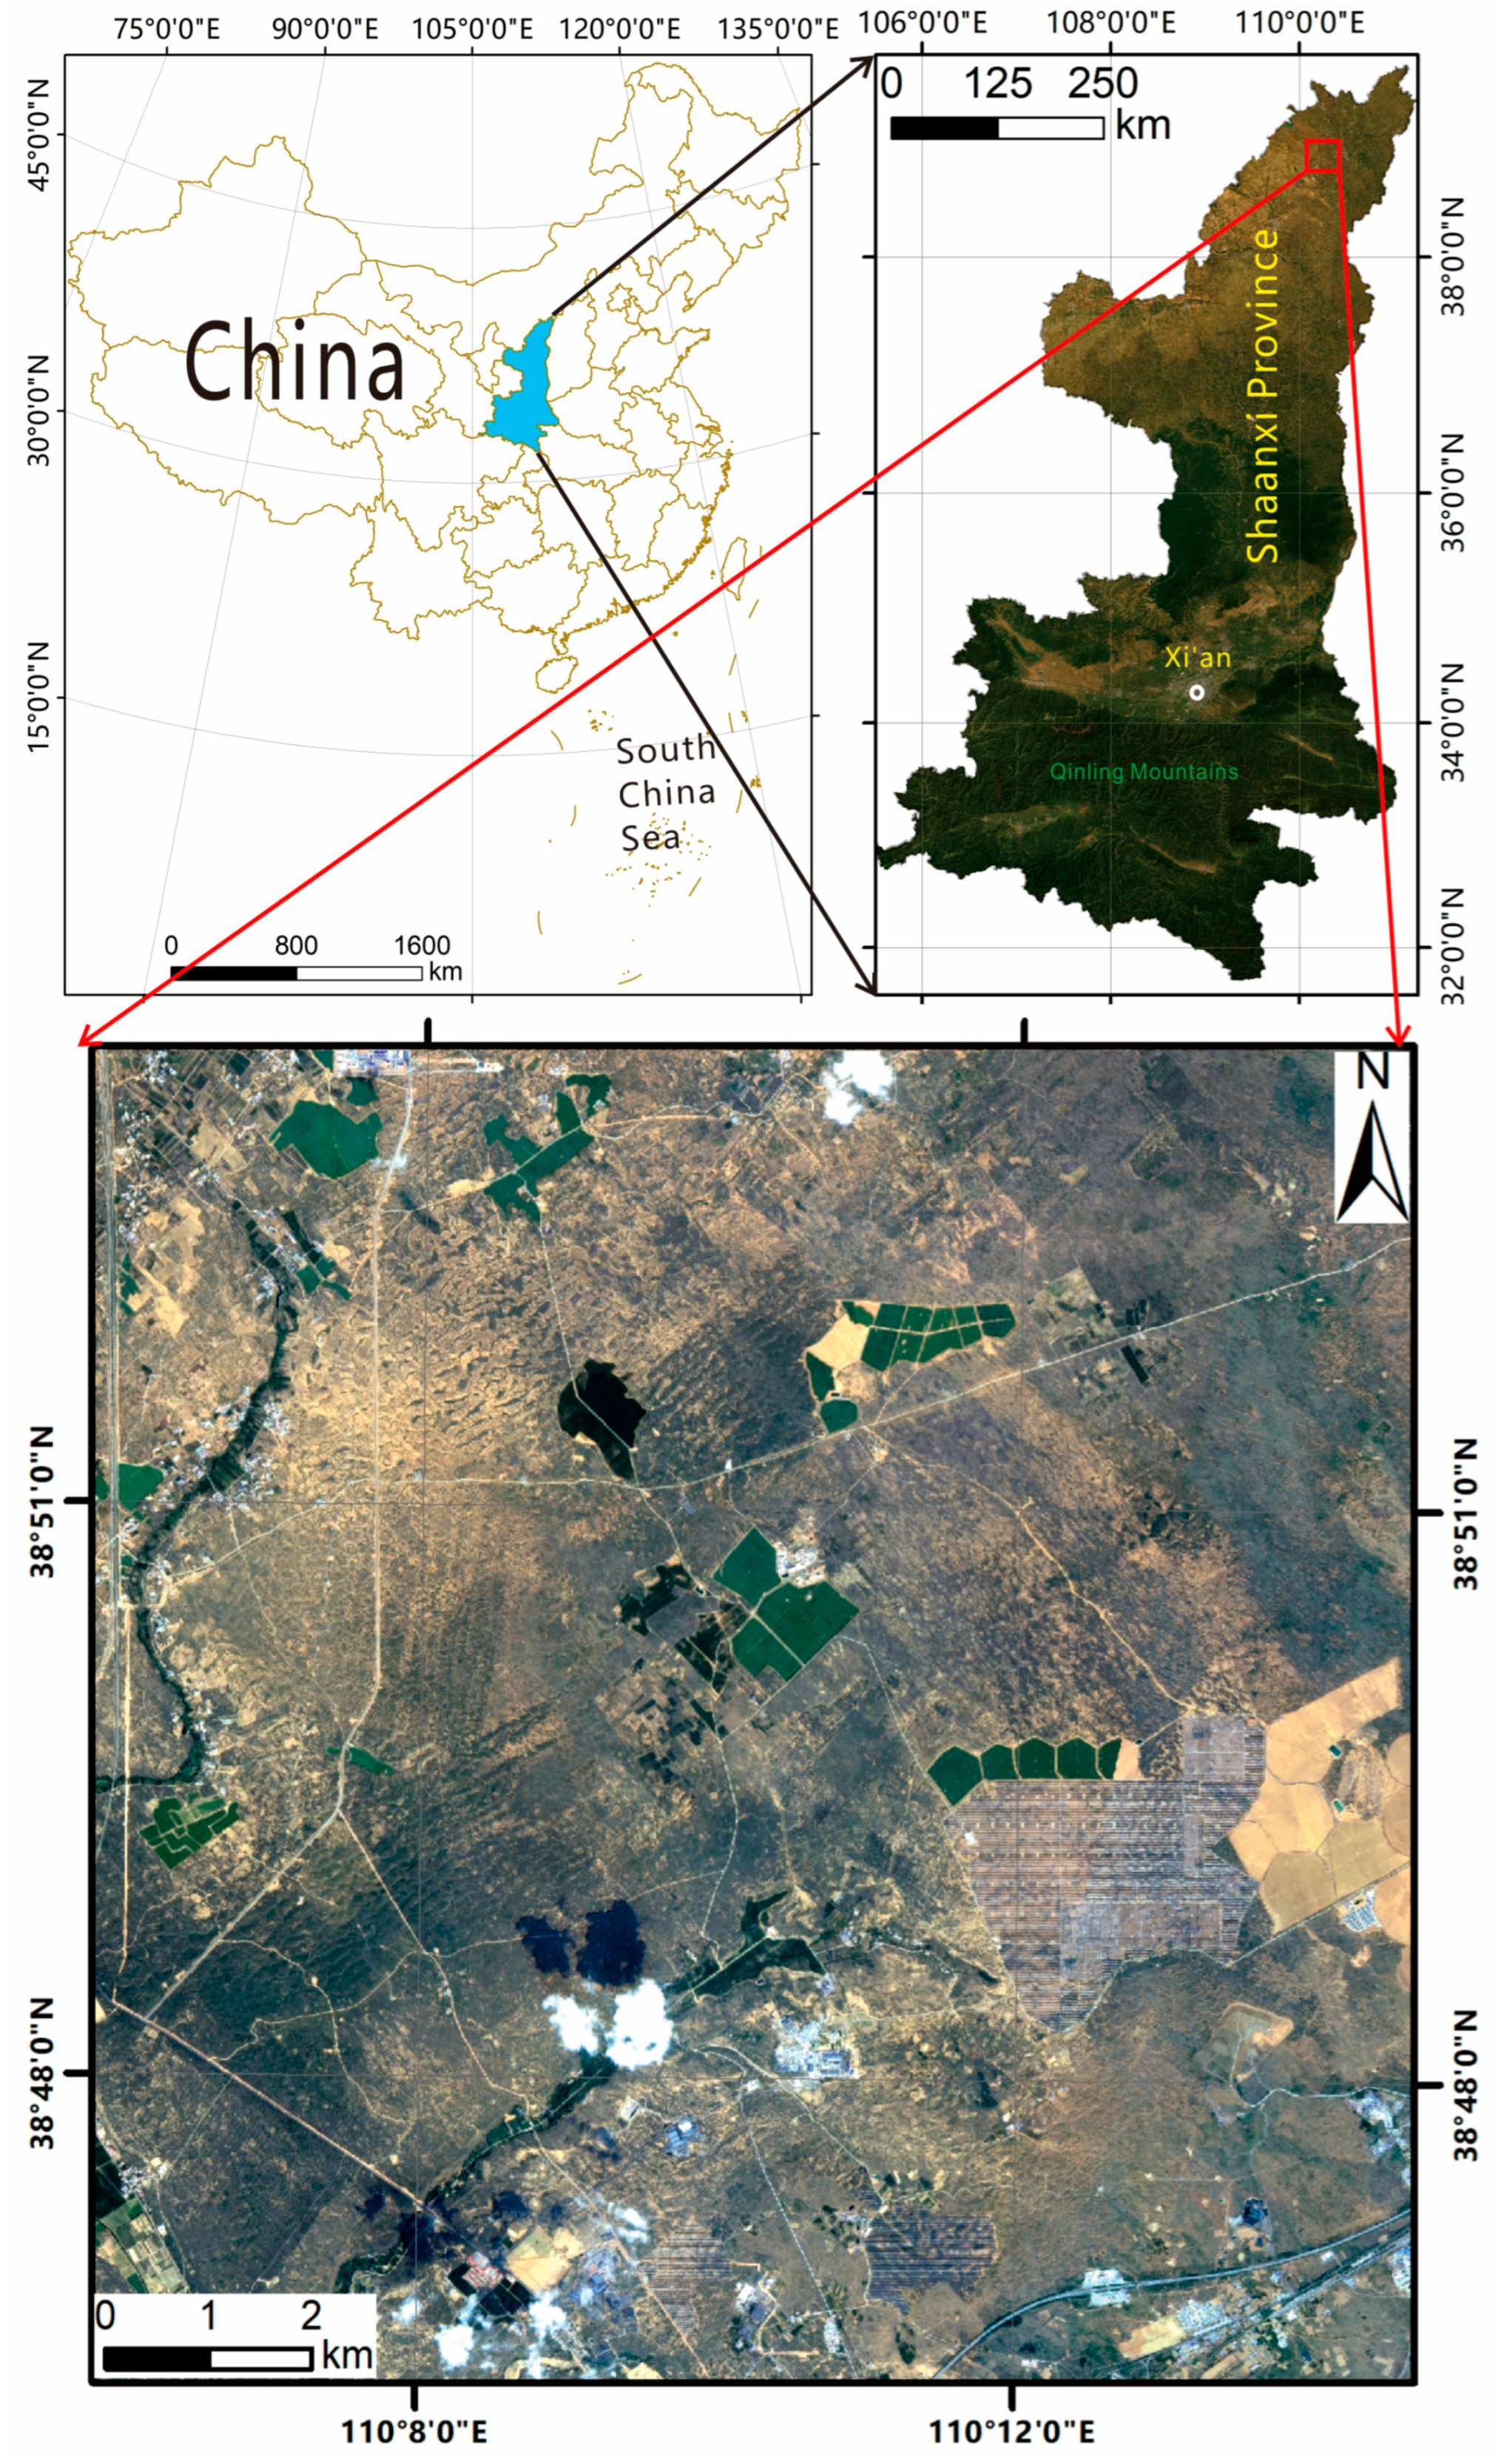
2.1. Study Area

The research site is situated at the boundary of Yaozhen Township and Majiata Township in Shenmu County, Shaanxi Province, China, with precise coordinates ranging from 110°06′ to 110°14′30″ east in longitude and 38°46′30″ to 38°53′15″ north in latitude. This coal mine sits in the northeastern corner of the Yushen Mining Area, closely adjacent to the western edge of the second-phase development plan for the mining area, and is administratively under the jurisdiction of Yaozhen Township, Shenmu County [27]. The eastern boundary of Jinjie Coal Mine is next to Liangshuijing Minefield, while its western boundary is delineated by a river, echoing the first-phase planning area of the Yushen Mining Area; the northern end seamlessly connects to the Shendong Mining Area, and the southern end is closely linked to small-scale coal mining areas in the Jinjie region, collectively forming an important coal mining landscape in the area (Figure 1). The terrain of the study area is relatively flat, with surface elevations gradually rising from 1110 m at Shamuhe River to 1313 m at Baijiamiao Ridge, creating a natural height difference of approximately 203 m. The initial mining areas were concentrated in the south, with elevations roughly maintained at around 1200 m, while the north is slightly higher, with elevations mainly ranging from 1240 to 1260 m. The landforms are distinctive, featuring widespread eolian sand plains and dunes. The surface is mainly covered by Quaternary eolian sand, dominated by semi-fixed and fixed dunes. The vegetation cover is good, and the terrain is broad and flat, favorable for precipitation infiltration, providing excellent conditions for groundwater recharge. The southeast exhibits a loess erosion landscape, with gentle ridge tops but deeply eroded by water flow, forming valleys of varying depths, generally ranging from 15 to 35 m. The research region experiences a semi-arid continental monsoon climate, controlled by polar continental cold air masses for extended periods, resulting in large diurnal and annual temperature variations, drought, and scant rainfall. The long-term mean yearly evaporation is as high as 2111.2 mm, far exceeding the long-term mean yearly rainfall of 435.7 mm, indicating severe water scarcity [28]. Precipitation is unevenly distributed, mainly concentrated in the flood season from July to September, constituting over 60% of the yearly rainfall, increasing the risk of flood disasters. In terms of coal resources, the Jurassic Yan’an Formation in the study area is the sole coal-bearing stratum, characterized by numerous coal seams with single-layer thicknesses varying between 2 m and 6 m, and a cumulative minable total thickness generally exceeding 25 m. The seams have gentle dips, all below 3°, providing extremely favorable natural conditions for coal mining [29]. Regarding the ecological pattern, the study area, influenced by various factors such as regional climate, soil, and groundwater conditions, has formed an ecological pattern where desert steppes and open woodland steppes coexist. The desert steppe zone boasts a rich vegetation landscape, including grassland vegetation, meadows, halophyte vegetation, and other types, with evident signs of human activity. The open woodland steppe zone is widely distributed in the loess hill and gully landform, where farmland and shrub vegetation intertwine, with trees and shrubs being interdependent, jointly maintaining ecological balance [29].

2.2. Remotely Sensed Data

2.2.1. High-Resolution Data

This study collected the high-resolution remotely sensed data of China’s Gaofen-1 (GF-1) satellite with a 2 m resolution for the study area across six periods from 2013 to 2023, including the years 2013, 2015, 2017, 2019, 2021, and 2023. Due to the extended observation period, it was challenging to cover the entire working area using a single high-resolution dataset. Therefore, this study gathered data from the GF-1 satellite sensor for these six periods. As the first satellite launched in China’s High-Resolution Earth Observation System, GF-1 has brought significant breakthroughs in the field of Earth observation since its successful launch, characterized by its wide coverage and high resolution. The GF-1 satellite series has accumulated abundant remote sensing data resources over time, and its long-term data records provide powerful data support for monitoring dynamic surface changes and investigating resources and the environment [30]. All images was sourced from the Geological Cloud Platform of the China Geological Survey, guaranteeing the authority and timeliness of the data (Table 1, Figure 2) [31].

2.2.2. Medium-Resolution Data

Ever since the first Landsat satellite was launched in 1972, the series has grown to include eight satellites, establishing a historical database of Earth observations spanning decades. The uniqueness of Landsat satellites lies in their rich historical record, which provides scientists with unprecedented opportunities to track and analyze long-term trends in surface environmental changes [32]. Given this advantage, this study decided to adopt high-precision remotely sensed images from the Landsat series as the core data source, focusing on a detailed analysis and assessment of the ecological conditions in mining regions. To ensure the authority and accessibility of the data, the required images were carefully sourced from the official United States Geological Survey (USGS) site at https://earthexplorer.usgs.gov (22 July 2024). To minimize the impact of seasonal fluctuations on surface ecological assessments, we deliberately chose remote sensing data from the period with the most vigorous vegetation cover and optimal growth conditions, namely between May and October annually. Throughout this period, seasonal changes in the natural environment are relatively mild, aiding in a more accurate grasp of the true state of the ecological conditions in mining regions. Specifically, this study meticulously selected Landsat 8 OLI images from six key time points: June 2013, September 2015, September 2017, May 2019, May 2021, and the latest, June 2023 (Table 1, Figure 3). These images represent multiple critical stages of the ecological qualities in mining regions and showcase its evolutionary trajectory over time. Each image has undergone rigorous quality control, ensuring high clarity and low cloud cover, thereby laying a solid foundation for the scientificity and accuracy of this study.

2.3. Methods

The remote sensing ecological index (RSEI) is an ecosystem quality evaluation system primarily based on natural factors that leverages remote sensing technology and integrates humidity, greenness, dryness, and heat indices, which are directly related to the standard of the ecological environment. It allows for intuitive and rapid assessments of ecological conditions [33]. Through use of remotely sensed imagery technology, metrics like the wetness index (WET), normalized difference vegetation index (NDVI) [8], normalized differential building–soil index (NDBSI), and land surface temperature (LST) can be obtained to represent the four major ecological components of humidity, greenness, dryness, and heat [34]. By standardizing each component index to eliminate dimensionality differences and then utilizing principal component analysis to determine the weights of each index, an RSEI evaluation model is established. This approach avoids the interference of subjective factors in weight setting and overcomes the drawback of traditional ecological indices (EIs) where component indices are difficult to obtain, enabling rapid, objective, and quantitative evaluations of regional ecological environments [12]. The RSEI can be expressed as a function containing these four component indices:
R S E I = f N D V I , W E T , L S T , N D B S I
In the formula, NDVI represents the normalized difference vegetation index, WET represents the wetness index, LST represents the land surface temperature, and NDBSI represents the normalized differential building–soil index.
The traditional remote sensing-based ecological index (RSEI) often employs Landsat series imagery data, utilizing the WET index as the humidity factor, which is derived from a tasseled cap transformation using the blue, red, nir, swir1, and swir2 bands of Landsat data [35]. Due to the 30 m resolution limitation of Landsat 8 OLI, the resolution of the resulting RSEI index images is also 30 m. This lacks sufficient detail for reflecting ecological indices at the mine scale in practical applications [36]. GF-1 data from China boast a resolution of 2 meters, offering a high spatial resolution and a repeat observation cycle of 4 days, with abundant observation data that can be freely requested [37]. Previous studies have conducted detailed comparisons of the correlation between the NDWI index and the WET index, finding a significant positive correlation between the two indices [38,39]. Therefore, this study intended to combine the high geometric resolution of GF-1 data with the rich spectral bands of Landsat 8 OLI data. Specifically, the NDVI and NDWI calculated using GF-1 data were utilized as vegetation and humidity indicators, respectively, while LST and NDBSI calculated using Landsat 8 OLI data served as land surface temperature and bare soil indicators. These were integrated to construct the FRSEI.
F R S E I = f N D V I , N D W I , L S T , N D B S I
In the formula, NDVI represents the normalized difference vegetation index calculated using GF-1 data, NDWI represents the normalized difference water index calculated using GF-1 data, LST represents the land surface temperature calculated using Landsat 8 OLI data, and NDBSI represents the normalized differential building–soil index calculated using Landsat 8 OLI data.

2.3.1. Greenness Index (NDVI)

Vegetation growth directly reflects the condition of regional ecological environments. The normalized vegetation index (NDVI) is derived from the combination of the strong absorption of plant leaves in the red light band and their strong reflection in the near-infrared band. It is a prominent and effective measure of plants’ growth status and vegetation’s distribution density, and has been widely used in regional land cover, ecological environmental change, and vegetation classification [40]. Therefore, NDVI can be selected to represent the greenness index, and its extraction formula is as follows:
N D V I = ( ρ n i r ρ r e d ) = ( ρ n i r + ρ r e d )
In the formula, ρnir represents the reflectance in the near-infrared band, and ρred represents the reflectance in the red band.

2.3.2. Wetness Index

The wetness index is closely related to the quality of ecological environments. Low wetness indicates severe land degradation, low vegetation cover, and poor ecological conditions, whereas high wetness suggests adequate soil moisture, abundant surface vegetation cover, and good ecological environments. Tasseled cap transformation is a technique for data compression and redundancy reduction, and the wetness component derived from this transformation can reflect the moisture content of soil and vegetation, which has been widely used in ecological environmental monitoring [41]. The wetness index in the RSEI based on Landsat 8 OL data is represented by the WET component [42,43], while the wetness index in the FRSEI is represented by the NDWI component. The extraction formulas are different, as follows [38,39].
Landsat 8 OLI data:
W E T = 0.1511   ρ b l u e + 0.1973   ρ g r e e n + 0.3283   ρ r e d + 0.3407   ρ n i r 0.7171   ρ s w i r 1 0.4559   ρ s w i r 2
GF-1 data:
N D W I = ρ g r e e n ρ n i r / ρ g r e e n + ρ n i r
In the formulas, ρblue represents the reflectance in the blue band, ρgreen represents the reflectance in the green band, ρred represents the reflectance in the red band, ρnir represents the reflectance in the near-infrared band, ρswir1 represents the reflectance in the shortwave infrared 1 band, and ρswir2 represents the reflectance in the shortwave infrared 2 band.

2.3.3. Land Surface Temperature (LST)

Land surface temperature (LST) has become a commonly used parameter in various urban environmental assessments. Current research primarily focuses on the formation mechanisms and spatio-temporal evolution of urban heat islands, with relatively limited application in ecological environmental assessments. LST is closely related to natural and human phenomena and processes such as vegetation growth, crop yields, surface water cycles, and urbanization, serving as a heat index to reflect the condition of surface ecological environments. There are numerous algorithms for retrieving LST using thermal infrared technology, mainly including atmospheric correction methods [44], single-window algorithms [45], and single-channel algorithms [46]. By comparing these with actual surface temperatures, it was found that the error between the surface temperature retrieved using the atmospheric correction method and the actual measured surface temperature is within 1 °C, and the accuracy can meet the needs of the research. Therefore, this method was adopted to retrieve the surface temperature of Wuhan City, with the extraction formula as follows:
L λ = G a i n × D N + B i a s
B ( T s ) = [ L λ L τ ( 1 ε ) L ] / τ ε
In the formula, Gain and Bias represent the gain and bias, respectively; Lλ denotes the radiance of the sensor; and B(Ts) represents the blackbody thermal radiance. τ is the atmospheric transmittance in the thermal infrared band, while L↑ and L↓ represent the upward and downward radiance measurements of the atmosphere, respectively, with specific values obtainable from websites provided by the National Aeronautics and Space Administration (NASA). Finally, Planck’s law was utilized to solve for the surface temperature Ts:
T s = K 2 / ln K 1 B T s + 1
In the formula, Ts represents the true surface temperature (in Kelvin, K), with K1 and K2 being calibration parameters. The ε denotes the surface emissivity [47], which is estimated using the normalized vegetation index (NDVI) as previously proposed, dividing the surface into water bodies, natural surfaces, and urban areas. Assuming that the surface emissivity of water pixels is 0.995, the formula for calculating the surface emissivity of natural surface and urban area pixels is as follows
ε s = 0.9625 + 0.614 F V 0.0461 F V 2
where FV represents the fractional vegetation cover, which can be calculated using the NDVI ratio.

2.3.4. Normalized Differential Building–Soil Index (NDBSI)

The aridity index quantifies soil desiccation, which can have severe impacts on regional ecological environments and disrupt entire ecosystems. Sparse vegetation cover (rock, sandy land, bare soil, etc.) and natural processes such as weathering and desertification are the main causes of soil desiccation. Considering that the study area contains a significant amount of urban construction land, the aridity index can be represented by a normalized difference building–soil index (NDBSI) that combines the soil index (SI) and the index-based built-up index (IBI) [47,48]. However, in the process of combining the SI and IBI, direct arithmetic averaging is often used, neglecting the intensity of their respective impacts on aridity, which has certain limitations. In this paper, an approach is proposed to extract the areas of bare soil and buildings by setting appropriate threshold values and then calculating the NDBSI index using a weighted average with the area ratio as the weight reference standard.
S I = ρ s w i r 1 + ρ r e d ρ b l u e + ρ n i r ρ s w i r 1 + ρ r e d + ρ b l u e + ρ n i r
I B I = 2 ρ s w i r 2 ρ s w i r 1 + ρ n i r ρ n i r ρ r e d + ρ n i r + ρ g r e e n ρ s w i r 1 + ρ g r e e n 2 ρ s w i r 2 ρ s w i r 1 + ρ n i r + ρ n i r ρ r e d + ρ n i r + ρ g r e e n ρ s w i r 1 + ρ g r e e n
N D B S I = α × S I + β × I B I
In the formula, ρgreen, ρblue, ρred, ρnir, ρswir1, and ρswir2 represent the reflectance values of the green, blue, red, near-infrared, shortwave infrared 1 (swir1), and shortwave infrared 2 (swir2) bands, respectively, from the Landsat 8 OLI imagery. α and β are the weight coefficients for the soil index (SI) and the index-based built-up index (IBI), respectively.

2.3.5. Establishment of the Remote Sensing Ecological Index Evaluation Model

The remote sensing-based ecological index (RSEI) is a comprehensive ecological environment evaluation index based on humidity, greenness, heat, and dryness. Due to differences in the numerical units and magnitudes among its components, standardization is required prior to integration to eliminate dimensional discrepancies. The formula for standardization is as follows:
N = I I m i n I m a x I m i n
In the formula, N represents the standardized index value, I denotes the numerical magnitude of the index, and Imin and Imax are, respectively, the minimum and maximum values among the indices.
After standardizing each component index, the variance contribution rate of each principal component is calculated using principal component analysis (PCA), which is then used as the weight for each component index [49]. The four component indices are converted into the original remote sensing-based ecological index (RSEI) using the extraction formula as follows:
R S E I = i = 1 m a i P C i = j = 1 n w j I j
In the formula, m and n represent the number of principal components and component indices, respectively; ai denotes the method contribution degree of each principal component; PCi stands for the principal component of each component index; wj represents the weight of each component index; and Ij indicates the standardized value of each component index.
To investigate the trend of the FRSEI’s variations in the Jinjie coal mining area across six observation periods spanning from 2013 to 2023, a univariate linear regression analysis was conducted pixel by pixel for the FRSEI results from these six periods. Subsequently, the pixels were classified into six grades based on their slopes and intercepts (Table 2) [50]. The calculation formula is as follows:
slop e = n j = 1 n j × y j = 1 n j × j = 1 n y n × j = 1 n j 2 j = 1 n j 2
p = j = 1 n y s l o p e × j = 1 n j 2 n j = 1 n j 2 n
In the formula, n represents the number of monitoring years; y denotes the FRSEI (a specific type of remote sensing-based ecological environment index) value of the working area in the j-th year; slope is the slope of the linear fit for the FRSEI over multiple years; and p is the intercept of the linear fit for the FRSEI over multiple years.

2.3.6. Verification of the FRSEI’s Calculation Results

In this study, targeting the FRSEI (a specific type of remote sensing-based ecological environment index) of the working area across six periods from 2013 to 2023, the traditional RSEI calculation method was employed using Landsat 8 OLI data sources to estimate six RSEI images for the working area. Subsequently, a relative deviation (RD) analysis was conducted between the FRSEI and RSEI images to quantify the differences between them [51]. The calculation formula for the relative deviation is as follows
R D = F R S E I R S E I F R S E I + R S E I
where RD represents the relative deviation, FRSEI refers to the FRSEI image that integrates GF-1 and Landsat 8 OLI data, and RSEI denotes the RSEI image calculated using only Landsat 8 OLI data.

3. Results

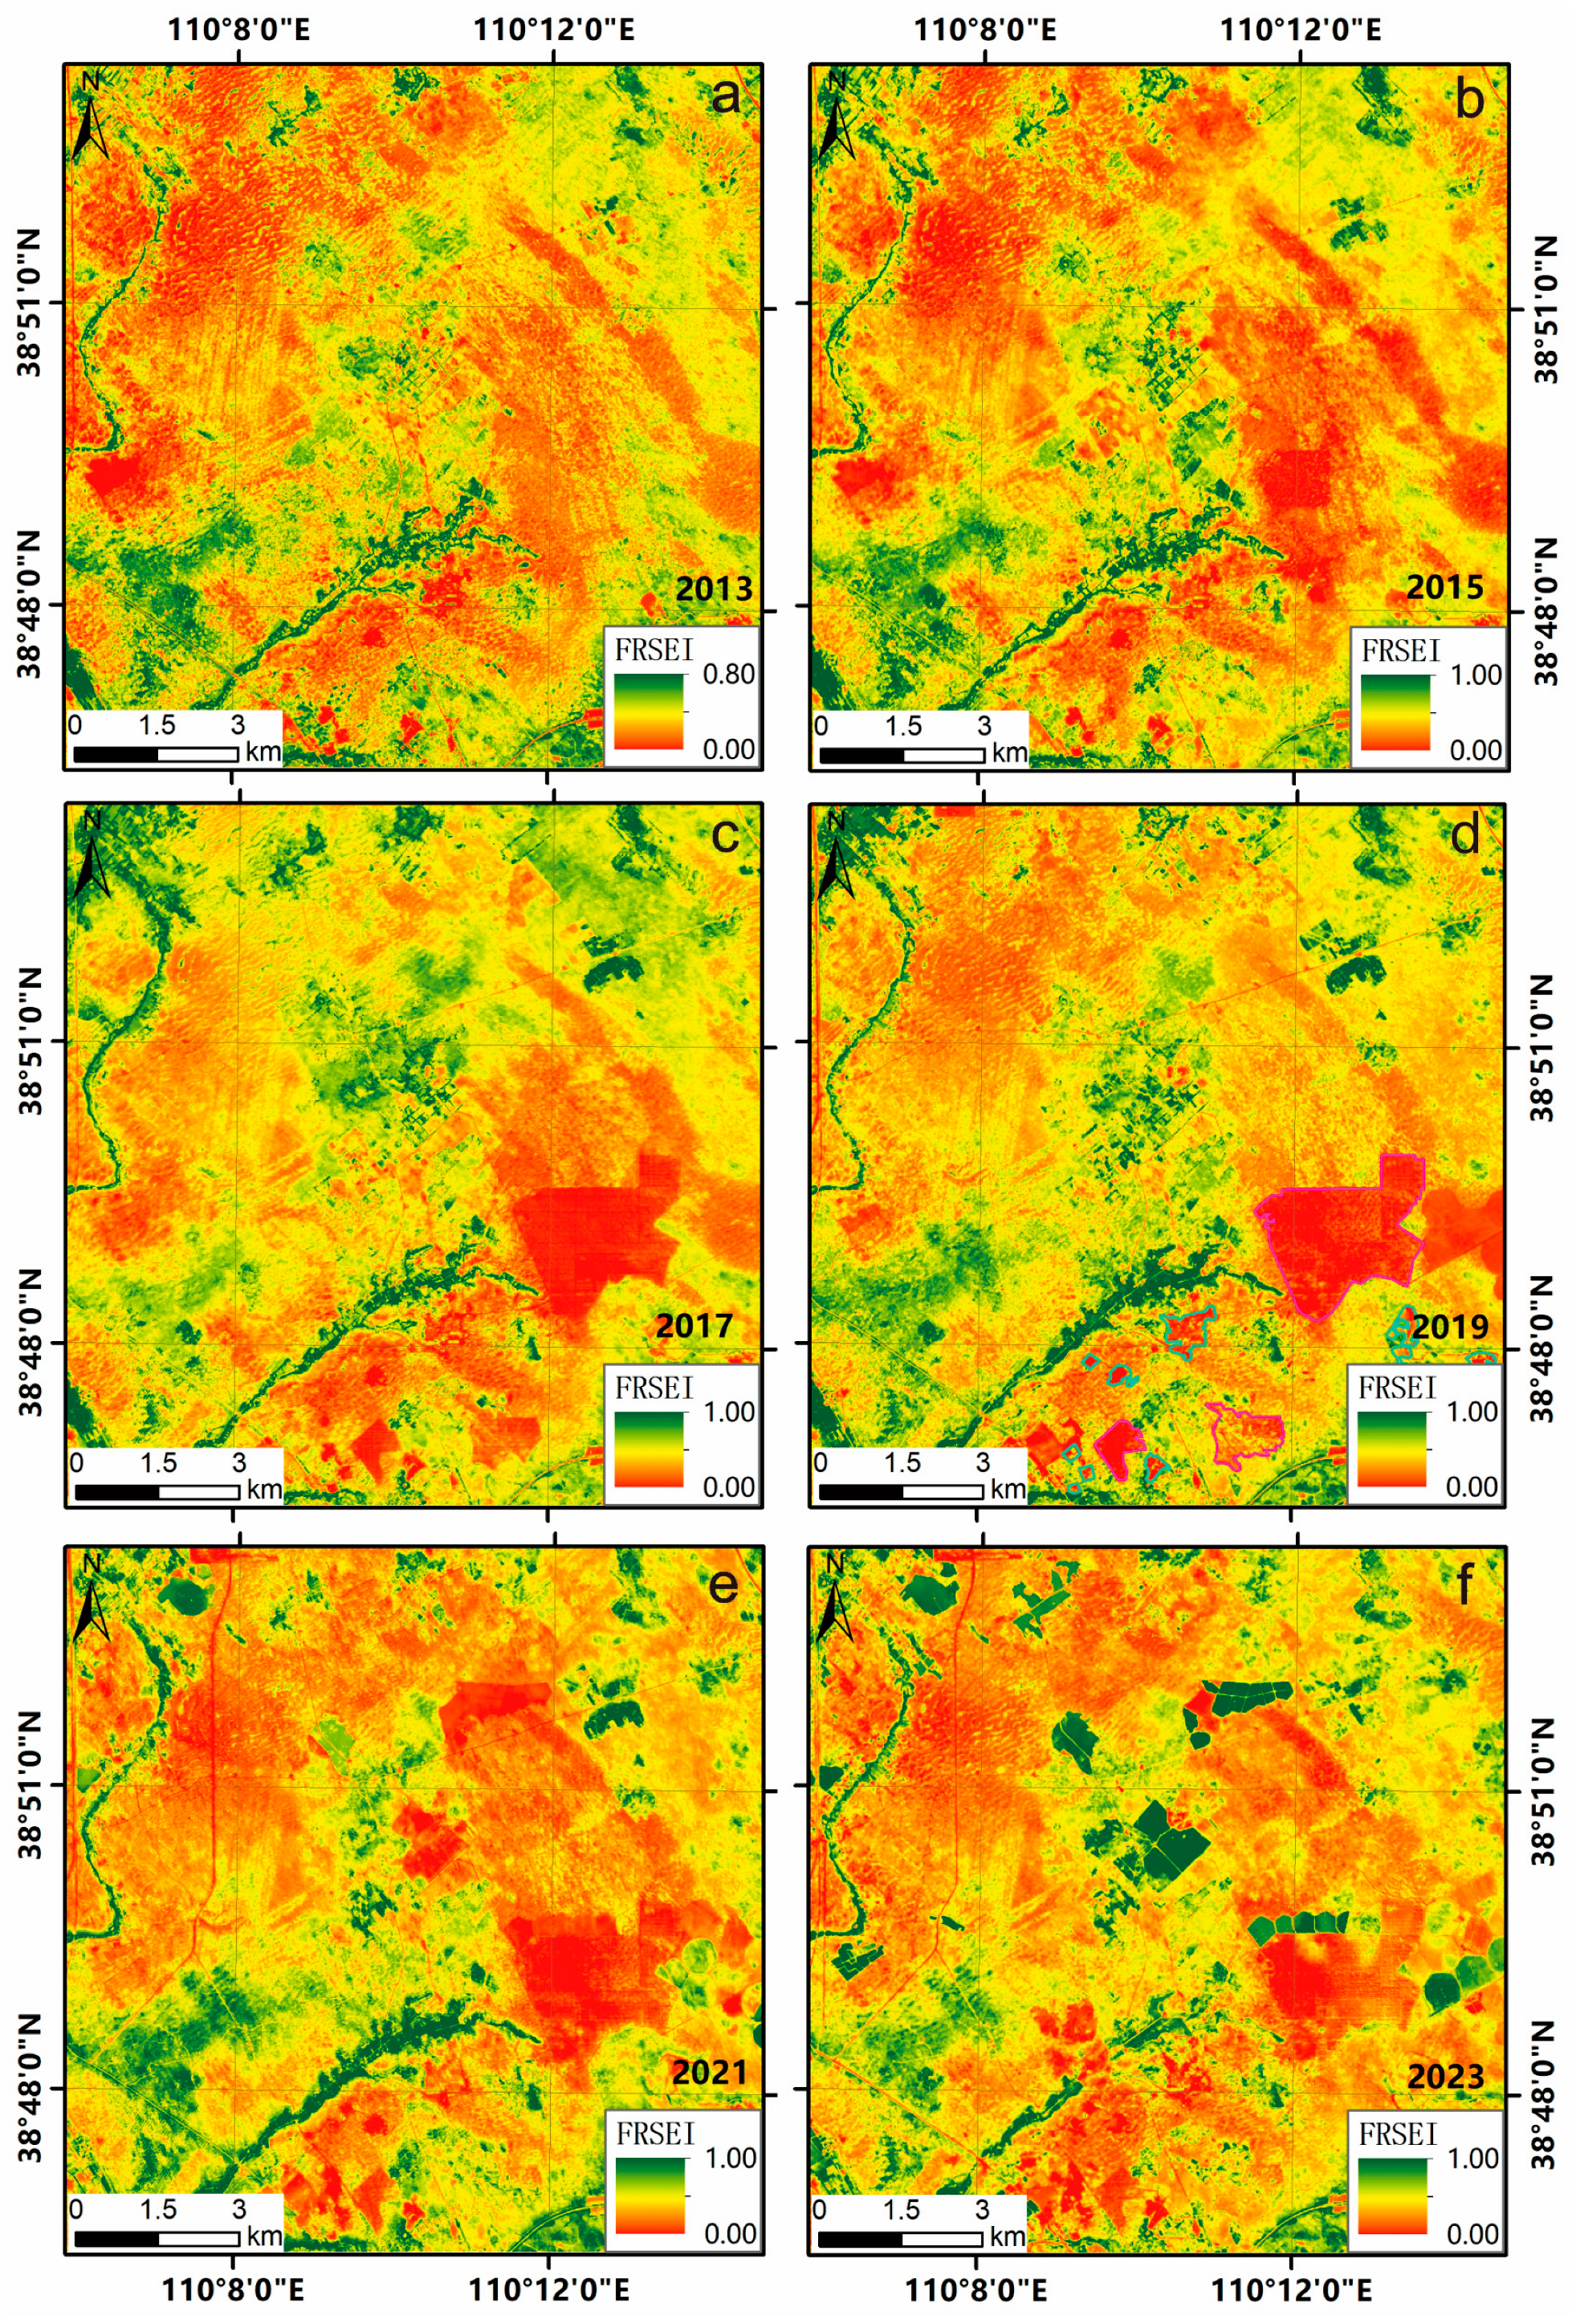
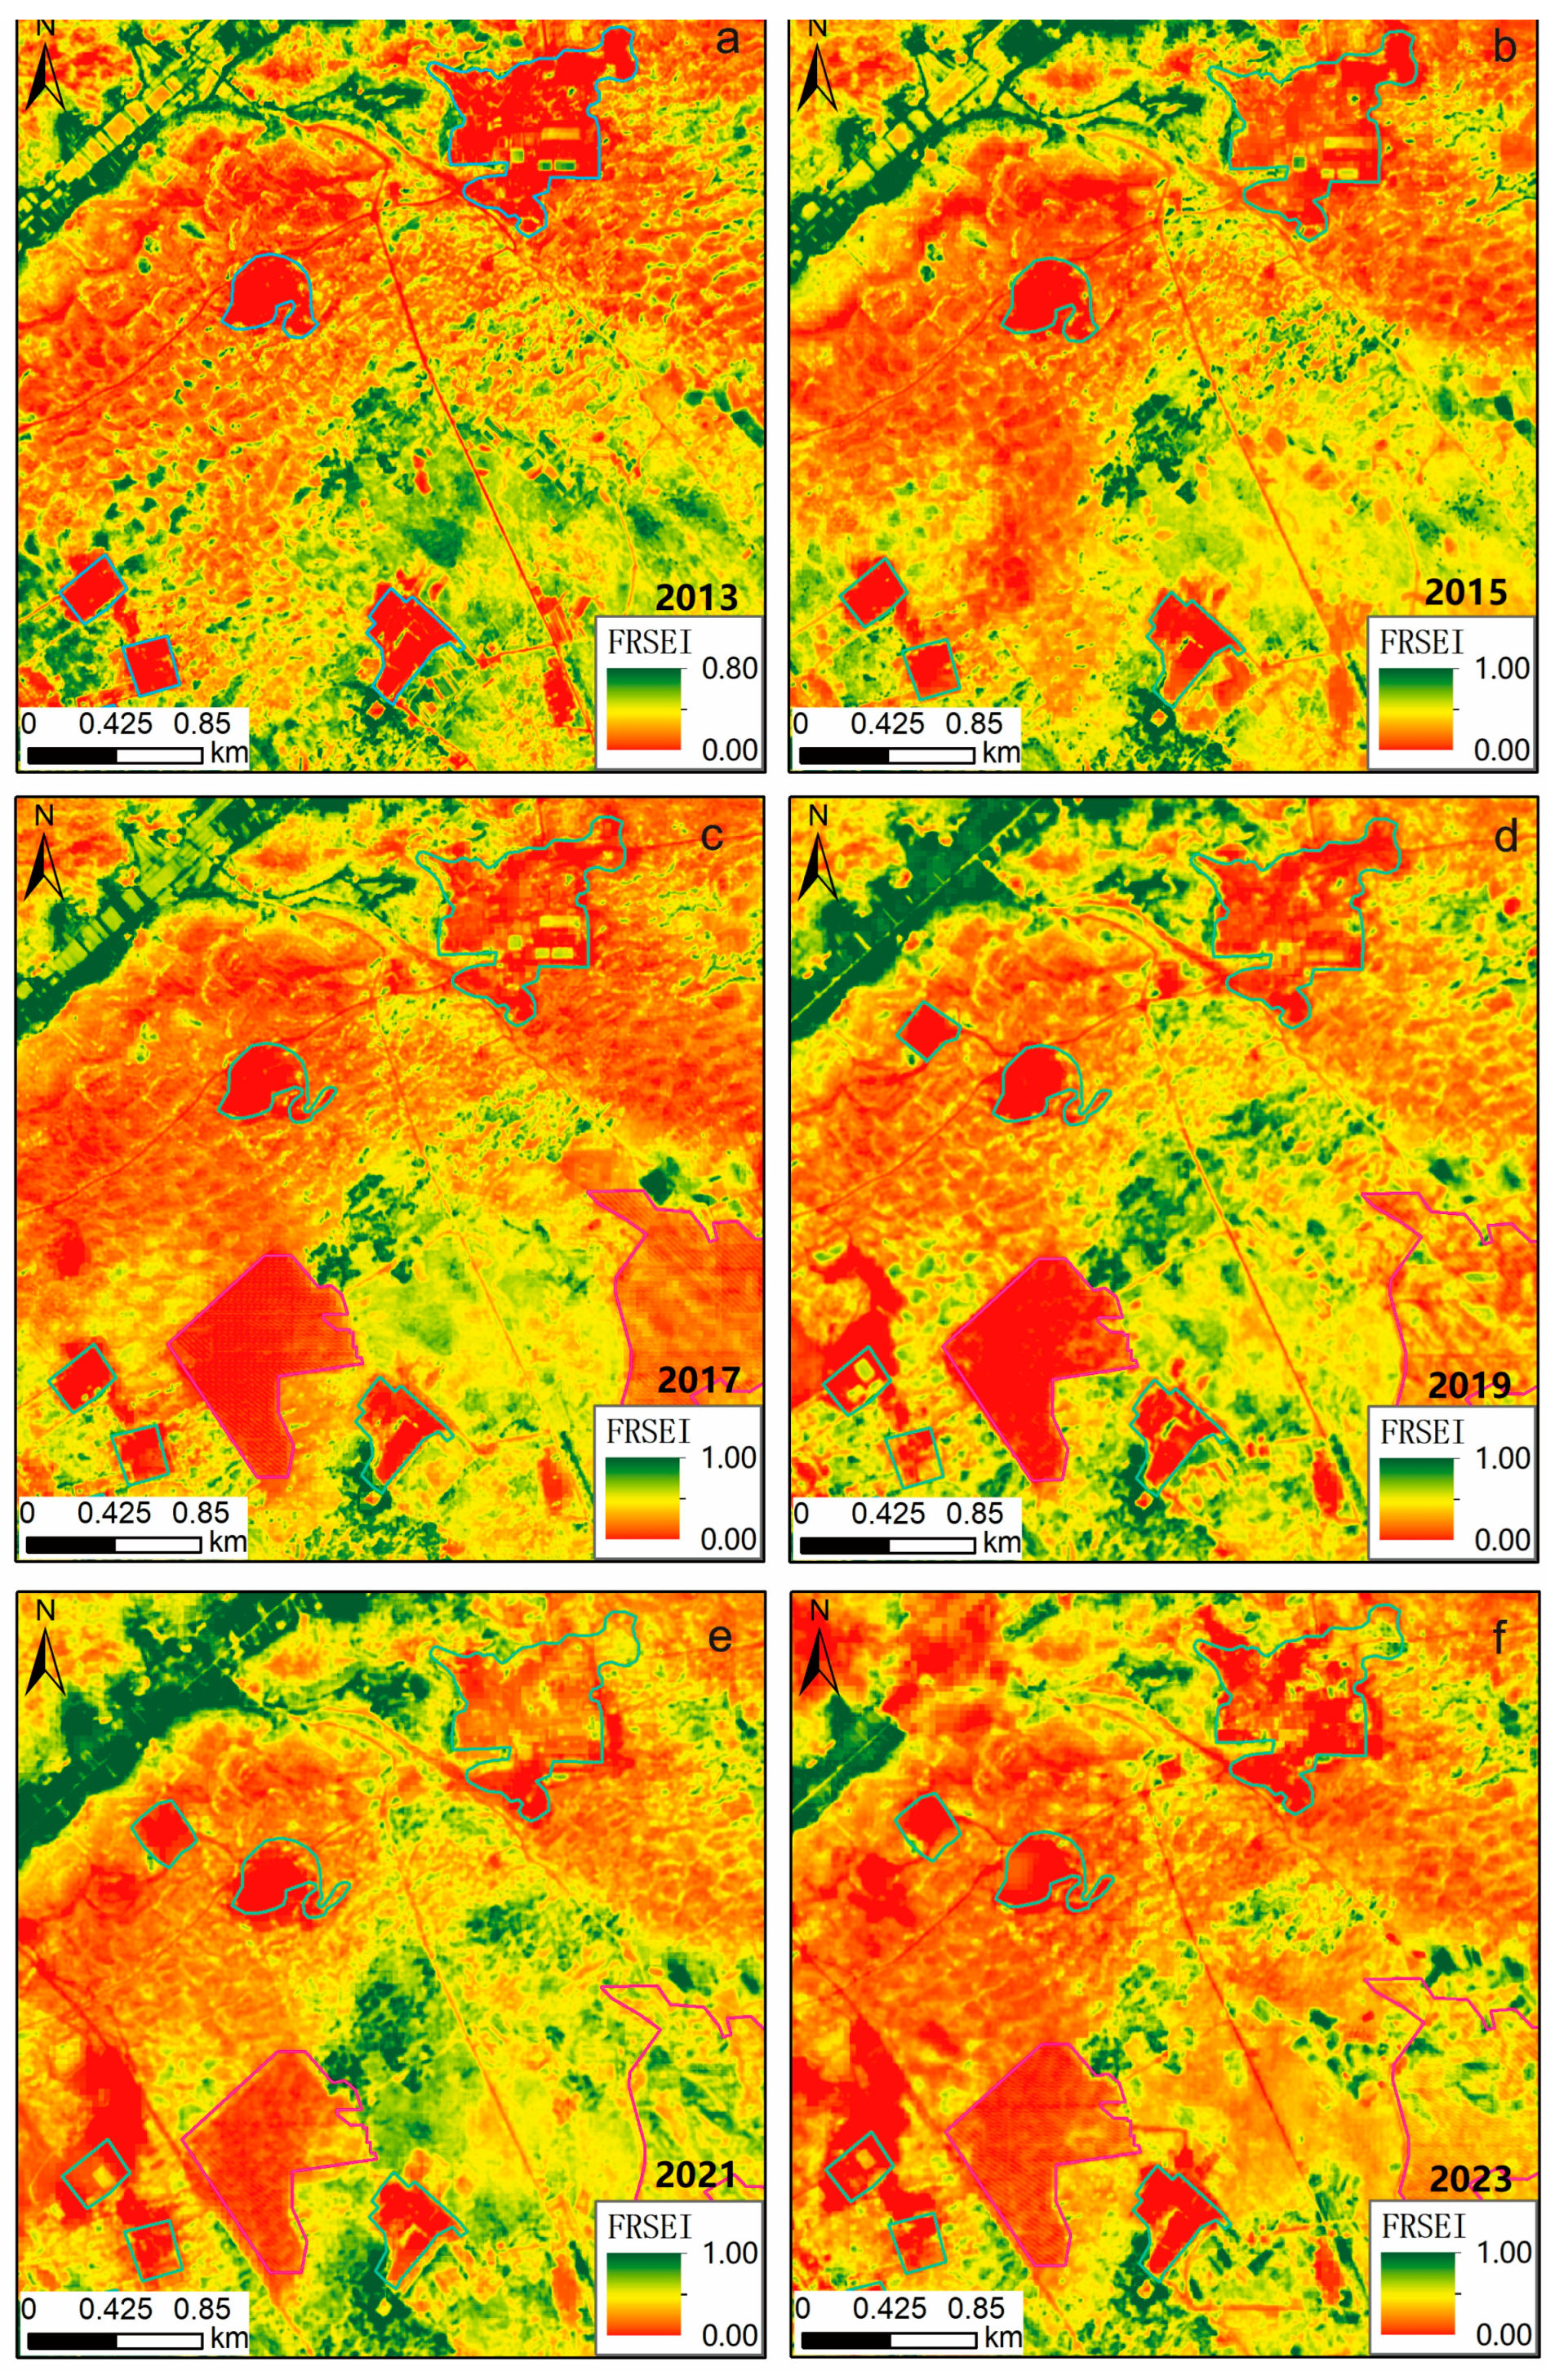
3.1. FRSEI Results of the Jinjie Mining Area

The statistical values of the FRSEI for the six periods from 2013 to 2023 in the working area are shown in Table 3. The average FRSEI values for the years 2013, 2015, 2017, 2019, 2021, and 2023 in the working area are 0.5837, 0.6207, 0.5700, 0.5785, 0.6029, and 0.6252, respectively. It can be observed that the FRSEI values exhibit an overall trend of increase–decrease–increase. Between 2013 and 2015, the FRSEI showed an upward trend, with a mean increase of approximately 6.34%. From 2015 to 2017, the FRSEI declined, with a mean decrease of 8.17%. Between 2017 and 2023, the FRSEI continued to increase, with a mean increase of about 9.68%. In summary, from 2013 to 2023, the FRSEI in the working area showed an overall pattern of initially declining followed by rising, presenting a fluctuating pattern. Combining the imagery of the study area, it is evident that the FRSEI values in the study area are mainly influenced by mine development, the establishment of solar photovoltaic panels, and the construction of new nurseries.
Utilizing data from Landsat 8 OLI and GF-2, the FRSEI distribution maps for six periods (2013, 2015, 2017, 2019, 2021, and 2023) of the ecological environment in the Jinjie Coal Mine were created, with the results presented in Figure 4. Elevated RSEI values reflect superior ecological quality, whereas reduced values indicate inferior ecological quality. The FRSEI distribution maps indicate that in 2013, the study region featured a modest and faintly shaded green area, with a larger red area, indicating poor overall ecological quality in the Jinjie Coal Mine. By comparing the FRSEI distribution maps for 2017, 2019, 2021, and 2023, we found an increase in the area and intensity of green regions, suggesting an improvement in ecological quality from 2017 to 2023. According to Figure 2 and Table 3, the mean FRSEI in 2013 was 0.5837, increasing to 0.6207 in 2015, with the lowest mean of 0.5700 in 2017 and reaching the highest observed mean of 0.6252 in 2023. Between 2015 and 2017, the FRSEI value decreased by 0.0507, while between 2017 and 2023, it increased by 0.0552. Overall, from 2013 to 2023, the ecological index exhibited a pattern of an early decrease followed by subsequent growth, with the magnitude of the increase being greater than the decline, indicating an overall improvement in the ecological environment index and gradually improving ecological quality.
Figure 4 indicates an overall trend of improving environmental conditions within the research region. The main red-colored areas in each period were naturally sparse grasslands, photovoltaic power plants, and coal mining areas.
From 2013 to 2015, the mean FRSEI showed an upward trend, with an overall increase in green area and intensity, suggesting a modest enhancement in the general ecological condition of the research region (Figure 4). In the eastern region, the red color intensified, indicating that this area remained sparse grassland. Between 2015 and 2017, the mean FRSEI declined, primarily due to an expansion and intensification of the red areas in the eastern region, resulting from grassland being reclaimed for photovoltaic power generation construction, which led to a decline in ecological quality (Figure 4). This highlights the negative impact of human activities on ecological quality. The installation of solar photovoltaic panels, however, had positive environmental effects by increasing the local air temperature and humidity, controlling the soil temperature, reducing the wind speed, and mitigating wind erosion [52]. From 2017 to 2023, the mean FRSEI continued to rise. Starting in 2017, the red areas in the west and east expanded and intensified, mainly due to the development of solar photovoltaic power stations on grassland. Within the core and valley sections of the research area, the green areas became larger and more intense. By 2021, center-pivot irrigation farmland was established in this region, and crop planting began in 2023, leading to improved ecological quality. In the central valley basin, the environment also showed significant improvement, with widespread planting of nurseries and farmland. This suggests that, under the combined influence of natural recovery and human reclamation, the overall environmental quality has improved.

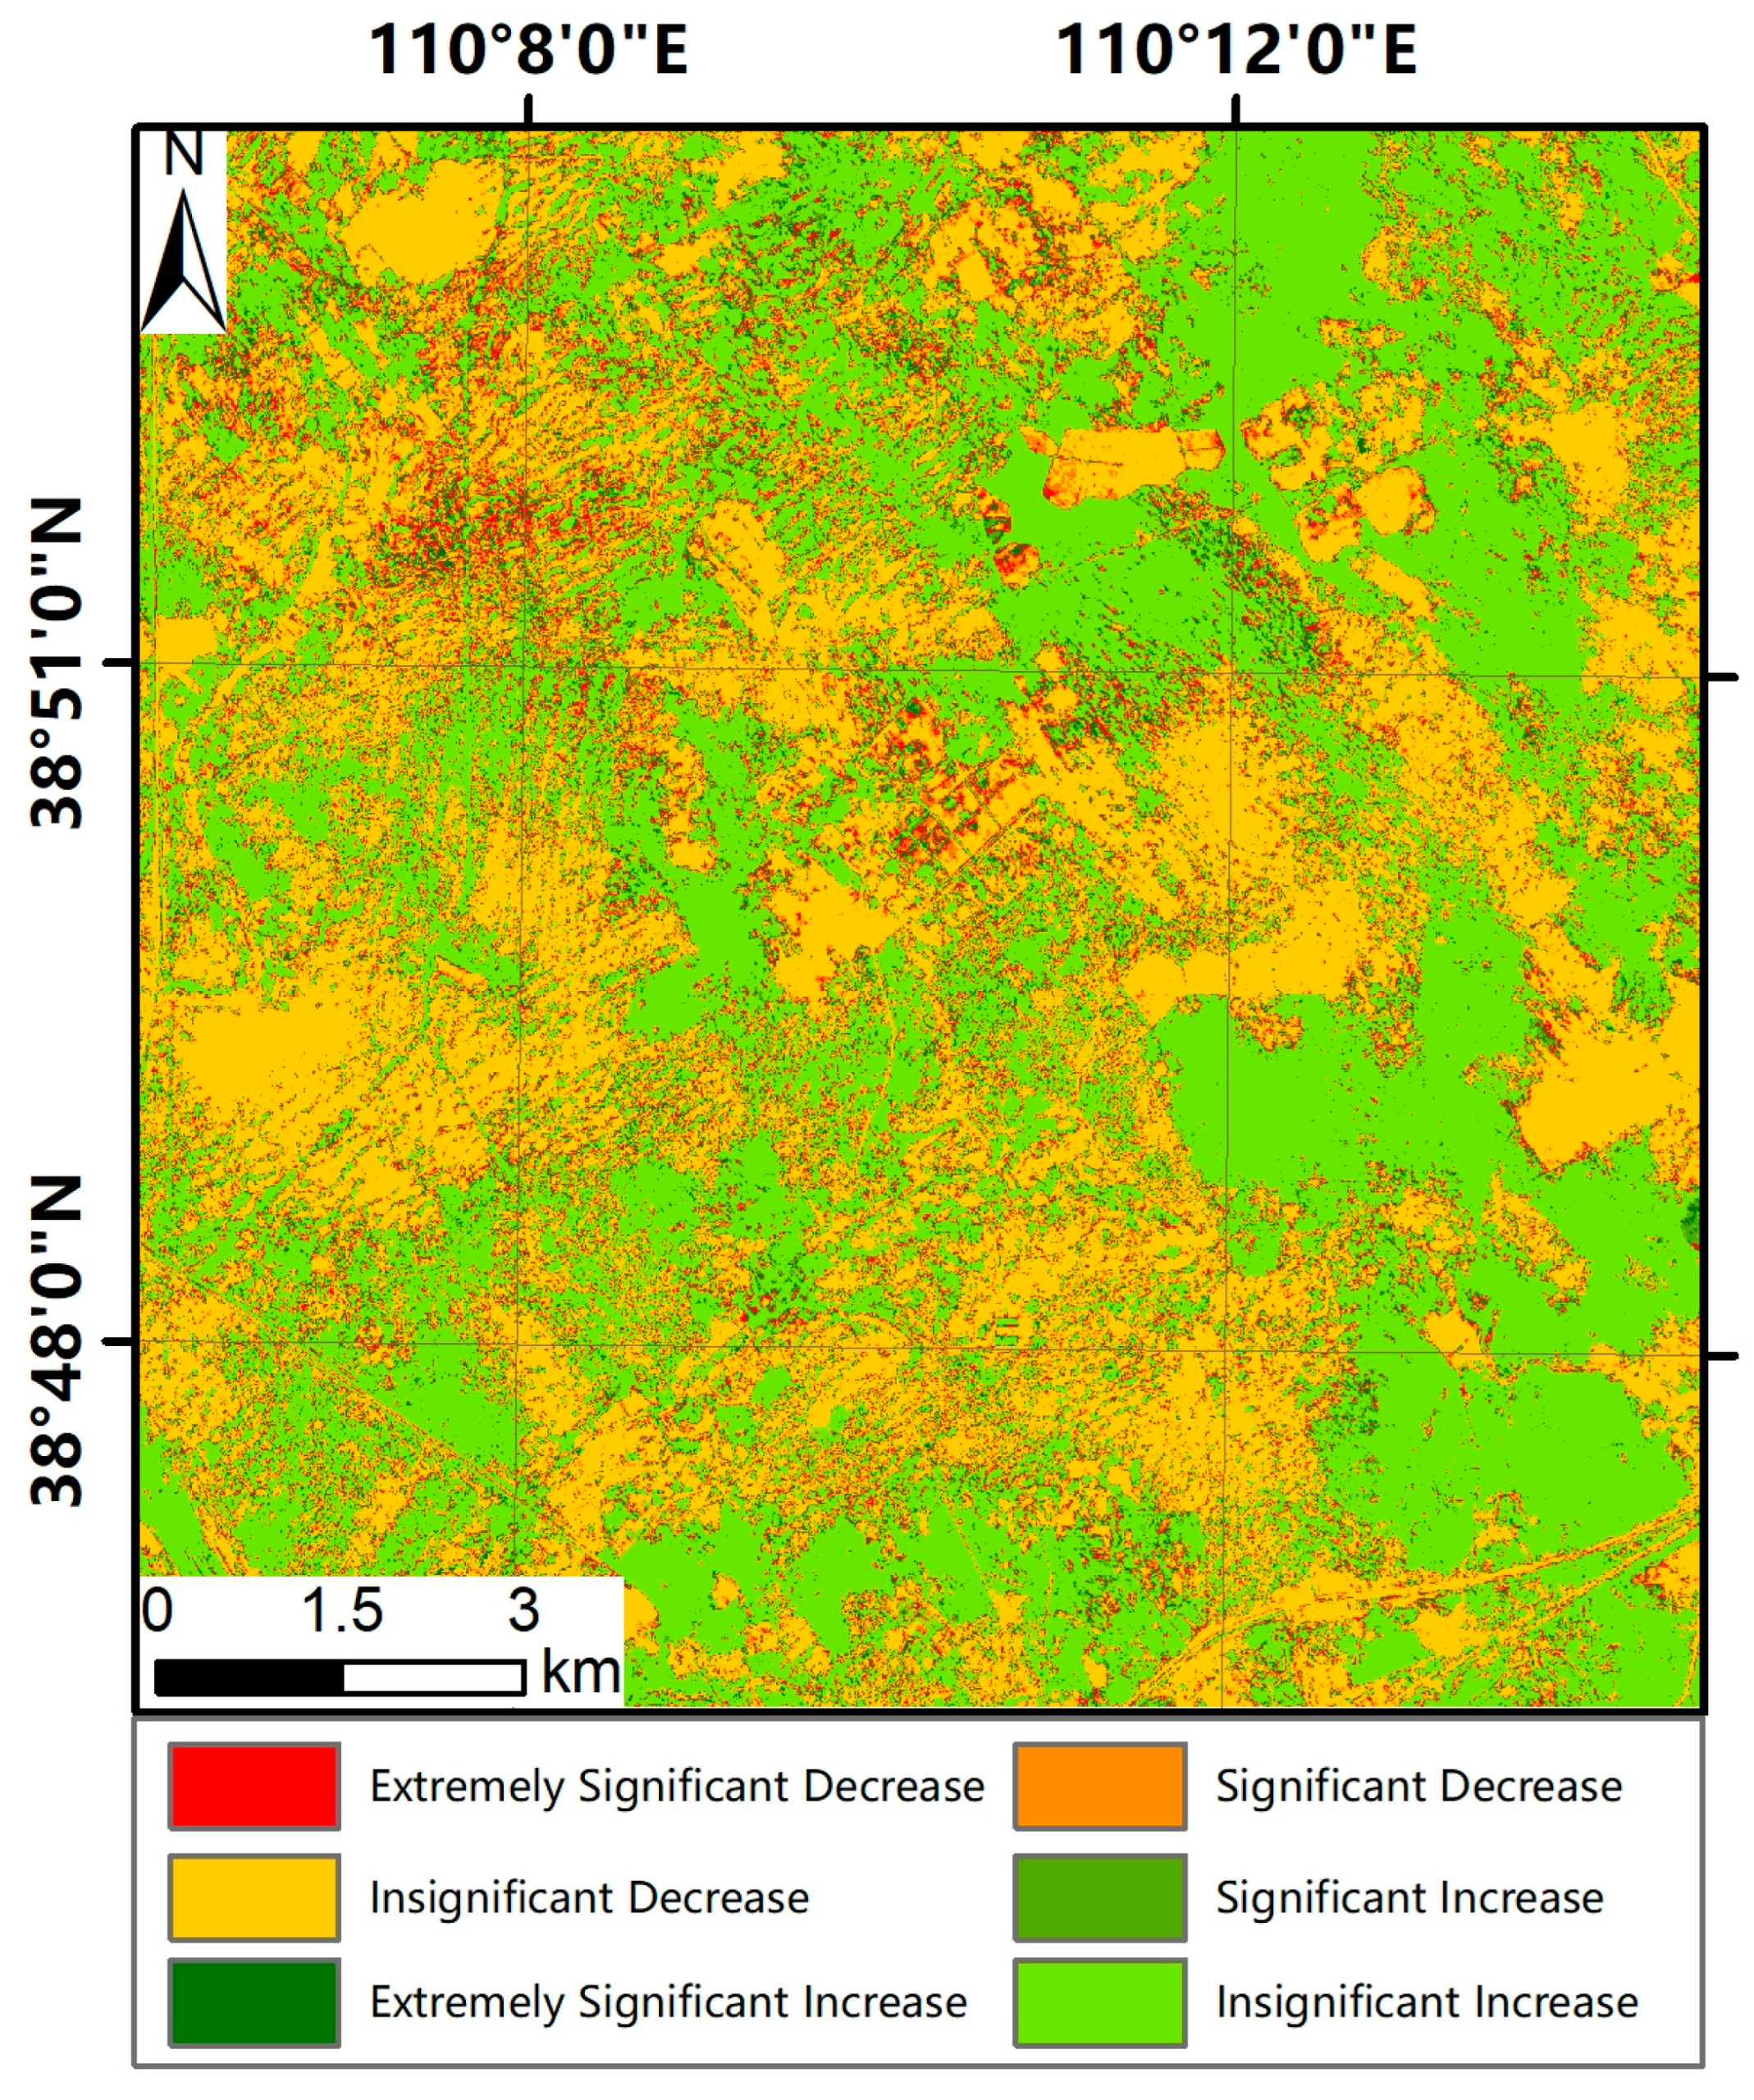
3.2. FRSEI Variation Trends of the Jinjie Mining Area

The trend in the FRSEI (a specific remote sensing-based ecological environment index) constructed through the integration of Landsat 8 OLI and GF-2 data is illustrated in Figure 5. The primary changes in the FRSEI within the study area are categorized as not significantly decreasing and significantly increasing. The regions experiencing not significantly decreasing and not significantly increasing FRSEI values are distributed relatively uniformly, indicating that the ecological environment in most areas is relatively stable. The FRSEI results demonstrate that the ecological environment index is generally stable, with gradual growth observed in some regions.
Among these, specific areas exhibit extremely significant decreases and increases, primarily concentrated in the northeastern region. Between 2013 and 2023, the extremely significant increase is attributed to the continuous reclamation of farmland in these areas, while the extremely significant decrease is due to the establishment of solar photovoltaic panels. Some of the extremely significant decreases observed in farmland areas are influenced by summer crop harvesting. For example, in certain regions depicted in Figure 6, the FRSEI values were higher in 2021 but significantly lower in 2023. A series of human activities, including reclamation and construction, led to extremely significant decreases in the FRSEI values in these areas (Figure 6a,b). The regions with extremely significant increases are those that remained as wasteland from 2013 to 2019 but saw the construction of extensive green nurseries in 2023, leading to a significant enhancement in the ecological surroundings (Figure 6c,d). Overall, the relatively uniform distribution of areas with not significantly decreasing and not significantly increasing FRSEI values suggests a steady enhancement in ecological environment quality.

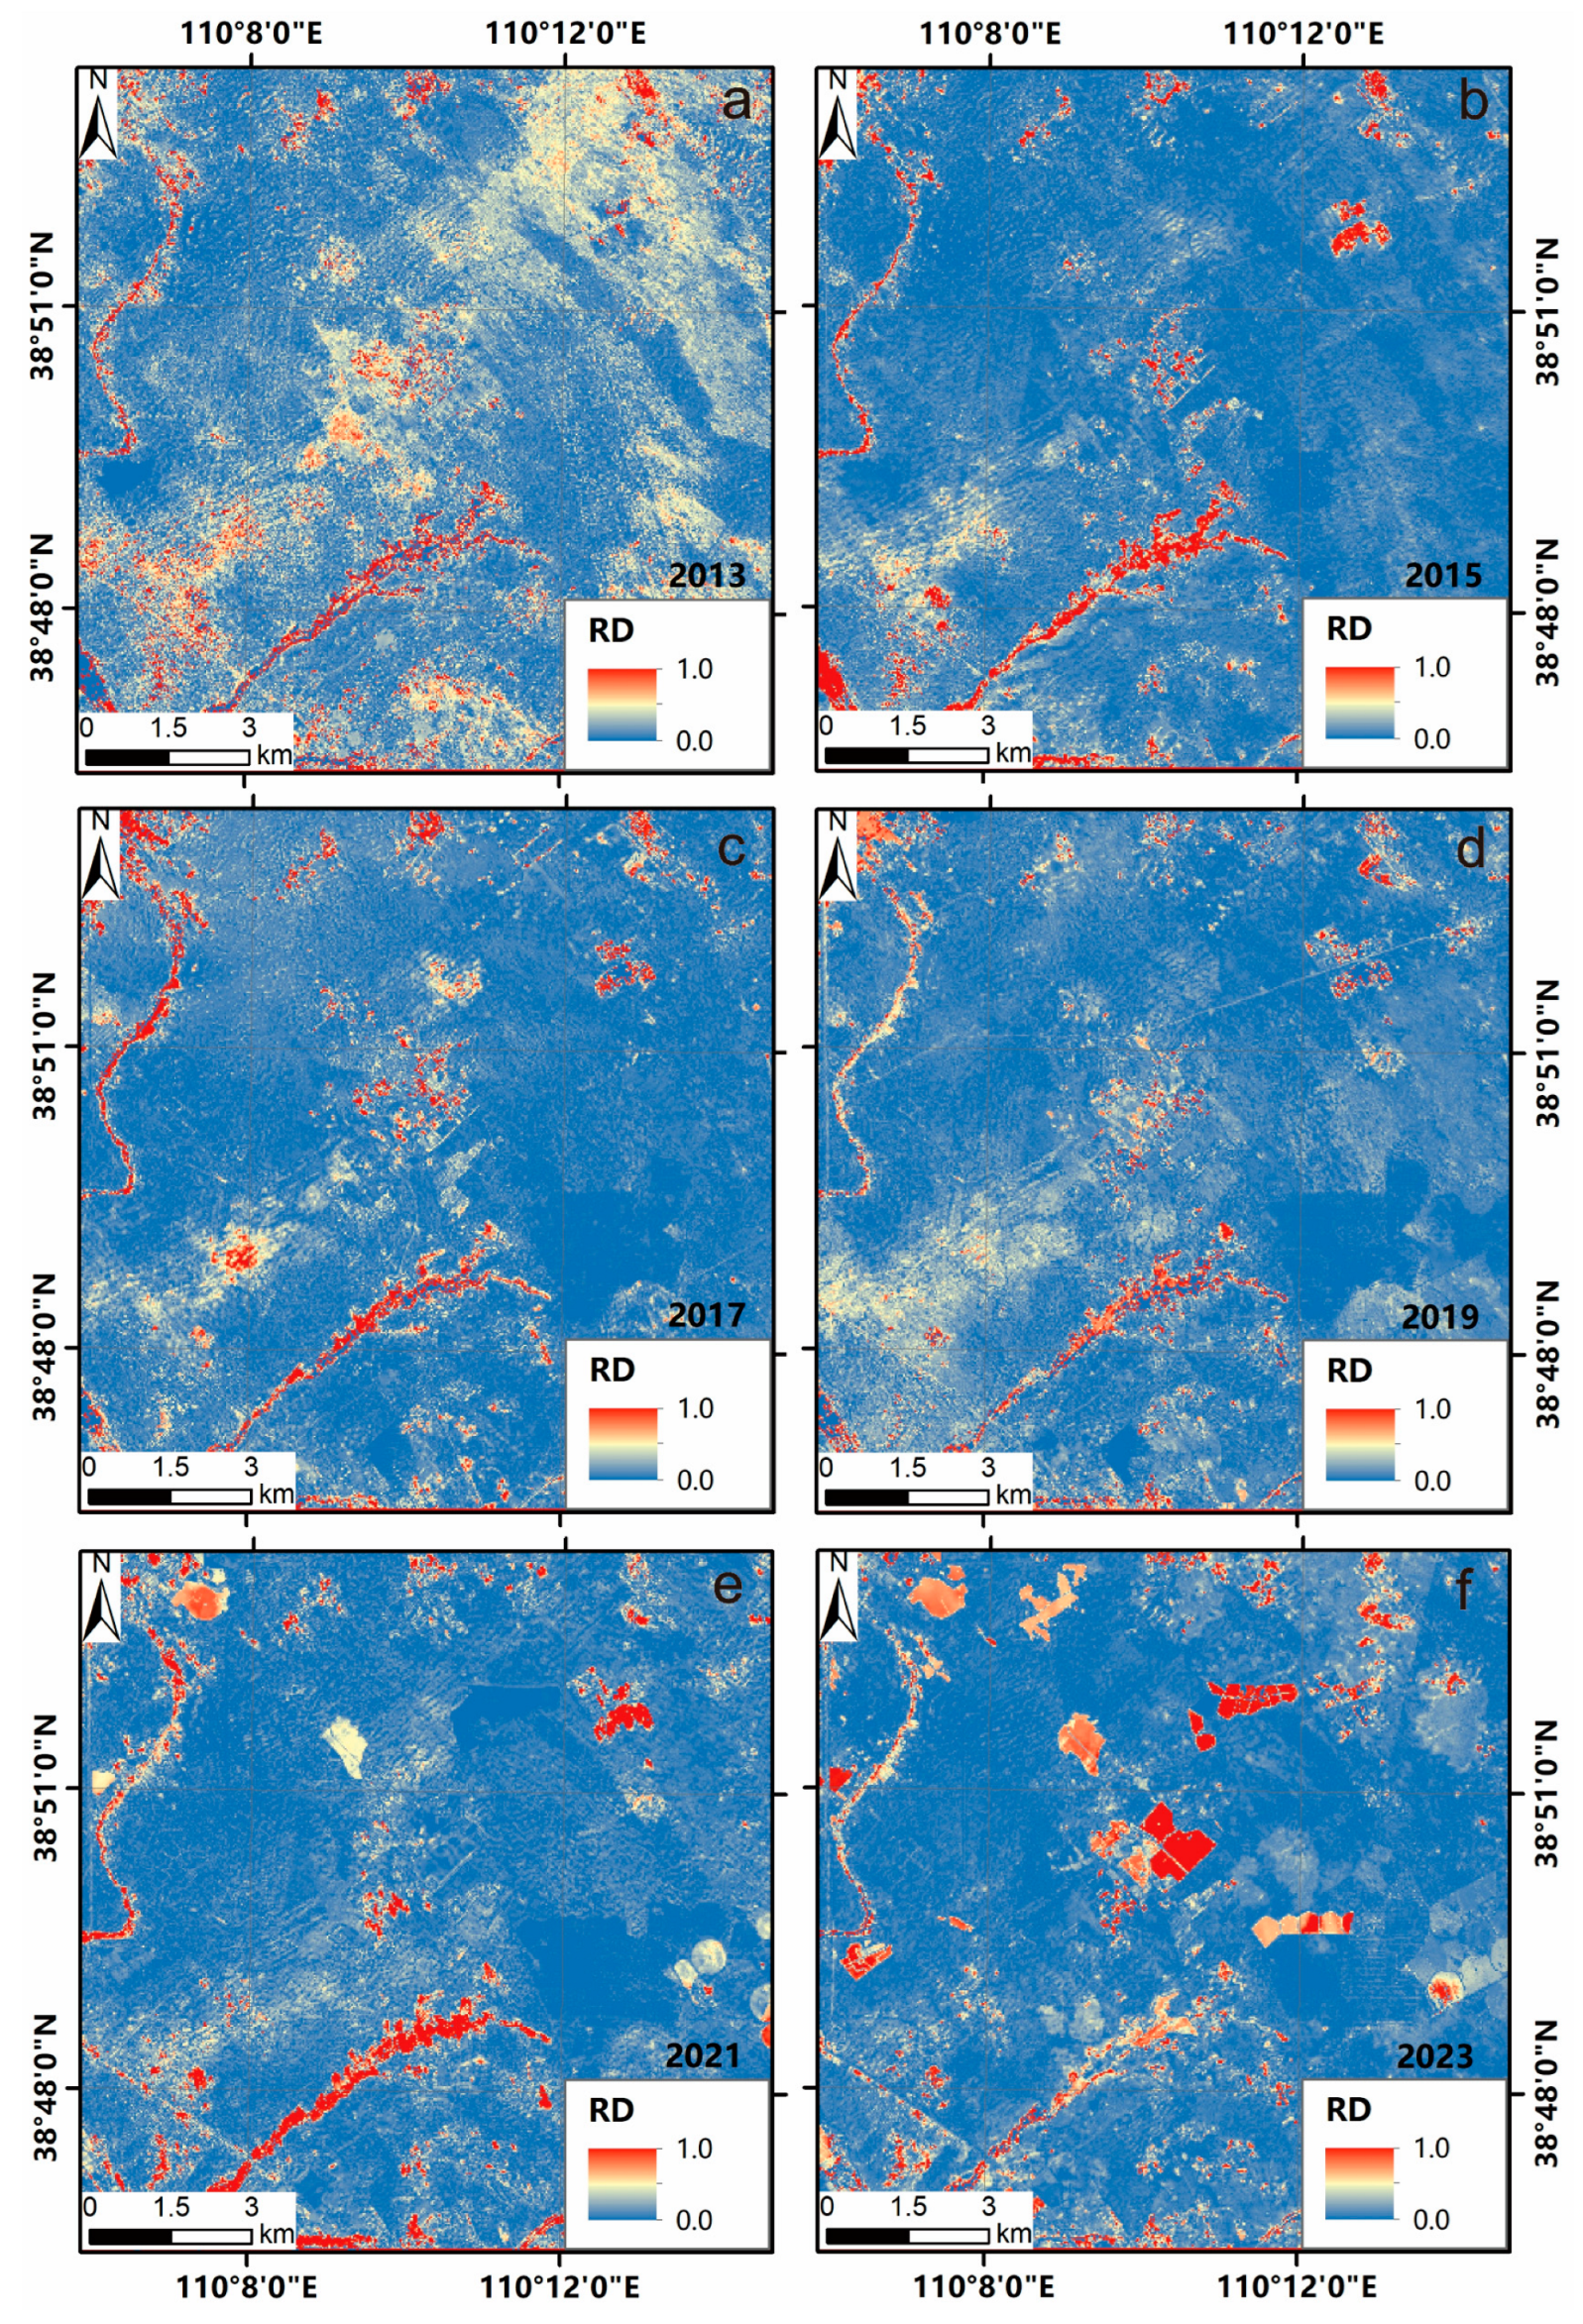
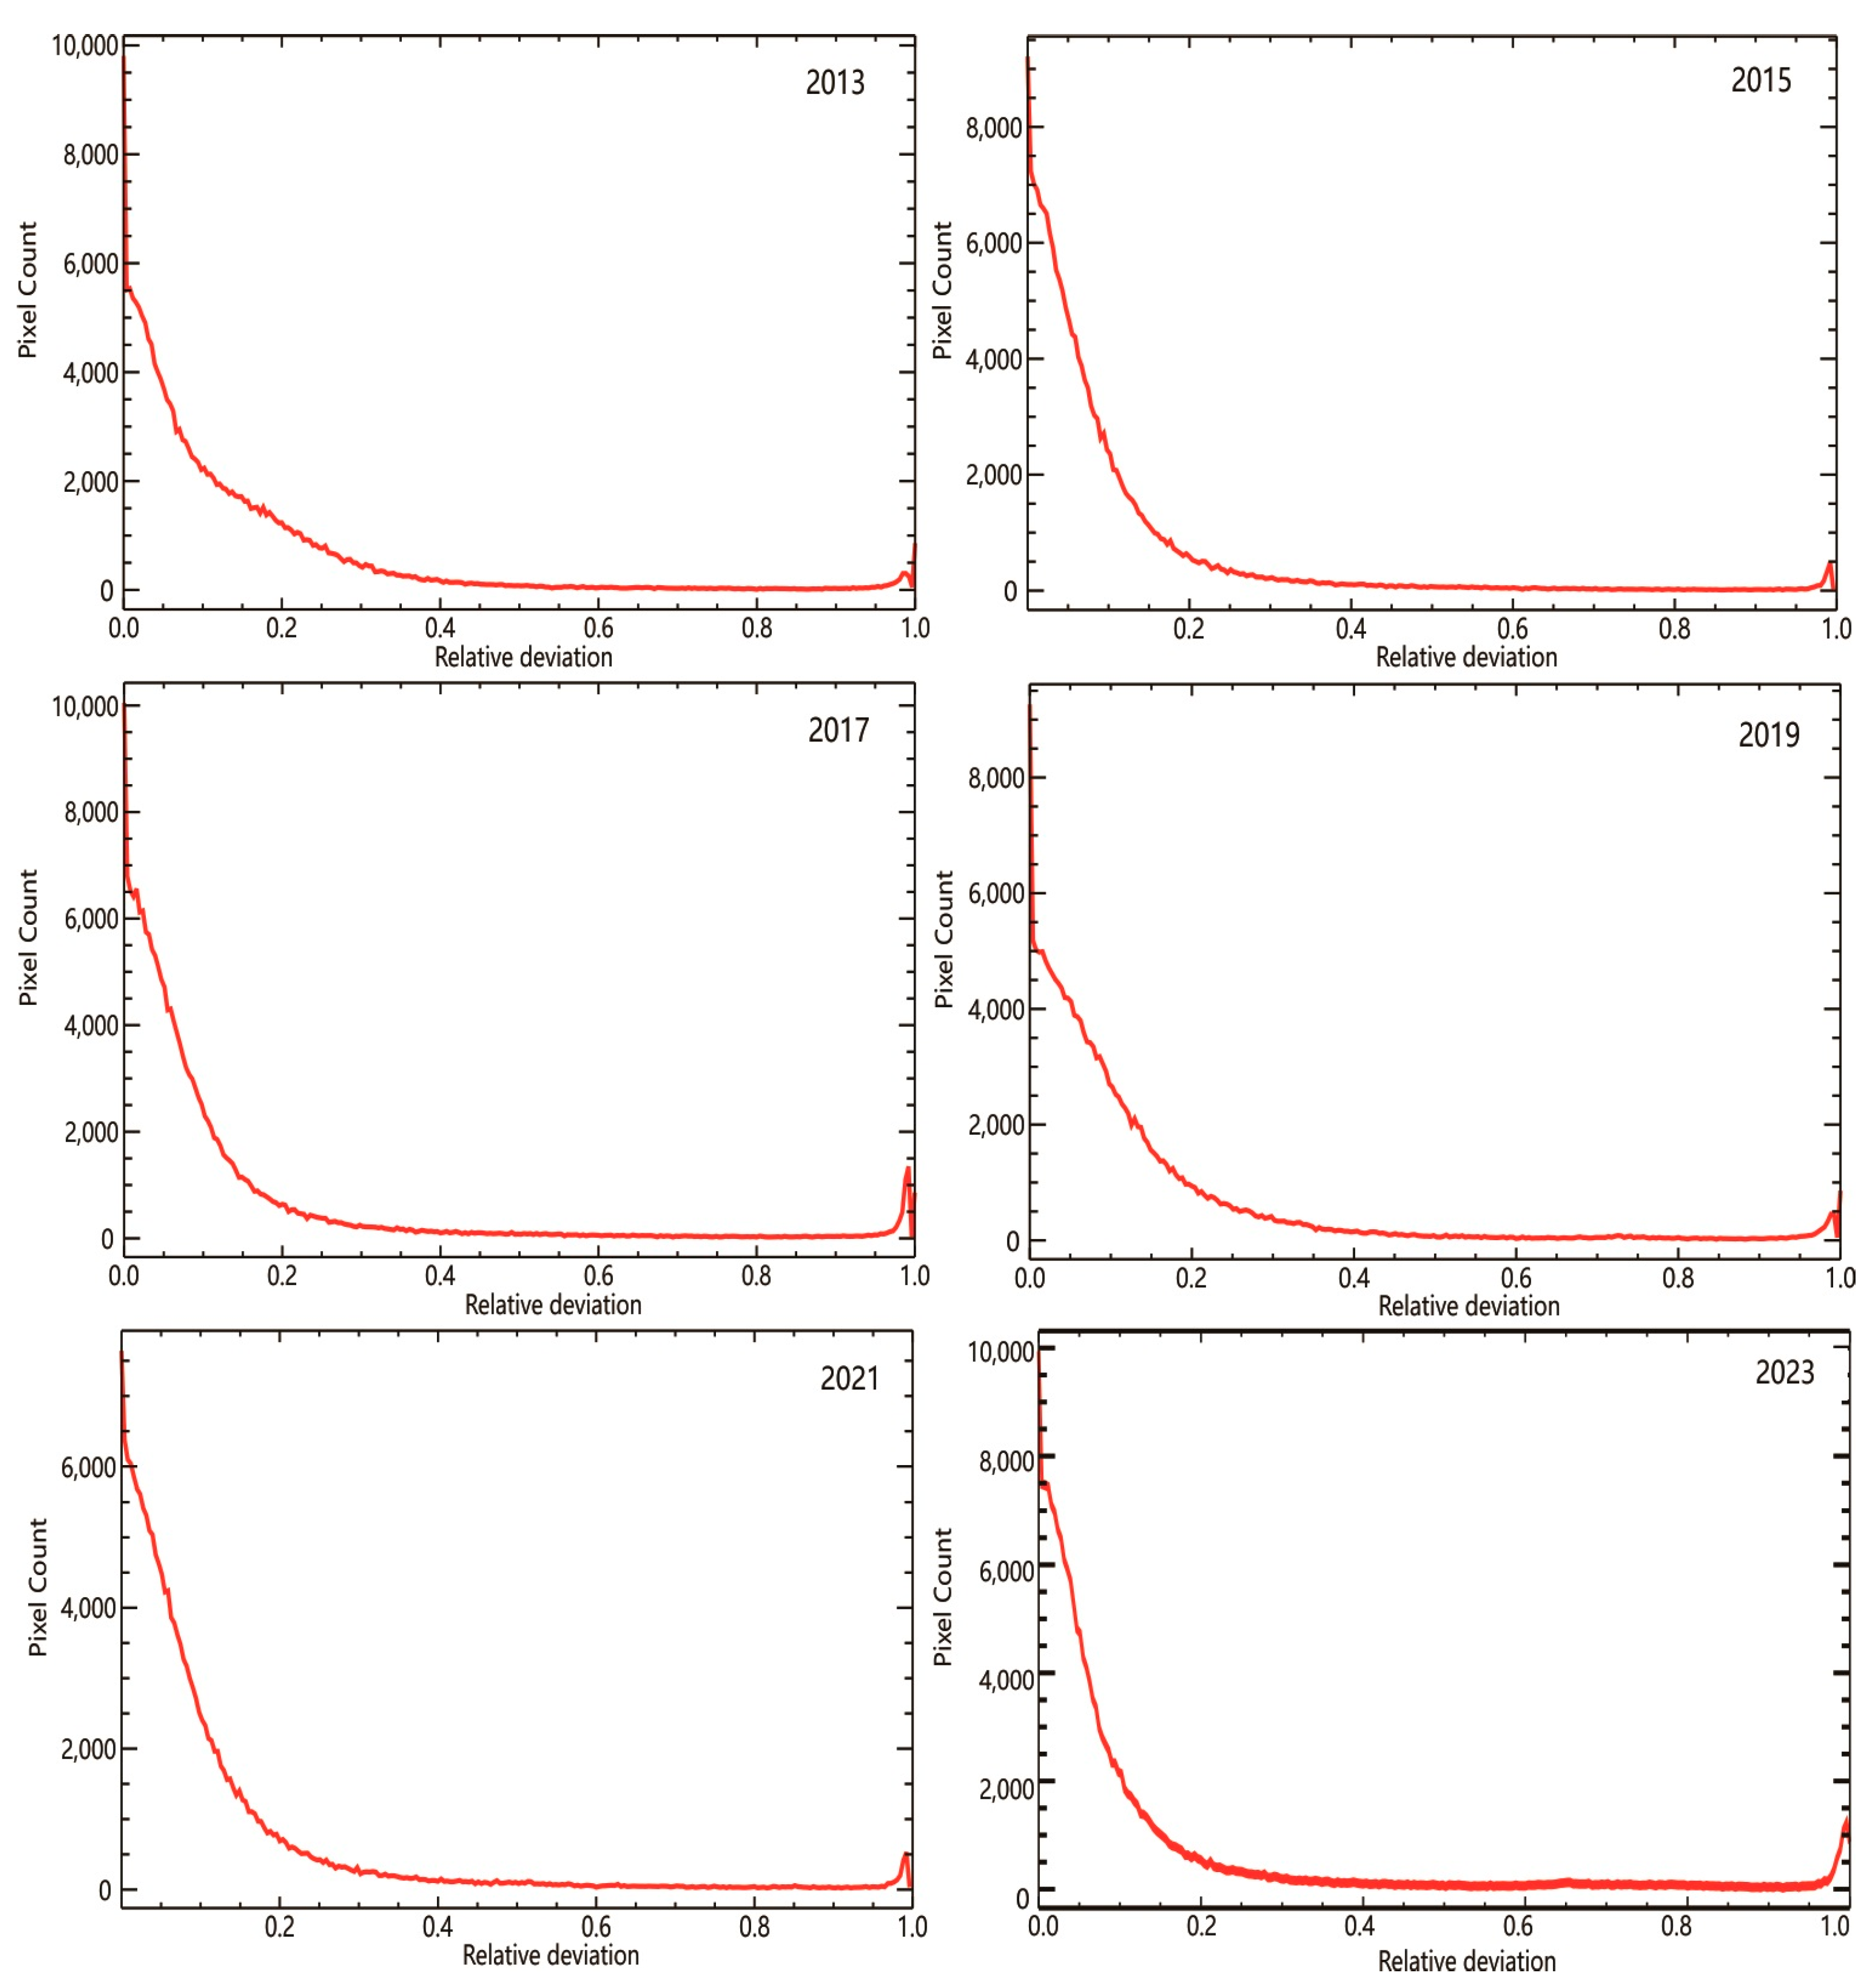
3.3. Robustness of the FRSEI’s Estimation Results

This study examined ecological conditions across different years (from 2013 to 2023, with one year selected every two years). Utilizing both technology for integrating data from multiple remote sensing sources and a single Landsat data source, the normalized FRSEI (an improved remote sensing ecological index) and RSEI (remote sensing ecological index) images were calculated and obtained (Figure 7). Subsequently, a relative deviation (RD) analysis was conducted on these two types of images to quantify the differences between them. As visually demonstrated in Figure 8 and Figure 9, the RD values ranged from 0 to 1, revealing the degree of consistency in the representation of ecological information among different regions. Notably, areas with higher RD values were concentrated in the arbor forests along water systems in the southwest, which could be linked to the region’s ecological intricacy and differences in the data sources’ sensitivity; in contrast, areas with lower RD values were mainly concentrated in cultivated land, grassland, and shrub forests, indicating good consistency between the two methods in agricultural land monitoring.
Observations from the spatial distribution map (Figure 8) and histogram (Figure 9) of RD for the FRSEI and RSEI reveal that the relative deviations between these two types of images are small, with only some regions exhibiting larger deviations. When compared with Figure 4, the regions with larger deviations align consistently with those with lower FRSEI values. Overall, from 2013 to 2023, the RD values in the valley basins in the west and south remained high, attributed to the fact that these valley basins are primarily crop-growing areas surrounded by significant human activities. Human cultivation activities led to higher RD values, as extensive planting and harvesting of crops caused noticeable changes in ground features. Additionally, the images were acquired on different days within the same month, contributing to the higher deviation in this region.
Apart from the valley basins, higher RD values were also observed in the northeast and central regions. Combined with the GF-1 true-color images (Figure 2), it can be seen that during 2013–2015, the northeast began constructing solar photovoltaic panels, and these construction activities resulted in changes in the ground features, leading to higher RD values. By 2023, higher RD values emerged in the central section of the research area. From the GF-1 true-color imagery (Figure 2), it is evident that this region started being reclaimed in 2019 and green nurseries or crops were established in 2023. The newly developed green areas caused changes in the ground features, resulting in higher RD values.
Further analysis revealed that among the RD results for the six different years, over 80% of the pixels had RD values within 0.20, with the highest proportion reaching 87.39% (Figure 9). This proportion fully demonstrates the high similarity between the FRSEI calculated utilizing the integration of data from various remote sensing sources and the RSEI calculated using only Landsat 8 OLI data. Specifically, the average proportion of pixels with high consistency (RD < 0.20) over the six years reached 85.74%. This result not only verifies the stability and accuracy of the FRSEI in the calculation process but also highlights the potential of multi-source remote sensing data fusion technology in improving the accuracy of ecological environment monitoring, thereby proving the applicability of the FRSEI as a more reliable and comprehensive ecological assessment tool.

4. Discussion

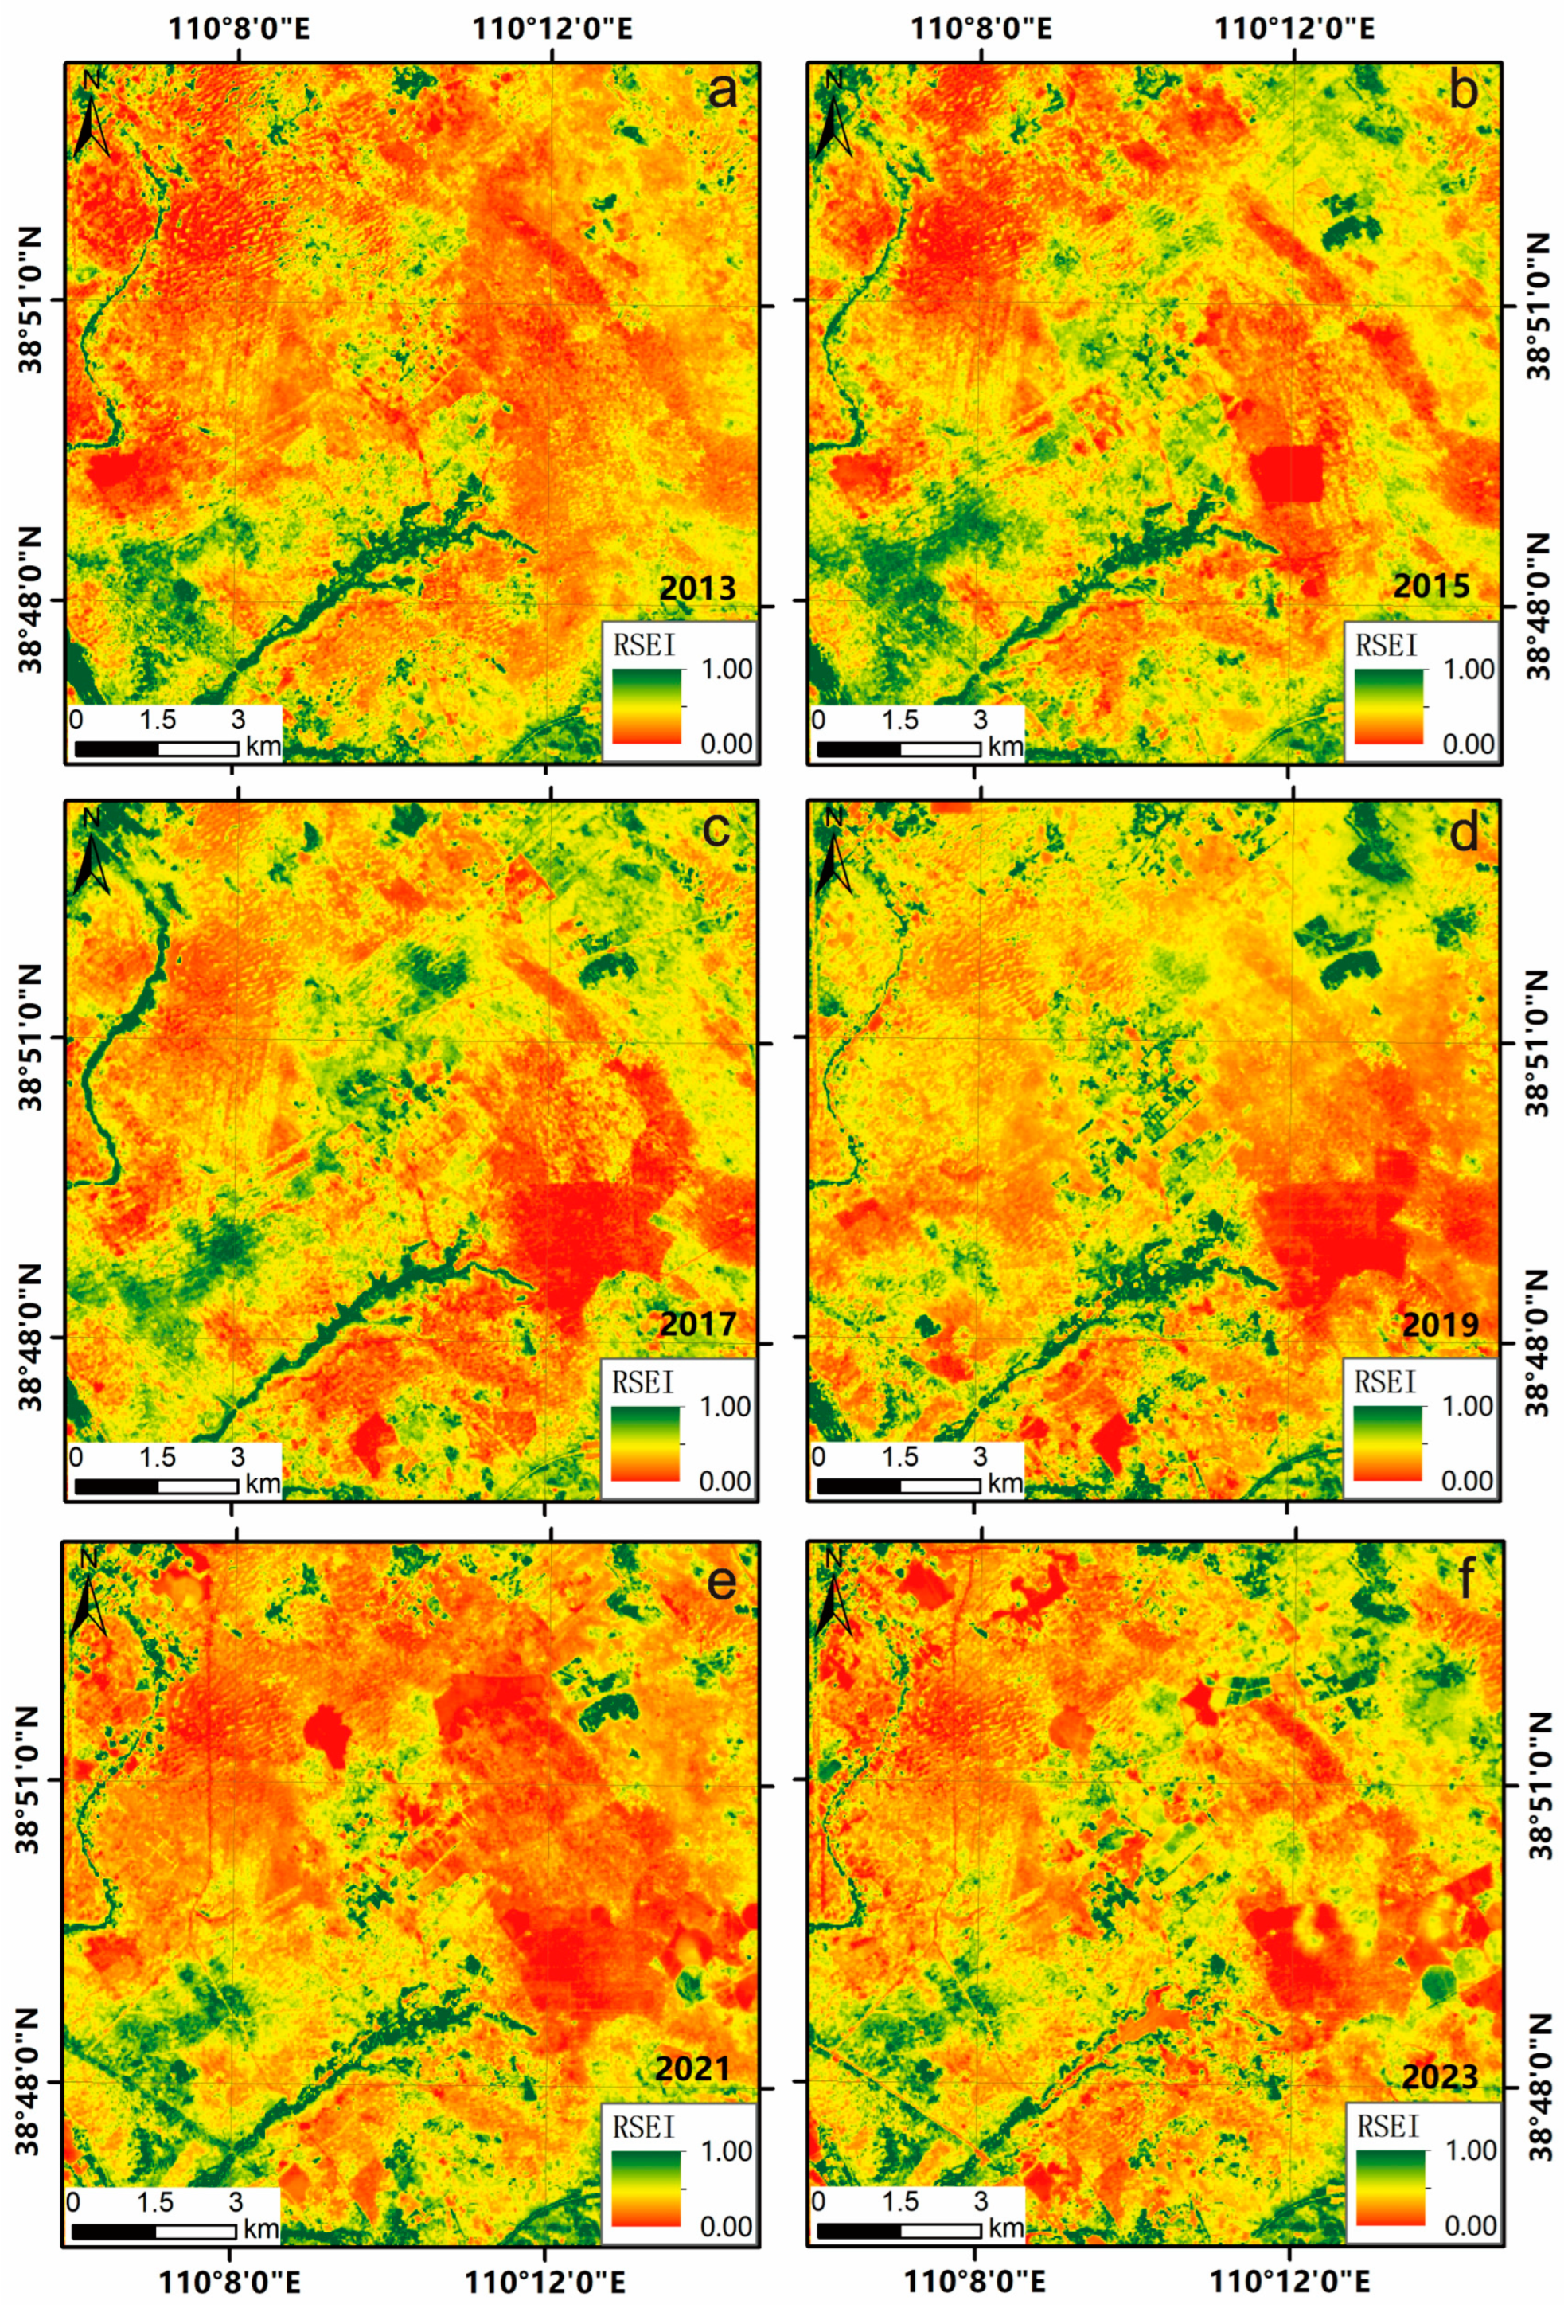
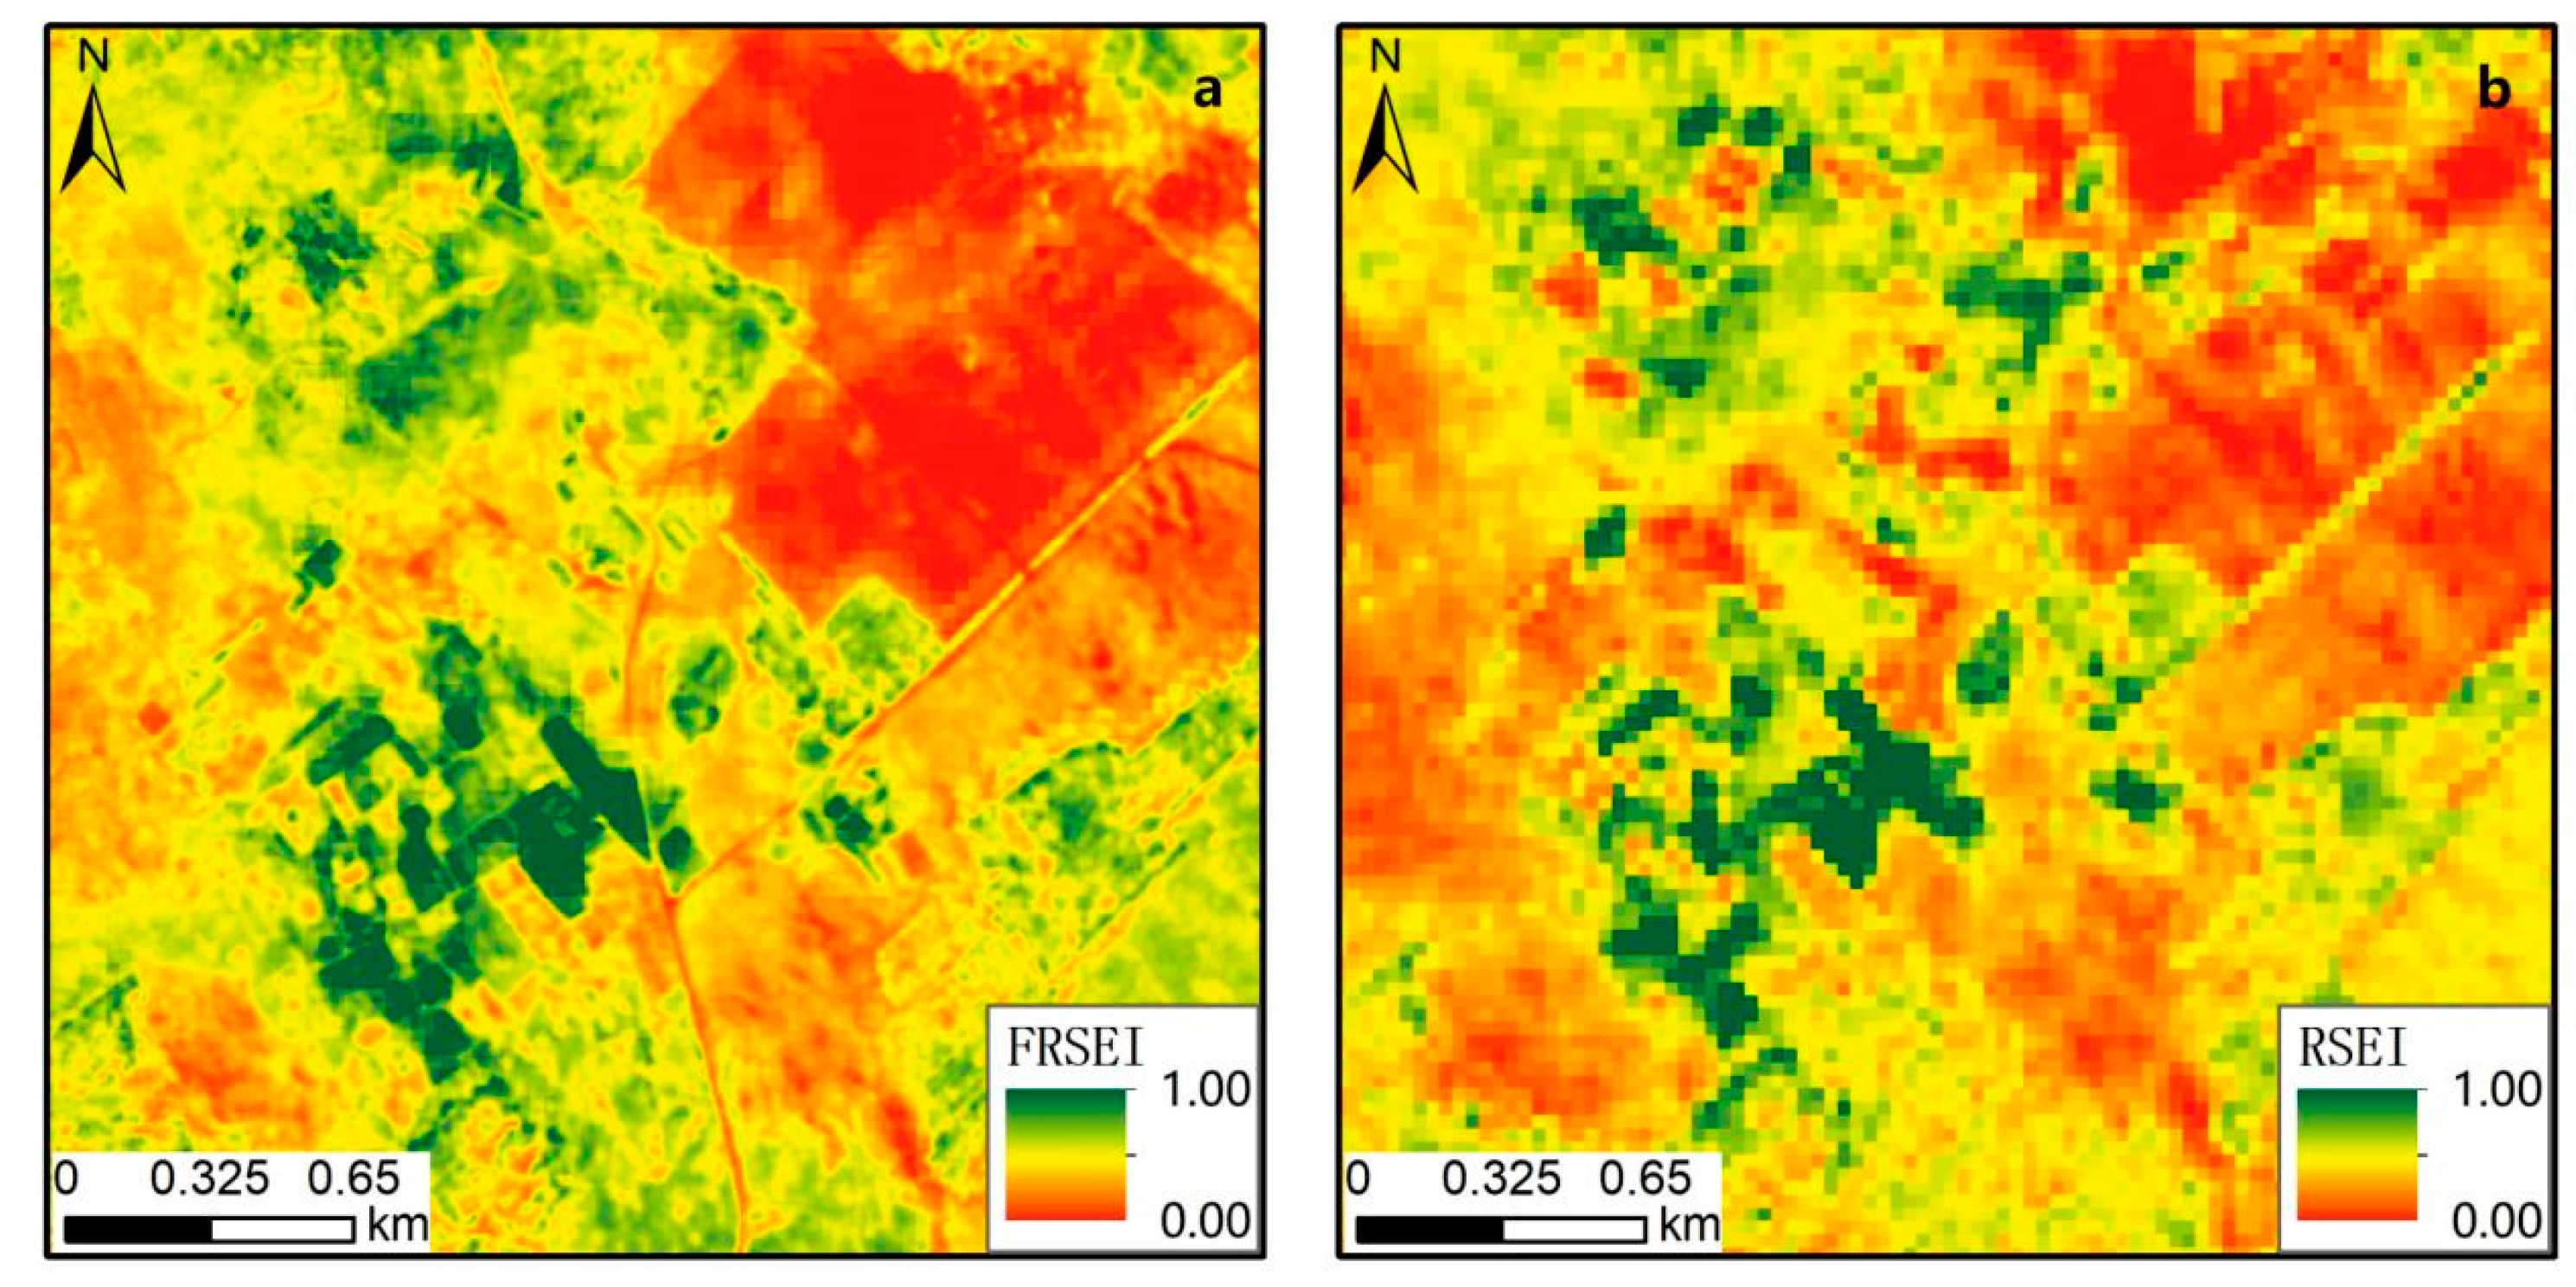
4.1. The FRSEI Enhances the Spatial Resolution of the Remote Sensing Ecological Index

In the field of remote sensing ecology, the remote sensing ecological index (RSEI) has emerged as an effective tool for assessing ecological environmental conditions, with the enhancement of its spatial resolution being a key research direction. The traditional RSEI primarily relies on Landsat series satellite data, particularly Landsat 8 OLI data, whose rich spectral bands facilitate the extraction of ecological environmental parameters [53]. However, due to the geometric resolution constraint of Landsat 8 OLI data, which is 30 m, the traditional RSEI has limitations in monitoring and assessing the ecological environment at fine scales, especially when conducting large-scale investigations at mine-level resolutions, where its resolution often fails to capture precise details of ecological environmental changes.
Furthermore, in recent years, advancements in high-resolution remote sensing technology have introduced China’s GF-1 satellite, with its 2 m high geometric resolution data, providing a new perspective for remote sensing ecology research. GF-1 data enhance recognition accuracy and provide detailed support for assessments in areas like mines [54]. Against this backdrop, the fused remote sensing ecological index (FRSEI) emerges as an innovative fusion strategy, combining the high geometric resolution of GF-1 data with the abundant spectral details provided by Landsat 8 OLI data, achieving a significant improvement in the spatial resolution of the remote sensing ecological index.
The FRSEI integrates the normalized difference vegetation index (NDVI) and the normalized difference water index (NDWI) calculated from GF-1 data, along with the land surface temperature (LST) and normalized difference building–soil index (NDBSI) derived from Landsat 8 OLI data, comprehensively reflecting multiple key elements of the ecological environment. This fusion strategy not only retains the comprehensiveness of the traditional RSEI in ecological environmental assessment but, importantly, through the introduction of GF-1 data, elevates the detail level of the produced images to the 2 m level, enabling precise capture of key ecological parameters such as vegetation cover, water body distribution, surface temperature, and bare soil proportion in specific areas like mines.
Previous research literature has documented scholars utilizing Landsat series data for large-scale ecological environment assessments, but because of limits in the data resolution, it has often been difficult to reveal subtle changes in the ecological environment at fine scales [55]. The application of GF-1 data offers potential solutions to this problem. However, the use of a single data source still has certain limitations. The proposal of the FRSEI not only fully exploits the potential of GF-1 data but also represents an important exploration of the utilization of technology for integrating data from multiple remote sensing sources in the domain of remote sensing ecology. Through comparative experiments, we found that compared with the traditional RSEI, the FRSEI can obtain more detailed ecological environment assessment results in larger-scale investigations at mine-level resolutions (Figure 10a). For instance, the FRSEI can more accurately identify subtle changes in remote sensing ecological indices at the surface compared with the RSEI, providing more precise data support for mine ecological restoration and vegetation reconstruction (Figure 10b).

4.2. Impact of Human Activities on the Ecological Environment of the Jinjie Mining Area

This study analyzed the ecological environment quality of coal mining in the Jinjie mining area from 2013 to 2023 using time series and spatial distribution data, exploring the impact of coal mining on ecological environmental quality. The extraction of coal resources occupies a significant amount of farmland, forestland, and grassland, resulting in a significant decline in the overall ecological conditions within the mining region [56]. Additionally, a large amount of waste generated during underground coal mining poses hazards to the ecological environment [57], a pattern also reflected in the interannual variation in the mean FRSEI (fused remote sensing ecological index) in this study. Considering the entire time series (2013–2023), the quality of the ecological surroundings in the Jinjie mining area experienced a trend of initial improvement (in 2013 and 2015), followed by decline (in 2017 and 2019), and then another improvement (in 2021 and 2023). Regarding the spatial distribution, the ecological conditions in the Jinjie mining area exhibit poorer quality in the northwest and east, while the central and southwestern regions show better quality. The quality of the ecological environment around the mines is significantly poorer than that of the entire mining area (Figure 11), indicating that mining activities have detrimental effects on ecological environmental quality. Besides mining activities, human activities in the mining area also include a series of reclamation measures taken to restore and promote ecological environmental quality [58]. Since its establishment in 2004, the Jinjie mining area has always adhered to the tenets of prioritizing ecology and promoting sustainable development, transforming the passive approach to ecological environmental management into a proactive one. It has implemented the “Five Mining and Five Treatments” construction strategy [59], which emphasizes “treating before mining, treating large areas while mining small ones, coordinating mining with treatment, ensuring mining through treatment, and promoting treatment through mining”, and explored the “Three Stages and Three Circles” governance model, focusing on “prevention and control before mining, control during mining, and restoration after mining”, as well as “outer protective circles, surrounding evergreen circles, and central beautification circles” [60]. This has ensured that the condition of the ecological environment in the mining area has improved rather than declined since its establishment, which is consistent with the results obtained in this paper, showing that the negative disturbances to the mining area can be offset by human-induced positive restoration, and that the general condition of the ecological environment in the Jinjie mining area has varied and improved over the last 10 years. In 2015, Yulin City constructed a 3-gigawatt photovoltaic power station in coal mine gob areas and industrial parks, including the Jinjie mining area [61]. These photovoltaic power plants stripped a large area of native vegetation during the initial construction phase in 2017, resulting in a significant decrease in the FRSEI (Figure 12). After they became operational and vegetation was restored, the FRSEI showed localized increases and improvements (Figure 12). This also led to a reduction in the average FRSEI across the whole study region in 2017 and 2019. Through six observations of the FRSEI over a decade, the overall FRSEI condition in the Jinjie mining area continued to achieve stable growth after experiencing a short-term and small-scale decline. This indicates that coal mining activities and human activities during the initial construction phase of photovoltaic power plants can damage the ecological environment to a certain extent. However, through green mine construction and vegetation restoration in photovoltaic power plants, the mining area can restore and slightly exceed the natural ecological environmental conditions. This growth trajectory establishes a robust basis for the sustainable economic and ecological advancement of the mining region.

5. Conclusions

(1) This research utilized high-resolution remote sensing data from GF-2 and medium-resolution data from Landsat 8 OLI to develop the fused remote sensing ecological index (FRSEI) for assessing and analyzing the ecological environmental quality of the Jinjie mining area. Between 2013 and 2023, the overall ecological environmental quality of the Jinjie mining area experienced an initial improvement, followed by degradation, and then improvement again. The ecological environmental quality near the mines was significantly lower than the overall quality of the mining area, indicating that coal mining activities have negatively impacted the ecological environment of the mining area.
(2) Shenmu County, Yulin City, where the study area is located, regards renewable energy as the key to green and low-carbon transformation, achieving the “dual carbon” goals and cultivating new pillar industries. It fully utilizes coal mining subsidence areas to vigorously promote the development of photovoltaic power generation, striving to reduce over-reliance on traditional energy sources and making the new energy industry a sustainable growth point for regional economic development. During the construction of these photovoltaic power plants, there was indeed a phenomenon of the FRSEI’s degradation. However, after the power plants were commissioned, the vegetation and the FRSEI showed a gradual trend of improvement.
(3) Among the RD results from six different years, over 80% of the pixels had RD values within 0.20, with the highest proportion reaching 87.39%. This proportion fully demonstrates the high similarity between the FRSEI calculated on the basis of multi-source remote sensing data fusion and the remote sensing ecological index (RSEI) calculated solely using Landsat 8 OLI data. Specifically, the average proportion of pixels with high consistency (RD < 0.20) over the six years reached 85.74%. This result not only verifies the stability and accuracy of the FRSEI’s calculation process but also highlights the potential of multi-source remote sensing data fusion technology in improving the accuracy of ecological environmental monitoring. Thus, it proves the applicability of the FRSEI as a more reliable and comprehensive ecological assessment tool.

Author Contributions

Conceptualization, X.G. and M.Y.; methodology, X.C.; software, X.Y.; validation, X.Z.; formal analysis, X.W.; investigation, X.Y.; writing—original draft preparation, X.W.; writing—review and editing, M.Y.; project administration, X.C.; funding acquisition, X.G. All authors have read and agreed to the published version of the manuscript.

Funding

This research was funded by the National Natural Science Foundation of China (grant number 42272342), the Natural Science Basic Research Program of Shaanxi (program number 2021JM-350), the Social Science Foundation of Shaanxi (grant number 2021D068) and the APC was supported by the Geological Survey Foundation of China Geological Survey (grant number DD20221774).

Data Availability Statement

Data are available from the corresponding author upon reasonable request.

Acknowledgments

We are thankful to the Key Laboratory of Groundwater and Ecology in Arid and Semi-Arid Regions, China Geological Survey, and the Xi’an Geological Survey Center of China Geological Survey for their contributions to this research. The authors would like to thank the reviewers and editors for their very helpful and constructive reviews of this manuscript.

Conflicts of Interest

The authors declare no conflicts of interest.

References

  1. Wu, Z.; Wang, M.; Chen, S.; Zou, D. Monitoring and Evaluation of Ecological Environments Spatio-Temporal Variation in Mine Based on RSEI in Yongding Mine. Ecol. Sci. 2016, 35, 200–207. [Google Scholar]
  2. Hao, Y.; Zhang, Z.; Liao, H.; Wei, Y. China’s farewell to coal: A forecast of coal consumption through 2020. Energy Poliey 2015, 86, 444–455. [Google Scholar] [CrossRef]
  3. Yue, H.; Liu, Y.; Zhu, R. Monitoring ecological environment change based on remote sensing ecological index in Shandong mining area. Bull. Soil Water Conserv. 2019, 39, 101–107. [Google Scholar]
  4. Lu, Y.; Heng, W.; Yue, H. Quantifying the coal mining impaction the ecological environment of Gobi open-pit mines. Sci. Total Environ. 2023, 883, 163723. [Google Scholar] [CrossRef]
  5. Li, D. Development Prospect of Photogrammetry and Remote Sensing. Geomat. Inf. Sci. Wuhan Univ. 2008, 33, 5–9. [Google Scholar]
  6. Yang, Y.; Erskine, P.; Lechner, A.; Mulligan, D.; Zhang, S.; Wang, Z. Detecting the Dynamics of Vegetation Disturbance and Recovery in Surface Mining Area via Landsat Imagery and Land Trendr Algorithm. J. Clean. Prod. 2018, 178, 353–362. [Google Scholar] [CrossRef]
  7. Li, N.; Yan, C.; Xie, J. Remote Sensing Monitoring Recent Rapid Increase of Coal Mining Activity of an Important Energy Base in Northern China, a Case Study of Mu Us Sandy Land. Resour. Conserv. Recycl. 2015, 94, 129–135. [Google Scholar] [CrossRef]
  8. Hu, X.; Xu, H. A new remote sensing index for assessing the spatial heterogeneity in urban ecological quality: A case from Fuzhou City, China. Ecol. Indic. 2018, 89, 11–21. [Google Scholar] [CrossRef]
  9. HJ/T192-2006; Environmental Protection Industry Standards of the People’s Republic of China. China Environmental Science Press Co., Ltd.: Beijing, China, 2006.
  10. Yao, Y.; Wang, S.; Zhou, Y.; Liu, R.; Han, X. The Application of Ecological Environment Index Model on the National Evaluation of Ecological Environment Quality. Remote Sens. Inf. 2012, 27, 93–98. [Google Scholar]
  11. Zhang, Y. The Western Coal Mining Area Ecological Environment Situation of Quantitative Evaluation. Shandong Coal Sci. Technol. 2016, 5, 207–208. [Google Scholar]
  12. Xu, H. A Remote Sensing Index for Assessment of Regional Ecological Changes. China Environ. Sci. 2013, 33, 889–897. [Google Scholar]
  13. Song, H.; Xue, L. Dynamie monitoring and analysis of ecological environment in Weinan City, Northwest China based on RSEI mode. J. Appl. Ecol. 2016, 27, 3913–3919. [Google Scholar]
  14. Liu, O.; Yu, F.; Mu, X. Evaluation of the ecological environment quality of the Kuye River source basin using the Remote Sensing ecological index. Int. J. Environ. Res. Public Health 2022, 19, 12500. [Google Scholar] [CrossRef] [PubMed]
  15. Xu, F.; Li, H.; Li, Y. Ecological environment quality evaluation and evolution analysis of a rare earth mining area under different disturbance conditions. Environ. Geochem. Health 2022, 43, 2243–2256. [Google Scholar] [CrossRef]
  16. Song, M.; Luo, Y.; Duan, L. Evaluation of Ecological Environment in the Xilin Gol Steppe Based on Modified Remote Sensing Ecological Index Model. Arid Zone Res. 2019, 36, 1521–1527. [Google Scholar]
  17. Xia, N. Study on Remote Sensing Monitoring of Eco-Environment and Assessment Model of Ecological Quality in Zhundong Mining Region. Ph.D. Thesis, Xinjiang University, Urumuqi, China, 2018. [Google Scholar]
  18. Wang, X. Study on Eco-Environmental Cumulative Effects in Coal Mining Area: Case Studies in Lu’an Mining Area. Ph.D. Thesis, China University of Mining and Technology, Xuzhou, China, 2010. [Google Scholar]
  19. Li, J.; Pei, Y.; Zhao, S.; Xiao, R.; Sang, X.; Zhang, C. A Review of Remote Sensing for Environmental Monitoring in China. Remote Sens. 2020, 12, 1130. [Google Scholar] [CrossRef]
  20. Li, N.; Wang, J.; Fen, Q. The improvement of ecological environment index model RSEI. Arab. J. Geosci. 2020, 13, 403. [Google Scholar]
  21. Ji, X.; Yan, Y.; Guo, W.; Teng, Y.; Zhao, C. Ecological environment assessment of Shanxi Province and planned mining area based on coupling Remote Sensing Ecological Index (RSEI) model. Coal Geol. Explor. 2023, 51, 103–112. [Google Scholar]
  22. Xu, H.; Wang, Y.; Guan, H.; Shi, T.; Hu, X. Detecting Ecological Changes with a Remote Sensing Based Ecological Index (RSEI) Produced Time Series and Change Vector Analysis. Remote Sens. 2019, 11, 2345. [Google Scholar] [CrossRef]
  23. Lan, G.; Jiang, X.; Xu, D.; Guo, X.; Wu, Y.; Liu, Y.; Yang, Y. Ecological vulnerability assessment based on remote sensing ecological index (RSEI): A case of Zhongxian County, Chongqing. Front. Environ. Sci. 2023, 10, 1074376. [Google Scholar] [CrossRef]
  24. Jiang, F.; Zhang, Y.; Li, J.; Sun, Z. Research on remote sensing ecological environmental assessment method optimized by regional scale. Environ. Sci. Pollut. Res. 2021, 28, 68174–68187. [Google Scholar] [CrossRef] [PubMed]
  25. Zhu, D.; Chen, T.; Niu, R.; Zhen, N. Analyzing the Ecological Environment of Mining Area by Using Moving Window Remote Sensing Ecological Index. Geomat. Inf. Sci. Wuhan Univ. 2021, 46, 341–347. [Google Scholar]
  26. Zheng, Z.; Wu, Z.; Chen, Y.; Guo, C. Francesco Marinello, Instability of remote sensing based ecological index (RSEI) and its improvement for time series analysis. Sci. Total Environ. 2022, 814, 152595. [Google Scholar] [CrossRef] [PubMed]
  27. Fan, Y.; Liu, Y.; Heng, W.; Yue, H.; Bi, Y. lmpaet analysis of coal mining on ecological environment in Shandong Mining area from 1990 to 2022 based on RSEI. J. Green Mine 2024, 2, 41–53. [Google Scholar]
  28. Li, X.; Zheng, Y.; Chen, A.; Zhou, J.; Li, Q.; Hou, Q. Ldentilicaion of ecological restoration priority areas based on ecological security patems and risk assessment: A case study of Shenmu City. Acta Ecol. Sin. 2024, 44, 8784–8797. [Google Scholar]
  29. Yang, P.; Yang, W.; Ma, R. Study on microscopic pore sruclure types of Jurassic sandstone and water abundance in Jinjie Coal Mine. Coal Sci. Technol. 2021, 49, 188–194. [Google Scholar] [CrossRef]
  30. Zhao, J.; Meng, L.; Wang, Q.; Guo, D.; Shen, Z. Development and Construction of China’s High-Resolution Earth Observation System. Satell. Appl. 2022, 11, 8–13. [Google Scholar]
  31. Liu, H.; Han, Y.; Wang, W.; Zhang, P.; Yao, R.; Zhao, W. Promoting the Synergistic Development of a New Round of Strategic Actions for Mineral Exploration Breakthroughs and Ecological Protection—AI + Geological Information Construction on the Qinghai-Tibet Plateau. Technol. Innov. Appl. 2024, 14, 91–93+98. [Google Scholar] [CrossRef]
  32. Duan, J. Comparative Analysis of Land Surface Temperature Retrieval Algorithms Based on Landsat8 Data: A Case Study of Beijing. Anhui Agric. Sci. Bull. 2019, 25, 148–150. [Google Scholar]
  33. Xu, H.; Duan, W.; Deng, W.; Lin, M. RSEI or MRSEI? Comment on Jia et al. Evaluation of Eco-Environmental Quality in Qaidam Basin Based on the Ecological Index (MRSEI) and GEE. Remote Sens. 2021, 13, 4543. Remote Sens. 2022, 14, 5307. [Google Scholar] [CrossRef]
  34. Wang, L.; Jiao, L.; Lai, F.; Zhang, N. Evaluation of ecological changes based on remote sensing ecological index in Manas Lake wetland, Xinjiang. Acta Ecol. Sin. 2019, 39, 2963–2972. [Google Scholar]
  35. Chao, F.; Feng, G.; Wang, L.; Zhao, S. Evaluation of Environmental Quality Based on Remote Sensing Data in the Coastal Lands of Eastern China. J. Coast. Res. 2010, 36, 1229–1236. [Google Scholar]
  36. Zhou, J.; Liu, W. Monitoring and Evaluation of Eco-Environment Quality Based on Remote Sensing-Based Ecological Index (RSEI) in Taihu Lake Basin, China. Sustainability 2022, 14, 5642. [Google Scholar] [CrossRef]
  37. Gao, B. NDWI—A normalized difference water index for remote sensing of vegetation liquid water from space. Remote Sens. Environ. 1996, 58, 257–266. [Google Scholar] [CrossRef]
  38. Wilson, E.H.; Sader, S.A. Detection of forest harvest type using multiple dates of Landsat TM imagery. Remote Sens. Environ. 2002, 80, 385–396. [Google Scholar] [CrossRef]
  39. Liu, X.; Zhou, J.; Lu, J.; Jia, L.; Xiong, X.; Cui, Y. Analyzing the uncertainty of the multisource remote sensing-based vegetation products for drought monitoring. Natl. Remote Sens. Bull. 2024, 28, 2383–2404. [Google Scholar] [CrossRef]
  40. Crist, E.P. A TM tasseled cap equivalent transformation for reflectance factor data. Remote Sens. Environ. 1985, 17, 301–306. [Google Scholar] [CrossRef]
  41. Huang, C.; Wylie, B.; Yang, L.; Homer, C.; Zylstra, G. Derivation of a tasseled cap transformation based on Landsat 7 at satellite reflectance. Int. J. Remote Sens. 2002, 23, 1741–1748. [Google Scholar] [CrossRef]
  42. Chen, C.; Fu, J.; Zhang, S.; Zhao, X. Coastline information extraction based on the tasseled cap transformation of Landsat-8 OLI images. Estuar. Coast. Shelf Sci. 2019, 271, 281–291. [Google Scholar] [CrossRef]
  43. Li, Z.; Ma, Y. A study on retrieving land surface temperature of Menglun region in Xishuangbanna based on Landsat TM/ETM+ thermal band. J. Yunnan Univ. Nat. Sci. Ed. 2008, 30, 373–376. [Google Scholar]
  44. Qin, Z.; Zhang, M.; Karnieli, A.; Berliner, P. Mono-window Algorithm for retrieving land surface temperature form Landsat TM6 data. Acta Geogr. Sin. 2001, 56, 456–466. [Google Scholar]
  45. Jiménez-Muñoz, J.C.; Sobrino, J.A. A generalized single-channel method for retrieving land surface temperature from remote sensing data. J. Geophys. Res. Atmos. 2003, 108, 4688. [Google Scholar] [CrossRef]
  46. Qin, Z.; Li, W.; Xu, B.; Chen, Z.; Liu, J. The estimation of land surface emissivity for Landsat TM6. Remote Sens. Land Resour. 2004, 16, 28–32. [Google Scholar]
  47. Rikimaru, A.; Roy, P.S.; Miyatake, S. Tropical forest cover density mapping. Trop. Ecol. 2002, 43, 39–47. [Google Scholar]
  48. Wang, S.; Xu, H.; Tang, F. IBI and CA Model based extraction of urban built-up area and its application: A case study in Shanghai. Remote Sens. Technol. Appl. 2017, 32, 1161–1170. [Google Scholar]
  49. Liu, Z.; Xu, H.; Li, L.; Tang, F.; Lin, Z. Ecological changes in the Hangzhou area using the remote sensing based ecological index. J. Sci. Eng. 2015, 23, 728–739. [Google Scholar]
  50. Xu, N. Analysis of Changes in Vegetation Coverage in Tibet during 2005—2014 Based on Remote Sensing. J. Anhui Agri. Sci 2016, 44, 33–37. [Google Scholar]
  51. Liu, J.; Kuang, R.; Li, J.; Hu, M. Inversion Model of TN, TP Concentration Based on Measured Spectral Reflectance Data in Poyang Lake. Southwest China J. Agric. Sci. 2020, 9, 2088–2094. [Google Scholar]
  52. Li, P.; Gao, X. The Impact of Photovoltaic Power Plants on Ecological Environment and Climate: A Literature Review. Plateau Meteorol. 2021, 40, 702–710. [Google Scholar]
  53. Ruan, Y. Extraction and feature analysis of vegetation phenology information from medium-high resolution remote sensing data. Acta Geod. Cartogr. Sin. 2023, 52, 1801. [Google Scholar]
  54. Chen, S.; Lu, D.; Wu, S. Quantitative Comparison of Normalized Water Body Index between GF-1 and Landsat 8 Remote Sensing Images in Karst Regions. J. Atmos. Environ. Opt. 2020, 15, 125–133. [Google Scholar]
  55. Xu, H.; Wang, M.; Shi, T.; Guan, H.; Fang, C.; Lin, Z. Prediction of ecological effects of potential population and impervious surface increases using a remote sensing based ecological index (RSEI). Ecol. Indic. 2018, 93, 730–740. [Google Scholar] [CrossRef]
  56. Zhai, M.; Xu, X.; Jang, D. Remote sensing monitoring of the ecologic environment in Wuhai Mining Area since 1979. Remote Sens. Technol. Appl. 2012, 27, 933–940. [Google Scholar]
  57. Adibee, N.; Osanloo, M.; Rahmanpour, M. Adverse effects and their of coal mine waste dumps on the environment management. Environ. Earth Sci. 2013, 70, 1581–1592. [Google Scholar] [CrossRef]
  58. Liu, Y.; Wei, J.; Bi, Y.; Yue, H.; He, X. Evaluation of ecosystem service function in Shandong Mining Area. J. China Coal Soc. 2021, 46, 1599–1613. [Google Scholar]
  59. Yuan, W.; Shen, D. Coal Group: Enhancing political position, loyally fulfilling duties and fulfilling responsibilities. China Coal Ind. 2021, 6, 18–19. [Google Scholar]
  60. Niu, H.; Tian, S.; Zu, P.; Cao, M.; Qu, S.; Dong, Q.; Li, B.; Jiang, Z.; Bi, Y.; Yue, H. Effect of coal mining on net primary productivity of vegetation in Shan-dong Mining Area. Coal Sci. Technol. 2024, 52, 267–277. [Google Scholar]
  61. Zhao, X. Yulin will construct a 400-kilometer photovoltaic industrial belt. Mod. Enterp. 2013, 10, I0001. [Google Scholar]
Figure 1. The map of the study area.
Water 17 00223 g001
Figure 2. Images captured by GF-1 in the study area in 2013, 2015, 2017, 2019, 2021, and 2023 ((a) GF-1 image acquired in 2013, (b) GF-1 image acquired in 2015, (c) GF-1 image acquired in 2017, (d) GF-1 image acquired in 2019, (e) GF-1 image acquired in 2021, (f) GF-1 image acquired in 2023).
Water 17 00223 g002
Figure 3. Images captured by Landsat 8 OLI in the study area in (a) 2013, (b) 2015, (c) 2017, (d) 2019, (e) 2021, and (f) 2023.
Water 17 00223 g003
Figure 4. The maps of the FRSEI for the six periods during 2013 to 2023 ((a) the FRSEI in 2013, (b) the FRSEI in 2015, (c) the FRSEI in 2017, (d) the FRSEI in 2019, (e) the FRSEI in 2021, (f) the FRSEI in 2023).
Water 17 00223 g004
Figure 5. The variation trend of the FRSEI distribution from 2013 to 2023.
Water 17 00223 g005
Figure 6. The changes in the FRSEI in some regions across different years ((a) the FRSEI around farm lands in 2021, (b) the FRSEI around farm lands in 2023, (c) the FRSEI around the photovoltaic power plant in 2019, (d) the FRSEI around the photovoltaic power plant in 2023).
Water 17 00223 g006
Figure 7. The maps of RSEI for the six periods during 2013 to 2023 ((a) the RSEI in 2013, (b) the RSEI in 2015, (c) the RSEI in 2017, (d) the RSEI in 2019, (e) the RSEI in 2021, (f) the RSEI in 2023).
Water 17 00223 g007
Figure 8. Spatial distribution of the relative deviation between the FRSEI and RSEI ((a) the relative deviation between FRSEI and RSEI in 2013, (b) the relative deviation between FRSEI and RSEI in 2015, (c) the relative deviation between FRSEI and RSEI in 2017, (d) the relative deviation between FRSEI and RSEI in 2019, (e) the relative deviation between FRSEI and RSEI in 2021, (f) the relative deviation between FRSEI and RSEI in 2023).
Water 17 00223 g008
Figure 9. Histogram of the distribution of relative deviation between the FRSEI and RSEI.
Water 17 00223 g009
Figure 10. A comparison of the spatial resolution between the FRSEI and RSEI results ((a) the finer resolution effect of the FRSEI, (b) the lower resolution effect of the RSEI).
Water 17 00223 g010
Figure 11. The impact of mining engineering on the FRSEI with orange highlighting the photovoltaic power plant and tourmaline green marking the industrial mining site ((a) the FRSEI in 2013, (b) the FRSEI in 2015, (c) the FRSEI in 2017, (d) the FRSEI in 2019, (e) the FRSEI in 2021, (f) the FRSEI in 2023).
Water 17 00223 g011
Figure 12. The impact of photovoltaic power plant construction on the FRSEI with orange highlighting the photovoltaic power plant ((a) the FRSEI around the photovoltaic power plant in 2017, (b) the FRSEI around the photovoltaic power plant in 2019, (c) the FRSEI around the photovoltaic power plant in 2021, (d) the FRSEI around the photovoltaic power plant in 2023).
Water 17 00223 g012
Table 1. Remote sensing data.
No.SatelliteSpatial Resolution (m)Acquisition Time
(Year. Month. Day)
Bands
1GF12.02013.09.244
2GF12.02015.05.124
3GF12.02017.08.034
4GF12.02019.08.074
5GF12.02021.07.044
6GF12.02023.07.184
7Landsat 8 OLI30.02013.06.198
8Landsat 8 OLI30.02015.09.058
9Landsat 8 OLI30.02017.09.088
10Landsat 8 OLI30.02019.05.258
11Landsat 8 OLI30.02021.05.308
12Landsat 8 OLI30.02023.06.058
Table 2. Classification table of trend levels.
Basis for ClassificationLevels
Slope < 0, p ≤ 0.01Extremely significant decrease
Slope < 0, 0.01 < p ≤ 0.05Significant decrease
Slope < 0, p > 0.05Insignificant decrease
Slope > 0, p > 0.05Insignificant increase
Slope > 0, 0.01 < p ≤ 0.05Significant increase
Slope > 0, p ≤ 0.01Extremely significant increase
Table 3. Ecological environment quality index of the study area from 2013 to 2023.
MinimumMaximumMean
20130.001.000.5837
20150.001.000.6207
20170.001.000.5700
20190.001.000.5785
20210.001.000.6029
20230.001.000.6252
Disclaimer/Publisher’s Note: The statements, opinions and data contained in all publications are solely those of the individual author(s) and contributor(s) and not of MDPI and/or the editor(s). MDPI and/or the editor(s) disclaim responsibility for any injury to people or property resulting from any ideas, methods, instructions or products referred to in the content.

