Article

Machine Learning Optimization of SWRO Membrane Performance in Wave-Powered Desalination for Sustainable Water Treatment

by
Lukka Thuyavan Yogarathinam
1,
Sani I. Abba
2,*,
Jamilu Usman
1,
Abdulhayat M. Jibrin
3 and
Isam H. Aljundi
1,4
1
Interdisciplinary Research Centre for Membranes and Water Security, King Fahd University of Petroleum and Minerals, Dhahran 31261, Saudi Arabia
2
Department of Civil Engineering, Prince Mohammad Bin Fahd University, Al Khobar 31952, Saudi Arabia
3
Civil and Environmental Engineering Department, King Fahd University of Petroleum and Minerals, Dhahran 31261, Saudi Arabia
4
Department of Chemical Engineering, King Fahd University of Petroleum and Minerals, Dhahran 31261, Saudi Arabia
*
Author to whom correspondence should be addressed.
Water 2025, 17(19), 2896; https://doi.org/10.3390/w17192896
Submission received: 29 April 2025 / Revised: 21 May 2025 / Accepted: 22 May 2025 / Published: 7 October 2025
(This article belongs to the Special Issue Novel Methods in Wastewater and Stormwater Treatment)

Abstract

Wave-powered desalination systems integrate reverse osmosis (RO) with renewable ocean energy, providing a sustainable and environmentally responsible approach to freshwater production. This study aims to investigate wave-powered RO desalination using supervised and deep machine learning (ML) models to predict the effects of variable feed flow on permeate recovery and salt rejection under dynamic hydrodynamic conditions. Multiple ML models, including Gaussian process regression (GPR), support vector machines (SVMs), multi-layer perceptron (MLP), linear regression (LR), and decision trees (DTs) were systematically assessed for the prediction of permeate recovery and salt rejection (%) using three distinct input configurations: limited physicochemical features (M1), flow- and salinity-related parameters (M2), and a comprehensive variable set incorporating temperature (M3). GPR achieved near-perfect predictive accuracy R2 values (~1.00) with minimal errors for permeate recovery and salt rejection, attributed to its flexible kernel and probabilistic design. MLP and SVM also performed well, though they showed greater sensitivity to feature complexity. In contrast, DT models exhibited limited generalization and higher error rates, particularly when key features were excluded. Sensitivity analyses revealed that feed pressure (FP) and brine salinity (BS) were dominant positive influencers of permeate recovery and salt rejection. In contrast, brine flow (BF) and permeate salinity (PS) had negative impacts.

1. Introduction

Water scarcity, intensified by population growth, urbanization, and climate change, has become a major challenge of the 21st century, endangering water security, ecosystem balance, public health, urban sustainability, and socio-economic development [1,2]. Desalination technology, especially the reverse osmosis (RO) process, has been extensively utilized as a sustainable solution to combat water scarcity by converting saline water and industrial wastewater into high-quality freshwater for diverse uses [3]. The cost of producing potable water using RO ranges from 0.9 to 2.1 USD per cubic meter, while seawater reverse osmosis (SWRO) requires 2–4 kWh of energy per cubic meter. Carbon emissions from SWRO desalination are estimated between 0.4 and 6.7 kg CO₂eq per cubic meter, varying based on energy sources and system efficiency [4,5,6]. Simultaneously, global energy demand is anticipated to grow by 48% by 2040, creating major challenges for energy sustainability, effective resource management, and the transition to renewable energy (RE) systems [7]. Integrating RE with RO systems offers a promising solution to environmental challenges by lowering carbon emissions and ensuring a sustainable and reliable water supply [8].
Solar, wind, geothermal, and ocean energy serve as the main RE sources for desalination, with their viability and deployment influenced by key factors such as plant capacity, geographical location, feed water pressure and composition, and the estimated cost of freshwater production [9]. Wave-powered desalination is acknowledged as a sustainable alternative to traditional RO desalination, utilizing wave energy converters (WECs) to produce the necessary pressure for membrane-based seawater desalination and freshwater generation [10]. Sitterley et al. examined the performance of RO membranes under significant feed pressure variations (200–900 psi) in a desalination system powered by wave energy [11]. During 1770 h of operation, permeability decreased by 7.4%, flux dropped by 18.4%, while salt rejection remained above 99%. Longer wave periods (1.25 waves per minute) yielded lower salinity permeate (~250–550 μS/cm) and ensured consistent permeate quality across feed salinities of 5–35 g/L NaCl. Mi et al. investigated the potential of harnessing ocean wave energy for desalination using an integrated system that includes an oscillating surge wave energy converter (OSWEC), a piston pump, an onshore RO module, and an accumulator [12]. An optimal water recovery rate of approximately 25% was achieved, along with a peak specific water productivity (SWP) of 2.23 m3/kWh, while adjustments to the needle valve improved SWP by 17%. Dimitriou et al. examined the performance of a SWRO desalination system under variable hydrodynamic conditions, including fluctuations in feed pressure, flow rate, and temperature, to simulate operation powered by renewable energy [13]. The study revealed that higher temperatures (35 °C) enhanced water flux and reduced specific energy consumption (SEC), whereas lower temperatures (10 °C) increased resistance and significantly raised SEC, reaching up to 60 kWh/m3. Research underscores the significance of enhancing pressure control mechanisms, energy recovery systems, and membrane configurations to sustain consistent desalination performance under varying operating conditions.
Machine learning (ML) enhances SWRO desalination performance by optimizing predictive modeling, system analysis, and operational strategy development, improving efficiency and decision-making [14]. Data-driven techniques facilitate membrane material screening and nanopore design, while artificial intelligence (AI)-based simulations optimize complex processes, reducing costs, decreasing human effort, and improving reliability [15,16]. Abba et al. optimized hybrid nanofiltration (NF)/RO desalination systems by utilizing long-short-term memory (LSTM) neural networks enhanced with a genetic algorithm (GA) and crow search algorithm (CSA) to improve predictive accuracy and reduce uncertainty [17]. The LSTM-GA model demonstrated the best performance (MAE = 0.13) with minimal uncertainty. Ruiz-García et al. analyzed an SWRO pilot plant utilizing a Pelton turbine energy recovery device (ERD), resulting in a 25% energy savings [18]. The system lowered SEC from 4.41–6.03 kWh/m3 to 3.21–4.47 kWh/m3 and increased permeate production by 25%. An artificial neural network (ANN)-based predictive model precisely estimates the permeate flowrate (Qp) with an error range of 1.56 × 10⁻⁶ to 8.49 × 10⁻² m3/h and the permeate conductivity (Condp) with an error range of 8.33 × 10⁻⁵ to 31.06 μS/cm. Yin et al. developed a wave energy-powered seawater desalination system that integrates a pitching paddle WEC with a deep reinforcement learning (DRL)-based deep deterministic policy gradient (DDPG) control strategy [19]. The system surpassed proportional and integral (PI) controllers by reducing flowrate fluctuations, ensuring a stable freshwater output of 1200 m3/day, and achieving convergence within 600 episodes. ML studies demonstrated enhanced efficiency and adaptability in RE-powered desalination systems, confirming their potential as a scalable, sustainable, and resilient off-grid water treatment solution.
The integration of ML techniques for predictive modeling in SWRO within wave-powered desalination systems remains largely unexplored in existing research. Das et al. analyzed SWRO membrane performance under variable flow in wave-powered desalination [20]. Sinusoidal flow had minimal impact, mirroring steady-state conditions, while rectified sinusoidal flow boosted permeate recovery by 40% but raised salinity by 115%, compromising quality. Membrane integrity declined, reducing salt rejection. SEC was consistent under steady and sinusoidal flow but 29% lower with rectified sinusoidal flow. The study highlights the need for flow regulation to enhance energy efficiency and membrane durability in wave-driven desalination. Conventional modeling approaches typically rely on steady-state assumptions and fail to capture the variability inherent in systems powered by renewable energy sources. This study advances beyond the state of the art by introducing a comprehensive ML framework specifically developed for wave-powered SWRO desalination systems operating under dynamic hydrodynamic conditions. Hence, this study proposes a predictive ML model based on supervised and deep learning to analyze variable feed flow under different hydrodynamic conditions with WEC, emphasizing permeate recovery and salt rejection efficiency. This study addresses that limitation by implementing a multi-level input feature design, evaluating three configurations of operational variables to understand their impact on prediction performance. This framework supports adaptable ML model deployment, accommodating different levels of data availability while maintaining accuracy. Furthermore, the inclusion of sensitivity analysis provides critical insights into the most influential factors governing system behavior, offering practical guidance for improving process control and energy efficiency in wave-driven SWRO desalination systems.

2. Proposed Methodology

2.1. Data Acquisition and Processing

The dataset was generated from experimental trials conducted on a wave-powered SWRO desalination system under variable flow conditions, encompassing key operational and environmental parameters such as brine pressure (BP), feed pressure (FP), permeate flow (PF), brine flow (BF), feed flow (FF), permeate salinity (PS), brine salinity (BS), and temperature (Temp) [20]. The primary output variables analyzed are permeate recovery (%) and salt rejection (%). BP, ranging from approximately 33.64 to 59.8 bar, is a key factor in driving water through the membrane, directly impacting PF (0.36 to 1.52 L/min) and salt rejection (99.16% to 99.76%). While higher pressure generally enhances permeate flow and salt rejection, extreme pressure fluctuations may affect membrane durability. PS varies significantly (84.27 to 293.15 ppm), with lower values indicating improved desalination performance, whereas BS remains relatively stable (36,829 to 44,758 ppm). Temp (25.54 to 28.23 °C) shows minimal variation, suggesting a limited effect on system performance. Permeate recovery (3.24% to 22.54%) exhibits a positive correlation with pressure; however, excessive recovery can result in increased PS. Salt rejection remains consistently high, demonstrating effective desalination, though it slightly declines at higher permeate recovery rates. In terms of data distribution, BP and PF are relatively uniform, while PS and recovery rates display greater variability, particularly under fluctuating flow conditions. Salt rejection values remain tightly clustered around 99.5%, confirming membrane efficiency under different conditions. These trends emphasize the importance of maintaining optimal pressure and flow conditions to maximize both permeate recovery and salt rejection efficiency.
Data normalization is crucial for standardizing variables in the SWRO membrane performance dataset, ensuring comparability and minimizing biases caused by differing numerical scales. To enhance interpretability and facilitate comparative analysis, normalization techniques were applied to both input and output variables. Min–Max scaling was used for BP, PF, and Temp due to their relatively uniform distributions, while PS and BS, which exhibit greater variability, required additional transformation methods. Since salt rejection values are highly clustered (>99%), standardization was implemented to better capture small-scale variations. Normalization improves dataset structure, making it more suitable for statistical analysis and modeling. By preventing variables with larger magnitudes from dominating the results, it enhances predictive accuracy and ensures compatibility with regression and classification techniques for analyzing key feature relationships. Additionally, normalization supports comparative performance assessments under varying flow conditions, providing deeper insights into SWRO membrane efficiency in wave-powered desalination. The normalization (y) of input and output variables in the SWRO system is represented by Equation (1)
y = 0.05 + 0.95 x x m a x + x m i n
where x , , x m a x , and x m i n denote the measured data, measured data, average value, highest value, and lowest value, respectively.

2.2. Feature Selection and Model Configurations

A key component of this study was the selection of input features, structured into three distinct combinations to evaluate their impact on prediction accuracy. Model 1 (M1) consisted of salinity- and pressure-related variables (BS, BP, and FP), representing the core physicochemical parameters influencing membrane behavior. Model 2 (M2) included flow and quality indicators (PF, BF, PS, and FF), which are important for operational monitoring but are less directly linked to membrane rejection mechanisms. Model 3 (M3) incorporated all operational and environmental parameters, including temperature (Temp), enabling a more detailed representation of process dynamics. The results showed that while M1 offers efficient and rapid predictions, making it suitable for low-resource or embedded control applications, M3 significantly improved prediction accuracy by capturing complex, nonlinear relationships among variables. This outcome is particularly important for real-time control systems, where models must balance accuracy with computational efficiency. M3-based models are particularly well suited for integration into adaptive or model predictive control (MPC) frameworks to support dynamic system optimization, reduce energy consumption, and mitigate membrane fouling. To enhance model robustness and avoid overfitting, a 10-fold cross-validation strategy combined with a 70/30 train–test split was adopted. In this approach, 70% of the data were used for training, while 30% were reserved for testing the model’s ability to generalize to unseen data. The use of k-fold cross-validation ensured that each sample contributed to validation, thereby enhancing the statistical reliability of the results. The dataset itself, characterized by a wide range of recovery and salt rejection values, provided a strong basis for learning complex relationships. In particular, lower recovery rates were generally linked to higher BS and FF, whereas salt rejection was influenced by the interplay between pressure, Temp, and permeate salinity. These observations emphasize the necessity of developing high-resolution, data-driven modeling frameworks for the real-time optimization of SWRO desalination systems. Matlab R2023b was used for data ML modeling of permeate recovery and salt rejection.

3. Machine Learning Models

3.1. Support Vector Machine (SVM)

SVM are supervised machine learning algorithms originally developed for classification tasks and later adapted for regression problems as Support Vector Regression (SVR). In SWRO desalination, SVR is utilized to predict % permeate recovery and salt rejection efficiency by modeling complex, nonlinear relationships between key operational parameters. The model first transforms input variables such as BP, PF, PS, BS, and Temp into a higher-dimensional space using kernel functions. It then identifies an optimal hyperplane that minimizes prediction errors while maintaining deviations within the epsilon-insensitive margin, ensuring robustness. Additionally, SVR selectively penalizes predictions outside this margin, making it resistant to noise and outliers, thereby enhancing its reliability in desalination performance modeling. To optimize the SVR model, key hyperparameters are fine-tuned to balance complexity and accuracy. The regularization parameter (C) controls the trade-off between error minimization and overfitting, while epsilon (ε) sets the tolerance for deviations. Kernel-specific parameters, such as the RBF kernel width (γ) and polynomial degree (d), adjust model flexibility by influencing data point impact and transformation complexity. The nonlinear SVM model is mathematically represented as follows [21]:
x i , y i ,   i = 1 , 2 , . N
where x represents the vector of input variables, which includes desalination operational parameters such as BP, PF, PS, BS, and Temp. y is the corresponding output variable, representing % permeate recovery or salt rejection efficiency in the desalination process. N denotes the total number of observations in the training dataset, representing the number of data points used for model learning and optimization. The application of SVM in desalination modeling involves several key steps: data preprocessing (handling missing values and normalizing variables), feature selection (identifying relevant parameters), kernel selection (choosing functions like Linear, RBF, or Polynomial), hyperparameter tuning (optimizing regularization and kernel-specific settings), and model training and validation. SVR is well-suited for small-to-medium datasets in desalination applications, effectively capturing nonlinear relationships using kernel functions. However, SVR has limitations, including high computational cost due to its quadratic time complexity, sensitivity to kernel selection, and limited scalability for real-time monitoring. For large-scale desalination applications, deep learning models may offer a more efficient alternative.

3.2. Gaussian Process Regression (GPR)

GPR is a non-parametric, probabilistic modeling technique used to analyze complex, nonlinear relationships in data. It defines a distribution over functions within the input space, providing both predictive estimates and uncertainty quantification. Unlike traditional regression models that assume a fixed functional form, GPR extends the multivariate Gaussian distribution to infinite dimensions, ensuring that each input variable corresponds to a normally distributed function value. Desalination processes operate under highly dynamic conditions, necessitating predictive models that accurately estimate key performance metrics. This study employs GPR to predict % recovery and salt rejection efficiency in a SWRO system based on operational parameters such as BP, PF, PS, BS, and Temp. In SWRO desalination, GPR is characterized by its mean function m(x) m(x) and covariance function k(x,x′) k(x,x′), also referred to as the kernel function [22].
f x = G P ( ( m x ,   k x , x )
where x represents the input parameters of the desalination system, f(x) denotes the predicted outputs, specifically the % permeate recovery and salt rejection efficiency, m(x) is the mean function, and k(x,x′) is the covariance function (kernel).
In desalination process modeling, the Radial Basis Function (RBF) kernel is commonly employed due to its ability to effectively capture nonlinear relationships between operational parameters and desalination performance metrics. GPR leverages Bayesian inference, enabling continuous updates to predictions as new data becomes available. This approach ensures accurate forecasting of % recovery and salt rejection while incorporating uncertainty quantification. The GPR model represents these relationships using a mean function and a covariance function (kernel), facilitating smooth and adaptable predictions. By incorporating adaptive learning, GPR enhances prediction accuracy and provides confidence intervals, enabling more informed decision-making in desalination operations. Integrating GPR into SWRO performance analysis allows for process optimization by adjusting operational parameters to maximize water recovery and improve salt rejection efficiency, ultimately enhancing the reliability and sustainability of desalination systems.

3.3. Multi-Layer Perceptron (MLP)

MLP, GPR, and SVM utilize distinct computational approaches for predictive modeling in desalination applications. MLP, a deep learning architecture, effectively captures nonlinear dependencies but requires large datasets and extensive hyperparameter tuning to optimize performance. GPR, a probabilistic method, offers uncertainty quantification through confidence intervals, yet its computational demands increase significantly with larger datasets. SVM, a kernel-based technique, efficiently determines decision boundaries for classification and regression but lacks inherent uncertainty estimation capabilities. The MLP model comprises an input layer, one or more hidden layers, and an output layer, where data undergo forward propagation via weighted connections and activation functions such as ReLU, Sigmoid, and Tanh. The training process incorporates backpropagation, wherein optimization algorithms like stochastic gradient descent (SGD) or Adam iteratively update network weights to minimize prediction errors. The general MLP equation representing the relationship between input (x_i) and output (Y_i) functions at each layer in SWRO desalination is given by the following equation [23]:
Y i = f ( w i 1 x i + b i )
where f is the activation function, and w and b are the weight matrix and bias, respectively. For SWRO desalination modeling, MLP is trained on datasets encompassing feed water pressure, salinity, temperature, permeate flow rate, water recovery rate, and salt rejection efficiency. During forward propagation, these input parameters are processed through multiple neuron layers, enabling the model to recognize intricate relationships between desalination variables. The backpropagation mechanism iteratively refines neuron weights, enhancing predictive accuracy. Once trained, the MLP model establishes mappings between input variables and desalination performance metrics, facilitating accurate predictions of permeate recovery and salt rejection efficiency across varying operational conditions. This predictive capability supports system optimization, fault detection, and efficiency improvements in wave-powered SWRO desalination systems, enhancing overall performance and sustainability.

3.4. Decision Tree (DT)

A DT is a rule-based analytical method used for classification and regression, where data are progressively divided into subsets based on predefined decision rules. In SWRO desalination, DTs estimate permeate recovery and salt rejection efficiency by evaluating key operational parameters such as FP, BS, Temp, and FF. The model identifies the most influential features using criteria such as Gini impurity, entropy, or mean squared error (MSE) and continues branching until a predefined stopping condition, such as maximum tree depth or minimum sample size per leaf, is met to prevent overfitting [24]. Once trained, DTs generate predictions by following structured decision paths from the root node to a leaf node, offering a computationally efficient and interpretable approach to desalination system analysis. The DT model for predicting desalination performance (Y) based on input features (X) and the total number of leaf nodes (N) can be expressed as follows:
Y = f x = i = 1 N c i   I ( X ϵ R i )
where c i is the constant value assigned to each region, R i is the leaf region associated with the feature space, and the indicator function is I ( X ϵ R i ) . Compared to other modeling techniques, DT offer advantages in simplicity and computational efficiency. Unlike complex multilayer models that require deep learning to capture nonlinear relationships, DTs rely on structured decision rules, making them easier to interpret but potentially less expressive. They also train faster than SVM and do not depend on kernel functions, though their effectiveness may be limited in high-dimensional feature spaces. While GPR provides uncertainty quantification, DT are more scalable and efficient for analyzing large datasets.

3.5. Linear Regression (LR)

Linear Regression (LR) is a statistical method for modeling linear relationships between dependent and independent variables by fitting an optimal straight line or hyperplane through observed data. The fundamental assumption of LR is linearity, meaning that changes in predictor variables directly and proportionally influence the response variable. The model is based on the ordinary least squares (OLS) criterion, which minimizes the sum of squared residuals (the differences between observed and predicted values) to achieve the best model fit [25]. In wave-powered RO desalination, LR serves as a baseline predictive tool for estimating key performance metrics such as permeate recovery and salt rejection, using input variables and operational conditions. The linear regression equation relating input variables (x) to dependent output variables (y) (% permeate recovery or salt rejection) in wave-powered desalination is expressed as
y = β 0 + β 1 x 1 + ε
where β 0 and β 1 represent the constant and regression coefficients, and ε is the random error. Although LR is appreciated for its simplicity, interpretability, and computational efficiency, it relies on the assumption of strict linearity and is sensitive to outliers. It performs effectively when the relationship between variables is approximately linear and when working with small-to-medium-sized datasets. Additionally, LR serves as a baseline model for evaluating more complex algorithms. Despite its challenges in capturing nonlinear interactions and handling outliers, LR remains a practical tool for quick and efficient predictive analysis across various applications, including wave-powered desalination modeling.

3.6. Evaluation Criteria

The performance of the predictive ML models was evaluated using statistical and error-based metrics, namely the coefficient of determination (R2), mean absolute error (MAE), MSE, and root mean squared error (RMSE). These metrics were computed based on the observed data Y ( x ) and model predicted data Y ( m ) across N total data points.
Coefficient of determination (R2),
R 2 = 1 i = 1 N ( Y x Y ( m ) ) 2 i = 1 N ( Y x Y ( m ) ) 2
Mean absolute error (MAE),
M A E = i = 1 N Y ( m ) Y ( x ) N
Mean squared error (MSE),
M S E = 1 N i = 1 N ( Y m Y ( x ) ) 2
Root mean squared error (RMSE)
R M S E = 1 N i = 1 N ( Y ( m ) Y ( x ) ) 2

4. Results and Discussion

4.1. ML Models on the Prediction of Permeate Recovery

Permeate recovery is a vital metric in evaluating the efficiency of a desalination process. Accurate prediction of this parameter requires capturing the nonlinear relationships among key operational variables such as pressures (FP and BP), flows (FF, BF, and PF), salinity levels (BS and PS), and temperature (Temp). The performance of ML models including GPR, SVM, MLP, and DT were comprehensively evaluated across the three model combinations (M1, M2, and M3) for predicting the permeate recovery (%) in wave-powered SWRO desalination systems. Figure 1 shows the prediction performance of DT, GPR, MLP, and SVM models evaluated across three feature combination scenarios M1, M2, and M3. Among the models evaluated, the GPR demonstrated the highest predictive performance, achieving perfect R2 values of 1.00 across all three feature combinations (M1, M2, and M3). It indicates that GPR has an exceptional ability to model recovery-related dynamics, even with minimal input features such as BS, BP, and FP in M1. The GPR model consistently delivered the highest predictive accuracy across all scenarios, achieving near-perfect predictions (R2 values approaching 1.0) along with exceptionally low error metrics (RMSE and MAE close to zero) in both training and testing phases. The superior R2 observed in the GPR model can be attributed to its inherent ability to capture complex nonlinear relationships through flexible kernel functions, combined with its probabilistic framework that enables accurate modeling of subtle variations while effectively minimizing prediction errors metrics [26]. Table 1 shows the R2, RMSE, MSE, and MAE of ML models across three combinations. The GPR model displayed the best performance, recording the lowest training and testing errors across all configurations. Notably, GPR-M2 achieved an exceptionally low testing MSE of 1.25 × 10⁻⁶ and MAE of 0.00075, reflecting nearly perfect learning and generalization. GPR-M3 further exhibited excellent generalization performance, achieving a low testing MSE of 3.81 × 10⁻⁶ and MAE of 0.00119, with minimal prediction deviation. DT models consistently exhibited the lowest R2 values across all feature combinations (M1, M2, and M3), highlighting their limited capacity to accurately predict water recovery behavior in the wave-powered SWRO desalination system. In particular, DT-M2 showed poor generalization, achieving R2 values between 0.59 and 0.79, which reflects the model’s difficulty in capturing the intricate dependencies necessary for precise recovery prediction when critical features such as pressure and salinity were excluded. The performance slightly improved in DT-M3 (R2 = 0.85–0.94) when the model had access to the full feature set, suggesting that DTs rely heavily on comprehensive input information to achieve moderately acceptable predictive accuracy. From an error analysis perspective, DT models consistently recorded the highest error metrics across all scenarios. DT-M2 exhibited a particularly poor predictive performance, with a testing MSE of 0.0114 and MAE of 0.0785, indicating significant deviation between predicted and experimental values. Even with the more complete feature set in DT-M3, errors remained comparatively high (testing MSE = 0.00307; MAE = 0.0392), although some improvement was observed compared to M1 and M2. Moreover, elevated training errors, such as the DT-M1 training MSE of 0.0127 and MAE of 0.0715, suggest persistent underfitting.
MLP and SVM models demonstrated strong predictive performance across the three feature combinations (M1, M2, and M3), though with nuances tied to feature complexity and model sensitivity. In terms of R2, MLP achieved near-perfect results in M1 (R2 = 0.99–1.00) and M2 (R2 = 0.97–1.00), indicating excellent alignment between its internal learning structure and the underlying recovery behavior. However, a slight decline was observed in M3 (R2 = 0.94–1.00), likely due to overfitting or feature redundancy introduced by the full set of operational and environmental variables. SVM similarly exhibited outstanding performance with minimal inputs in M1, attaining a perfect R2 of 1.00 for both training and testing phases, confirming that essential physicochemical features (pressure and salinity) were sufficient for accurate recovery prediction when processed by a robust kernel-based approach. Nevertheless, SVM performance decreased in M2 (training R2 = 0.90; testing R2 = 0.89), highlighting its sensitivity to increased feature complexity and the necessity for more careful hyperparameter tuning. Performance improved again in M3 (R2 = 0.98–0.99), suggesting that the incorporation of additional flow and quality parameters enhanced SVM generalization capacity, albeit not matching the performance stability of GPR. In terms of error analysis, MLP maintained low testing errors across all scenarios. For instance, MLP-M1 achieved a testing MSE of 3.42 × 10⁻⁵ and MAE of 0.00344, reflecting highly precise predictions when using the compact M1 feature set. Even with expanded inputs in M2 and M3, MLP maintained strong performance, with MAE values remaining below 0.0023. However, a slight increase in training MSE for MLP-M3 (MSE = 0.00331) pointed to potential overfitting or increased sensitivity to less relevant features. The SVM model also performed well under minimal feature conditions, achieving a low testing MSE of 2.05 × 10⁻⁴ and a MAE of 0.0123 in M1, affirming its efficiency in leveraging key operational parameters. However, SVM showed greater error inflation when feature complexity increased; in M2, the testing MSE rose sharply to 0.00586, and MAE increased to 0.0473, suggesting the model struggled to maintain robustness without optimal parameter tuning. While SVM-M3 exhibited improvement (testing MSE = 4.38 × 10⁻⁴), it still lagged behind MLP and GPR in overall predictive accuracy. The superior performance of MLP, particularly in M1 and M2, can be attributed to its capacity to model complex, nonlinear relationships through deep multilayer architectures, which effectively captured the intricate dependencies between membrane characteristics and recovery outcomes. Conversely, SVM kernel-based learning enabled it to efficiently handle nonlinearities with small feature sets but exposed vulnerabilities when faced with redundant or less informative features, highlighting the importance of careful model calibration under varying input complexities.
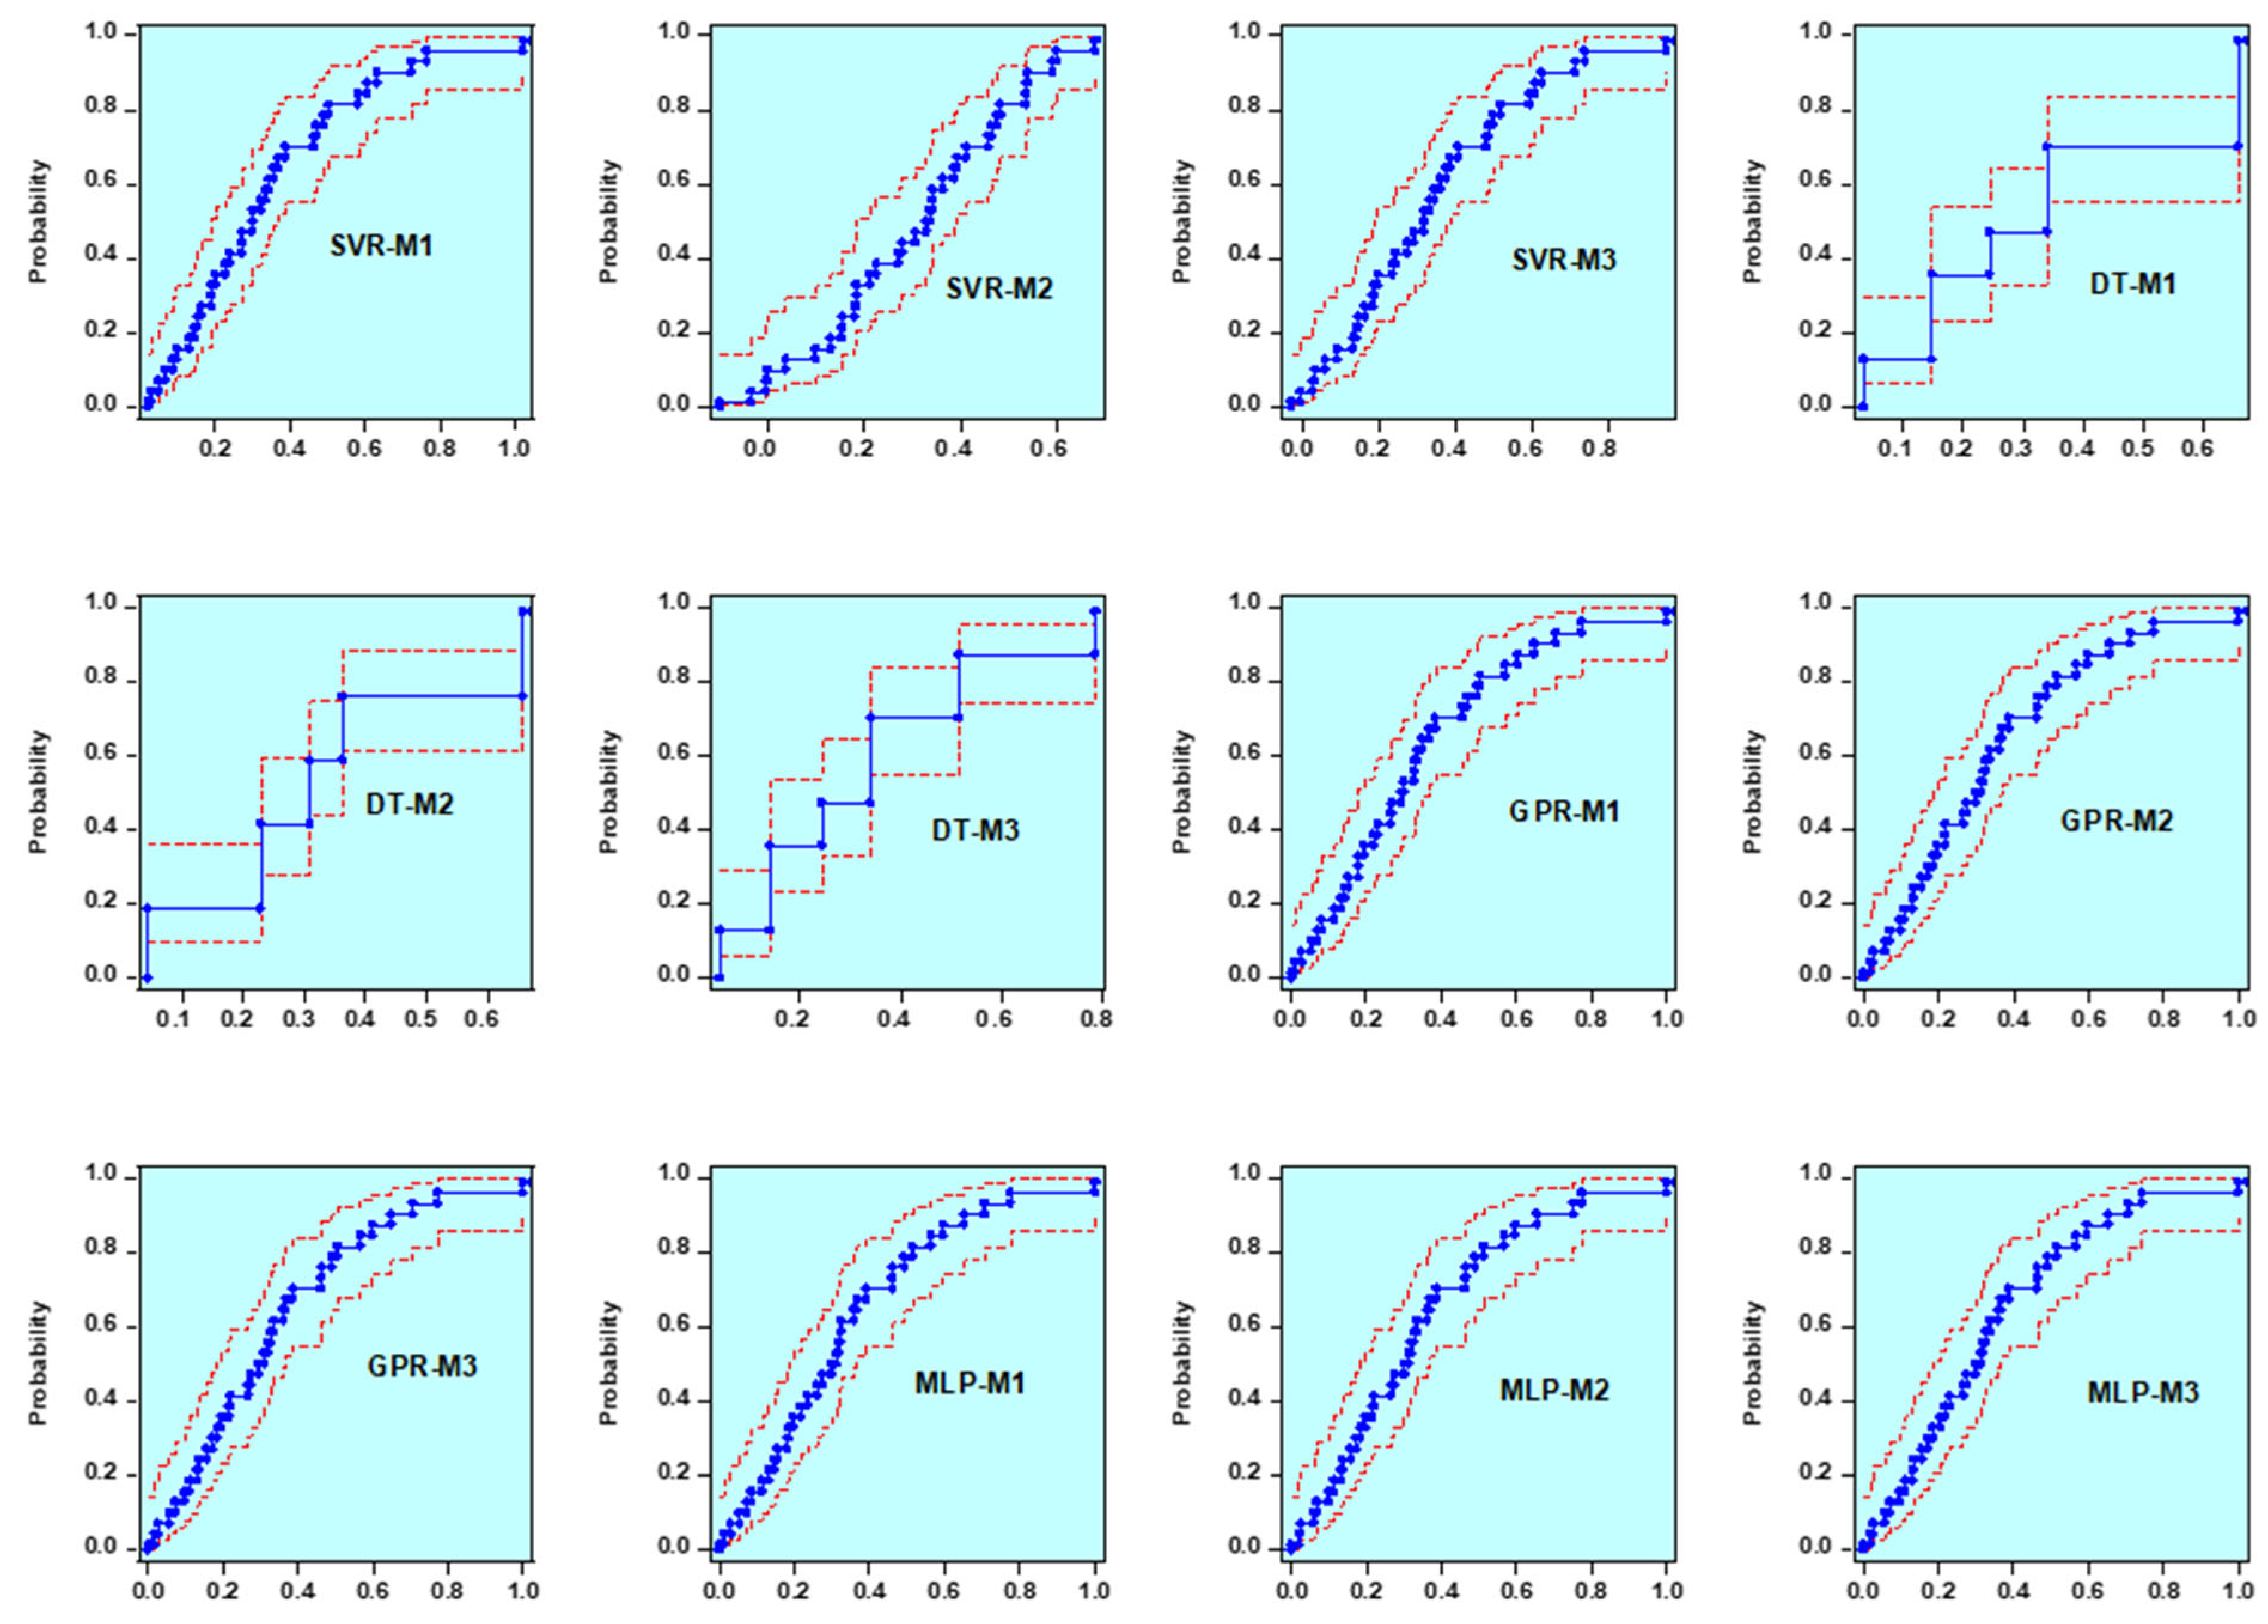
The cumulative probability plots further reinforce the predictive performance trends observed in the R2 and error analyses. The cumulative probability plots for permeate recovery prediction using SVM, GPR, MLP, and DT models across M1, M2, and M3 configurations are illustrated in Figure 2. GPR models exhibited cumulative distributions tightly aligned with the ideal 45° line across all feature sets, confirming their exceptional consistency and minimal deviation from experimental values. SVM models also showed strong cumulative behavior in M1 and M3; although, a slight broadening in M2 indicated sensitivity to increased feature complexity. MLP models maintained relatively smooth cumulative curves, with minor dispersion emerging in M3, suggesting slight instability likely due to feature redundancy. In contrast, DT models displayed stepwise cumulative distributions in all cases, reflecting their limited ability to model continuous recovery behavior. Although slight improvement was observed in DT-M3, the overall stair-step pattern confirmed the inherent discretization of tree-based models and their weaker suitability for continuous regression tasks. Overall, GPR emerged as the most robust and accurate model for percentage permeate recovery prediction, driven by its strong generalization and probabilistic modeling capabilities. SVM and MLP also demonstrated high performance with both minimal and comprehensive inputs, balancing accuracy and computational efficiency. In contrast, DT models, while interpretable and lightweight, showed predictive reliability that was highly dependent on the feature set richness.

4.2. ML Models on the Prediction of Salt Rejection

This study evaluated the predictive performance of three ML models such as Matern Gaussian process regression (GM5/2), SVM, and LR for salt rejection efficiency in wave-powered SWRO desalination across three input scenarios of increasing complexity (M1, M2, and M3). Radial plots of training and testing R2 values for salt rejection prediction using GM5/2, SVM, and LR models across M1, M2, and M3 are presented in Figure 3. Among the models, the GM5/2 approach consistently delivered the highest predictive accuracy, achieving perfect R2 values (1.0000) in both training and testing phases under the comprehensive input set (M3). This outstanding performance highlights the strength of the GPR non-parametric and probabilistic framework, which effectively captures the subtle nonlinearities and complex interactions influencing salt rejection, while its Matern kernel further enhances model flexibility and uncertainty quantification [27]. The SVM model demonstrated strong generalization capabilities, achieving R2 values between 0.9800 and 0.9900 in M1 and M3, indicating its effectiveness when sufficient operational variables are provided. Performance metrics for salt rejection prediction using SVM, GM5/2, and MLP models across M1, M2, and M3 are provided in Table 2. However, SVM performance declined in M2 (R2 = 0.6900–0.8400), suggesting a higher sensitivity to feature selection and the need for precise hyperparameter tuning. Notably, SVM regained predictive strength in M3 when comprehensive system variables were included, reinforcing the critical role of complete input data in achieving accurate salt rejection predictions. In contrast, LR showed only moderate performance in M1 and M2, with R2 values ranging from 0.8600 to 0.8700, consistent with its assumption of linear relationships. The unexpected perfect prediction (R2 = 1.0000) observed for LR under M3 likely results from overfitting or data redundancy, given that LR inherently lacks the capacity to model the complex, nonlinear mechanisms governing salt rejection behavior [28]. These findings affirm that while simpler models like LR can approximate system behavior under fully characterized conditions, advanced nonlinear models such as GPR and SVM offer superior robustness and predictive reliability for modeling salt rejection performance in dynamic desalination systems.
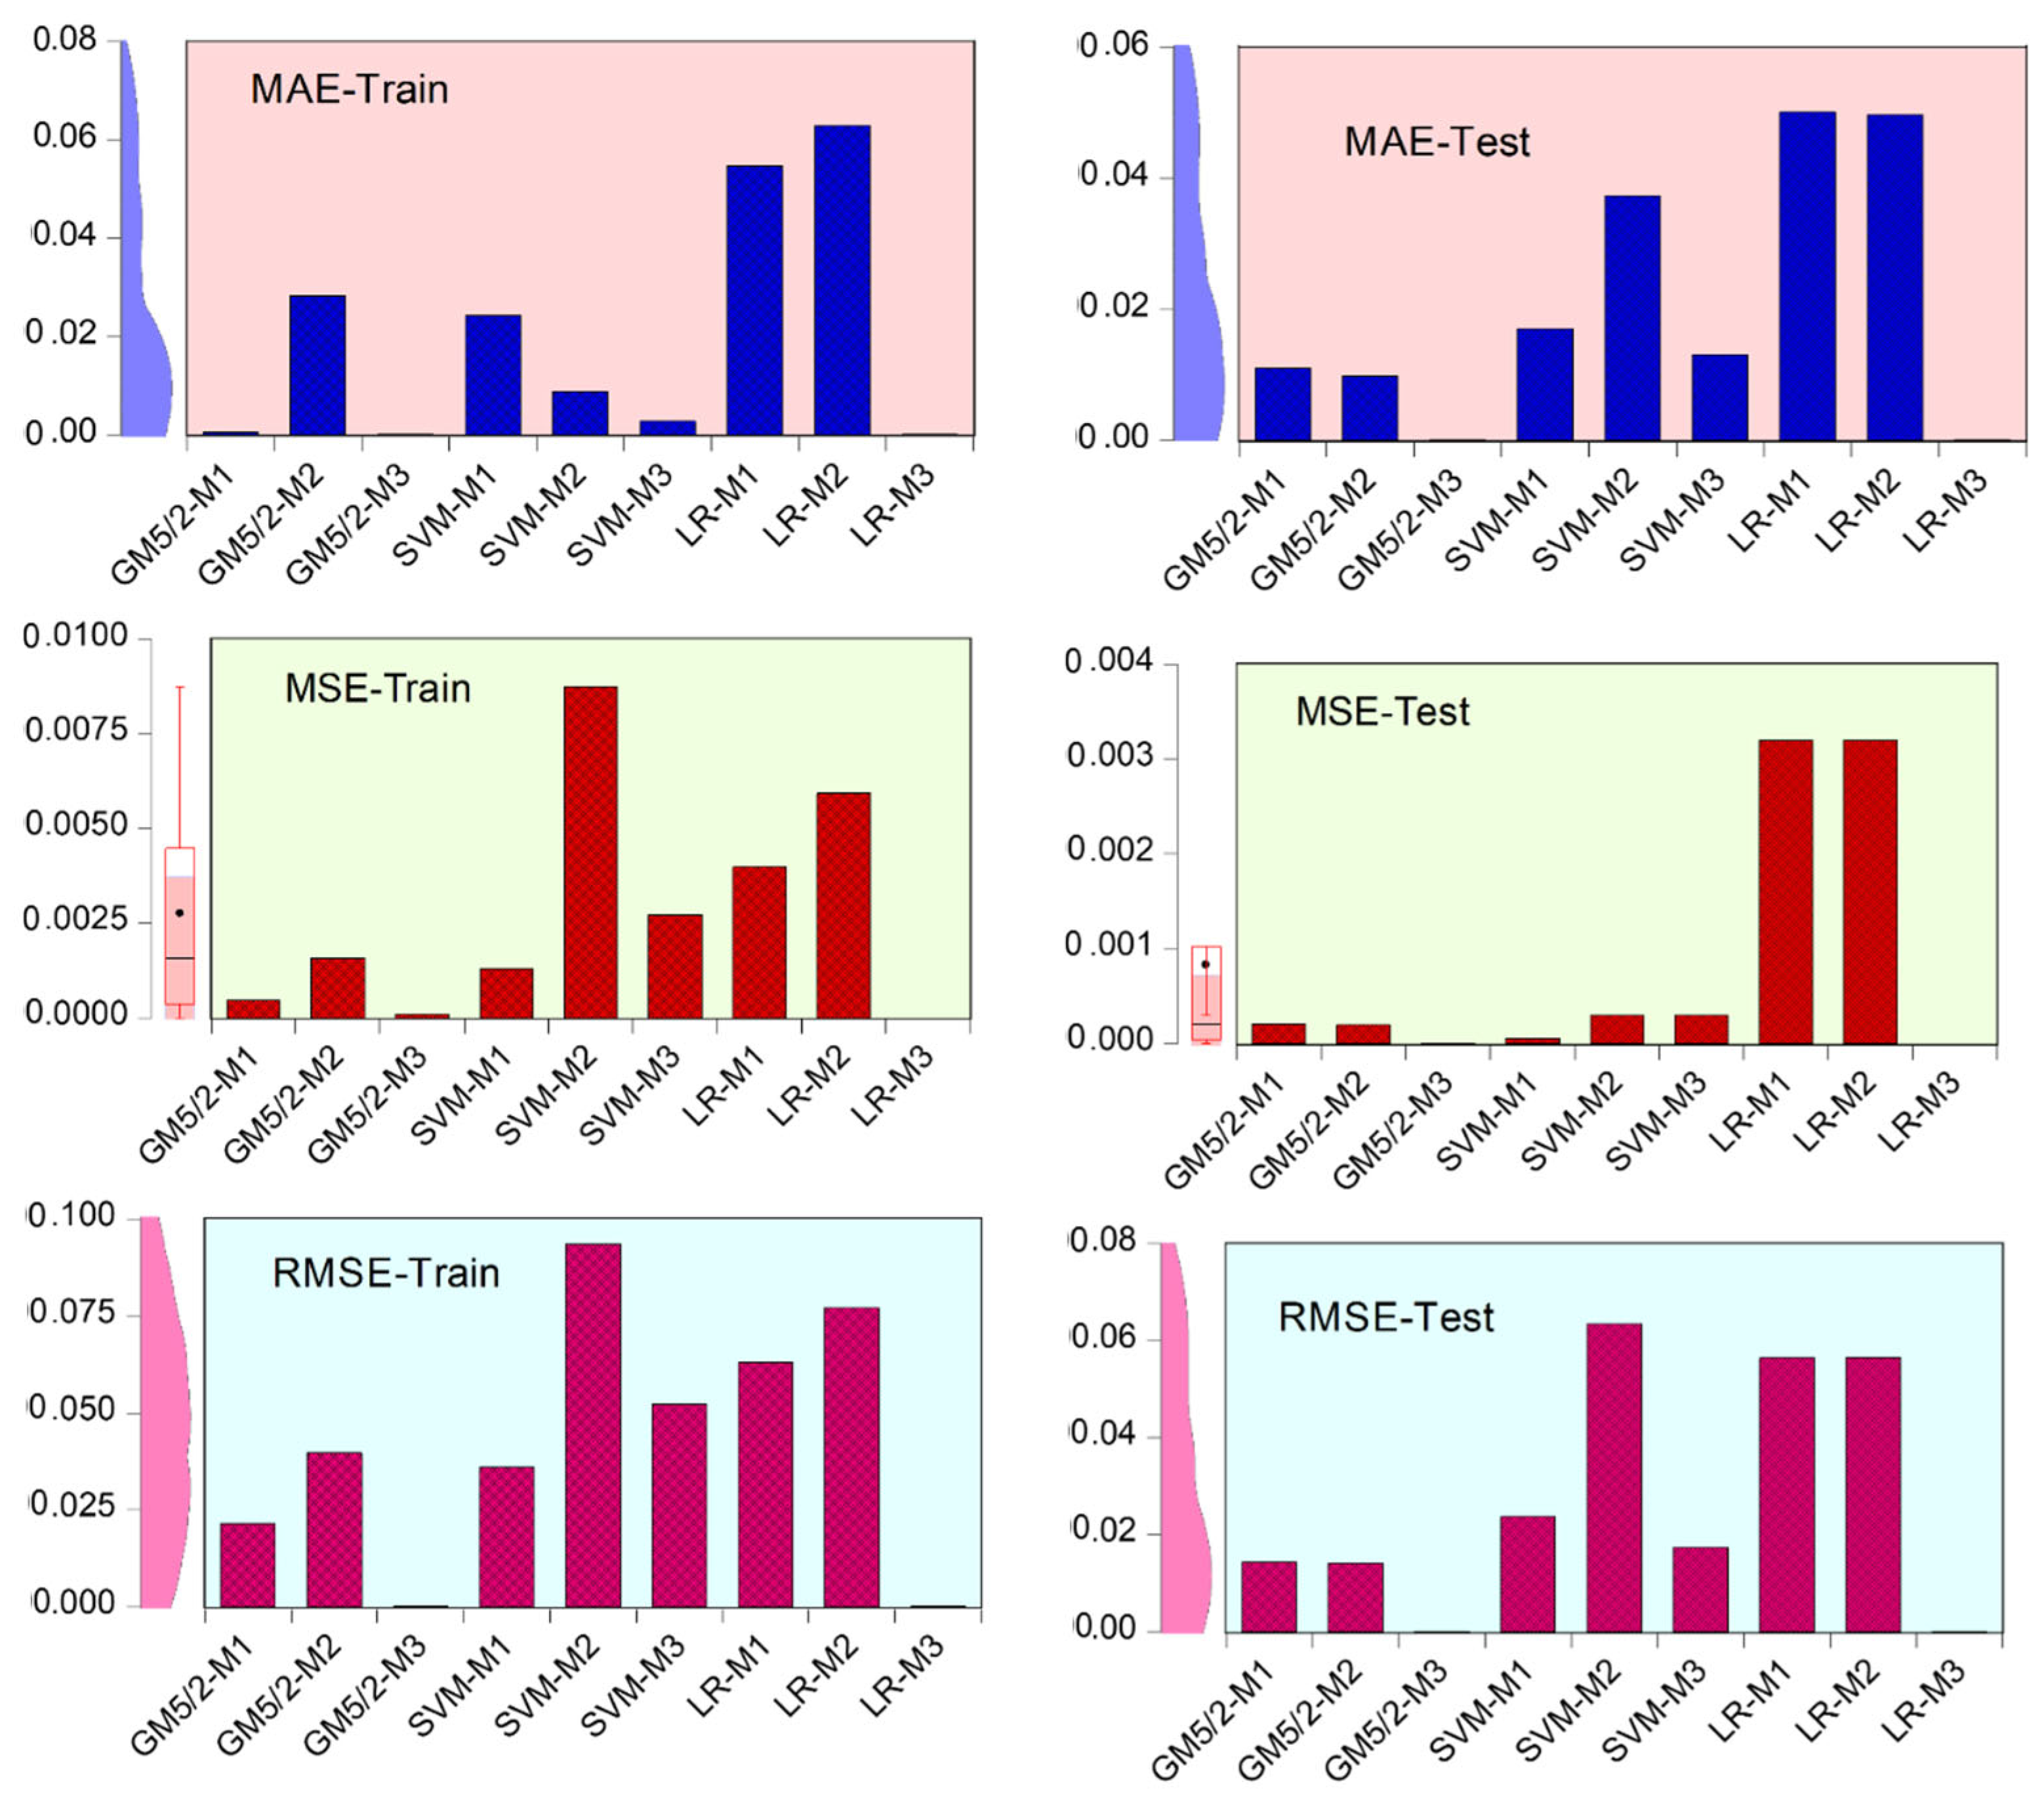
In evaluating the performance of ML models for salt rejection prediction, three key error metrics such as RMSE, MSE, and MAE were analyzed to quantify the deviation between predicted and actual values. Bar plots comparing MAE, MSE, and RMSE for SVM, GPR, and LR models during salt rejection prediction are shown in Figure 4. Among the models, GM5/2 consistently yielded the lowest RMSE values, with results as low as 0.0000 in M3 and 0.0143 and 0.0140 in M1 and M2, respectively, during testing. These values indicate highly precise predictions with minimal residual error, underscoring the model’s capacity to closely replicate true system behavior. In parallel, GM5/2 also recorded the lowest MSE values, including 0.0000 (M3) and 0.0002 (M1 and M2), which further confirms its ability to minimize large prediction errors, since MSE penalizes outliers more heavily than RMSE. The MAE values for GM5/2 were also extremely low—0.0000 in M3 and below 0.012 in M1 and M2—demonstrating that the model’s average prediction error remains consistently small across all samples. By contrast, SVM and LR models exhibited higher RMSE, MSE, and MAE values, particularly in reduced-input scenarios like M2. For instance, SVM-M2 had a testing RMSE of 0.0634, MSE of 0.0003, and MAE of 0.0373, while LR-M2 showed RMSE ≈ 0.0566 and MAE ≈ 0.050, indicating reduced reliability. These elevated errors reflect the models’ limitations in capturing the nonlinear patterns of salt rejection. Overall, the distinctively low error values observed in GM5/2 across all metrics confirm its superior prediction precision, robustness against outliers, and consistent average error control, making it the most dependable model for salt rejection estimation in desalination systems.

4.3. Sensitivity Analysis

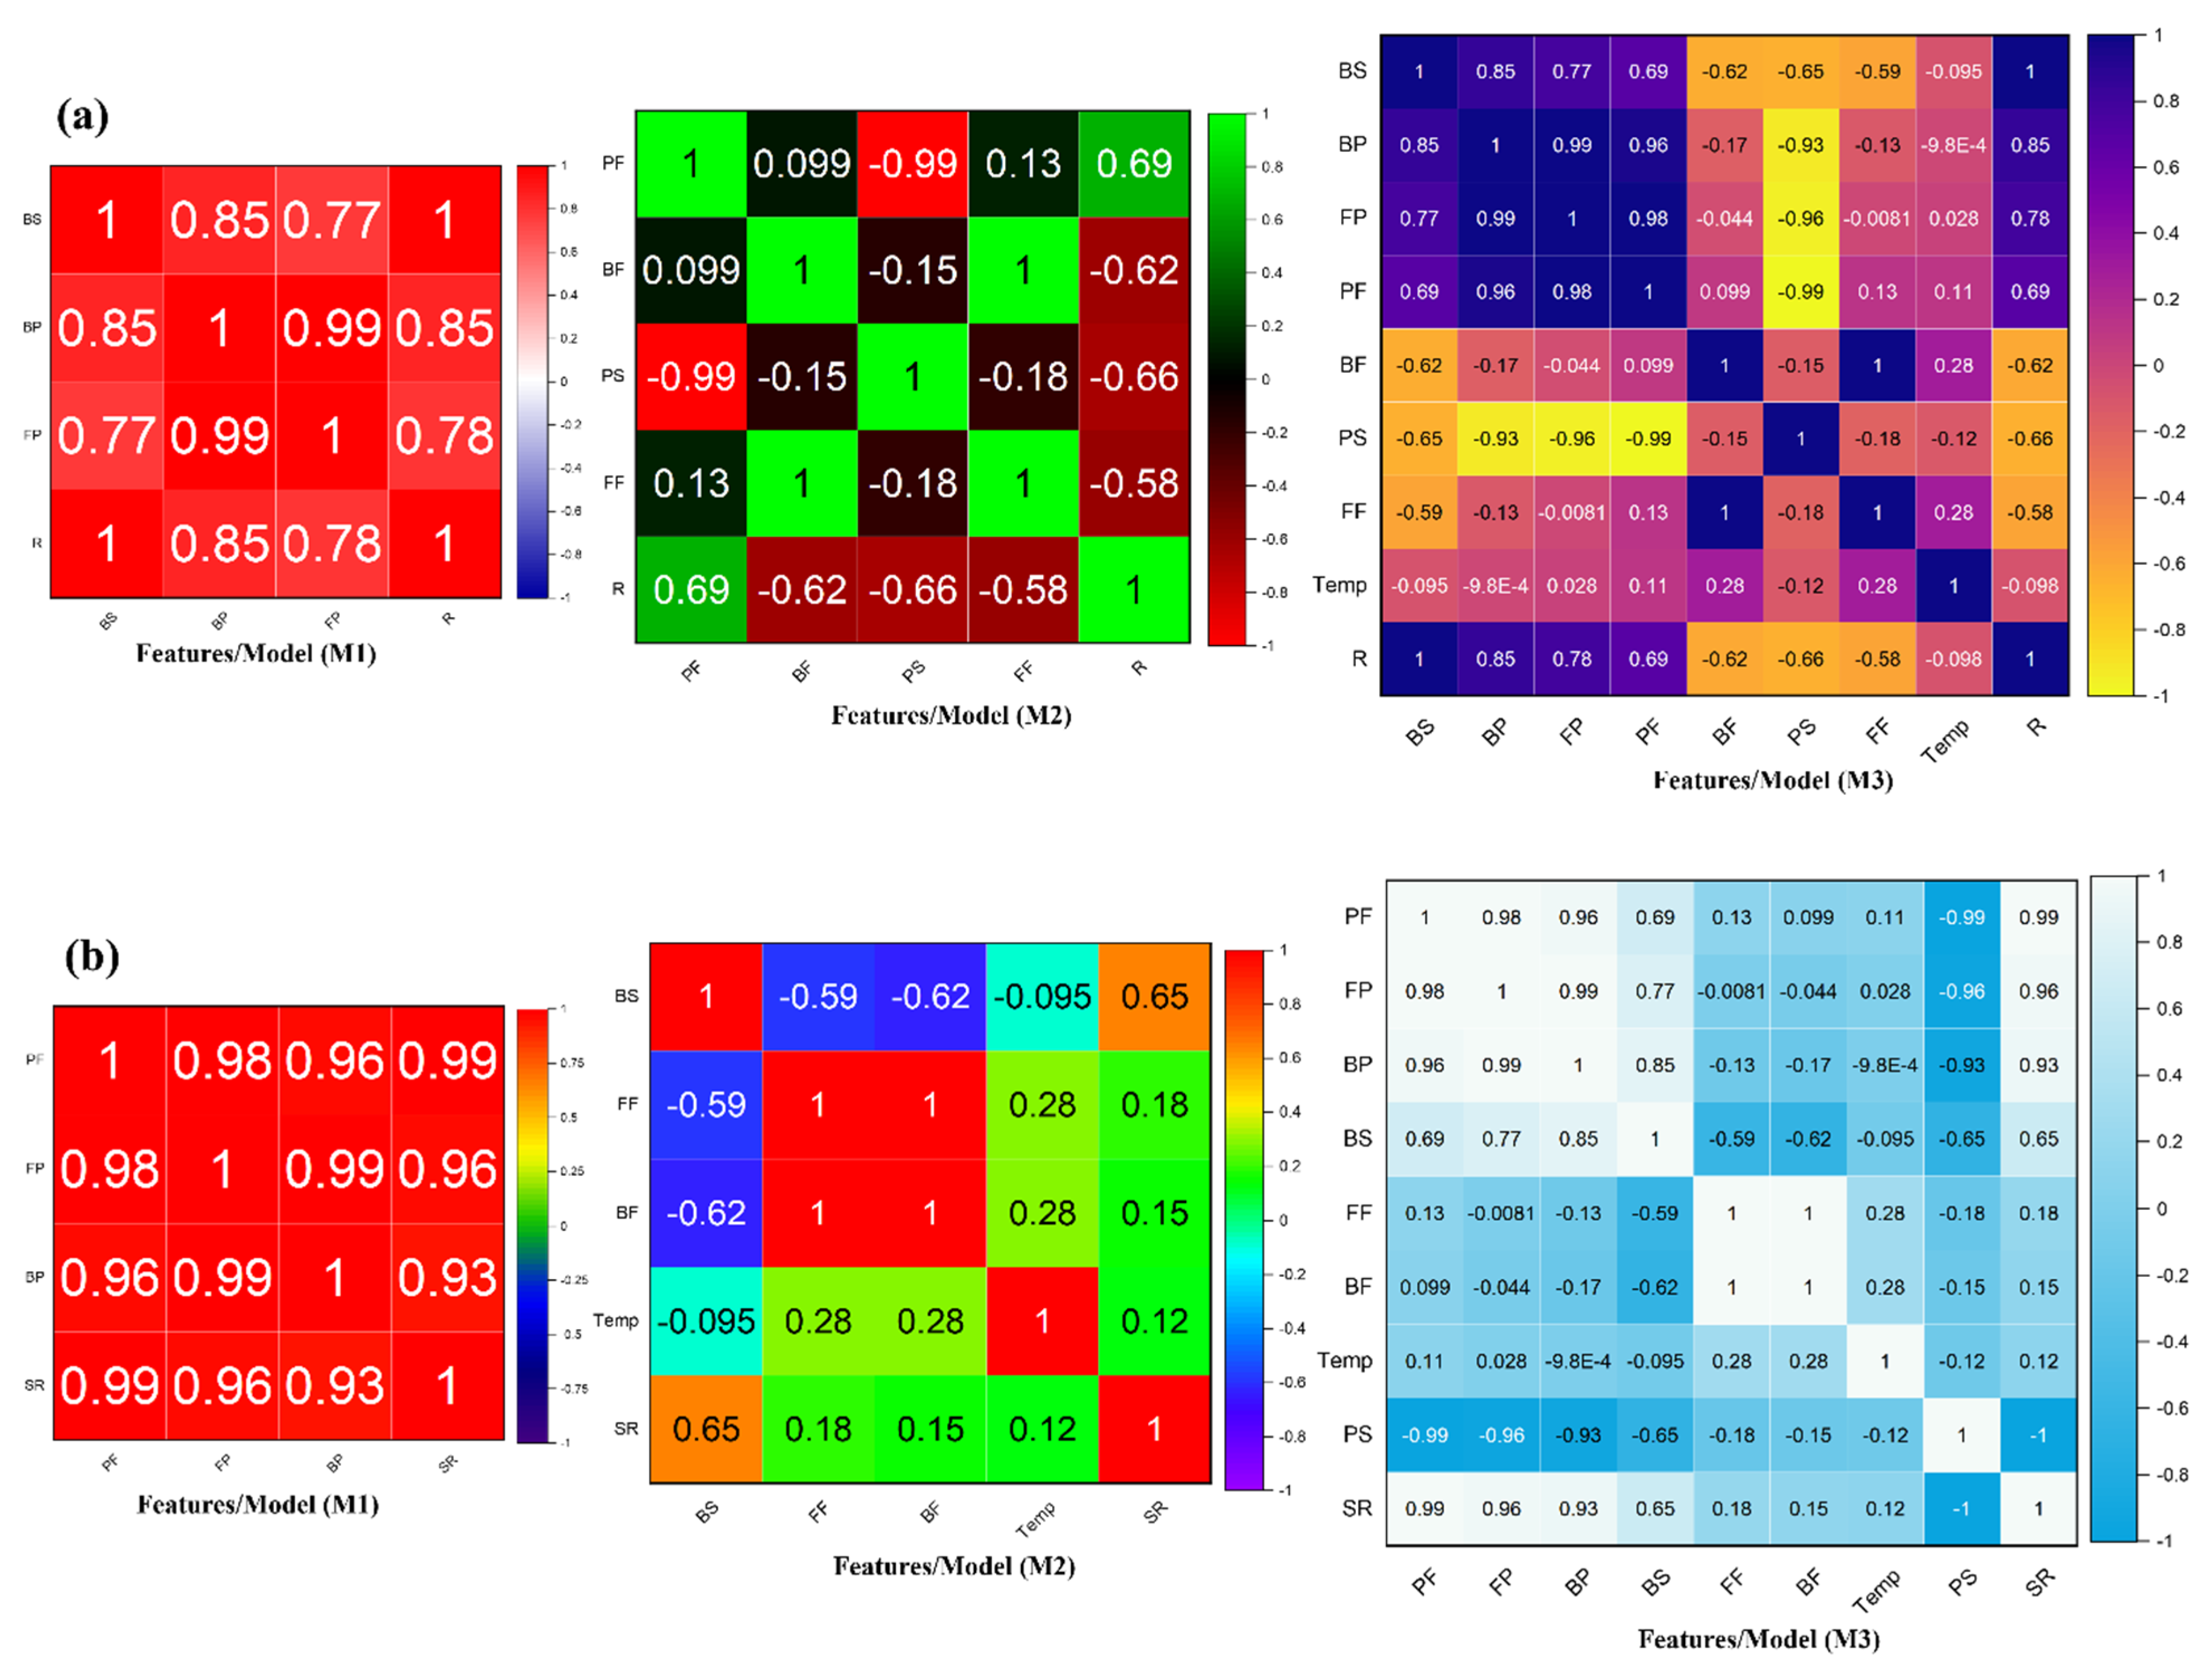
The sensitivity analysis performed across the three feature sets (M1, M2, and M3) provides critical insights into how different operational variables influence permeate recovery, highlighting the nature (positive or negative) and strength (strong or weak) of these relationships. Correlation heatmaps for permeate recovery and salt rejection across M1, M2, and M3 configurations are shown in Figure 5a,b. In M1, which includes key physicochemical features (BS, BP, and FP), strong positive correlations dominate the analysis. FP showed the highest positive correlation with permeate recovery (+0.99), confirming that increasing hydraulic pressure directly improves water transport across the membrane, leading to higher recovery rates. BP and BS also demonstrated high positive correlations (+0.85 and ~+0.77, respectively), indicating their supportive role in maintaining osmotic gradients favorable for sustained water permeation. Importantly, no negative correlations were observed within M1, reflecting the clean and synergistic influence of pressure and salinity variables when isolated from flow dynamics. In M2, which incorporates flow-related and quality indicators (PF, BF, FF, and PS), the pattern shifts to a mix of positive and negative correlations. FF showed a weak positive correlation with recovery, suggesting that higher feed volumes can slightly enhance throughput but are not the primary drivers of recovery efficiency. In contrast, BF and PS exhibited moderate-to-strong negative correlations (approximately −0.58 to −0.66). Higher BF implies greater concentrate discharge with less permeate generation, thus lowering recovery. Similarly, increased permeate salinity reflects compromised membrane rejection performance, where salt leakage reduces the net freshwater production. These negative influences underscore the operational trade-offs introduced when flow dynamics and quality parameters are considered. In M3, which integrates all operational, quality, and environmental parameters, the system becomes more complex, revealing both strong positive and moderate negative correlations. FP maintained a strong positive relationship with recovery, reaffirming its central importance. However, BF and PS continued to show moderate negative correlations, and their effects became more pronounced due to interactions with additional variables like FF and Temp. Notably, Temp exhibited a weak correlation with recovery, indicating that under the limited range of operating conditions tested (approximately 25–28 °C), thermal effects were minimal and did not significantly influence system behavior. The interrelation among variables became especially evident in M3: while higher feed pressure promotes recovery, if not carefully managed, it can also exacerbate membrane fouling, leading to increased PS and elevated BF, both of which are detrimental to recovery. Thus, operational optimization must balance pressure application with control over concentrate management and salt rejection to maximize system performance.
The sensitivity analysis across the three model combinations (M1, M2, and M3) reveals distinct influences of operational variables on salt rejection behavior in the seawater desalination process. In M1, the correlation plot shows very strong positive correlations among the selected features FP, BP, BS, and salt rejection with correlation coefficients ranging from +0.93 to +0.99. FP demonstrates the highest positive correlation (+0.99) with salt rejection, confirming that higher hydraulic driving force enhances membrane selectivity by reducing salt passage. BP and BS also show very high positive correlations (+0.96 to +0.98), reinforcing their critical role in maintaining effective ion separation. Importantly, no negative correlations are detected within M1, suggesting that the focused pressure–salinity feature set synergistically promotes efficient salt rejection when operating conditions are optimized. In M2, where flow-related parameters and permeate salinity are introduced, both positive and negative relationships become evident. PS displays a strong negative correlation with salt rejection (−0.59 to −0.62), which is physically expected because higher salt passage (higher permeate salinity) inherently reflects poorer rejection efficiency. BF and FF show weaker positive correlations (+0.15 to +0.28), indicating that increased throughput marginally supports salt rejection under stable operating conditions but is not the primary driver. FP continues to maintain a positive relationship even in M2, although its dominance becomes slightly diluted due to the introduction of flow complexities. In M3, which incorporates all operational and environmental variables, a more complex interaction emerges. FP and BP retain strong positive correlations with salt rejection (+0.93 to +0.99), emphasizing their consistent importance. Meanwhile, PS again shows a clear negative correlation (−0.62), reinforcing its role as a limiting factor for salt rejection performance. Temp, however, displays a very weak or negligible correlation, indicating that within the narrow experimental range, thermal effects do not significantly impact membrane selectivity. BF and FF maintain weak positive associations, similar to M2, suggesting that flow adjustments alone have limited impact on improving salt rejection compared to pressure management.
Recent developments have shown the considerable potential of ML models for accurately predicting desalination system performance. Table 3 provides a comparative overview of the performance of various ML models applied in desalination processes. Ajali-Hernández et al. utilized ensemble ANN to estimate boron permeability in seawater reverse osmosis (SWRO) systems, achieving extremely low MAE values of 7.93 × 10⁻⁸ and a mean absolute percentage error (MAPE) of 11.8%, suggesting prediction accuracy close to R2 ≈ 1 [29]. Similarly, Sharshir et al. applied Extra Trees (ETs), Random Forest (RF), Adaboost, K-Nearest Neighbors (KNNs), and Light Gradient Boosting (LGB) models to forecast cumulative freshwater yield and thermal efficiency in solar desalination systems, attaining R2 values exceeding 0.98 along with minimal prediction errors [30]. In the present work, a comprehensive evaluation of ML models such as GPR, SVM, MLP, and DT was carried out to predict water recovery and salt rejection in a wave-powered SWRO desalination unit. Among these models, GPR achieved the highest predictive accuracy, consistently delivering near-perfect R2 values (~1.00) and exceptionally low error metrics across different feature configurations. MLP and SVM models also showed strong predictive capabilities, particularly when trained with either selected or full input features, while DT models lagged in prediction performance. Sensitivity analysis across studies consistently emphasized the dominant role of feed pressure, brine pressure, and salinity on system performance, while factors like brine flow and permeate salinity were identified as having adverse effects. This enhanced performance results from using dynamic wave-driven data and a structured input design, allowing more accurate and generalizable prediction than models based on static or constrained conditions. Overall, ensemble models, GPR, and deep learning approaches have emerged as leading tools for desalination system modeling, with future efforts likely focusing on hybrid ML designs and adaptive real-time control to further improve operational stability, energy efficiency, and system resilience.

5. Conclusions

The accurate prediction of permeate recovery is essential for optimizing the efficiency and sustainability of SWRO desalination. ML models demonstrated strong potential in modeling recovery behavior, with GPR consistently achieving near-perfect R2 values (~1.00) and minimal error metrics across all feature scenarios. GPR probabilistic framework and flexible kernels allowed it to capture complex nonlinear relationships with outstanding generalization. MLP and SVM also showed high predictive performance, particularly with minimal and comprehensive inputs, while DT struggled with lower R2 values and higher errors, particularly when key operational features were limited. GPR again outperformed other models for salt rejection prediction, achieving the lowest RMSE and MAE values, especially under full-feature scenarios. SVM performed well but showed sensitivity to feature complexity, while LR achieved high accuracy only when comprehensive variables were included. Sensitivity analysis confirmed that FP and BS are the dominant positive factors, whereas brine flow and permeate salinity negatively influenced performance. Overall, GPR proved to be the most robust model for recovery and salt rejection prediction. Future work should focus on integrating such ML models with real-time control systems, expanding datasets to broader operational conditions, and developing adaptive learning frameworks to enhance desalination system performance further. This study provides a foundation for advancing future research aimed at integrating high-accuracy models, particularly GPR, into real-time monitoring and control systems for wave-powered desalination technologies. Incorporating these models into adaptive control architectures such as MPC can enable automated responses to fluctuating operational conditions, thereby improving system efficiency and reliability. To enhance the robustness and generalizability of predictive performance, future efforts should focus on expanding training datasets to include a broader spectrum of salinity levels and environmental scenarios. Furthermore, the convergence of ML with emerging technologies such as the Internet of Things (IoT) and digital twin platforms presents promising opportunities for predictive maintenance, early fault detection, and autonomous process optimization. Collectively, these developments will be instrumental in enabling next-generation, intelligent, and energy-efficient desalination systems, particularly in remote or resource-constrained coastal regions.

Author Contributions

Conceptualization, L.T.Y., S.I.A., and J.U; methodology, L.T.Y. and J.U.; software, A.M.J.; validation, L.T.Y., S.I.A. and A.M.J.; formal analysis, J.U.; investigation, L.T.Y. and S.I.A.; resources, J.U.; data curation, L.T.Y., S.I.A. and J.U; writing—original draft preparation, L.T.Y. and S.I.A.; writing—review and editing, L.T.Y. and S.I.A.; visualization, J.U.; supervision, S.I.A.; project administration, I.H.A.; funding acquisition, I.H.A. All authors have read and agreed to the published version of this manuscript.

Funding

This research received no external funding.

Data Availability Statement

Data are available upon request.

Conflicts of Interest

The authors declare no conflicts of interest.

References

  1. Rosa, L.; Sangiorgio, M. Global Water Gaps Under Future Warming Levels. Nat. Commun. 2025, 16, 1192. [Google Scholar] [CrossRef] [PubMed]
  2. He, C.; Liu, Z.; Wu, J.; Pan, X.; Fang, Z.; Li, J.; Bryan, B.A. Future Global Urban Water Scarcity and Potential Solutions. Nat. Commun. 2021, 12, 4667. [Google Scholar] [CrossRef]
  3. Alenezi, A.; Alabaiadly, Y. Emerging Technologies in Water Desalination: A Review and Future Outlook. Energy Nexus 2025, 17, 100373. [Google Scholar] [CrossRef]
  4. Park, K.; Kim, J.; Yang, D.R.; Hong, S. Towards a Low-Energy Seawater Reverse Osmosis Desalination Plant: A Review and Theoretical Analysis for Future Directions. J. Memb. Sci. 2020, 595, 117607. [Google Scholar] [CrossRef]
  5. Tal, A. Addressing Desalination’s Carbon Footprint: The Israeli Experience. Water 2018, 10, 197. [Google Scholar] [CrossRef]
  6. Saavedra, A.; Valdés, H.; Mahn, A.; Acosta, O. Comparative Analysis of Conventional and Emerging Technologies for Seawater Desalination: Northern Chile as a Case Study. Membranes 2021, 11, 180. [Google Scholar] [CrossRef]
  7. Ahmad, T.; Zhang, D. A Critical Review of Comparative Global Historical Energy Consumption and Future Demand: The Story Told so Far. Energy Rep. 2020, 6, 1973–1991. [Google Scholar] [CrossRef]
  8. Nurjanah, I.; Chang, T.T.; You, S.J.; Huang, C.Y.; Sean, W.Y. Reverse Osmosis Integrated with Renewable Energy as Sustainable Technology: A Review. Desalination 2024, 581, 117590. [Google Scholar] [CrossRef]
  9. Okampo, E.J.; Nwulu, N. Optimisation of Renewable Energy Powered Reverse Osmosis Desalination Systems: A State-of-the-Art Review. Renew. Sustain. Energy Rev. 2021, 140, 110712. [Google Scholar] [CrossRef]
  10. Leijon, J.; Salar, D.; Engström, J.; Leijon, M.; Boström, C. Variable Renewable Energy Sources for Powering Reverse Osmosis Desalination, with a Case Study of Wave Powered Desalination for Kilifi, Kenya. Desalination 2020, 494, 114669. [Google Scholar] [CrossRef]
  11. Sitterley, K.A.; Cath, T.J.; Jenne, D.S.; Yu, Y.H.; Cath, T.Y. Performance of Reverse Osmosis Membrane with Large Feed Pressure Fluctuations from a Wave-Driven Desalination System. Desalination 2022, 527, 115546. [Google Scholar] [CrossRef]
  12. Mi, J.; Wu, X.; Capper, J.; Li, X.; Shalaby, A.; Wang, R.; Lin, S.; Hajj, M.; Zuo, L. Experimental Investigation of a Reverse Osmosis Desalination System Directly Powered by Wave Energy. Appl. Energy 2023, 343, 121194. [Google Scholar] [CrossRef]
  13. Dimitriou, E.; Camacho-Espino, J.; Anastasiou, A.; Papadakis, G. Experimental Investigation of the Performance of a Seawater Reverse Osmosis Desalination System Operating under Variable Feed Flowrate Pressure and Temperature Conditions. J. Environ. Chem. Eng. 2025, 13, 115778. [Google Scholar] [CrossRef]
  14. Wang, C.; Wang, L.; Dong, L.; Shon, H.K.; Kim, J. Specific Energy Consumption of Seawater Reverse Osmosis Desalination Plants Using Machine Learning. Desalination 2025, 602, 118654. [Google Scholar] [CrossRef]
  15. Ma, X.; Lan, C.; Lin, H.; Peng, Y.; Li, T.; Wang, J.; Azamat, J.; Liang, L. Designing Desalination MXene Membranes by Machine Learning and Global Optimization Algorithm. J. Memb. Sci. 2024, 702, 122803. [Google Scholar] [CrossRef]
  16. Priya, P.; Nguyen, T.C.; Saxena, A.; Aluru, N.R. Machine Learning Assisted Screening of Two-Dimensional Materials for Water Desalination. ACS Nano 2022, 16, 1929–1939. [Google Scholar] [CrossRef]
  17. Abba, S.I.; Usman, J.; Bafaqeer, A.; Salami, B.A.; Lawal, Z.K.; Lawal, A.; Usman, A.G.; Aljundi, I.H. Optimizing Sustainable Desalination Plants with Advanced ML-Based Uncertainty Analysis. Appl. Soft Comput. 2025, 169, 112624. [Google Scholar] [CrossRef]
  18. Ruiz-García, A.; Nuez, I.; Khayet, M. Performance Assessment and Modeling of an SWRO Pilot Plant with an Energy Recovery Device under Variable Operating Conditions. Desalination 2023, 555, 116523. [Google Scholar] [CrossRef]
  19. Yin, X.; Lei, M. Deep Reinforcement Learning Based Coastal Seawater Desalination via a Pitching Paddle Wave Energy Converter. Desalination 2022, 543, 115986. [Google Scholar] [CrossRef]
  20. Das, T.K.; Folley, M.; Lamont-Kane, P.; Frost, C. Performance of a SWRO Membrane under Variable Flow Conditions Arising from Wave Powered Desalination. Desalination 2024, 571, 117069. [Google Scholar] [CrossRef]
  21. Zhang, X.; Li, H.; Fan, Y.; Zhang, L.; Peng, S.; Huang, J.; Zhang, J.; Meng, Z. Predicting the Dynamic of Debris Flow Based on Viscoplastic Theory and Support Vector Regression. Water 2025, 17, 120. [Google Scholar] [CrossRef]
  22. Wang, S.; Gong, J.; Gao, H.; Liu, W.; Feng, Z. Gaussian Process Regression and Cooperation Search Algorithm for Forecasting Nonstationary Runoff Time Series. Water 2023, 15, 2111. [Google Scholar] [CrossRef]
  23. Kim, C.H.; Kim, M.; Sholahudin; Giannetti, N.; Saito, K. Systematic Development of Multilayer-Perceptron-Based Void Fraction Model. Int. Commun. Heat. Mass. Transf. 2025, 162, 108563. [Google Scholar] [CrossRef]
  24. Zhao, R.; Hong, L.; Ji, H.; Zhang, Q.; Zhang, S.; Li, Q.; Gong, H. Decision Tree Based Parameter Identification and State Estimation: Application to Reactor Operation Digital Twin. Nucl. Eng. Technol. 2025, 57, 103527. [Google Scholar] [CrossRef]
  25. Chen, B.; Ouyang, H.; Li, S.; Gao, L.; Ding, W. Photovoltaic Parameter Extraction through an Adaptive Differential Evolution Algorithm with Multiple Linear Regression. Appl. Soft Comput. 2025, 176, 113117. [Google Scholar] [CrossRef]
  26. Pan, Y.; Zeng, X.; Xu, H.; Sun, Y.; Wang, D.; Wu, J. Evaluation of Gaussian Process Regression Kernel Functions for Improving Groundwater Prediction. J. Hydrol. 2021, 603, 126960. [Google Scholar] [CrossRef]
  27. Prakash, A.K.; Xu, S.; Rajagopal, R.; Noh, H.Y. Robust Building Energy Load Forecasting Using Physically-Based Kernel Models. Energies 2018, 11, 862. [Google Scholar] [CrossRef]
  28. Talhami, M.; Wakjira, T.; Alomar, T.; Fouladi, S.; Fezouni, F.; Ebead, U.; Altaee, A.; AL-Ejji, M.; Das, P.; Hawari, A.H. Single and Ensemble Explainable Machine Learning-Based Prediction of Membrane Flux in the Reverse Osmosis Process. J. Water Process Eng. 2024, 57, 104633. [Google Scholar] [CrossRef]
  29. Ajali-Hernández, N.I.; Ruiz-Garćıa, A.; Travieso-González, C.M. ANN Based-Model for Estimating the Boron Permeability Coefficient as Boric Acid in SWRO Desalination Plants Using Ensemble-Based Machine Learning. Desalination 2024, 573, 117180. [Google Scholar] [CrossRef]
  30. Sharshir, S.W.; Joseph, A.; Abdalzaher, M.S.; Kandeal, A.W.; Abdullah, A.S.; Yuan, Z.; Zhao, H.; Salim, M.M. Using Multiple Machine Learning Techniques to Enhance the Performance Prediction of Heat Pump-Driven Solar Desalination Unit. Desalin. Water Treat. 2025, 321, 100916. [Google Scholar] [CrossRef]
Figure 1. Prediction performance (R2) of different ML models (SVM, GPR, MLP, and DT) across three input feature configurations (M1, M2, and M3) for permeate recovery (%) in wave-powered SWRO desalination systems.
Water 17 02896 g001
Figure 2. Cumulative probability plots comparing the predictive performance of ML models (SVM, GPR, MLP, and DT) across three input feature configurations (M1, M2, and M3) for permeate recovery (%) in wave-powered SWRO systems.
Water 17 02896 g002
Figure 3. Radial plots representing the R2 values during the training and testing phases for different ML models (GM5/2), SVM, and LR) across three input feature configurations (M1, M2, and M3) for salt rejection (%) prediction.
Water 17 02896 g003
Figure 4. Bar plots illustrating the MAE, MSE, and RMSE during the training and testing phases for different ML models (SVM, GM5/2, and LR) used for salt rejection (%) prediction.
Water 17 02896 g004
Figure 5. Correlation heatmaps illustrating the relationships between operational variables and key performance metrics under three feature configurations: (a) permeate recovery for M1 (pressure and salinity parameters), M2 (flow and quality indicators), and M3 (comprehensive feature set) and (b) salt rejection for M1 (pressure and salinity parameters), M2 (flow and permeate salinity indicators), and M3 (comprehensive feature set).
Water 17 02896 g005
Table 1. Performance metrics (R2, RMSE, MSE, and MAE) of ML models (SVM, GPR, MLP, and DT) for permeate recovery (%) prediction under different input feature combinations (M1, M2, and M3) during training and testing phases in a wave-powered SWRO desalination system.
Training PhaseTesting Phase
RMSER2MSEMAERMSER2MSEMAE
SVM-M10.0151.0000.0000.0120.0141.0000.0000.012
SVM-M20.0660.9000.0040.0480.0770.8900.0060.047
SVM-M30.0310.9800.0010.0240.0210.9900.0000.019
GPR-M10.0091.0000.0000.0070.0071.0000.0000.005
GPR-M20.0051.0000.0000.0030.0011.0000.0000.001
GPR-M30.0091.0000.0000.0060.0021.0000.0000.001
MLP-M10.0210.9900.0000.0150.0061.0000.0000.003
MLP-M20.0380.9700.0010.0230.0081.0000.0000.002
MLP-M30.0580.9400.0030.0350.0061.0000.0000.002
DT-M10.1130.7700.0130.0720.0910.8400.0080.058
DT-M20.1560.5900.0240.1120.1070.7900.0110.079
DT-M30.0960.8500.0090.0670.0550.9400.0030.039
Table 2. Performance metrics (R2, RMSE, MSE, and MAE) of ML models (SVM, GM5/2, and MLP) for salt rejection (%) prediction under different input feature combinations (M1, M2, and M3) during training and testing phase.
Training PhaseTesting Phase
RMSER2MSEMAERMSER2MSEMAE
GM5/2-M10.02140.98000.00050.00050.01430.99000.00020.0110
GM5/2-M20.03970.94000.00160.02820.01400.99000.00020.0098
GM5/2-M30.00001.00000.00010.00000.00001.00000.00000.0000
SVM-M10.03590.95000.00130.02420.02370.98000.00010.0170
SVM-M20.09350.69000.00870.00870.06340.84000.00030.0373
SVM-M30.05210.91000.00270.00270.01730.99000.00030.0130
LR-M10.06310.86000.00400.05460.05650.87000.00320.0501
LR-M20.07700.79000.00590.06290.05660.87000.00320.0497
LR-M30.00001.00000.00000.00000.00001.00000.00000.0000
Table 3. Comparison of ML performance on desalination with the literature.
ML ModelApplicationDataPrediction EfficacyReferences
LSTM-GA, LSTM-CSAHybrid (NF/RO) systemsHybrid of simulation and real operational dataLSTM-GA (MAE-0.13)[17]
ANNSWRO with ERDPilot SWRO with ERD under variable conditionsMAE-0.0082[18]
Deep Reinforcement LearningWave-powered RO (simulated)Simulated wave-powered RO using real wave dataStable flow at 1200 m3/day[19]
Ensemble ANNSWRO for boron rejectionFull-scale plant; long-term dataMAE-7.93 × 10⁻⁸[29]
GPR, SVM, MLP, DT, LRWave-powered SWRODynamic wave-driven flowR2 -1.00, MAE-0.001The present study
Disclaimer/Publisher’s Note: The statements, opinions and data contained in all publications are solely those of the individual author(s) and contributor(s) and not of MDPI and/or the editor(s). MDPI and/or the editor(s) disclaim responsibility for any injury to people or property resulting from any ideas, methods, instructions or products referred to in the content.