1. Introduction
Contemporary cities—densely populated, with heavy traffic, and infrastructurally complex—pose growing challenges to sustainable urban mobility. In this context, a growing number of cities are promoting policies that provide pedestrians with the priority traditionally given to vehicles on urban roads. One of the main actions promoted by local administrations is related to the sustainable philosophy of traffic calming to support the liveability and vitality of residential and commercial areas through improvements in non-motorist safety, mobility, and comfort.
Traffic calming is a term used to describe the physical features provided along a road that encourage vehicle drivers to reduce speed. These features are introduced for the safety and the comfort of all road users, particularly pedestrians and cyclists.
Traffic-calming schemes can employ a variety of measures, including digital and pedagogic signs, narrowed areas, limited speed areas, roundabouts, speed bumps (or road humps), etc. (
Figure 1).
As part of this collection of traffic-calming measures, speed bumps are becoming increasingly common throughout numerous Spanish cities. These devices can feature either flat or curved surfaces, spanning the entire width of the roadway or encompassing complete intersections. They may also take the shape of a “cushion”, occupying only a section of the driving lane, and these are engineered to permit buses and large emergency vehicles to pass over them easily, while reducing the speed of other traffic. Advisory signage can be positioned at the start of street where a single bump or multiple bumps are placed (
Figure 2) [
1].
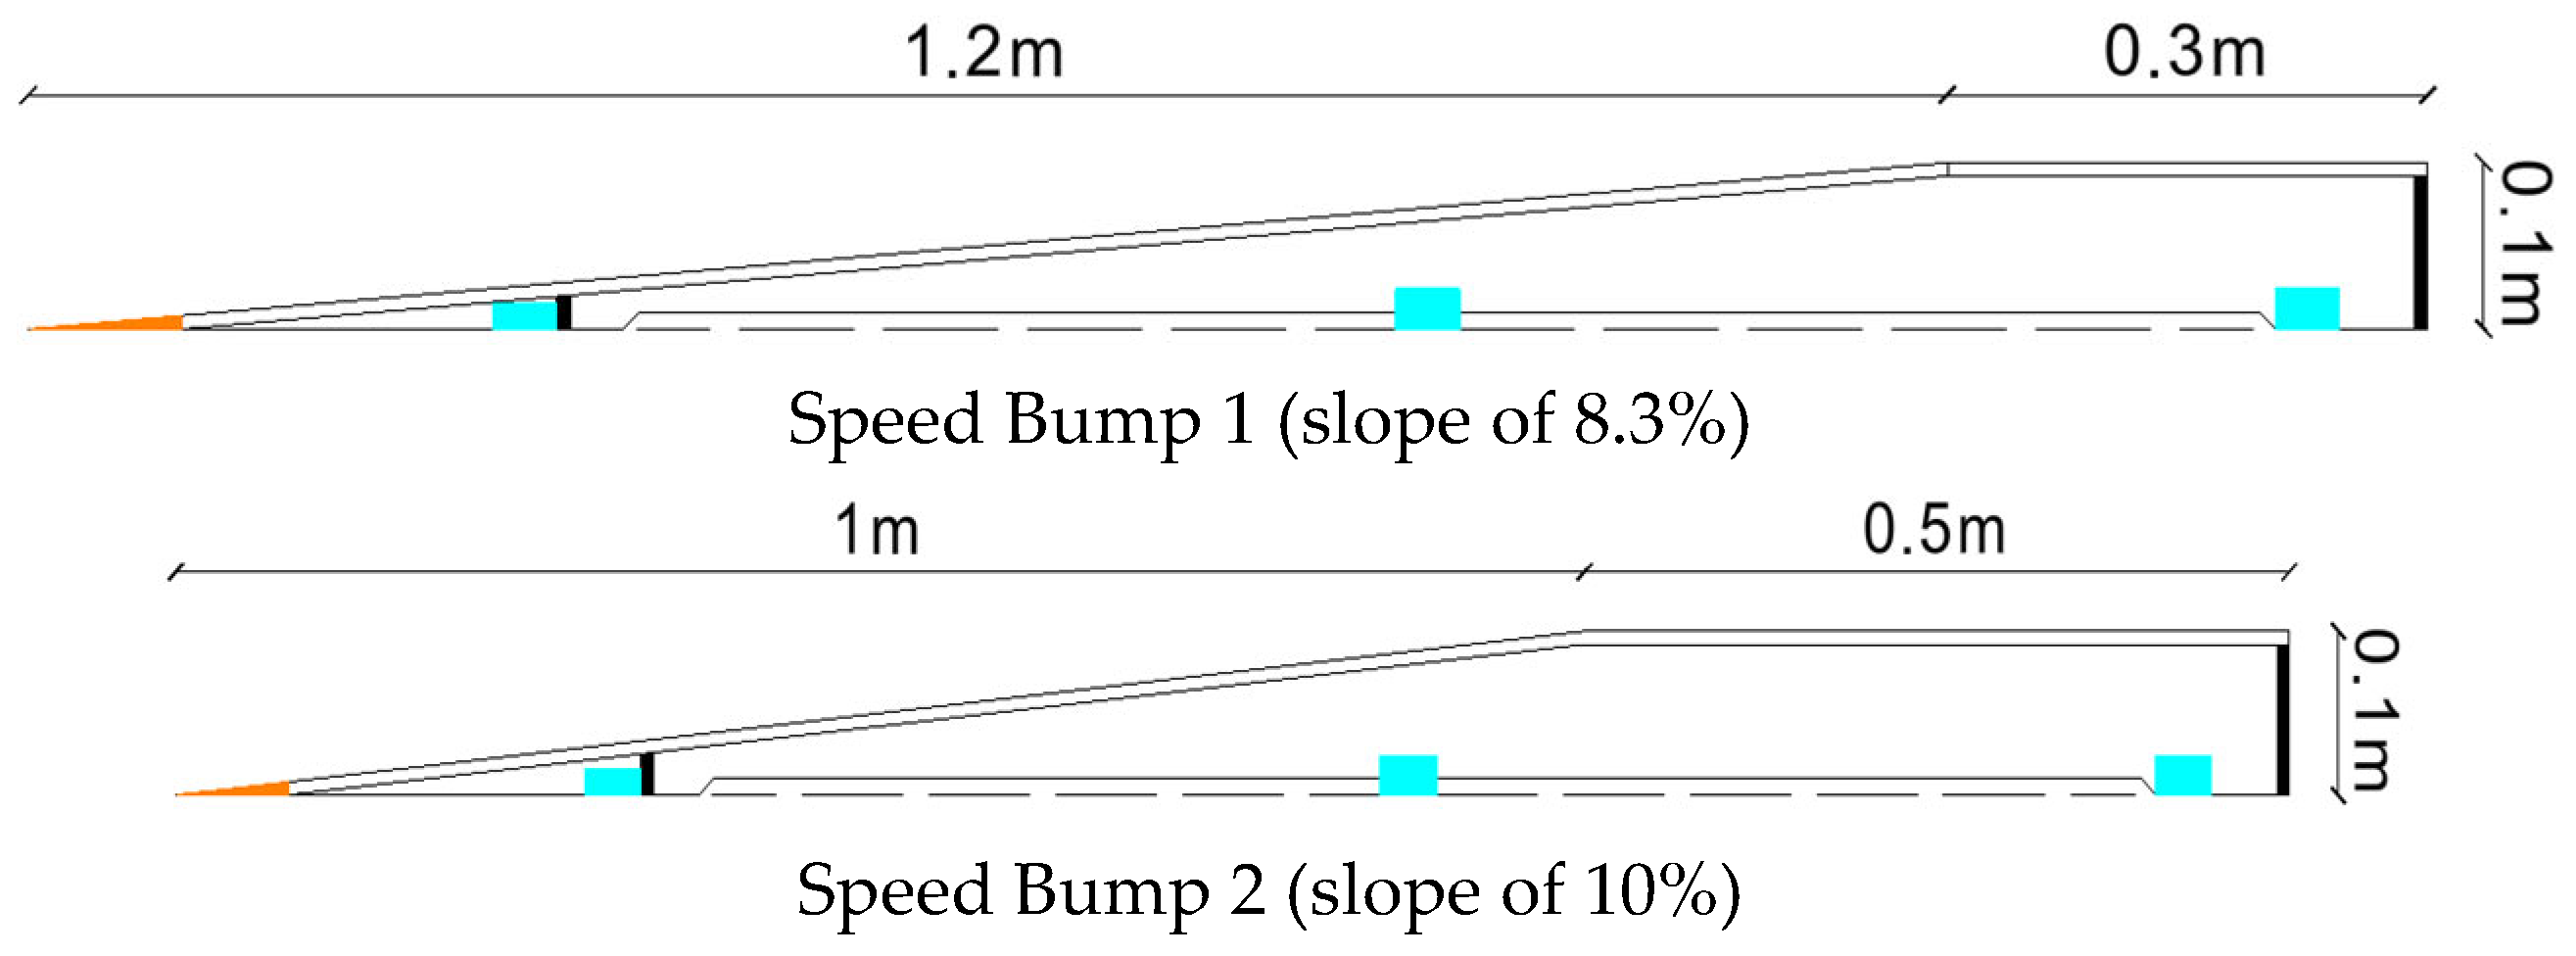
In Spain, national standards for speed bump installation are governed by technical directive Order FOM 3053/2008 [
2]. This regulation defines two distinct speed bump designs, one featuring a trapezoidal cross-section (
Figure 3) and another with a circular segment profile. The trapezoidal design, which is the predominant type used throughout Spain, requires that the ramp’s horizontal projection measures between 1 and 2 m in length.
Moreover, a proper understanding of hydraulic surface drainage systems is gaining increasing acknowledgment within the scientific community [
3]. The surface drainage system consists of multiple street inlets and various other stormwater collection components. This system is designed to ensure the quick introduction of runoff generated from city surfaces—including streets, walkways, recreational areas, and public areas—directly into the municipal sewage infrastructure [
4].
A proper surface drainage system is essential to limiting flow depths and velocity during storm events. The combination of these parameters in cases of pluvial floods and consequent uncontrolled runoff circulating in urban areas can produce severe hazard conditions for pedestrians [
5] and vehicles [
6], as well as relevant economic damage to properties and exposed assets [
7].
Flood hazard criteria related to people or vehicles are generally used as design criteria to define optimum inlet spacing [
8].
Beyond tailored flood hazard criteria, the design of surface drainage systems requires the estimation of the hydraulic performance of the sewer inlets, generally defined as inlet hydraulic efficiency and expressed as the ratio between the flow captured by the drain elements and the flow approaching it [
3].
Several studies, based on both experimental and numerical approaches, have been carried out during recent decades to estimate the hydraulic efficiency of common grated inlets or non-conventional inlets (like macro-grates, circular inlets, or continuous grates) [
3,
9,
10,
11,
12,
13,
14,
15]. Some studies also considered the poor hydraulic performance of surface drainage systems due to clogging phenomena or badly located drain elements [
3,
15,
16,
17].
Furthermore, a correct evaluation of flow intercepted by inlets and overflowed by pressurized sewer pipes during flood events is essential for implementing a proper 1D/2D urban stormwater coupled model and assessing the hydrologic and hydraulic responses of urban catchments during heavy storm episodes [
3]. In this kind of model, considered as the most realistic approach to simulate interactions between a sewer network and street-level surface [
18], the underground sewer network is represented by a 1D sewer model, while the overland flow is computed using a 2D model. In this case, the amount of flow interchanged between the two drainage layers (surface and underground) is determined, among other factors, by the type and the location of sewer inlets and manholes. Considering all this, it is evident that the accuracy of the 1D/2D coupled model depends on a proper estimation of inlet hydraulic performance under different scenarios (flow conditions, state of maintenance, etc.).
All these aspects have been considered in cutting-edge models developed and calibrated in the city of Barcelona, Spain, within the frameworks of recent research projects and master drainage plans [
19]. In particular, according to the last Integral Drainage Master Plan of Barcelona (acronym PDISBA, according to the Catalan title of the plan), it has been estimated that around 43,000 inlets (for a budget of 83.5 M€) are required to accomplish the flood hazard criteria adopted by the municipality, but some are still missing [
19].
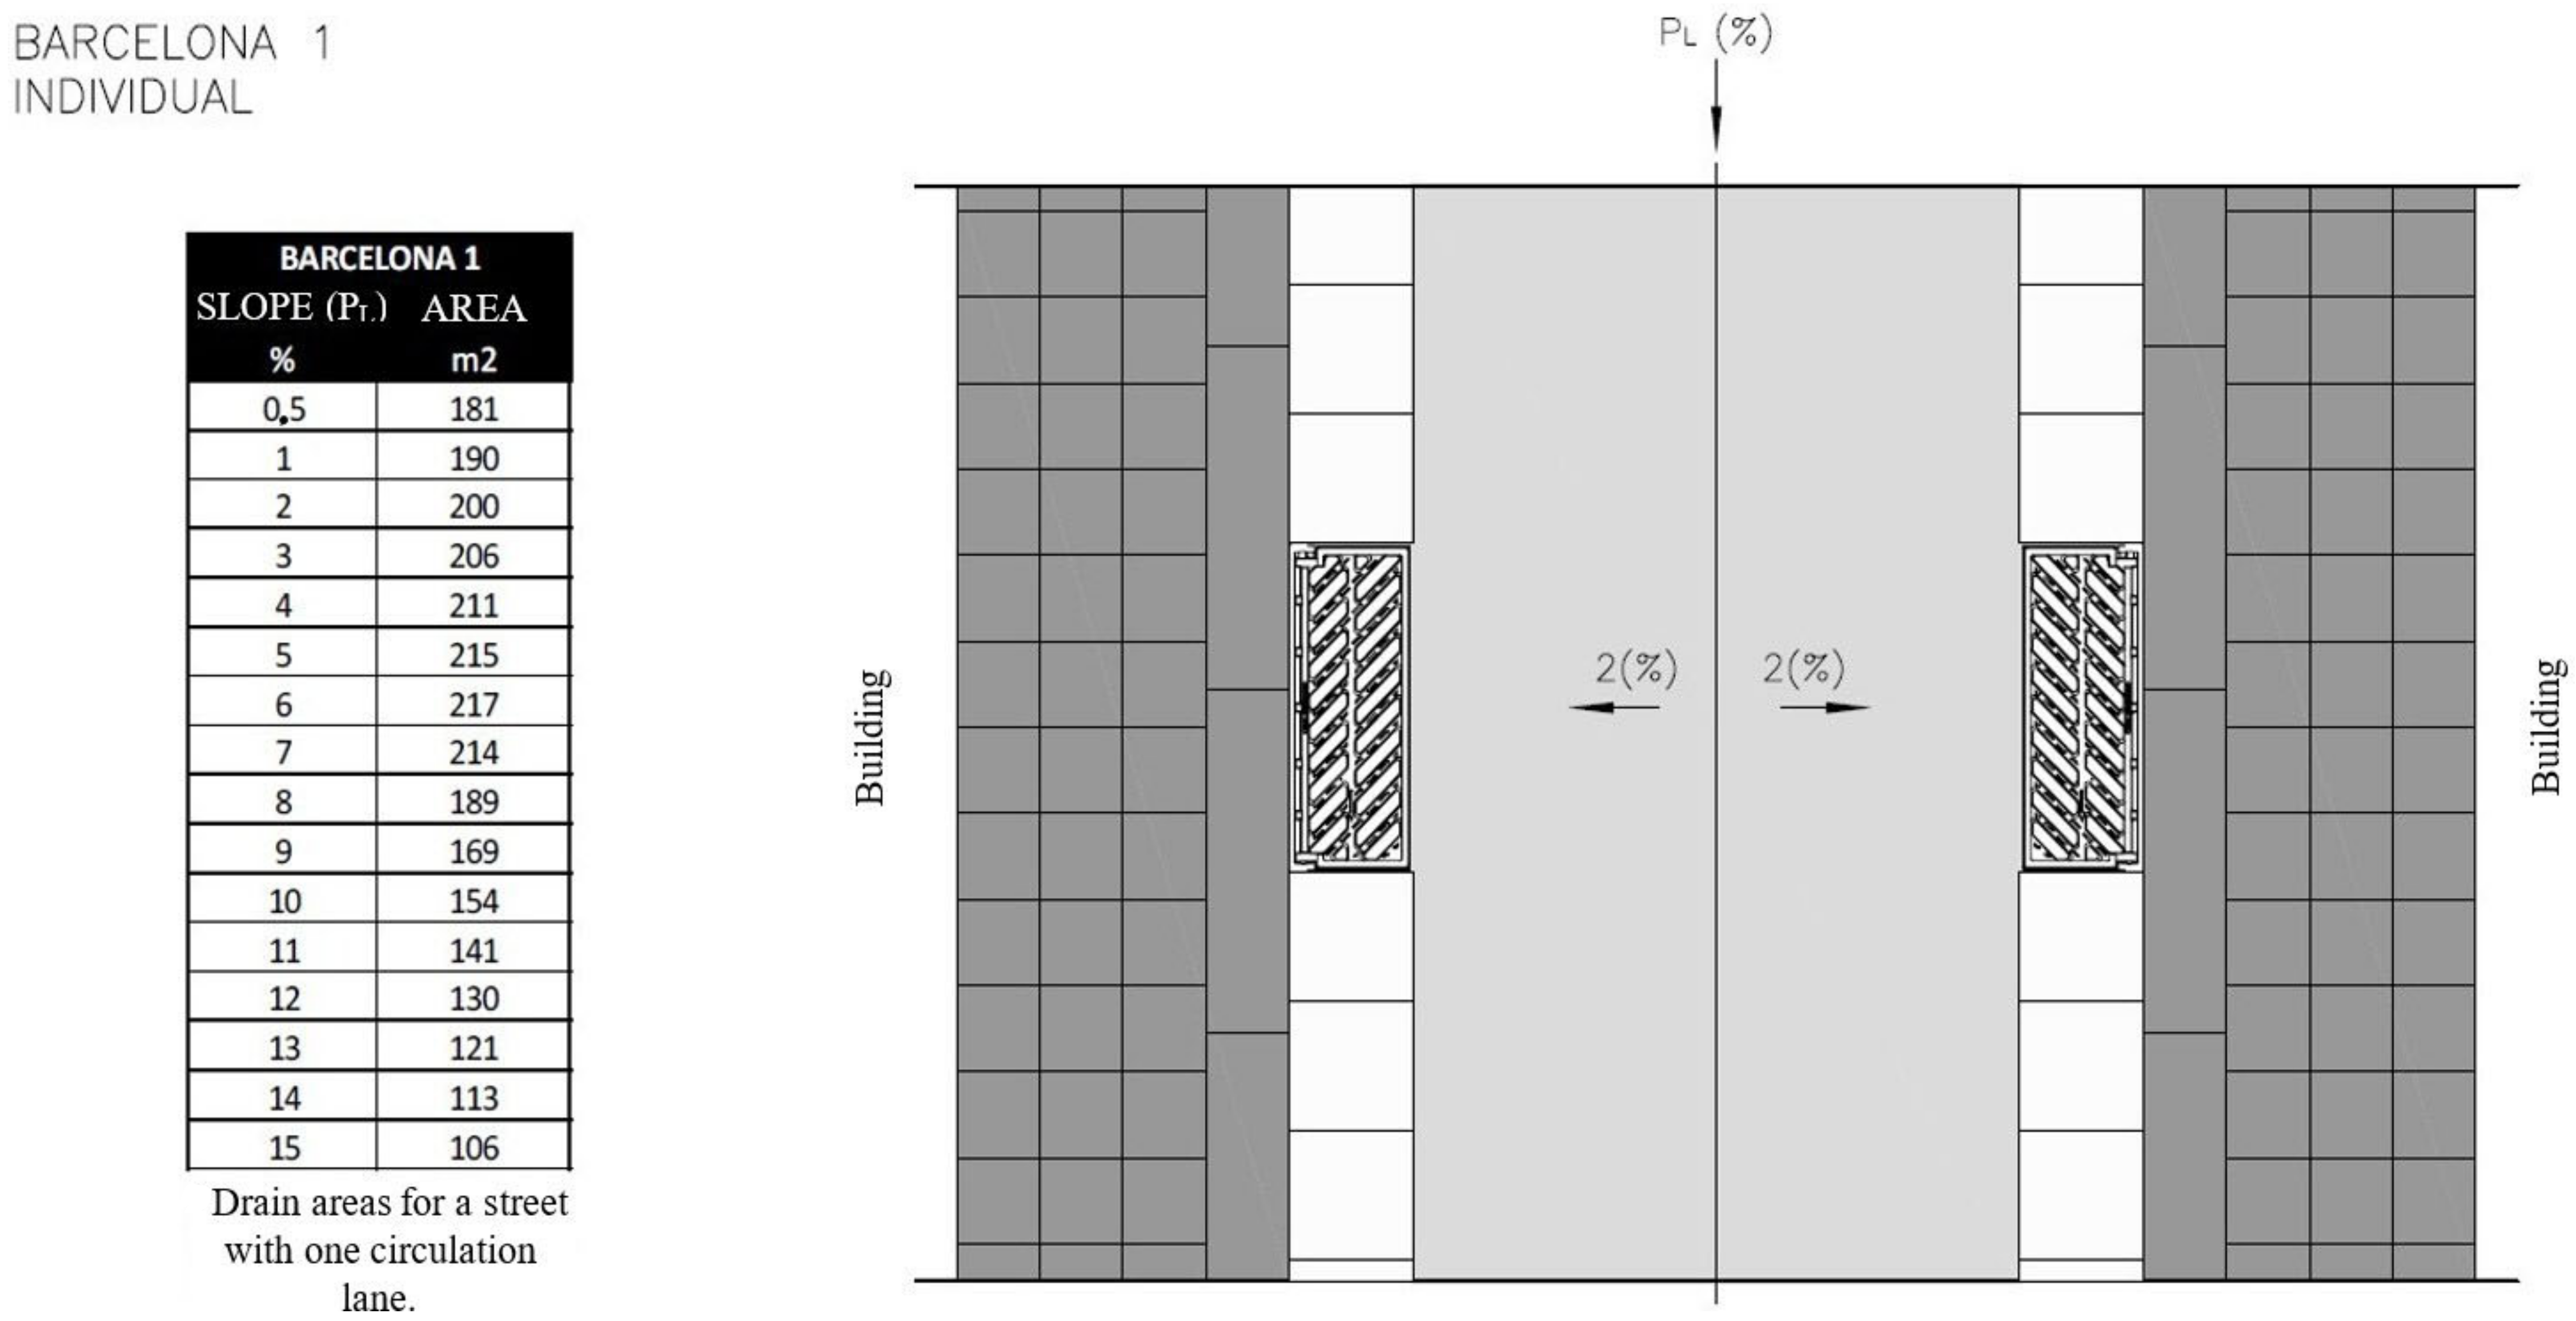
Furthermore, the public company Barcelona Cicle de l’Aigua SA (BCASA), which manages the urban water cycle of the city, published the results obtained from the analysis of the drained area (
Figure 4), using several configurations of drainage elements according to their hydraulic efficiency, the geometry of the street, and the accomplishment of the official flood hazard criteria [
20].
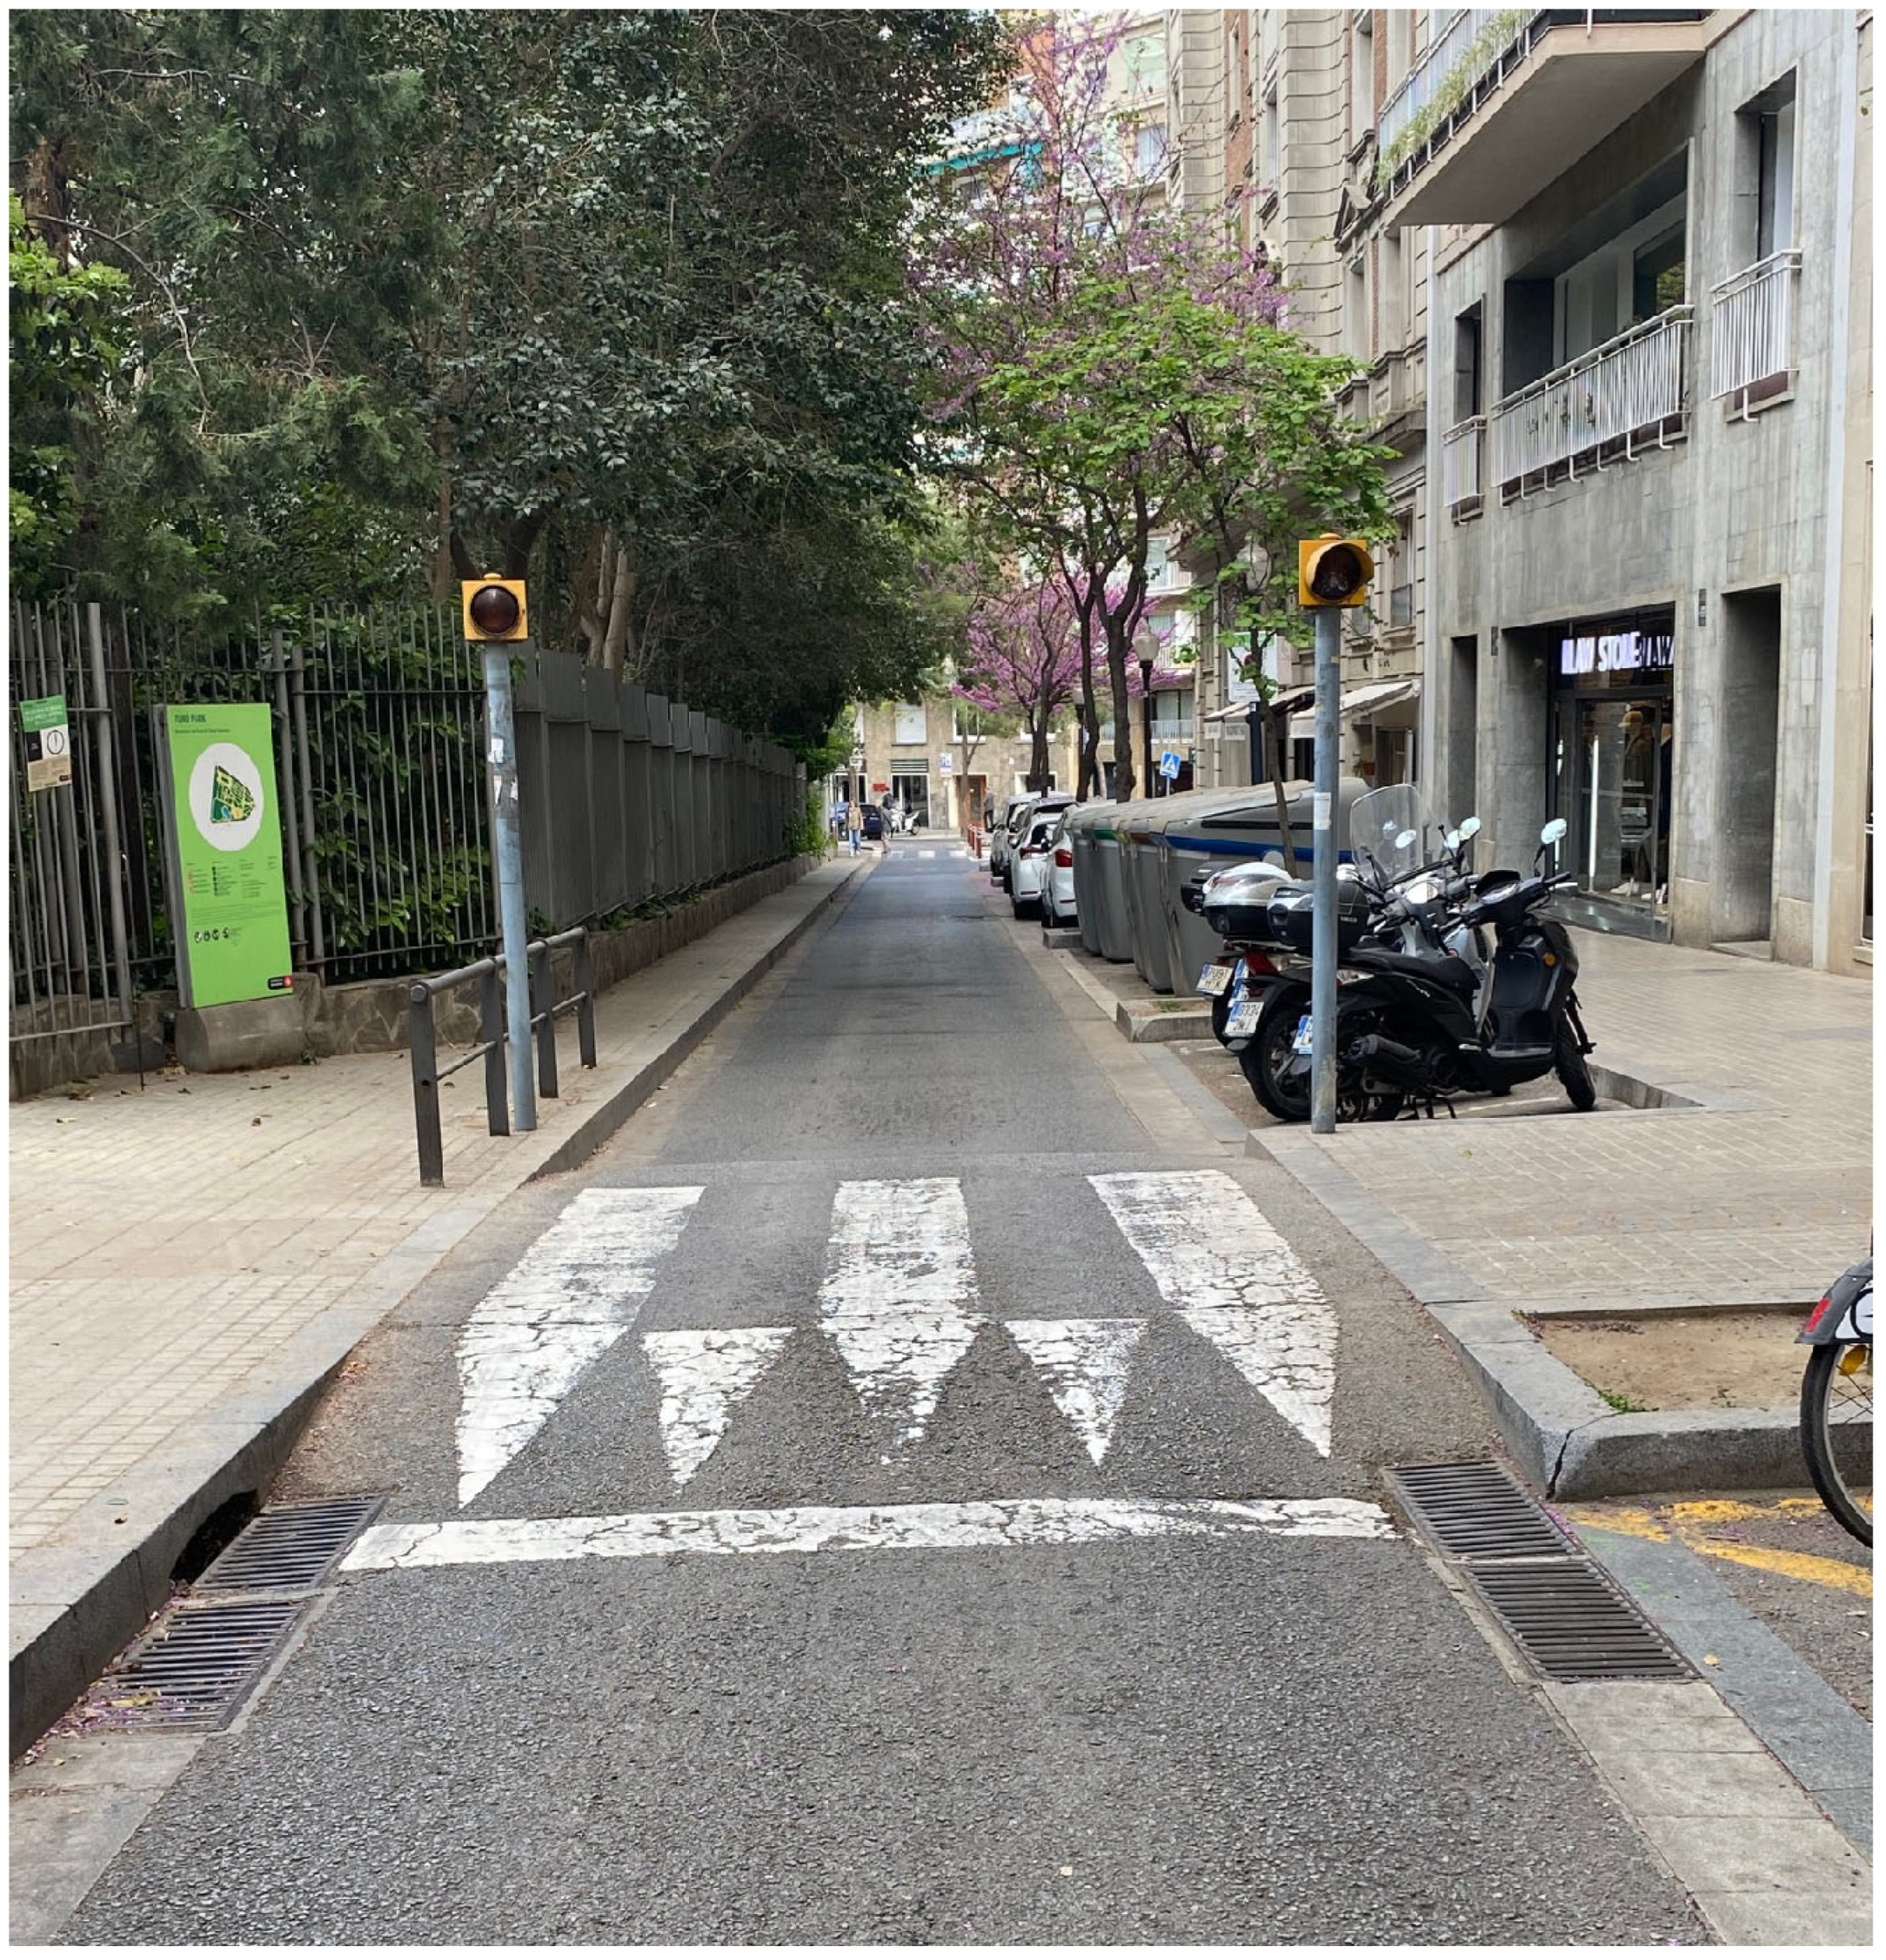
The proliferation of speed bumps in urban areas (
Figure 5) is often accompanied by grated inlets located upstream of them to maximize their hydraulic efficiency, which makes necessary an in-depth study about the effect of these elements on the hydraulic performance of surface drainage systems.
This work aims to estimate the effects of the speed bumps on the hydraulic efficiency of grated inlets located just upstream of them. Several configurations of grated inlets have been tested in the hydraulic laboratory of the Technical University of Catalonia, considering two types of trapezoidal speed bumps. Experiments were carried out at real scale. Being a full-scale platform, the experimental results are highly realistic and free from uncertainties associated with scaling effects.
2. Materials and Methods
2.1. Concept of Hydraulic Efficiency
The hydraulic efficiency of a grated inlet (like other surface drainage structures) can be defined as the ratio between the flow intercepted by the inlet and the total approaching flow approaching it. Thus, efficiency (
E) can be calculated by the following equation:
where
E is the hydraulic efficiency of the grated inlet,
Qint is the flow intercepted by the inlet and
Q is the flow approaching the inlet.
The experimental campaign performed in this study aims to estimate the hydraulic efficiency of two grated inlets commonly used in the city of Barcelona which are located upstream of two types of speed bumps according to different configurations. These values are then compared with the results obtained for isolated grated inlets without speed bumps in order to demonstrate how the presence of speed bumps enhances the hydraulic efficiency of these elements, quantifying these improvements.
2.2. Set-Up of the Configurations of Grated Inlets and Speed Bumps to Be Analyzed
Currently, there is a wide range of storm drain grates available, with their design being influenced by structural, hydraulic, and aesthetic considerations. Nevertheless, certain cities such as Barcelona only permit specific types of grates that meet structural and architectural requirements [
20] and for which hydraulic performance data is available through experimental studies or manufacturer specifications [
21].
Two of the most common grates currently used in Barcelona [
20] have been selected for this study. The geometric characteristics of these elements are shown in
Figure 6 and
Table 1.
The analysis carried out considered grated inlets located upstream of two types of speed bumps manufactured at the hydraulic laboratory of the UPC and dimensioned to accomplish the standard in force in Spain [
2]. The speed bumps present differences in terms of length of the rump and slope, as shown in
Figure 7.
In accordance with the usual arrangements of the surface drainage elements in the paved streets of the municipality of Barcelona [
21], different combinations between the analyzed grated inlets and the aforementioned speed bumps were considered, producing the following six configurations (C) that were analyzed through a tailored experimental campaign (
Figure 8). According to official regulation EN-124 [
22], grate BCN1 is classified as Type C and can be located only in a gutter street, while BCN10 is a Type D grate and can also be positioned transversally on a roadway. For this reason, grate BCN10 was also tested transversally.
2.3. Experimental Campaign: Laboratory Facility
The research was carried out at the hydraulic laboratory of the Universitat Politècnica de Catalunya (UPC) in Barcelona, Spain, taking advantage of a physical model already used in the past for other studies [
3].
The laboratory is equipped with a pumping assembly capable of delivering flow rates up to 250 L/s, transferring water from a subsurface reservoir located in the building’s basement to an elevated tank positioned on the building’s rooftop. Water level variations in the underground reservoir necessitate limiting the maximum operational flow rate to approximately 200 L/s. The pipeline supplying water to the laboratory connects to this underground reservoir. The rooftop tank functions to maintain a constant hydraulic head and serves as a flow regulation component for laboratory supply. This elevated tank is positioned approximately 15 m above the testing zone elevation.
Flow control is accomplished through a motorized gate valve of multi-jet configuration, operated via manual controls. Discharge measurement is performed using an electromagnetic flow meter, with an estimated precision of 1 L/s. This installation enables the straightforward and reliable establishment of desired testing flow rates.
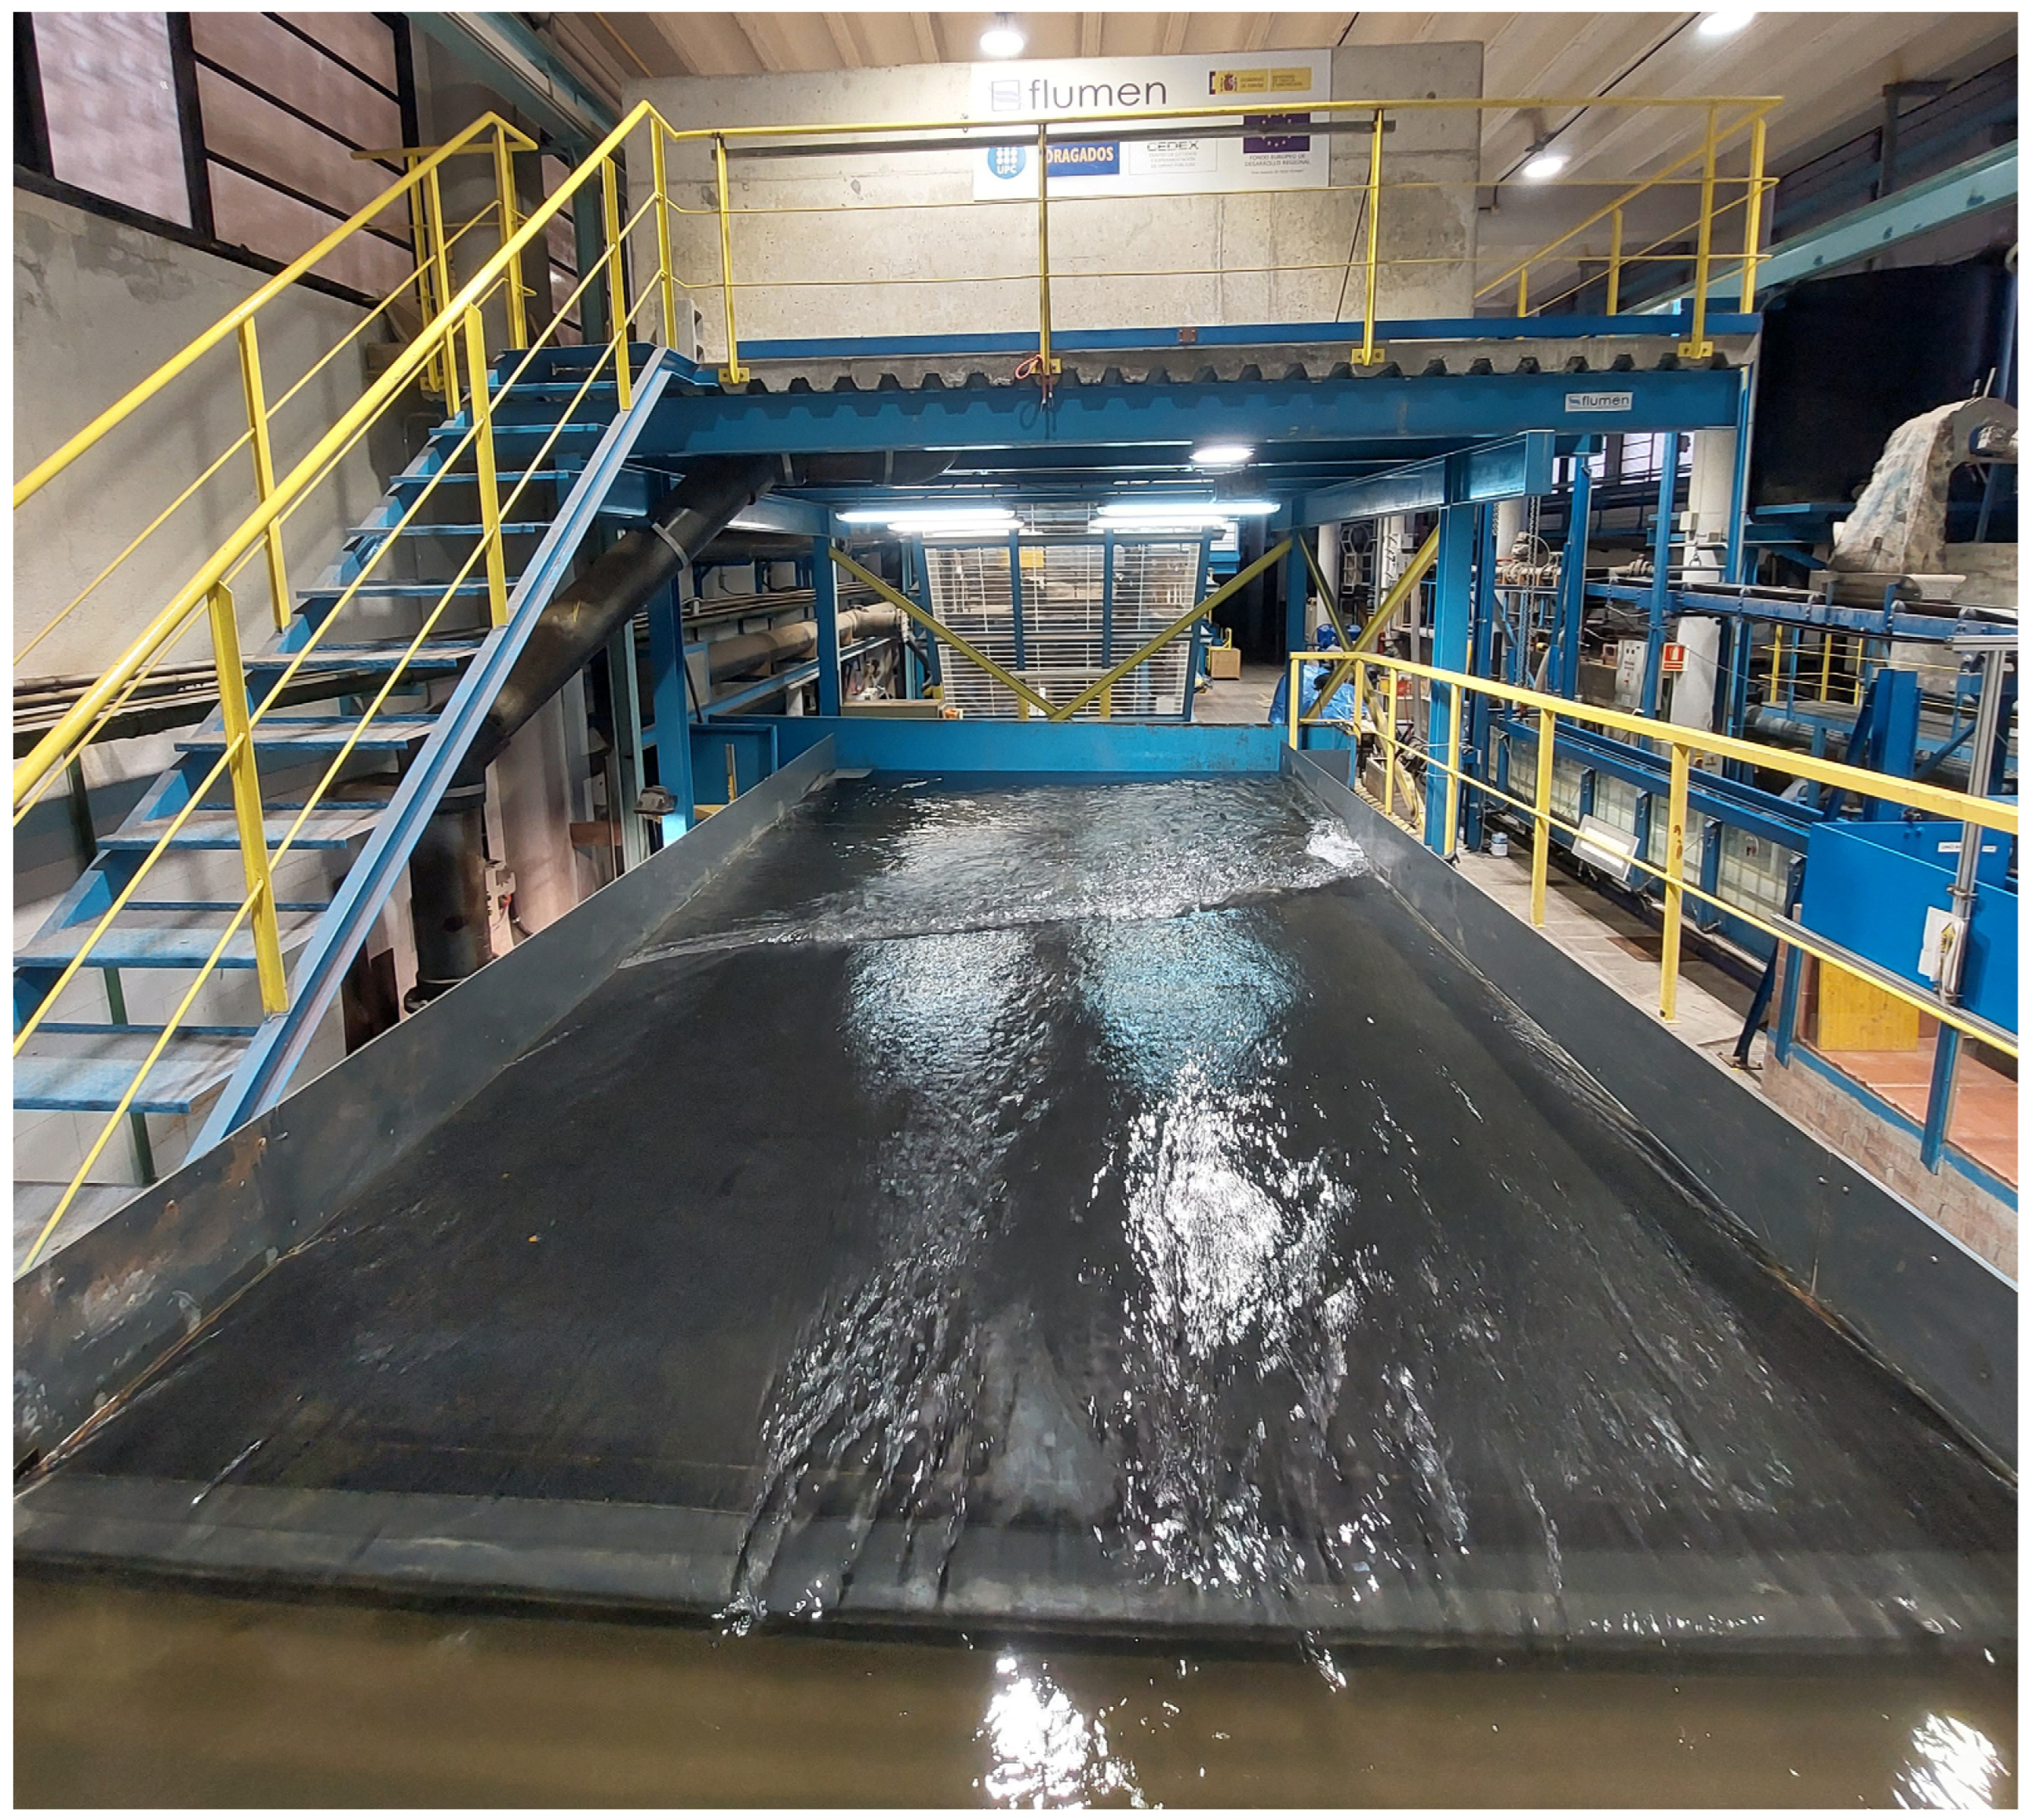
The testing facility (
Figure 9 and
Figure 10) used for this study consists of a platform designed to accommodate the storm drain inlet under investigation. The effective testing area dimensions on this platform measure 3 m in width by 5.50 m in length. These dimensions closely replicate the width of an urban traffic lane, thereby enabling capacity testing at full scale. Water circulates on the platform in the longitudinal direction. The platform’s slope can be adjusted in the flow direction (longitudinal slope up to 10% and transverse one up to 4%).
To supply the platform, water enters via a header reservoir designed to stabilize flow and establish horizontal water surface conditions relative to the base surface. This configuration promotes one-dimensional free-surface flow characteristics where water surface elevation remains uniform across any cross-section perpendicular to the flow direction. This arrangement facilitates the achievement of steady, uniform-approach flow conditions.
This design aims to reproduce as accurately as possible the natural arrival conditions of water (from street surfaces) at storm drain inlets under realistic circumstances. Water enters the testing platform with a transverse depth distribution closely resembling the actual conditions encountered on urban streets.
The header tank dimensions comprise 3.85 m width (encompassing the platform’s complete useful width), approximately 2 m height (providing adequate water depth above the platform), and 1 m length, ensuring sufficient storage volume and regulation capacity for inlet flow stabilization.
The tank and platform are connected through a flexible butyl rubber joint that accommodates platform movement (the mobile component) relative to the fixed tank while ensuring watertight sealing to prevent water escape.
As said, the effective flow area measures 3.00 m × 5.50 m, with flow guidance provided by two PVC walls approximately 30 cm in height. The wall adjacent to the grate simulates the curb boundary, as Barcelona’s drainage grate inlets are positioned in uniform curbs with triangular cross-sections.
The circulating flows during testing closely resemble those generated by heavy rainfall on actual roadways, and the real-scale dimensions of both the platform and tested grates eliminate typical scaling effects related to surface tension found in reduced-scale models.
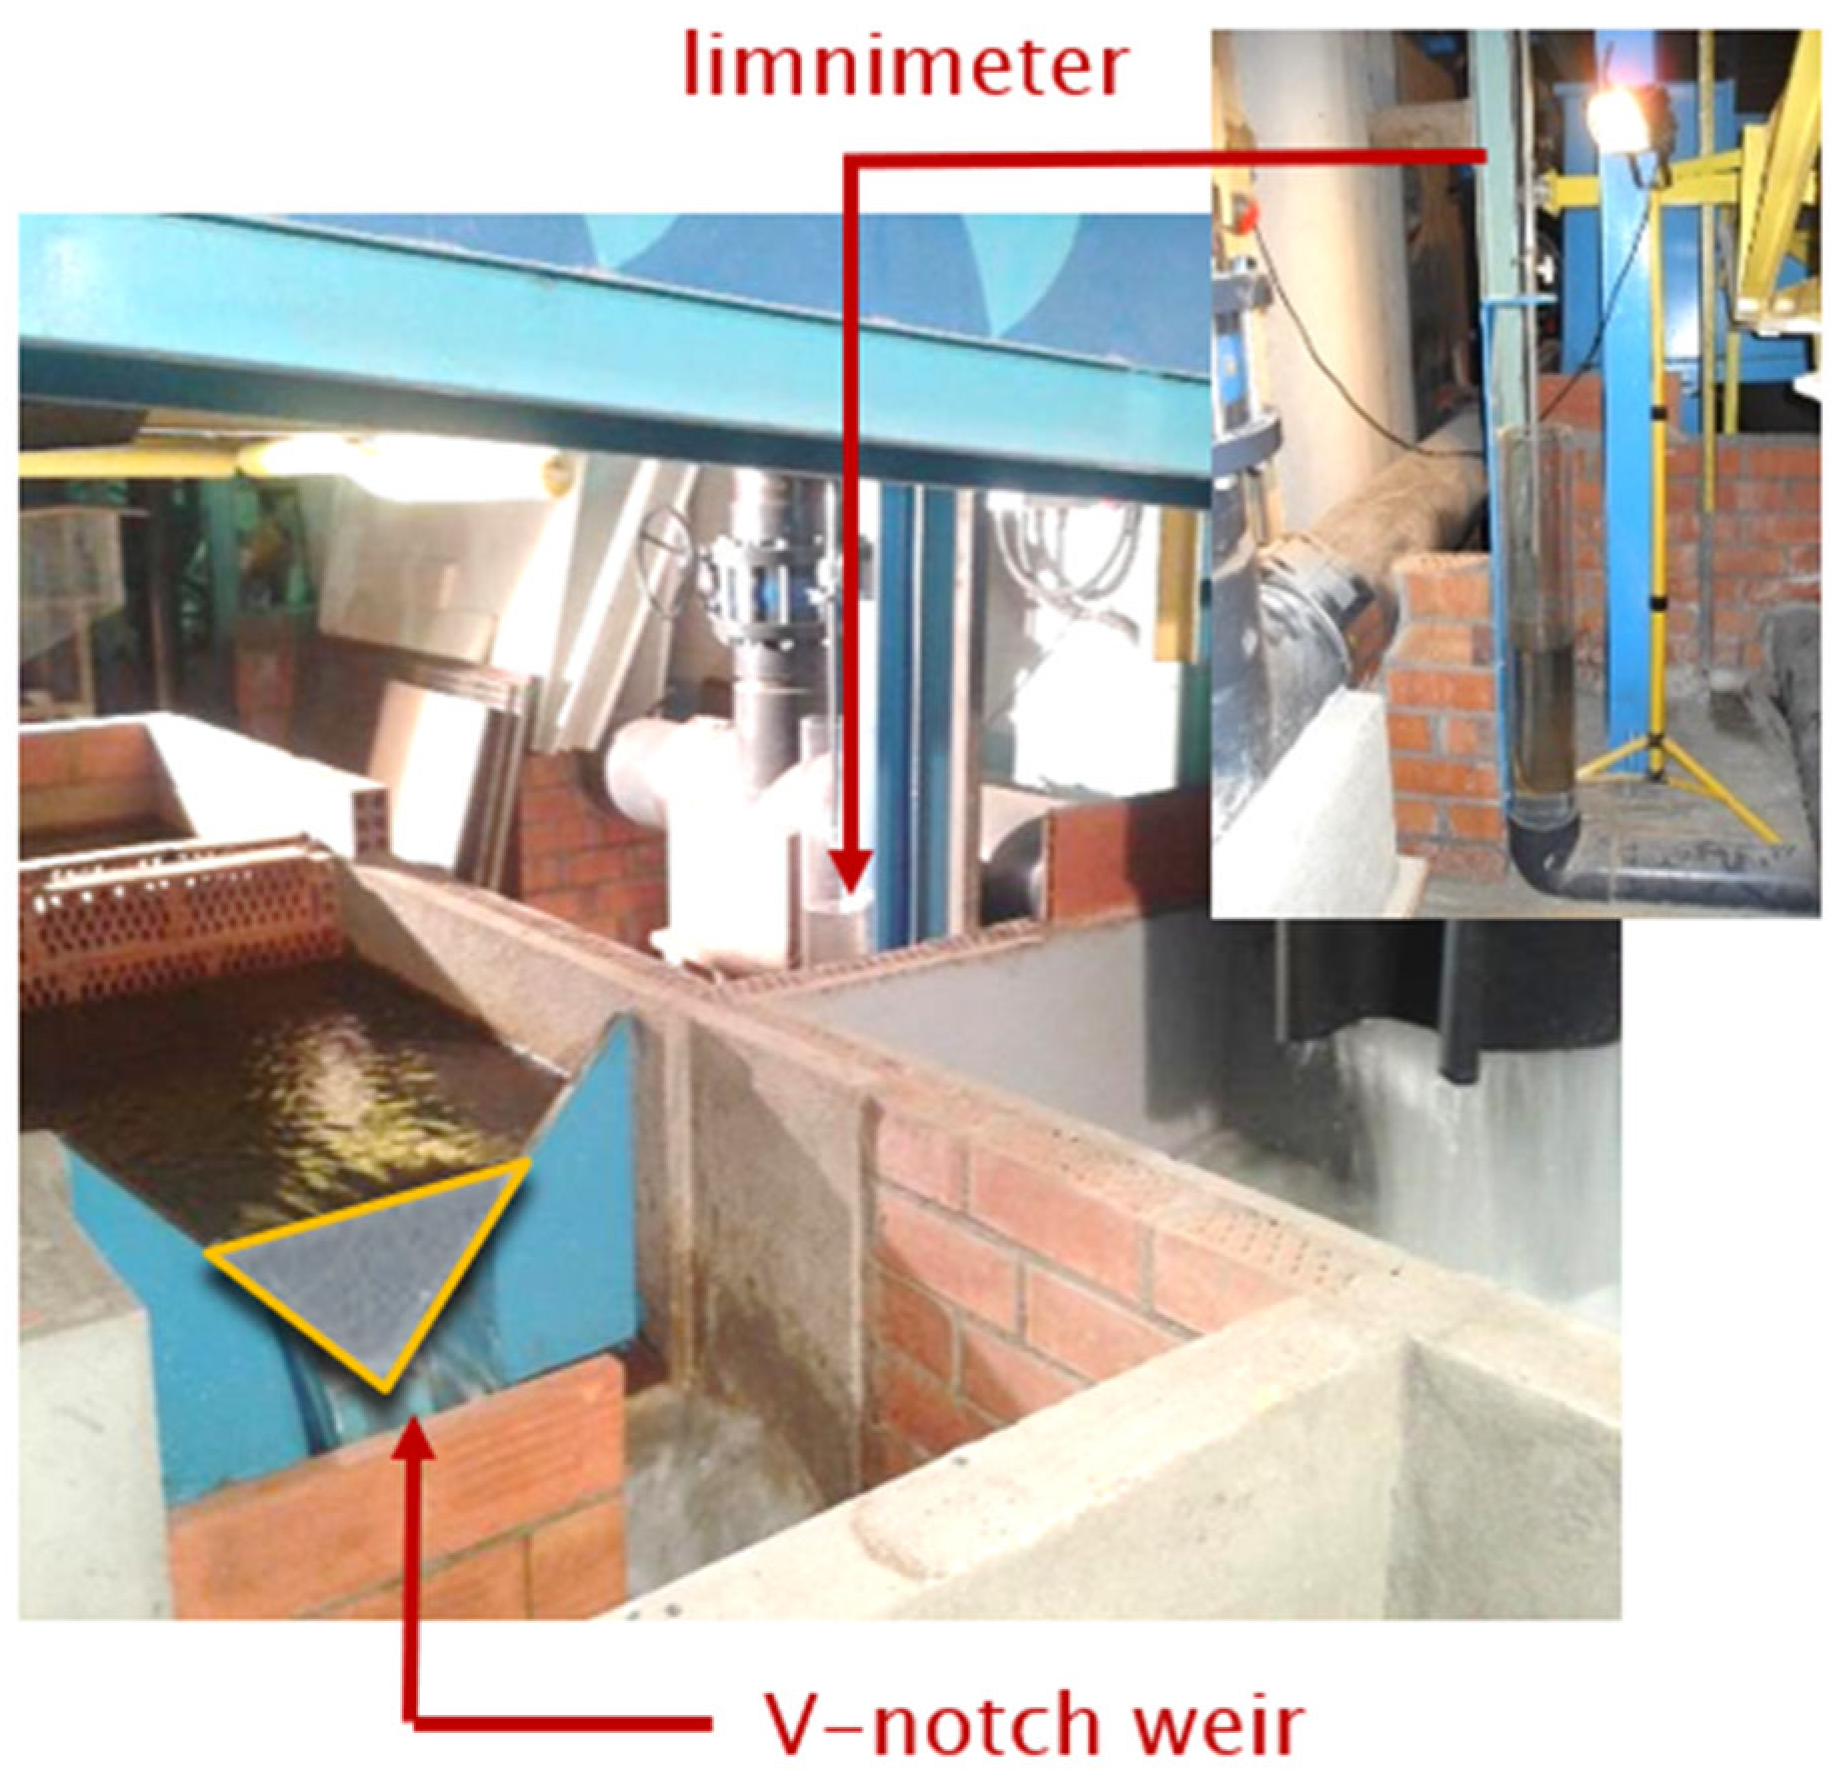
Water intercepted by the tested grate falls into a masonry collection chamber where flow energy is dissipated before being directed toward a triangular weir for discharge measurement using a staff gauge (limnimeter) that provides reading precision to one-tenth of a millimeter (
Figure 11).
2.4. Experimental Campaign: Testing Conditions
Hydraulic efficiency of the two tested grates (BCN1 and BCN10) was achieved considering several discharge rates circulating on the platform and several longitudinal and transverse slopes, as shown in
Table 2. For each configuration (C), the maximum circulating flow rate was determined by the laboratory facility constraints. Furthermore, for transverse grates, only 1 m of the platform and a fixed transverse slope of 0% were considered according to previous studies [
3] in order to express the results in terms of specific flow.
The upper boundaries in terms of circulating flows were constrained by the maximum discharge capacity of the fixed installations and specially by the limited capacity of the system (masonry collection chamber) to collect great intercepted volumes/flows.
The 50 L/s value represents a practical lower threshold established through preliminary testing of initial grates, which demonstrated that lower discharges produced water films measuring only millimeters in depth given the platform dimensions, thereby compromising result reliability.
The investigated discharge range significantly exceeds those reported in reference studies and approximates actual flow rates encountered in urban roadways experiencing capacity constraints.
Testing discharge rates are achieved through the existing supply configuration of the Hydraulic Laboratory, utilizing adaptations of the available fixed installations.
3. Results
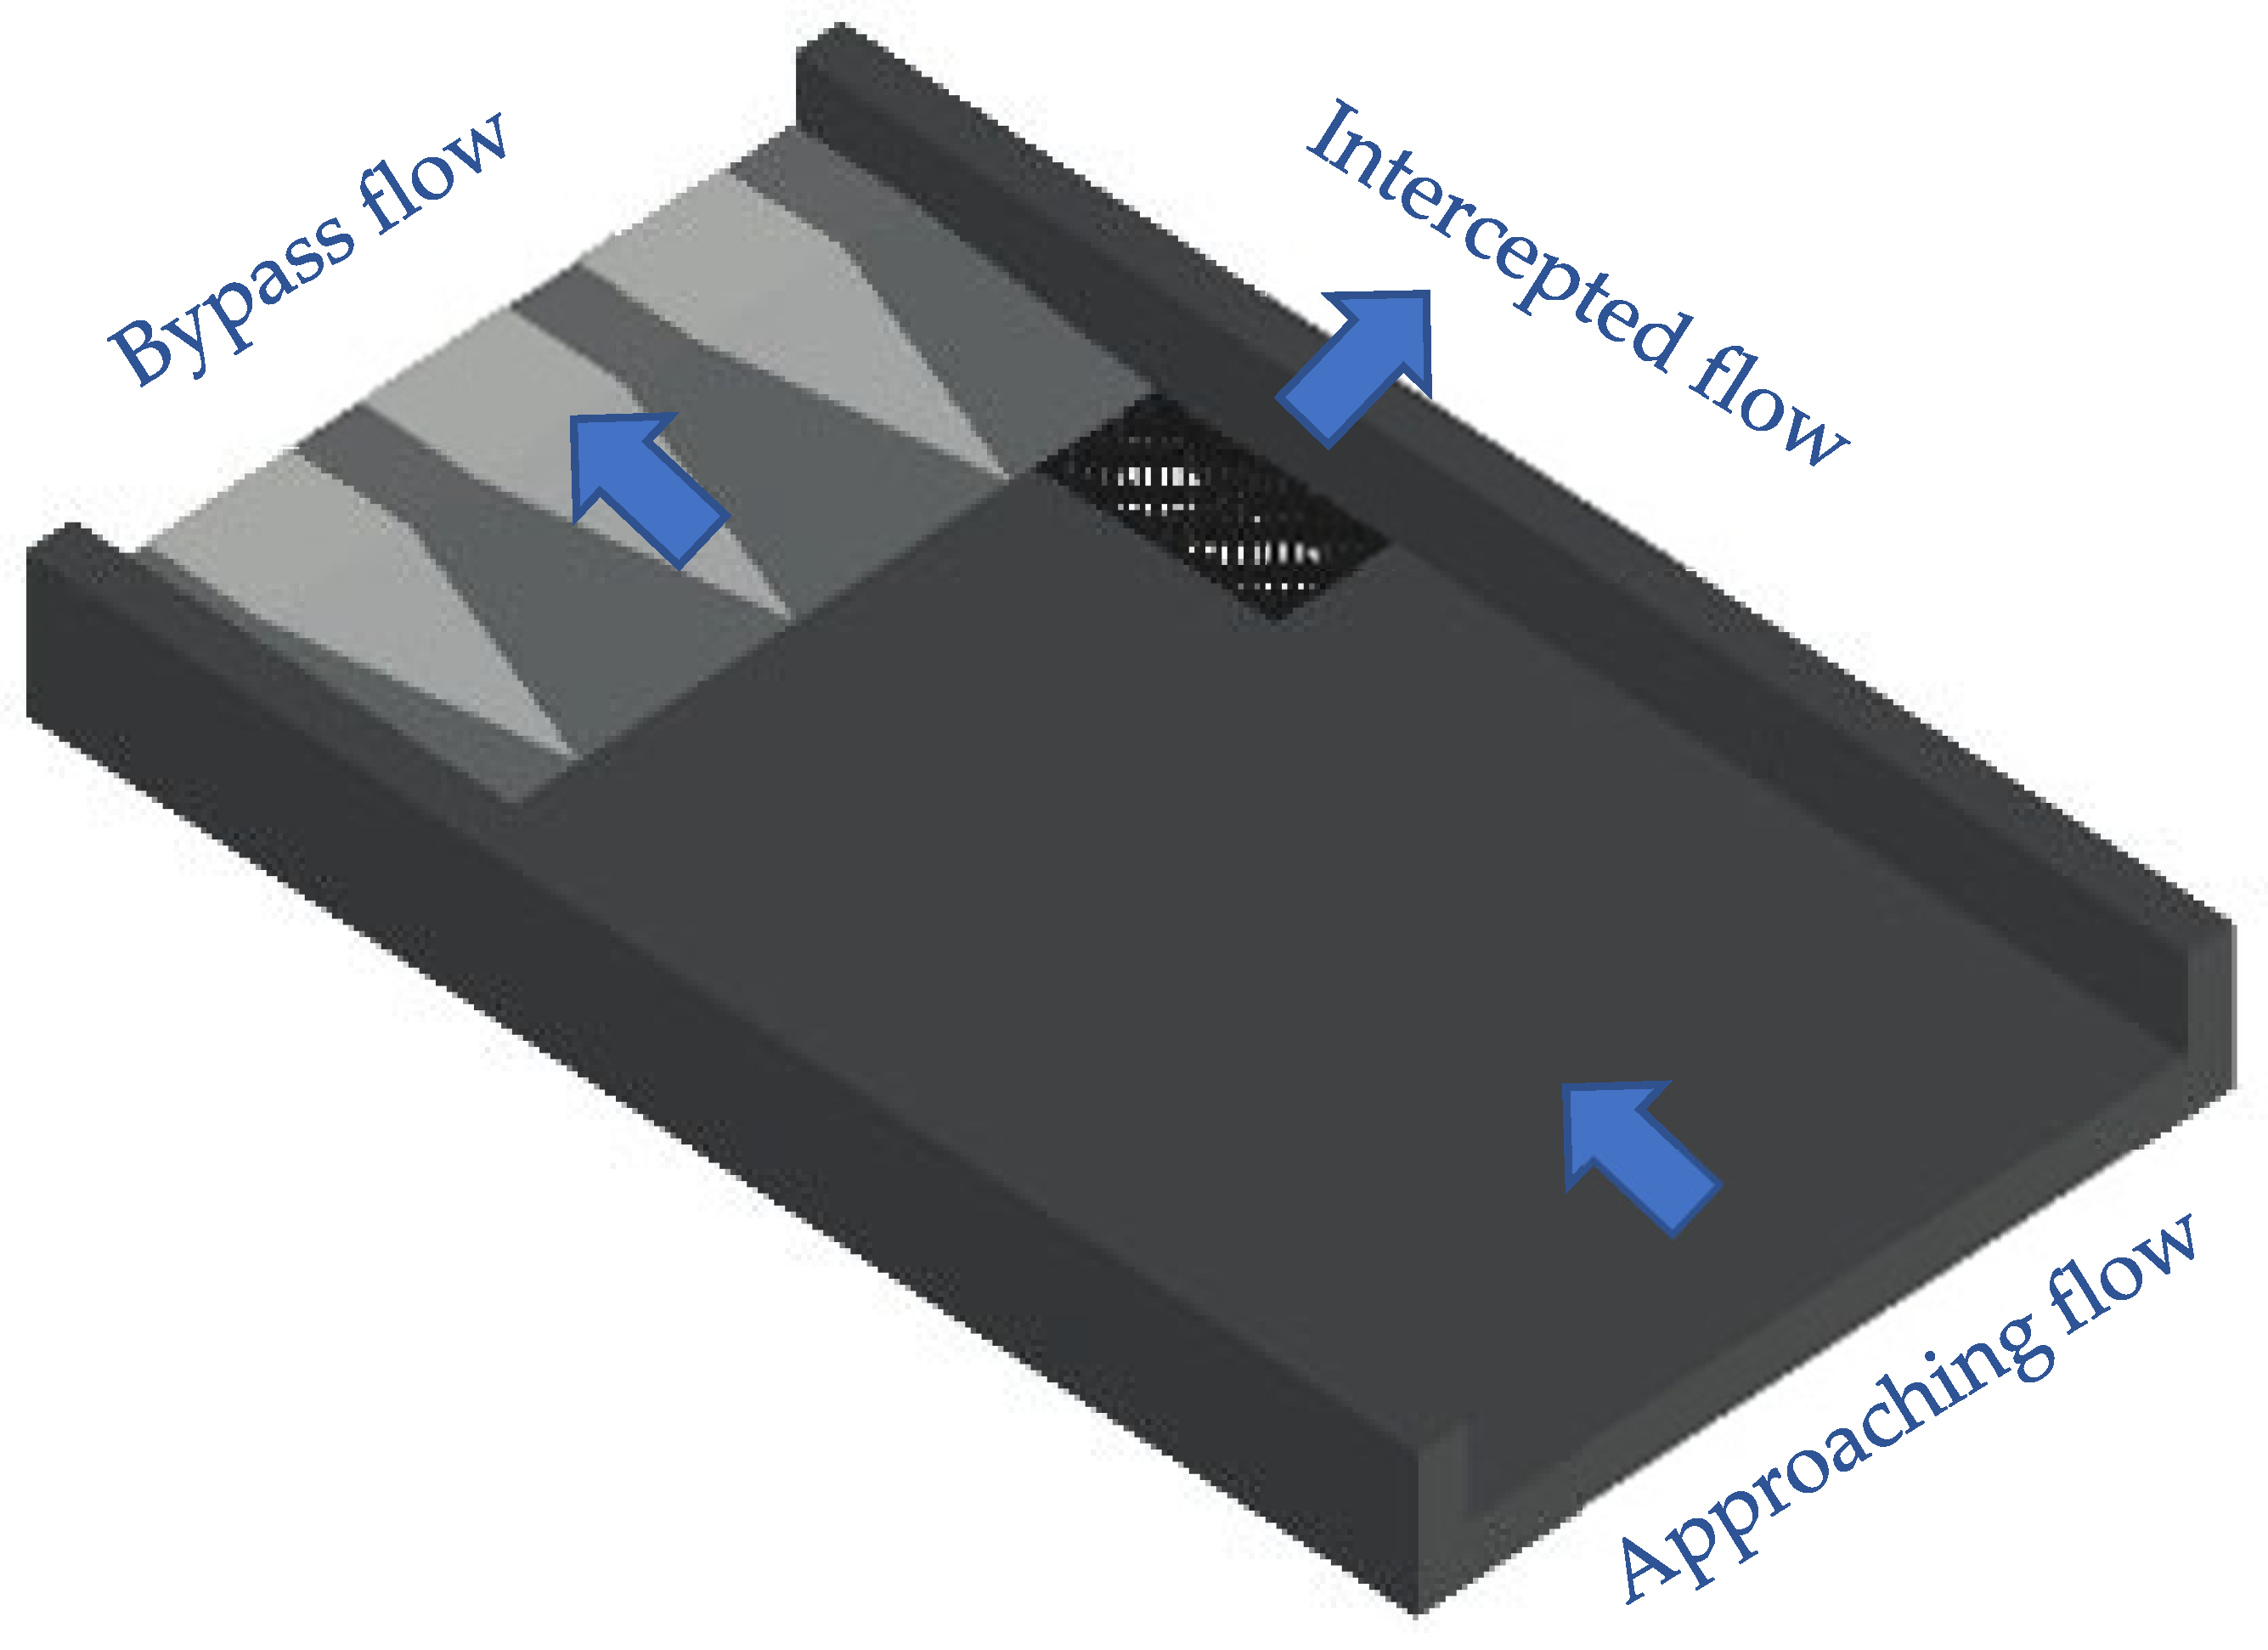
The results of the experimental campaign focused on the comparison of the hydraulic efficiency of the grate inlets BCN1 and BCN10 in normal conditions (without a speed bump) and with two different types of speed bumps, for both situations, as an isolated inlet in the curb and as a continuous transverse grate perpendicular to the main flow direction (
Figure 8). This comparative analysis aims to assess how the inclusion of speed bumps affects the hydraulic efficiency of grated inlets under various flow rates and slope conditions.
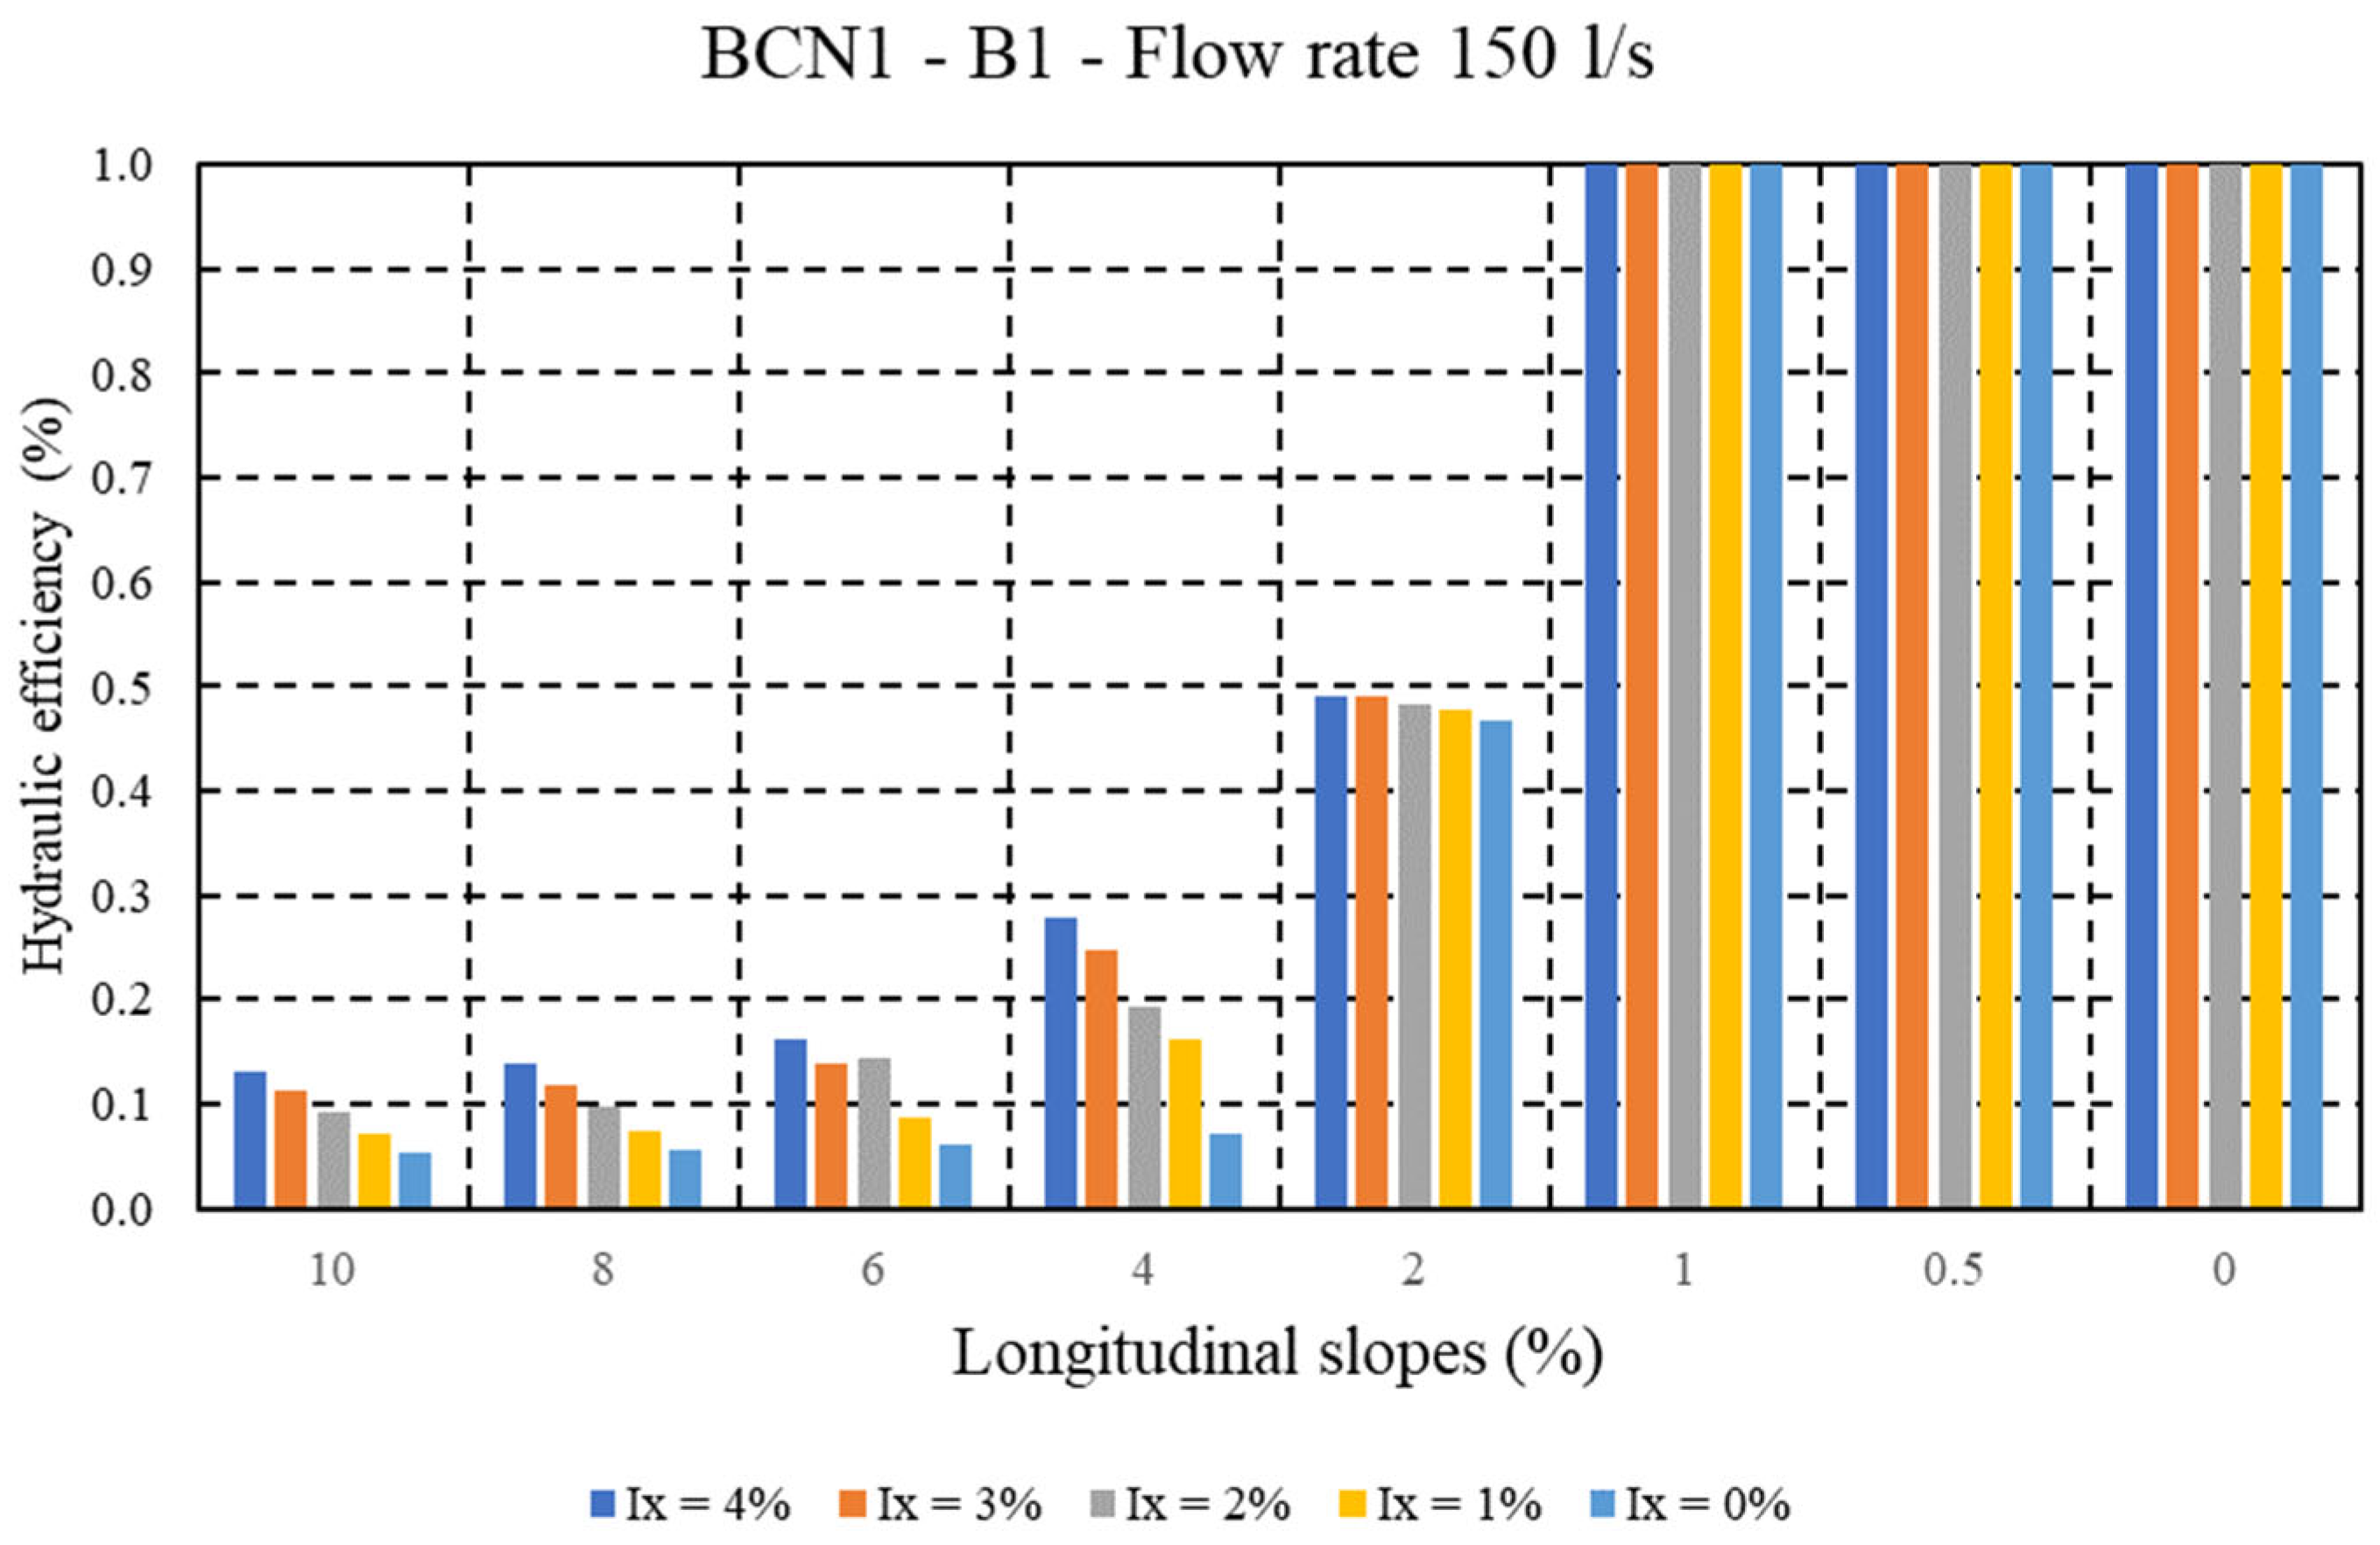
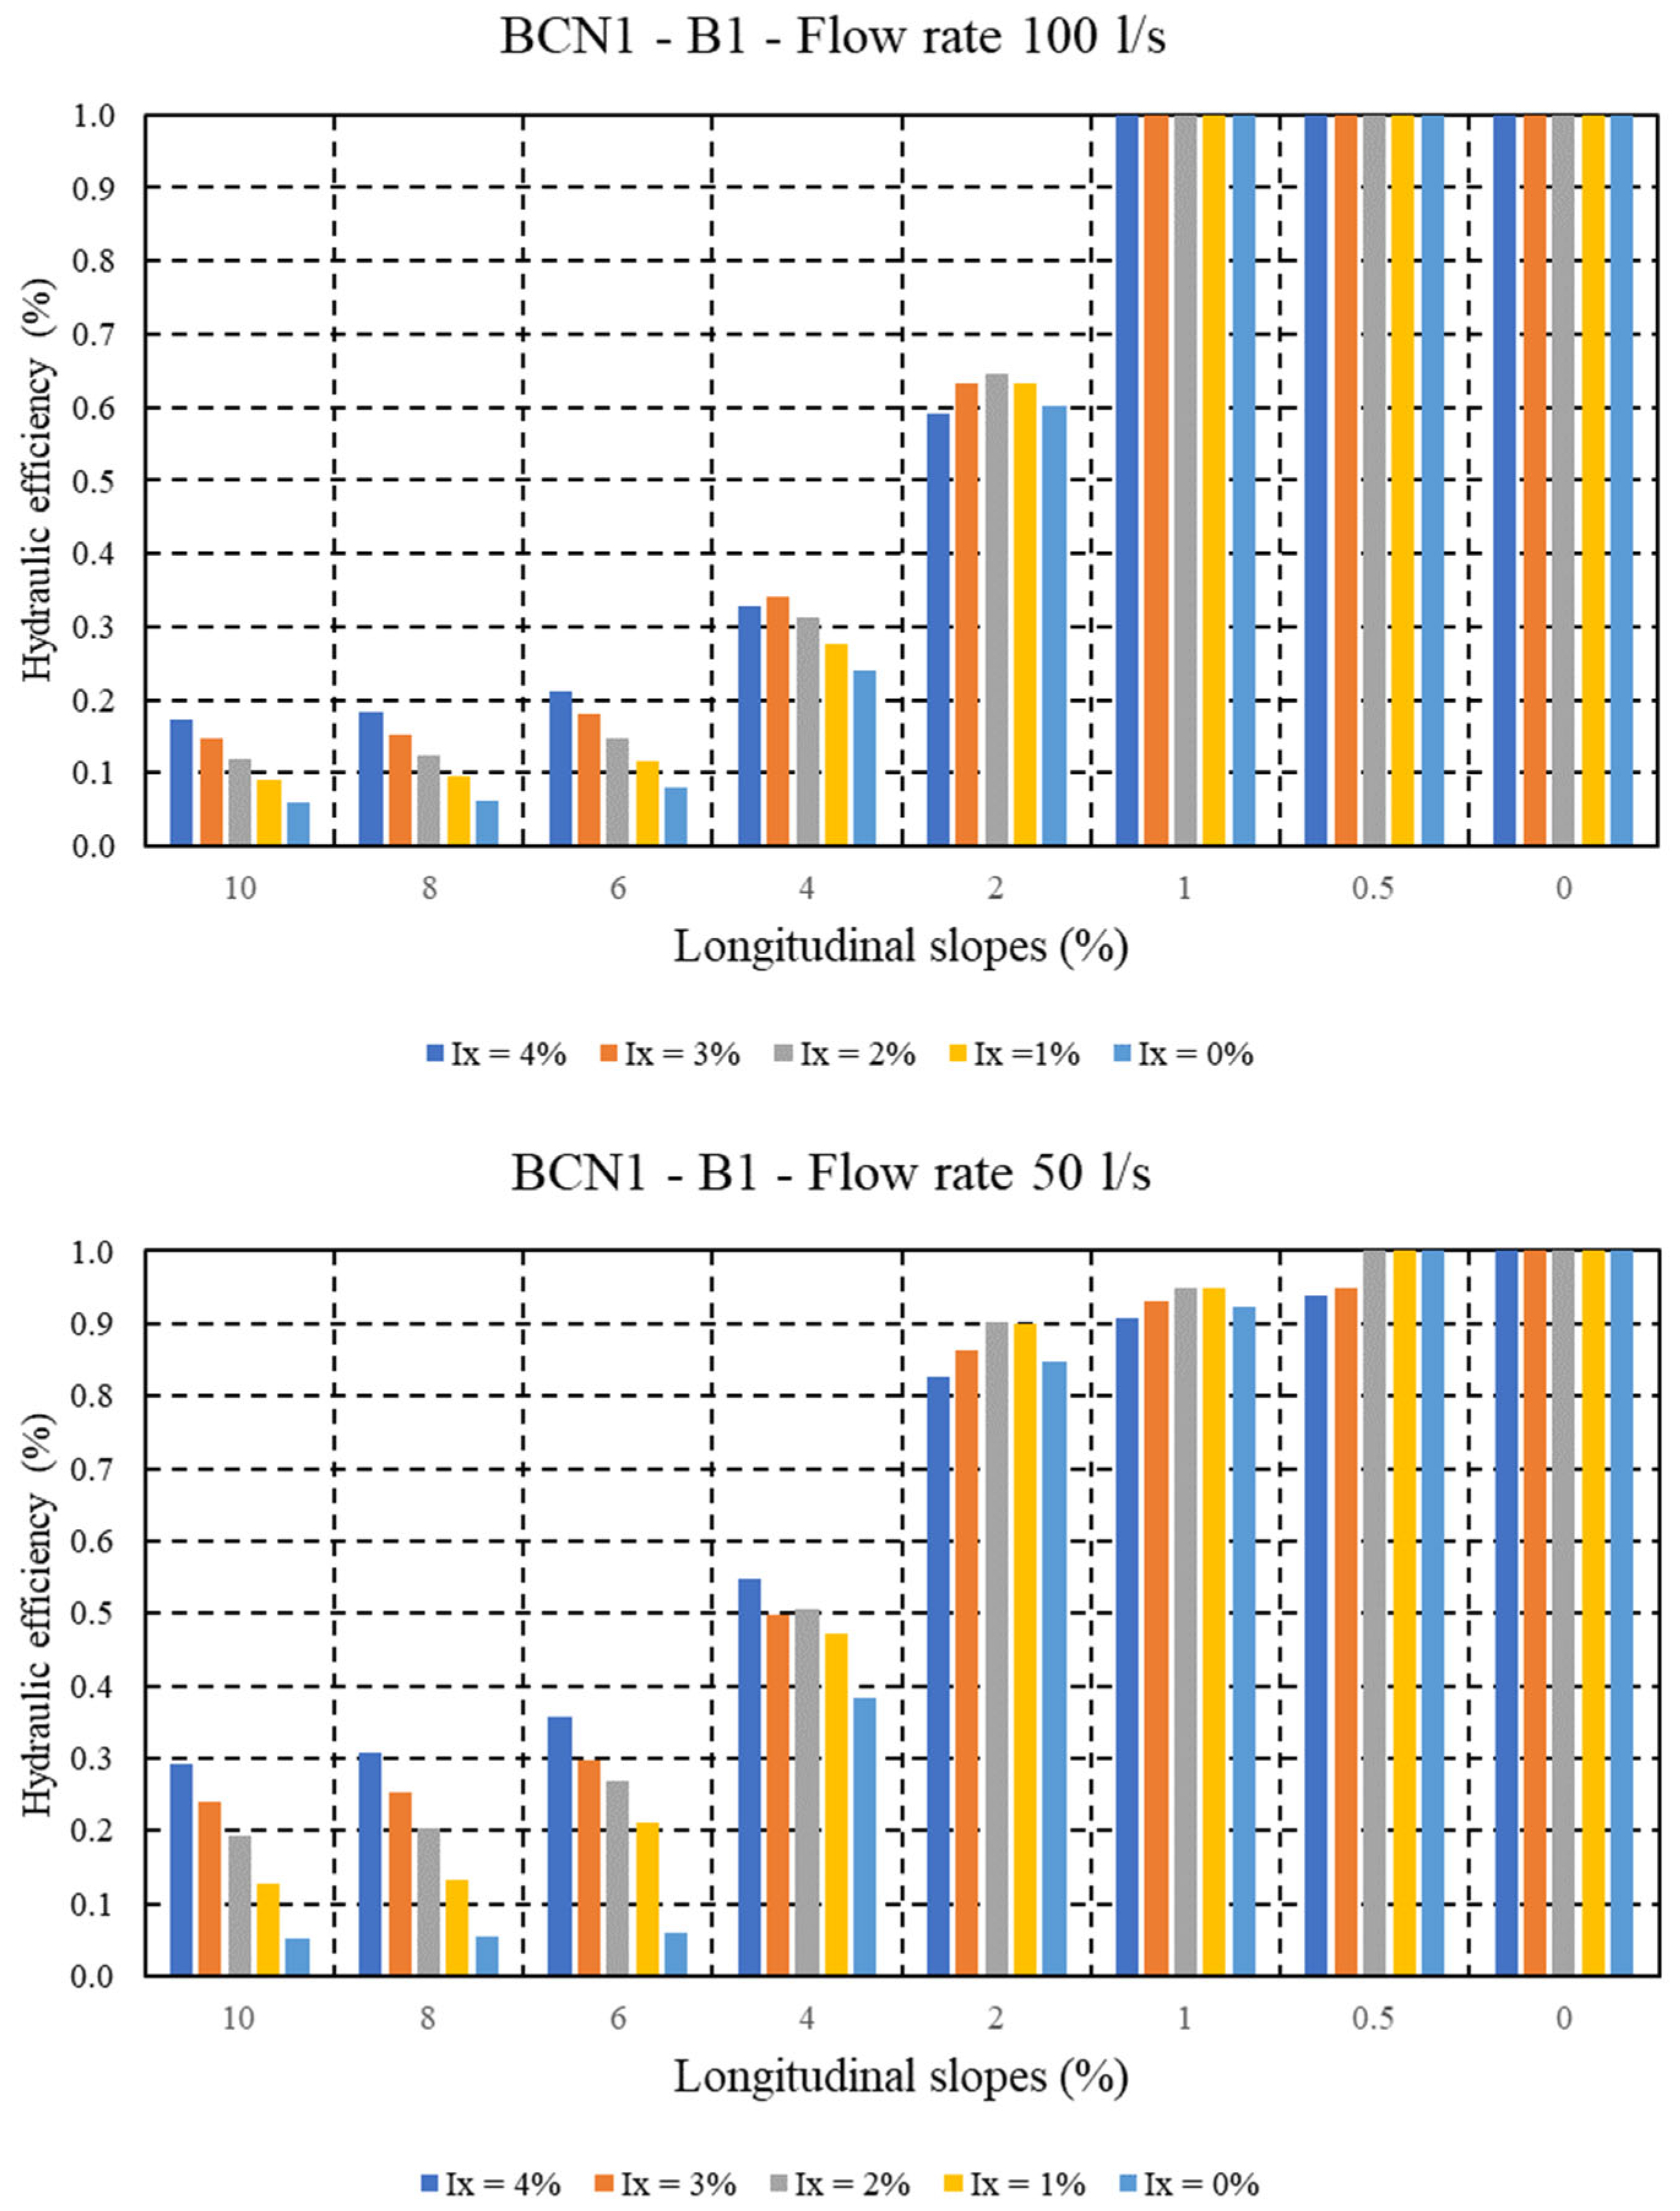
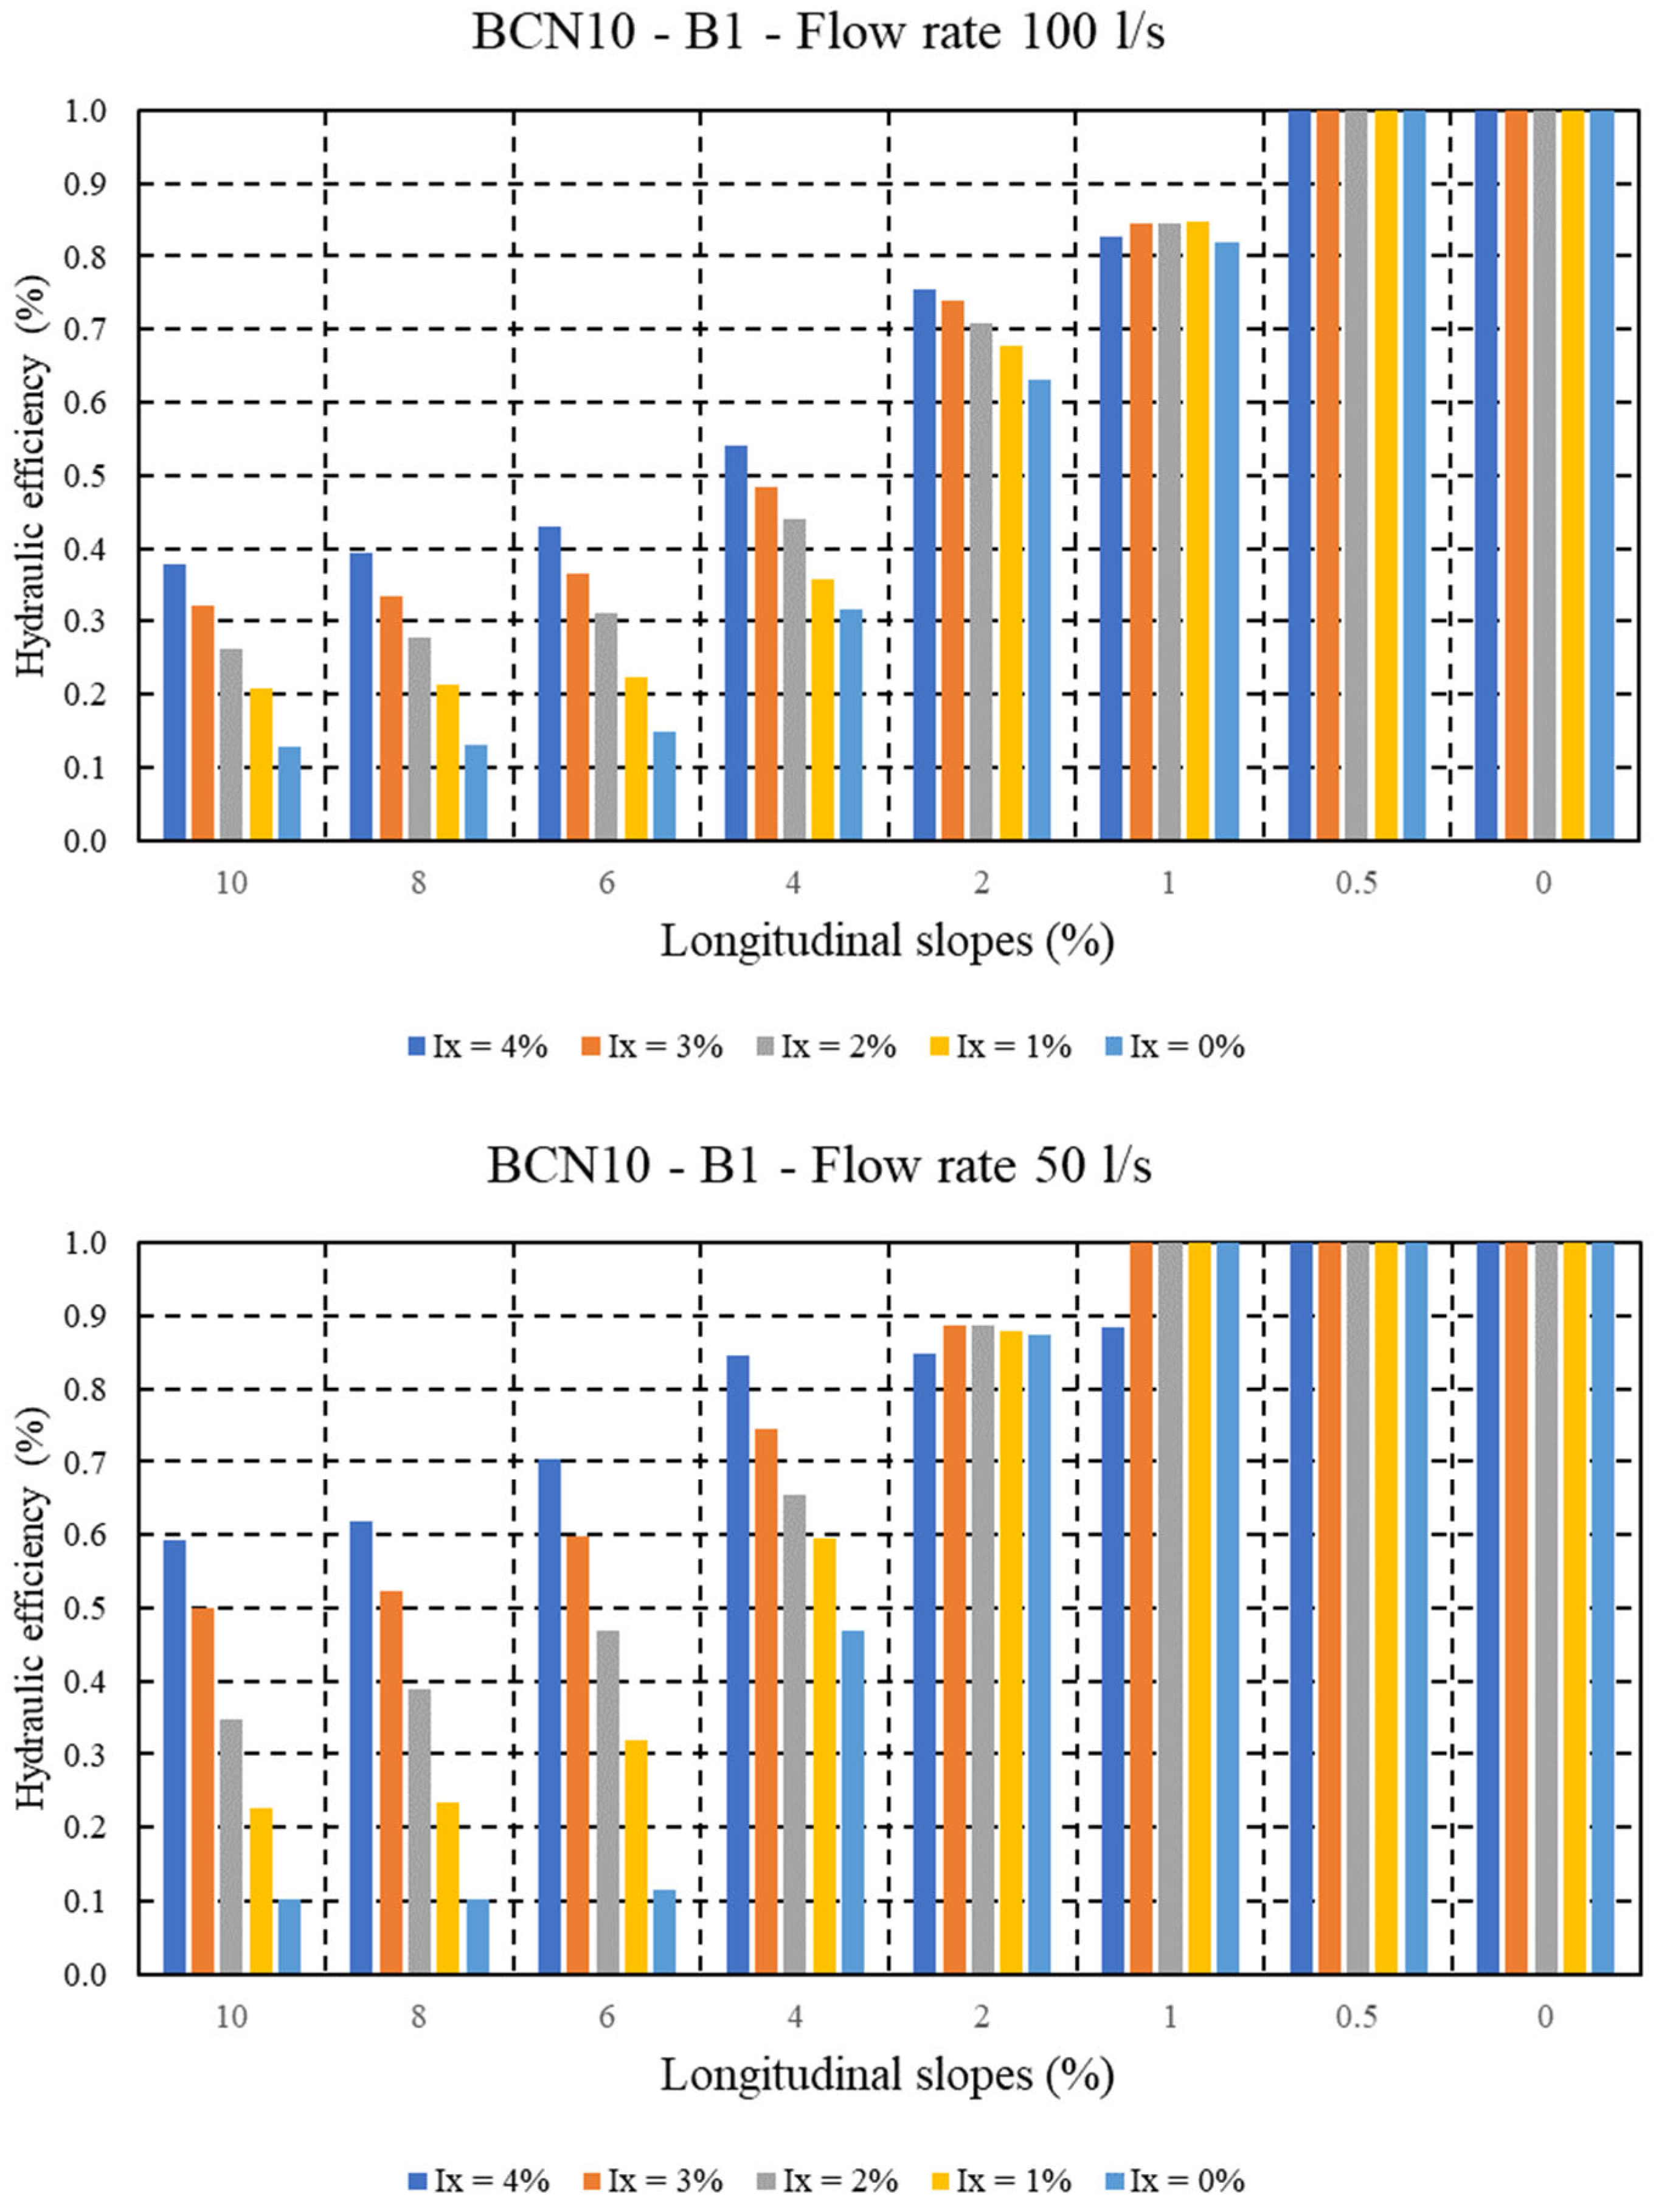
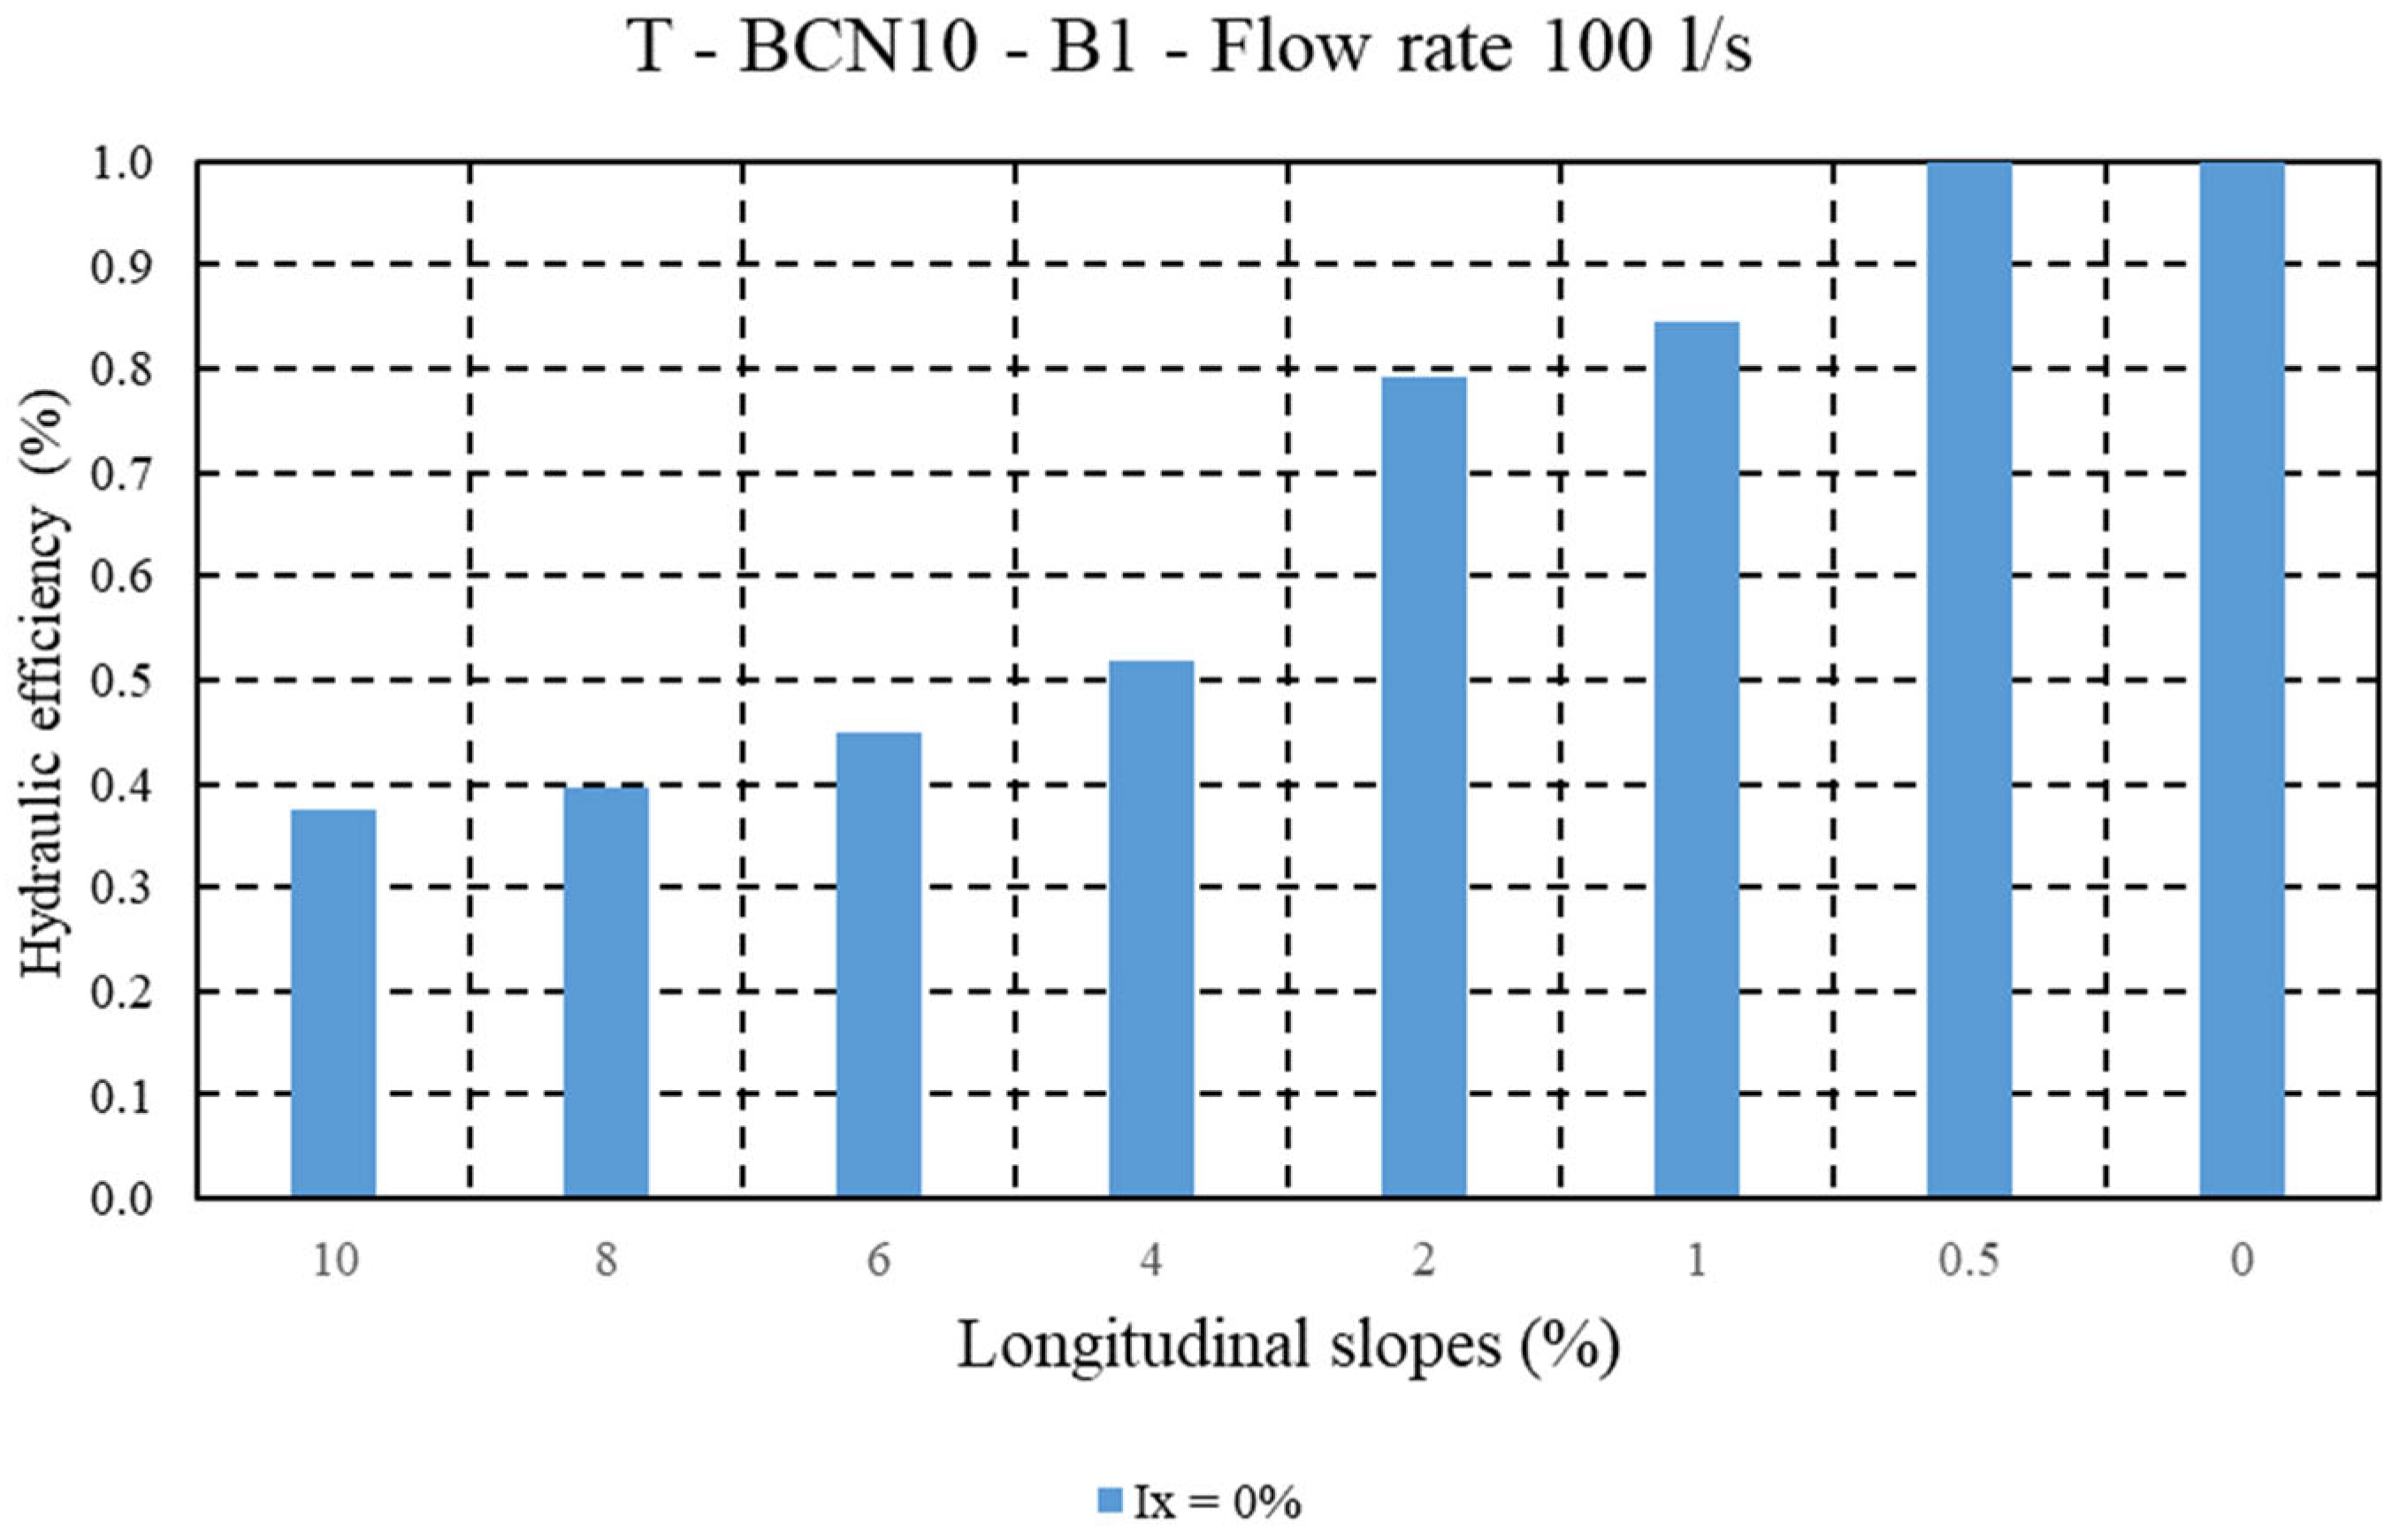
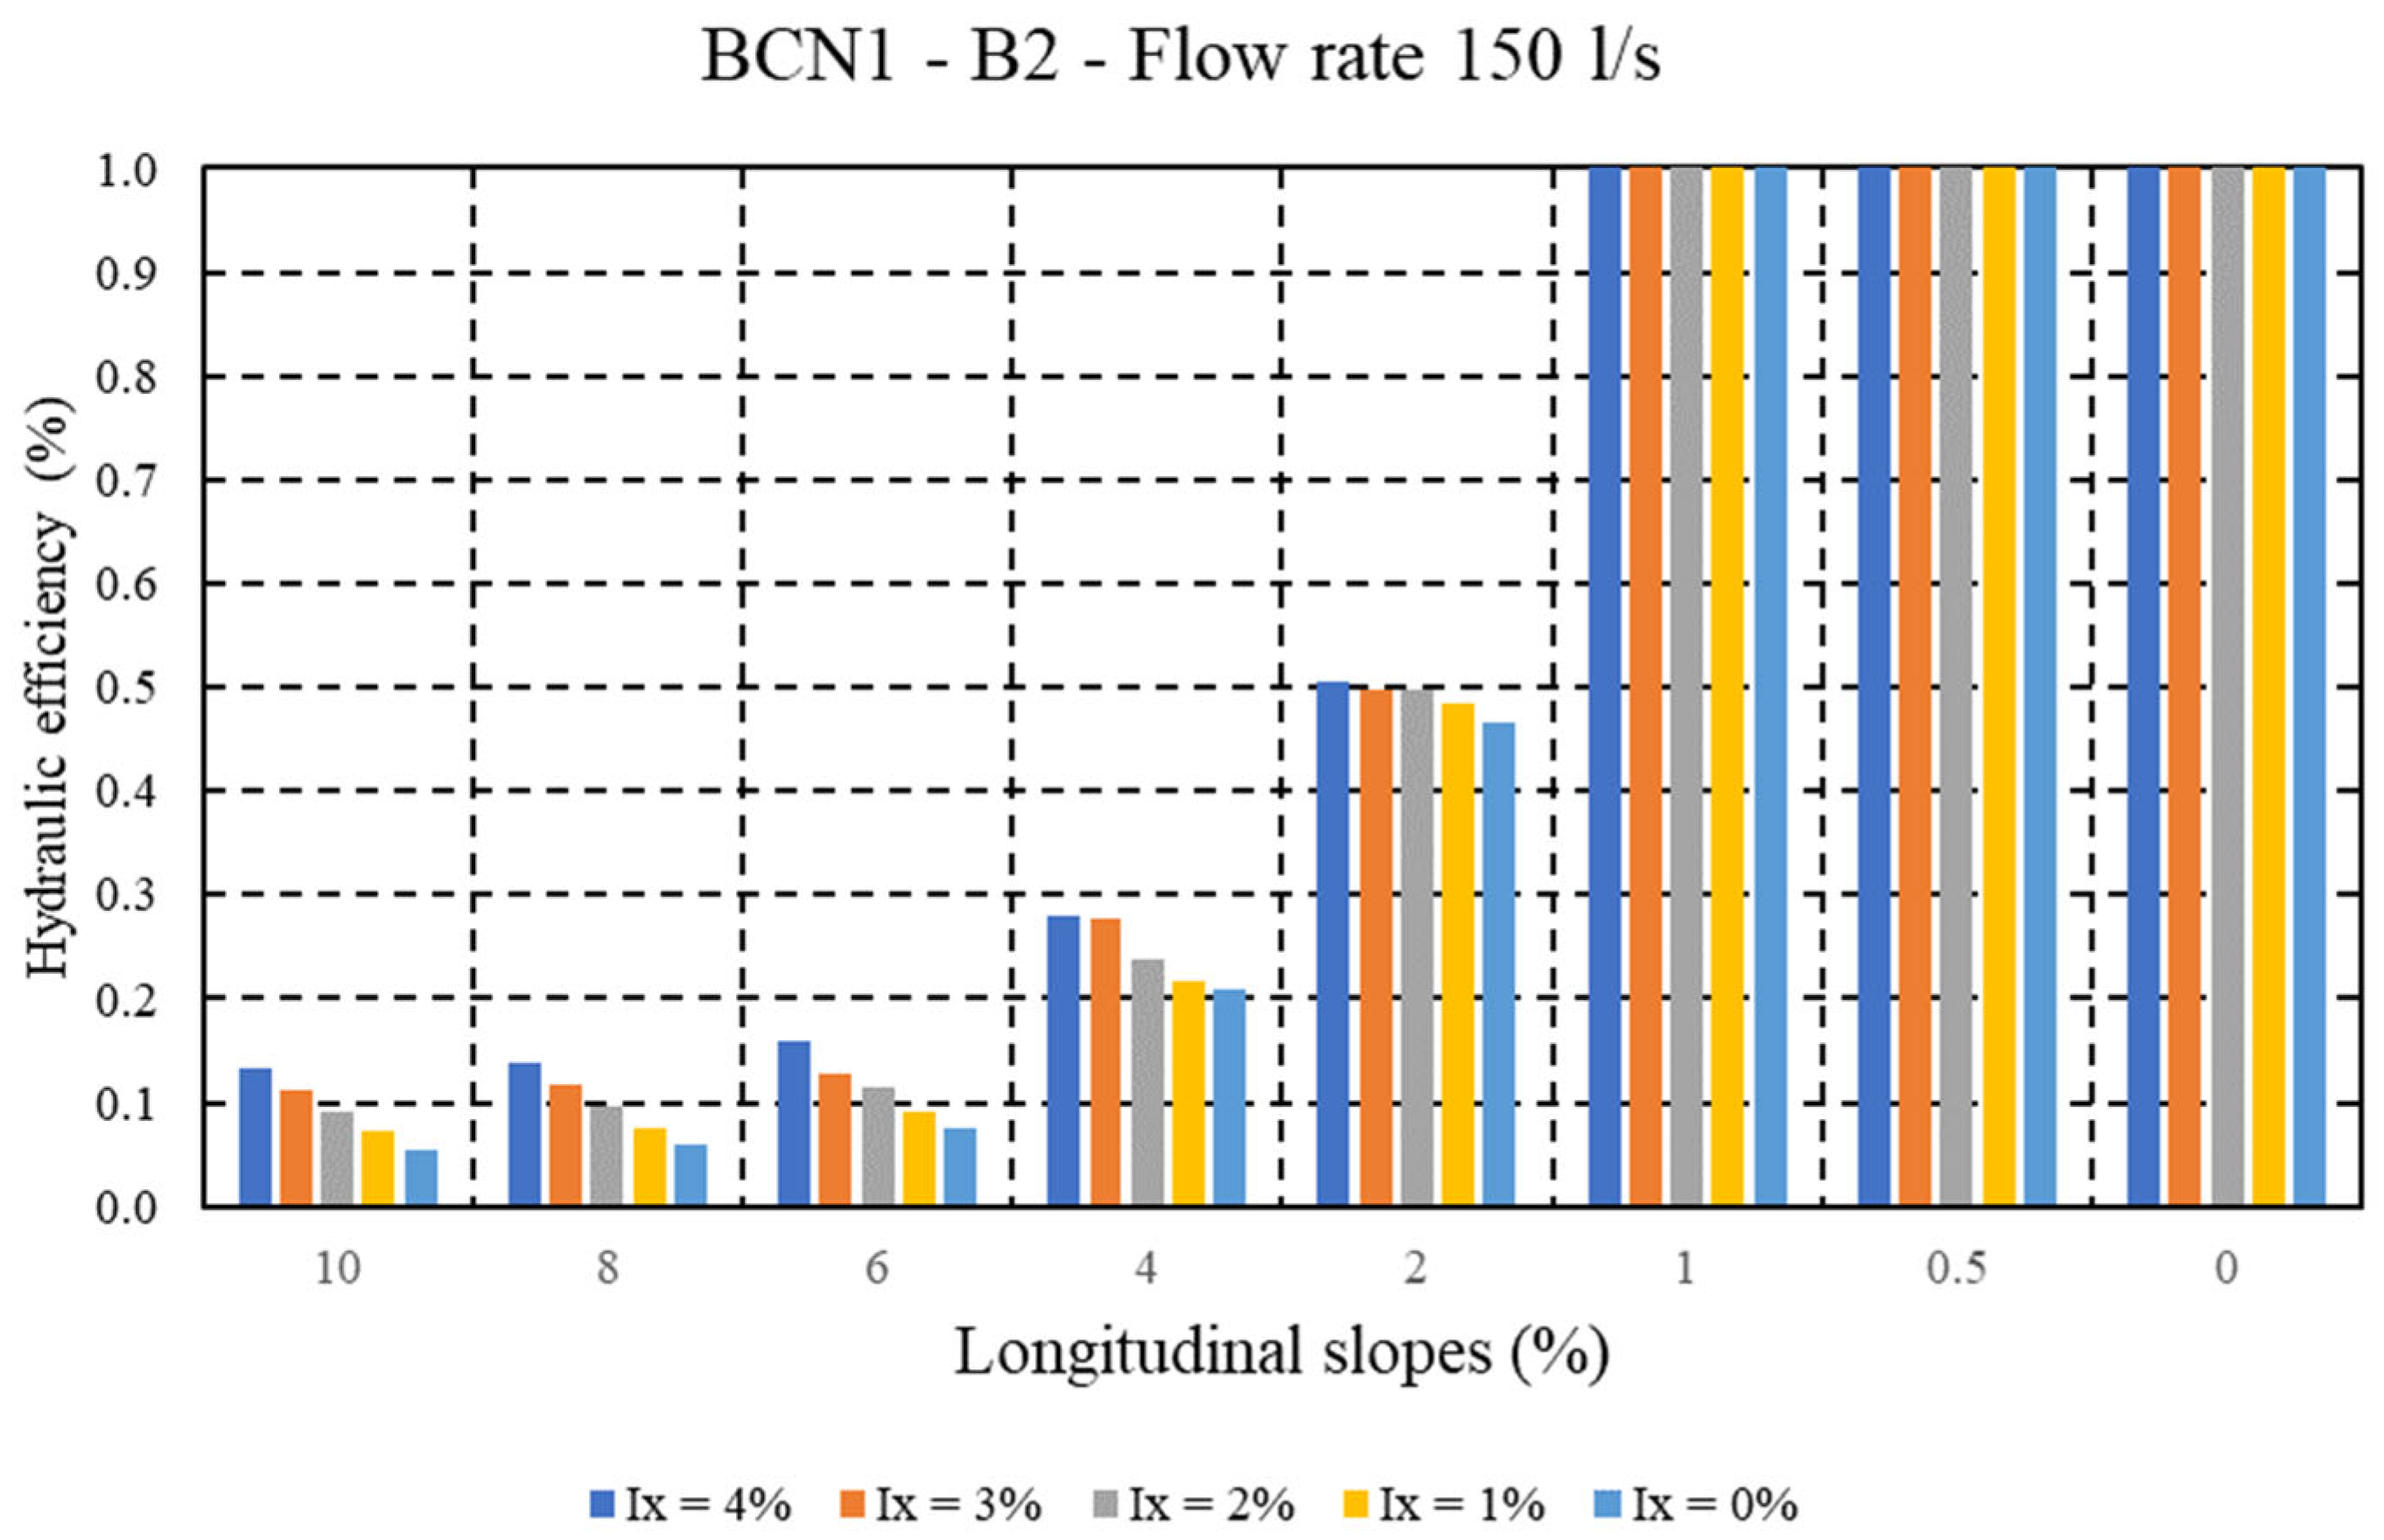
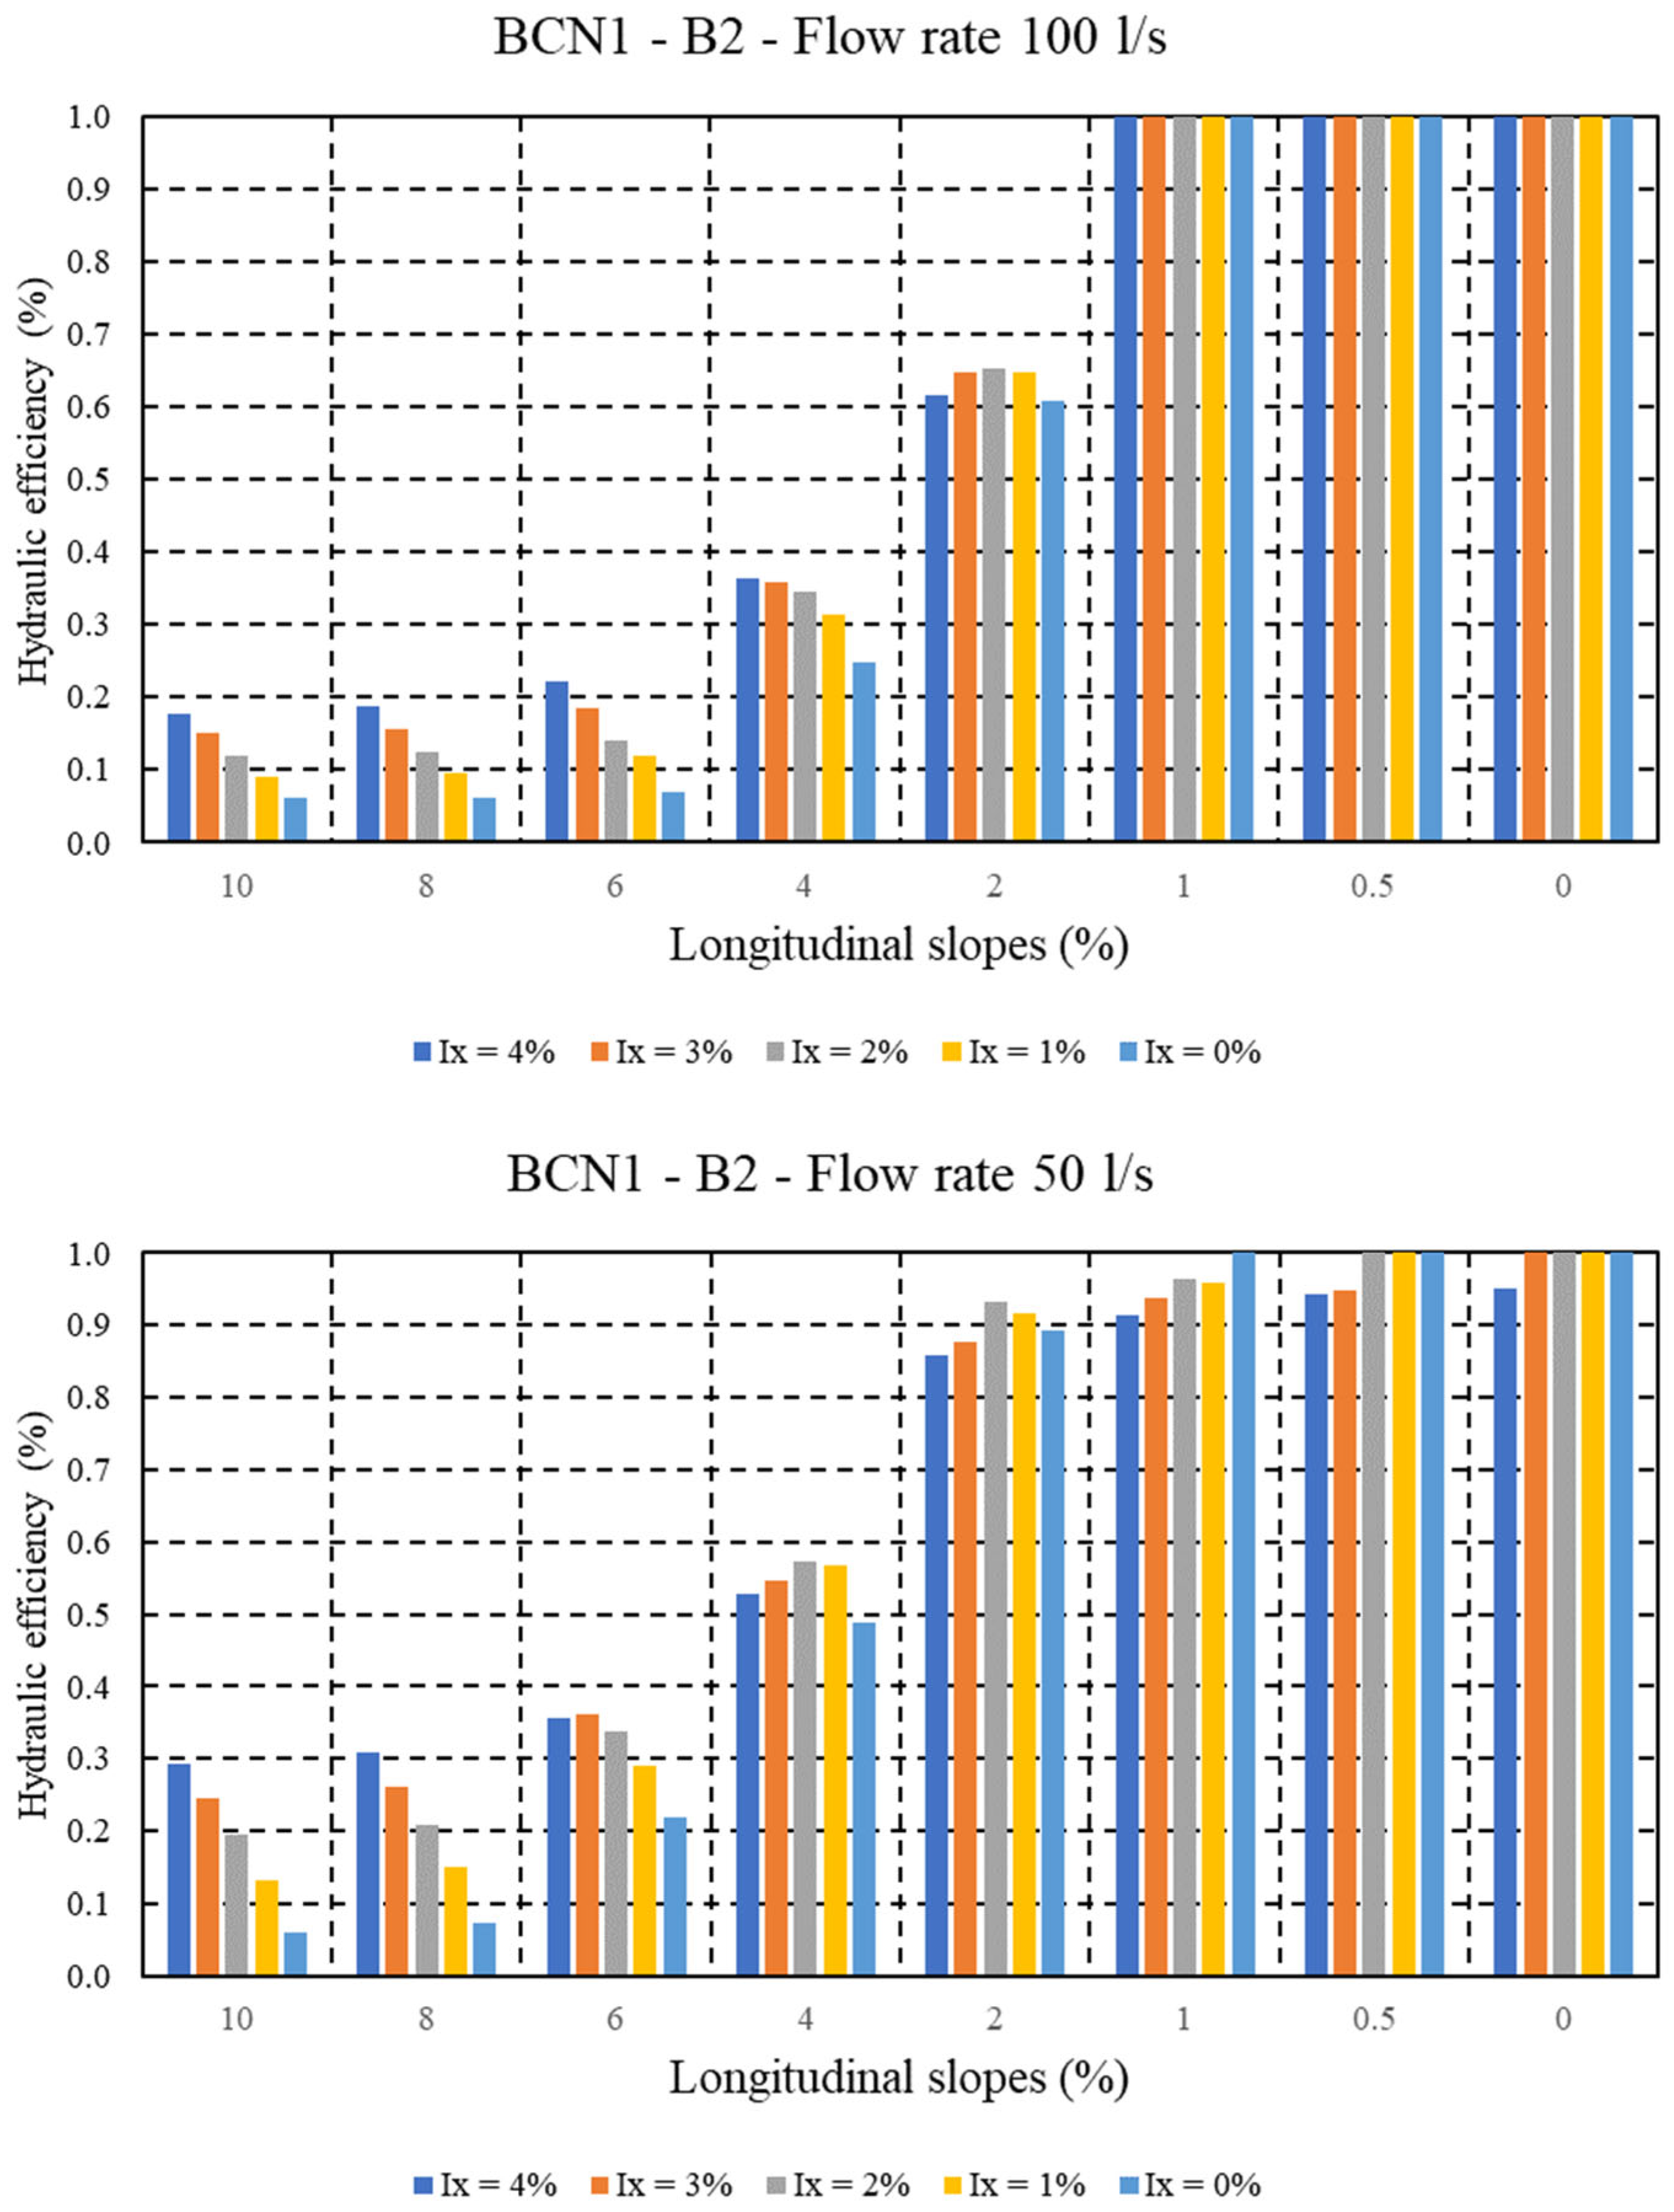
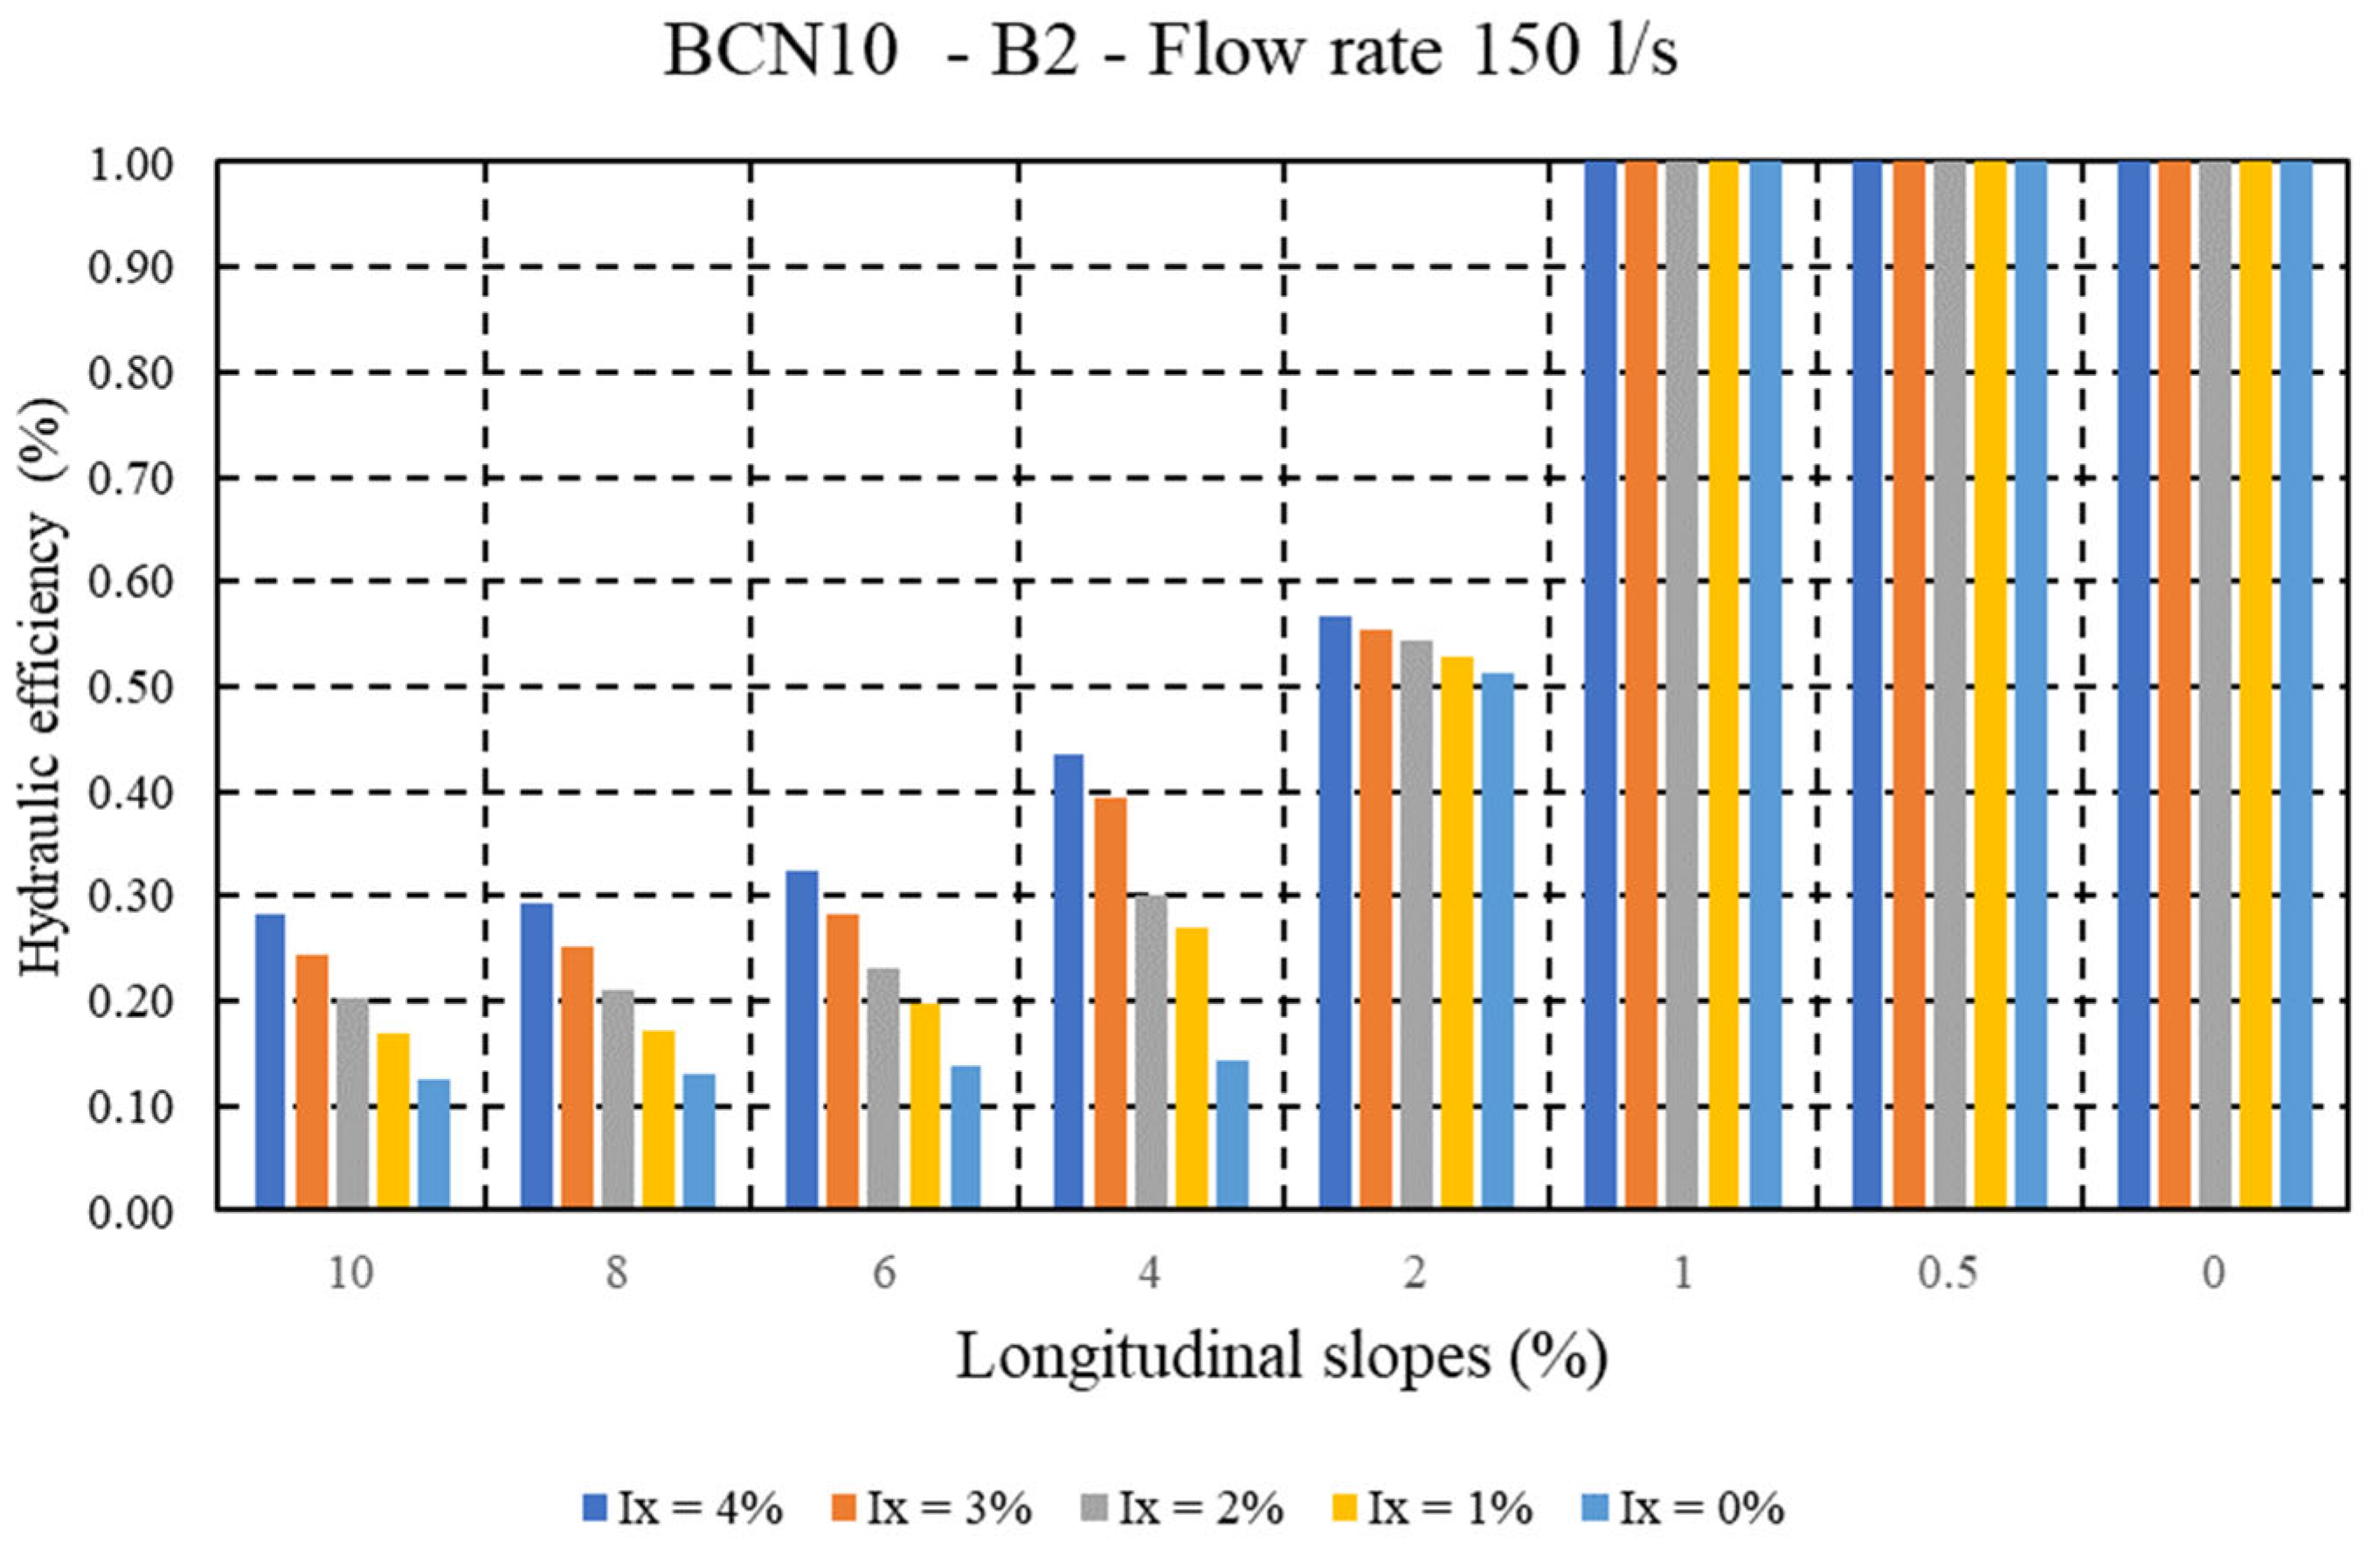
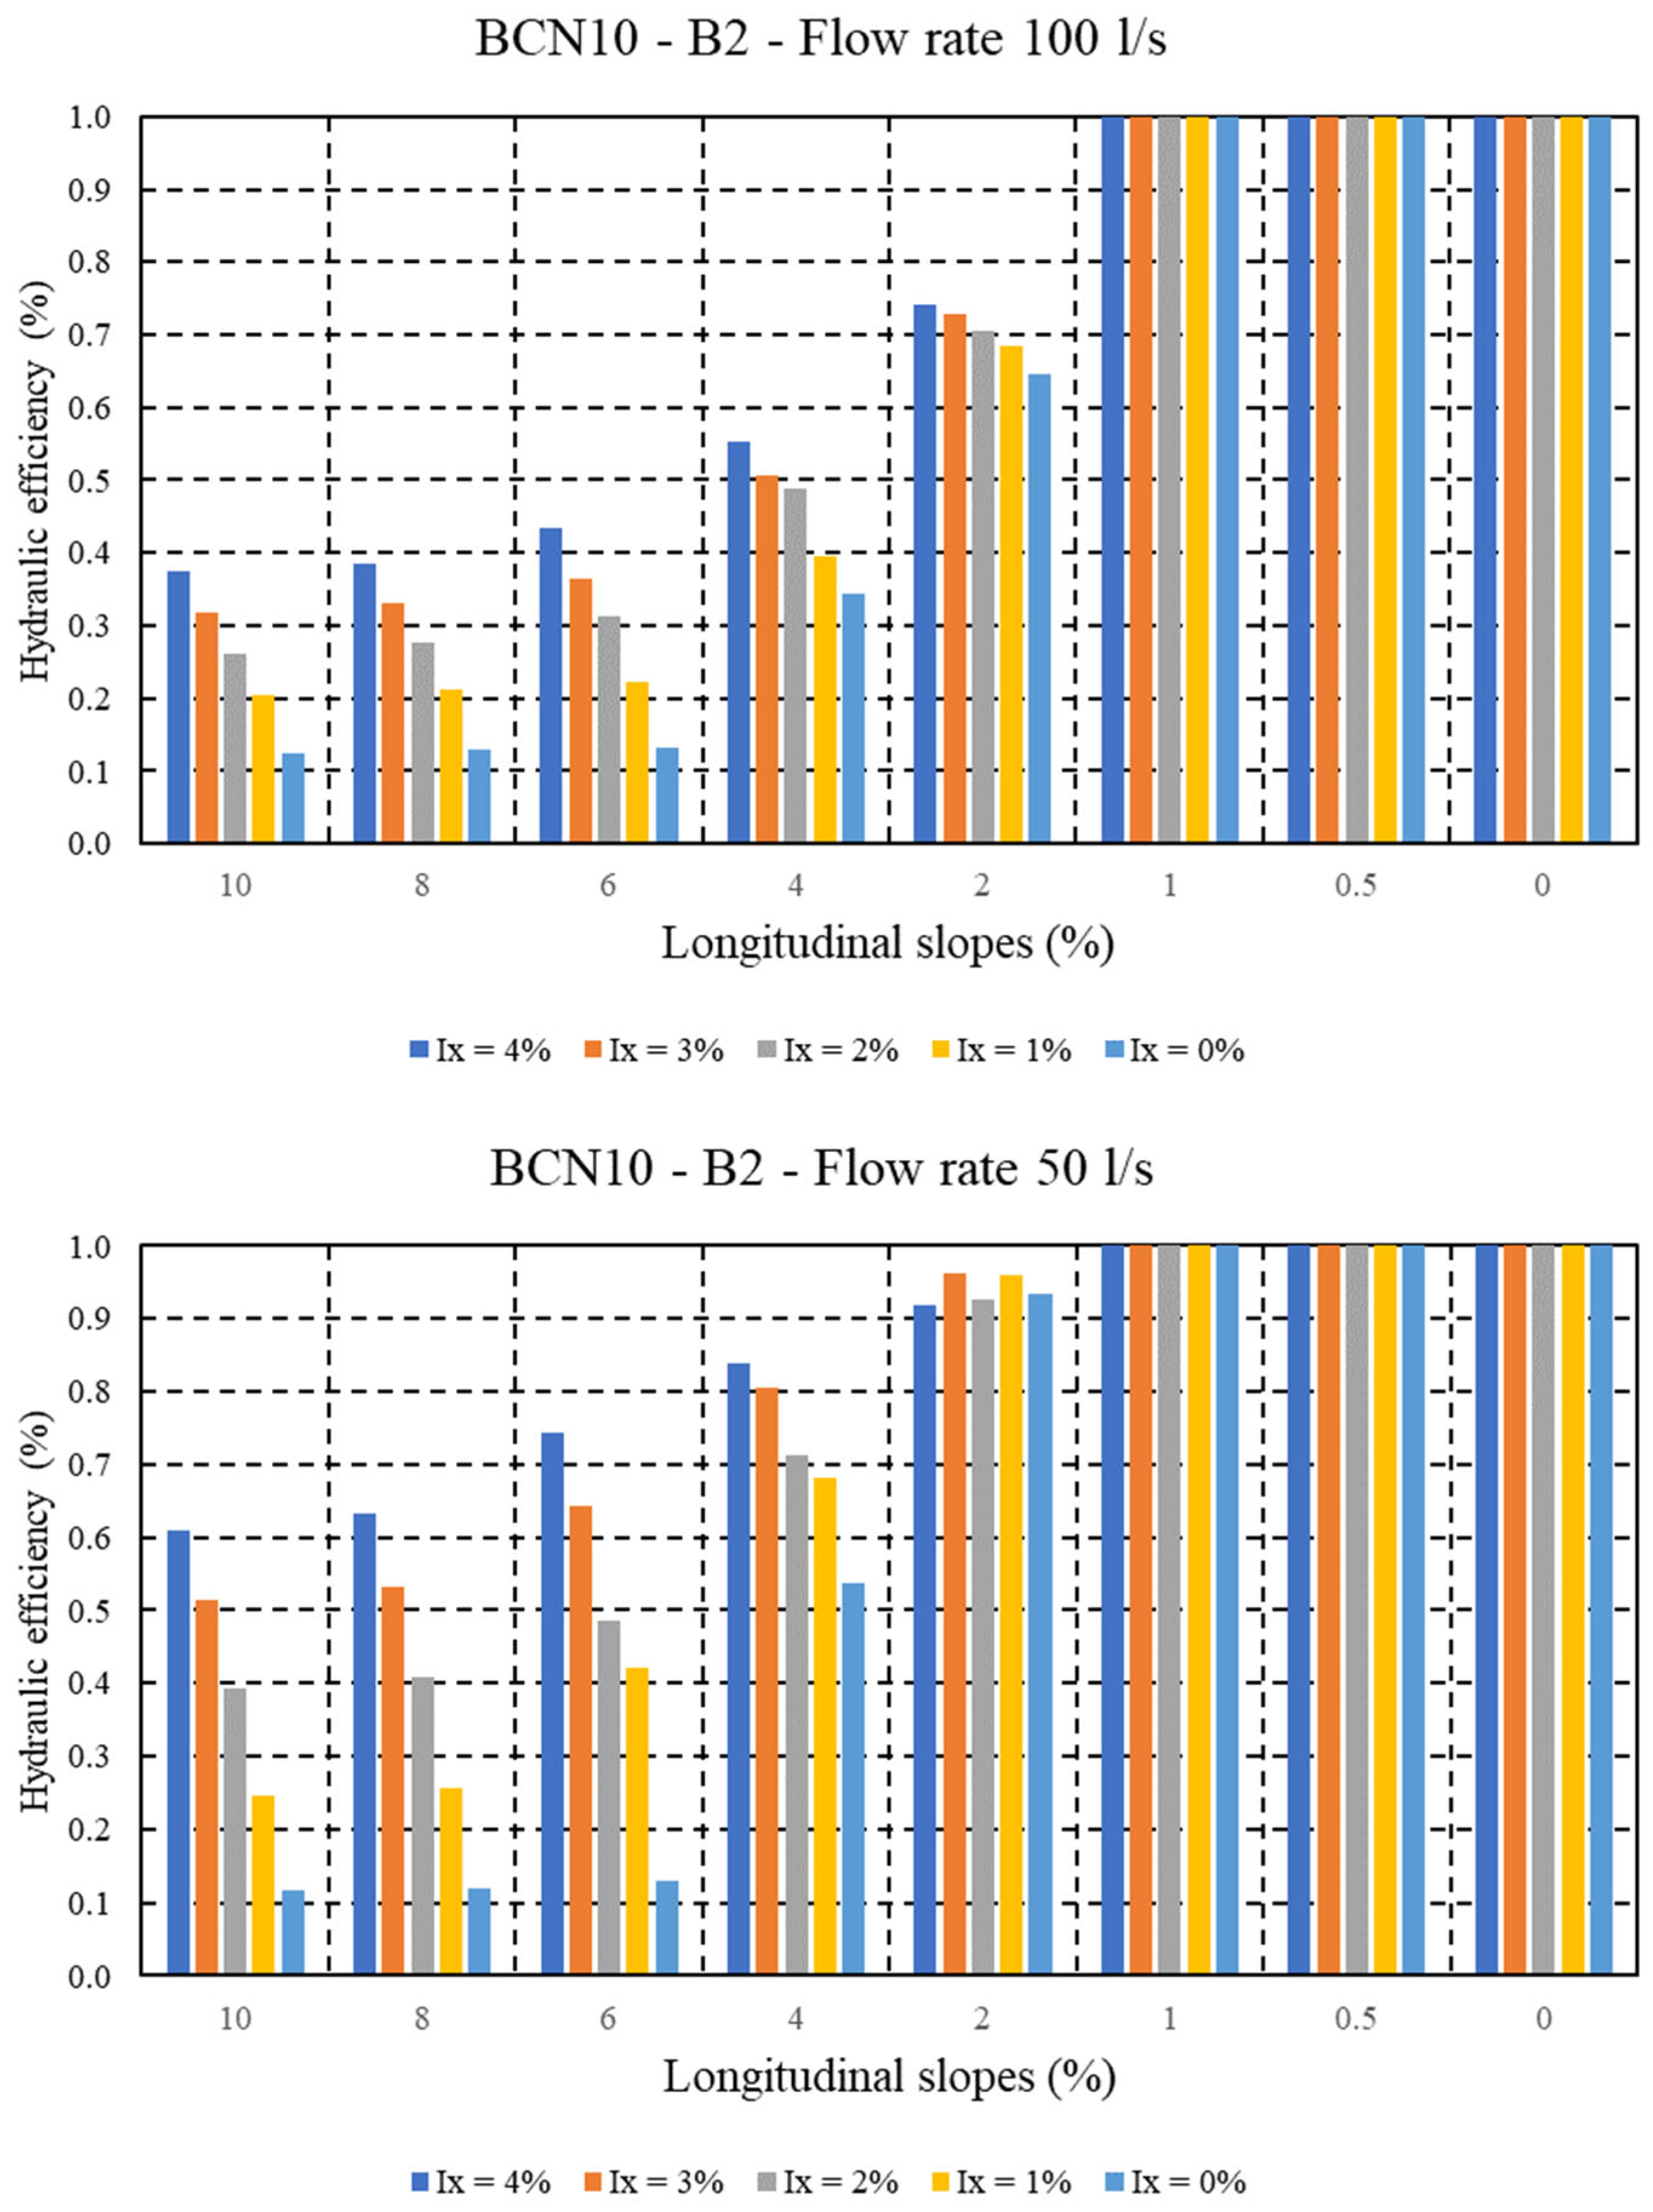
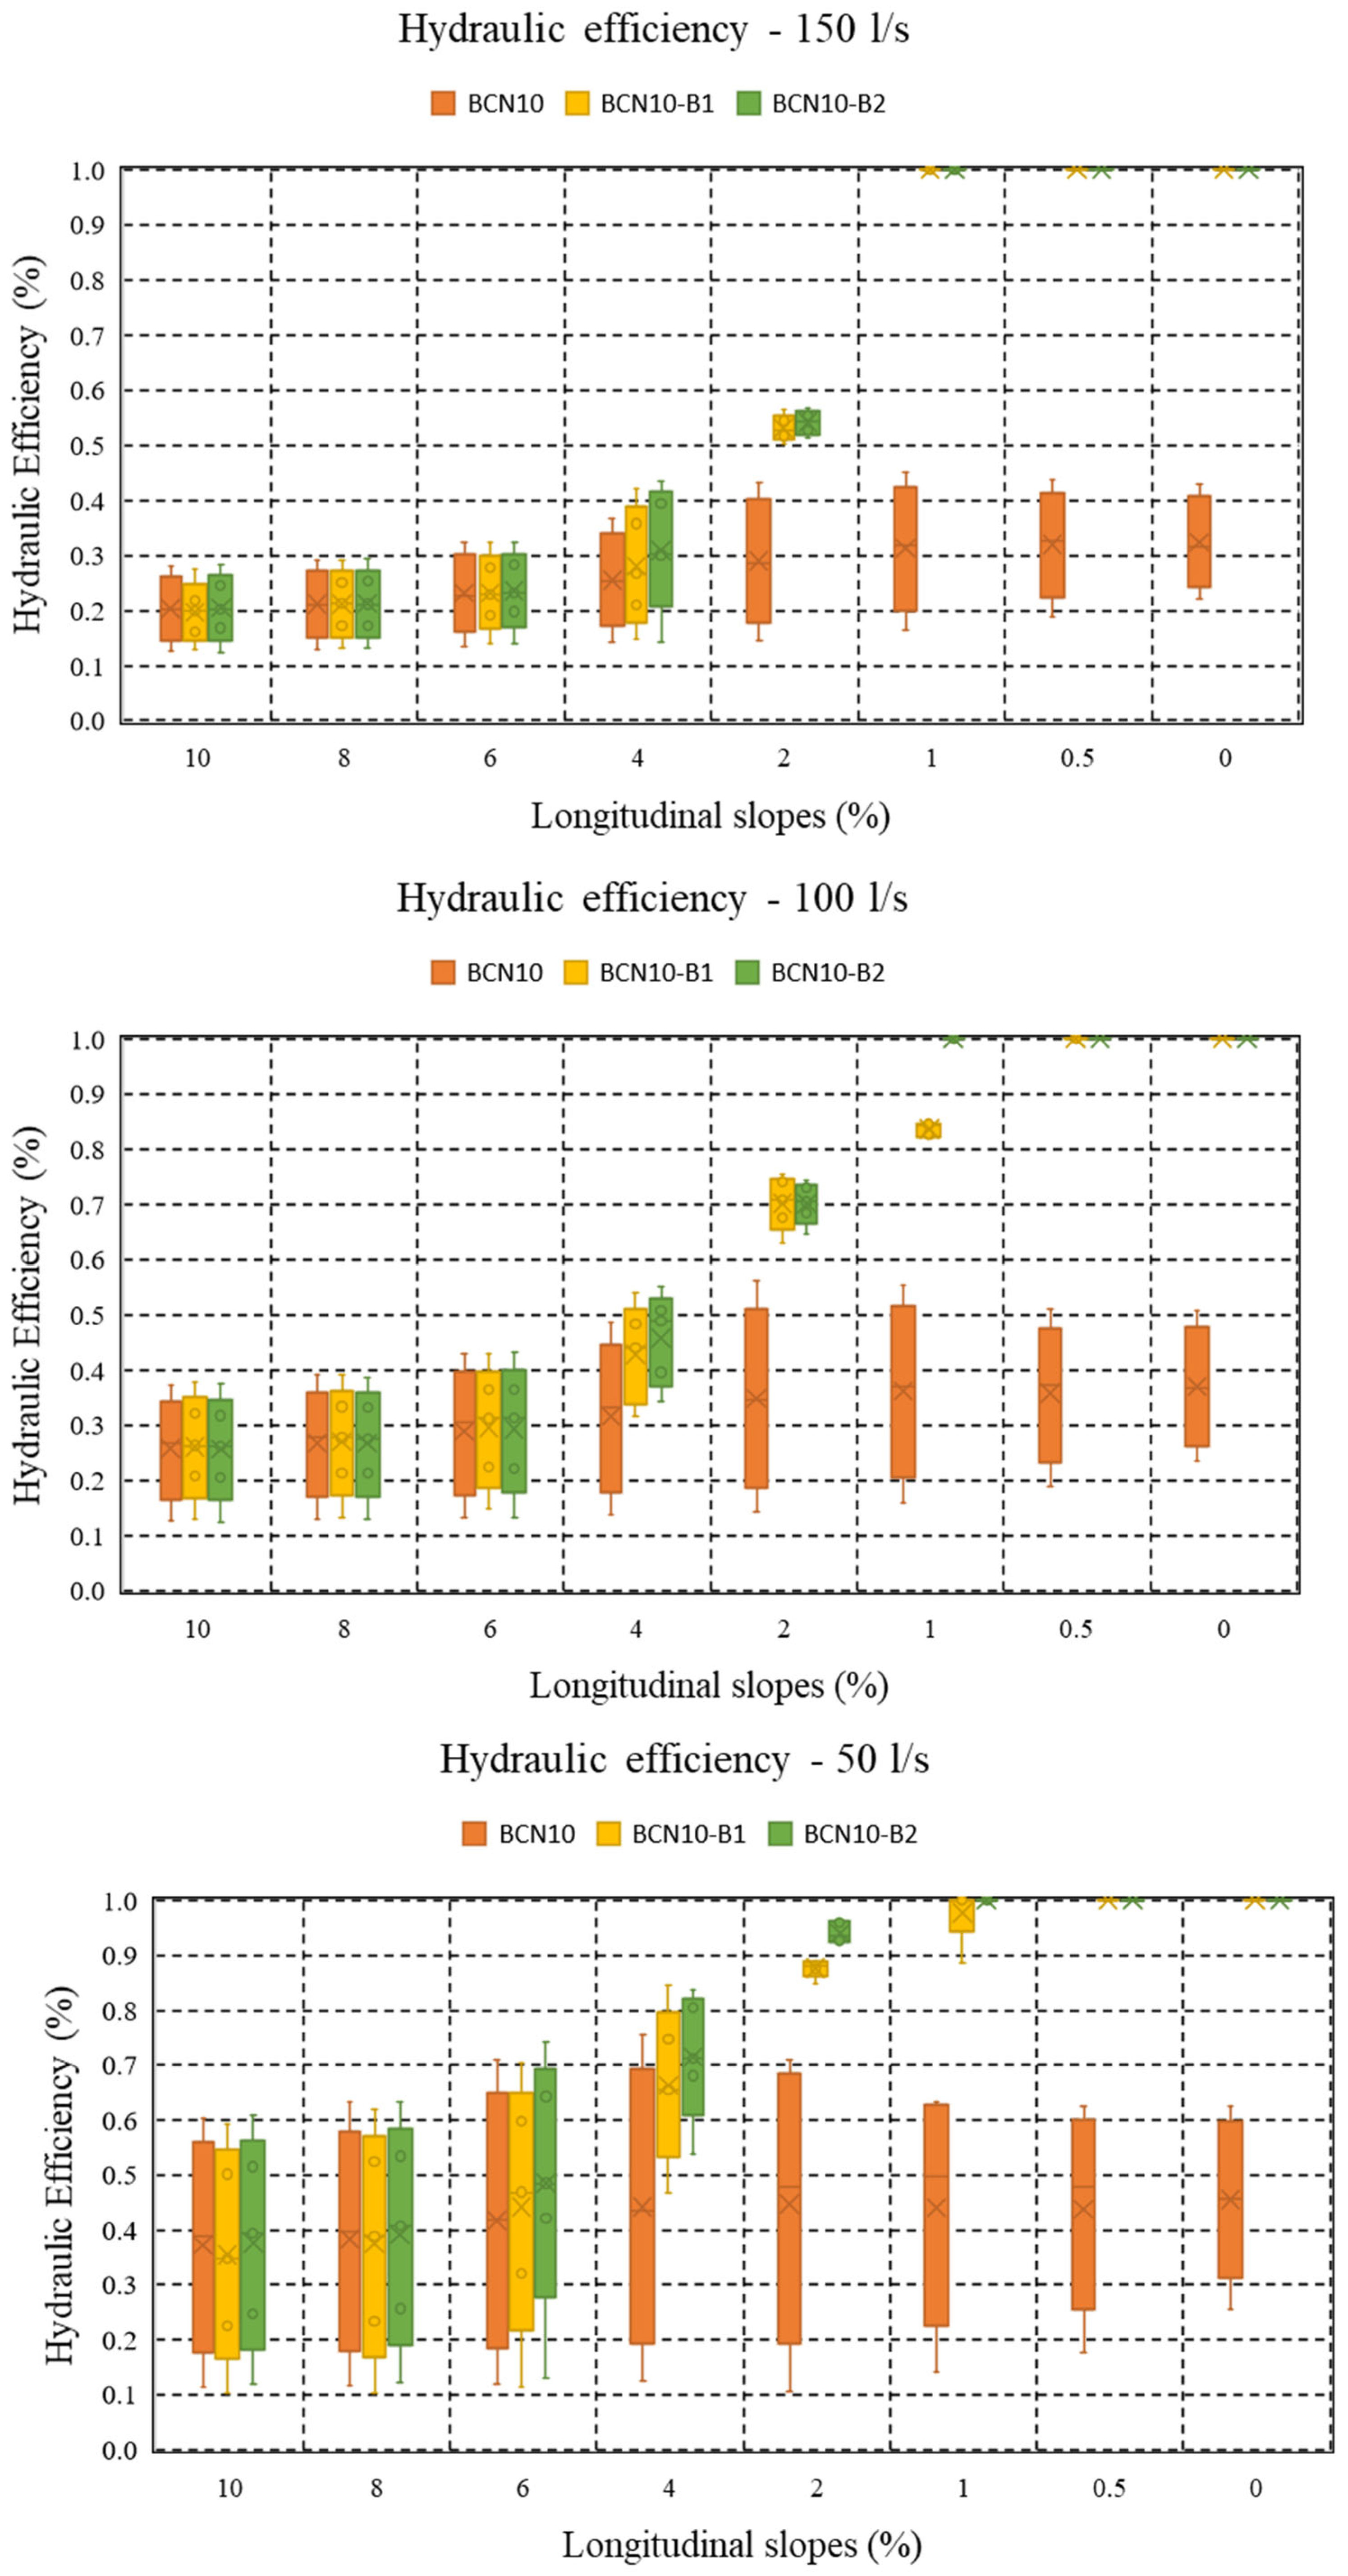
The experimental results, summarized in the following box plot charts (including results in terms of hydraulic efficiency for all the tested geometric conditions), indicate that significant increases in inlet hydraulic efficiency can be obtained through the location of a grated inlet immediately upstream of speed bumps in streets with low and medium longitudinal slopes (up to 4%), while no improvement was observed for higher slopes (i.e., 8 and 10%).
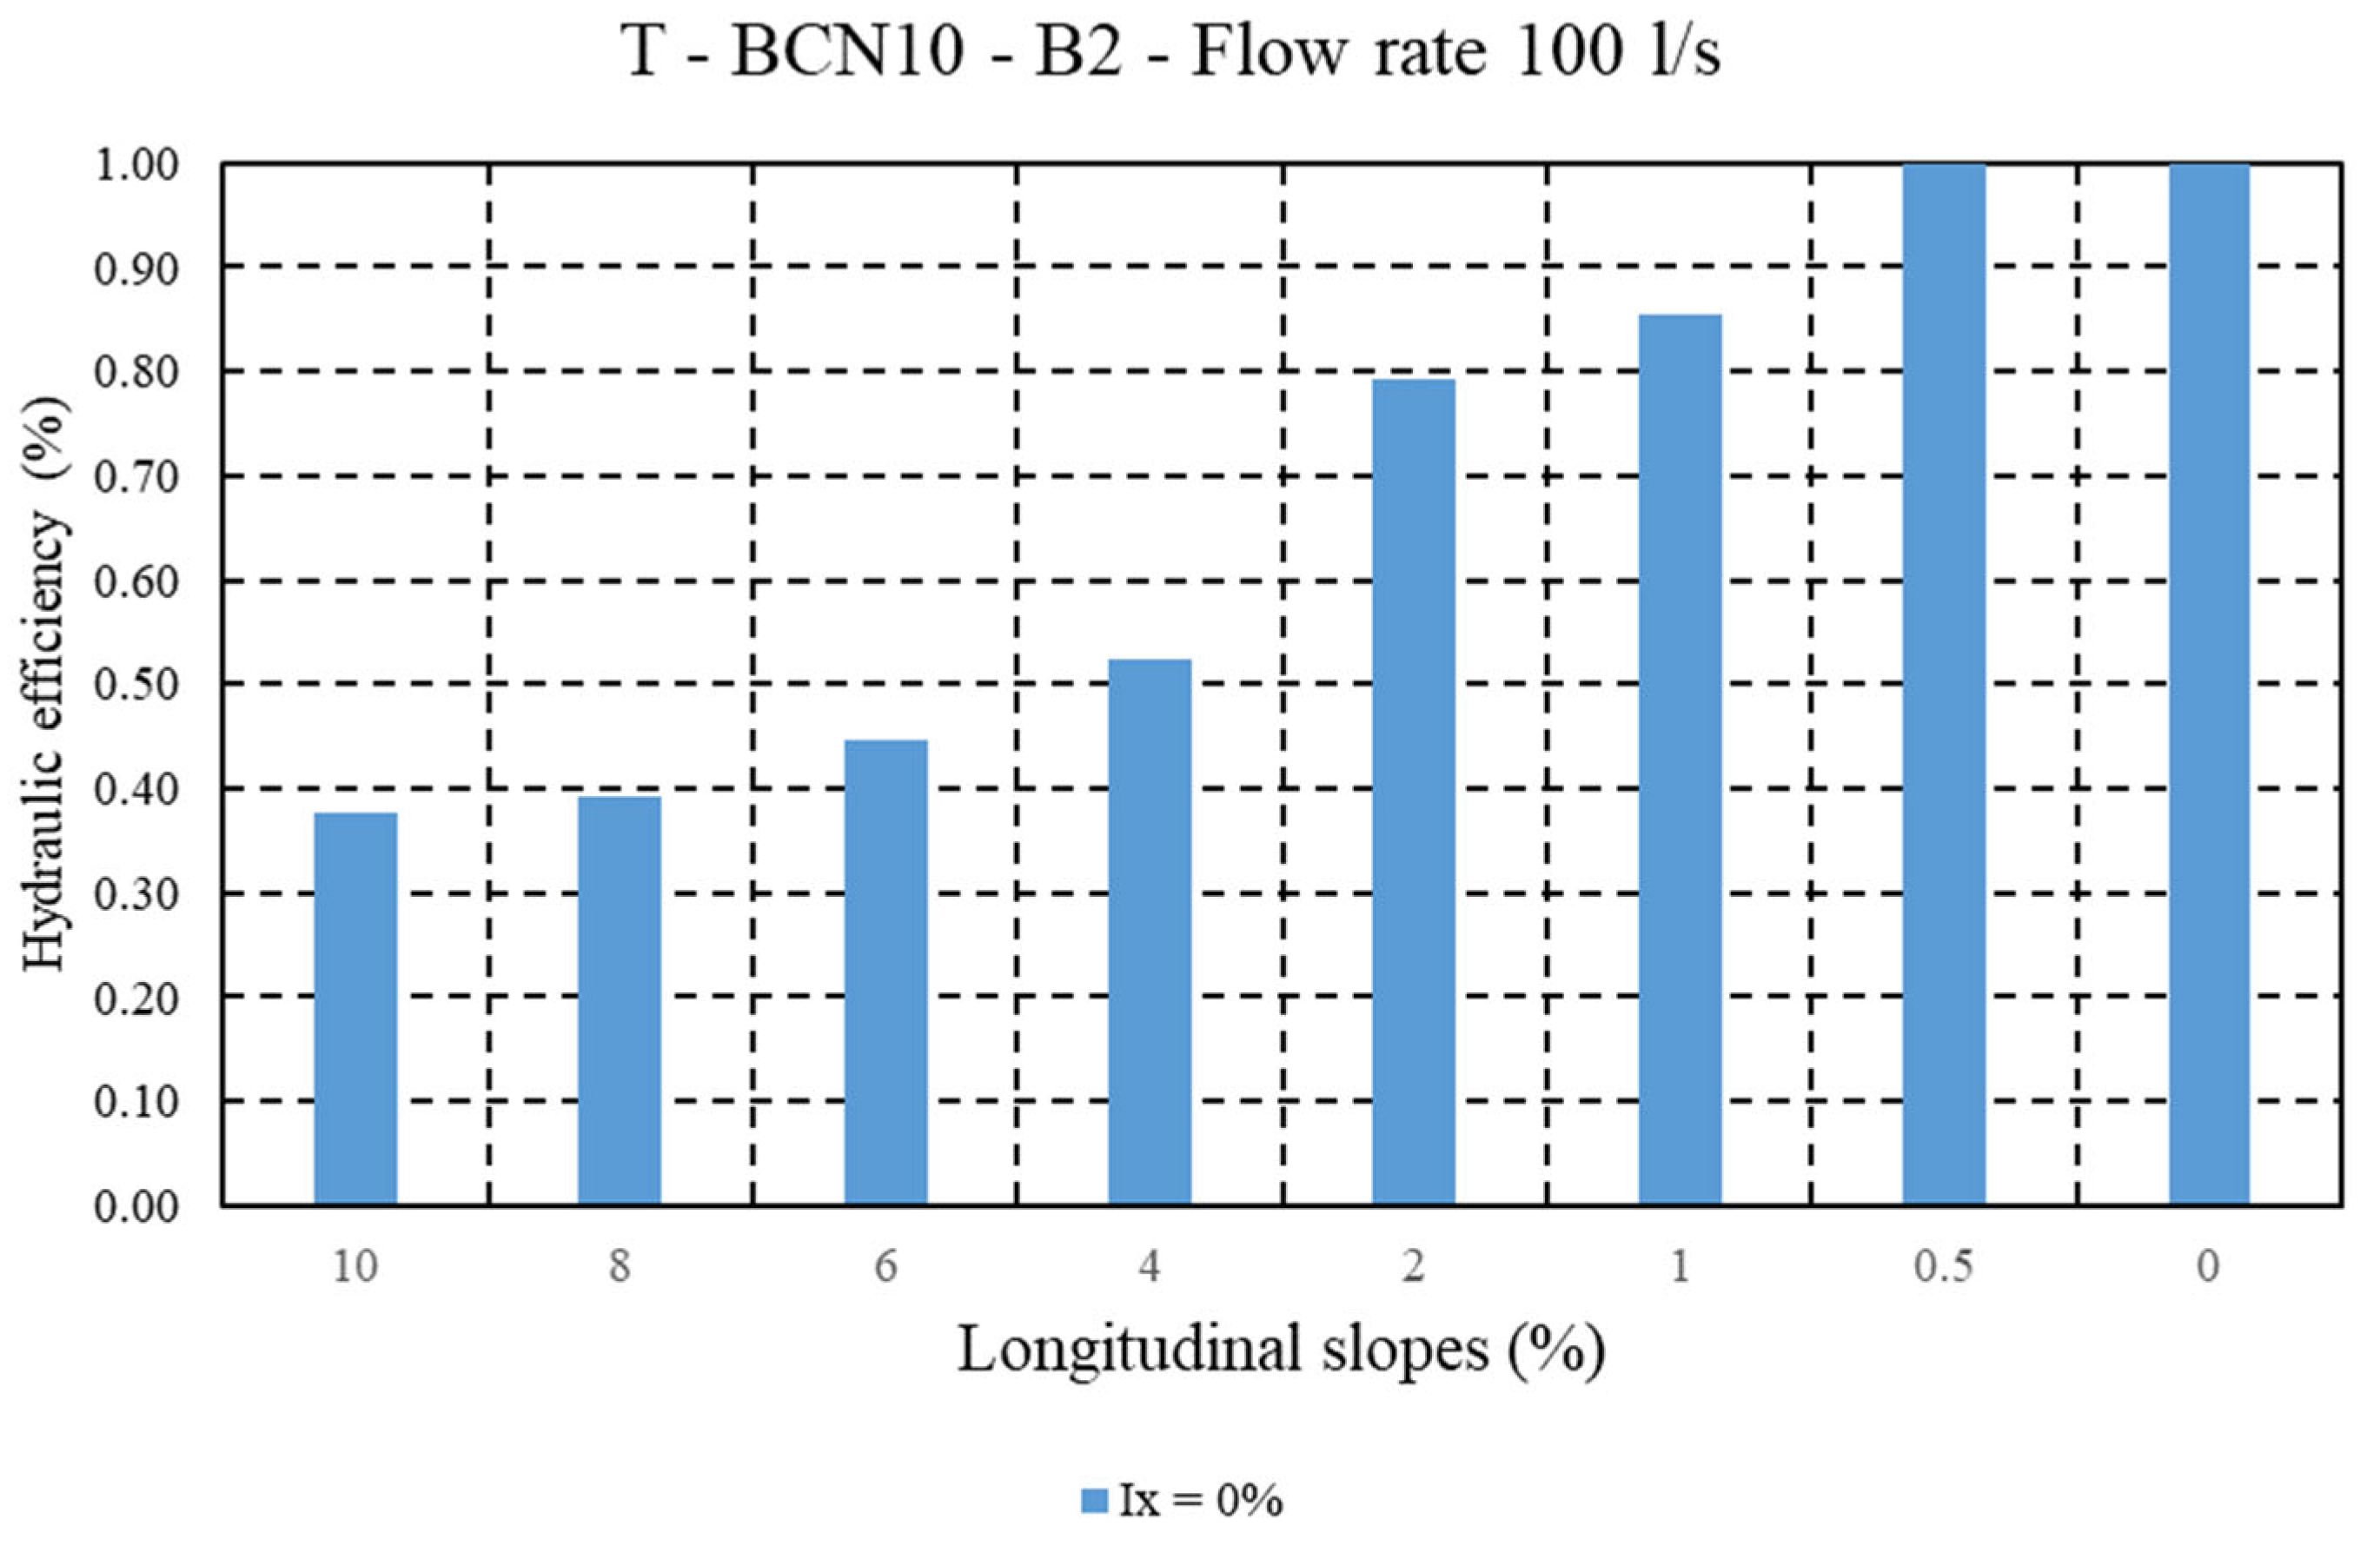
Figure 12,
Figure 13 and
Figure 14 below illustrate the comparative analysis between the tested configurations including speed bumps and the corresponding scenarios without these elements.
Focusing on the grated inlet BCN1 (
Figure 12), for the three tested flow rates, it is possible to observe that for flat street conditions (longitudinal slopes of 0, 0.5 and 1%), the presence of the speed bumps (both types) ensure the whole collection for the flow rates of 50 and 100 L/s, while for the flow rate of 150 L/s, these values range between 90% and 100%. For the same longitudinal slopes, the hydraulic efficiency without speed bumps varies from minimum values of around 10% to maxim values of 45%.
When the longitudinal slope increases, the differences decrease progressively but are still very high for a longitudinal slope of 2% and significant for a longitudinal slope of 4%.
For higher longitudinal slopes (from 6% to 10%), the effects of the speed bumps are not good, and in same case (above all for low flow rates), the conditions without them provide better hydraulic efficiency.
The behavior of the two speed bumps is similar, although type 2 speed bumps present better performance in the range of longitudinal slope between 2 and 6%.
Similarly, regarding the grated inlet BCN10 (
Figure 13), the general trend is the same. The most significant improvements are observed for a low longitudinal slope (from 0% to 1%). In these cases, the hydraulic efficiency of the grates with speed bumps are close to 100%, while for the conditions without them, the majority of these values range between 20% and 60%. Again, the differences decrease when longitudinal slope increases. Specifically, for a longitudinal slope of 2%, the hydraulic efficiency of this grate with speed bumps varies from 50% (for a flow rate of 150 L/s) to around 90% (flow rate of 50 L/s), while the conditions without speed bumps present values from 20% to 70%. The differences are still significant for the longitudinal slope of 4% (above all for the minimum flow rate of 50 L/s), while from the longitudinal slope of 6%, the results are practically the same for all the configurations and the effect of the speed bumps on the flow interception by the inlet is negligible.
Consistent with these findings, similar trends are observed for the tests carried out with the grated inlet BCN10 located transversally with respect to the main flow direction (
Figure 14). As said, for these configurations, only the null transverse slope was considered. For the minimum specific flow rate (50 L/s), a grated inlet with speed bumps is able to capture all circulating flow for longitudinal slopes up to 2%. For the same geometric conditions without speed bumps, hydraulic efficiency ranges between 80 and 90%. For a longitudinal slope of 4%, the improvement is less significant (from 70% to 80% and 85% for the speed bumps 1 and 2, respectively), while from the longitudinal slope of 6% the results are the same. For the medium specific flow rate (75 L/s), the grated inlet with speed bumps is able to capture all circulating flow for longitudinal slopes up to 1%. For the same geometric conditions without speed bumps, hydraulic efficiency is around 80%. For a longitudinal slope of 2%, the improvement is still significant (70% without speed bumps and 90% for the inlet with speed bumps). No effects of the speed bumps are observed in the results related to the tests carried out with a longitudinal slope from 4%. For the maximum specific flow rate (100 L/s), the grated inlet with speed bumps is able to capture all circulating flow for flat conditions (longitudinal slopes of 0% and 0.5%). For higher longitudinal slopes (1% and 2%), the improvements are still significant with values around 80% and 85% for the configurations with speed bumps with respect to values between 60% and 70% without speed bumps. Again, no effects of the speed bumps are observed in the results related to the tests carried out with longitudinal slope from 4%. For this set of tests, the results demonstrated that the behavior of the two speed bumps is practically the same (only for the case of flow rate 50% and the longitudinal slope of 4% are significant differences appreciated).
4. Conclusions
The main goal of traffic-calming approaches is to enhance the quality of life and vibrancy in residential and business districts by making conditions safer, more accessible, and more comfortable for pedestrians and cyclists. Speed bumps are one of the most common features used to achieve this goal. These kinds of structures may have significant effects on the hydraulic capacity of grate inlets generally located upstream of these elements.
This study provides several results concerning these kinds of effects based on a large experimental campaign carried out at the hydraulic laboratory of the UPC.
The experimental campaign was developed through a physical model representing a street lane used in the past to evaluate the hydraulic efficiency of several types of grated inlets. The platform was modified to include and test the hydraulic behavior of two grated inlets commonly used in Barcelona (BCN1 and BCN10) in the case of the presence of two kinds of trapezial speed bumps constructed at the UPC hydraulic laboratory according to the legislative framework in force.
Since the tests were carried out through a full-scale platform with real grated inlets, the experimental data obtained is highly accurate and avoids the reliability issues that come with extrapolating from smaller-scale models.
Experimental tests were conducted under different circulating flow rates (from 50 to 150 L/s), different transverse (from 0 to 4%) and longitudinal (from 0 to 10%) slopes, and different orientations of the grated inlets (in the curb, parallel with respect to the main circulating flow direction and transversally with respect to it). Tests considered high circulating flow rates that are representative of the stormwater runoff that can be produced during heavy storm events.
Results concerning grated inlets located at the curb show a great influence of the presence of speed bumps in the hydraulic mechanism of flow interception by the inlets. These effects are greater for flat areas (improvements up to 400% in terms of hydraulic efficiency) and decrease progressively to be negligible for high values of longitudinal slopes (generally from 6%). This trend can be observed for all the considered circulating flow rates. For the smallest grate (BCN1), a better performance of the grate was observed for a high longitudinal slope in the case of an absence of speed bumps. This improvement is small and could be due to laboratory errors. For the other grate (BCN10), this behavior was not detected.
The type 2 speed bump provided better performance with respect to type 1 due to the higher slope (10%) of the initial ramp downstream of the grate, but the differences were generally not significant.
For the grated inlets located transversally with respect to the main flow direction, results demonstrate that the effects of the presence of speed bumps are significant, but not so relevant like the other configurations with inlets positioned in the curb. Tests in this case only considered null transverse slopes. The effect of transverse slope on the interception capacity of the grates is evident.
The results of this study can be used to update spacing among inlets in case of the presence of speed bumps (the calculation procedures generally neglect the effect of these elements, like the case of the Barcelona Drainage Master Plan), saving important economic resources and maintaining the same level of flood hazard protection.
