Article

Human Impacts on Heavy Metals in Lake Sediments of Northern China: History, Sources, and Trend Prediction

1
Institute of Natural Resources and Ecology, Heilongjiang Academy of Sciences, Harbin 150040, China
2
Heilongjiang Province Key Laboratory of Geographical Environment Monitoring and Spatial Information Service in Cold Regions, Harbin Normal University, Harbin 150025, China
*
Authors to whom correspondence should be addressed.
Water 2025, 17(19), 2884; https://doi.org/10.3390/w17192884
Submission received: 26 August 2025 / Revised: 26 September 2025 / Accepted: 1 October 2025 / Published: 2 October 2025
(This article belongs to the Section Water Quality and Contamination)

Abstract

Lake sediments are important indicators of human activities and environmental changes, while lakes in northern China receive little attention. Heavy metal elements in core sediments from Bosten Lake (BST) in the arid area, Wuliangsuhai Lake (WLS) in the semi-arid area, and Chagan Lake (CG) in the semi-humid area of northern China, based on the precise dating of 210Pb and 137Cs, were analyzed to evaluate the characteristics and sources of heavy metal pollution, analyze the influence of different types and intensities of human activities on heavy metals, and predict the development trend of heavy metal content in lake sediments in the future. The content of heavy metals in the sediments of the three lakes has gradually increased over time, with a decreasing trend of CG > WLS > BST, which is in accordance with the intensity of human activities. Co, Cu, Zn, Cd, As, and Pb are greatly influenced by human activities and mainly come from wastewater, waste residue, and waste gas produced by industrial activities, pesticide residues from agricultural activities, and pollution from domestic sewage, while, Cr and Ni come from both natural sources and human activities. Mn and Fe are relatively stable and mainly come from natural sources. The development trend of heavy metal content in the sediments of various lakes in the future is predicted by regression analysis. Fe and As in WLS and Cr, Mn, Ni, and Cu in BST show upward trends, indicating that the influences of industrial activities, agricultural activities, domestic emissions, and air pollutants on heavy metal pollution in lake sediments have a continuous effect. The results can provide a scientific basis for the effective control and environmental governance of heavy metal pollution in lakes.

1. Introduction

Due to the toxic, persistent, and bioaccumulative effects of heavy metals on the environment, heavy metal pollution in aquatic environments is attracting widespread attention worldwide at present, posing a potential threat to human health and ecosystems [1,2,3]. Sediments are regarded as the largest reservoir of heavy metals in aquatic environments. Existing studies have found that approximately 99% of heavy metal loads in aquatic systems eventually precipitate onto sediments [4]. Because heavy metals are non-biodegradable and bioaccumulation occurs at all links of the food chain, the research and detection of them are particularly important for humans at the top of the food chain. Excessive intake of heavy metals can lead to genetic diseases and poisoning reactions in organisms [5,6]. The analysis of the distribution of heavy metals in sediments can be used to investigate the impact of human factors on aquatic ecosystems and assess the risks caused by human waste emissions [7]. The content of heavy metals in sediments is not an isolated factor but interacts with the surrounding environmental factors [8]. Hence, studying the relationship between heavy metals and various environmental factors is conducive to a comprehensive assessment of the impact of heavy metals on ecosystems and grasping the pollution characteristics of the local environment [9,10]. Therefore, sediment content can reflect the status of heavy metal pollution in the entire ecosystem. Measuring the content of heavy metals in sediments is crucial for providing information on heavy metal pollution throughout aquatic ecosystems.
Heavy metals entering lakes may come from various sources, such as geological weathering, soil erosion, air dust, atmospheric precipitation, and human activities, including fertilizer leaching, sewage discharge, industrial wastewater, and urban construction [11,12,13]. In recent years, human activities have become the main cause of heavy metal pollution in many lakes around the world [14]. After heavy metals deposit in sediments, they may be re-suspended due to certain disturbances, thereby causing secondary pollution and harm to aquatic organisms [15]. Lake sediments have the characteristics of good continuity and high resolution. They can also record the changes in the external environment and the impact of human activities on lakes. Moreover, the changes in physical, chemical and biological effects caused by external factors on lakes can also be recorded in the sediments [16,17,18,19]. Studies on lake sediments have been unanimously recognized and widely utilized by geological and environmental experts [11,20]. The analysis of nutrient elements, organochlorine, particle size, polycyclic aromatic hydrocarbons, heavy metals, and other chemical components in lake sediments, integrated with the dating methods of sediments, can effectively determine their sedimentary environments across distinct historical periods [16,20,21,22,23]. Further comparative analysis between natural and human factors that influence changes in the lake environment provides a deeper understanding of the mechanisms driving these environmental variations [24,25,26]. Therefore, it has indicative significance for determining the natural condition of lakes, treating lake pollution, and restoring the ecological environment of lakes and provides a theoretical basis for predicting the trend of future environmental changes in lakes.
China spans a vast territory, divided into four major climate zones from west to east: arid region on the western side, semi-arid region in the middle, and semi-humid region on the eastern end. However, the northern part of China predominantly comprises the arid region, the semi-arid region, and the semi-humid region. This study selected three lakes located in approximately the same latitude zones. These lakes exhibit distinct climate divisions from west to east, and their respective locations have different population sizes and levels of industrial/agricultural development. Progressing from west to east, the selected lakes are Bosten Lake (BST) in the arid area, Wuliangsuhai Lake (WLS) in the semi-arid area, and Chagan Lake (CG) in the semi-humid area. Here, the aim of our work is (1) to evaluate the pollution characteristics and ecological risks of heavy metal (As Cr, Mn, Fe, Co, Ni, Cu, Zn, As, Cd, and Pb) in lake sediments of the three lakes based on the precise dating of 210Pb and 137Cs; (2) to determine the sources of heavy metals and analysis the influence of different types and intensities of human activities on heavy metals in lake sediments; and (3) to predict the possible future trends of changes in the metals. In order to have a clearer understanding of the future evolution characteristics of heavy metals in the lake area, an innovative statistical regression analysis model was established to predict the development trend of heavy metal content in lake sediments in the future, providing a scientific basis for the effective control and environmental governance of heavy metal pollution in lakes.

2. Materials and Methods

2.1. Study Area and Sampling

Three lakes with approximately the same latitude zone, experiencing different climate zones from west to east, and having different population sizes and degrees of industrial and agricultural development in the lake locations were selected as the research objects. From west to east, they are Bosten Lake (BST) in the arid area, Wuliangsuhai Lake (WLS) in the semi-arid area, and Chagan Lake (CG) in the semi-humid area as the research objects in sequence (Figure 1). Lake sedimentary core samples were collected from CG in January 2017 and from WLS and BST, respectively, in January 2018. Columnar sedimentary core samples at the central point near the lake were collected using a stainless steel static gravity piston corer (version 13540, KC-Denmark incorporation, Silkeborg, Denmark). The sampling tube of the sampler is 120 cm long and 5.5 cm in diameter. The sampling principle mainly relies on the force of gravity to obtain vertical sediment core samples. Each sampling point was located and recorded using a handheld GPS: BST (41°57′55.98″ N, 87°13′40.09″ E), WLS (40°56′32.30″ N, 108°52′12.17″ E), and CG (45°14′45.86″ N, 124°16′48.33″ E).
The average water depths of CG, WLS and BST are 2.5, 0.8 and 9 m, respectively. The water depths in the areas of the center of the three lakes are 5, 4, and 10 m, respectively. The lake water is relatively deep and is less affected by human activities and river inflows. The sedimentation near the center of the lake is stable and less affected by the disturbance of the inflow river. Hence, the sampling sites are from the deepest water level at the center of the lakes to minimize the impacts on sediment. During the sampling process, the sampler was perpendicular to the water surface, and the suspension layer was not disturbed. Therefore, the sediment cores collected can represent the history of lake pollution. The water in the upper layer was clear, and the sedimentary columnar core was well-preserved. The columnar samples collected on site were continuously cut by 1 cm with a 5 cm diameter and 1 cm thick dividing ring, and the samples were numbered. At the deepest point near the center of each lake, two sedimentary rock cores were collected from the water. Each core was divided into 1 cm sections for sampling. One of the cores was used for dating, and the other core was used for analyzing heavy metal elements. The lengths for CG, WLS, and BST were 81 and 81 cm, 58 and 49 cm, and 61 and 51 cm, respectively. The long core was used for dating, while the short core was used for heavy metal analysis. The total number of samples was 381. They were immediately placed in polyethylene self-sealing bags for sealed storage, taken back to the laboratory, and then weighed. The sediment samples were freeze-dried using the Advantage EL-85 vacuum freeze dryer (SP Scientific, New York, NY, USA). Then, impurities such as gravel and plant residues were removed, mixed evenly, ground, and passed through a 120-mesh sieve. They were placed in polyethylene plastic-sealed bags and stored in a 4 °C refrigerator for analysis and testing.

2.2. Dating

The sedimentation rate of lake sediments varies with the environment of the lake area where they are located. The dating of sediments was measured using the high-purity germanium gamma spectrometer (ORTEC, Inc., Oak Ridge, TN, USA) to measure 137Cs and 210Pb. The main basis for establishing the dating framework of 137Cs is that according to the distribution characteristics of 137Cs in lake sedimentary profiles, it can be known that the global nuclear tests began in 1952 corresponding to the residual layer of 137Cs [27], as well as the peak period of dispersion after the nuclear explosion in 1963 corresponding to the main accumulation peak [28], and the secondary accumulation peak corresponding to the Chernobyl incident in 1986. The main basis for establishing the 210Pb dating framework is to use the specific activity of 210Pb, calculate the dating of columnar cores with a constant initial concentration CRS, and establish the dating sequence [29]. In this study, the constant rate of the 210Pbex Supply Model (CRS) was adopted to calculate the age and deposition rate of the sedimentary column and establish the sedimentary age sequence [28] (Figure 2). According to the 1963 marking of 137Cs, the sedimentary core was divided into upper and lower sections at the corresponding depth. Using the 210Pbex activity value, the sedimentary age was calculated using different formulas, respectively. Due to the stable deposition in the lower layer of the core and the significant decrease in 210Pbex, the deposition age was calculated from 1963 to the bottom of the rock layer using the CRS formula. The CIC model was used to calculate the age between the surface layer of the core and the depth at the 137Cs time scale (1963). Meanwhile, this study adopted the 137Cs dating method to test the reliability of the dating results obtained by the 210Pb method.
The dating results were compared and corrected with the 210Pb dating standard samples provided by the China Institute of Atomic Energy. After calculation, the chronological sequences of the columnar core sediments in CG, WLS, and BST were obtained as 1877–2017, 1880–2017, and 1945–2017, respectively. The sedimentary chronological sequences of 140 years for CG, 137 years for WLS, and 73 years for BST were established, respectively.

2.3. Heavy Metal Analysis

A total of 0.1 g of the sample was digested by the HCL-NHO3-HF-H2O2 digestion method (Anton Paar Multiwave 3000, Anton Paar GmbH, Graz, Austria). After digestion, it was placed in a heating tank for acid removal. Finally, it was made up to 100 mL and placed in a sample bottle. Elemental analysis was conducted using the Agilent 7500c inductively coupled plasma mass spectrometer (Agilent Technologies, Santa Clara, CA, USA). Soil component analysis standard soil was used for comparison. The calibration solution was determined by the standard curve using the Agilent standard solution (Agilent Technologies, Santa Clara, CA, USA). The standard error of the quality control samples did not exceed 5%. The contents of ten heavy metal elements such As Cr, Mn, Cu, Zn, As, Cd, Fe, Ni, Pb, and Co in the three lakes were measured, respectively. The rationale for choosing these ten metal elements for analysis is that they include both those released by common human activities (Cr, Mn, Fe, Co, Cu, Zn, As, Cd, and Pb) and those less affected by human activities (Ni). Additionally, these elements are the primary focus of current research efforts. The findings of this study can be compared and analyzed with data from lake sediments in other regions.

2.4. Geoaccumulation Index Method

The geoaccumulation index (Igeo) method is an indicator for quantitatively evaluating the degree of heavy metal pollution in sediments. It can fully reflect the influence of natural conditions and human activities on sediments and soil and can directly reflect the accumulation degree of heavy metals. Therefore, it is usually used to evaluate the pollution situation of heavy metal elements in sediments and soil. The calculation formula is as follows:
Igeo = log2(Ci/kBi)
where Ci represents the actual measured value of heavy metal content in sediments. k is a constant introduced to consider the possible fluctuations in background values caused by regional differences, and usually k = 1.5. Bi is the background value of heavy metals in sediments. The element background values of the provinces where CG, WLS, and BST are located are listed in Table 1.
The Igeo can not only reflect the natural variation law of heavy metal distribution in sediments but also determine the impact of human activities on the environment, and can be used as an important indicator to distinguish the impact of human activities. The classification criteria for the Igeo are shown in Table 2.

2.5. Potential Ecological Hazard Index Method

The potential ecological hazard index method was proposed from the perspective of sedimanology, which is a widely used method for evaluating heavy metal pollution in sediments. It takes into account various factors such as the background value, nature and environmental effects of heavy metals in sediments, and is an effective and simple algorithm developed in combination with biotoxicology research. The calculation formula of potential risk index of a single heavy metal (Eir) is as follows:
Eir = Tir × Ci/Co
where Ci represents the actual measured value of heavy metal content in sediments. Co is the background value of heavy metals in sediments, as shown in Table 1. Tir is the biological toxicity response factor coefficient of different heavy metals, representing the toxicity level of heavy metals and the sensitivity of organisms to them. Generally, it is considered that the toxicity coefficients of Cr, Mn, Fe, Co, Ni, Cu, Zn, As, Cd, and Pb are 2, 1, 4.94, 5, 5, 1, 10, 30, and 5, respectively. According to the formula, the Er values of each heavy metal element in different lakes were calculated, and by referring to Table 3, the potential ecological risk degrees of different elements in different years of each lake were analyzed.

2.6. Evolution Prediction Method

The analysis steps for predicting the evolution of heavy metal elements in lake sediments are as follows: (1) use regression analysis to calculate the residuals and confidence intervals of the fitted data at each point; (2) remove the noise data whose confidence intervals do not contain zero points; (3) re-fit the denoised data; (4) draw the residual plot and the regression analysis fitting plot; and (5) based on the results of the regression analysis, determine the data trend according to the fitted curve.
For the coefficients of the fitting polynomial, use MATLAB software (R2019b) to obtain the result of each coefficient. The statement for implementing polynomial fitting is as follows:
a = polyfit(x,y,m), Y = polyval(a,x*)
where (x, y) are known points, m is the degree of the polynomial to be generated, and a is the m + 1 coefficient of the obtained polynomial, ca = [a1, …, am, am +1]. Y is the value of the polynomial with coefficient a at x*.
In order to prevent overfitting, the established polynomial regression analysis model is verified. A set of data was randomly selected from a total of 30 sets of data in three lakes to verify the regression model, taking the heavy metal element Cr in the sediments of WLS as an example. First, take a layer of data with an interval of every five years, totaling 10 data points, as the verification data; the remaining 39 data were used as test data for a 7-degree polynomial regression analysis.

2.7. Statistic Analysis

Descriptive statistical analysis of the content of heavy metal elements was conducted through Excel 2016 and SPSS 22.0, and factor analysis was used for quantitative source analysis.

3. Results

Lake sediments record the history of lake environmental changes. The geochemical behavior of heavy metal elements in sediments during the environmental evolution process provides a strong basis for reconstructing the evolution of lake sedimentary environments. By analyzing the content of heavy metal elements in different layers of samples of lake sediments in combination with dating, the intensity of the influence of human activities on the content of heavy metals in lake sediments at different stages can be accurately reflected. Moreover, the metal elements in the sediments originate from both natural and anthropogenic sources. In order to conduct an in-depth analysis of the impact of human activities on metal pollution in the sediment cores of lakes, we selected Ni, which is less affected by human activities, to standardize the other metal elements. The standardized results can be regarded as the characteristics of the content of anthropogenic pollution.

3.1. Vertical Distribution Characteristics of Heavy Metals in Sediments of CG

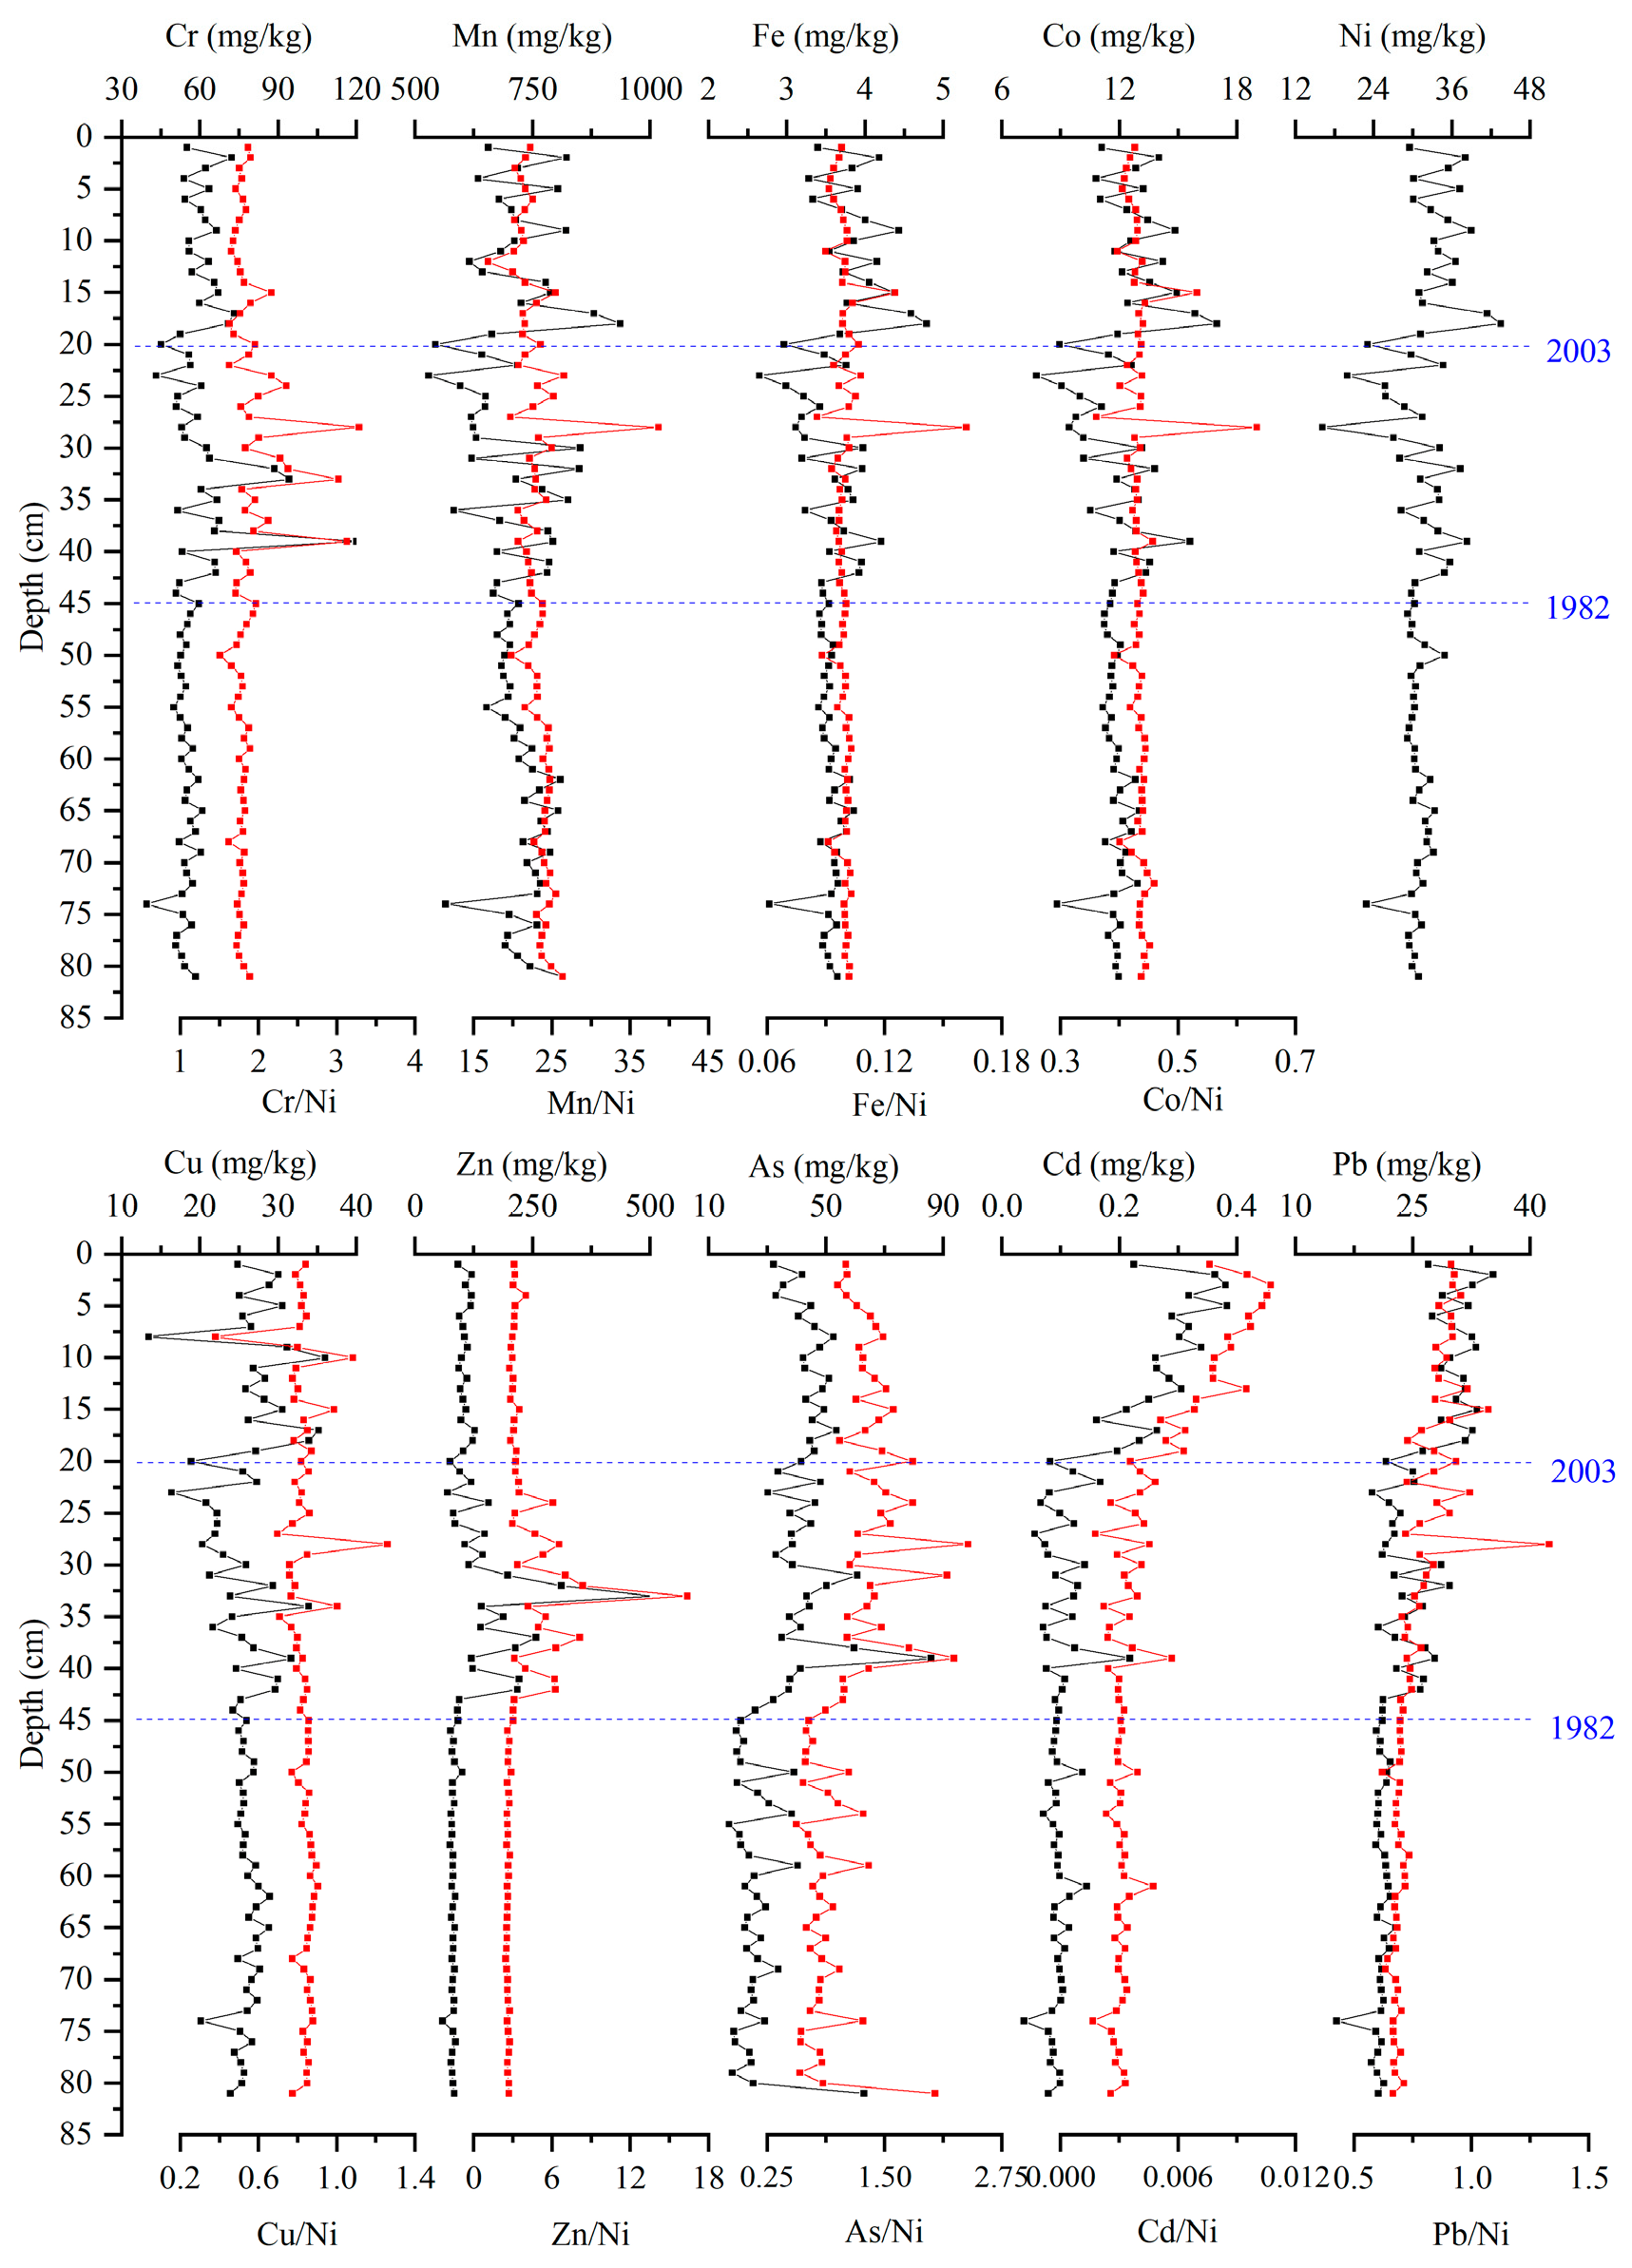
The changes in heavy metal content in the sediments of CG can be divided into three different stages (Figure 3). Before 1982, it was a relatively stable stage. During this stage, the fluctuations in the changes in each heavy metal element were relatively small. The deviation rates of the content changes in the ten heavy metal elements, except for As, remained below 10%. Except for the sudden drop in heavy metal content in the early 1930s due to the flood in the CG Basin in the early 1930s, there was basically no change in other times. During this period, heavy metals in the sediments were mainly naturally deposited.
From 1982 to 2003, the content of heavy metals in the sediments of CG fluctuated, especially in 1983. The main reason for the abnormal values was that the Xinli Oil Production Plant of Jilin Oilfield drilled wells for oil production at the bottom of CG, resulting in a sharp increase in the contents of Cr, Zn, As, and Cd. In 1986, the floods of the Huolin River and Taoer River entered CG. The highest water level of CG was 131.23 m. The flood persisted in CG throughout the winter and spring, and the content of heavy metal elements dropped to the average value of recent years. In 1998, the Huolin River and the Nen River suffered from a once-in-a-century severe flood. The water level of CG once rose to 132.02 m, and the content of heavy metal elements was slightly abnormal. During other periods, the content of heavy metals in the sediments of CG fluctuated within a small range. The overall average content of the ten heavy metal elements did not change much compared to the previous stage. The content of each metal element varied significantly from year to year, and the difference between the maximum and minimum values began to increase.
In 2003, in order to concentrate on the development of seedling breeding, the CG Tourism and Economic Development Zone newly built a 9.3 km long dam inside the dam of the Southeast Oilfield of CG and established a 10,000 mu fishpond breeding base. The content of heavy metals in the sediment of CG fluctuated sharply. With the passage of time, the contents of Cr, Zn, As, Cd, and Pb gradually increased. Particularly, the contents of the two heavy metal elements Cd and Pb increased the fastest, while the contents of Mn, Fe, Co, and Ni remained stable.

3.2. Vertical Distribution Characteristics of Heavy Metals in Sediments of WLS

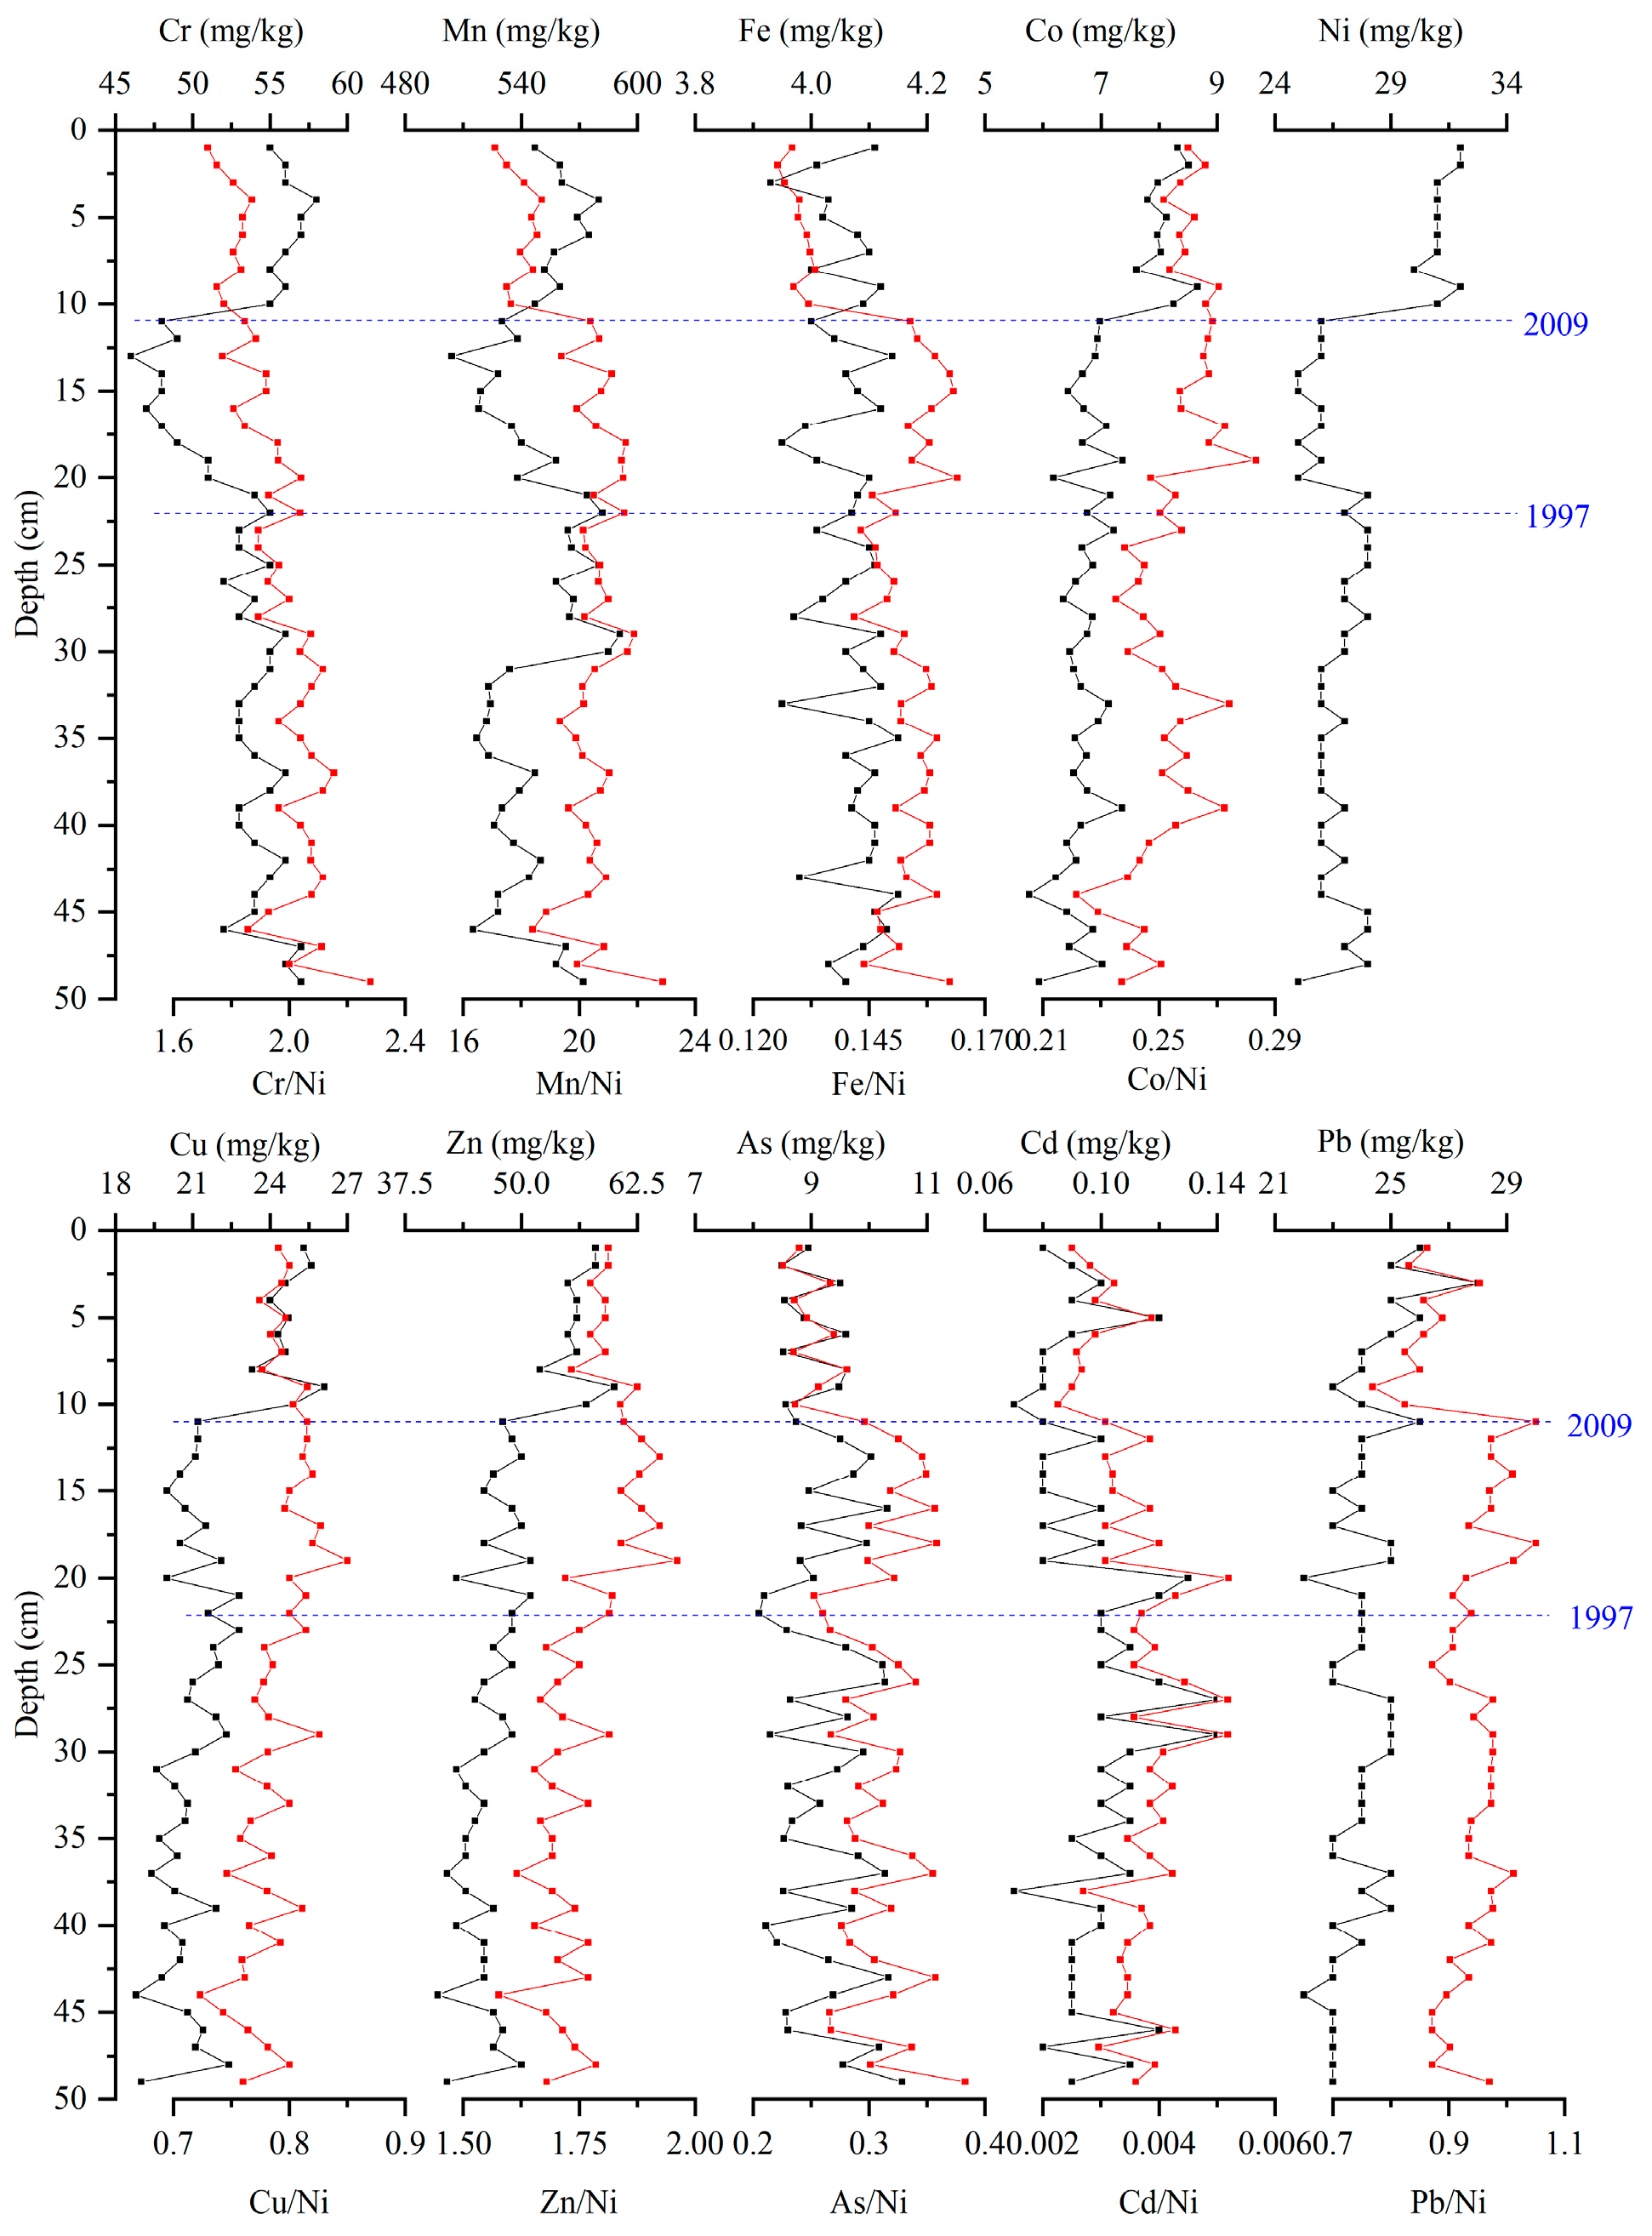
Three distinct sedimentary stages were also identified in WLS (Figure 4). Before 1997, the contents of most heavy metals such as Ni, Pb, Zn, Cu, Co, and Cr in the sediments of WLS fluctuated relatively stably, and the values basically remained within a relatively low range with a small coefficient of variation. During this period, the heavy metals in the sediments were mainly naturally deposited. The concentration of heavy metal pollutants released by humans into the environment in the agricultural economic society fluctuates within a low range.
During the period from 1997 to 2009, the contents of various heavy metals in the sediments mostly changed in the same way as in the previous period. The contents of some elements such as Cr, Mn, Ni, Cu, Cd, and other heavy metals showed a trend of decreasing with the decrease in depth. It is speculated that the trend of decreasing concentration might have been affected by the increase in precipitation in the basin during the same period. The influence of the “dilution effect” caused the coarsening of particulate matter entering the lake.
After 2009, the heavy metals Cr, Mn, Co, Ni, Cu, and Zn in the sediments increased significantly, significantly exceeding the average values before 2009. According to the records, in May 2008, over 80,000 mu of yellow algae appeared in WLS and persisted for nearly five months, covering the water surface of the core area of WLS, which might have led to a rapid increase in the content of the above-mentioned heavy metals.

3.3. Vertical Distribution Characteristics of Heavy Metals in Sediments of BST

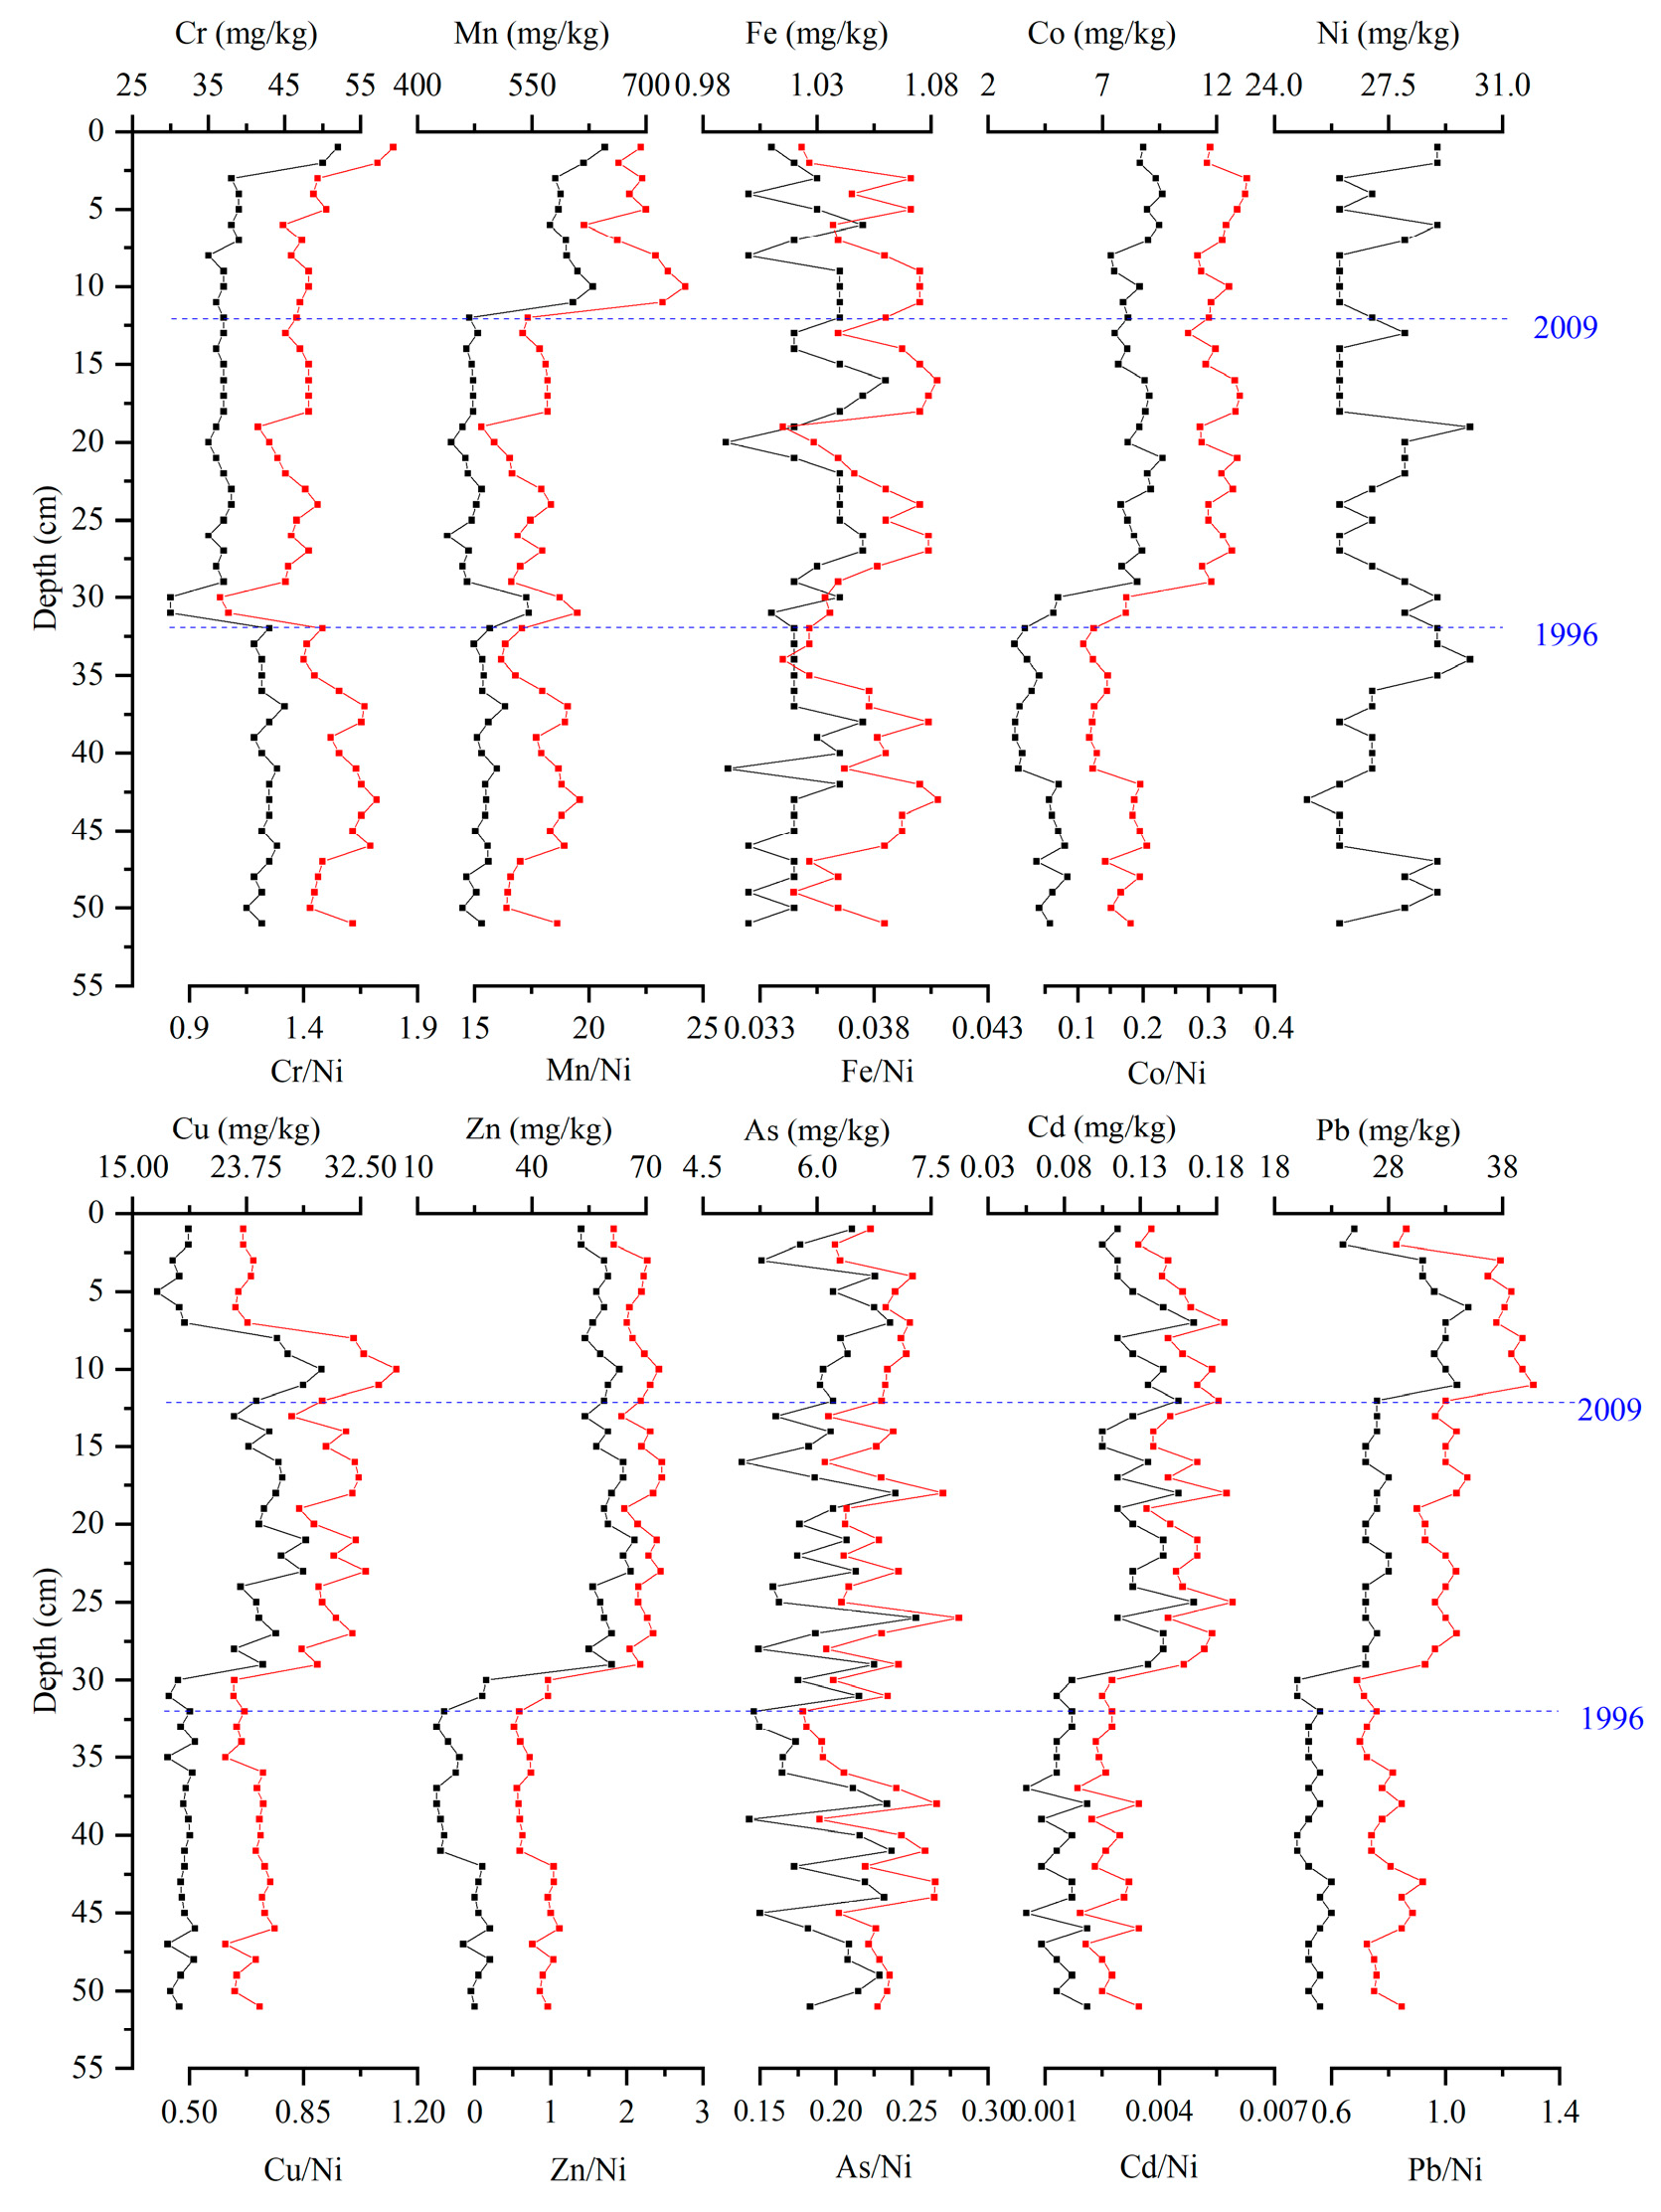
Three distinct sedimentary stages were also identified in BST (Figure 5). Before 1996, the contents of various heavy metal elements in the sediments of BST tended to be stable, with values fluctuating within a small range. During this period, the relatively low concentrations of heavy metal elements in the lake sediments were mainly due to traditional agricultural, animal husbandry, and economic and social activities. The concentrations of various pollutants released by humans to the environment were all relatively low, and the lake sediments were mainly naturally deposited. From 1996 to 2009, the two heavy metals Fe and Ni fluctuated greatly, while the contents of heavy metals Co, Cu, Zn, Cd, and Pb in the sediment showed a significant upward trend. The main reason for this is that since the establishment of Xinjiang Province, a large number of agricultural activities have carried fine particles into the lake with runoff, resulting in an increase in the concentration of heavy metal pollution in the sediment. After 2009, the contents of Cr, Mn, and Pb showed an upward trend again, while the contents of Cu and Cd showed a downward trend. The difference in this change might be affected by the different sources of different heavy metal elements.

3.4. Pollution History of Heavy Metals

To understand the intensity of the influence of human activities on heavy metal elements in lake sediments, it is necessary to first eliminate the natural variation content of heavy metal elements and standardize the existing data. Generally, elements such as Al, Fe, Ti, and Ni, which are not easily affected by human activities and have wide sources, are selected to standardize the heavy metal content in sediments to identify and distinguish the sources of various heavy metal elements [28]. Elements such as Al, Fe, Ti, and Ni can rapidly precipitate from the solution during weathering and have extremely low solubility. Therefore, they are not easily affected by human activities and are suitable to be used as conservative elements for standardizing heavy metal elements in sediments. In this study, the Ni element was chosen as the conservative element for standardization.
After standardization, as shown in Figure 3, before 1982, the heavy metal elements in the sediments of CG were less affected by human activities. From 1982 to 2003, the trends of the standardized curves of Cr, Mn, Fe, Co, Cu, and Pb differed significantly from those of the originally measured curves of heavy metals, indicating that the contents of these heavy metals were greatly affected by human activities during this period. After 2003, the standardized curves of Cr, Mn, Fe, Co, and Pb differed significantly from the originally measured curves of heavy metals in sediments, indicating that these heavy metals were greatly affected by human activities at this stage. However, the curve trend of Cu was basically the same as the originally measured value and was less affected by human activities.
The influence of human activities on heavy metal elements in the sediments of WLS can also be roughly divided into three stages (Figure 4). The first stage was before 1997. The curves of various heavy metals were basically consistent with the original measured values and were less affected by human activities. During the second stage, from 1997 to 2009, the curve trends of Cr, Mn, Fe, Co, Cu, Zn, and Pb changed significantly. During this stage, these heavy metals were greatly affected by human activities.
In the third stage after 2009, except for the trend of Fe, which changed and continued to be significantly influenced by human activities, the changes in other heavy metal elements were not significant.
The trend of heavy metal content in BST is relatively clear (Figure 5). After 2009, three heavy metals, Mn, Fe, and As, were significantly influenced by human activities, whereas at other times, they were less affected by human activities.

4. Discussion

4.1. Heavy Metal Evolutionary History of Lake Sediments

Studies show that heavy metals in sediments are mainly classified into two types according to the sources of pollutants: natural sources and sources from human activities. Under natural conditions, the sources of heavy metals are mainly distributed in rock strata. The types and contents of heavy metals are not uniform. Different rock types and environmental changes lead to different contents of heavy metals in different regions. Moreover, due to the relatively slow erosion process, the sources and contents of heavy metals flowing from nature to soil and sediments are limited. Existing studies have shown that the elements with relatively high content in sediments under natural conditions are Cr, Mn, Co, Ni, Cu, Zn, Cd and Pb [30].
The main sources of human activities are industrialization and urbanization as the main influencing factors. The sources of heavy metals can be further refined into the following four aspects: 1. Industrial production sources, 2. Agricultural production sources, 3. Domestic emission sources, and 4. Air pollution and other sources.
The industrial sources of heavy metals mainly include mining, metallurgy, refining, manufacturing, etc. Mining is one of the industrial projects with the largest sources of heavy metal pollution. The content and types of heavy metals in different types of ores also vary. For instance, coal ores are rich in As, Cd, Fe, etc. Besides Fe, common iron ores also contain Mn, Ni, Co, etc. Zinc ores contain heavy metal elements such as Cd, Co, Ni, Cu, etc. These elements will all cause pollution to the surrounding environment. Moreover, the flowing water produced during the rainy season will erode and transfer minerals, transferring heavy metals from ores to soil, water bodies, and sediments, causing pollution. Metal smelting is also an important cause of heavy metal pollution. During the process of metal smelting, metal particles are produced and discharged into the atmosphere along with smoke and dust. Subsequently, they will cause pollution to a wider range of soil, water bodies, and sediments due to rainfall or natural sedimentation. Other industrial activities such as the papermaking industry, wood processing industry, textile industry, and electronic product manufacturing industry can all lead to heavy metal pollution.
Organic and inorganic fertilizers, herbicides, and insecticides are the largest source of heavy metal pollution in agricultural land. These pollutants are transferred to lakes through rainfall and irrigation and accumulate in sediments. Specifically, organic and inorganic fertilizers contain Pb, Cr, Cd, Ni, and As. The most widely used herbicides, insecticides, and fungicides contain relatively high levels of heavy metals, mostly Cd, Cr, Ni, Zn, and Pb [31]. Under normal conditions, the properties of Cd and Zn are active, and crops can accumulate a large amount of Cd and Zn elements. The consumption of crops by humans and animals leads to the accumulation of these two elements in the human or animal body as well. This further leads to the occurrence of related diseases. Especially due to the particularity of agricultural land, various fertilizers have been repeatedly used for years, resulting in increasingly severe sediment pollution.
The discharge of domestic sewage is the main source of heavy metals in lakes and rivers. A large number of households use chemical and chemical products such as cleaning agents in their daily lives. These products contain considerable amounts of Fe, Mn, Cr, Co, and Zn, which are the main sources of heavy metals in domestic sewage. Urban domestic waste is also a source of heavy metals in other domestic emissions. Heavy metals in domestic waste are leached through rainwater erosion and soaking and finally discharged into lakes and rivers.
Air pollution and other sources mainly include waste incineration and landfill, as well as exhaust emissions from transportation vehicles. The combustion of coal will increase the content of heavy metals in the atmosphere, soil, and water bodies, such as Cd, Mn, Ni, Fe, etc. A large amount of heavy metals are also produced during the process of transportation. The combustion of gasoline can lead to an increase in Fe, Ni, and Pb. In particular, the combustion of gasoline containing Pb is the main source of Pb content in the atmosphere. Diesel combustion will lead to an increase in Cd and Cu. Tire wear can lead to an increase in Ni and Zn.

4.2. Pollution Status of Heavy Metals

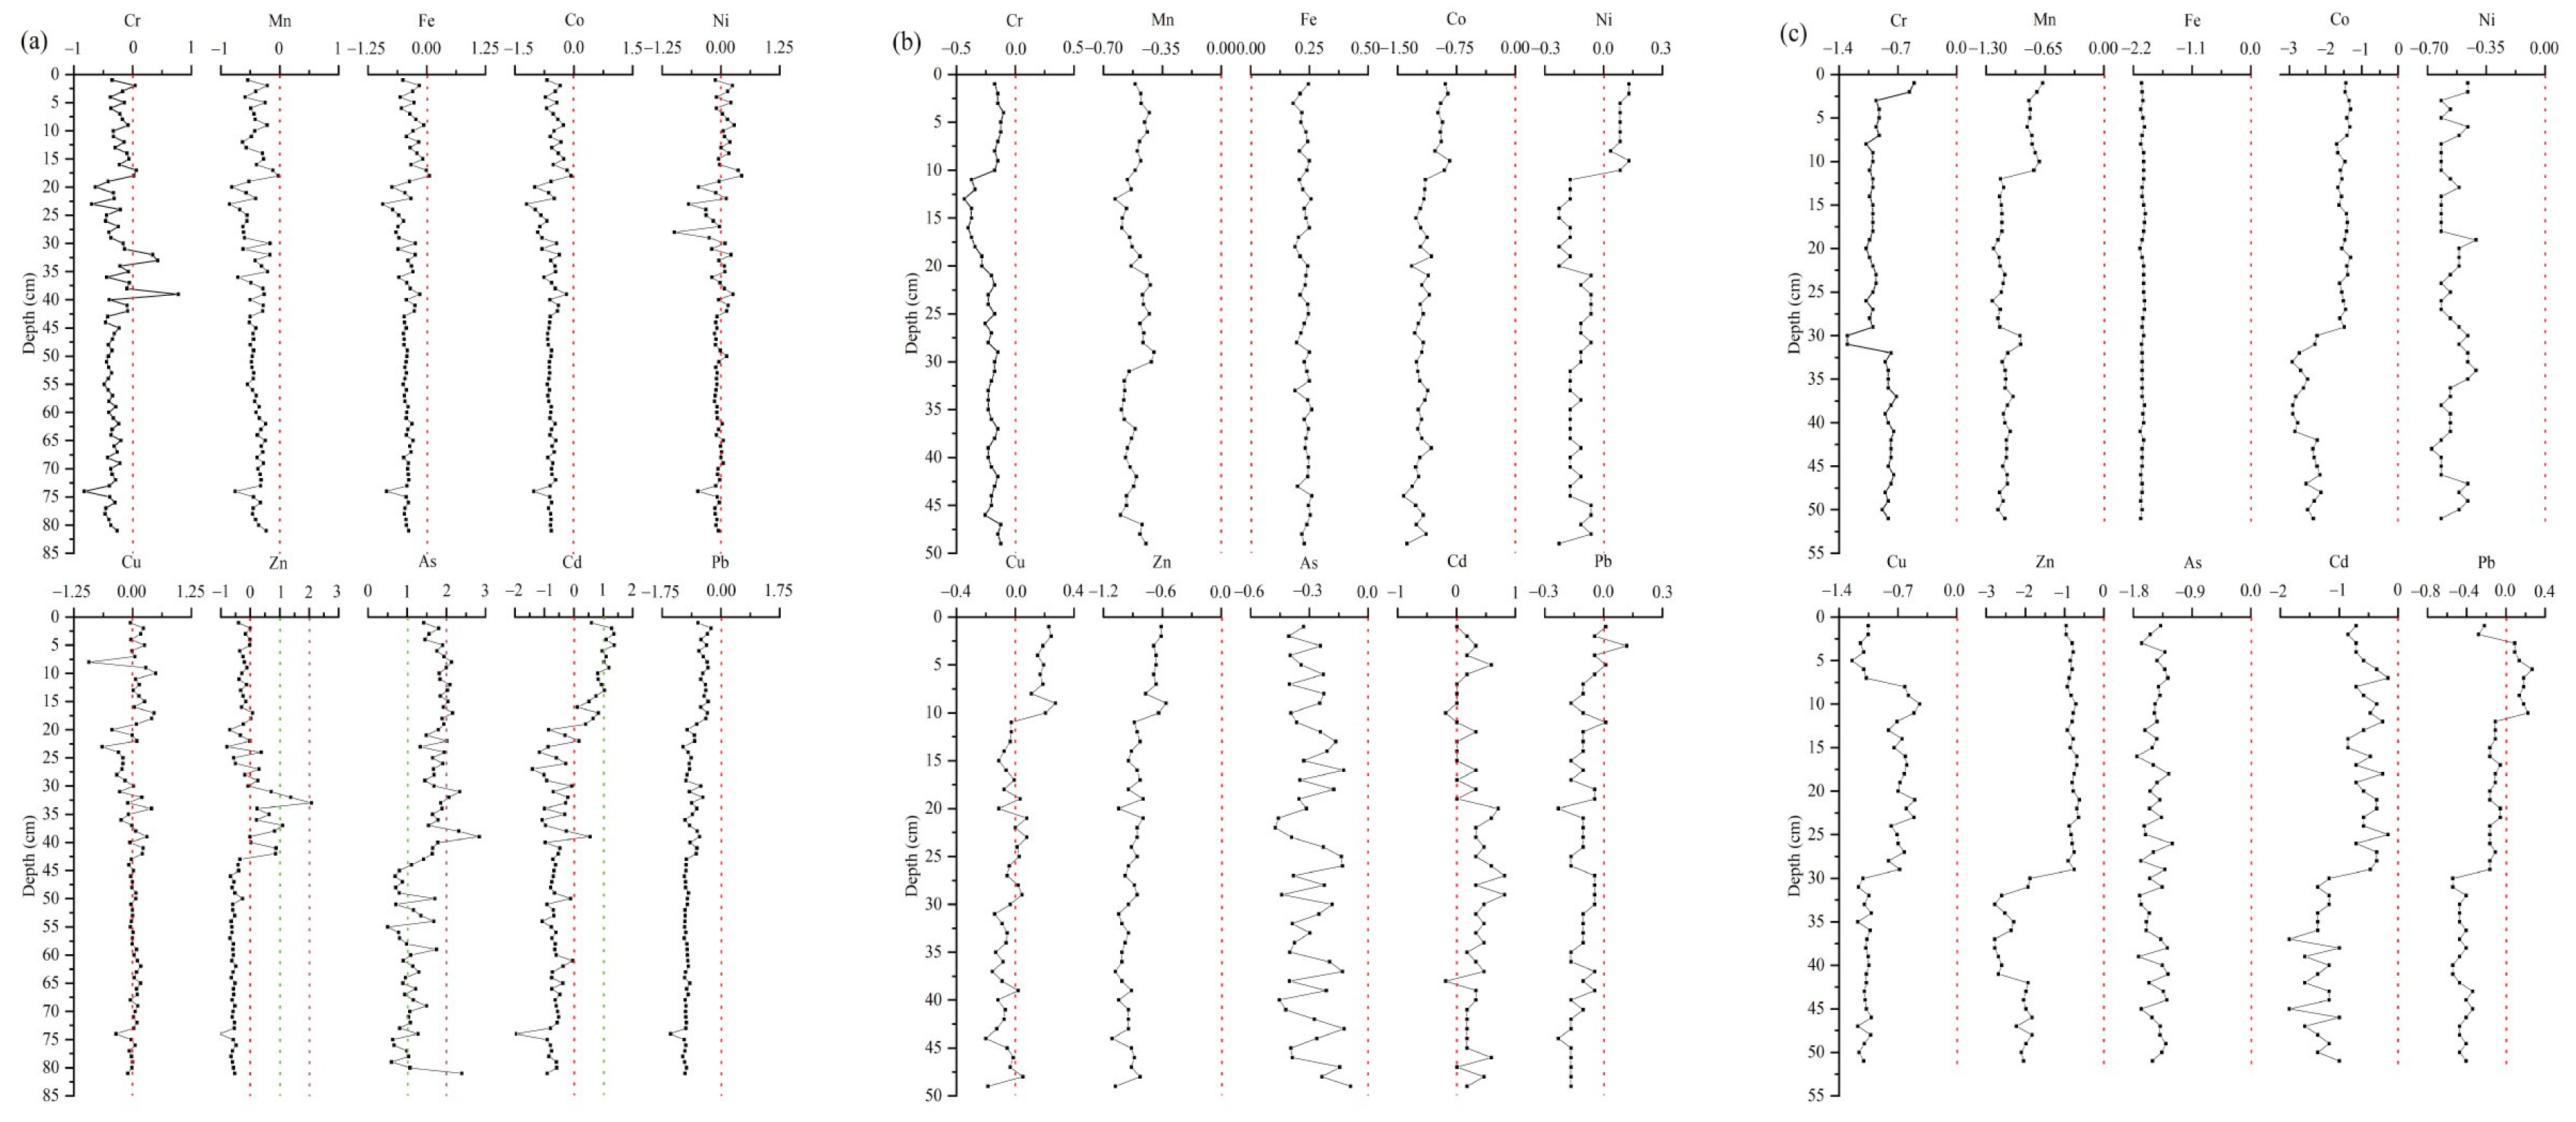
As shown in Figure 6, in CG, the five heavy metal elements Cr, Mn, Fe, Co, and Pb have remained within the unpollution range all along, and although their values have fluctuated slightly, they have always hovered below the standard. The values of Ni and Cu have been fluctuating between unpollution and slightly polluted. The values of Zn and Cd have developed from unpollution at the beginning to slightly polluted and then to moderately polluted. The value of As changed from mild pollution to moderate pollution. The values of heavy metals Cr, Mn, Co, Zn, and As in the sediments of WLS have always been in unpolluted state, while Fe and Cd have remained at a slightly polluted level. However, the values of Ni, Cu, and Pb have gradually changed from an unpolluted level to a slightly polluted one. In the sediments of BST, except for the value of Pb, which gradually changes from unpolluted to slightly polluted, the Igeo indexes of other heavy metal elements are all below 0, indicating an unpolluted state.

4.3. Potential Ecological Hazard Assessment of Lake Sediments

As shown in Figure 7, the values of several heavy metal elements such as Cr, Mn, Fe, Co, Ni, Cu, Zn, and Pb in the sediments of CG are all less than 40, which falls within the range of low ecological hazard. However, in terms of time, the potential ecological hazard shows a gradually increasing trend. The values of the two heavy metal elements, As and Cd, have gradually increased over time, reaching a moderate ecological hazard. Cd has even reached a high ecological hazard in recent years. The potential ecological risk coefficients of Cr, Mn, Fe, Co, Ni, Cu, Zn, As, and Pb in the sediments of WLS are much lower than 40, which indicates low potential ecological risk, while the potential ecological risk coefficient of Cd is between 40 and 80, which indicates medium potential ecological risk, mainly related to the relatively high toxicity response coefficient of Cd. Furthermore, the potential ecological risk coefficients of ten heavy metals in the sediments of BST are all less than 40, which indicates low potential ecological risk.

4.4. Source Apportionment of Heavy Metals in Lake Sediments

4.4.1. Correlation Analysis of Heavy Metal

The various heavy metal elements in the sediments show relative stability. When the sources of heavy metals in the sediments are consistent or similar, significant correlations will be exhibited. Through the correlation analysis of various heavy metal elements in sediments, the sources of heavy metal elements and the differences among their controlling factors can be preliminarily determined to reflect the intensity of human activities’ influence and the similarity of sedimentary environments [29,30]. The magnitude of the correlation coefficient reflects the degree of similarity, proximity, and closeness among various elements.
It can be seen from Table 4 that the correlation coefficients of Cr element in the sediments of CG and other measured heavy metal elements are all extremely significantly correlated (p < 0.01). Mn was extremely significantly correlated with Cr, Fe, Co, Ni, Cu, and Pb (p < 0.01) and significantly correlated with Cd (p < 0.05). Fe was extremely significantly correlated with Cr, Mn, Co, Ni, Cu, As, Cd, and Pb (p < 0.01). Co was extremely significantly correlated with Cr, Mn, Fe, Ni, Cu, As, Cd, and Pb (p < 0.01). Aside from being significantly correlated with Zn (p < 0.05), Ni was extremely significantly correlated with other metal elements (p < 0.01). Cu was not correlated with Zn and As but was extremely significantly correlated with other metal elements (p < 0.01). Zn was extremely significantly correlated with Cr and As (p < 0.01) and significantly correlated with Ni and Pb (p < 0.05). As was extremely significantly correlated with Cr, Fe, Co, Ni, Zn, Cd, and Pb (p < 0.01), while Cd was extremely significantly correlated with Cr, Fe, Co, Ni, Cu, As, and Pb (p < 0.01) and significantly correlated with Mn (p < 0.05). Pb was significantly correlated with Zn (p < 0.05) and was extremely significantly correlated with other metal elements (p < 0.01). Overall, there is a highly significant correlation among most heavy metal elements in CG. Since the content of these elements is higher than the corresponding soil background values, it indicates that these elements have a relatively consistent source of release due to human activities [32].
It can be seen from Table 5 that the Cr element in the sediments of WLS is extremely significantly correlated with Mn and Ni (p < 0.01) and significantly correlated with Cu. Mn was extremely significantly correlated with Cr, Ni, Cu, and Zn (p < 0.01) and significantly correlated with Pb (p < 0.05). Fe was extremely significantly correlated with Pb (p < 0.01) but had no correlation with other heavy metal elements. Co was extremely significantly correlated with Ni, Cu, Zn, and Pb (p < 0.01). Ni was significantly correlated with Cr, Mn, Co, Cu, Zn and Pb (p < 0.01). Cu was extremely significantly correlated with Mn, Co, Ni, Zn, and Pb (p < 0.01) and significantly correlated with Cr (p < 0.05). Zn was extremely significantly correlated with Mn, Co, Ni, Cu, and Pb (p < 0.01). As and Cd had no correlation with all heavy metal elements. Pb was extremely significantly correlated with Fe, Co, Ni, Cu, and Zn (p < 0.01) and significantly correlated with Mn (p < 0.05). The analysis results showed that As and Cd had no correlation with other heavy metal elements, indicating that the sources of these two heavy metals are different from those of other heavy metals. Cr has the same sources as Mn, Ni, and Cu, which are from discharge of domestic sewage. Zn has the same sources as Mn, Ni, Co, Cu, and Pb, which are probably from industrial activities release.
It can be seen from Table 6 that the Cr element in the sediments of BST was extremely significantly correlated with Co, Cu, Zn, Cd, and Pb (p < 0.01) and significantly correlated with Fe (p < 0.05). Mn was extremely significantly correlated with Pb (p < 0.01). Fe was extremely significantly correlated with Cu and Cd (p < 0.01) and significantly correlated with Cr, Co, Ni and Zn (p < 0.05). Co was extremely significantly correlated with Cr, Cu, Zn, Cd, and Pb (p < 0.01) and significantly correlated with Fe (p < 0.05). Ni was significantly correlated with Fe and Cu (p < 0.05). Cu was extremely significantly correlated with Cr, Fe, Co, Zn, Cd, and Pb (p < 0.01) and significantly correlated with Ni (p < 0.05). Zn was extremely significantly correlated with Cr, Co, Cu, Cd, and Pb (p < 0.01) and significantly correlated with Fe (p < 0.05). As has no correlation with all heavy metal elements. Cd was extremely significantly correlated with Cr, Fe, Co, Cu, Zn, and Pb (p < 0.01). Pb was extremely significantly correlated with Cr, Mn, Co, Cu, Zn, and Cd (p < 0.01). From the analysis results, it can be seen that As has no correlation with other heavy metal elements, indicating that the sources of As are different from those of other heavy metals, which are mainly derived from the emissions of coal from industrial activities. Mn and Pb have the same source, Cr has the same source as Fe, Co, Cu, Zn, Cd, and Pb, and Pb has the same source as Co, Zn, and Cd. These metals are mainly derived from the discharge of domestic sewage and agricultural wastewater from human activities [33].

4.4.2. Factor Analysis of Heavy Metals

Using the factor analysis method, the sources of the three lakes were analyzed separately (Table 7). The contribution rate of the first factor (PC1) of CG was 40.35%, and the main elements of the factor loading were Cr, Mn, Fe, Co, Ni, and Cu. The contribution rate of the second factor (PC2) was 22.334%, and the main elements of the factor loading were As, Cd, and Pb. The contribution rate of the third factor (PC3) was 17.149%, and the main elements of the factor loading were Cr, Zn, and As. The contribution rate of the first factor (PC1) of WLS was 36.327%, and the main elements of the factor loading were Co, Ni, Cu, and Zn. The contribution rate of the second factor (PC2) was 15.793%, and the main elements of the factor loading were Cr, Mn, and Ni. The contribution rate of the third factor (PC3) was 11.838%, and the main element of the factor payload was Pb. The contribution rate of the fourth factor (PC4) was 6.743%, and the main element of the factor loading was Cd. The contribution rate of the first factor (PC1) of BST was 38.21%, and the main elements of the factor loading were Cr, Cu, Zn, Cd, and Pb. The contribution rate of the second factor (PC2) was 13.057%, and the main elements of the factor loading were Mn and Pb. The contribution rate of the third factor (PC3) was 8.667%, and the main elements of the factor loading were Fe, Cu, and Pb.

4.5. Comparison of the History of Heavy Metal Pollution

The average of heavy metals in lake sediments is calculated for every ten-year stage (Table 8) and then compared with the background values of the soil in the region (Table 1). The relationship between the heavy metal content in the sediments and the background values can be clearly observed. Combining this with the types of pollution sources, the lakes in the study area are compared and analyzed.
From the 1960s–1970s to the 2010s–2020s, notable differences in heavy metal content existed among CG, WLS, and BST across different time stages. In the early stages (1960s–1980s), Fe content was consistently high in WLS, while Zn in CG started to show a rising trend from the 1980s. By the 1990s–2000s, Zn in CG had increased significantly and remained at a considerable level, and Cd in CG began to rise from the 2000s onward. In contrast, BST had relatively stable heavy metal levels throughout most stages, with Mn and Zn being more prominent elements. It was only in the later stages (2000s–2020s) that Cd in BST showed a slight rise, which differed from its low levels in most previous periods. Overall, the variations in heavy metal content among the three lakes reflected differing pollution impacts and environmental responses over time. CG experienced more pronounced changes in certain heavy metals, WLS maintained consistently high Fe levels, and BST showed relative stability with a late slight shift in Cd, all of which indicated distinct ecological and anthropogenic influence patterns for each lake.
Since the 1960s, human activities (including industrial, agricultural, and domestic emissions) and air pollution have started to impact the heavy metal content in lake sediments. There are distinct differences in pollution characteristics and sources among Lakes CG, WLS, and BST over different periods. In the 1960s, the overall pollution levels of the three lakes were mild, mainly stemming from natural sources and domestic emissions. Industrial impacts were limited. In CG, industrial and natural sources contributed relatively more to pollution. For WLS, heavy metals mainly originated from agricultural, domestic, and air pollution sources. As for BST, the pollution was primarily from natural sources, although excessive Ni and Pb came from industry and agriculture. From 1970 to 1980, industrial activities around CG intensified, and agricultural activities and air pollution around BST became more prominent. However, natural sources remained the primary pollution contributors, and there were no significant changes in WLS. The 1980s marked a turning point as frequent industrial activities led to an increase in the heavy metal content in sediments. In CG, there was a continuous increase in the concentration of As, a significant rise in Cr and Ni, and growing contributions from industrial and agricultural sources. In WLS, the Cd content increased notably due to intensified industrial, agricultural, and domestic activities. In BST, the heavy metal content remained stable, although the impacts of industrial and air pollution started to increase. From 1990 to 2000, the As content in CG continued to rise, the Zn content increased sharply, and domestic emissions and air pollution became major influencing factors. The Cd content in WLS rose significantly, with intensified impacts from industrial, agricultural, and domestic sources. BST still relied on natural sources, but the influences of industrial, agricultural activities, and air pollution were further strengthened. Between 2000 and 2010, industrial sources and air pollutants emerged as the core drivers of heavy metal increases (while agricultural impacts declined), resulting in an increase in As, Cd, Mn, Fe, Ni, and Cu (and a decrease in Zn) in CG; a decrease in Cr and Cd in WLS (as agricultural activities slowed down); and significantly higher levels of Zn, Cd, and Pb in BST (due to increased contributions from industrial, natural, and agricultural sources and minor impacts from domestic and air pollution). After the 2010s, industrial, agricultural, natural, and air pollution sources all increased (especially agricultural sources) in Lake CG. WLS experienced an improvement in the impact of natural sources (alongside higher levels of agricultural and air pollution). In Lake BST, air pollution rose, and vehicle exhaust emissions are now detectable in its sediment heavy metals.

4.6. Evolution Prediction of Heavy Metal Elements in Lake Sediments

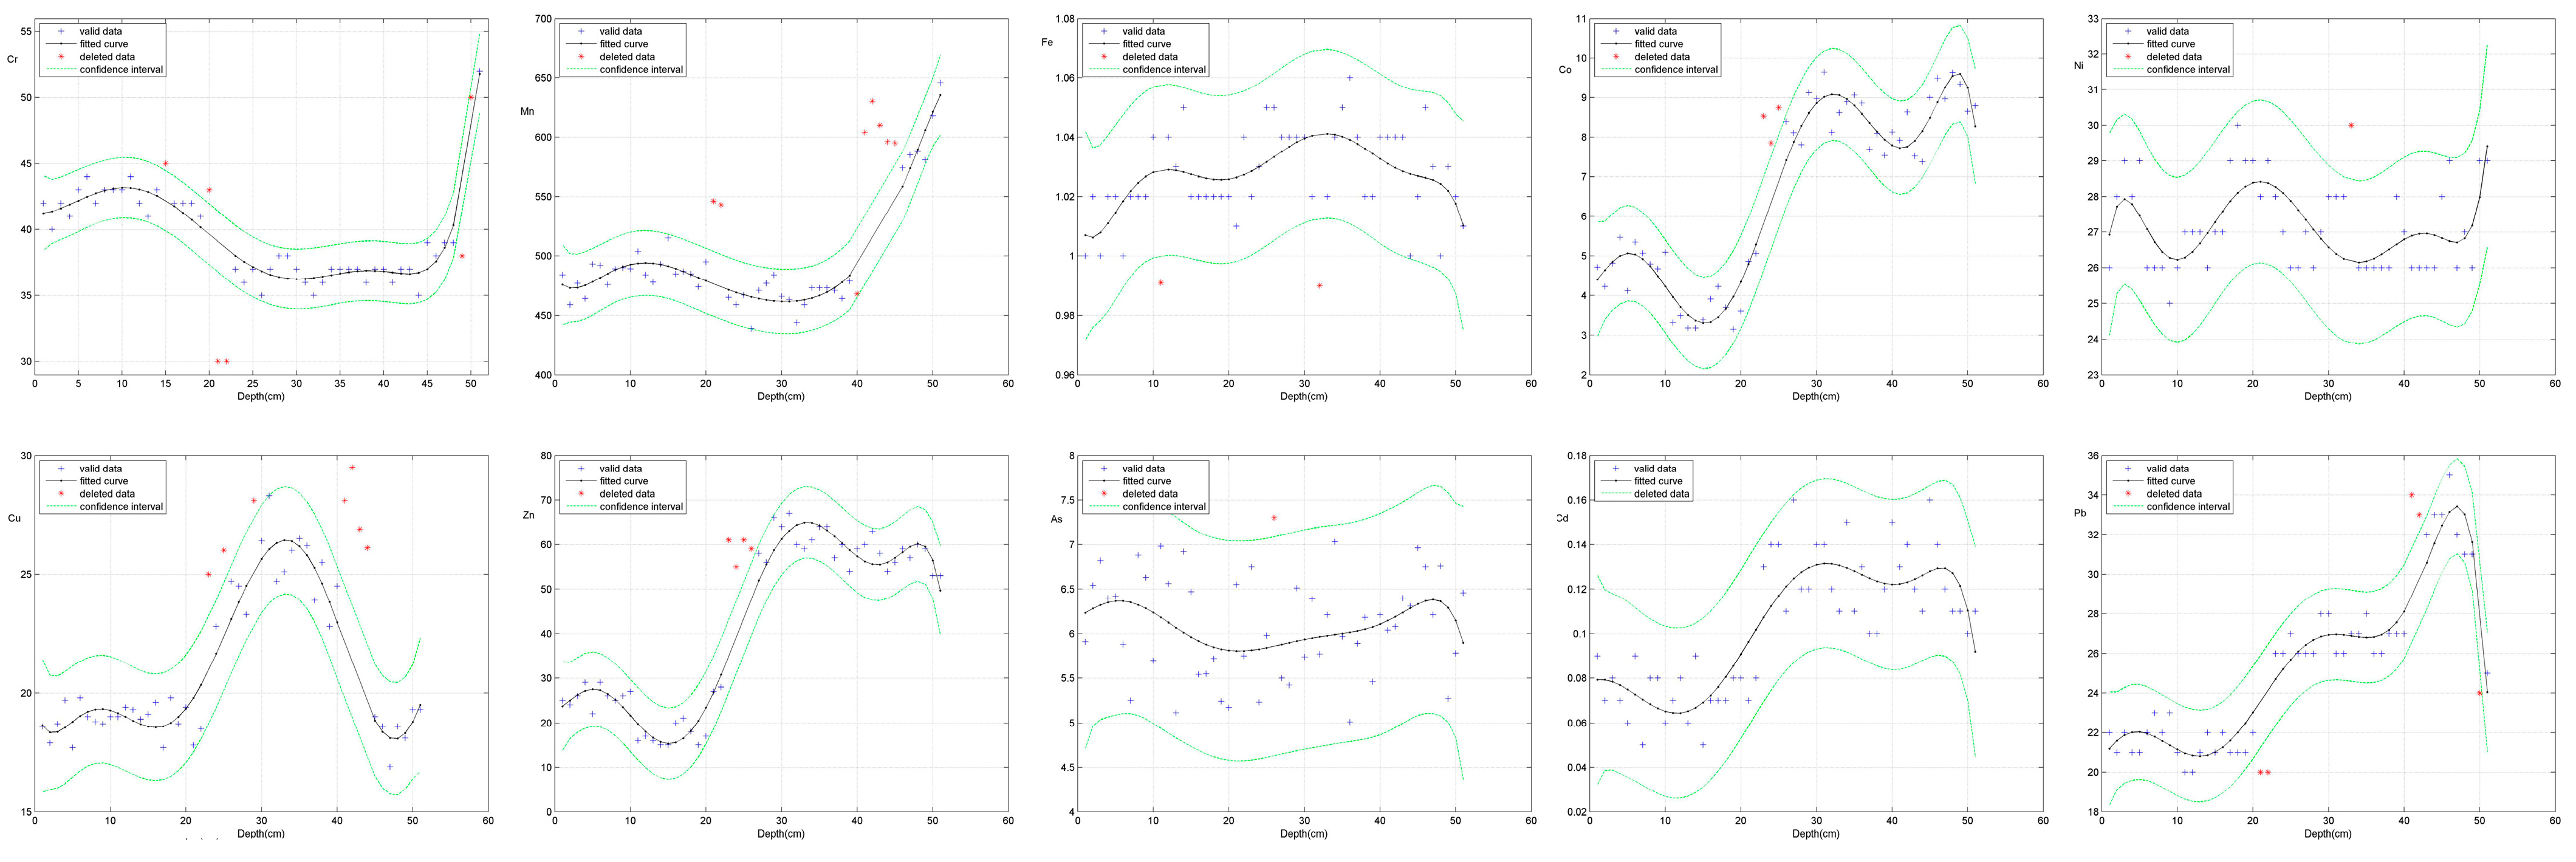
We calculated and analyzed the heavy metal fitting curves of the sediments in three lakes, respectively. The heavy metal elements in the sediments of CG are generally on a downward trend, but all heavy metal elements are at high levels. It is indicated that industrial activities, air pollutants, agricultural activities, domestic emissions, and heavy metals from natural sources around CG continue to cause pollution to the lake, but the overall trend is weakening (Figure 8). From the trend of heavy metal content in the sediments of WLS, the content of Fe and As elements is on the rise, while the content of other heavy metal elements is beginning to decline. The influence of heavy metals from industrial activities and natural sources on WLS continues to strengthen. Although the content of Co, Ni, and Zn shows a downward trend, the overall content is still at a high level (Figure 9). Industrial activities, agricultural activities, and air pollutants still have a continuous impact on BST. The contents of heavy metals Cr, Mn, Ni, and Cu in the sediments of BST are on the rise, while the contents of other heavy metal elements are on the decline. Although Fe, Co, Zn, As, Cd, and Pb show a downward trend, their overall contents are still at a high level. Industrial activities, agricultural activities, domestic emissions, and air pollutants still have a strong and continuous impact on BST (Figure 10).

4.7. Limitations

This study on heavy metals in the sediments of three northern Chinese lakes (Bosten Lake, Wuliangsuhai Lake, and Chagan Lake) provides insights into pollution characteristics and trends, yet it exhibits several limitations. First of all, research on quantitative assessment of human health risks and exposure risks needs to be strengthened. Secondly, in-depth analysis of the relationship between metal elements and other soil physical and chemical indicators (such as organic carbon, particle size, and pH) during the deposition process is necessary. Finally, when conducting metal prediction simulations, the impact of climate change needs to be taken into account.

5. Conclusions

The content of heavy metals in the sediments of the three lakes gradually increased over time. However, the heavy metal elements with increased content in different lakes were not the same. The order of the content of various heavy metal elements from high to low was CG, Wuliangsu Lake, and BST. The content of heavy metals in the sediments of CG was relatively stable before 1982. It began to fluctuate between 1982 and 2003. After 2003, the content of heavy metals gradually increased, among which Cd and Pb rose most significantly. The content of heavy metals in the sediments of Wuliangsu Lake was relatively stable before 1997. From 1997 to 2009, fluctuations began to occur, with the contents of Cr and Mn even starting to decrease. After 2009, the content of heavy metals began to increase significantly, with the contents of Cr, Mn, Ni, Cu, and Zn rising sharply. The content of heavy metals in the sediments of BST remained relatively stable before 1996. From 1996 to 2009, the content of heavy metals began to rise on the largest scale, among which the contents of Co, Cu, Zn, Cd, and Pb increased significantly. After 2009, the contents of Mn and Pb rose sharply again.
By using the method of multivariate statistics, heavy metals can be roughly classified into three major categories based on their sources. Firstly, Co, Cu, Zn, Cd, As, and Pb have homology, including wastewater, waste residue, and waste gas produced by industrial activities, pesticide residues from agricultural activities, and pollution from domestic sewage, all of which are factors greatly influenced by human activities. Secondly, the sources of the two heavy metals Cr and Ni are relatively complex. Both natural sources and human activities can have an impact on them. Secondly, the two heavy metals Mn and Fe are relatively stable, basically of natural origin, and less affected by human activities. Using statistical regression analysis models, the future development trends of heavy metal content in sediments of various lakes were predicted, and the development trend of lake pollution was analyzed. This comparative framework is valuable for generalizing findings to other lakes in similar climatic regions, enhancing the broader scientific understanding of lake sediment pollution, and guiding regional-scale ecological restoration efforts.

Author Contributions

Conceptualization, L.S. and R.X.; methodology, L.S., S.Z. and H.N.; software, R.X.; validation, S.Z. and H.N.; investigation, R.X.; writing—original draft preparation, R.X.; writing—review and editing, L.S. and H.N. All authors have read and agreed to the published version of the manuscript.

Funding

This research was funded by Heilongjiang Postdoctoral Foundation (LBH-Z22256), Natural Science Foundation of Heilongjiang Province (PL2024D005), Research Project of Excellent Master’s and Doctoral Dissertations in the Longjiang New Era (LJYXL2022-012), and the Basic Research Support Program for Excellent Young Teachers in Provincial Undergraduate Universities in Heilongjiang Province (YQJH2023161).

Data Availability Statement

The original contributions presented in this study are included in the article. Further inquiries can be directed at the corresponding author.

Conflicts of Interest

The authors declare no conflicts of interest.

References

  1. Li, D.P.; Yu, R.D.; Chen, J.; Leng, X.; Zhao, D.H.; Jia, H.T.; An, S.Q. Ecological risk of heavy metals in lake sediments of China: A national-scale integrated analysis. J. Clean. Prod. 2022, 334, 130206. [Google Scholar] [CrossRef]
  2. Phillips, D.P.; Human, L.R.D.; Adams, J.B. Wetland plants as indicators of heavy metal contamination. Mar. Pollut. Bull. 2015, 92, 227–232. [Google Scholar] [CrossRef]
  3. Miao, Y.Q.; Gu, J.X.; Gao, Z.J.; Lyu, J.; Sun, F.H.; Wu, C.S.; Liu, X.; Hong, W.L.; Lin, Y.S.; Wang, H.; et al. Distribution, Potential Sources, and Risks of Heavy Metal Contamination in the Huaihe River: Insights from Water and Sediment Analysis. Sustainability 2025, 17, 3548. [Google Scholar] [CrossRef]
  4. Sun, D.Y.; Yang, Y.; Zang, S.Y.; Ren, X.X.; Xue, Z.C.; Wang, Y.; Sun, L.; Wu, C.W.; Li, J.D.; Liu, Y.X.; et al. Spatial and Temporal Variations in Heavy Metals in Lake and Reservoir Sediments in China: A Pollution Status and Risk Assessment. Sustainability 2024, 16, 9218. [Google Scholar] [CrossRef]
  5. Zhang, P.; Pan, X.M.; Wang, Q.Y.; Ge, G.; Huang, Y. Toxic effects of heavy metals on the freshwater benthic organisms in sediments and research on quality guidelines in Poyang Lake, China. J. Soils Sediments 2020, 20, 3779–3792. [Google Scholar] [CrossRef]
  6. Cheng, H.X.; Li, M.; Zhao, C.D.; Yang, K.; Li, K.; Peng, M.; Yang, Z.F.; Liu, F.; Liu, Y.G.; Bai, R.J.; et al. Concentrations of toxic metals and ecological risk assessment for sediments of major freshwater lakes in China. J. Geochem. Explor. 2015, 157, 15–26. [Google Scholar] [CrossRef]
  7. Zhang, Z.X.; Lu, Y.; Li, H.P.; Tu, Y.; Liu, B.Y.; Yang, Z.G. Assessment of heavy metal contamination, distribution and source identification in the sediments from the Zijiang River, China. Sci. Total Environ. 2018, 645, 235–243. [Google Scholar] [CrossRef]
  8. Jian, R.F.; Yue, F.J.; Zhu, Z.Z.; Liu, X.L.; Zhang, L.Y. Temporal and spatial variation of heavy metals in coastal wetlands around the Bohai Sea and analysis of their sources. China Environ. Sci. 2023, 11, 6025–6038. [Google Scholar]
  9. Varol, M. Assessment of heavy metal contamination in sediments of the Tigris River (Turkey) using pollution indices and multivariate statistical techniques. J. Hazard. Mater. 2011, 195, 355–364. [Google Scholar] [CrossRef] [PubMed]
  10. Ke, X.; Gui, S.F.; Huang, H.; Zhang, H.J.; Wang, C.Y.; Guo, W. Ecological risk assessment and source identification for heavy metals in surface sediment from the Liaohe River protected area, China. Chemosphere 2017, 175, 473–481. [Google Scholar] [CrossRef] [PubMed]
  11. Xu, Y.F.; Wu, Y.; Han, J.G.; Li, P.P. The current status of heavy metal in lake sediments from China: Pollution and ecological risk assessment. Ecol. Evol. 2017, 7, 5454–5466. [Google Scholar] [CrossRef]
  12. Xie, F.Y.; Yu, M.C.; Yuan, Q.K.; Meng, Y.; Qie, Y.K.; Shang, Z.M.; Luan, F.B.; Zhang, D.L. Spatial distribution, pollution assessment, and source identification of heavy metals in the Yellow River. J. Hazard. Mater. 2022, 436, 129309. [Google Scholar] [CrossRef] [PubMed]
  13. Zhang, Y.L.; Qin, B.Q.; Zhu, G.W.; Song, C.Q.; Deng, J.M.; Xue, B.; Gong, Z.J.; Wang, X.L.; Wu, J.L.; Shi, K.; et al. Importance and main ecological and environmental problems of lakes in China. Sci. Bull. 2022, 67, 3503–3519. [Google Scholar] [CrossRef]
  14. Qin, Z.H.; Li, L.; Wu, X.Q. Analysis of the Sources of Soil Heavy Metals in Geological High-Background Areas at a Large Spatial Scale. Sustainability 2025, 17, 3518. [Google Scholar] [CrossRef]
  15. El-Sharkawy, M.; Alotaibi, M.O.; Li, J.; Du, D.; Mahmoud, E. Heavy Metal Pollution in Coastal Environments: Ecological Implications and Management Strategies: A Review. Sustainability 2025, 17, 701. [Google Scholar] [CrossRef]
  16. Sun, L.; Zang, S.Y. Relationship between polycyclic aromatic hydrocarbons (PAHs) and particle size in dated core sediments in Lake Lianhuan, Northeast China. Sci. Total Environ. 2013, 461, 180–187. [Google Scholar] [CrossRef] [PubMed]
  17. Zhuang, Q.F.; Li, G.; Liu, Z.Y. Distribution, source and pollution level of heavy metals in river sediments from South China. Catena 2018, 170, 386–396. [Google Scholar] [CrossRef]
  18. Sun, H.J.; Sun, L.; Zang, S.Y. Pollution history, source and transport path for PAHs in dated sediment cores from four lakes in Northern China. J. Clean. Prod. 2022, 374, 133994. [Google Scholar] [CrossRef]
  19. Lin, Q.; Liu, E.F.; Zhang, E.L.; Li, K.; Shen, J. Spatial distribution, contamination and ecological risk assessment of heavy metals in surface sediments of Erhai Lake, a large eutrophic plateau lake in southwest China. Catena 2016, 145, 193–203. [Google Scholar] [CrossRef]
  20. Ma, X.; Wang, X.D.; Gao, Y.L.; Yue, F.J.; Chen, W. Geochemical Indicators on the Central Tibetan Plateau Lake Sediments: Historical Climate Change and Regional Sustainability. Sustainability 2024, 16, 8186. [Google Scholar] [CrossRef]
  21. Ahmad, N.; Singh, S.P.; Sahu, S.; Bhattacharyya, R.; Maurya, A.S.; Kumar, N.; Rout, R.K.; Tripathy, G.R. Isotopic evidence of autochthonous organic matter acting as a major sink of anthropogenic heavy metals in modern lacustrine sediments. Environ. Pollut. 2024, 349, 123964. [Google Scholar] [CrossRef]
  22. Ogola, J.O.; Olale, K.; Mogwasi, R.; Mainya, O. Organochlorine pesticide residues in water and sediments in river Kibos-Nyamasaria in Kisumu County: An inlet river of Lake Victoria, Kenya. Sci. Afr. 2024, 23, e02094. [Google Scholar] [CrossRef]
  23. Duan, L.Z.; Luo, L.C.; Zhang, L.W.; Li, D.L.; Li, H.Y.; Xu, T.B.; Xu, J.; Zhang, H.C. The Occurrence of Microplastics Pollution in the Surface Water and Sediment of Lake Chenghai in Southwestern China. Water 2024, 16, 2672. [Google Scholar] [CrossRef]
  24. Xie, R.F.; Sun, D.Y.; Sun, L.; Zhang, N.N.; Zhang, J.W.; Zang, S.Y. Sediment record of heavy metals over the last 150 years in Northeast China: Implications for regional anthropogenic activities. Ecotoxicology 2021, 30, 1354–1365. [Google Scholar] [CrossRef]
  25. Miranda, L.S.; Ayoko, G.A.; Egodawatta, P.; Goonetilleke, A. Adsorption-desorption behavior of heavy metals in aquatic environments: Influence of sediment, water and metal ionic properties. J. Hazard. Mater. 2022, 421, 126743. [Google Scholar] [CrossRef]
  26. Zhang, M.; Sun, X.; Hu, Y.; Chen, G.; Xu, J.L. The influence of anthropogenic activities on heavy metal pollution of estuary sediment from the coastal East China Sea in the past nearly 50 years. Mar. Pollut. Bull. 2022, 181, 113872. [Google Scholar] [CrossRef] [PubMed]
  27. Wan, G.J. Progresses on 137Cs and 210Pbex Dating of Lake Sediments. Adv. Earth Sci. 1995, 10, 188–192, (In Chinese with English Abstract). [Google Scholar]
  28. Arnaud, F.; Magand, O.; Chaoron, E.; Bertrand, S.; Boës, X.; Charlet, F.; Mélières, M.-A. Radionuclide dating (210Pb, 137Cs, 241Am) of Recent Lake Sediments in a Highly Active Geodynamic setting (Lakes Puyehue and Icalma-Chilean Lake District). Sci. Total Environ. 2006, 366, 837–850. [Google Scholar] [CrossRef]
  29. Walling, D.E.; He, Q. Use of fallout 137Cs in investigations of overbank sediment deposition on river floodplains. Catena 1997, 29, 263–282. [Google Scholar] [CrossRef]
  30. Juan, Y.Y.; Huang, H.; Wang, X.D. Sedimentary Heavy Metal Pollution in the Huaihe River. Res. Environ. Sci. 2003, 16, 26–28. [Google Scholar]
  31. Sojka, M.; Jaskula, J. Heavy Metals in River Sediments: Contamination, Toxicity, and Source Identification—A Case Study from Poland. Int. J. Environ. Res. Public Health. 2022, 19, 10502. [Google Scholar] [CrossRef] [PubMed]
  32. Liu, S.; Zhang, J. The Normalization problem of heavy metals in Sediments: A Case Study of Al. Donghai Mar. Sci. 1998, 16, 48–55, (In Chinese with English Abstract). [Google Scholar]
  33. Wang, L.; Wang, Y.P.; Xu, C.X.; An, Z.Y.; Wang, S.M. Analysis and evaluation of the source of heavy metals in water of the River Changjiang. Environ. Monit. Assess. 2011, 173, 301–313. [Google Scholar] [CrossRef] [PubMed]
Figure 1. Location map of the study area.
Water 17 02884 g001
Figure 2. Results of 137Cs and 210Pb dating: (a) CG, (b) WLS, and (c) BST.
Water 17 02884 g002
Figure 3. Vertical distribution of heavy metals in CG (black represents the measured data and red represents the corrected data).
Water 17 02884 g003
Figure 4. Vertical distribution of heavy metals in WLS (black represents the measured data and red represents the corrected data).
Water 17 02884 g004
Figure 5. Vertical distribution of heavy metals in BST (black represents the measured data and red represents the corrected data).
Water 17 02884 g005
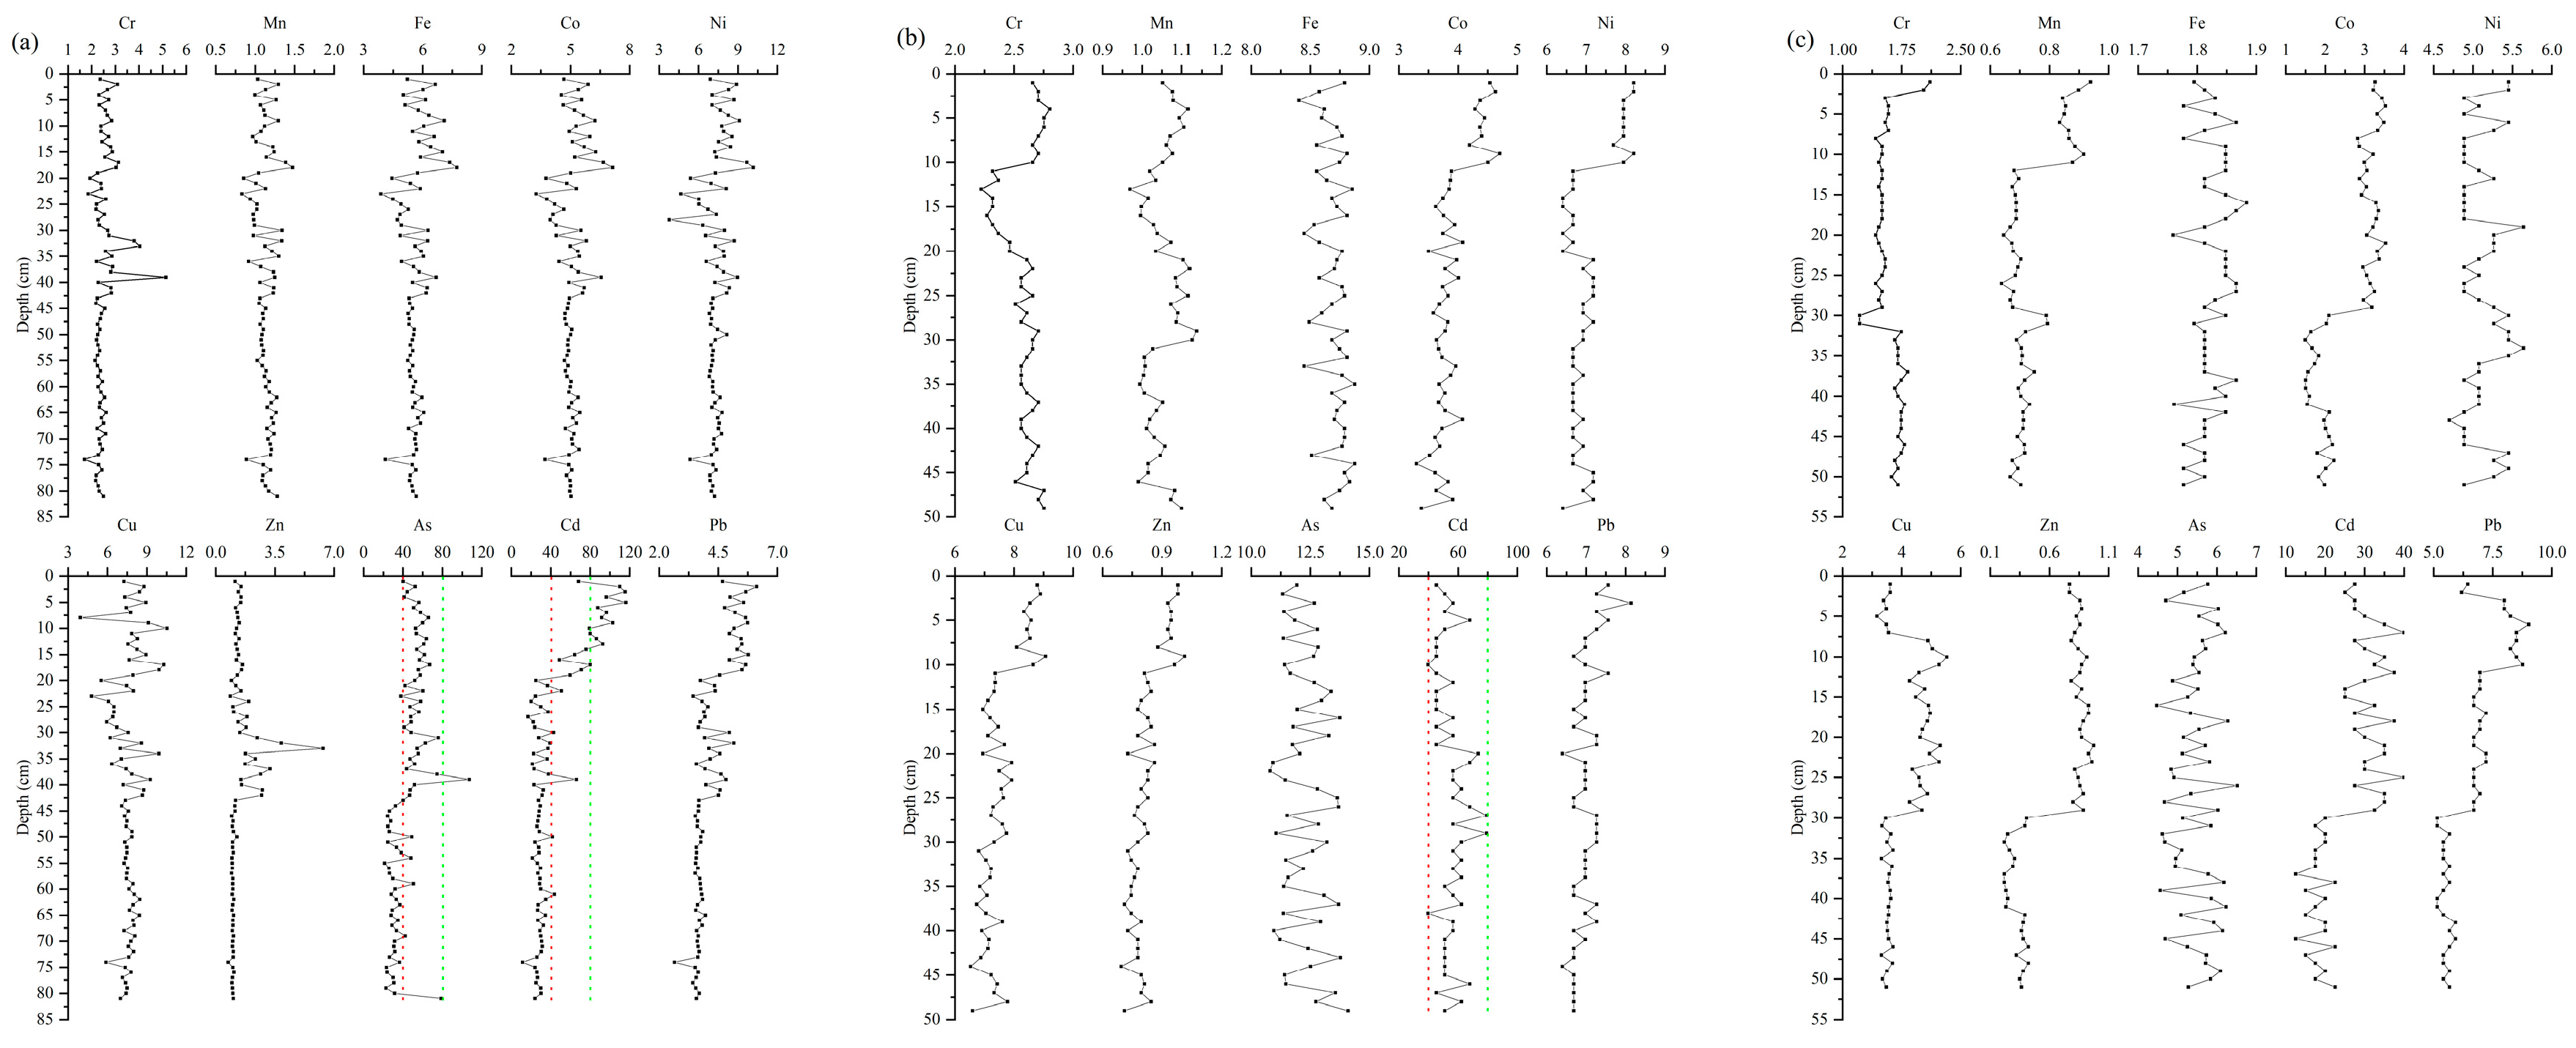
Figure 6. Vertical distribution of Igeo in lake sediments (a) CG, (b) WLS, and (c) BST. Red, green and purple dotted lines represent the threshold values of unpollution, slight pollution, and slight-to-moderate pollution, respectively).
Water 17 02884 g006
Figure 7. Vertical distribution of potential risk ecological hazard index Eir in lake sediments (a) CG, (b) WLS, and (c) BST. Red and green dotted lines represent low and moderate ecological risks, respectively).
Water 17 02884 g007
Figure 8. Fitting curve of heavy metal element data in sediments of CG.
Water 17 02884 g008
Figure 9. Fitting curve of heavy metal element data in sediments of WLS.
Water 17 02884 g009
Figure 10. Fitting curve of heavy metal element data in sediments of BST.
Water 17 02884 g010
Table 1. Soil background value of heavy metal elements (mg/kg).
CrMnFeCoNiCuZnAsCdPb
CG46.76362.7411.921.417.180.48.00.09928.8
WLS41.45202.3110.319.514.459.17.50.05317.2
BST49.36882.7815.926.626.768.811.20.1219.4
Table 2. Grading standards of pollution levels based on Igeo.
Practically UnpollutionSlight PollutionSlight to Moderate PollutionModerate PollutionModerate to High PollutionHigh PollutionExtreme Pollution
Pollution level0123456
Igeo≤00–11–22–33–44–5>5
Table 3. Potential ecological risk assessment indicator and classification.
LowModerateModerate to HighHighExtremely High
Eir<4040–8080–16080–320≥320
Table 4. Correlation matrix of heavy metal elements in sediments of CG.
CrMnFeCoNiCuZnAsCdPb
Cr10.517 **0.598 **0.633 **0.585 **0.426 **0.611 **0.606 **0.324 **0.497 **
Mn 10.822 **0.829 **0.747 **0.693 **0.1410.1370.244 *0.389 **
Fe 10.985 **0.886 **0.745 **0.1650.368 **0.547 **0.712 **
Co 10.898 **0.757 **0.1670.360 **0.510 **0.660 **
Ni 10.715 **0.220 *0.354 **0.561 **0.662 **
Cu 10.0650.1440.372 **0.465 **
Zn 10.365 **0.0220.228 *
As 10.443 **0.596 **
Cd 10.887 **
Pb 1
Note: * indicates a significant correlation at the 0.05 level; ** indicates a significant correlation at the 0.01 level.
Table 5. Correlation matrix of heavy metal elements in sediments of WLS.
CrMnFeCoNiCuZnAsCdPb
Cr10.617 **0.0410.2710.551 **0.359 *0.235−0.0910.1070.118
Mn 1−0.2330.2550.449 **0.460 **0.375 **0.0030.2570.304 *
Fe 1−0.216−0.082−0.196−0.187−0.1120.026−0.461 **
Co 10.869 **0.947 **0.929 **−0.247−0.2740.504 **
Ni 10.932 **0.881 **−0.206−0.1360.409 **
Cu 10.967 **−0.242−0.1560.482 **
Zn 1−0.202−0.2740.443 **
As 1−0.066−0.098
Cd 10.061
Pb 1
Note: * indicates a significant correlation at the 0.05 level; ** indicates a significant correlation at the 0.01 level.
Table 6. Correlation matrix of heavy metal elements in sediments of BST.
CrMnFeCoNiCuZnAsCdPb
Cr10.158−0.290 *−0.394 **0.134−0.506 **−0.478 **0.027−0.437 **−0.384 **
Mn 1−0.0730.260.003−0.1030.190.1430.1620.510 **
Fe 10.294 *−0.285 *0.379 **0.334 *−0.1150.365 **0.269
Co 1−0.1440.614 **0.980 **0.0810.842 **0.807 **
Ni 1−0.278 *−0.198−0.048−0.141−0.254
Cu 10.733 **−0.0160.654 **0.527 **
Zn 10.0490.864 **0.811 **
As 10.080.116
Cd 10.759 **
Pb 1
Note: * indicates a significant correlation at the 0.05 level; ** indicates a significant correlation at the 0.01 level.
Table 7. Factor loading after rotation of CG, WLS and BST.
Heavy MetalsCGWLSBST
PC1PC2PC3PC1PC2PC3PC4PC1PC2PC3
Cr0.4330.1780.8580.2030.757−0.0950.056−0.5080.179−0.0246
Mn0.8850.0150.1440.1690.7870.2790.1830.0180.8430.003
Fe0.8870.3750.185−0.024−0.033−0.7980.0710.308−0.1190.453
Co0.9080.3190.2100.9340.1120.217−0.1730.9080.3000.077
Ni0.8050.3710.2170.8460.4570.042−0.105−0.093−0.018−0.530
Cu0.7720.1850.0450.9260.2960.201−0.0710.715−0.1460.377
Zn0.0480.0130.6790.8970.1920.201−0.2090.9640.2000.159
As0.0740.4820.555−0.3200.0430.131−0.1990.0280.189−0.036
Cd0.2610.8770.030−0.1830.1720.0350.6930.8510.1790.180
Pb0.3670.8870.2440.4080.0840.5580.1500.6850.5740.336
Table 8. Average content of heavy metals in lake sediments for every ten years.
CrMnFeCoNiCuZnAsCdPb
1960s–1970sCG557403.0811.93026.98029.50.1122
WLS56.55654.056.526.520.74610.10.123
BST424781.014.828.718.725.76.550.0721.3
1970s–1980sCG536953.0111.63125.78225.80.0921
WLS54.75384.096.382720.445.89.390.09322.8
BST434851.015.072619.226.760.0722.3
1980s–1990sCG637213.1412.33226.614237.370.1423
WLS53.85294.096.7726.220.444.58.990.09823.9
BST42.94921.023.7826.519.1196.240.0721.3
1990s–2000sCG626672.8210.62822.5175420.123
WLS53.85674.076.727.221.5479.160.11424
BST385051.024.12918.7215.670.0720.8
2000s–2010sCG607183.4113.13427.810445.690.2129
WLS48.25304.046.8625.6721.048.49.430.08724.2
BST36.64741.038.4226.925.4606.30.12727
2010s–2020sCG617273.2912.63427.210741.690.3231
WLS56.15614.058.1331.224.756.39.020.08825
BST40.46021.028.7427.221.257.26.30.12230.9
Disclaimer/Publisher’s Note: The statements, opinions and data contained in all publications are solely those of the individual author(s) and contributor(s) and not of MDPI and/or the editor(s). MDPI and/or the editor(s) disclaim responsibility for any injury to people or property resulting from any ideas, methods, instructions or products referred to in the content.