Abstract
Armed conflicts continue to severely impact human populations and essential infrastructure, particularly water supply systems. This study examines the Yechilla area, a high-intensity battle corridor during the Tigray (between 12°15′26″ 14°57′49″ N latitude; and 36°20′57″–39°58′54″ E longitude) war (2020–2022). Using Cochran’s formula, a representative sample of 89 water schemes was selected for onsite assessment. Additional data on damages to water offices, personnel, equipment, and related infrastructure were gathered through face-to-face interviews with local officials and water professionals, onsite visits, and reviews of governmental and non-governmental archives, and previous studies. The findings reveal that 48.3% of water schemes in the study area are non-functional (does not deliver water), which is a significant increase from pre-war non-functionality rates of approximately 7.1% regionally and 21.1% nationally. Despite the Pretoria peace agreement, non-functionality levels remain critically high two years after conflict. Damage includes partial impairments, lack of technical and spare part support, complete destruction, and looting of water scheme components. The widespread destruction of civilian water infrastructure during the Tigray conflict underscores the insufficiency of existing international legal frameworks, such as the International Humanitarian Law and International Water Law, which are inadequately protecting civilians and their property. Understanding the broader consequences of armed conflicts requires examining the indirect effects and the complex interactions within and between social, economic, and environmental systems. These interconnected impacts are essential to fully grasp how conflict affects livelihoods and human security on a wider scale.
1. Introduction
Armed conflicts remain a serious challenge facing human society, causing 0.5–1 million deaths annually, along with many non-lethal impacts such as injuries and lost economic opportunities [1]. While numerous conflicts have occurred worldwide over time, the effects of war on water infrastructures and related hydrosystems are less frequently addressed in the literature. Many conflicts have had devastating impacts on human populations, natural resources, and key infrastructures built over generations [2].
Despite protections under the International Humanitarian Law (IHL) and International Water Law (IWL), civilians and water infrastructure continue to be targeted during armed conflicts. This violence undermines the principles of these legal frameworks, leading to severe humanitarian consequences, including the disruption of access to clean water and sanitation services [3,4].
World War I (WWI) and II (WWII) are widely recognized as the deadliest wars in history [5]. However, numerous armed conflicts have occurred since then, with both intentional and unintentional targeting of civilians and water infrastructures. According to the Armed Conflict Location and Event Data Project, conflict events and political violence have increased sharply in recent years. Between July 2020 and June 2021, ACLED recorded 100,272 armed conflict events, exposing 13% of the global population to conflict. By 2024, over 165,273 political violence events were recorded worldwide, which is a 15% increase from the previous. Approximately one in seven people worldwide experienced conflict exposure between July 2023 and 2024 [6,7,8]. Of the top 50 countries on the conflict index, 39 are currently experiencing sustained or escalating violence, with Ethiopia ranked 17th [8].
Between 2020 and 2022, major conflicts continued in several regions, including the war in Ethiopia’s Tigray region, Yemen, and the escalation of fighting in Ukraine. The Tigray conflict, involving the Tigrayan People’s Liberation Front (TPLF) and the Ethiopian government (and its allies), resulted in widespread violence, and human rights abuses, and one of the deadliest conflicts in recent history [9,10,11,12]. While scholars have examined civilian casualties, health infrastructure impacts, food insecurity environmental damage, education disruptions, and conservation issues related to the conflict [10,12,13,14,15,16], the specific impact on water infrastructure and hydrosystems remains largely unstudied. However, media outlets and international organizations report extensive destruction to decades of water supply improvements in Tigray [17]. The primary objective of this paper is to analyze the effects of the Tigray armed conflict on water infrastructures and key hydrosystems for the first time within selected battle corridors of the war.
2. Tigray Context and Study Site Corridors
2.1. Geographic Location and Climate
The Tigray region of Ethiopia is situated in the horn of Africa. It shares borders with Eritrea to the north, Sudan to the west, the Amhara Regional State to the south, and the Afar Regional State to the east. The region lies within the tropics, between 12°15′26″–14°57′49″ N latitude, and 36°20′57″–39°58′54″ E longitude. It covers more than 54,593 km2 (5,459,300 ha). Since 1995, Tigray has been divided into seven administrative zones. These zones are Western, Northwestern, Central, Eastern, Southeastern, Southern, and Mekelle. There are 94 Woredas (districts) and 820 Tabias (lowest administrative level) in the region. Each Woreda represents a distinct area within Tigray and serves as an administrative unit for governance and public services.
Tigray has varied topography; much of it is highlands with peaks of volcanic mountains distributed in many parts. The mountains and plateau are dissected with deep gorges/rivers flowing towards the western and eastern lowland areas. The elevation ranges from 650 m.a.s.l. in the western lowlands of Setit-Humera to ~3939 m.a.s.l. in the mountains of Tsibet and Alage in the south.
Tigray has made significant efforts and achieved various milestones. However, it continues to face challenges related to shortage of potable water and inadequate water harvesting activities. The area is classified as an arid and semi-arid region based on climatic conditions [18,19]. The annual rainfall in the region varies from 350 mm in the eastern Erob area to 900 mm in the western highland and Astbi Horst areas. In most parts of the region, 50–70% of the annual rainfall occurs in July and August only [18,20,21]. Historical records from 1954 to 2008 show that the mean annual rainfall is 560.7 mm [19] (Table 1). The rainfall can be intense, with showers reaching up to 68 mm/h [19,22,23,24], while most months remain dry. Due to such rainfall fluctuations, it is common to find rivers in the area either running dry or becoming intermittent. In such circumstances, the construction of water harvesting schemes becomes indispensable for the clear reason that water is needed for the longer dry period. Subject to update and further detailed investigation, Tigray’s surface water potential as identified and estimated in different integrated river basin master plans and other technical reports is 9000 Mm3 (Table 1) while groundwater potential is estimated as 250 Mm3 [25]. The mean annual temperature ranges between 16 and 38 °C.

Table 1.
Inventoried well types and their distribution.
2.2. Demographic and Economic Situation
Tigray has a population of 6.9 million [26] growing at 3.2 percent annually. About 73 percent of this population lives in rural areas and the remaining 27% reside in urban areas. Urbanization is growing at 4.6% [27]. The agricultural sector is vital to Tigray’s socio-economy, employing around 80–85% of the population. It contributes approximately 36.57% to the total GDP. Crops make up 23.8% of the sector, livestock and their products make up 9.2% of the sector, forests and hunting make up 3.2% of the sector, and fish contribute to 0.1% of the sector. [28,29].
The projected report by [26] showed that the total population of Tigray was about 6,872,218. Of this population size, nearly 5 million (72%) live in rural areas while the 1.9 million (28%) reside in urban areas [30]. The economic background of Tigray is dominantly agrarian with little contribution from services and industry. The people’s sustenance relies primarily on subsistence farming, which encompasses a diverse range of agricultural practices, such as rain-fed crop cultivation and the rearing of livestock.
2.3. Description of the Study Corridor
One of the selected corridors where repeated and intense armed conflict occurs is “Dengolat-Gijet-Esret-Yechilla” and “Yechilla-shewate Higum” (Figure 1). These routes are among the regions that endure repeated and prolonged conflicts, characterized by heavy bombardments and air strikes. The relentless nature of the violence has severely impacted the local communities and infrastructure, leading to significant humanitarian crises. The continuous military engagements in these areas not only disrupt daily life but also impede access to essential services and resources, exacerbating the challenges faced by the population. As a result, these routes have become critical focal points for assessing the broader implications of the conflict on both the environment and the well-being of the affected communities, including impacts on water supply infrastructures.
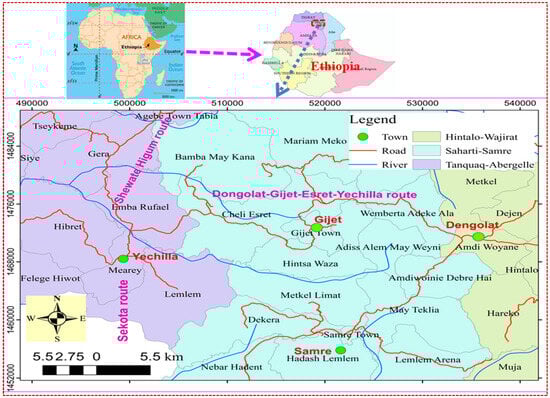
Figure 1.
General location of the battle corridor (Yechilla area) with Africa and Ethiopia as inset (top).
3. Methods
3.1. Data Collection and on Spot Water Infrastructure Inventory
Between October 2023 and March 2025, an extensive inventory of water supply schemes was conducted along the two routes. It was the first of its kind for the locality with the present level of detail. In addition to the list of damaged facilities from the local administration, systematic and organized data were non-existent. This assessment involved carefully designed field data collection formats to ensure comprehensive and accurate information gathering onsite.
The total estimated water schemes in the study area are reported as different figures. The study is part of the three Woredas (Abergelle (a total of 470 water schemes), Seharti (a total of 307 water schemes) and Samre (a total of 283 water schemes)). The data from the three Woredas shows total water schemes of about 1060. For determining the sample size in groundwater well damage studies, a common formula that is often used in studies involving proportions is the Cochran’s formula [31]. This formula helps estimate the minimum sample size needed to achieve a desired level of precision and confidence (often without considering the total population of water schemes).
where n is the required sample size.
Z: Z-score corresponding to the desired confidence level (1.96 for a 95% confidence level was considered for this study).
p: Estimated proportion of well damage in the population (0.36 taken from previous studies conducted covering the larger area, the Tigray region, but excluding part of Southern and Western Tigray).
e: Desired margin of error or level of precision (0.1 was taken for the present study).
Accordingly, the estimated sample size was found to be 89. Actually, more than 89 wells were inventoried for contingency purposes in case the wells may overlap or get discarded for any reason and to increase the validity of the findings. Generally, a sample size that ranges between 5% and 10% is considered statistically acceptable. The finite population correction (FPC) is a statistical adjustment applied when sampling without replacement from a relatively small population. The larger the proportion of the sample size in relation to the finite population, the more benefit there is. The benefit becomes noticeable when the sample size is at least 10% of the population. For the present case, the sample size is only 8.2%; hence, the FPC was not considered into account.
The types of inventoried wells and their distributions are portrayed in Figure 2 and itemized in Table 1.
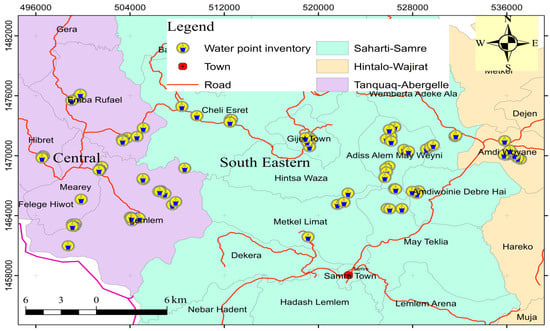
Figure 2.
Distribution of the water point inventory in the battle area.
Data collection efforts included not only systematic documentation of existing water supply infrastructure but also informal interviews with local community members and representatives from local water supply authorities. These conversations provided valuable insights into the challenges faced by the communities, the current state of water services, and the impact of the armed conflicts on water accessibility and destruction. By combining quantitative data with qualitative narratives, the study aimed to create a holistic understanding of the water supply situation in these areas, highlighting the urgent need for targeted interventions and support.
3.2. Qualitative Data Analysis
Qualitative data were collected from the field carefully with pre-prepared format. They were collected directly from ground observation and local people around the schemes and administrative bodies. Available archives were also collected from offices. The qualitative data were prepared in the form of tables and carefully reviewed for any patterns and compared for validation and findings through discussions.
3.3. Quantitative Data Analysis
Simple descriptive statistical analysis, bar graphs, spatial distribution maps, etc., were used for qualitative data analysis and interpretations. Comparisons were also made between pre-war and post-war in terms of degree of functionality and non-functionality of water schemes.
4. Results and Discussion
4.1. Damages on Common Livelihoods
The Tigray armed conflict has led to widespread destruction across various sectors, impacting both military and civilian targets indiscriminately. The violence has not only devastated infrastructures but has also severely disrupted the livelihoods of countless individuals and communities. Homes, schools [15], water supply schemes, and hospitals [14] have been damaged or destroyed, leaving many without access to essential services. Additionally, agricultural lands and related developments [32] have suffered significant damage, threatening food security and economic stability for families who depend on farming for their survival. The conflict’s pervasive nature means that the repercussions extend far beyond immediate casualties, creating a lasting humanitarian crisis that affects the social fabric and economic resilience of the region.
Dengolat (Amdiwoyane, Figure 1) is one of the lowest-level administrative units (Tabias) situated along the Dengolat–Gijet–Esret–Yechilla battle corridor, which has been profoundly affected by the armed conflict that unfolded in this area. This region has experienced significant turmoil, leading to extensive damage to infrastructure and disruptions to the daily lives of its residents (Figure 3). As a result, the local governance structures in Dengolat (Amdiwoyane) have faced immense challenges in providing essential services. The armed conflict has not only compromised the safety and security of the community but has also hindered economic activities, leaving many families struggling to meet their basic needs. In light of these challenges, the resilience of Dengolat (Amdiwoyane) and its inhabitants is being tested, making it crucial to assess the impact of the conflict and explore avenues for recovery and support. Examples of the damages collected from the field as well as from a focused group discussion with local administrative are presented in Table 2.
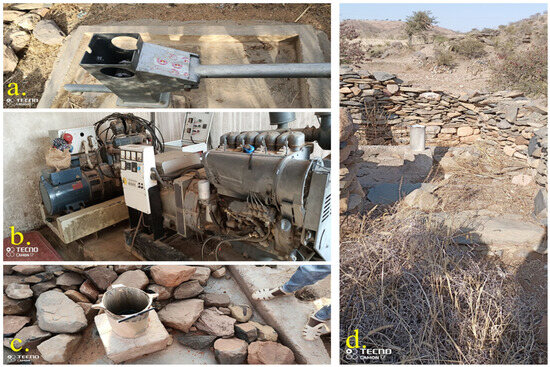
Figure 3.
Field photographs illustrating the destruction of water infrastructures: deliberate damage on hand pumps (a,c,d), deliberate damage and lootings of parts of the electrical generator of the water well (b).
Table 2.
Examples of damages reported from Amdiwoyane Tabia on the Dongolat–Gijet–Esret–Yechilla Battle Corridor.
The data reveals the extensive and profound impact of the conflict on local infrastructures and the livelihoods of community members, illustrating a crisis with far-reaching consequences. This analysis highlights not only the physical destruction of essential services such as water supply systems, agricultural infrastructures, offices and houses, and other facilities but also the significant disruption to economic activities that sustain families and their communities. The loss of infrastructure has led to increased unemployment rates, diminished access to education, and a decline in overall quality of life. As a result, many residents find themselves facing persistent challenges, including food insecurity and lack of access to basic necessities. The cumulative effects of these disruptions are deep-rooted, creating a cycle of poverty and instability that will require substantial efforts and resources to address. The findings underscore the urgent need for targeted interventions aimed at rebuilding and revitalizing the affected areas, as well as supporting the resilience of the local population in the aftermath of this crisis.
Another locality along this battle corridor is the Esret (Adiesher) area, which has also experienced severe consequences due to the repeated occurrences of armed conflict during the Tigray war. This region has been profoundly impacted by the violence, leading to significant destruction of infrastructure and disruption of everyday life for its residents. Communities in Esret have faced relentless turmoil, with ongoing military engagements resulting in damage to homes, agricultural infrastructures, public offices, and water related facilities (Table 3). The psychological toll on the population has been immense, as families have been forced to flee their homes, often leaving behind their livelihoods and personal belongings.
Table 3.
Examples of damage reported from the Esret (Adiesher) area on the Dongolat–Gijet–Esret–Yechilla Battle Corridor.
In addition to the immediate physical damage, the conflict has led the economic activities to be sharply declined, leaving many individuals without stable sources of income and exacerbating issues such as food insecurity. The resilience of the Esret (Adiesher) community is being tested as they navigate the consequences of this prolonged conflict. The necessity for comprehensive recovery efforts is paramount, focusing not only on rebuilding infrastructure but also on providing support to restore economic stability.
The third locality, known as the Yechilla area, is strategically situated at the junction of the two battle corridors and serves as a semi-urban hub. This area is uniquely positioned where four major routes converge: from the south along the Sekota route (Figure 1), from the west via the Tekeze dam road, from the east along the Gijet–Esret route, and from the north through the Abiadi/Shewate Higum route (Figure 1). This accessibility from multiple directions has made the Yechilla area a focal point for various armed conflicts during the Tigray war, leading to a series of intense battles and skirmishes.
As a result of the devastating armed conflict (war), the Yechilla area has suffered catastrophic damage and destruction. The relentless clashes have not only devastated the physical infrastructure, such as agricultural developments/facilities, buildings, and utility services (Table 4), but have also disrupted the daily lives of its residents. Many homes have been rendered uninhabitable during the active war, forcing families to seek refuge elsewhere in remote areas (in mountains, gullies, forest areas, etc.), while businesses and service providers have been forced to close, leading to widespread economic instability.
Table 4.
Examples of damage reported from the Yechilla area located at the junctions of the two battle corridors.
4.2. Water Infrastructure
Despite the 2010 UN Resolution that explicitly recognized the essential human right to water and sanitation, recent data show a disturbing trend, where access to water is regularly becoming a factor in armed conflicts around the world. The situation is worsening in Africa and other developing countries due to armed conflicts occurring in many parts of the continent. The Tigray War (2020–2022) compromised the water supply infrastructures. The situation led people to remain without access to basic needs including water. Consequently, all other services became disrupted due to the lack of water and the services themselves became affected by the armed conflict.
4.2.1. Descriptive Statistical Analysis
Initially, the evaluated water schemes were categorized based on their intended purposes. Approximately 81% of the water schemes were utilized for domestic purposes, primarily household drinking water. This was followed by 9% for irrigation, 5% for municipal water supply, 3% for educational institutions, and the remaining schemes were allocated for health centers (1%) and road construction (1%) (Table 5). During the field survey, it was observed that water schemes originally constructed for road construction were repurposed for use by internally displaced persons (IDPs) in the area. Notably, none of the inventoried water schemes were designated for military purposes.
Table 5.
Common uses of the water schemes in the study area.
The water schemes were further analyzed based on their ownership status, distinguishing between public and private ownership. As presented in Table 6, over 92% of the water schemes are publicly owned, primarily by community groups and public institutions. In contrast, approximately 8% of the schemes are privately owned by individuals and private companies. The survey, along with localized focus group discussions and input from local administrative bodies, confirmed that none of the water schemes in the study area are owned by military entities or associated organizations.
Table 6.
Common uses and ownership of the inventoried water schemes (n = 89).
One of the key parameters evaluated in this survey was the functionality status of the water schemes. The survey data indicate that 48.3% of the water schemes were classified as non-functional, while approximately 51.7% were functional (see Table 7, Figure 4 and Figure 5). These results clearly demonstrate the impact of armed conflict on water infrastructure in Tigray. Site visits within the study area and existing scientific research highlighted that the proportion of non-functional schemes is significantly higher compared to the status prior to the onset of the conflict. The result was evaluated using a 95% confidence interval (CI), indicating a 95% probability that the interval contains the true population proportion. The calculated CI of (38.36, 58.24) aligns well with the obtained result. This means that with 95% confidence, the true proportion of percentage non-functional water schemes is between 38.36% and 58.24%. This quantifies the uncertainty around the sample proportion and how it might vary if the survey were repeated under similar conditions, thereby improving the precision of the estimate.
Table 7.
Functionality and non-functionality status of the water schemes.
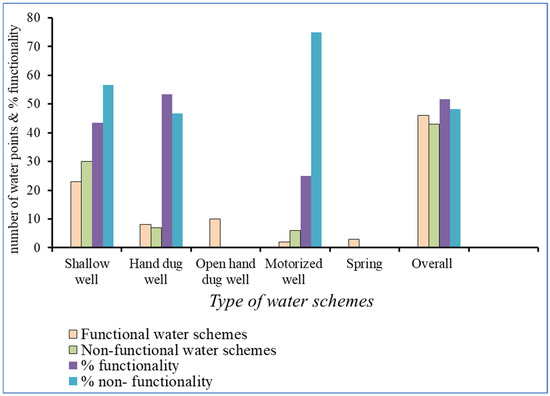
Figure 4.
Distribution of functional and non-functional water schemes.
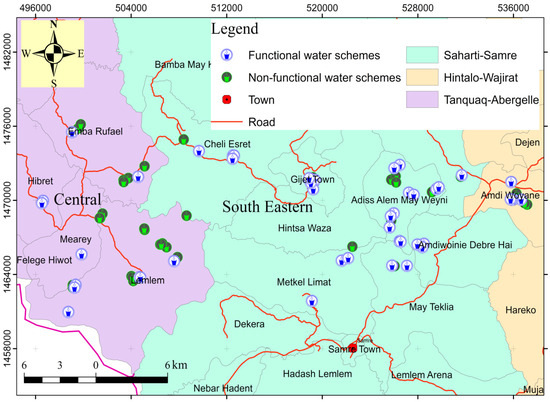
Figure 5.
Spatial distribution of the functional and non-functional water schemes of the battle corridors.
Before the armed conflict in Tigray in 2020, the non-functionality rate of water schemes was reported at 7.1%. According to a 2021 report by the Water Development Commission of the Federal Democratic Republic of Ethiopia (National WaSH Inventory-II and MIS), the national non-functionality rate for water supply systems was 19%, with a specific rate of 21.1% for the Tigray region.
The commonly observed damages to water schemes and infrastructure in the battle corridor are detailed in Table 8 and illustrated in a bar graph in Figure 6. The majority of the damage is categorized as partial damage (18%), which can be addressed with the deployment of technical personnel and financial resources. Following this, 12% of the issues stem from non-functionality due to the lack of minor spare parts and routine maintenance services. These water schemes can be restored to functionality through the procurement of necessary spare parts and services, which local water associations and the Woreda water offices can manage.
Table 8.
Nature and type of damages observed in the study area.
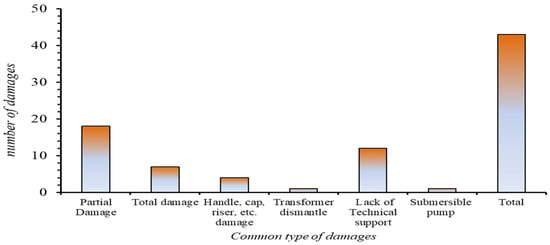
Figure 6.
Proportion of common types of damage to water schemes.
The next category of damage is total destruction (7%), which necessitates the relocation and re-drilling of new water wells. Additionally, 6% of the damage is attributed to intentional looting, involving the dismantling of specific components of the water schemes, such as parts of transformers, submersible pumps, and hand pumps. This categorical breakdown is beneficial for planning, prioritization, and resource allocation for both governmental and non-governmental organizations.
The overall status of water schemes in Tigray during the pre-war, wartime, and post-war periods, as referenced in the current study of the Yechilla area, is summarized in Table 9 and illustrated in Figure 7. This study aligns with findings from broader research conducted across the region, all of which indicate that armed conflict has had severe consequences for water infrastructure throughout Tigray. Significant efforts and financial resources will be required to restore the water infrastructure to at least its pre-war condition. A simple comparison of the status in 2024 (regional study) and 2025 (present study) indicates that no significant rehabilitation activities have taken place in the sector within the study area.
Table 9.
Summary and comparison of water scheme damage following the Tigray war.
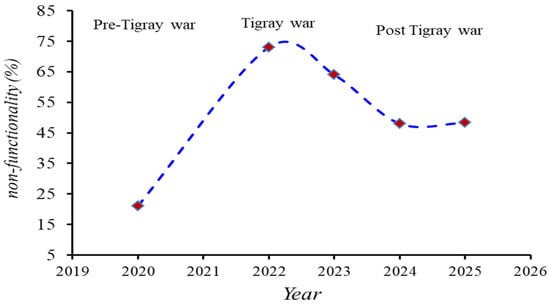
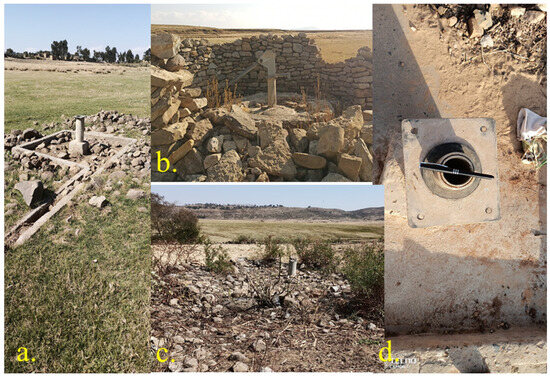
Figure 7.
Summary of the non-functionality status during pre- and post-Tigray war (data source: see Table 9) (top). Field photographs illustrating the deliberate nature of the damages on water schemes (bottom, a–d).
A comparative analysis of the consequences of armed conflict in Tigray, with selected countries experiencing similar conflicts, reveals that the damage to water infrastructure in Tigray has been exceptionally severe (Table 10). The results indicate that valuable experiences from other countries, particularly the Middle East, can inform quick and resilient rehabilitation of water infrastructure in the study area. Detailed policy implications and reconstruction strategies are discussed in Section 4.2.2. Integrated planning that involves local communities and NGOs, with a focus on transparency, resilience, and environmental sustainability, is essential.
Table 10.
Comparisons of selected armed conflicts from different parts of the globe.
4.2.2. International Laws and Tigray’s Water Infrastructure Damage
Water systems are essential for reducing and eliminating water-related illnesses and fatalities, safeguarding against extreme hydrological events, and ensuring a reliable water supply for food production for billions of people. These systems have also played a crucial role in alleviating poverty and easing the burdens placed on women and girls, who are often responsible for the labor-intensive task of collecting and transporting household water. Additionally, they are vital for achieving the Sustainable Development Goals (SDGs) for 2030, as outlined by the United Nations and the global community [39].
However, conflicts and violence that affect freshwater resources and existing water infrastructure pose significant threats to these critical benefits. The Tigray war serves as a notable example, as highlighted by field data and discussed by various international organizations and the media (e.g., [40,41,42,43,44]).
Water is essential for human civilization and development, recognized as a critical factor in international law. These laws highlight water’s importance for societal functioning and environmental sustainability. According to the Geneva Convention, specifically Article 54 of the 1977 Protocol I, parties in conflict are prohibited from attacking or destroying essential resources for civilian survival, including drinking water installations and supplies, and irrigation works. Protocol I protects victims of international armed conflicts, while Protocol II safeguards those affected by non-international armed conflicts [3,45], with both protocols emphasizing the protection of civilian water systems. Armed forces must avoid targeting these installations to prevent depriving civilians of food and water, which could lead to starvation or displacement (Protocol I, Article 54).
Despite the protective provisions outlined in international law, water infrastructure frequently suffers damage during armed conflicts [3]. This damage occurs both directly, when water facilities are targeted to undermine the livelihoods of communities, and indirectly, as collateral damage amidst broader military operations. Such destruction severely impacts the functionality of water institutions and the delivery of essential services to civilian populations.
Substantial evidence has emerged highlighting the extensive damage to environmental and water infrastructure during various conflicts. For instance, the Tigray war in Ethiopia (2020–2022) resulted in significant harm to water supply systems, exacerbating the humanitarian crisis in the region [46]. Similarly, conflicts in the Middle East have shown a troubling pattern of destruction of water facilities, which has been documented in studies that note the direct correlation between armed conflict and the deterioration of water infrastructure [47]. Furthermore, the ongoing conflict in Ukraine has led to widespread damage to water systems, with reports indicating that military actions have disrupted water supply and sanitation services, affecting millions of civilians [48].
The destruction of water infrastructure not only endangers immediate access to clean water but also has long-term repercussions on public health, food security, and socio-economic stability in affected regions. As such, it is imperative for international bodies and humanitarian organizations to prioritize the protection of water resources in conflict zones and to hold parties accountable for violations of international law. Gleick [3] concluded that the International Humanitarian Law has not effectively addressed or protected essential civilian infrastructure, particularly water resources and managed water systems. This shortfall is attributed to the laws being either insufficient in scope or poorly enforced. This shortfall of the law leads to millions of people facing critical water scarcity and waterborne diseases across the globe. The destruction of water infrastructure and inefficient reconstruction and rehabilitation activities following the Tigray war is a typical example. Based on the Water Conflict Chronology (Pacific Institute, [49]), the situation in Tigray can be considered as a casualty (direct attack on water systems). Similarly, according to the analytical framework of water and armed conflict of Zeitoun et al. [50], almost all of the destructions related to the water infrastructures are characterized as discriminatory in nature (a direct/intentional attack). According to studies by [51], three key dynamics within conflict-affected water systems have been identified as particularly relevant to the humanitarian sector: (1) insufficient financing for repairs and service provision, (2) destruction of critical infrastructure causing significant direct and indirect impacts, and (3) the crucial need to safeguard water quality in armed conflict settings. These dynamics directly or indirectly affect livelihoods and contribute to humanitarian crises, including challenges related to food security, health, and the environment. The findings from the Middle East by [51] closely mirror the impacts observed in the Tigray war, as demonstrated by the high proportion of non-functional water schemes found in the present study area. Like the present study, many others, e.g., [2,47,51], have examined the impact of armed conflict on civilians and infrastructure, strongly emphasizing and supporting urgent calls for conflict parties to strictly comply with international humanitarian and water laws protecting civilians and their infrastructure during armed conflict. A detailed recommendation and strategies for Ethiopia in the context Tigray war is depicted in [52].
5. Conclusions and Recommendation
This research provides a first assessment of armed conflict impacts on water supply systems and related services at the battle corridor level. Despite the ongoing humanitarian crisis and associated fatalities, the war in Tigray has resulted in significant destruction of water infrastructure and related ecosystems. Regional studies conducted thus far are corroborated by both local and large-scale investigation in selected battle corridors. The Yechilla area and its surroundings were chosen for a localized study due to the presence of multiple frontlines and their status as a center for major armed conflicts. The non-functionality rate of water schemes in this specific area has reached 48.3%, with partial damage accounting for up to 18%, followed by a lack of technical support at 12%.
The results of the present study confirm the reliability of previous region-wide assessments, excluding inaccessible peripheral areas due to security concerns. Furthermore, the findings indicate that substantial human and financial resources are essential to restore the functionality of water schemes to at least their pre-war condition.
Common indicators like water infrastructure damage and loss of life are important but only capture part of a conflict’s impact. To fully understand its effects on livelihoods and human security, indirect impacts and complex social, economic, and environmental interactions must be considered. Additionally, inclusive management that involves local communities helps ensure laws and reconstruction plans gain strong support, greatly improving their success. Overall, the study highlights a critical situation, with reconstruction and rehabilitation efforts being either non-existent or progressing at a very slow pace. The initiatives of both government and non-government organizations must be accelerated significantly; otherwise, the limited access to clean water will lead to a collapse of health, income, and overall livelihoods for the affected populations in the near future.
Author Contributions
G.B.: conceptualized the original research idea, methodology, and wrote the manuscript; T.G., M.H., K.A.A. and A.H.: proofread the manuscript; A.G.: helped in organizing field access with local administrative and data collection; T.H. and K.W.: solicited funding and supervised the overall project. All authors have read and agreed to the published version of the manuscript.
Funding
VLIR-UOS (Ghent University and Mekelle University): ET2023SIN389A103, RDPD/MU/EXTERNAL/004/2023.
Data Availability Statement
The datasets analyzed during the current study are included in the manuscript.
Acknowledgments
The authors would like to express their sincere gratitude to VLIR-UOS, Belgium for generously providing funds for the fieldwork and data collection process through the Short Initiative Research Project (ET2023SIN389A103) registered at Mekelle University (RDPD/MU/EXTERNAL/004/2023). The authors would also like to extend their appreciation to the rural and urban utility administrations of the study area.
Conflicts of Interest
The authors declare no conflicts of interest.
References
- Wang, Q.; Hao, M.; Helman, D.; Ding, F.; Jiang, D.; Xie, X.; Chen, S.; Ma, T. Quantifying the influence of climate variability on armed conflict in Africa, 2000–2015. Environ. Dev. Sustain. 2023, 25, 9289–9306. [Google Scholar] [CrossRef]
- Gharios, G.; Farajalla, N.; El Hajj, R. Challenges of post-war policy reforms in Lebanon’s water sector–lessons learned. Water Supply 2021, 21, 3672–3684. [Google Scholar] [CrossRef]
- Gleick, P.H. Water as a weapon and casualty of armed conflict: A review of recent water-related violence in Iraq, Syria, and Yemen. WIREs Water 2019, 6, e1351. [Google Scholar] [CrossRef]
- EU News. The Toll of Two Years of War on Water: Damage and Needs Assessment in Ukraine’s Water Sector. 2024. Available online: https://www.eu4waterdata.eu/en/blog-news/34-ukraine/334-the-toll-of-two-years-of-war-on-water-damage-and-needs-assessment-in-ukraine-s-water-sector.html (accessed on 20 February 2025).
- Kennedy, P.M. The First World War and the International Power System. Int. Secur. 1984, 9, 7–40. [Google Scholar] [CrossRef]
- Armed Conflict Location and Event Data (ACLED). 2024. Available online: https://acleddata.com/sites/default/files/wp-content-archive/uploads/dlm_uploads/2024/10/ACLED-Codebook-2024-7-Oct.-2024.pdf (accessed on 20 February 2025).
- Conflict Index. Available online: https://acleddata.com/conflict-index/ (accessed on 20 February 2025).
- Conflict Index Results: July 2024. Available online: https://acleddata.com/conflict-index/index-july-2024/ (accessed on 20 February 2025).
- Gesesew, H.; Berhane, K.; Siraj, E.; Siraj, D.; Gebregziabher, M.; Gebre, Y.G.; Gebreslassie, S.A.; Amdeslassie, F.; Tesema, A.G.; Siraj, A.; et al. The impact of war on the health system of the Tigray region in Ethiopia: An assessment. BMJ Glob. Health 2021, 6, e007328. [Google Scholar] [CrossRef] [PubMed]
- Manaye, A.; Afewerk, A.; Manjur, B.; Solomon, N. The Effect of the war on smallholder agriculture in Tigray, Northern Ethiopia. Cogent Food Agric. 2023, 9, 2247696. [Google Scholar] [CrossRef]
- Weldemichel, T.G. Tigray war: Modern geographies of mass violence and the invisibilization of populations. Political Geogr. 2025, 118, 103298. [Google Scholar] [CrossRef]
- Weldegiargis, A.W.; Abebe, H.T.; Abraha, H.E.; Abrha, M.M.; Tesfay, T.B.; Belay, R.E.; Araya, A.A.; Gebregziabher, M.B.; Godefay, H.; Mulugeta, A. Armed conflict and household food insecurity: Evidence from war-torn Tigray, Ethiopia. Confl. Health 2023, 17, 22. [Google Scholar] [CrossRef]
- Meaza, H.; Ghebreyohannes, T.; Tesfamariam, Z.; Gebresamuel, G.; Demissie, B.; Gebregziabher, D.; Nyssen, J. The effects of armed conflict on natural resources and conservation measures in Tigray, Northern Ethiopia. Int. Soil Water Conserv. Res. 2025, 13, 463–474. [Google Scholar] [CrossRef]
- Abay, K.A.; Abay, M.H.; Berhane, G.; Chamberlin, J.; Croke, K.; Tafere, K. Access to health services, food, and water during an active conflict: Evidence from Ethiopia. PLoS Glob. Public Health 2022, 2, e0001015. [Google Scholar] [CrossRef]
- Belay, F.; Berhane, D.; Teshale, H.; Mulubrhan, G.; Hagos, T.; Gebremariam, H.; Tadesse, B.; Islam, Z. The effect of war on educational institutions of Eastern Tigray zone, Tigray state, Ethiopia. Int. J. Educ. Dev. 2023, 102, 102864. [Google Scholar] [CrossRef]
- Hishe, S.; Gidey, E.; Zenebe, A.; Bewket, W.; Lyimo, J.; Knight, J.; Gebretekle, T. The impacts of armed conflict on vegetation cover degradation in Tigray, northern Ethiopia. Int. Soil Water Conserv. Res. 2024, 12, 635–649. [Google Scholar] [CrossRef]
- Pacific Institute Fact Sheet. Fact Sheet: Water Conflict Chronology Update. 2024. Available online: https://pacinst.org/wp-content/uploads/2024/08/Water-Conflict-Chronology_Fact-Sheet.pdf (accessed on 25 February 2025).
- Gebreyohannes, T.; De Smedt, F.; Hagos, M.; Gebresilassie, S.; Amare, K.; Kabeto, K.; Hussein, A.; Nyssen, J.; Bauer, H.; Moeyersons, J.; et al. Large-Scale Geological Mapping of the Geba Basin, Northern Ethiopia. 2010. Available online: https://api.semanticscholar.org/CorpusID:55041051 (accessed on 20 February 2025).
- Gebrehiwot, T.; Van Der Veen, A. Farm level adaptation to climate change: The case of farmer’s in the Ethiopian Highlands. Environ. Manag. 2013, 52, 29–44. [Google Scholar] [CrossRef] [PubMed]
- Berhane, G. Engineering geological soil and rock characterization in the Mekelle town, Northern Ethiopia: Implications to engineering practice. Momona Ethiop. J. Sci. 2010, 2, 64–86. [Google Scholar]
- Nyssen, J.; Vandenreyken, H.; Poesen, J.; Moeyersons, J.; Deckers, J.; Haile, M.; Salles, C.; Govers, G. Rainfall erosivity and variability in the Northern Ethiopian Highlands. J. Hydrol. 2005, 311, 172–187. [Google Scholar] [CrossRef]
- Girmay, T. Methodological Review for the Economic Assessment of Soil and Water Conservation and Water Harvesting Practices in Tigray, Ethiopia. MSc Thesis, University College of North Wales Bangor, Bangor, UK, 1995. [Google Scholar]
- Yazew, E. Development and Management of Irrigated Lands in Tigray, Ethiopia; UNESCO-IHE: Delft, The Netherlands, 2005. [Google Scholar]
- Nyssen, J.; Frankl, A.; Haile, M.; Hurni, H.; Descheemaeker, K.; Crummey, D.; Ritler, A.; Portner, B.; Nievergelt, B.; Moeyersons, J.; et al. Environmental conditions and human drivers for changes to north Ethiopian mountain landscapes over 145 years. Sci. Total Environ. 2014, 485, 164–179. [Google Scholar] [CrossRef]
- Hunting Technical Services, Ltd.; MacDonald, A.M. Water Resources Survey of Tigray Region, Northern Ethiopia; Ethiopian Ministry of Water Resources: Addis Ababa, Ethiopia, 1976. [Google Scholar]
- CSA (Ethiopian Central Statistical Agency). Population Projections for Ethiopia 2007–2037; CSA: Addis Ababa, Ethiopia, 2017. [Google Scholar]
- Adimassu, Z.; Mekonnen, K.; Yirga, C.; Kessler, A. Effect of soil bunds on runoff, soil and nutrient losses, and crop yield in the central highlands of Ethiopia. Land Degrad. Dev. 2014, 25, 554–564. [Google Scholar] [CrossRef]
- TCPA (Tigray Cooperative Promotion Agency). Performance of Agricultural Cooperatives Report; TCPA: Mekelle, Ethiopia, 2017. [Google Scholar]
- National Plan Commission. Accelerating the Implementation of the 2030 Agenda in Ethiopia. Addis Ababa. 2018. Available online: https://www.un.org/development/desa/dspd/wp-content/uploads/sites/22/2018/05/4-1.pdf (accessed on 4 July 2025).
- TBoPF (Tigray Bureau of Planning and Finance). Socio-Economic Baseline Survey Report; TBoPF: Mekelle, Ethiopia, 2018. [Google Scholar]
- Asenahabi, B.M.; Ikoha, P.A. Scientific Research Sample Size Determination. Int. J. Sci. Technoledge 2023, 11, 8–12. [Google Scholar] [CrossRef]
- Demissie, B.; Nyssen, J.; Annys, S.; Negash, E.; Gebrehiwet, T.; Abay, F.; Wolff, E. Geospatial solutions for evaluating the impact of the Tigray conflict on farming. Acta Geophys. 2022, 70, 1285–1299. [Google Scholar] [CrossRef]
- Tigray Bureau of Water and Energy (TBoWE). Water Infrastructure Damage Assessment Report; Tigray Regional Government: Tigray, Ethiopia, 2022; Unpublished report. [Google Scholar]
- Shishaye, H.A.; Gebremicael, T.G.; Meresa, H.; Gebre, F.A.; Kidanu, S. Assessing the Impact of War on the Water Supply Infrastructure in Tigray, Ethiopia. 2023. Available online: https://eartharxiv.org/repository/view/5016/ (accessed on 25 February 2025).
- Tigray Bureau of Water and Energy (TBoWE). Water Supply Status Report for the Accessible Areas of Tigray; Tigray Regional Government: Tigray, Ethiopia, 2024; Unpublished report. [Google Scholar]
- National WaSH Program. National Water, Sanitation, and Hygiene Sector Development Plan 2021; Ministry of Water and Sanitation: Addis Ababa, Ethiopia, 2021. [Google Scholar]
- Lund, A. Cholera in the Time of Assad: How Syria’s Water Crisis Caused an Avoidable Outbreak. The Century Foundation. 2023. Available online: https://tcf.org/content/report/cholera-in-the-time-of-assad-how-syrias-water-crisis-caused-an-avoidable-outbreak/#:~:text=In%20the%20first%20few%20decades,%2C%20sanitation%2C%20and%20health%20infrastructure (accessed on 18 June 2025).
- ICRC. Syria Water Crisis: Up to 40% Less Drinking Water After 10 Years of War. 2021. Available online: https://www.icrc.org/en/document/syria-water-crisis-after-10-years-war (accessed on 18 June 2025).
- United Nations. The Sustainable Development Goals, 2016. 2016. Available online: https://unstats.un.org/sdgs/report/2016/overview/ (accessed on 4 July 2025).
- Available online: https://www.ethiopia-insight.com/2022/04/16/the-ethiopian-civil-war-that-destroyed-tigrays-economy/ (accessed on 4 July 2025).
- Available online: https://www.wilsoncenter.org/blog-post/tigray-war-and-education (accessed on 5 July 2025).
- Available online: https://upr-info.org/sites/default/files/country-document/2025-04/JS22_UPR47_Ethiopia.pdf (accessed on 4 July 2025).
- Available online: https://reliefweb.int/report/ethiopia/water-supply-status-report-accessible-areas-tigray-may-2024 (accessed on 4 July 2025).
- Available online: https://www.goalglobal.org/stories/restoring-hope-rebuilding-water-infrastructure-in-tigray/ (accessed on 4 July 2025).
- Gleick, P.H. Water and Conflict Peter: Fresh Water Resources and International Security. Int. Secur. 1993, 18, 99–104. [Google Scholar] [CrossRef]
- World Health Organization. Health and Humanitarian Crisis in Tigray: The Impact of Conflict on Water and Sanitation. 2022. Available online: https://www.who.int/news (accessed on 4 July 2025).
- Al-Saidi, M.; Roach, E.L.; Al-Saeedi, B.A.H. Conflict Resilience of Water and Energy Supply Infrastructure: Insights from Yemen. Water 2020, 12, 3269. [Google Scholar] [CrossRef]
- European Union News. Impact of the Ukraine Conflict on Water Supply and Sanitation Services. 2024. Available online: https://european-union.europa.eu/news-and-events_en (accessed on 7 July 2025).
- Available online: https://www.worldwater.org/water-conflict/ (accessed on 7 July 2025).
- Zeitoun, M.; Eid-Sabbagh, K.; Loveless, J. The analytical framework of water and armed conflict: A focus on the 2006 Summer War between Israel and Lebanon. Disasters 2014, 38, 22–44. [Google Scholar] [CrossRef]
- Schillinger, J.; Özerol, G.; Heldeweg, M. A social-ecological systems perspective on the impacts of armed conflict on water resources management: Case studies from the Middle East. Geoforum 2022, 133, 101–116. [Google Scholar] [CrossRef]
- Available online: https://upr-info.org/sites/default/files/country-document/2025-04/JS28_UPR47_Ethiopia.pdf (accessed on 7 July 2025).


Disclaimer/Publisher’s Note: The statements, opinions and data contained in all publications are solely those of the individual author(s) and contributor(s) and not of MDPI and/or the editor(s). MDPI and/or the editor(s) disclaim responsibility for any injury to people or property resulting from any ideas, methods, instructions or products referred to in the content. |
© 2025 by the authors. Licensee MDPI, Basel, Switzerland. This article is an open access article distributed under the terms and conditions of the Creative Commons Attribution (CC BY) license (https://creativecommons.org/licenses/by/4.0/).