Article

Groundwater Pollution Source Identification Based on a Coupled PCA–PMF–Mantel Framework: A Case Study of the Qujiang River Basin

1
Institute of Disaster Prevention, Sanhe 065201, China
2
Zhejiang Geological Exploration Institute, General Administration of Metallurgical Geology of China, Quzhou 324000, China
3
Chinese Academy of Natural Resources Economics, Beijing 100035, China
4
No. 1 Geological Exploration Institute, General Administration of Metallurgical Geology of China, Sanhe 065201, China
5
Technical Centre for Soil, Agriculture and Rural Ecology and Environment, Ministry of Ecology and Environment, Beijing 100012, China
*
Authors to whom correspondence should be addressed.
Water 2025, 17(19), 2881; https://doi.org/10.3390/w17192881
Submission received: 21 August 2025 / Revised: 26 September 2025 / Accepted: 1 October 2025 / Published: 2 October 2025
(This article belongs to the Special Issue Advance in Hydrology and Hydraulics of the River System Research 2025)

Abstract

This study develops an integrated framework for groundwater pollution source identification by coupling Principal Component Analysis (PCA), Positive Matrix Factorization (PMF), and the Mantel test, with the Qujiang River Basin as a case study. The framework enables a full-process assessment, encompassing qualitative identification, quantitative apportionment, and spatial validation of pollution drivers. Results indicate that groundwater chemistry is primarily influenced by three categories of sources: natural rock weathering, agricultural and domestic activities, and industrial wastewater discharge. Anthropogenic sources account for 73.7% of the total contribution, with mixed agricultural and domestic inputs dominating (38.5%), followed by industrial effluents (35.2%), while natural weathering contributes 26.3%. Mantel test analysis further shows that agricultural and domestic pollution correlates strongly with intensive farmland distribution in the midstream area, natural sources correspond to carbonate outcrops and higher elevations in the upstream, and industrial contributions cluster in downstream industrial zones. By integrating PCA, PMF, and Mantel analysis, this study offers a robust and transferable framework that improves both the accuracy and spatial interpretability of groundwater pollution source identification. The proposed approach provides scientific support for regionalized groundwater pollution prevention and control under complex hydrogeological settings.

1. Introduction

Groundwater pollution is a pressing global environmental challenge, threatening freshwater security for over two billion people who rely on groundwater as their primary drinking water source [1]. Anthropogenic activities—such as intensive agriculture, rapid urbanization, industrial discharges, and inadequate wastewater management—have led to widespread contamination of aquifers with nitrates, heavy metals, pathogens, and emerging contaminants [2]. In many regions, including the North China Plain, the Indo-Gangetic Basin, and parts of Europe and North America, elevated concentrations of NO3, NH4+, As, and Mn have exceeded drinking water quality standards, posing serious risks to human health and ecosystem stability [3,4]. Moreover, the coexistence of multiple pollution sources within complex hydrogeological settings often complicates the accurate identification of contamination origins, thereby undermining the effectiveness of pollution control strategies. Despite recent advances in statistical and modeling tools, there remains a critical need for integrated, robust, and transferable frameworks capable of distinguishing natural from anthropogenic influences and spatially attributing pollution sources across diverse geographical contexts.
Within this global context, groundwater plays a vital role in sustaining water security, particularly in densely populated and rapidly developing regions such as China. It serves as a crucial resource for agricultural irrigation, industrial production, domestic supply, and strategic reserves [5,6]. The Qujiang River Basin, located in western Zhejiang Province, is an essential tributary and headwater region of the Qiantang River, functioning as a key water conservation zone. The basin supports the drinking water needs of millions of residents, underpins agricultural productivity, and maintains regional ecological integrity [7]. However, accelerated urbanization, industrial expansion, and population growth have intensified anthropogenic pressures on groundwater systems, resulting in progressive deterioration of groundwater quality characterized by complex pollutant mixtures [8,9,10]. Notably, elevated levels of NH4+ and Mn have been detected in certain areas, exceeding regulatory thresholds for Class III groundwater quality in China [11]. These emerging contamination issues highlight the urgent need for precise identification of pollution sources and their contributing mechanisms to support science-based management and remediation efforts [12,13].
To characterize groundwater chemistry, classical hydrochemical diagrams—such as Piper and Gibbs plots—and ionic ratio analyses have long been employed and remain valuable tools for initial classification of water types and identification of dominant processes, including water–rock interactions and evaporation effects [1,14,15]. In recent years, multivariate statistical techniques such as Principal Component Analysis (PCA), Factor Analysis (FA), and Cluster Analysis (CA) have been increasingly adopted to extract dominant hydrochemical patterns from complex datasets. For example, Du et al. [16] identified rock weathering and evaporation as primary controls in the Hetao Irrigation District, with agricultural irrigation and drought as major drivers. Mohammed et al. [17] applied PCA and hierarchical cluster analysis to identify rock–water interaction, agricultural activities, and septic tank leakage as key factors influencing groundwater quality in a Nubian aquifer system in Sudan. Positive Matrix Factorization (PMF), which does not require prior information and permits rotational optimization, has increasingly been applied for quantitative apportionment of pollution sources [18,19,20]. Nevertheless, these methods often fail to sufficiently resolve the spatial distribution of pollution sources and their underlying driving mechanisms. The Mantel test, as a spatial statistical approach, can effectively evaluate correlations between hydrochemical components and environmental or anthropogenic factors, thereby providing a robust means to validate spatial drivers of pollution sources [21].
In China, numerous studies have focused on groundwater source apportionment in regions such as the North China Plain [22,23], the Huang–Huai–Hai Plain [24], and the Yangtze River Delta [25,26]. However, most of these studies emphasize single-method analyses, lacking an integrated framework that unifies qualitative identification, quantitative apportionment, and spatial verification. This limitation is particularly pronounced in hydrogeologically complex regions where multiple anthropogenic sources coexist, leading to insufficient accuracy and applicability in identifying pollution control factors. In the Qujiang River Basin, recent studies have characterized hydrochemical patterns and identified dominant natural processes [27], while others have examined surface-water/groundwater interactions using isotopic and hydrological tracers [7]. However, these works did not quantitatively apportion pollution sources or link them to spatial drivers such as land use and geology. Therefore, a systematic framework for source identification that integrates qualitative analysis, quantitative apportionment, and spatial validation remains lacking.
While PCA and PMF have been widely applied in groundwater studies to identify and quantify pollution sources, most such applications remain limited to isolated or sequential use, often lacking explicit spatial validation of the inferred sources. For example, in many studies, PMF-derived source contributions are interpreted qualitatively without testing their correlation with land use, geology, or hydrological gradients [28]. This gap increases uncertainty in source attribution, particularly in complex basins where natural and anthropogenic processes overlap. In the Qujiang River Basin, where groundwater systems are influenced by heterogeneous recharge patterns, variable land use, and legacy contamination, such uncertainty poses a major challenge for effective management. To address this, we integrate PMF with the Mantel test—a spatial correlation method not commonly used in this context—to statistically evaluate whether the identified sources are spatially coherent with environmental drivers. This linkage allows us to move beyond source identification toward source validation, reducing subjectivity in interpretation. Unlike previous PCA–PMF studies that focus on source types and contributions, our approach explicitly tests the spatial plausibility of those sources, offering a more defensible basis for groundwater protection in data-limited, hydrogeologically complex regions.

2. Materials and Methods

2.1. Study Area

The Qujiang River Basin is located in Quzhou City, western Zhejiang Province, and constitutes an important tributary and headwater region of the Qiantang River (Figure 1a). Within Zhejiang Province, the basin covers an area of 1.11 × 10⁴ km2 and includes major tributaries such as Changshan Port, Majinxi, and Wuxi River. The study area spans Kaihua County, Changshan County, Qujiang District, Kecheng District, and Longyou County. The region has a subtropical monsoon climate, with a mean annual temperature of 17.3 °C, mean annual evaporation of 938.8 mm, and annual precipitation ranging from 1100 to 2000 mm. Rainfall is concentrated during the plum-rain season (April–July) and the typhoon season (July–September) [27,29].
Topographically, the basin is higher in the north, south, and west, and lower in the central and eastern areas. The upstream is dominated by low mountains and hills, while the midstream and downstream lie in the Jinqu Basin, characterized by hilly red-bed terrain and alluvial plains. (Figure 1b). The upstream region, located along the basin margins, is characterized by low mountains, hills, and uplands, whereas the midstream and downstream regions lie within the Jinqu Basin, dominated by red-bed hilly basins, residual hills, and alluvial plains. The overall geomorphic pattern is described as “three sides surrounded by mountains with a river valley in between, and three rivers interlaced within the basin.” Elevation generally ranges from 50 to 300 m.
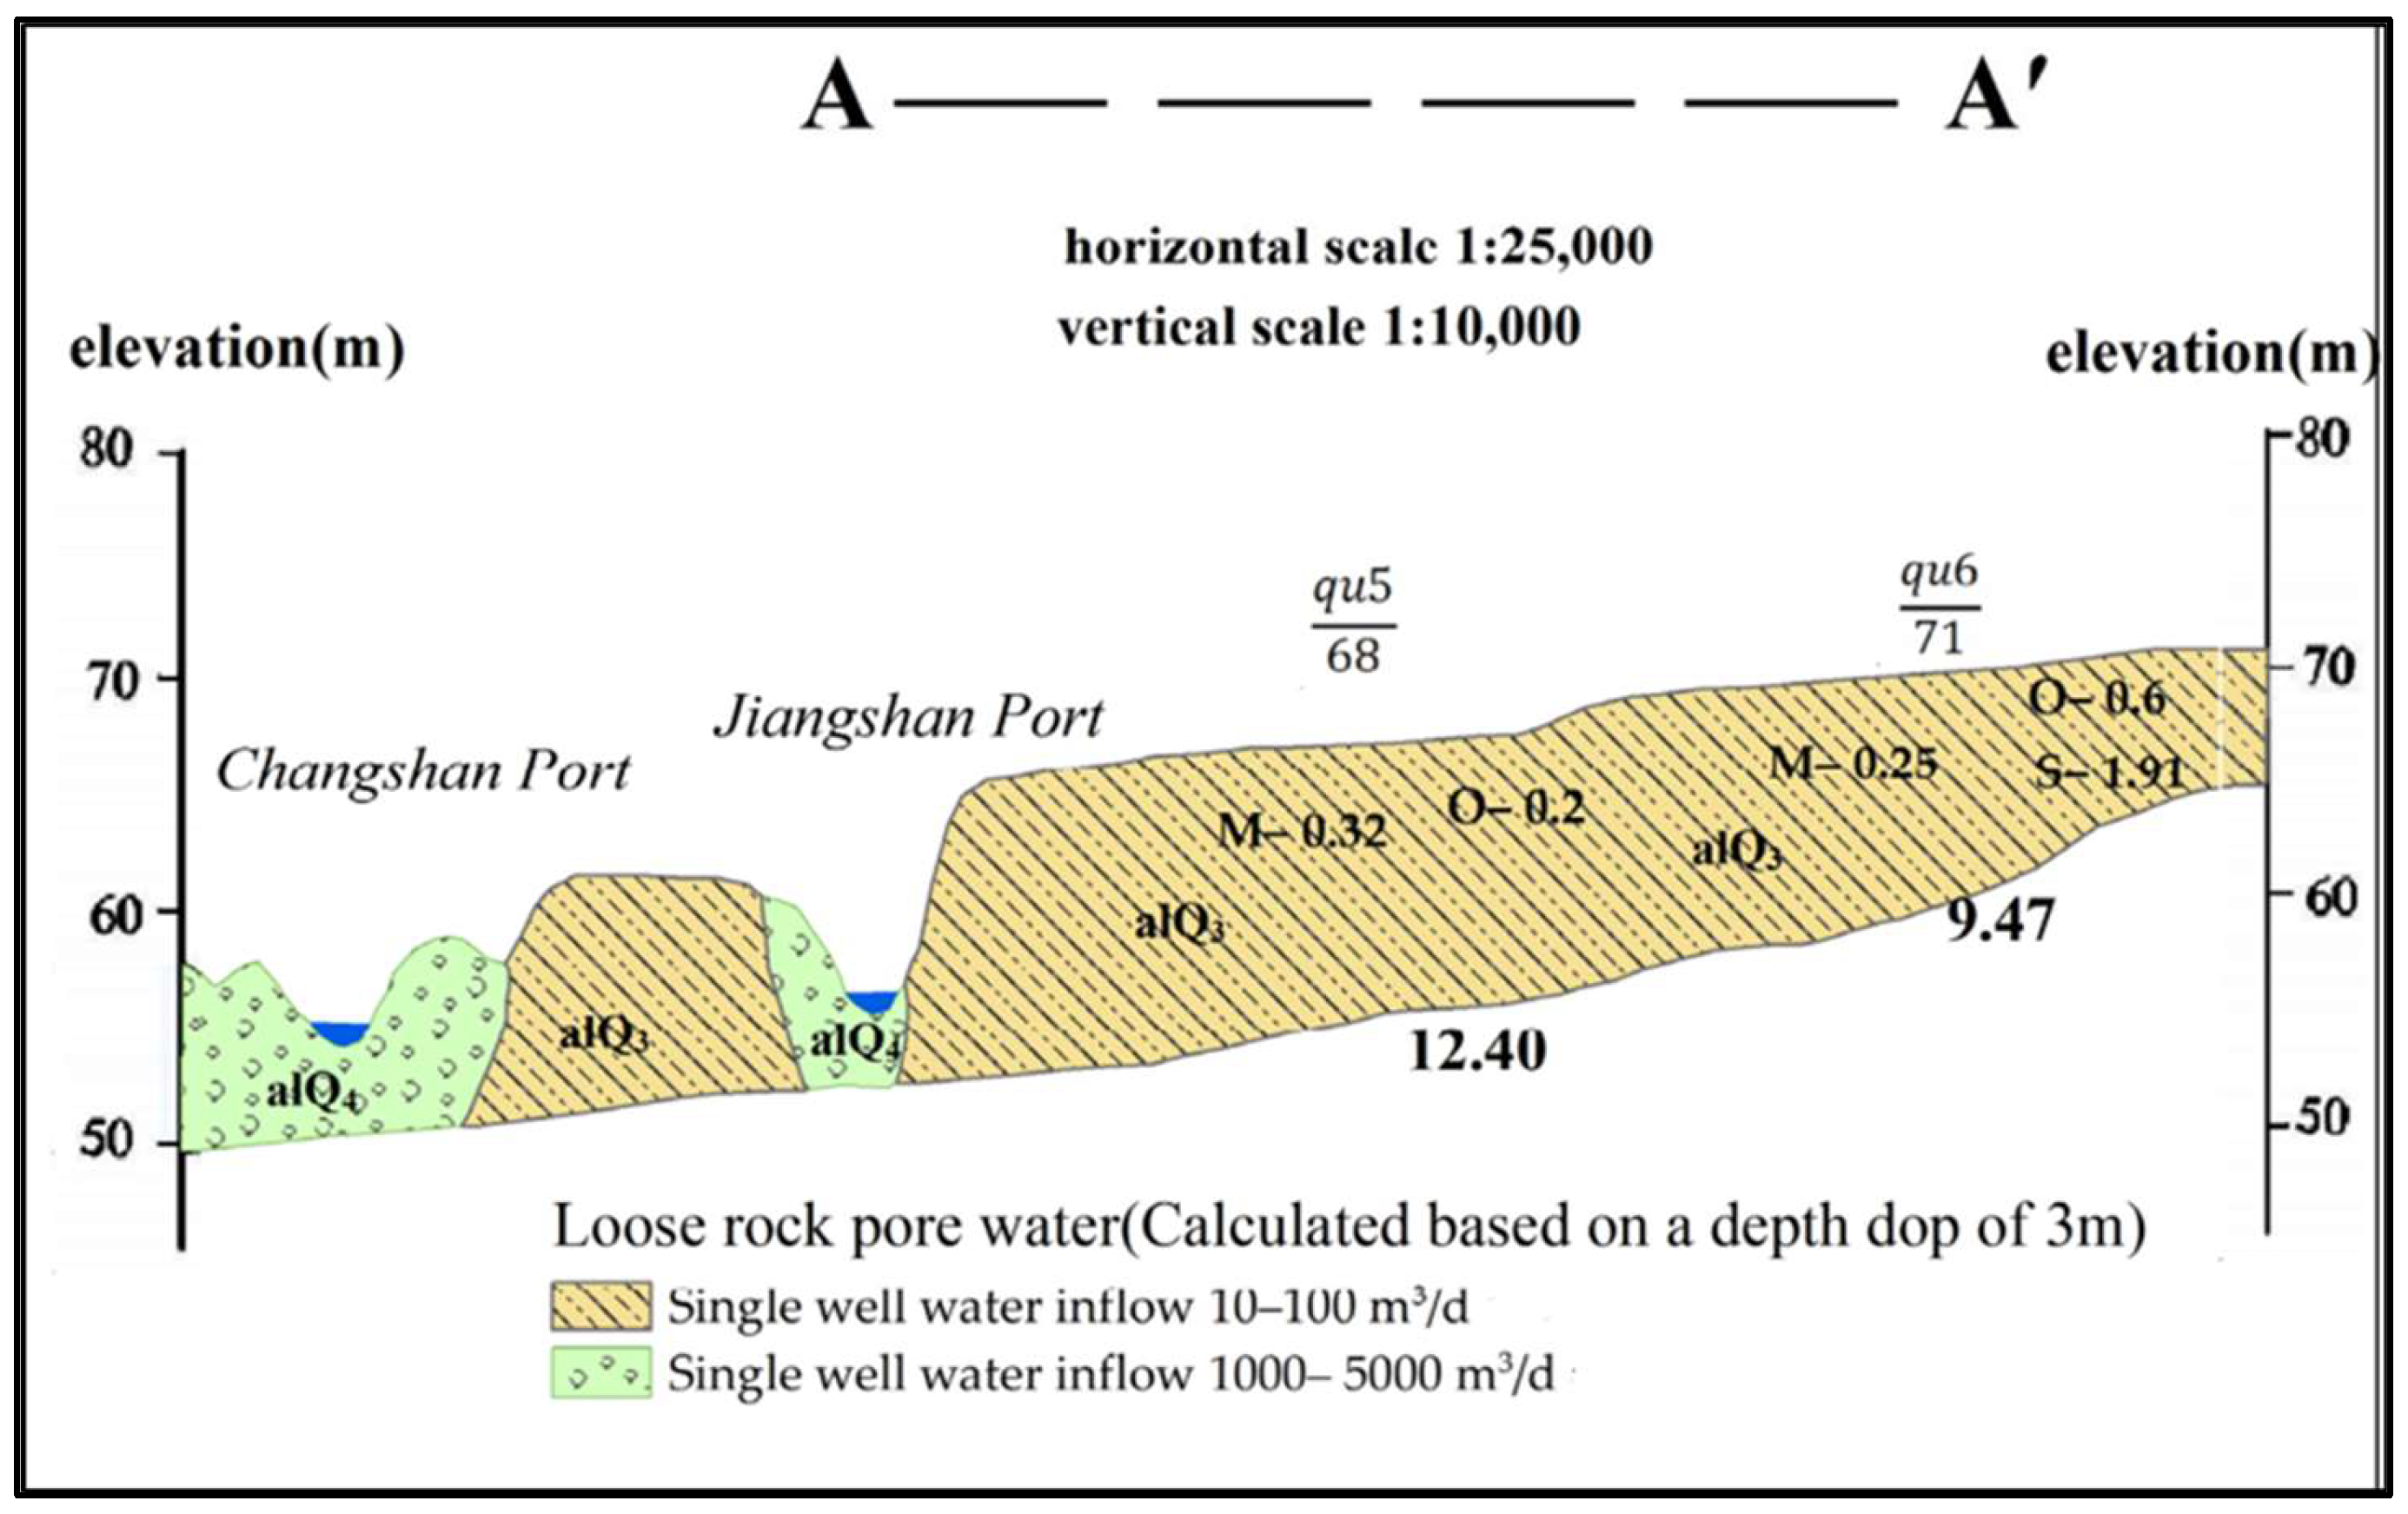
The stratigraphy of the upstream basin is dominated by Lower Paleozoic Ordovician and Cambrian formations, whereas the midstream and downstream regions are underlain by Upper Cretaceous deposits. Quaternary strata consist mainly of Middle–Upper Pleistocene alluvial and fluvio-pluvial deposits as well as Holocene alluvium. Based on aquifer media and occurrence, groundwater types include pore phreatic water in loose rocks, pore–fissure water in red-bed clastic rocks, and fissure water in bedrock. In many cases, phreatic water in loose sediments overlies pore–fissure water in red-bed clastic rocks [30]. The hydrogeological map of the study area is shown in Figure 1c, with a typical hydrogeological cross-section illustrated in Figure 2.

2.2. Sampling and Analytical Procedures

2.2.1. Sample Collection

A total of 94 groundwater samples were collected across the Qujiang River Basin in September 2019, including 41 from the upstream, 40 from the midstream, and 13 from the downstream regions (Figure 1a). The sampling protocol followed the Technical Specifications for Groundwater Environmental Monitoring (HJ/T 164-2004) [31]. Prior to sampling, each well was pumped for approximately 15 min to stabilize in situ physicochemical parameters. A multiparameter water quality analyzer (HANNA HI9828, USA) was used to measure pH, temperature, electrical conductivity (EC), dissolved oxygen (DO), and redox potential (Eh) on-site. It should be noted that the dataset represents a single sampling event in September 2019, and therefore may not capture seasonal variations in groundwater chemistry.
In addition, a comprehensive suite of water quality parameters was analyzed to assess both natural geochemical processes and potential anthropogenic impacts. This included major cations (Ca2+, Mg2+, Na+, K+), major anions (Cl, SO42−, HCO3), nutrients (NO3, NO2, NH4+), indicators (F, As), and trace metals (Mn, Ba, Sr, Cd, Pb, Cr). Samples were filtered through 0.45 μm cellulose acetate membranes. Cation and trace metal samples were acidified to pH < 2 with ultrapure HNO3; anion and nutrient samples were not acidified. All samples were stored at 4 °C and analyzed promptly at Zhejiang Zhongyi Testing and Research Institute Co., Ltd.
The concentrations of F, As, and selected trace metals (Ba, Pb, Cd, Cr) were either below the method detection limits or within the permissible levels specified in the Chinese Standards for Drinking Water Quality (GB 5749-2022) [32]. Given their compliance with regulatory standards and low environmental risk, these parameters are not elaborated upon in the main discussion. Detailed analytical methods and detection limits are provided in Table 1.
To ensure the reliability of hydrochemical data, quality assurance and quality control (QA/QC) procedures were implemented during sampling and analysis. Field duplicate samples were collected at approximately 10% of the total sites (i.e., 9 out of 94 samples) to assess sampling and analytical precision, yielding relative standard deviations (RSD) of less than 5% for major ions. Procedural blanks were included to monitor potential contamination during transport and laboratory handling, and no significant contamination was detected.
The accuracy of ionic charge balance was evaluated using the percentage charge balance error (EB%), calculated as:
E B % = cations   ( m e q / L ) anions   ( m e q / L ) ( cations + anions ) / 2 × 100
All 94 samples exhibited a charge balance error within ±5%, with 85 samples falling within ±3%, well within the acceptable range for groundwater geochemical studies. These results confirm high analytical accuracy and support the reliability of the dataset used in subsequent multivariate analyses.

2.2.2. Data Processing and Statistical Analysis

Geographic coordinates of the sampling sites were processed in ArcGIS 10.8, where ion concentration maps were generated using the inverse distance weighting (IDW) method with a power parameter of 2 to capture spatial variability. Data organization and descriptive statistics were conducted in Microsoft Excel 2019. To explore the dominant hydrochemical factors, Principal Component Analysis (PCA) was applied using Origin 2021. Source apportionment was further carried out with the EPA PMF 5.0 model, in which uncertainties of chemical constituents were estimated from detection limits and standard deviations following established protocols [33,34]. The uncertainty for each measurement was calculated as follows:
① For concentrations above the detection limit (DL):
U n c = ( e r r o r   f r a c t i o n × x ) 2 + ( 0.5 D L ) 2
where x is the measured concentration and error fraction was set to 0.05–0.10 based on laboratory precision.
② For concentrations at or below the detection limit (DL):
U n c = 5 6 × D L
and the concentration value was replaced with DL/2, a standard approach to minimize bias while retaining statistical robustness.
The model was run 20 times for each factor solution (from 2 to 5 factors) using the displacement method with a maximum of 100 iterations per run. The optimal number of factors (n = 3) was determined based on the minimum Qrobust/Qtrue ratio, visual inspection of residual patterns (all within ±3), and interpretability of factor profiles. All variables were weighted by their uncertainties, and no re-scaling was applied. The final solution showed a maximum change in Q-value of less than 1% between consecutive iterations, indicating convergence.
To examine the spatial associations between source contributions and environmental variables, the Mantel test was performed in R 4.4.1 with the LinkET package, using Pearson correlation coefficients and 999 permutations [35]. The environmental and land use variables considered included: elevation, slope, percentage of agricultural land, percentage of urban area, and distance to industrial zones. These variables were selected based on their potential influence on groundwater hydrology and contamination sources. Elevation and slope are key topographic controls on groundwater recharge and flow direction; the percentage of agricultural land within a 1 km buffer around each sampling site was included to assess the impact of agricultural activities, which are commonly associated with nitrate and pesticide inputs; similarly, the percentage of urban area was used to represent urbanization intensity and its associated domestic pollution sources (e.g., sewage leakage); distance to industrial zones was incorporated to evaluate the potential influence of industrial discharges on groundwater quality [36]. All variables were derived from 30 m resolution digital elevation model (DEM) and land use data, and were standardized prior to analysis.
In addition, Piper diagrams, Gibbs diagrams, and ion ratio plots were prepared in Origin 2021 to assist in hydrochemical classification and interpretation of controlling mechanisms.

3. Results and Discussion

3.1. Hydrochemical Characteristics and Spatial Distribution

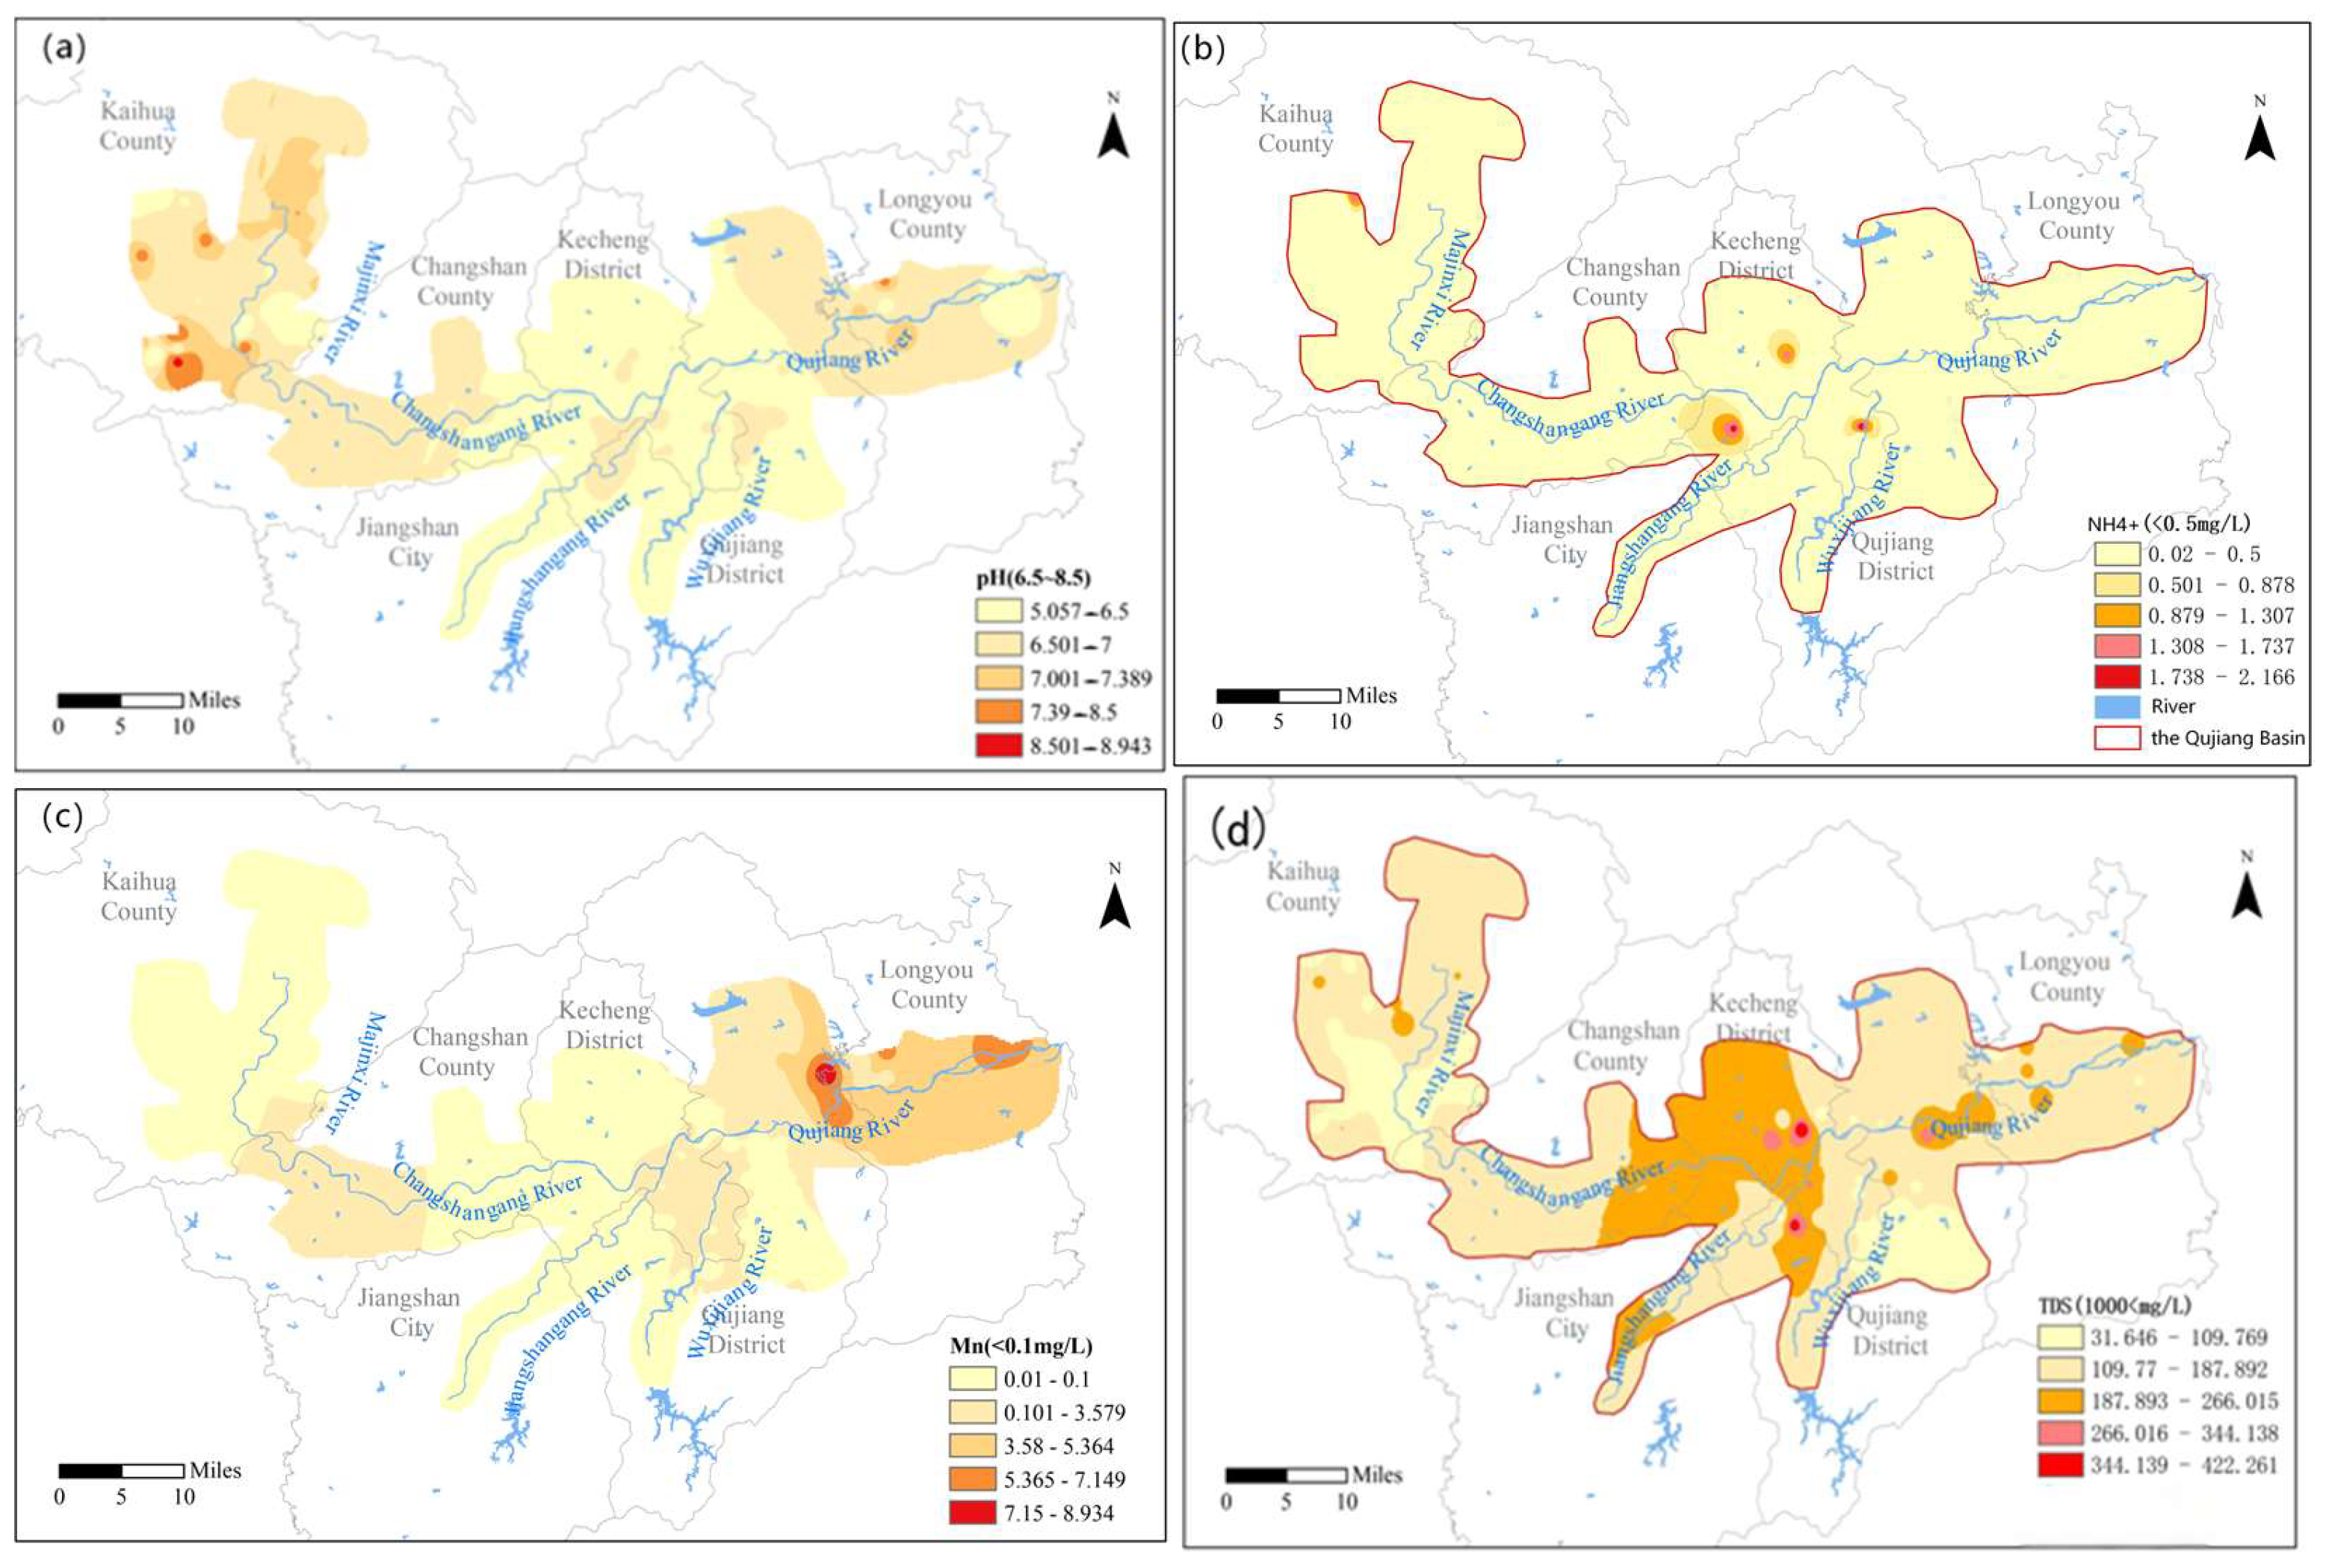
The statistical summary of groundwater hydrochemistry in the Qujiang River Basin is provided in Table 2. Groundwater pH values varied between 5.05 and 8.98, with some samples exceeding the threshold for Class III groundwater quality. Spatially, higher pH values (weakly alkaline) were generally recorded in the upstream area, whereas lower values (weakly acidic) occurred in the midstream. Total dissolved solids (TDS) remained below 1000 mg·L−1 across all samples, consistent with freshwater conditions. However, the midstream section exhibited both the highest mean TDS concentration and the largest coefficient of variation (57%), pointing to stronger external perturbations to groundwater chemistry in this part of the basin.
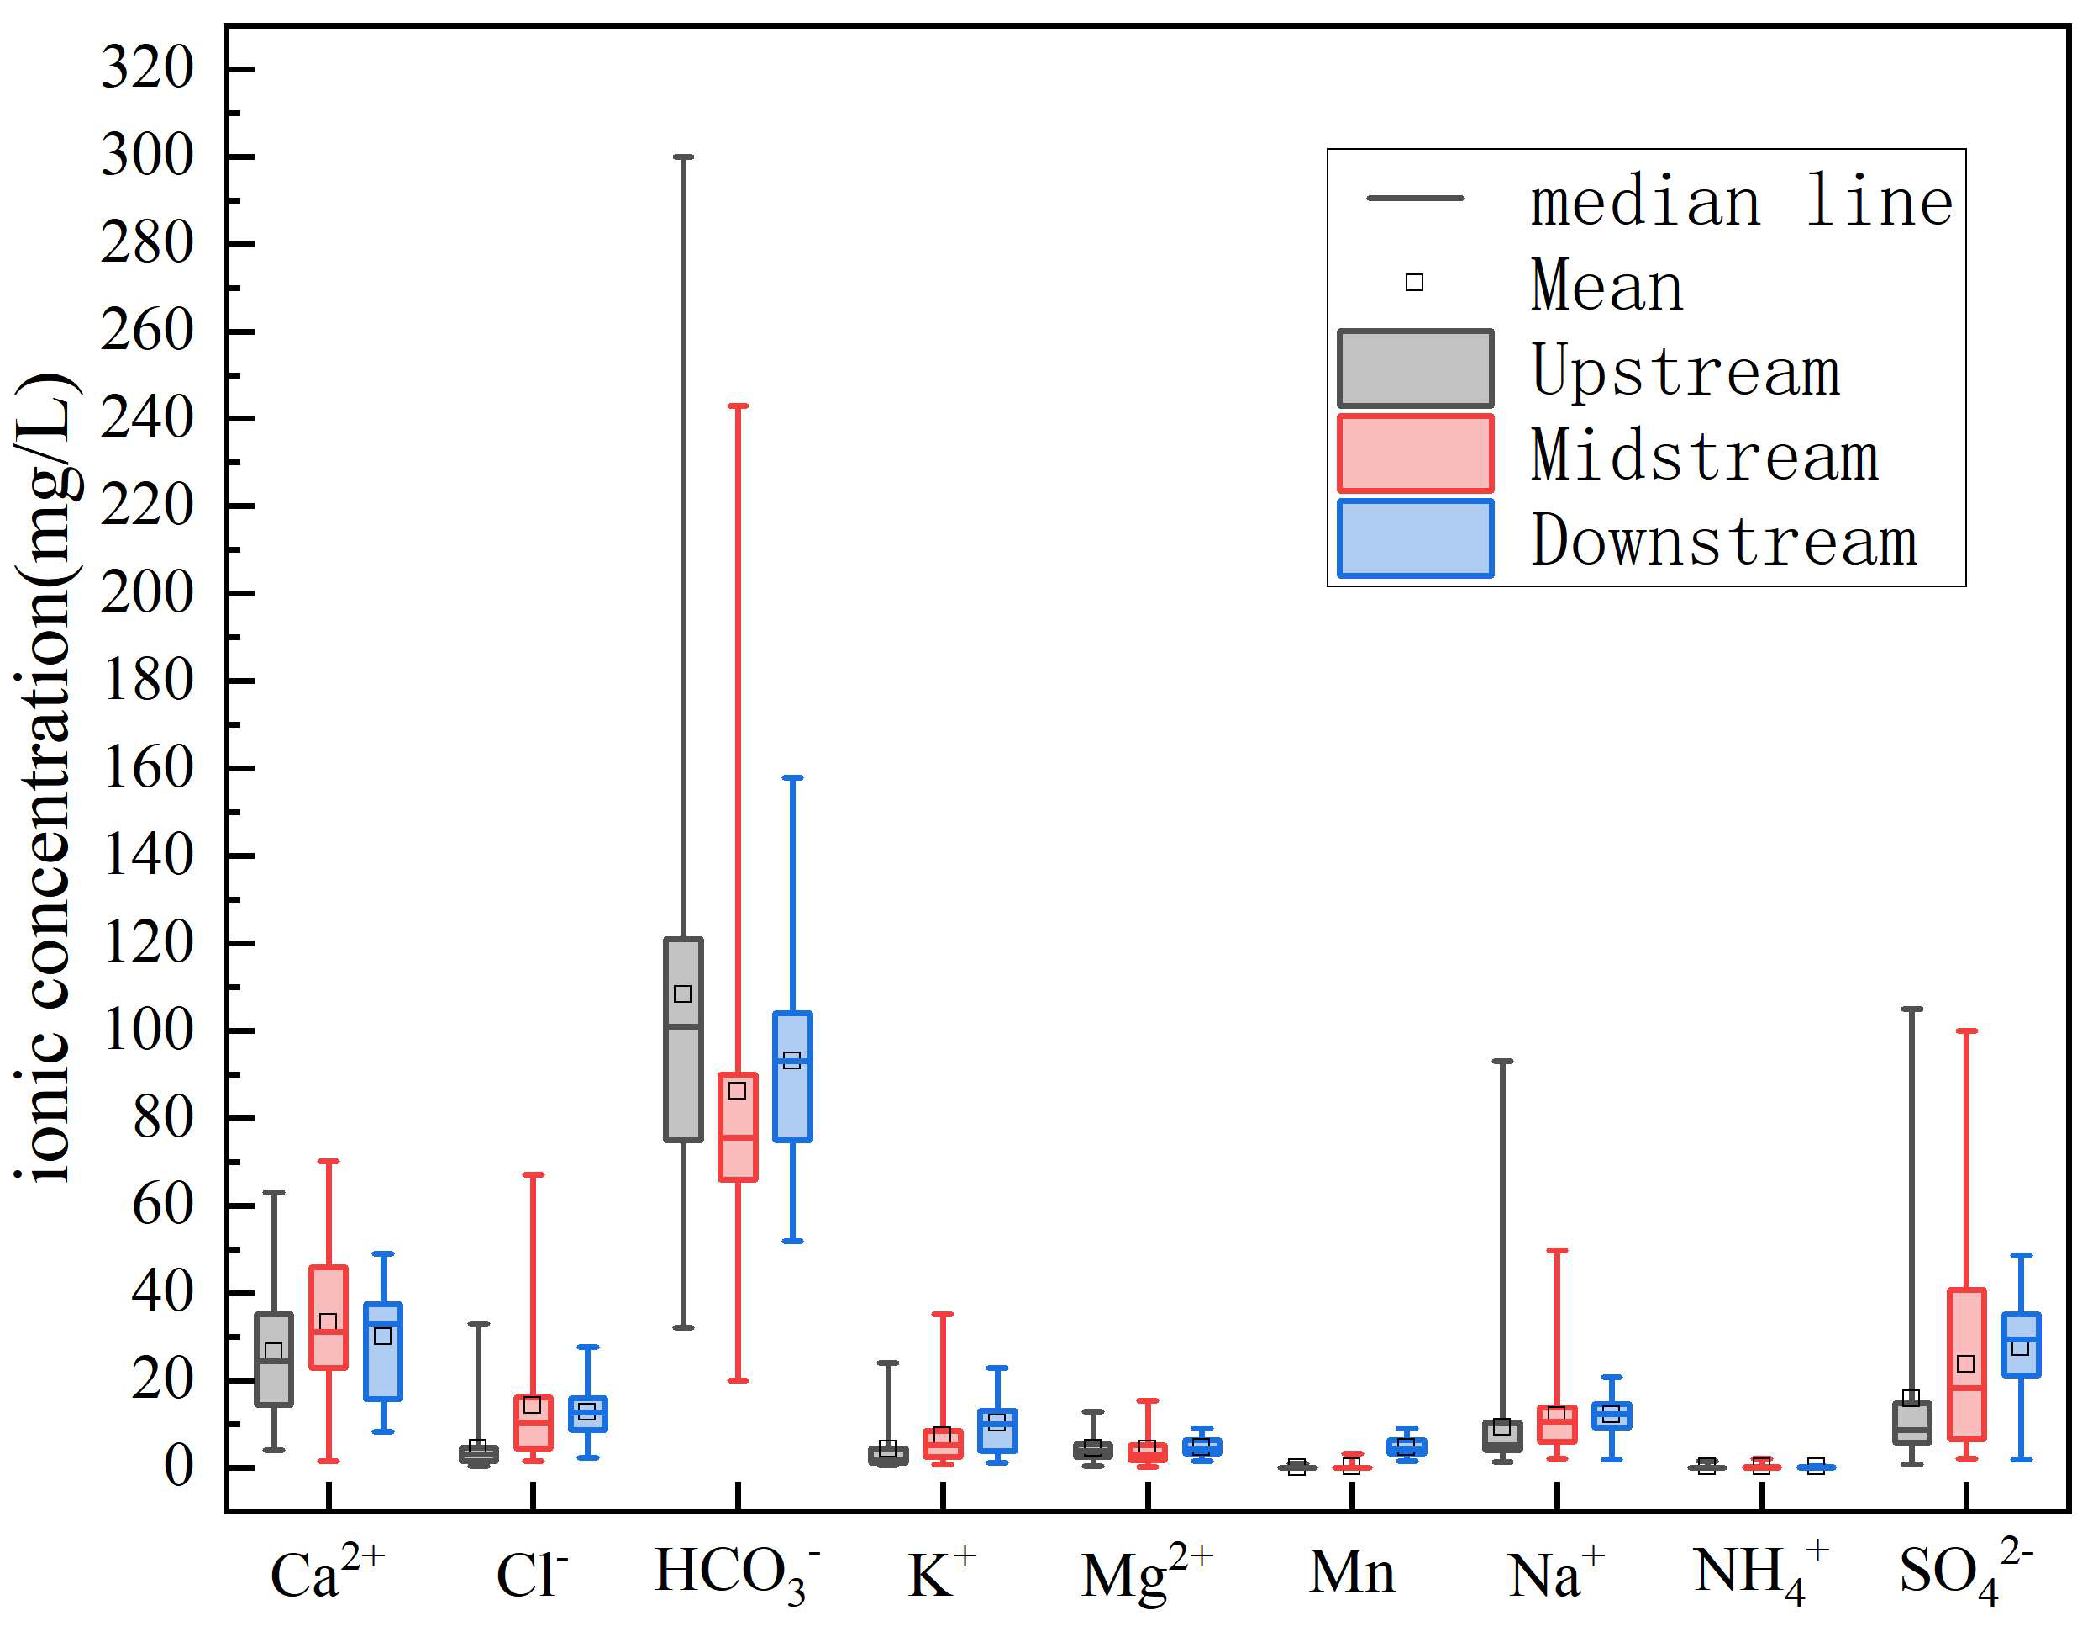
Among the major cations, Ca2+, Na+, and K+ were predominant (Figure 3). Ca2+ concentrations were highest in the midstream (mean: 33.3 mg·L−1) and lowest in the upstream (26.5 mg·L−1). Na+ concentrations peaked in the downstream (12.1 mg·L−1), while K+ exhibited the greatest variability in the midstream (CV = 128%), likely reflecting fertilizer application and localized industrial inputs. In contrast, Mg2+ concentrations were relatively uniform across the basin (3~4 mg·L−1). All cation concentrations complied with the Class III groundwater standard.
For the major anions, HCO3 was dominant, with the highest mean concentration in the upstream and the lowest in the midstream (86.3 mg·L−1). Cl and SO42− were markedly elevated in the midstream relative to upstream and downstream areas, consistent with agricultural return flow and domestic sewage contributions.
Regarding toxicological indicators, NH4+ reached the highest mean concentration in the midstream (0.22 mg·L−1), where localized exceedances appearing as point-source anomalies (Figure 4b). Box plots (Figure 3) further show that Mn concentrations downstream had a median of 4.57 mg·L−1, substantially higher than those in upstream and midstream samples. Elevated Mn levels in the downstream red-bed aquifers (Figure 4c) are primarily attributed to natural geological enrichment, but may also be influenced by local industrial activities, which are commonly found in the downstream area [37].
Overall, the spatial variability of hydrochemical parameters reflects the combined influence of natural geologic settings and anthropogenic activities, providing a critical basis for subsequent pollution source apportionment.

3.2. Dominant Hydrogeochemical Processes

3.2.1. Gibbs Diagram

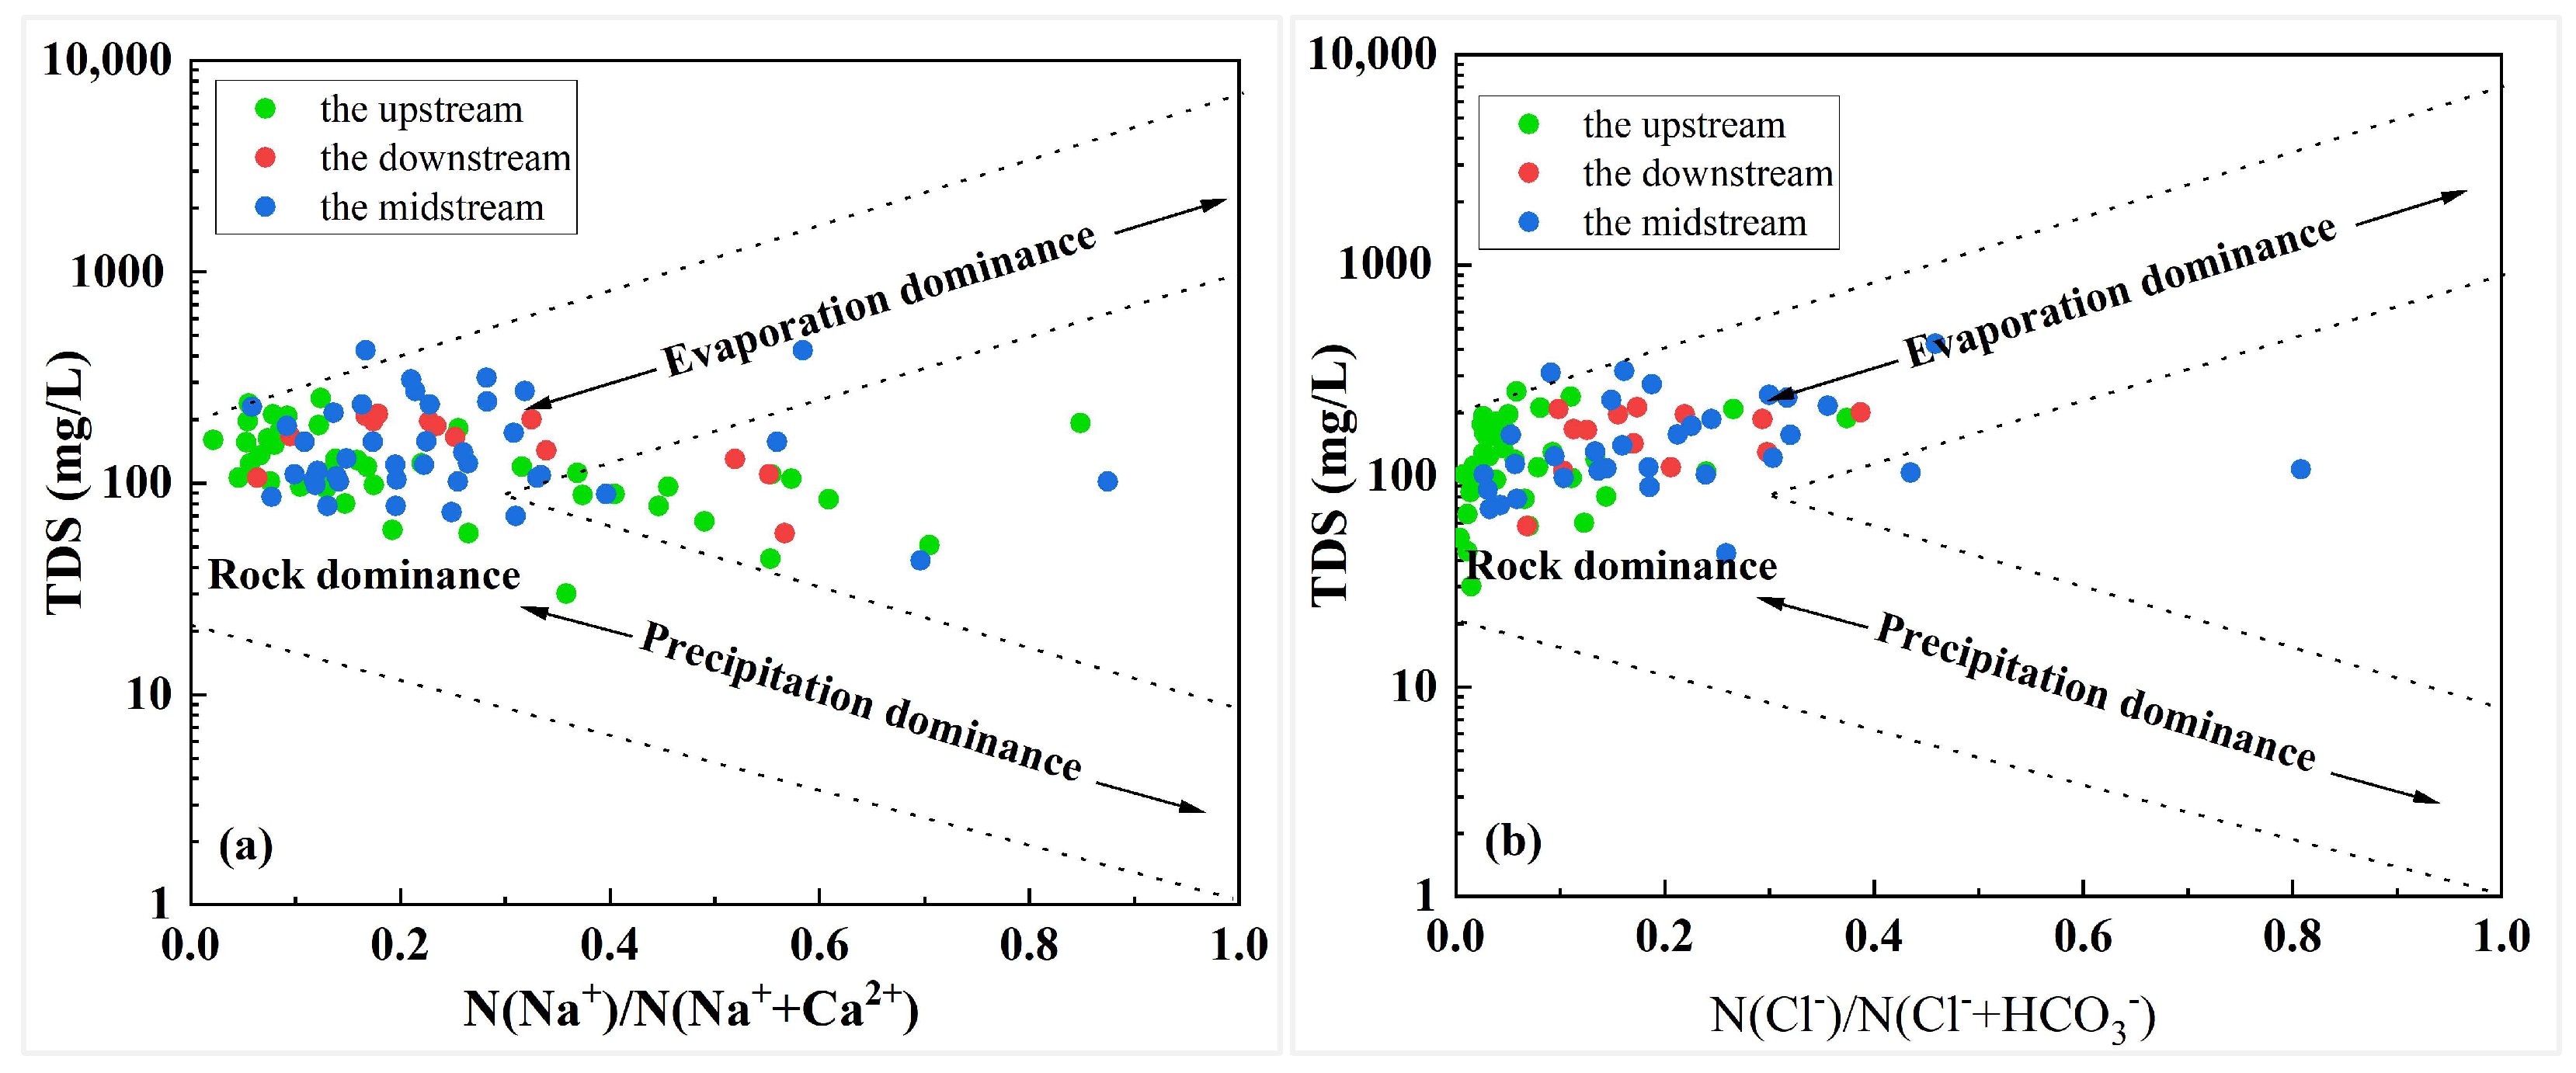
According to Gibbs (1970), three main mechanisms govern global water chemistry: precipitation, evaporation, and rock weathering [38,39]. As shown in Figure 5, most samples fall within the “rock weathering dominance” field, indicating that groundwater chemistry is primarily controlled by water–rock interactions. Moderate TDS levels (30–426 mg·L−1) and relatively low Na+/(Na+ + Ca2+) and Cl/(Cl + HCO3) ratios support this conclusion [40,41].
Given the subtropical monsoon climate of the study area and the presence of Cretaceous red beds, alluvial deposits, and igneous interlayers enriched in easily weathered minerals (e.g., feldspar, pyroxene, dolomite), dissolution is strongly promoted under weakly acidic conditions. Moreover, the hydraulic connectivity between pore–fissure water in red-bed clastic rocks and phreatic water in loose sediments enhances reaction surfaces and rates. Together, these factors create favorable geological conditions for rock weathering.

3.2.2. Correlation Analysis

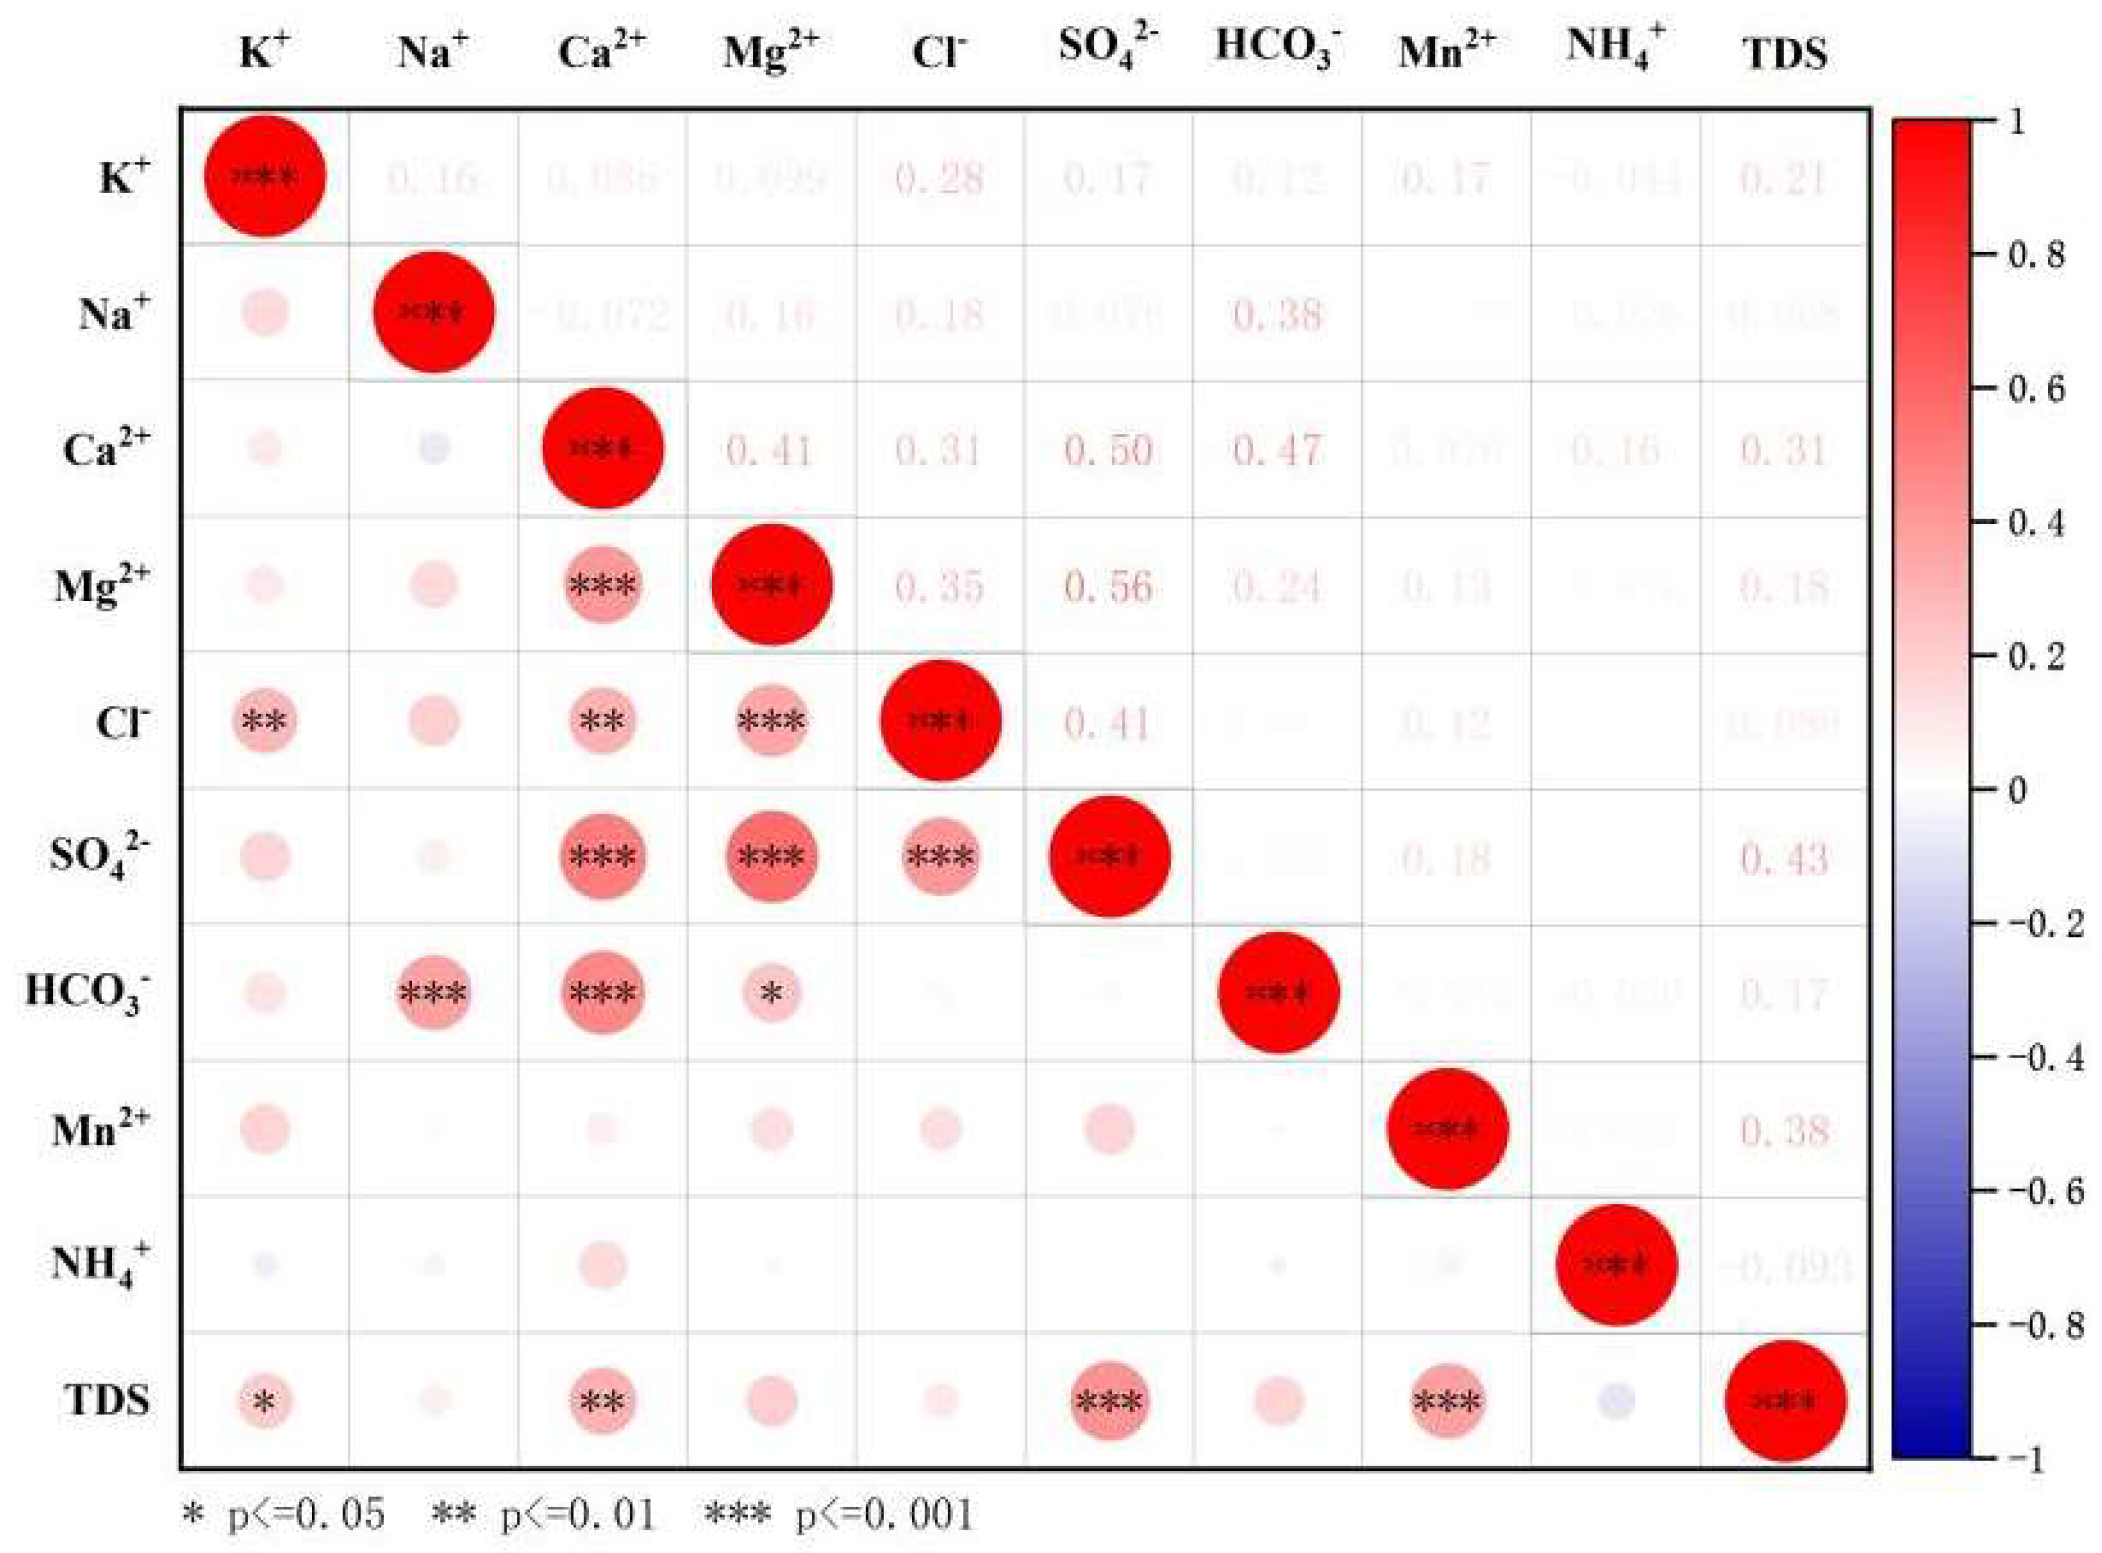
Correlation analysis provides insights into the co-variation patterns among hydrochemical parameters [42]. The Pearson correlation matrix (Figure 6) shows significant positive correlations among Ca2+, Mg2+, SO42−, and HCO3. Specifically, the correlations between Ca2+–HCO3 and Mg2+–HCO3 are consistent with carbonate mineral dissolution (e.g., calcite, dolomite), whereas the strong positive correlations of Ca2+–SO42− and Mg2+–SO42− suggest a potential contribution from sulfate minerals (e.g., gypsum, anhydrite) as important sources of Ca2+ and Mg2+ [29]. These dual dissolution processes align with the coexistence of carbonates and sulfates in Cretaceous red beds and Quaternary alluvium [7].
In addition, Mn showed a strong positive correlation with TDS, which may reflect the coupled release of Mn2+ and other ions during the dissolution of Mn-bearing minerals (e.g., rhodochrosite, manganese oxides), thereby contributing to elevated dissolved solids [37]. This process is particularly pronounced in downstream red-bed aquifers under weakly acidic or reducing conditions. By contrast, NH4+ displayed generally weak correlations with other ions, reflecting its relatively independent sources, mainly associated with anthropogenic activities such as agricultural fertilization and leakage of domestic sewage [7].

3.2.3. Ion Ratio Analysis

Ion ratio analysis is a key tool for evaluating the origins and evolution of groundwater chemistry. In this study, relationships among Cl, SO42−, HCO3, Na+, Ca2+, and Mg2+ were examined to elucidate controlling processes in the Qujiang River Basin.
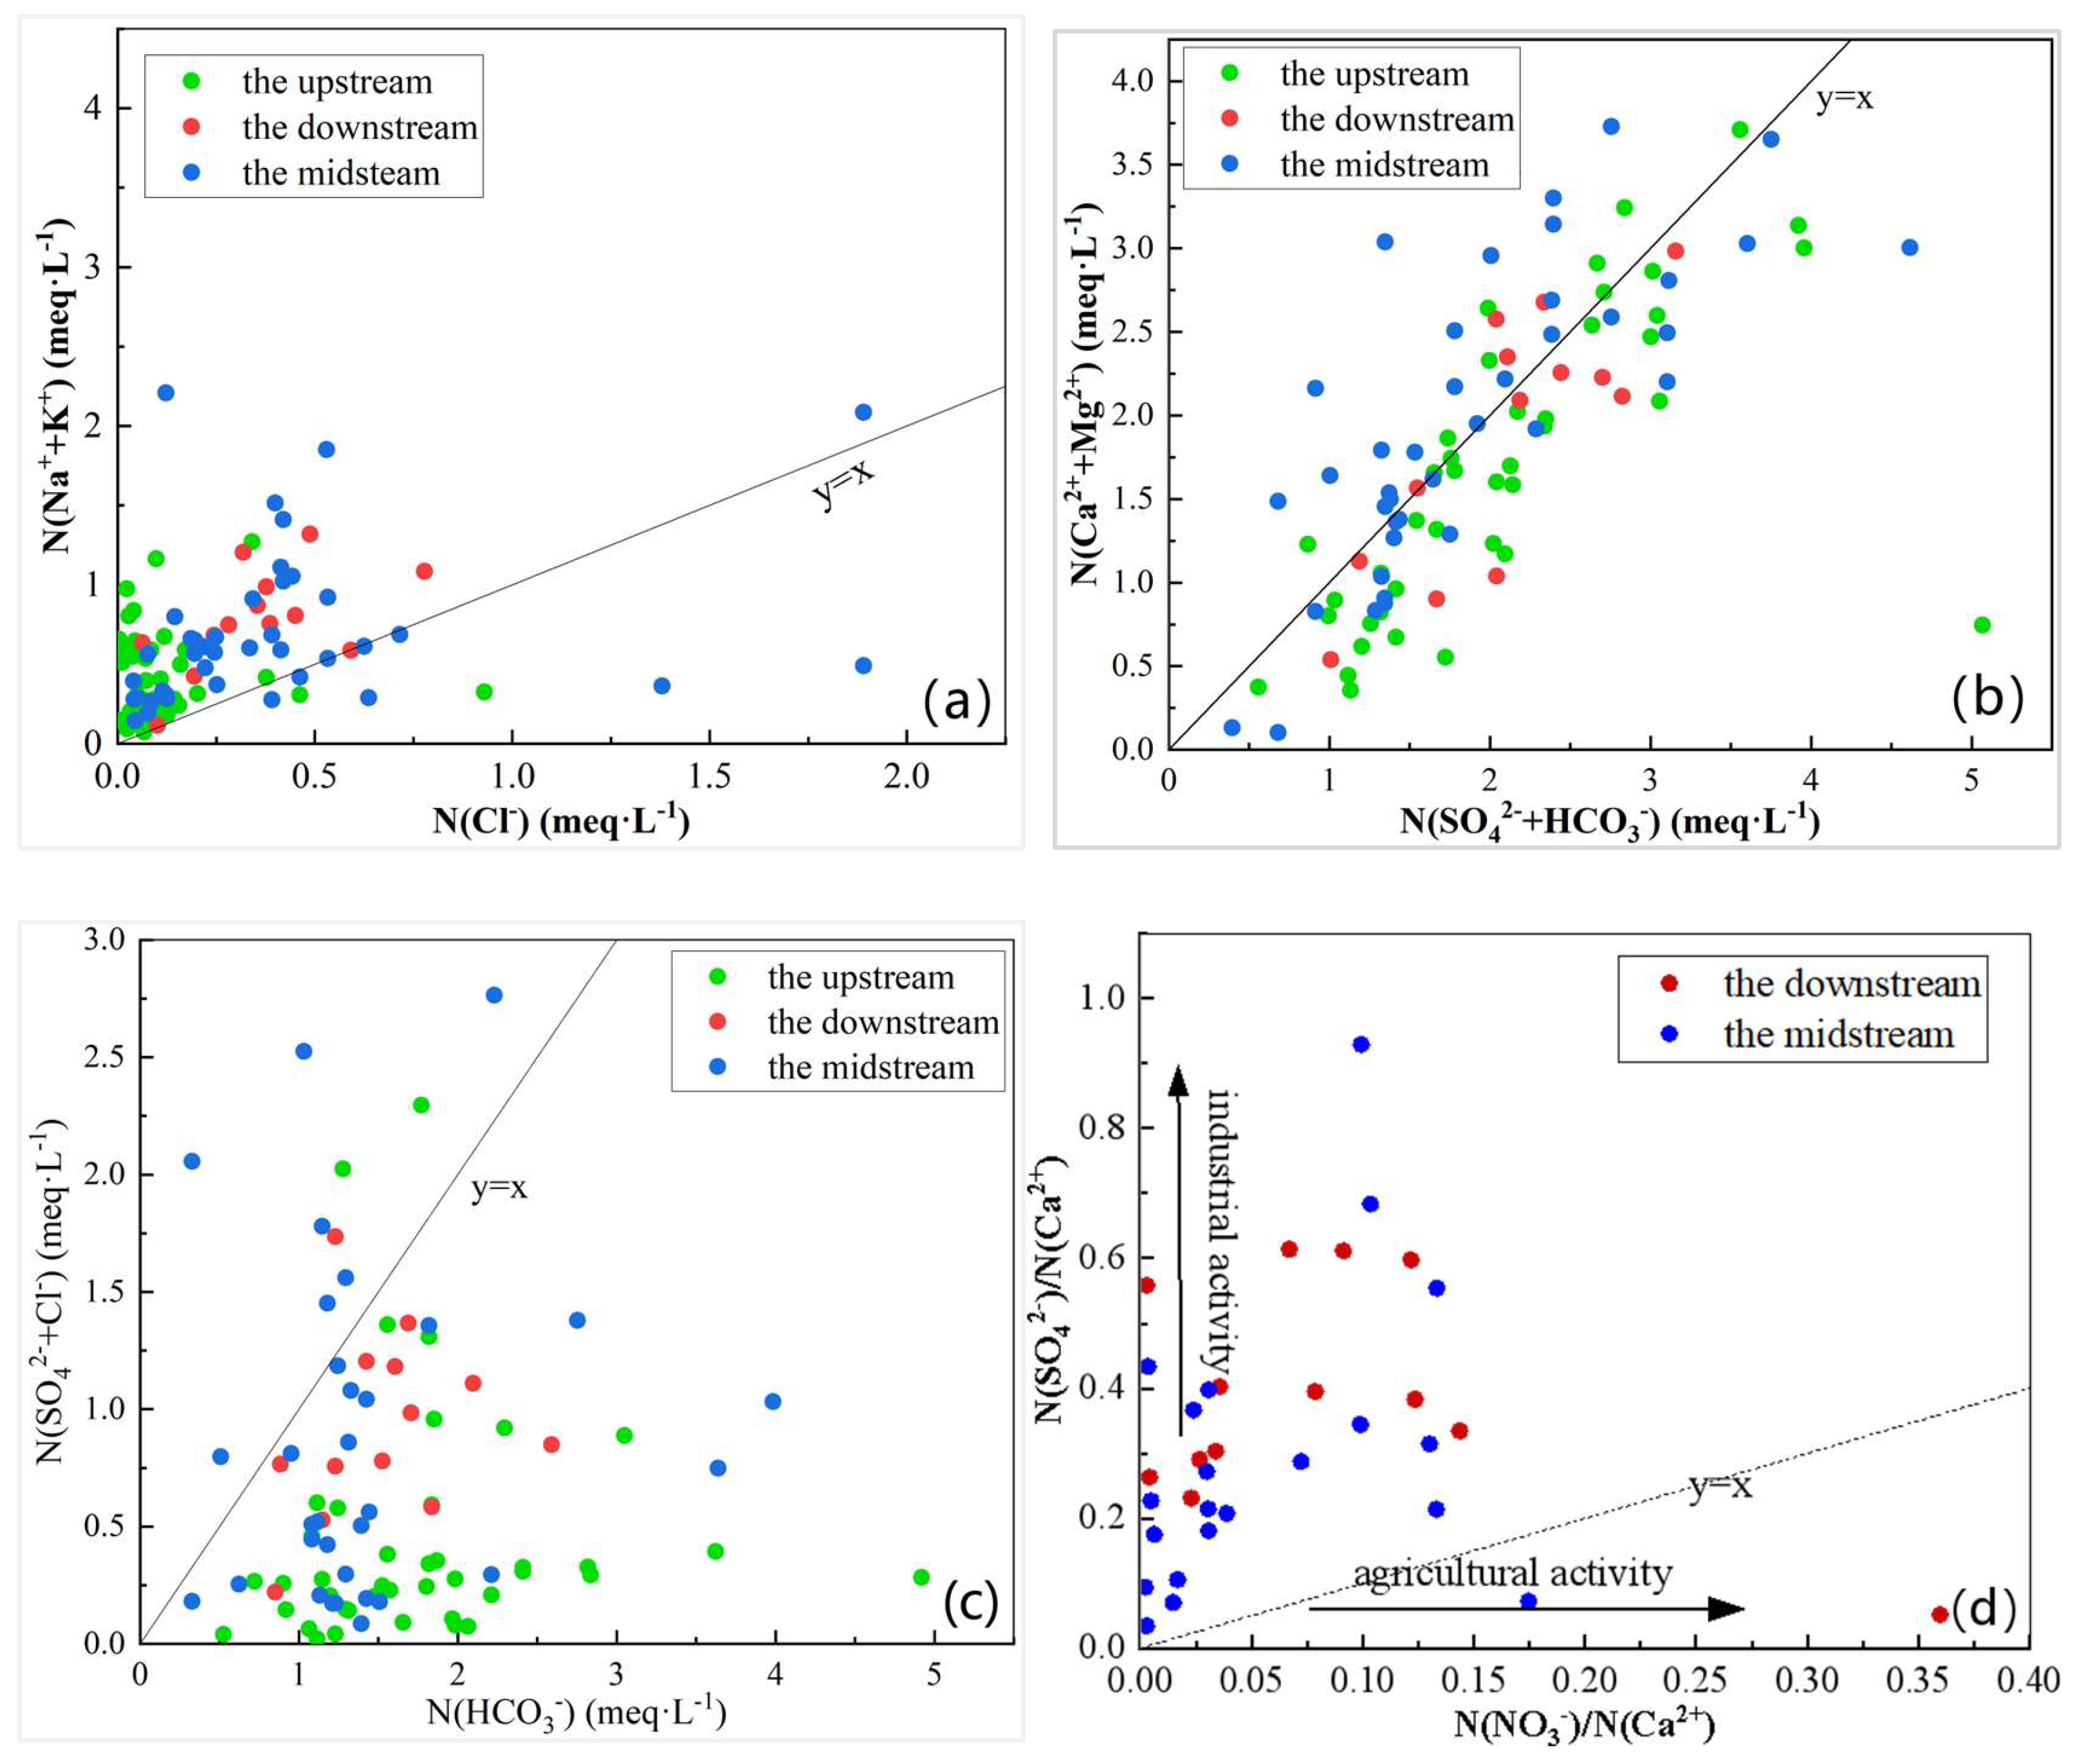
The ratio (Na+ + K+)/Cl helps determine sources of alkali metals [43,44]. As shown in Figure 7a, most groundwater samples plot above the 1:1 line, indicating that Na+ and K+ are not solely derived from halite dissolution, but also from silicate weathering, cation exchange, and anthropogenic activities-- particularly agricultural fertilization (e.g., potassium-rich fertilizers) and domestic sewage discharge (a major source of Na+ and K+ in urban areas) [45].
The ratio (Ca2+ + Mg2+)/(HCO3 + SO42−) can distinguish between carbonate and evaporite dissolution [38,39]. Most samples fall near the 1:1 line (Figure 7b), suggesting good charge balance and confirming that carbonate and sulfate dissolution are the main sources of Ca2+ and Mg2+.
To further differentiate contributions of carbonate versus evaporite dissolution, the ratio (SO42− + Cl)/HCO3 was analyzed [46]. Samples plotting below the 1:1 line (Figure 7c) indicate that carbonate weathering is the dominant control on groundwater hydrochemistry.
Anthropogenic activities also exert significant influence, especially on Na+, Cl, NO3, and SO42− concentrations [47,48,49]. For example, industrial effluents and sewage increase Na+ and Cl levels, while application of nitrogen fertilizers and animal manure elevates NO3, posing risks of eutrophication and nitrate contamination in groundwater. Combustion emissions, mining, and industrial wastewater contribute to SO42− enrichment. The NO3/Ca2+ vs. SO42−/Ca2+ relationship helps distinguish anthropogenic impacts [50,51]. Samples plotting below the 1:1 line generally reflect agricultural and domestic sources, whereas those above the line are indicative of industrial and mining activities. Given the minimal human impact in the upstream, the spatial trend analysis for anthropogenic sources (Figure 7d) focuses on the midstream and downstream regions. As shown in Figure 7d, several midstream and downstream samples (e.g., LYS155, QZS107, QZS116, QZS111) fall above the line, confirming industrial influence as a key driver of hydrochemical anomalies.
End-member analysis (Figure 8) further demonstrates the dominant role of carbonate dissolution, with most samples clustering in the carbonate domain. Some displacement toward silicate fields indicates contributions from silicate weathering, particularly feldspar-rich rocks. A subset of samples also shows influence from evaporite dissolution (gypsum). Overall, carbonate dissolution is confirmed as the primary control on groundwater chemistry, consistent with Gibbs and ion ratio results.

3.3. Hydrochemical Types

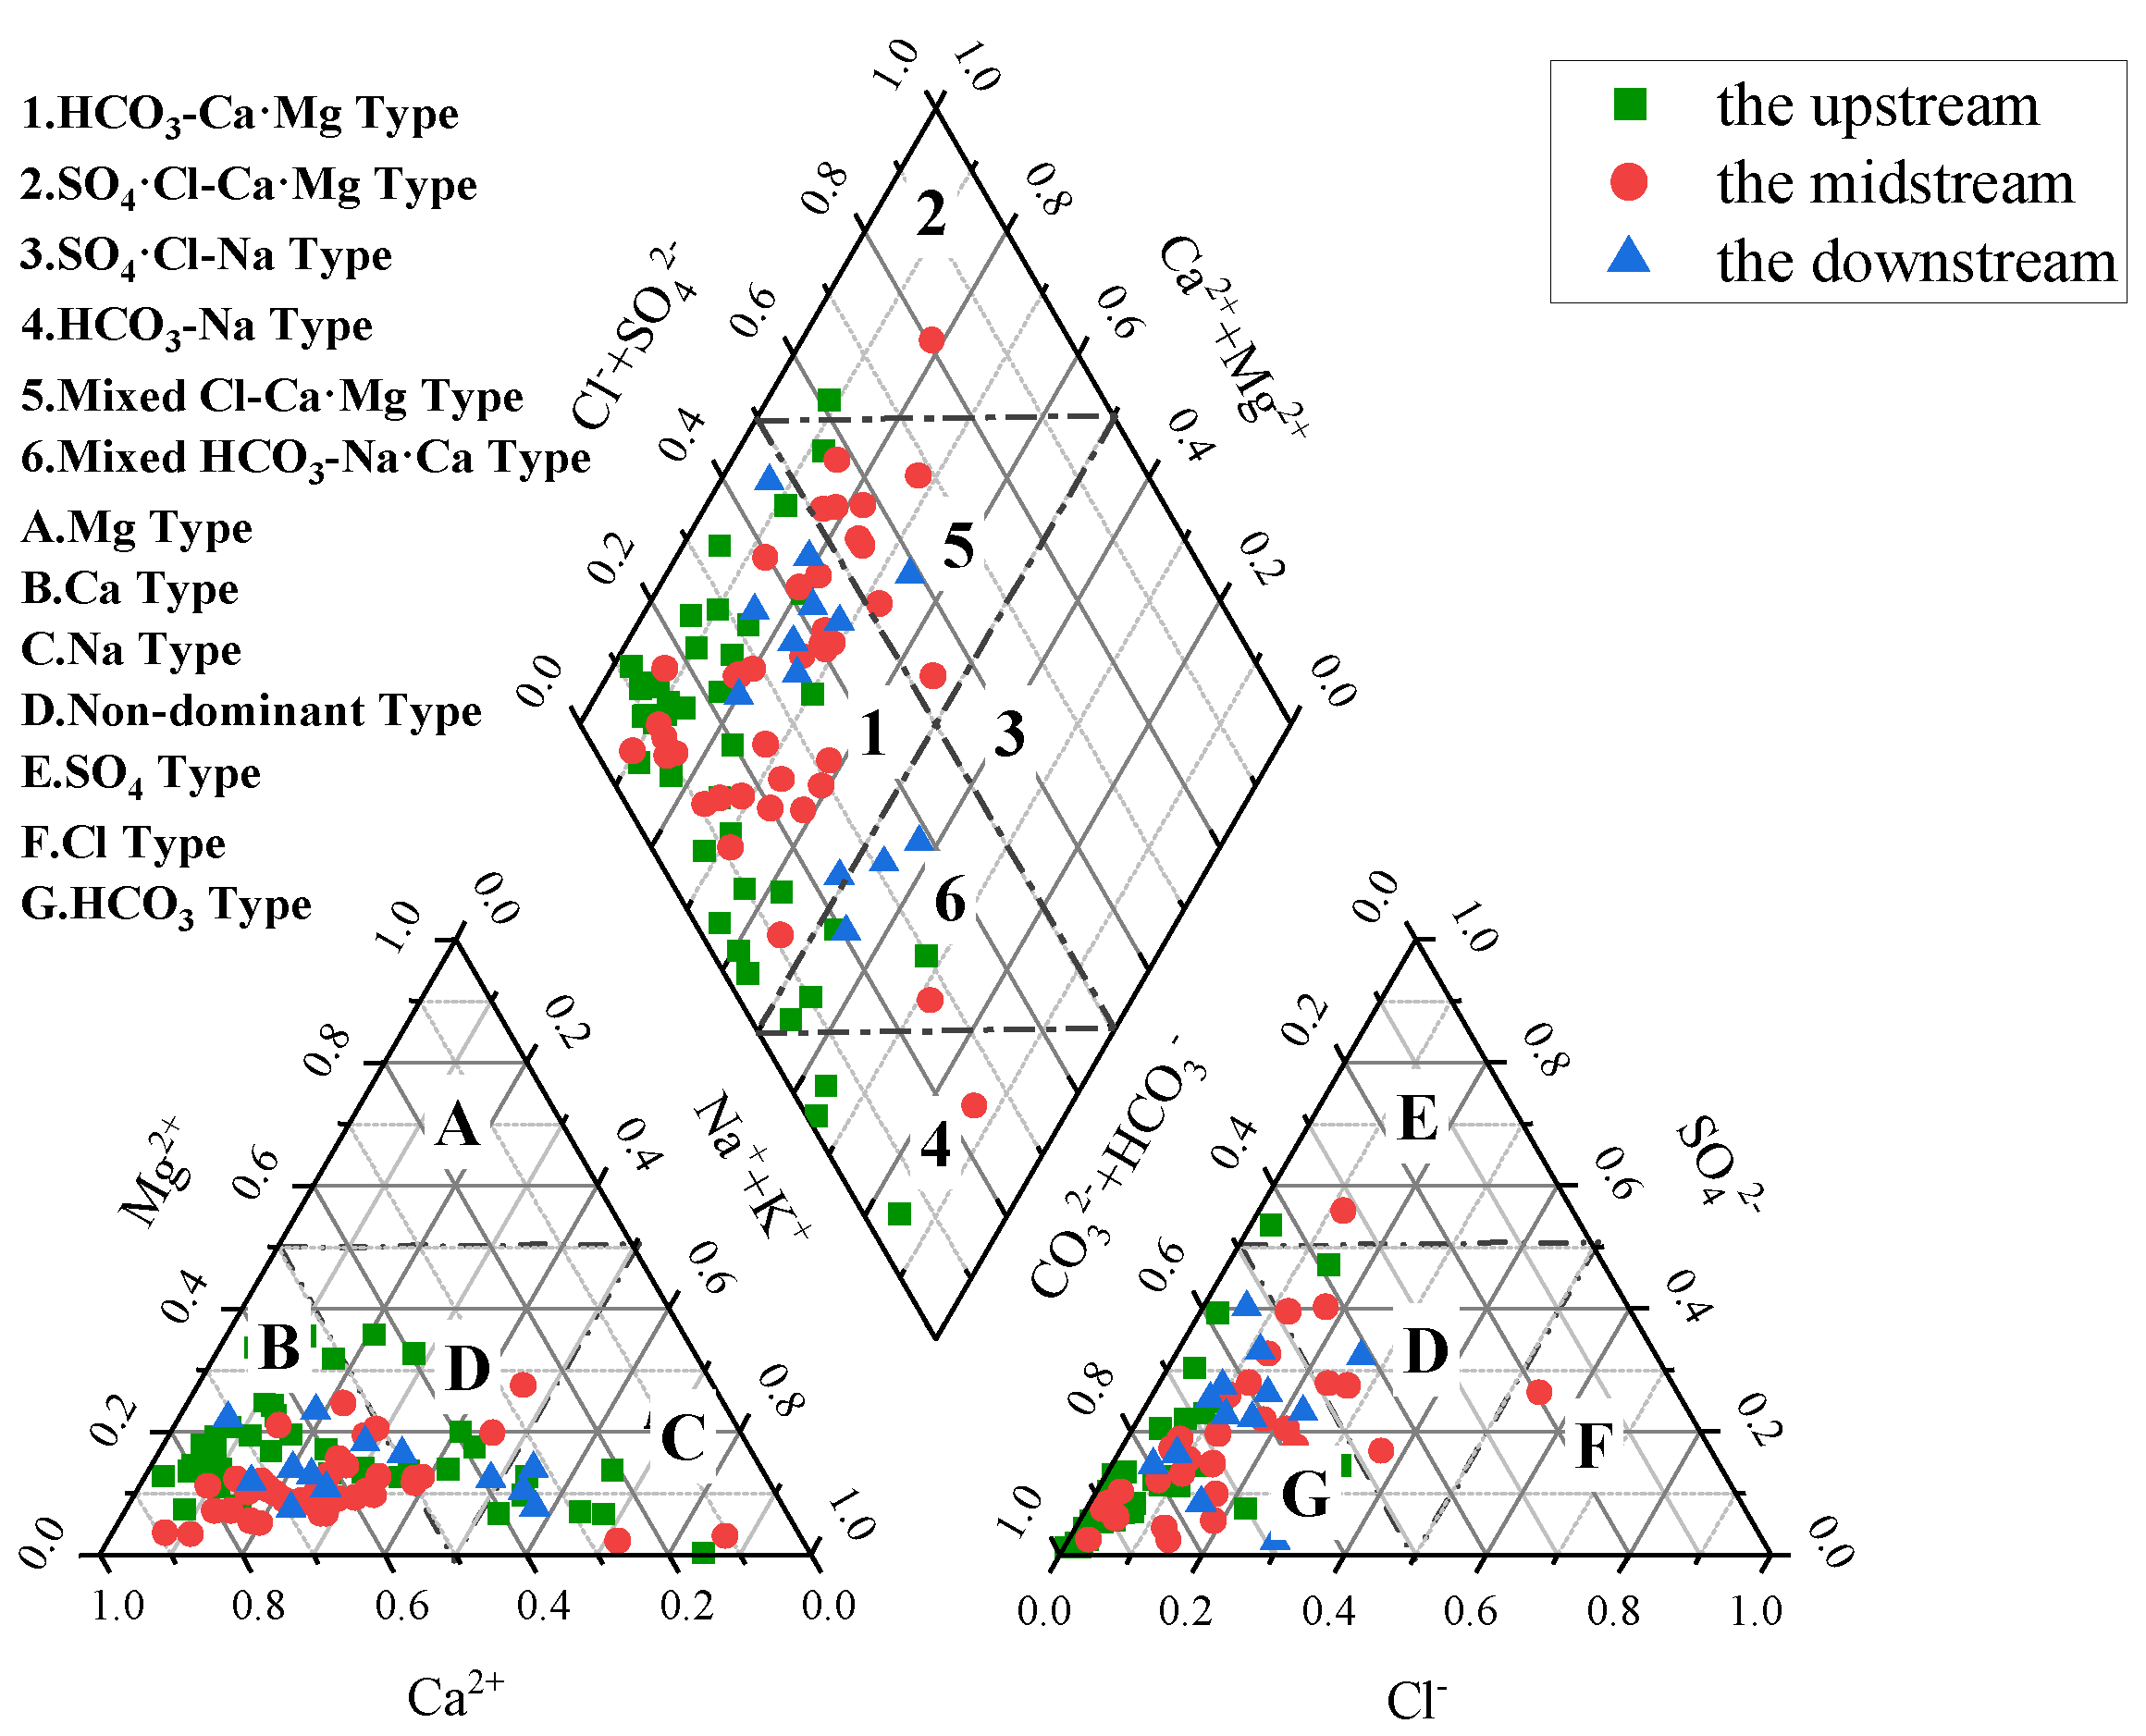
Piper diagrams are widely used to classify hydrochemical types [52]. As shown in Figure 9, most groundwater samples plot in the Ca-type cation field (Region B), with fewer in the Na-type (Region C). For anions, samples mainly fall within the HCO3-type (Region G), with some in the mixed field (Region D). These patterns indicate that Ca2+ and HCO3 dominate the ionic composition, reflecting the fundamental control of carbonate weathering.
In the central diamond field, samples mainly cluster in Regions 1, 5, and 6, indicating that the principal hydrochemical types are HCO3–Ca·Mg, Cl–Ca·Mg, and HCO3–Na–Ca. Spatially, upstream areas are dominated by Ca–HCO3 water, reflecting early-stage carbonate dissolution. In the midstream, Ca–SO4–HCO3 types are more prevalent, associated with intensified sulfate dissolution and irrigation return flow. In the downstream, Ca–HCO3 water remains common, but local occurrences of Ca–SO4 water highlight enhanced sulfate dissolution under weakly acidic or reducing conditions.

3.4. Pollution Source Identification and Quantitative Analysis

3.4.1. Principal Component Analysis (PCA)

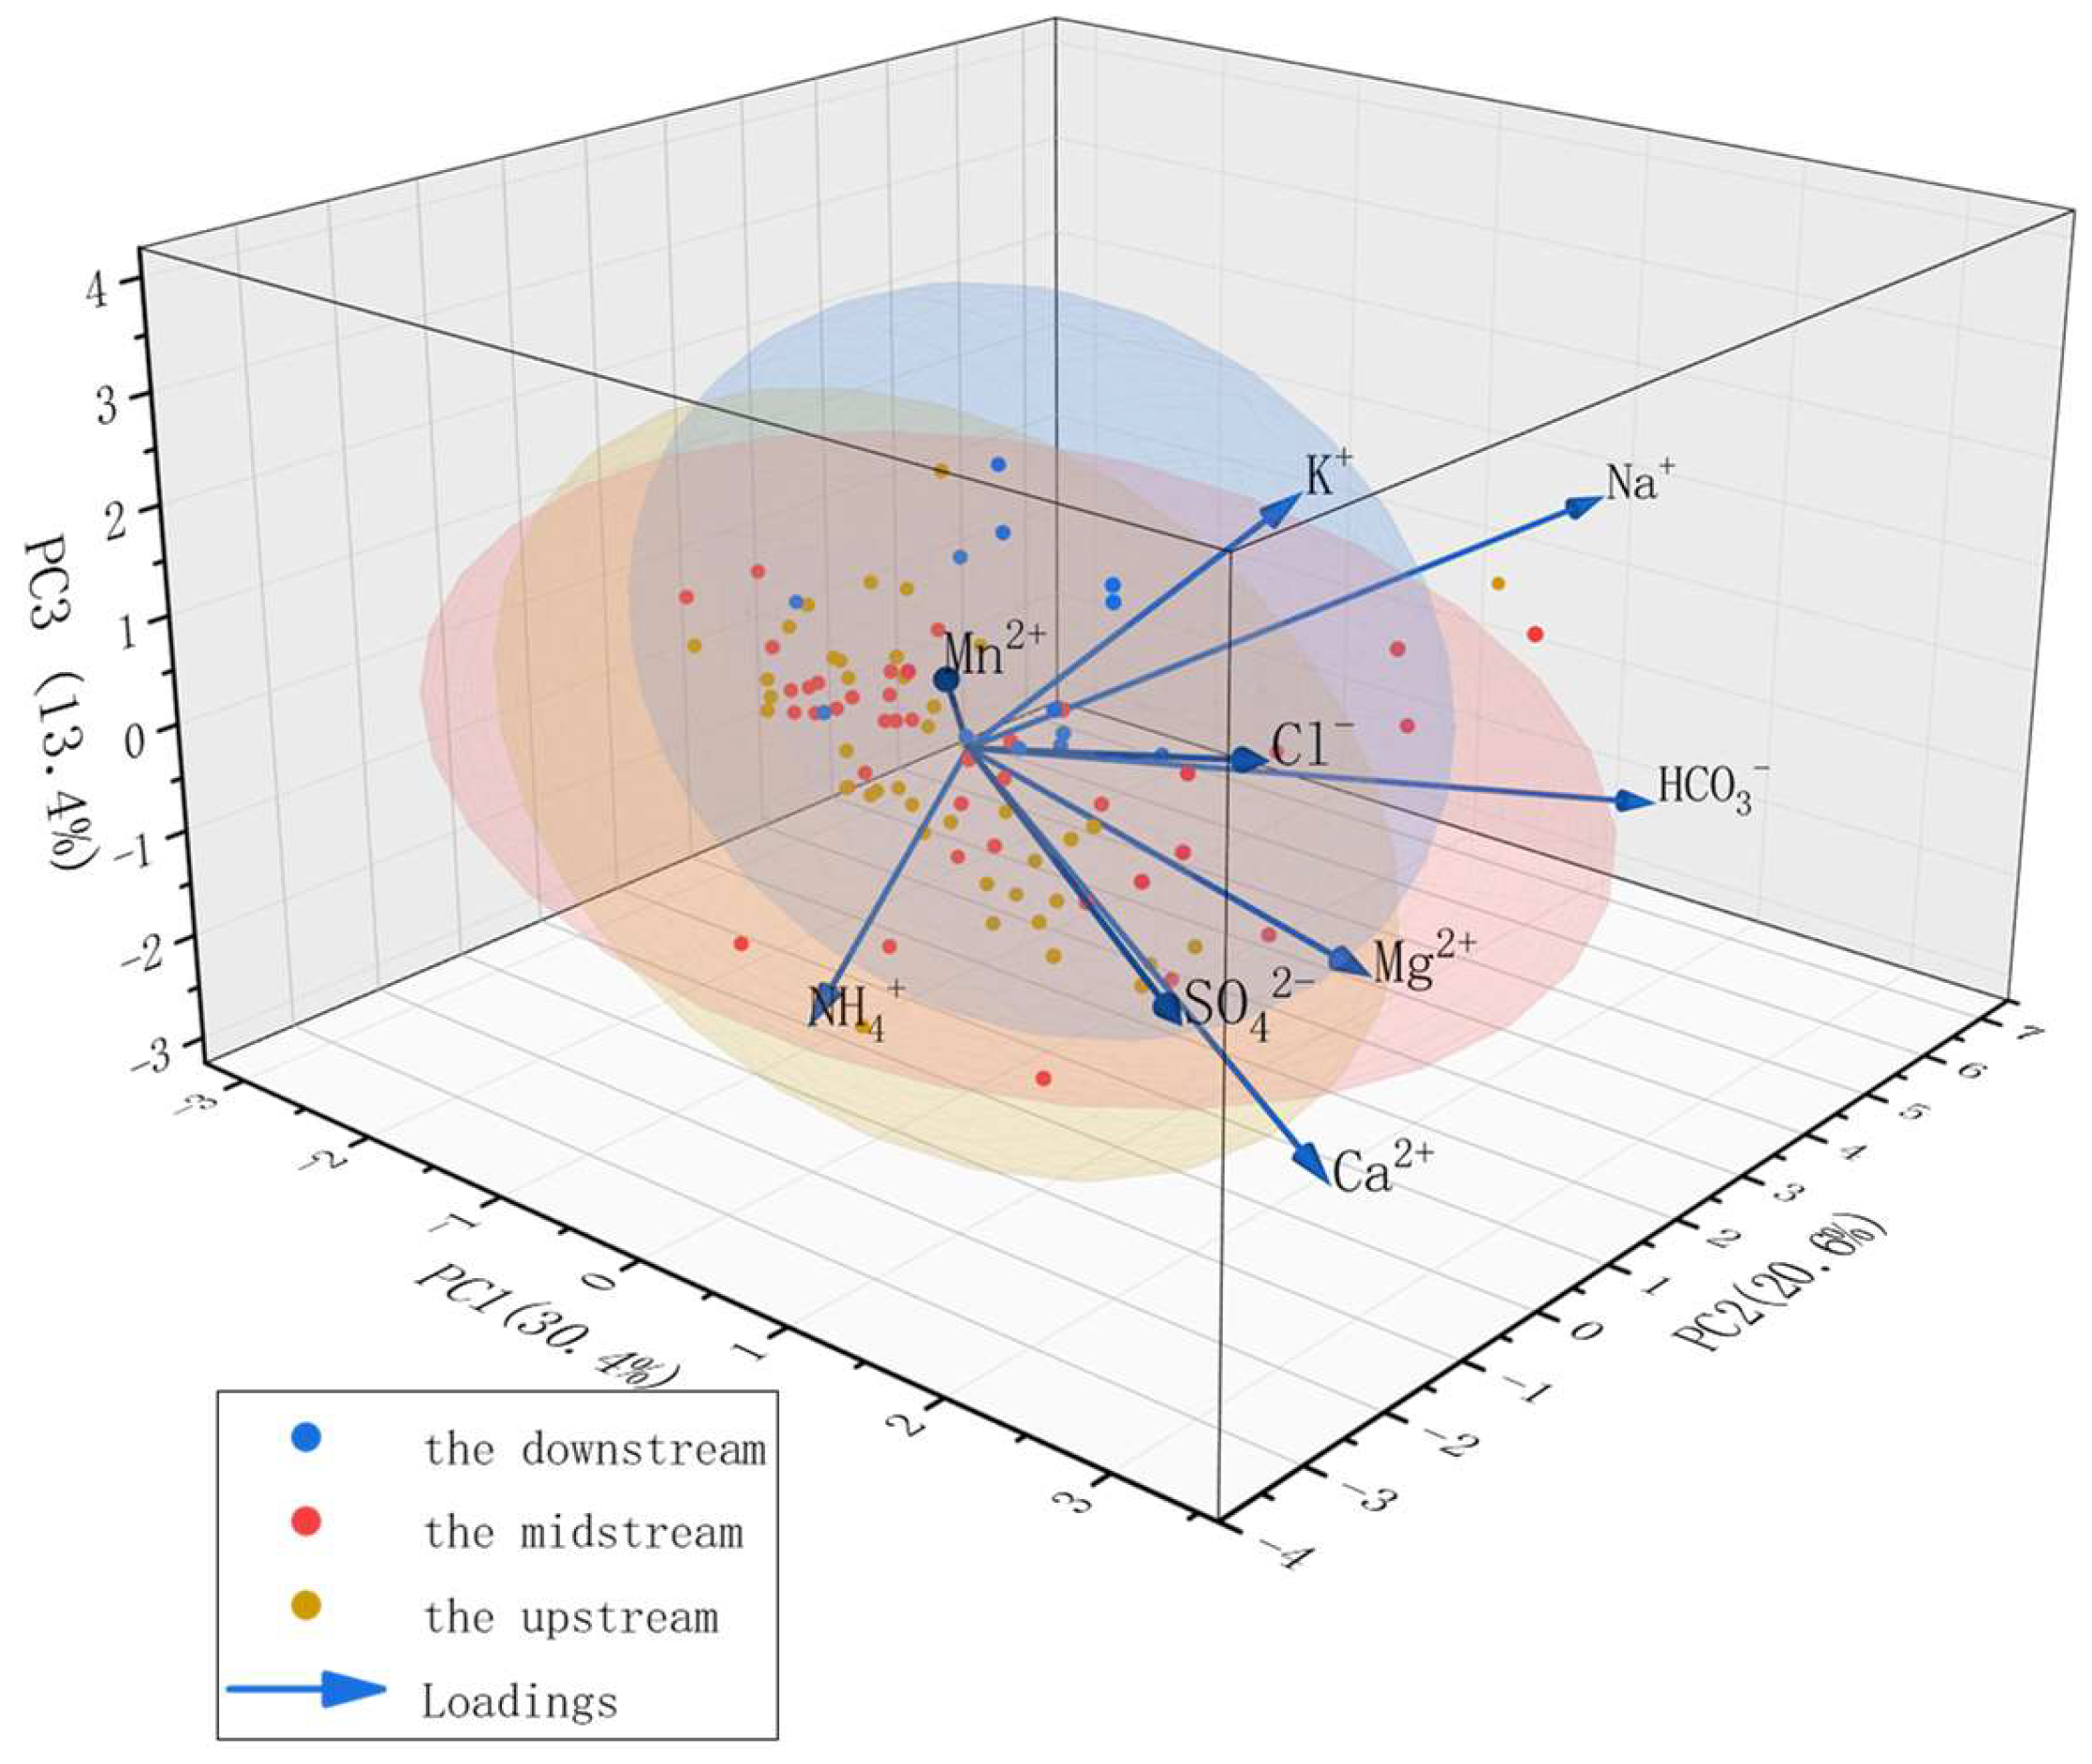
The Kaiser–Meyer–Olkin (KMO) value was 0.608 (>0.5), and Bartlett’s test showed p < 0.001, confirming suitability of PCA for groundwater source identification [53]. Three principal components with eigenvalues > 1 were extracted, explaining 64.32% of the total variance (Table 3).
PC1 (30.37%) had high loadings on Ca2+ (0.45), Mg2+ (0.465), and SO42− (0.472). These ions reflect carbonate and sulfate dissolution, indicating natural rock weathering as a dominant process [54]. Although Cl also shows moderate loading (0.398), its spatial distribution (Figure 4a) does not fully align with PC1’s upstream dominance, suggesting mixed sources—possibly minor anthropogenic inputs superimposed on a natural background.
PC2 (20.59%) had high loadings on Na+ (0.636) and HCO3 (0.594). Na+ enrichment likely results from irrigation return flows and domestic detergents, while HCO3 partly reflects carbonate buffering under anthropogenic disturbance (e.g., soil acidification from fertilizers) [54]. Thus, PC2 represents mixed agricultural and domestic anthropogenic sources, particularly in the midstream.
PC3 (13.36%) had high loadings on K+ (0.524) and Mn2+ (0.383). K+ indicates fertilizer inputs, while Mn2+ reflects both natural red-bed enrichment and industrial effluents [55]. Hence, PC3 suggests combined agricultural–industrial anthropogenic pollution, dominant in downstream industrial zones and midstream agricultural–industrial transition areas, see Figure 10.
In summary, Principal Component Analysis (PCA) preliminarily identified three driving factors of groundwater pollution in the Qujiang River Basin: natural rock weathering (PC1), agricultural and domestic pollution (PC2), and combined agricultural–industrial pollution (PC3). This qualitative identification provided the basis for subsequent quantitative source apportionment using the Positive Matrix Factorization (PMF) model. Although the rotated factor loadings did not exceed 0.7, this reflects the multi-source and multi-process nature of groundwater chemistry in the Qujiang Basin, and the cumulative variance explained (64.32%) together with KMO and Bartlett’s tests confirm the robustness of the PCA results.

3.4.2. PMF Source Apportionment

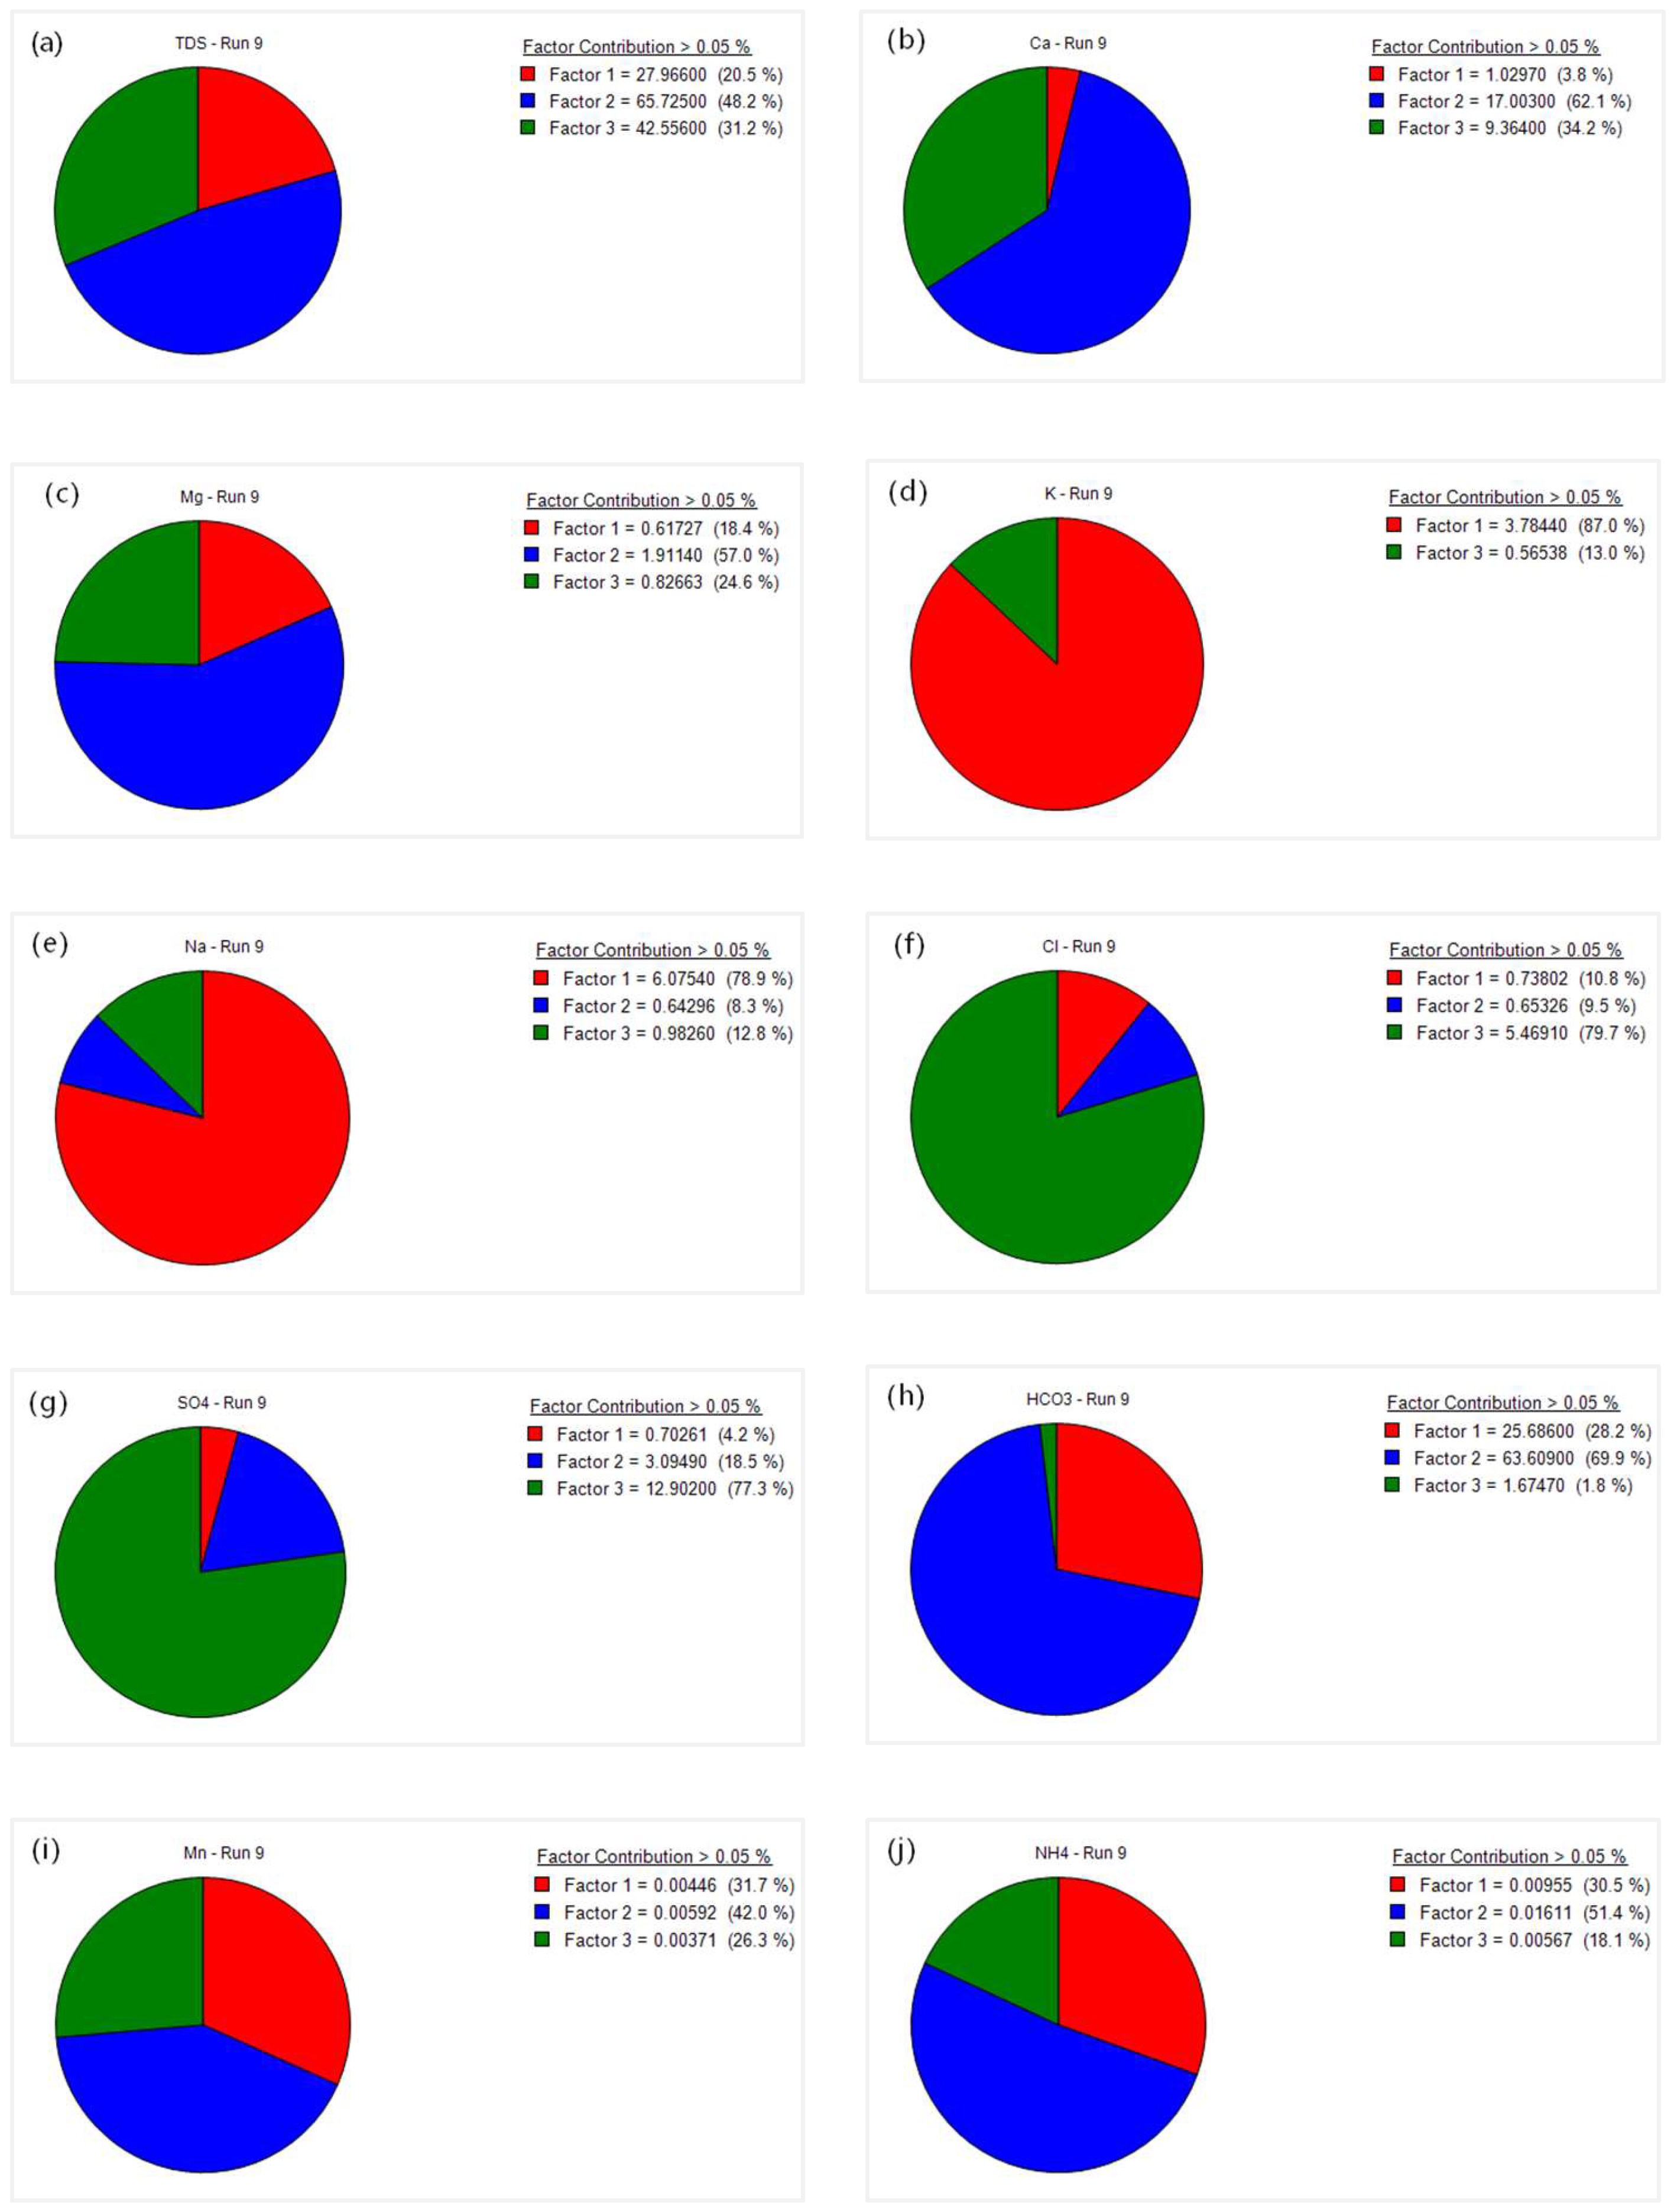
In this study, ten representative parameters were selected for PMF modeling to quantify the relative impacts of natural and anthropogenic factors on groundwater chemistry in the Qujiang River Basin [19]. The mass concentrations of these indicators and their uncertainties were input into EPA PMF 5.0, with 20 iterations and factor numbers tested from two to five. Model performance indicated that three factors yielded the most reliable solution, with the QRobust/QTrue ratio reaching the lowest convergence value and the maximum Q-value decrease being less than 1% of QRobust (3.251), confirming the robustness of the fit. Factor contribution plots (Figure 11) and species distribution patterns (Figure 12) were highly consistent with PCA results, validating the integration of the two methods.
F1 was dominated by K+ (87%) and Na+ (78.9%), accompanied by contributions of NH4+ (30.5%). These signatures point to inputs from potassium fertilizers, livestock and poultry manure, irrigation return flows containing sodium salts, and sodium-based detergents in domestic sewage. The enrichment of K+ is widely associated with agricultural activities, particularly fertilizer application and animal waste [55], while elevated Na+ in groundwater systems often reflects domestic inputs such as detergents and irrigation return flows [54]. This geochemical fingerprint is characteristic of mixed agricultural and domestic sources. Spatially, F1 accounted for the largest share in the midstream region (45.2%), coinciding with intensive agricultural activities and rural settlements. This pattern strongly aligns with PC2 identified in PCA, confirming the dominance of mixed agricultural and domestic sources.
F2 was characterized by high contributions from Ca2+ (62.1%), Mg2+ (57.0%), and HCO3 (69.9%), which are typical products of carbonate dissolution (CaCO3 + H2O + CO2 ⇌ Ca2+ + 2HCO3). This ion assemblage is a well-documented signature of natural carbonate rock weathering, commonly observed in geological terrains rich in limestone and dolomite [54]. The high HCO3 further supports CO2-driven dissolution processes under near-natural conditions. The highest spatial contribution of F2 occurred upstream (41.7%), consistent with extensive Ordovician and Cambrian carbonate outcrops. This source corresponds well with PC1 in PCA, representing natural geologic processes dominated by carbonate weathering.
F3 was mainly defined by Cl (79.7%), SO42− (77.3%), and Mn (26.3%), reflecting emissions from industrial sectors such as chlor-alkali production, coal-fired desulfurization, metal processing, and electroplating. The co-enrichment of Cl and SO42− is a recognized indicator of industrial discharges, particularly from chemical and metallurgical plants [37]. Mn, while sometimes of natural origin in red-bed regions, shows extreme enrichment here, strongly suggesting industrial release from electroplating or alloy manufacturing [56]. Downstream areas, where F3 contributed up to 58.6%, exhibited elevated Mn concentrations alongside localized Cl and SO42− anomalies. These findings are consistent with PC3 in PCA and confirm industrial effluents as the dominant downstream pollution source.
While the overall interpretations of PMF and PCA are broadly consistent—both identifying agricultural/domestic, natural weathering, and industrial sources as dominant—minor discrepancies exist in the relative loading patterns. For instance, PCA slightly emphasizes NO3–Cl–SO42− correlations in PC3, whereas PMF isolates Cl–SO42−–Mn as a distinct industrial signal with quantitative contribution. These differences arise from methodological distinctions: PCA is an unsupervised variance-based technique that identifies covariance structures without assuming source specificity, while PMF is a receptor model that incorporates uncertainty and apportions sources based on mass balance. Thus, PMF provides more interpretable source quantification, whereas PCA offers exploratory insight into variable relationships. The convergence of both methods on the same three-source framework strengthens confidence in the final interpretation.
Overall, PMF apportionment indicated that anthropogenic activities (F1 + F3) contributed 73.7% of total groundwater pollution, with agricultural/domestic inputs (38.5%) slightly exceeding industrial sources (35.2%). Natural sources (F2) accounted for 26.3%. These results corroborate PCA interpretations while providing quantitative resolution, thereby establishing a sound basis for subsequent spatial validation using the Mantel test.

3.4.3. Mantel Test Validation

To validate the spatial relevance of the PMF results, Mantel tests were conducted between factor contributions and key environmental/land use variables (Figure 13). The analysis confirmed significant correlations (p < 0.01) across all three sources, highlighting the consistency between geochemical source signals and their underlying environmental drivers, underscoring the robustness of the PCA–PMF–Mantel framework.
Agricultural and domestic sources (F1) showed strong positive correlations with farmland proportion (r = 0.462) and rural settlement density. This spatial pattern reflects the intensive agricultural practices and widespread use of fertilizers and animal manure in the midstream region, where shallow groundwater is particularly vulnerable to leaching from croplands and septic systems. The correlation reinforces the role of rural land use intensity in shaping non-point source pollution in areas with permeable soils and active recharge.
Natural sources (F2) were significantly correlated with elevation and carbonate rock exposure (r = 0.417), a relationship rooted in the upstream geology, where Ordovician and Cambrian limestone formations dominate. Groundwater in this zone evolves through prolonged interaction with carbonate minerals under forested, high-elevation conditions, leading to characteristic HCO3–Ca2+–Mg2+ enrichment. This match confirms that natural weathering, not anthropogenic influence, controls baseline chemistry in the headwaters.
Industrial sources (F3) exhibited the strongest correlation with industrial land use and urban density (r = 0.503), particularly in the downstream lowland, where decades of unregulated discharge from chemical and electroplating plants have left a persistent contamination legacy. The co-location of elevated Mn, Cl, and SO42− with industrial clusters—combined with thin vadose zones and dense drainage networks—facilitates rapid contaminant infiltration and downstream accumulation. This linkage highlights the long-term impact of industrial development on groundwater quality in urbanized zones.
Compared with multivariate approaches such as Redundancy Analysis (RDA) or Canonical Correspondence Analysis (CCA), the Mantel test offers distinct advantages in this context. It evaluates correlations between distance matrices without requiring assumptions about linear or unimodal responses, making it particularly suitable for heterogeneous basins. Its permutation-based framework also enhances statistical reliability with moderate sample sizes, as in this study.
In summary, the Mantel test effectively validated the spatial consistency of PMF-derived factors, linking source contributions to environmental drivers. Rather than merely reporting statistical associations, the results illustrate how regional hydrogeological settings and human land use patterns collectively shape groundwater contamination. Together with PCA and PMF, it completes a full-process framework for groundwater pollution source identification—qualitative recognition, quantitative apportionment, and spatial verification.

3.5. Comparison with Other Regional Studies

The above analysis clarifies the major sources and their relative contributions to groundwater pollution in the Qujiang River Basin. To place these findings in a broader geographical and environmental context, it is essential to compare them with results from other representative regions undergoing similar anthropogenic pressures.
To contextualize our source apportionment results, we compared them with findings from other major basins in China (Table 4). The contribution of agricultural and domestic sources (38.5%) in the Qujiang River Basin is comparable to that in the Fenhe River Basin (~30%) [57] and the Yangtze River Basin (43–60% from manure/sewage) [58], reflecting the widespread impact of rural activities. However, the relatively high contribution of industrial discharge (35.2%) exceeds that in most agricultural-dominated regions, highlighting the growing pressure from local industries. In contrast, natural processes and evaporative concentration play a more dominant role in arid regions such as the Hetao Plain (~30–40%) [59]. This comparison underscores the need for region-specific groundwater protection strategies that account for local hydrogeological and anthropogenic conditions.

4. Conclusions and Suggestions

This study developed and applied a coupled PCA–PMF–Mantel framework to identify groundwater pollution sources in the Qujiang River Basin. The main conclusions are as follows:
  • Groundwater hydrochemistry in the Qujiang River Basin is dominated by Ca2+ and HCO3, with HCO3–Ca·Mg as the principal water type. Carbonate dissolution is the primary control, while spatial variations reflect combined influences of natural water–rock interactions and anthropogenic activities. Specifically, upstream groundwater is mainly Ca–HCO3 type, midstream samples show higher proportions of Ca–SO4–HCO3 type due to sulfate dissolution and irrigation return flow, and downstream groundwater locally exhibits Ca–SO4 type under acidic or reducing conditions.
  • PCA and PMF consistently identified three major sources: natural rock weathering (26.3%), agricultural and domestic anthropogenic activities (38.5%), and industrial anthropogenic activities (35.2%). Agricultural and domestic contributions were most significant in the midstream agricultural belt, industrial contributions were concentrated in downstream industrial clusters, while natural sources dominated the upstream with strong geological background control.
  • Mantel test results confirmed significant spatial correlations between pollution sources and environmental drivers: agricultural and domestic sources were positively correlated with farmland proportion and rural settlement density; natural sources were associated with carbonate rock outcrops and topographic elevation; industrial sources were strongly linked to industrial land use and urban density. These findings validate the robustness and spatial rationality of the proposed framework.
Despite these insights, this study has several limitations. First, sampling was restricted to a single season, limiting representation of seasonal hydrochemical variations. Second, certain potential pollutants (e.g., organic contaminants, microplastics) were not analyzed, possibly underestimating composite pollution effects. Third, while the Mantel test effectively verified spatial associations, it remains insufficient for characterizing complex groundwater flow paths and aquifer dynamics in the basin.
Future work should incorporate multi-season, long-term monitoring with a wider range of chemical indicators, coupled with isotope tracing and groundwater flow modeling, to further enhance accuracy and resolution of groundwater source apportionment under complex hydrogeological conditions.

Author Contributions

X.L. drafted the manuscript and created figures and visualizations; Y.Z. formulated and selected appropriate research methods; J.J. managed the project; L.X. participated in data collection and investigation; C.Z. and H.H. processed the data and conducted result analysis; G.W. contributed to the writing of the initial draft and investigation; J.G. and D.T. revised the manuscript. All authors have read and agreed to the published version of the manuscript.

Funding

This research was funded by Science and Technology Innovation Program for Postgraduate students in IDP subsidized by Fundamental Research Funds for the Central Universities (ZY20260310), 2024 Langfang City Science and Technology Research and Development Program (2024013003) and Geological Survey Project (DD20190216).

Data Availability Statement

The original contributions presented in this study are included in the article. Further inquiries can be directed to the corresponding author(s).

Conflicts of Interest

The authors declare no conflicts of interest.

References

  1. Ruan, D.; Bian, J.; Wang, Y.; Wu, J.; Gu, Z. Identification of groundwater pollution sources and health risk assessment in the Songnen Plain based on PCA-APCS-MLR and trapezoidal fuzzy number-Monte Carlo stochastic simulation model. J. Hydrol. 2024, 632, 130897. [Google Scholar] [CrossRef]
  2. Deng, X.; Zou, H.; Ren, B.; Wang, J.; Chen, L. Study on Pollution Characteristics, Sources, and Health Risks of Potentially Toxic Elements in Groundwater of Dongting Lake Basin, China. Sustainability 2025, 17, 3554. [Google Scholar] [CrossRef]
  3. Wu, C.; Zhou, H.; Lu, C.; Zhao, Y.; Liu, R.; Zhan, L.; Shi, Z. Groundwater nitrate responses to extreme rainfall in alluvial-diluvial plain aquifers: Evidence from hydrogeochemistry and isotopes. J. Contam. Hydrol. 2025, 273, 104584. [Google Scholar] [CrossRef] [PubMed]
  4. Lapworth, J.D.; Boving, T.B.; Kreamer, D.K.; Kebede, S.; Smedley, P.L. Groundwater quality: Global threats, opportunities and Realising the potential of groundwater. Sci. Total Environ. 2021, 811, 152471. [Google Scholar] [CrossRef]
  5. Liu, J.; Lou, K.; Gao, Z.; Wang, Y.; Li, Q.; Tan, M. Comprehending hydrochemical fingerprint, spatial patterns, and driving forces of groundwater in a topical coastal plain of Northern China based on hydrochemical and isotopic evaluations. J. Clean. Prod. 2024, 461, 142640. [Google Scholar] [CrossRef]
  6. Ren, J.; Li, J.; Xi, B.; Yang, Y.; Lu, H.; Shi, J. Groundwater Pollution Prevention and Control in China: Current Status and Countermeasures. Strateg. Study CAE 2022, 24, 161–168. [Google Scholar] [CrossRef]
  7. Wang, G.; Zhang, Y.; Xu, L.; Jiang, J.; Li, C. Relationship between Surface Water and Groundwater Transformation in Qu River Basin. Sci. Technol. Eng. 2021, 21, 6165–6174. [Google Scholar]
  8. Jakóbczyk-Karpierz, S.; Ślósarczyk, K. Isotopic signature of anthropogenic sources of groundwater contamination with sulfate and its application to groundwater in a heavily urbanized and industrialized area (Upper Silesia, Poland). J. Hydrol. 2022, 612, 128255. [Google Scholar] [CrossRef]
  9. Pereira, S.; Galvão, P.; Miotlinski, K.; Schuch, C. Numerical modeling applications for the evaluation of the past and future scenarios of groundwater use in an urbanized complex karst aquifer in the city of Sete Lagoas, State of Minas Gerais, Brazil. Groundw. Sustain. Dev. 2024, 25, 101089. [Google Scholar] [CrossRef]
  10. Li, S.; Su, H.; Han, F.; Li, Z. Source identification of trace elements in groundwater combining APCS-MLR with geographical detector. J. Hydrol. 2023, 623, 129771. [Google Scholar] [CrossRef]
  11. Yuan, P.; Wang, Y.; Wang, L.; He, P. Change and Pollution Evaluation of Groundwater from Wet and Dry Periods of Ion-adsorbed Rare Earth Mine in Northern Guangdong Province. Bull. Soil Water Conserv. 2022, 42, 291–299. [Google Scholar] [CrossRef]
  12. Zhao, S.; Zhou, J.; Jiang, F.; Ding, Q.; Lei, M. Identifying Hydrochemical Characteristics, Control Factors, and Pollution Source of Groundwater in the Oasis Area of Toksun County, Xinjiang. China Environ. Sci. 2025, 46, 2179–2192. [Google Scholar] [CrossRef]
  13. Antelmi, M.; Mazzon, P.; Höhener, P.; Marchesi, M.; Alberti, L. Evaluation of MNA in A Chlorinated Solvents-Contaminated Aquifer Using Reactive Transport Modeling Coupled with Isotopic Fractionation Analysis. Water 2021, 13, 2945. [Google Scholar] [CrossRef]
  14. Qu, S.; Duan, L.; Mao, H.; Wang, C.; Liang, X.; Luo, A.; Huang, L.; Yu, R.; Miao, P.; Zhao, Y. Hydrochemical and isotopic fingerprints of groundwater origin and evolution in the Urangulan River basin, China's Loess Plateau. Sci. Total Environ. 2023, 866, 161377. [Google Scholar] [CrossRef] [PubMed]
  15. Taloor, A.K.; Bala, A.; Mehta, P. Human health risk assessment and pollution index of groundwater in Jammu plains of India: A geospatial approach. Chemosphere 2023, 313, 137329. [Google Scholar] [CrossRef]
  16. Du, D.D.; Bai, Y.Y.; Yuan, D.L. Chemical Spatiotemporal Characteristics and Environmental Driving Factors of Groundwater in Hetao Irrigation Area. Huan Jing Ke Xue 2024, 45, 5777–5789. [Google Scholar]
  17. Mohammed, M.A.A.; Szabó, N.P.; Szűcs, P. Multivariate statistical and hydrochemical approaches for evaluation of groundwater quality in north Bahri city-Sudan. Heliyon 2022, 8, e11308. [Google Scholar] [CrossRef]
  18. Chen, Z.; Ding, Y.; Jiang, X.; Duan, H.; Ruan, X.; Li, Z.; Li, Y. Combination of UNMIX, PMF model and Pb-Zn-Cu isotopic compositions for quantitative source apportionment of heavy metals in suburban agricultural soils. Ecotoxicol. Environ. Saf. 2022, 234, 113369. [Google Scholar] [CrossRef]
  19. Xu, J.; Si, W.; Wang, J.; Chen, B.; Zhang, M.; Liu, R.; Zhou, H.; Wang, S.; Liu, G. Identification of Pollution Sources and Health Risk Assessment of Shallow Groundwater in the North Anhui Plain Based on the PMF Model and Monte Carlo Simulation. China Environ. Sci. 2025, 46, 1–15. [Google Scholar] [CrossRef]
  20. Han, Y.; Luo, Y.; Mi, Z.; Liu, C. Source identification of groundwater pollution based on PMF model and stable isotope. Environ. Sci. Technol. 2024, 47, 127–134. [Google Scholar] [CrossRef]
  21. Wu, Z.; Wu, Y.; Yu, Y.; Wang, L.; Qi, P.; Sun, Y.; Fu, Q.; Zhang, G. Assessment of groundwater quality variation characteristics and influencing factors in an intensified agricultural area: An integrated hydrochemical and machine learning approach. J. Environ. Manag. 2024, 371, 123233. [Google Scholar] [CrossRef]
  22. Liu, F.; Liu, C.; Zhen, P.; Guo, X.; Wang, S. Groundwater quality variability with inter-basin water transfer and overexploitation control in an agriculture-dominant subregion of North China Plain. Agric. Water Manag. 2025, 317, 109660. [Google Scholar] [CrossRef]
  23. Li, M.; Sun, J.; Xue, L.; Shen, Z.; Li, Y.; Zhao, B.; Hu, L. Characterizing Aquifer Properties and Groundwater Storage at North China Plain Using Geodetic and Hydrological Measurements. Water Resour. Res. 2025, 61, e2024WR037425. [Google Scholar] [CrossRef]
  24. Li, Z.; Sun, J.; Wang, S.; Guo, X. Assessment of the Quality of Groundwater in Huang-hua-i hai Plain. Hydrogeol. Eng. Geol. 2005, 32, 51–55. [Google Scholar]
  25. Huang, L.; Li, P.; Liu, B. Health Risk Assessment of Pollution in Groundwater—A Case Study in Changjiang Delta. Saf. Environ. Eng. 2008, 15, 26–29. [Google Scholar]
  26. Wu, X.; Li, J.; Jiang, S.; Dai, L. Quality Assessment of Shallow Groundwater in the Jiangsu Region of the Yangtze River Delta. Ground Water 2013, 35, 11–13. [Google Scholar]
  27. Zhang, X.; Li, J.; Jiang, J.; Xu, L.; Zhou, T. Assessment of Groundwater Vulnerability in Red-bed Area Based on AHP and DRASTIC Model—Take the Middle and Lower Reaches of Qujiang River as an Example. J. Inst. Disaster Prev. 2021, 23, 26–33. [Google Scholar]
  28. Onjia, A.; Huang, X.; González, J.M.T.; Egbueri, J.C. Editorial: Chemometric approach to distribution, source apportionment, ecological and health risk of trace pollutants. Front. Environ. Sci. 2022, 10. [Google Scholar] [CrossRef]
  29. Liu, Y.; Zhang, C.; Jiang, J.; Zhang, Y.; Wang, G.; Xu, L.; Qu, Z. Interaction between Groundwater and Surface Water in the Qujiang River Basin in China: Evidence from Chemical Isotope Measurements. Water 2023, 15, 3932. [Google Scholar] [CrossRef]
  30. Li, X.; Zhang, Y.; Xu, L.; Jiang, J.; Zhang, C.; Wang, G.; Liu, Y.; Zhang, C.; Tian, D. Hydrochemical Characteristics and Dominant Controlling Factors of the Qujiang River Under Dual Natural–Anthropogenic Influences. Water 2025, 17, 1581. [Google Scholar] [CrossRef]
  31. HJ/T 164-2004; Technical Specifications for Environmental Monitoring of Groundwater. Environmental Science Press of China: Beijing, China, 2004; p. 41.
  32. GB 5749-2022; Chinese Standards for Drinking Water Quality. The Standardization Administration of China: Beijing, China, 2022.
  33. Paatero, P.; Tapper, U.J.E. Positive matrix factorization: A non-negative factor model with optimal utilization of error estimates of data values. Environmetrics 1994, 5, 111–126. [Google Scholar] [CrossRef]
  34. Mao, H.; Wang, G.; Liao, F.; Shi, Z.; Zhang, H.; Chen, X.; Qiao, Z.; Li, B.; Bai, Y. Spatial variability of source contributions to nitrate in regional groundwater based on the positive matrix factorization and Bayesian model. J. Hazard. Mater. 2023, 445, 130569. [Google Scholar] [CrossRef] [PubMed]
  35. Zhu, A.; Yuan, S.; Wen, S.; HUang, B.; Feng, X.; XIe, Z. Effects of landscape pattern on water quality at multi-spatial scales in the Liuxi River. ACTA Ecol. Sin. 2023, 43, 1485–1495. [Google Scholar] [CrossRef]
  36. Chen, J.; Huang, Q.; Lin, Y.; Fang, Y.; Qian, H.; Liu, R.; Ma, H. Hydrogeochemical Characteristics and Quality Assessment of Groundwater in an Irrigated Region, Northwest China. Water 2019, 11, 96. [Google Scholar] [CrossRef]
  37. Wang, G.H. Anomaly Analysis of Chemical Components of Shallow Groundwater in Red Bed Area of Quzhou. Master’s Thesis, Institute of Disaster Prevention, Langfang, China, 2021. [Google Scholar]
  38. Gibbs, R.J. Mechanisms controlling world water chemistry. Science 1970, 170, 1088–1090. [Google Scholar] [CrossRef]
  39. Shakerkhatibi, M.; Mosaferi, M.; Pourakbar, M.; Ahmadnejad, M.; Safavi, N.; Banitorab, F. Comprehensive investigation of groundwater quality in the north-west of Iran: Physicochemical and heavy metal analysis. Groundw. Sustain. Dev. 2019, 8, 156–168. [Google Scholar] [CrossRef]
  40. Marandi, A.; Shand, P. Groundwater chemistry and the Gibbs Diagram. Appl. Geochem. 2018, 97, 209–212. [Google Scholar] [CrossRef]
  41. Zhang, Y.; Xu, Z.; Zhang, L.; Lv, W.; Yuan, H.; Zhou, L.; Gao, Y.; Zhu, L. Hydrochemical characteristics and genetic mechanism of high TDS groundwater in Xinjulong Coal Mine. COAL Geol. Explor. 2021, 49, 52–62. [Google Scholar] [CrossRef]
  42. Wang, Y.; Zhao, L.; Luan, S.; Wang, J.; Zhang, L.; Li, C. Spatial patterns and driving mechanisms of groundwater chemistry in Pearl River Delta Region. Environ. Sci. Technol. 2025, 48, 125–135. [Google Scholar] [CrossRef]
  43. Li, J.; Ouyang, H.; Zhou, J. Controlling Factors of Groundwater Salinization and Pollution in the Oasis Zone of the Cherchen River Basin of Xinjiang. China Environ. Sci. 2024, 45, 207–217. [Google Scholar] [CrossRef]
  44. Liang, H.; Wang, W.; Li, J.; Fang, Y.; Liu, Z. Hydrochemical characteristics and health risk assessment of groundwater in Dingbian county of the Chinese Loess Plateau, northwest China. Environ. Earth Sci. 2022, 81, 319. [Google Scholar] [CrossRef]
  45. Yan, Y.; Gao, R.; Liu, Y.; Fang, L.; Wang, Y. Hydrochemical Characteristic and Control Factors of Groundwater in the Northwest Salt Lake Basin. China Environ. Sci. 2023, 44, 6767–6777. [Google Scholar] [CrossRef]
  46. Liu, F.; Song, X.; Yang, L.; Zhang, Y.; Han, D.; Ma, Y.; Bu, H. Identifying the origin and geochemical evolution of groundwater using hydrochemistry and stable isotopes in the Subei Lake basin, Ordos energy base, Northwestern China. Hydrol. Earth Syst. Sci. 2015, 19, 551–565. [Google Scholar] [CrossRef]
  47. Xu, Q.; Liu, C.; Li, C.; Sun, B.; Qi, H.; Wu, X.; Xu, Q. Analysis on Spatial Variability of Hydrochemical Characteristics and Control Factors of Jinan Baotu Spring Area. China Environ. Sci. 2024, 45, 4565–4576. [Google Scholar] [CrossRef]
  48. Gao, Y.; Qian, H.; Ren, W.; Wang, H.; Liu, F.; Yang, F. Hydrogeochemical characterization and quality assessment of groundwater based on integrated-weight water quality index in a concentrated urban area. J. Clean. Prod. 2020, 260, 121006. [Google Scholar] [CrossRef]
  49. Peng, H.; Yang, W.; Nadine Ferrer, A.S.; Xiong, S.; Li, X.; Niu, G.; Lu, T. Hydrochemical characteristics and health risk assessment of groundwater in karst areas of southwest China: A case study of Bama, Guangxi. J. Clean. Prod. 2022, 341, 130872. [Google Scholar] [CrossRef]
  50. Tang, L.; Yao, R.; Zhang, Y.; Ding, W.; Wang, J.; Kang, J.; Liu, G.; Zhang, W.; Li, X. Hydrochemical analysis and groundwater suitability for drinking and irrigation in an arid agricultural area of the Northwest China. J. Contam. Hydrol. 2023, 259, 104256. [Google Scholar] [CrossRef]
  51. Wu, Z.; Gao, Y.; Wen, R.; Qian, H.; Hong, M. Chemical Characteristics and Transformation Relationship of Groundwater and Surface Water in Fenghe River Basin at the Northern Foot of Qinling Mountains, China. J. Earch Sci. Environ. 2024, 46, 334–350. [Google Scholar] [CrossRef]
  52. Piper, A.M. A graphic procedure in the geochemical interpretation of water-analyses. Eos Trans. Am. Geophys. Union 1944, 25, 914–928. [Google Scholar] [CrossRef]
  53. Yang, Y.; Liu, H.; Zhao, K.; Wang, X.; Li, M.; Wang, R.; Li, R. Source Apportionment of Soil Heavy Metals in Moqi Area on the Northwest Edge of Songnen Plain Based on the PCA-PMF Model. China Environ. Sci. 2025, 46, 3220–3228. [Google Scholar] [CrossRef]
  54. Luo, A.; Xiong, Q.; Meng, J.; Mu, D.; Xiao, S. Hydrochemical characteristics of a karst basin and its response to world heritage protection. npj Herit. Sci. 2025, 13, 363. [Google Scholar] [CrossRef]
  55. Griffioen, J. Potassium adsorption ratios as an indicator for the fate of agricultural potassium in groundwater. J. Hydrol. 2001, 254, 244–254. [Google Scholar] [CrossRef]
  56. Vesković, J.; Deršek-Timotić, I.; Lučić, M.; Miletić, A.; Đolić, M.; Ražić, S.; Onjia, A. Entropy-weighted water quality index, hydrogeochemistry, and Monte Carlo simulation of source-specific health risks of groundwater in the Morava River plain (Serbia). Mar. Pollut. Bull. 2024, 201, 116277. [Google Scholar] [CrossRef] [PubMed]
  57. Li, Z.; Lu, C.; Zhang, Y.; Wu, C.; Liu, B.; Shu, L. Mechanisms of evolution and pollution source identification in groundwater quality of the Fen River Basin driven by precipitation. Sci. Total Environ. 2024, 952, 175893. [Google Scholar] [CrossRef] [PubMed]
  58. Chen, R.; Hu, Q.; Shen, W.; Guo, J.; Yang, L.; Yuan, Q.; Lu, X.; Wang, L. Identification of nitrate sources of groundwater and rivers in complex urban environments based on isotopic and hydro-chemical evidence. Sci. Total Environ. 2023, 871, 162026. [Google Scholar] [CrossRef] [PubMed]
  59. Vranesevic, M.; Zemunac, R.; Grabic, J.; Salvai, A. Hydrochemical Characteristics and Suitability Assessment of Groundwater Quality for Irrigation. Appl. Sci. 2024, 14, 615. [Google Scholar] [CrossRef]
  60. Ning, J.; Li, P.; Wu, J.; Yuan, Z.; Xu, F.; Zheng, L. Source apportionment of groundwater nitrate pollution in irrigation districts along the Jing River, Guanzhong Basin: Insights from hydrochemistry, isotopes, and the MixSIAR model. J. Environ. Chem. Eng. 2025, 13, 116231. [Google Scholar] [CrossRef]
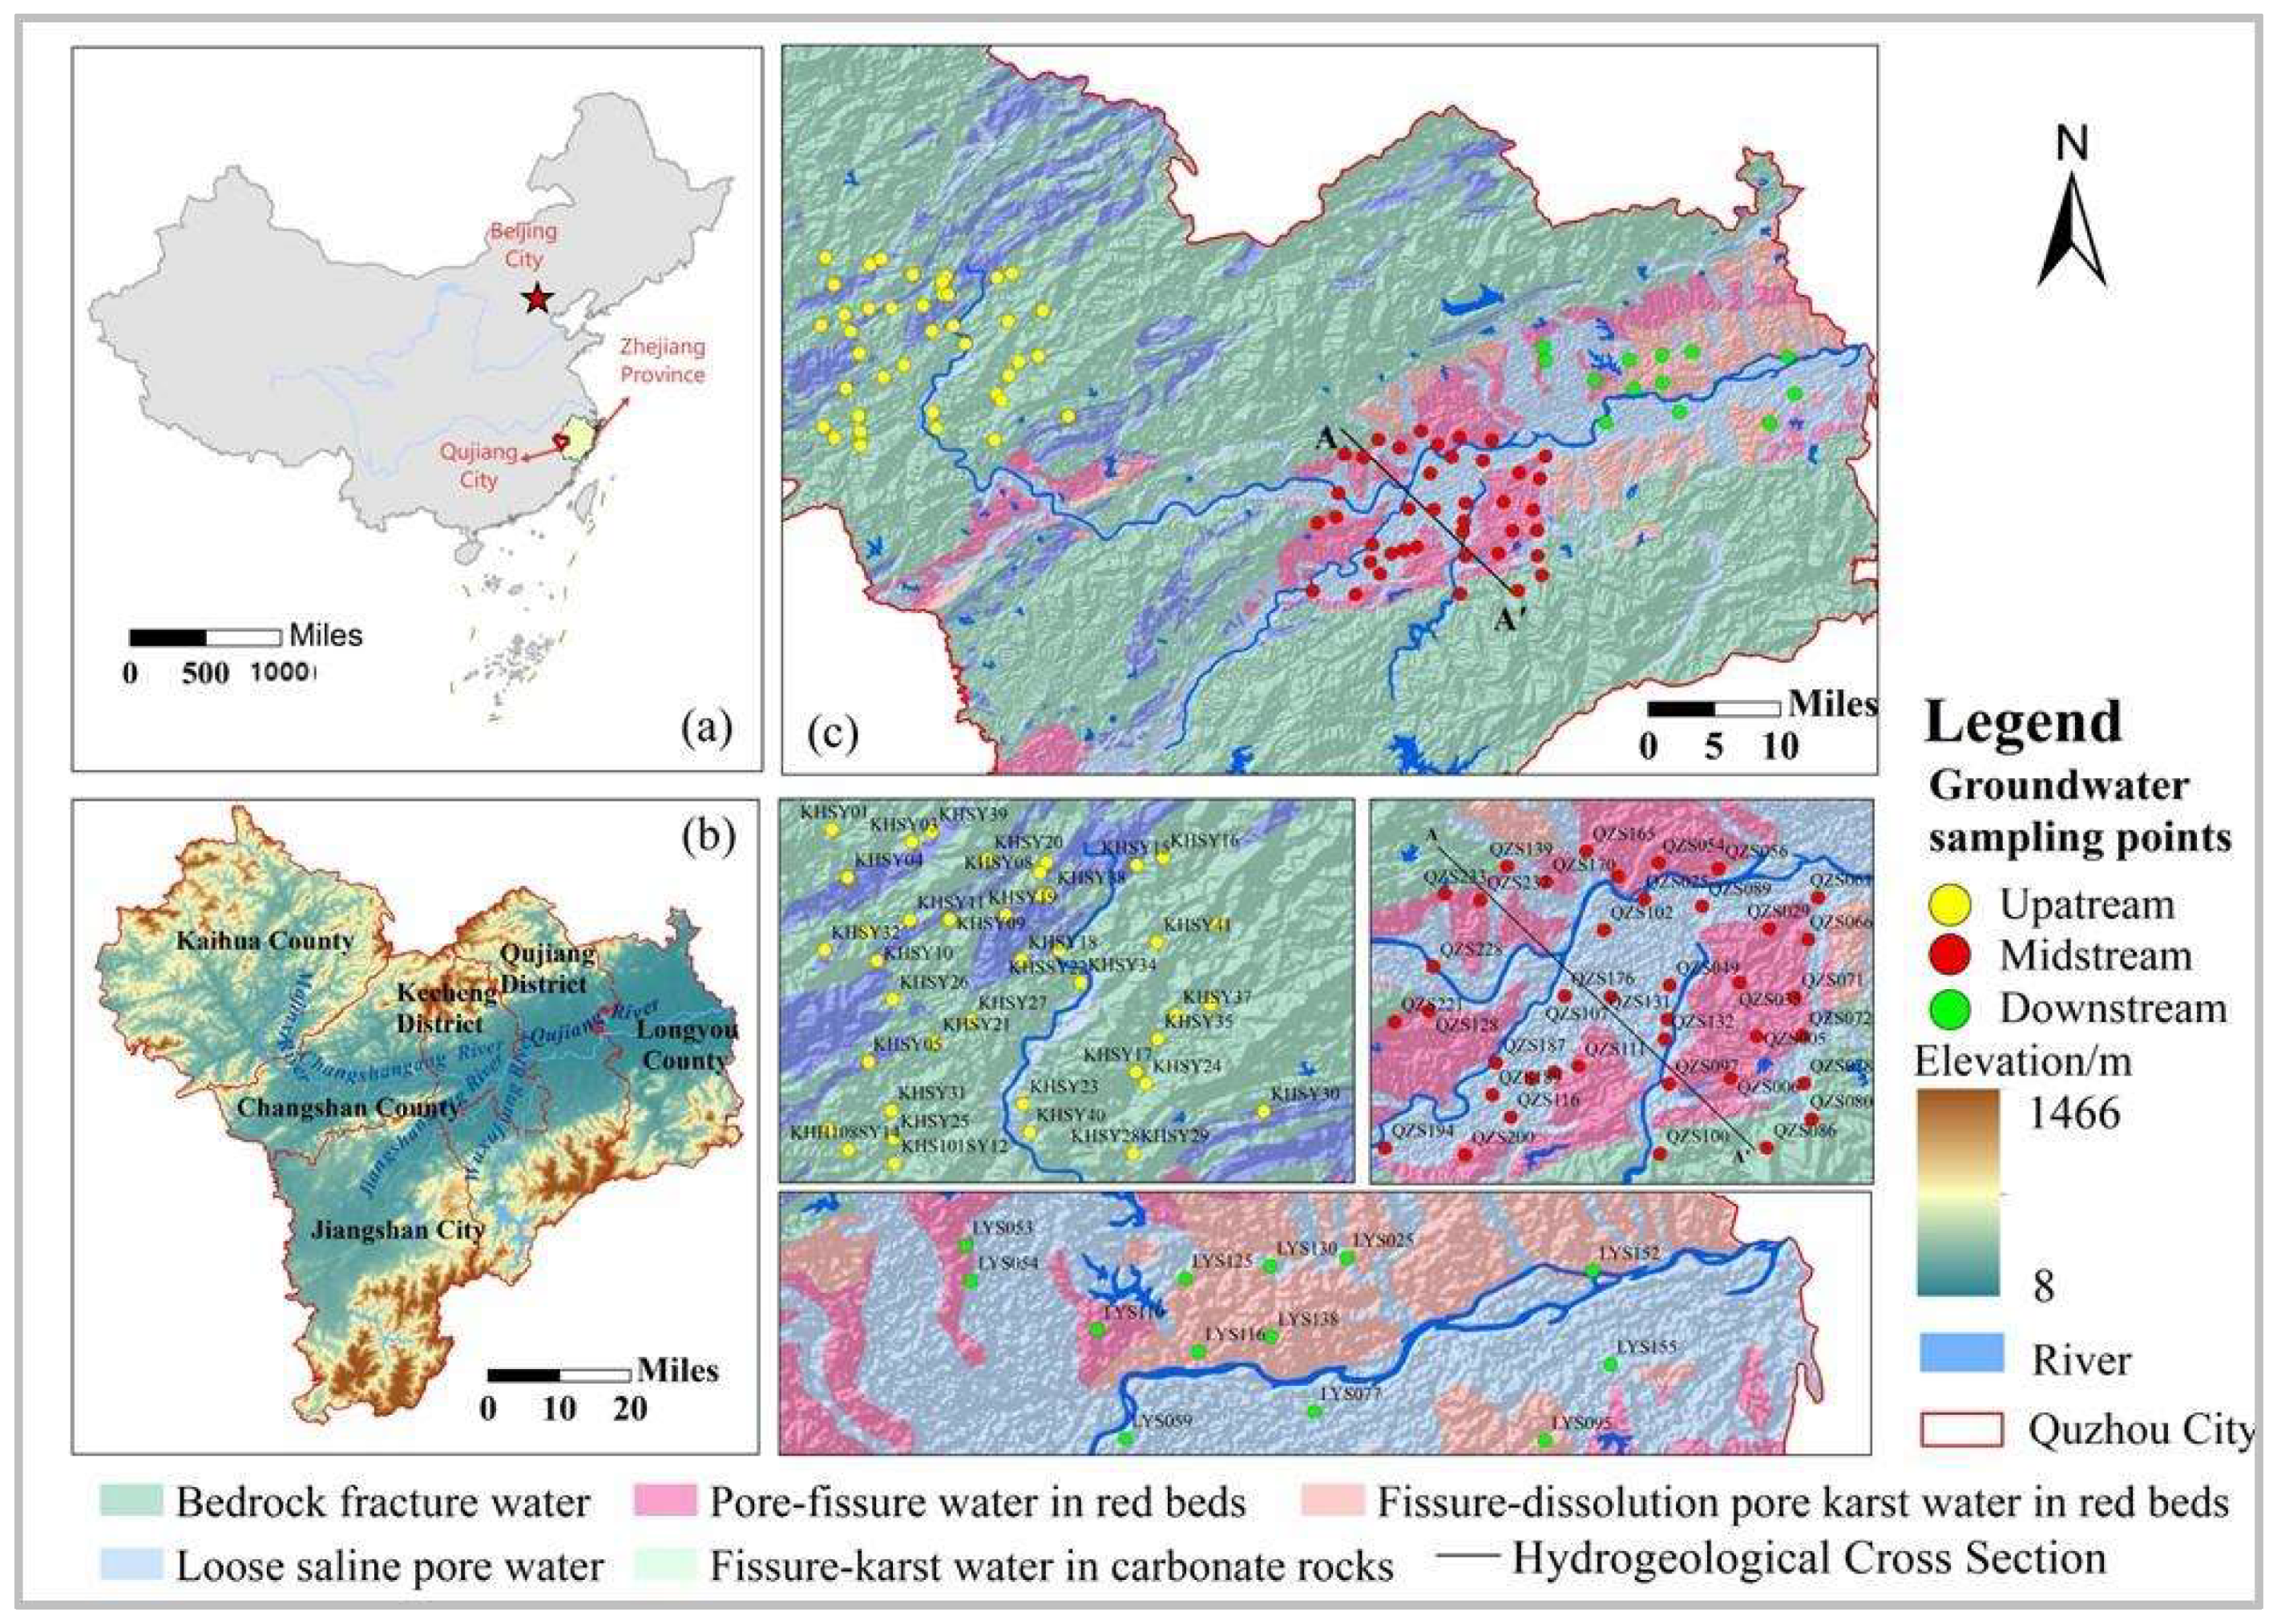
Figure 1. Location of the study area and sampling sites. (a) Geographic location map; (b) Topographic and geomorphic map; (c) Hydrogeological map.
Water 17 02881 g001
Figure 2. Hydrogeological cross-section of the study area.
Water 17 02881 g002
Figure 3. Boxplots of major hydrochemical parameters in groundwater.
Water 17 02881 g003
Figure 4. Spatial distribution of exceedance factors in groundwater. (a) pH; (b) NH4+; (c) Mn; (d) TDS.
Water 17 02881 g004
Figure 5. Gibbs diagram of groundwater in the Qujiang River Basin. (a) TDS/(Na+/(Na++Ca2+)); (b) TDS/(Cl/Cl+HCO3).
Water 17 02881 g005
Figure 6. Pearson correlation matrix of major hydrochemical parameters.
Water 17 02881 g006
Figure 7. Scatter plots of major ion ratios. (a) N(Na++K+)/N(Cl-); (b) N(Ca2++Mg2+)/N(SO42-+HCO3-); (c) N(SO42-+Cl-)/N(HCO3-); (d)(N(SO42-)/N(Ca2+))/(N(NO3-)/N(Ca2+)); (Note: Upstream samples are excluded from (d) to focus on areas with significant anthropogenic influence, as their NO3 and SO42− levels are low and do not reflect clear human activity signals.).
Water 17 02881 g007
Figure 8. End-member diagrams for groundwater samples. (a) (Mg2+/Na+)/(Ca2+/Na+); (b) (HCO3-/Na+)/(Ca2+/Na+).
Water 17 02881 g008
Figure 9. Piper diagram of groundwater samples.
Water 17 02881 g009
Figure 10. PCA results for groundwater samples.
Water 17 02881 g010
Figure 11. PMF factor contribution plots.
Water 17 02881 g011
Figure 12. Contribution distribution results of individual indicators. (a) TDS; (b) Ca2+; (c) Mg2+; (d) K+; (e) Na+; (f) Cl-; (g) SO42-; (h) HCO3-; (i) Mn; (j) NH4+.
Water 17 02881 g012
Figure 13. Mantel test results for source–environment associations.
Water 17 02881 g013
Table 1. Analytical methods and detection limits for groundwater quality parameters.
ParametersDetection LimitDetection MethodParametersDetection LimitDetection Method
K+0.10flame atomic absorption spectrophotometryCl-0.10silver nitrate volumetric method
Na+0.01flame atomic absorption spectrophotometrySO42-0.20barium sulfate turbidimetric method
Ca2+0.004disodium edetate titrationNO3-0.02ultraviolet spectrophotometry
Mg2+0.01disodium edetate titrationF-0.01ion-selective electrode method
HCO3-5.00acid titrationNH4+0.04UV-Vis spectrophotometry
TH10.00disodium edetate titrationMn0.005flame atomic absorption spectrophotometry
TDS4.00dry residue methodAs0.01HG-AFS
Ba0.005ICP-MS1Cd0.001ICP-MS1
Pb0.005ICP-MS1Cr0.01ICP-MS1
Note: The unit of detection limit is mg·L−1.; All trace metals (Ba, Pb, Cd, Cr) were analyzed by inductively coupled plasma mass spectrometry (ICP-MS) at Zhejiang Zhongyi Testing and Research Institute Co., Ltd.
Table 2. Statistical results of hydrochemical indices in the study area.
ParameterspHTDSCa2+Mg2+K+Na+ClSO42−HCO3MnNH4+
UpstreamMin (mg·L−1)5.27 30 4.080.30 0.51.28 0.3 0.8 32 0.02 0.02
Max (mg·L−1)8.98252 63.00 12.80 24.1 93.00 33.0 105.0 300 0.92 1.59
Mean
(mg·L−1)
6.8512526.46 4.43 4.2 9.20 4.4 15.7 1080.32 0.13
SD (mg·L−1)0.65 53 15.063.005.1 14.29 5.8 20.9 50 0.52 0.34
CV (%)9.4% 42.8% 56.9% 67.7% 121.8% 155.3% 132% 132.9%46.2%162.4% 270.8%
MidstreamMin (mg·L−1)5.05 43 1.58 0.13 0.7 2.16 1.52.020 0.01 0.02
Max (mg·L−1)6.95 426 70.10 15.30 35.2 49.80 67.1 100.0 243 3.14 2.17
Mean
(mg·L−1)
6.27 162 33.29 4.12 7.2 11.88 14.2 23.6 86 0.14 0.22
SD (mg·L−1)0.5392 15.50 3.58 7.5 9.52 15.2 21.2 470.54 0.49
CV (%)8.5% 57% 46.6% 87% 103.5% 80.1% 107% 89.6% 54.3%372.3% 223.3%
DownstreamMin (mg·L−1)6.17 58 8.25 1.50 1.0 1.860 2.2 1.9 52 1.50 0.02
Max (mg·L−1)7.54 212 49.008.95 22.8 20.800 27.6 48.6 158 8.95 0.30
Mean
(mg·L−1)
6.79 1560 29.99 4.57 10.2 12.062 12.6 27.5 93 4.57 0.08
SD (mg·L−1)0.40 47 13.23 2.09 7.15.346 6.9 14.1 30 2.090.10
CV (%)5.9% 29.7% 44.1% 45.7% 69.7% 44.3%54.8%51.3%31.8% 45.7% 112.4%
Table 3. Principal component loadings after varimax rotation.
ParametersRotated Factor Loadings
PC1PC2PC3
K+0.2330.1350.524
Na+0.1870.6360.209
Ca2+0.450−0.101−0.451
Mg2+0.465−0.076−0.079
Cl0.398−0.1160.289
SO42−0.472−0.3080.025
HCO30.2820.594−0.355
Mn2+0.169−0.2150.383
NH4+0.039−0.234−0.339
eigenvalue2.571.311.21
explained variance /%30.3720.5913.36
cumulative explained variance /%30.3750.6964.32
Table 4. Comparison of groundwater pollution source apportionment results from representative studies in different regions of China.
Study AreaMethodMajor Sources IdentifiedContribution
(%)
Key Tracers
Qujiang River Basin (this study)PCA–PMF–MantelNatural weathering26.3Ca2+, HCO3, Mg2+
Agricultural & domestic38.5NO3, NH4+, Cl
Industrial discharge35.2SO42−, Mn
Fenhe River Basin [57] (FRB)PMF–GISRock weathering & evaporation~40–50F, As, Cr, Ca2+
Agricultural inputs~30NO3, Cl
Anthropogenic discharge~20–30Na+, SO42−
Guanzhong Basin [60]Dual isotopes (δ15N–NO3, δ18O–NO3) + Bayesian modelAgricultural fertilizers45–60%NO3, δ15N
Manure & sewage25–35%NH4+, Cl, δ15N > +15‰
Atmospheric deposition10–15%NO3, low δ15N
Hetao Plain [59]Hydrochemical + statistical analysisIrrigation return flow~40–50TDS, Cl, NO3
Evaporative concentration~30–40Cl, Na+, TDS
Natural dissolution~10–20Ca2+, HCO3
Yangtze River Basin [58]SIAR + δ15N/δ18O–NO3Manure and sewage43–60%NH4+, Cl, δ15N > +10‰
Chemical fertilizers23–44%NO3, low δ15N
Soil organic N21–39%δ15N~+5‰
Disclaimer/Publisher’s Note: The statements, opinions and data contained in all publications are solely those of the individual author(s) and contributor(s) and not of MDPI and/or the editor(s). MDPI and/or the editor(s) disclaim responsibility for any injury to people or property resulting from any ideas, methods, instructions or products referred to in the content.