Article

Evaluating the Ability of Wetlands to Remove Nutrients from Streams and Rivers Across the Conterminous United States by Diatom-Inferred Total Phosphorus

1
School of Life Sciences, Institute of Life Sciences and Green Development, Hebei University, Baoding 071002, China
2
Department of Integrative Biology, Michigan State University, East Lansing, MI 48824, USA
*
Author to whom correspondence should be addressed.
These authors contributed equally to this work.
Water 2025, 17(19), 2865; https://doi.org/10.3390/w17192865
Submission received: 27 August 2025 / Revised: 27 September 2025 / Accepted: 29 September 2025 / Published: 1 October 2025
(This article belongs to the Section Water Quality and Contamination)

Abstract

The efficiency of wetlands in removing nutrients from streams and rivers can be accurately evaluated using diatom-inferred total phosphorus (DI-TP), as DI-TP integrates the effects of various environmental factors. However, studies assessing the efficiency of an extensive set of wetlands at multiple scales and under different levels of human disturbance activities (HDA) in removing DI-TP from streams and rivers are sparse. A national-scale dataset from the U.S. EPA’s 2008–2009 National Rivers and Streams Assessment survey provides a unique opportunity to answer this question. Our results showed that, compared to watershed-scale wetlands, local-scale wetlands performed better at removing DI-TP from streams and rivers. Additionally, wetlands performed better at removing DI-TP under lower levels of HDA, suggesting that high levels of HDA could alter the structure and function of wetlands enough to affect their ability to remove nutrients. Interaction analysis revealed there was a significant positive relationship between HDA and local-scale wetlands. We conclude that DI-TP is a valuable metric for evaluating the effectiveness of wetlands at removing nutrients from streams and rivers. To support freshwater management, both the spatial scale of wetlands and the level of HDA on wetlands, along with their cross-scale interactions, should be considered.

Graphical Abstract

1. Introduction

Wetlands are often thought of as nutrient sinks [1,2,3,4]. A general decrease in nutrient concentration by wetlands can improve water quality and can reduce the likelihood of algae blooms and other abrupt ecological changes in downstream waters. Zhang et al. found that the destruction of constructed wetlands in a headwater river led to an increase in total phosphorus (TP) (15%) and total nitrogen (TN) (17%) in streams [5]. However, it is difficult to identify which landscape feature(s), operating at which spatial scale(s) (e.g., the watershed scales), best captures nutrient condition variation in streams [6,7,8]. Compared to the local-scale land use and land cover (LULC), the watershed-scale LULC could be more correlated with water quality, because the processes of nutrient generation and removal have been known to occur at large spatial scales [9,10,11,12]. In the State of Iowa, Mitchell et al. found that local catchment scale (i.e., small watershed) assessments of the effect of wetlands were valuable for understanding how land management approaches influence ecosystem services in wetlands [13]. In a study that examined the local wetland relationships with lake TP, it was discovered that the relationship between local wetland cover in the riparian lake buffer and lake TP was affected by regional landscape characteristics, such as agriculture and urban land use [14].
On the other hand, wetlands are under the stress of a suite of human disturbance activities (HDA) [15] (e.g., urban land use, water diversion projects, farming), which can influence the nutrient removal ability of wetlands. The capacity of wetlands to improve water quality is affected by P loading rates [1], which are closely related to the level of HDA on wetlands. Wetlands can shift their structures and lose their nutrient removal capacity when the nutrient loading rate surpasses a certain limit [16]. Therefore, the nutrient removal ability of wetlands could be compromised in systems with high levels of HDA, particularly those associated with nutrient enrichment (e.g., the percentage of row crops). Until now, studies have focused on the impacts of an individual wetland or a few wetlands on nutrient removal in streams and rivers [17,18,19]. Evaluating a large number of wetlands at various spatial scales and under different levels of HDA would provide a more comprehensive assessment of wetland nutrient removal in streams and rivers.
Compared with other assemblages commonly used in ecological condition assessments (e.g., fish, macroinvertebrates, and plants), algae (especially benthic diatoms) are more sensitive to the eutrophication status in streams [20]. For that reason, diatom indicators are extensively used in ecological condition assessments because of their diversity, sensitivity to nutrient pollution, and easily quantified species optimum and tolerances [21,22]. Diatom-inferred total phosphorus (DI-TP) is a better indicator of nutrient conditions in streams and rivers than one-time measured TP for a number of reasons. Biologically available P is the only form of P which can be directly used by algae and, compared with traditional TP, DI-TP can integrate the effects of a variety of environmental factors (e.g., nutrients, light availability, and water-flow velocity). Moreover, diatom metrics can reflect the longer-term environmental conditions of streams and rivers, even though conditions can be temporally highly variable [23]. Many studies have reported the successful use of DI-TP to reflect water quality in streams [24,25,26,27] and lakes [28,29,30]. However, studies that have evaluated the efficiency of an extensive set of wetlands on removing bioavailable phosphorus (e.g., DI-TP) from streams and rivers are limited.
The aim of the present study is to use DI-TP to evaluate the effectiveness of wetlands at various spatial scales and under different levels of HDA at removing nutrients from streams and rivers located across the conterminous US. Data from the United States Environmental Protection Agency’s (U.S. EPA’s) 2008–2009 National Rivers and Streams Assessment (NRSA) survey and associated LULC data provided a unique opportunity to test our hypotheses. We hypothesized that (1) watershed-scale wetlands perform better at removing DI-TP than local-scale wetlands; (2) wetlands with a low level of HDA are more efficient at removing DI-TP; (3) interactions exist between the different spatial scales and the magnitude of HDA on the efficiency of wetland DI-TP removal. To test our hypotheses, first, we reconstructed the TP concentrations in streams and rivers based on diatom data and water quality data from the 2008–2009 NRSA survey. Using the LULC data for selected streams and rivers, we classified the level of HDA on wetlands based on their percentiles of watershed-scale agriculture and urban land use. Next, the DI-TP concentrations and a suite of LULC variables were used as the left and right hand of a function to model the effects of spatial scale and the level of HDA on the efficiency of wetland DI-TP removal in streams and rivers. Finally, we used analysis of variance (ANOVA) to determine whether or not interactions existed between different spatial scales of LULC and levels of HDA in wetlands.

2. Materials and Methods

2.1. Ecoregions

Ecoregions can capture a significant amount of natural variation caused by differences in climate, geology, hydrology, soils, LULC, and natural vegetation. We used Omernik’s 9 level III ecoregions to group the studied sites in the conterminous US (Figure 1) [31]. Based on satellite images in the 2008 National Land Cover Database (https://www.mrlc.gov/data, accessed on 25 January 2024), land cover in the aggregated EHIGH region (i.e., the Northern Appalachians (NAP) and the Southern Appalachians (SAP) ecoregion) was dominated by forest (~60%), and land cover in the aggregated WMTNS region (i.e., Xeric (XER) and the Western Mountains (WMT) ecoregions) was made up of forest and grassland/shrubs. In contrast, the aggregated PLNLOW region (i.e., the Coastal Plain (CPL), the Upper Midwest (UMW), the Temperate Plains (TPL), the Southern Plains (SPL) and the Northern Plains (NPL) ecoregions) was more developed, mostly composed of agriculture. Wetlands were more abundant in coastal regions, such as UMW (25.6%), CPL (23.51%), and NAP (8.79%).

2.2. Datasets

The diatom and water physicochemical data from the 2008–2009 NRSA survey were downloaded from the US Environmental Protection Agency’s website (https://www.epa.gov/national-aquatic-resource-surveys/data-national-aquatic-resource-surveys, accessed on 10 February 2024). The management, design, methods, and standards of the NRSA survey are described in four companion documents: USEPA [32,33,34,35]. The target population consisted of all streams and rivers within the conterminous US that had flowing water during the sampling period (from May to September), which excluded portions of tidal rivers up to head-of-salt. The NRSA survey used a probability-based sample design to ensure the selected sites could represent streams and rivers across the conterminous US. For our purpose, 1871 sites with LULC data and diatom data were selected for analysis (Figure 1).
From late May through the end of September in the years 2008 and 2009, field crews used a multi-parameter water quality meter (or sonde) to measure dissolved oxygen (DO), pH, temperature, and conductivity. In the laboratory, TP and TN were determined by the molybdate/ascorbic acid blue method and automated colorimetric analysis with cadmium reduction method, respectively [34]. The diatom subsamples were digested with nitric acid to remove organic material. Six hundred valves were identified and counted to the lowest possible taxonomic level at 1000× magnification according to Krammer and Lange-Bertalot [36,37,38,39]. If the counting target for 600 valves could not be reached, the taxonomists were required to count at least 20 transects (cover slide: 22 × 22 mm) or for not less than 6 h. For diatom QAQC, 10% of samples were randomly selected and identified by independent taxonomists. The similarity between the datasets from the two taxonomists had to be ˃85% [34].
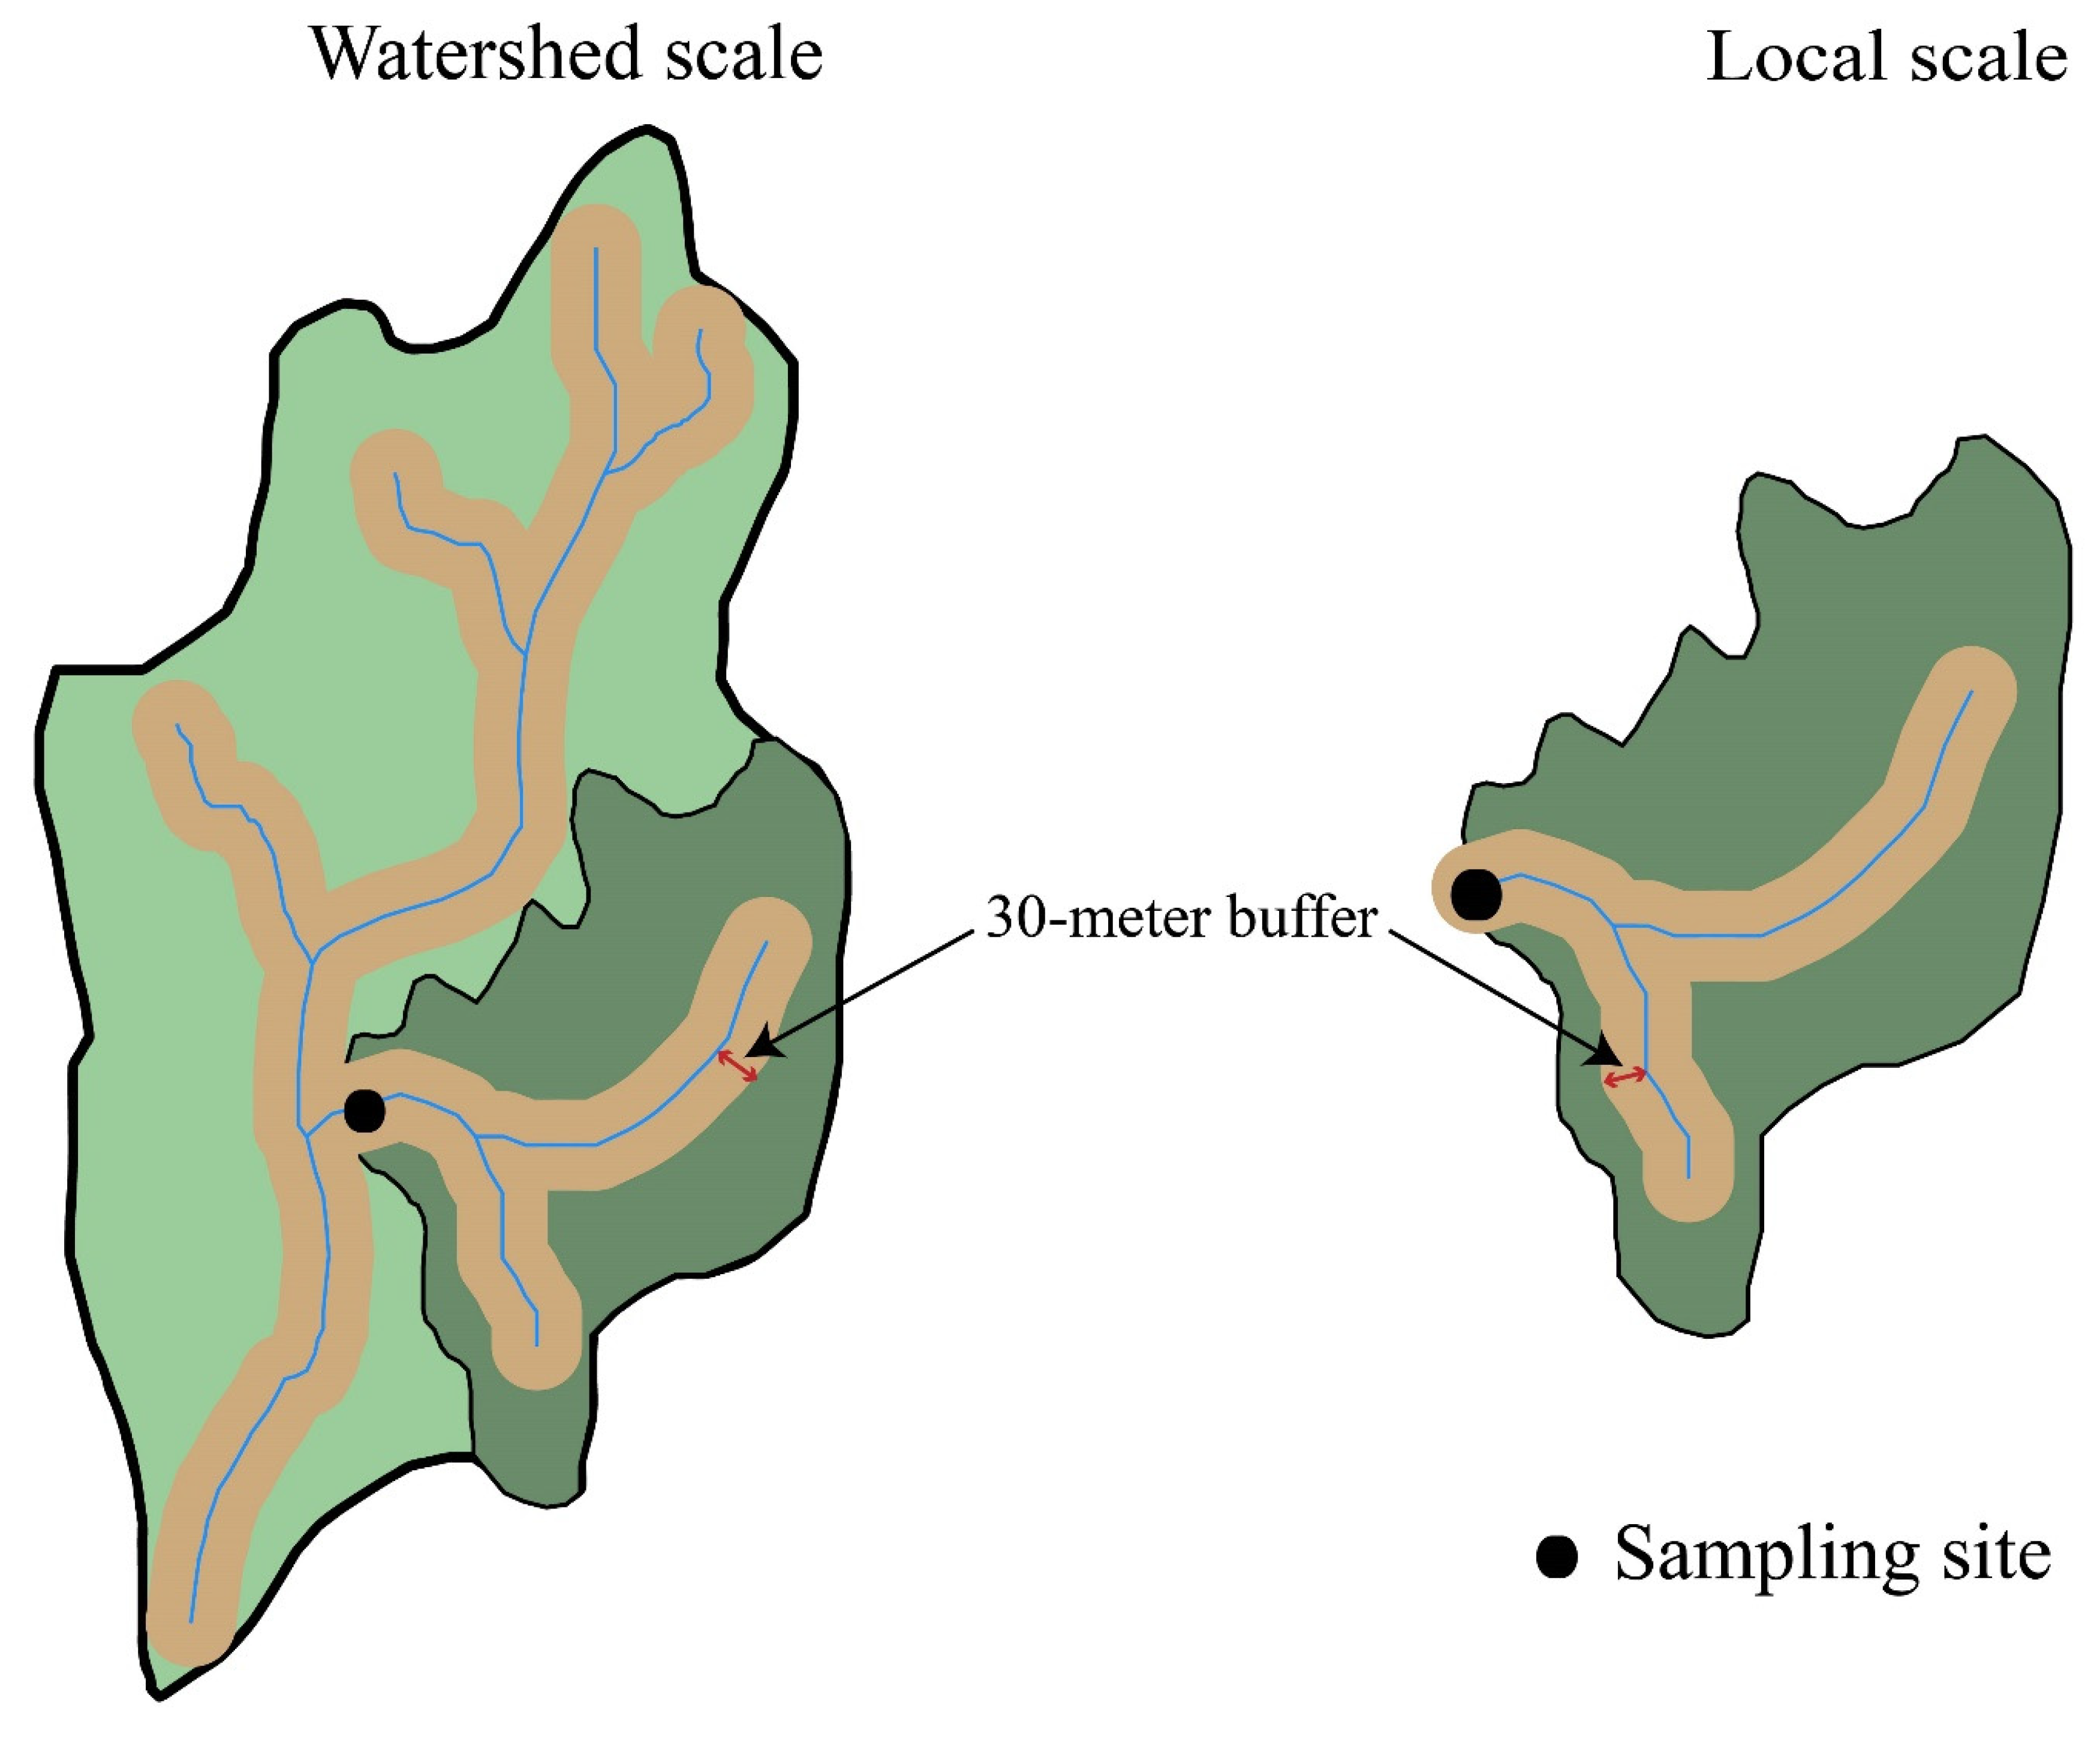
The land use variables for each site were provided by Dr. R Jan Stevenson of the Department of Integrative Biology at Michigan State University. Sixteen different spatial scales of wetlands and different land uses (agriculture, urban, and row crops) were calculated for each stream and river to evaluate wetland nutrient removal. These included: Wtrshd_30m_Buffer_Wetland, Wtrshd_30m_Buffer_Ag, Wtrshd_30m_Buffer_Urban, Wtrshd_30m_Buffer_Crops, Wtrshd_Wetland, Wtrshd_Ag, Wtrshd_Urban, Wtrshd_Crops, Local_30m_Buffer_Wetland, Local_30m_Buffer_Ag, Local_30m_Buffer_Urban, Local_30m_Buffer_Crops, Local_Wetland, Local_Ag, Local_Urban, Local_Crops. Here, local scale refers to the areas adjacent to streams and rivers and is used interchangeably with riparian (Figure A1). Local 30 m buffer refers to the area extending 30 m around a stream or river. Watershed scale, which is the area draining to a stream reach, consists of the local catchment plus all upstream catchments. Watershed 30 m buffer is a 30 m buffer around a stream or a river within a watershed. Row crops, urban, and agriculture are different types of land uses, with row crops falling within the category of agriculture. We include the percentage of row crops in our analysis because it is an important type of HDA for predicting wetland quality across the conterminous US [15].

2.3. Determining Levels of Human Disturbance Activities

Given that agriculture and urbanization are primary drivers of wetland degradation [15,40,41], we used the percentage of watershed disturbance (%WD), which is the sum of the percentage of watershed agriculture (%Ag) and watershed urban use (%Urban), to represent the HDA on wetlands. The level of HDA in a wetland was assigned as either “low” or “high” when %WD of the site fell below the 25th percentile or was larger than the 75th percentile of the frequency distribution of all sites. Otherwise, a site was recorded as moderately disturbed.

2.4. DI-TP Reconstruction

We used Microsoft Access 2016 to infer TP based on the diatom species composition. Weighted average models were developed to calculate inferred ln(TP) concentrations (hereafter referred to as DI-TP) for each sample, using relative abundances of diatom taxa and their TP optima in samples, following methods detailed by ter Braak and van Dame [42]. TP optima for diatom taxa were determined using the diatoms and the ln(TP) from the 2008–2009 NRSA datasets. The TP optimum for a diatom taxon is a weighted average of TP concentration weighted by the relative abundance of that taxon. The TP optima for taxa were computed by calculating the product of the proportional relative abundances of a diatom taxon times the TP concentration in each stream/river, summing those products for all streams and rivers, and then dividing that sum of products by the sum of proportional relative abundances of that species. TP optima were calculated for all taxa having ≥5 observations in the streams and rivers in the USEPA’s 2008–2009 NRSA survey. The weighted average model for TP concentration in a stream/river was then computed by calculating the products of matched TP optima and proportional relative abundances of each taxon in the sample from that stream/river with known TP optima, summing those products for all taxa with known TP optima, and then dividing that sum of products by the sum of proportional relative abundances of all taxa with known TP optima in that sample. Bootstrapping was used for model validation because the same data were used to both develop and test the weighted average model [43]. The reconstructed TP was evaluated by relating DI-TP to measured TP in each site for each of the 9 ecoregions.

2.5. Effects of Spatial Scale and Levels of HDA in Wetlands on Removing DI-TP from Streams and Rivers

The boosted regression tree (BRT) algorithm was used to model the relationship between different spatial scales of wetlands (i.e., watershed, watershed 30 m buffer, local, and local 30 m buffer) and DI-TP concentrations in streams and rivers, because BRT can fit complex nonlinear relationships and automatically handle the interaction effect between predictor variables [44]. The BRT models were run using script provided by Elith et al. and the “gbm” package (version 2.2.2) developed by Ridgeway using R (v4.3.2; R Core Team 2021) [44,45]. Independent predictor variables with a skewed distribution were log( x )-transformed to better represent the population behind them. Besides evaluating the effects of different spatial scales of wetlands, we also included the effects of urban, agriculture, and row crop land uses on modeling DI-TP concentrations, because diatom metrics were found to be significantly related to urban [46] and agricultural land uses [47].
Similarly, DI-TP concentrations and the aforementioned LULC variables were used as the left and right hand of the function ( D I T P ~ f ( W t r s h d _ 30 m _ B u f f e r _ W e t l a n d + W t r s h d _ 30 m _ B u f f e r _ A g + + L o c a l _ C r o p s ) ) to evaluate the level of HDA in wetlands on decreasing DI-TP concentration in streams and rivers. The BRT results were visualized using partial dependence plots (PDPs), which showed the relative influence of each predictor on the fitted function. The performance of wetlands at decreasing DI-TP concentration was determined by comparing their relative influence (%) under different levels of HDA.

2.6. Interactions Between Spatial Scale and Level of Human Disturbance

Although the BRT algorithm can handle the interaction effect among a suite of predictor variables, a complex interplay could exist between spatial scale and HDA [48]. Therefore, a 17 × 3 factorial ANOVA with 17 factors (i.e., 16 LULC variables and %WD) was designed to analyze the interaction between spatial scale and level of HDA on wetlands. We used the same method on grouping %WD described in Section 2.3 to classify levels (low, medium, and high) of 16 LULC variables. Homogeneity of variances, normality, and independence of variables were checked prior to the analysis. For the purpose of better visualization, we also used the “interaction 2 wt” in the HH package (version 3.1–53) using R to generate a visual analysis of the interaction [49].

2.7. Data Analysis

We used Microsoft Access 2016 to select the data and classify sites. R software (version 4.3.2) was used to model the effects of spatial scale and level of HDA in wetlands on removing DI-TP from streams and rivers and to analyze the interaction between spatial scale and level of HDA. A p-value of 0.05 was used for all statistical significance tests to check how likely it was that the observed differences could occur purely by chance due to random sampling. The interpolation method in ArcGIS 10.8 was used to generate the distribution of a variety of LULC variables across the conterminous US.

3. Results

3.1. Distribution of Wetlands and Other Types of LULC from 2008 to 2009

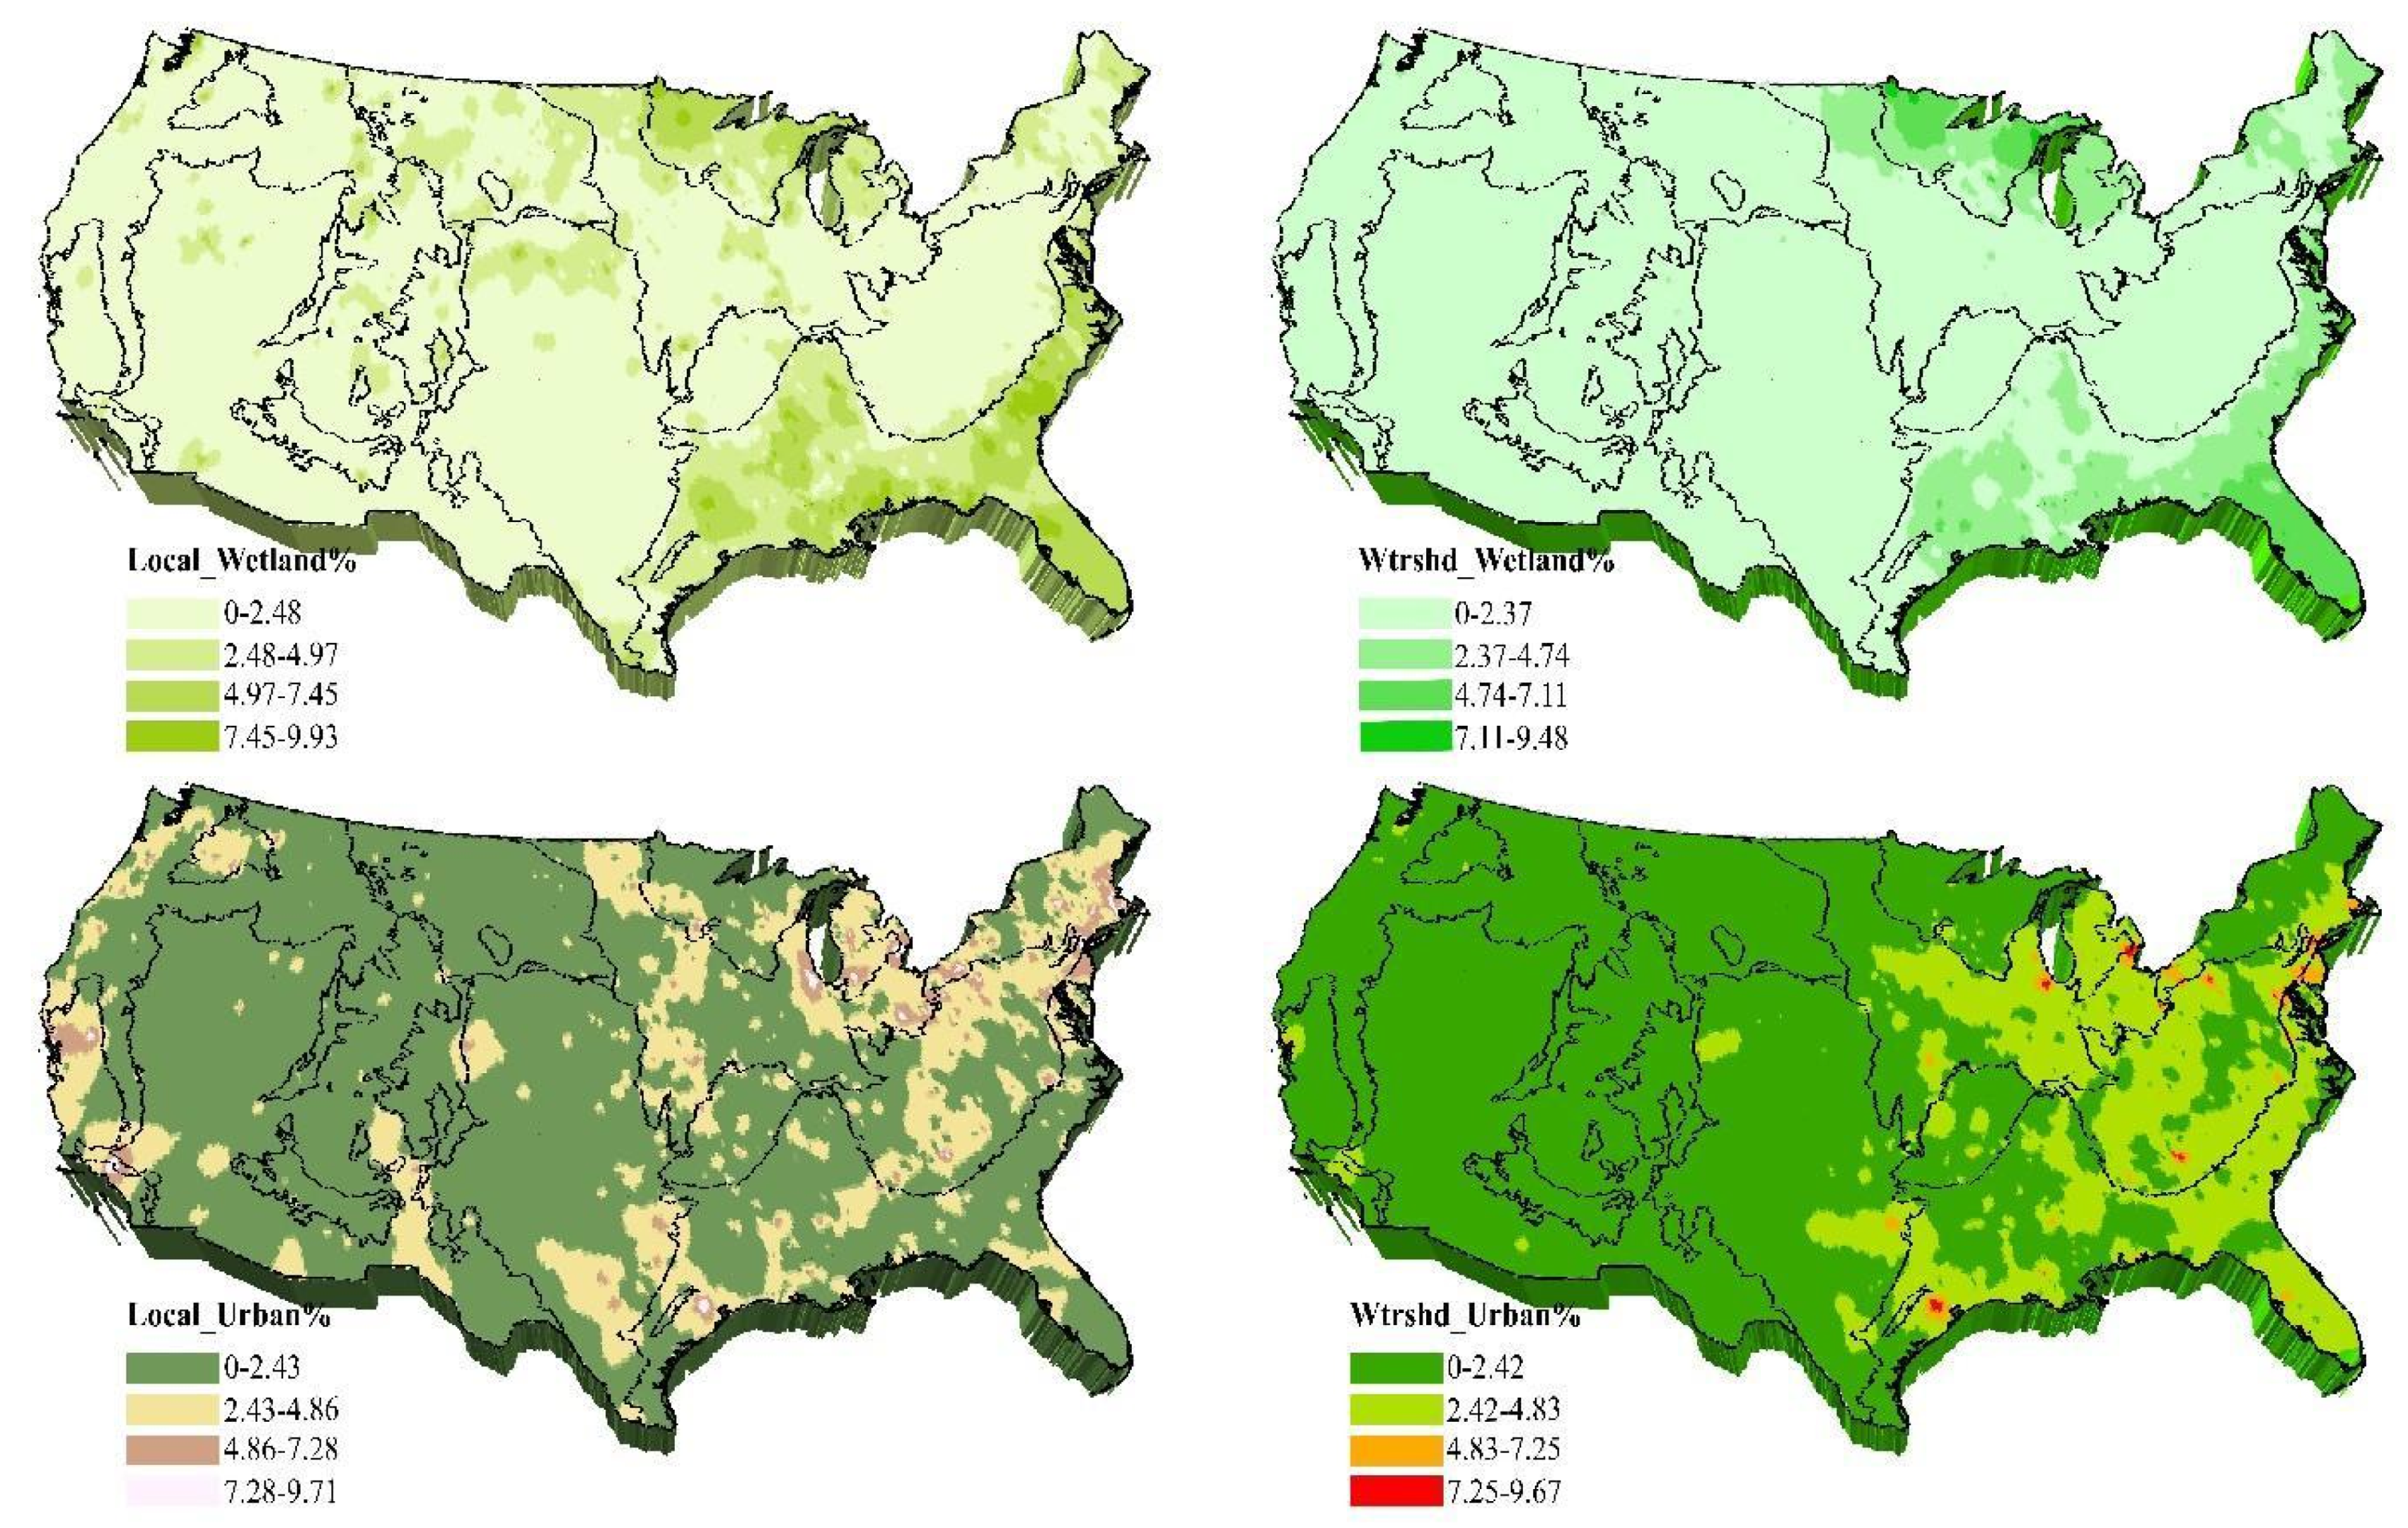
Local- (>2.48%) and watershed-scale wetlands (>2.37%) were mainly distributed in the UMW and CPL ecoregions (Figure 2, Table A1). Compared to watershed-scale wetlands, there were more local-scale wetlands (>2.48%) in the NPL and northern SPL ecoregions. In the WMTNS region, percentages of wetlands were <2.48% for almost all streams and rivers.
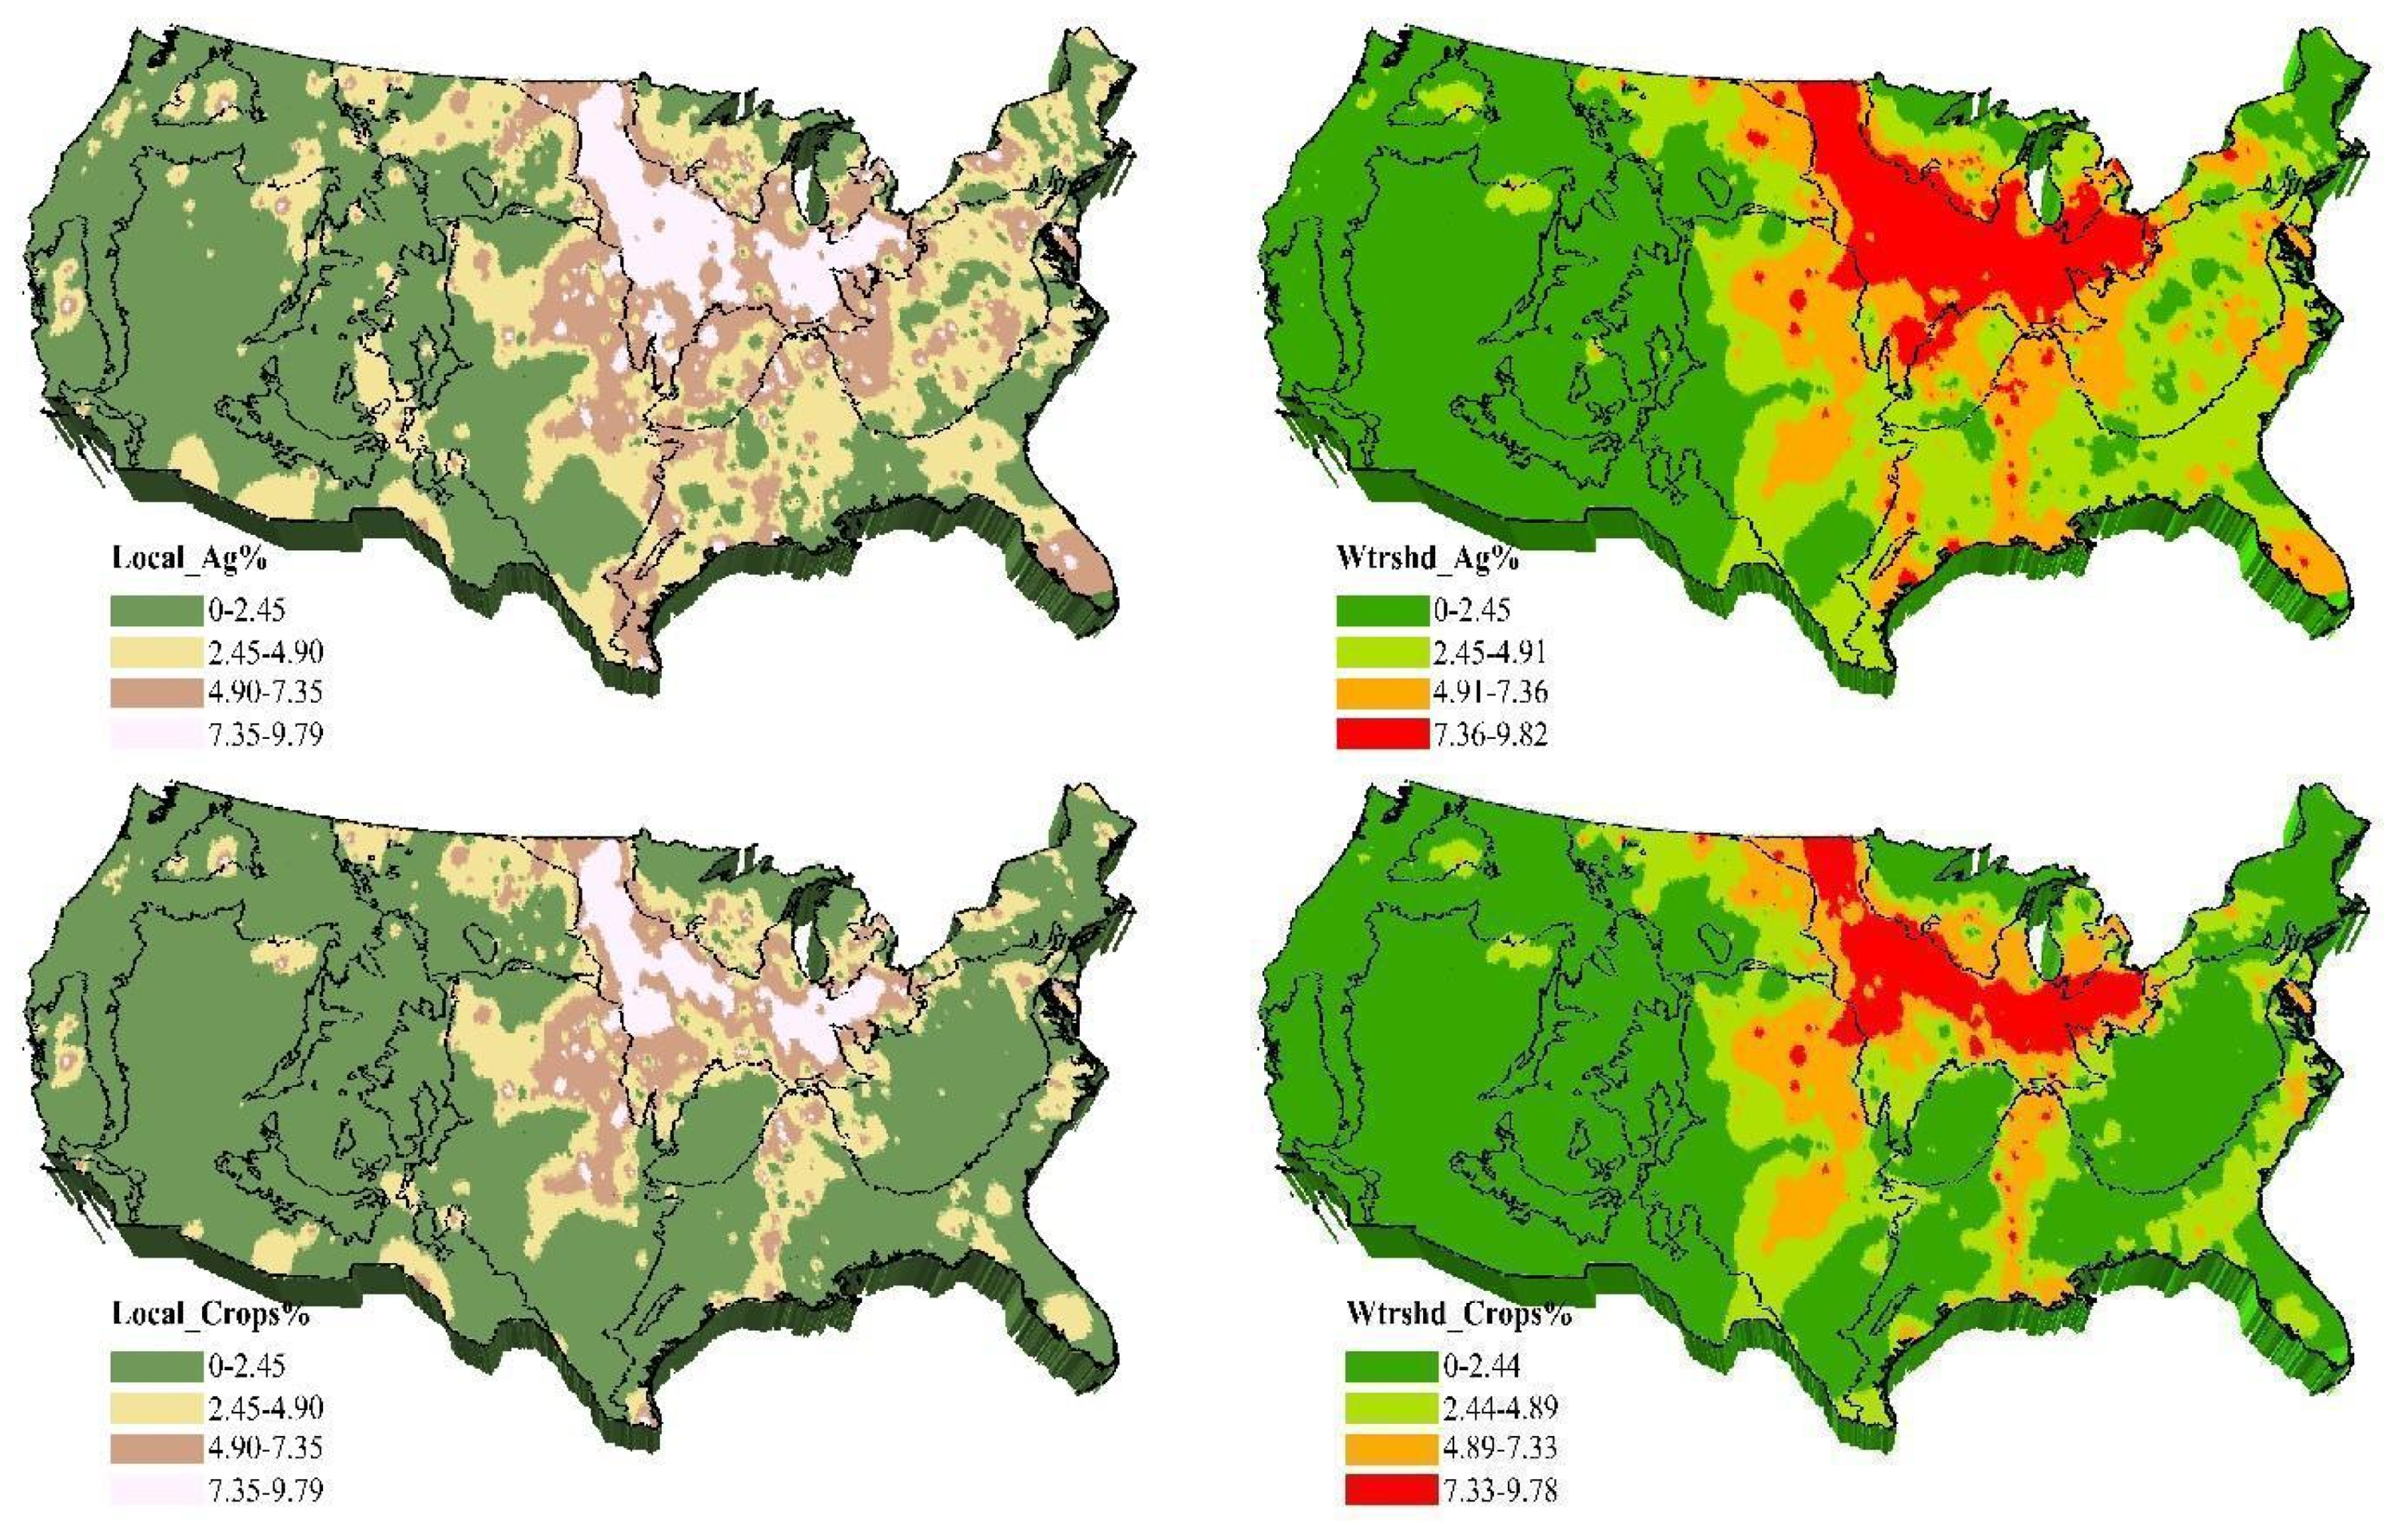
Both local-scale (>2.43%) and watershed-scale urban land use (>2.42%) had a higher distribution in the TPL, SAP, and CPL ecoregions. The distribution of watershed-scale urban land use was sparser in four ecoregions (WMT, XER, SPL, and NPL) than that of local-scale urban land use. The distributions of agriculture and row crop land uses were very similar and mainly distributed in the PLNLOW region (Figure 2) and the area with cropland land use >7.33% was similar to the Corn Belt region, which is historically rich in wetlands [50].

3.2. Reconstructed DI-TP

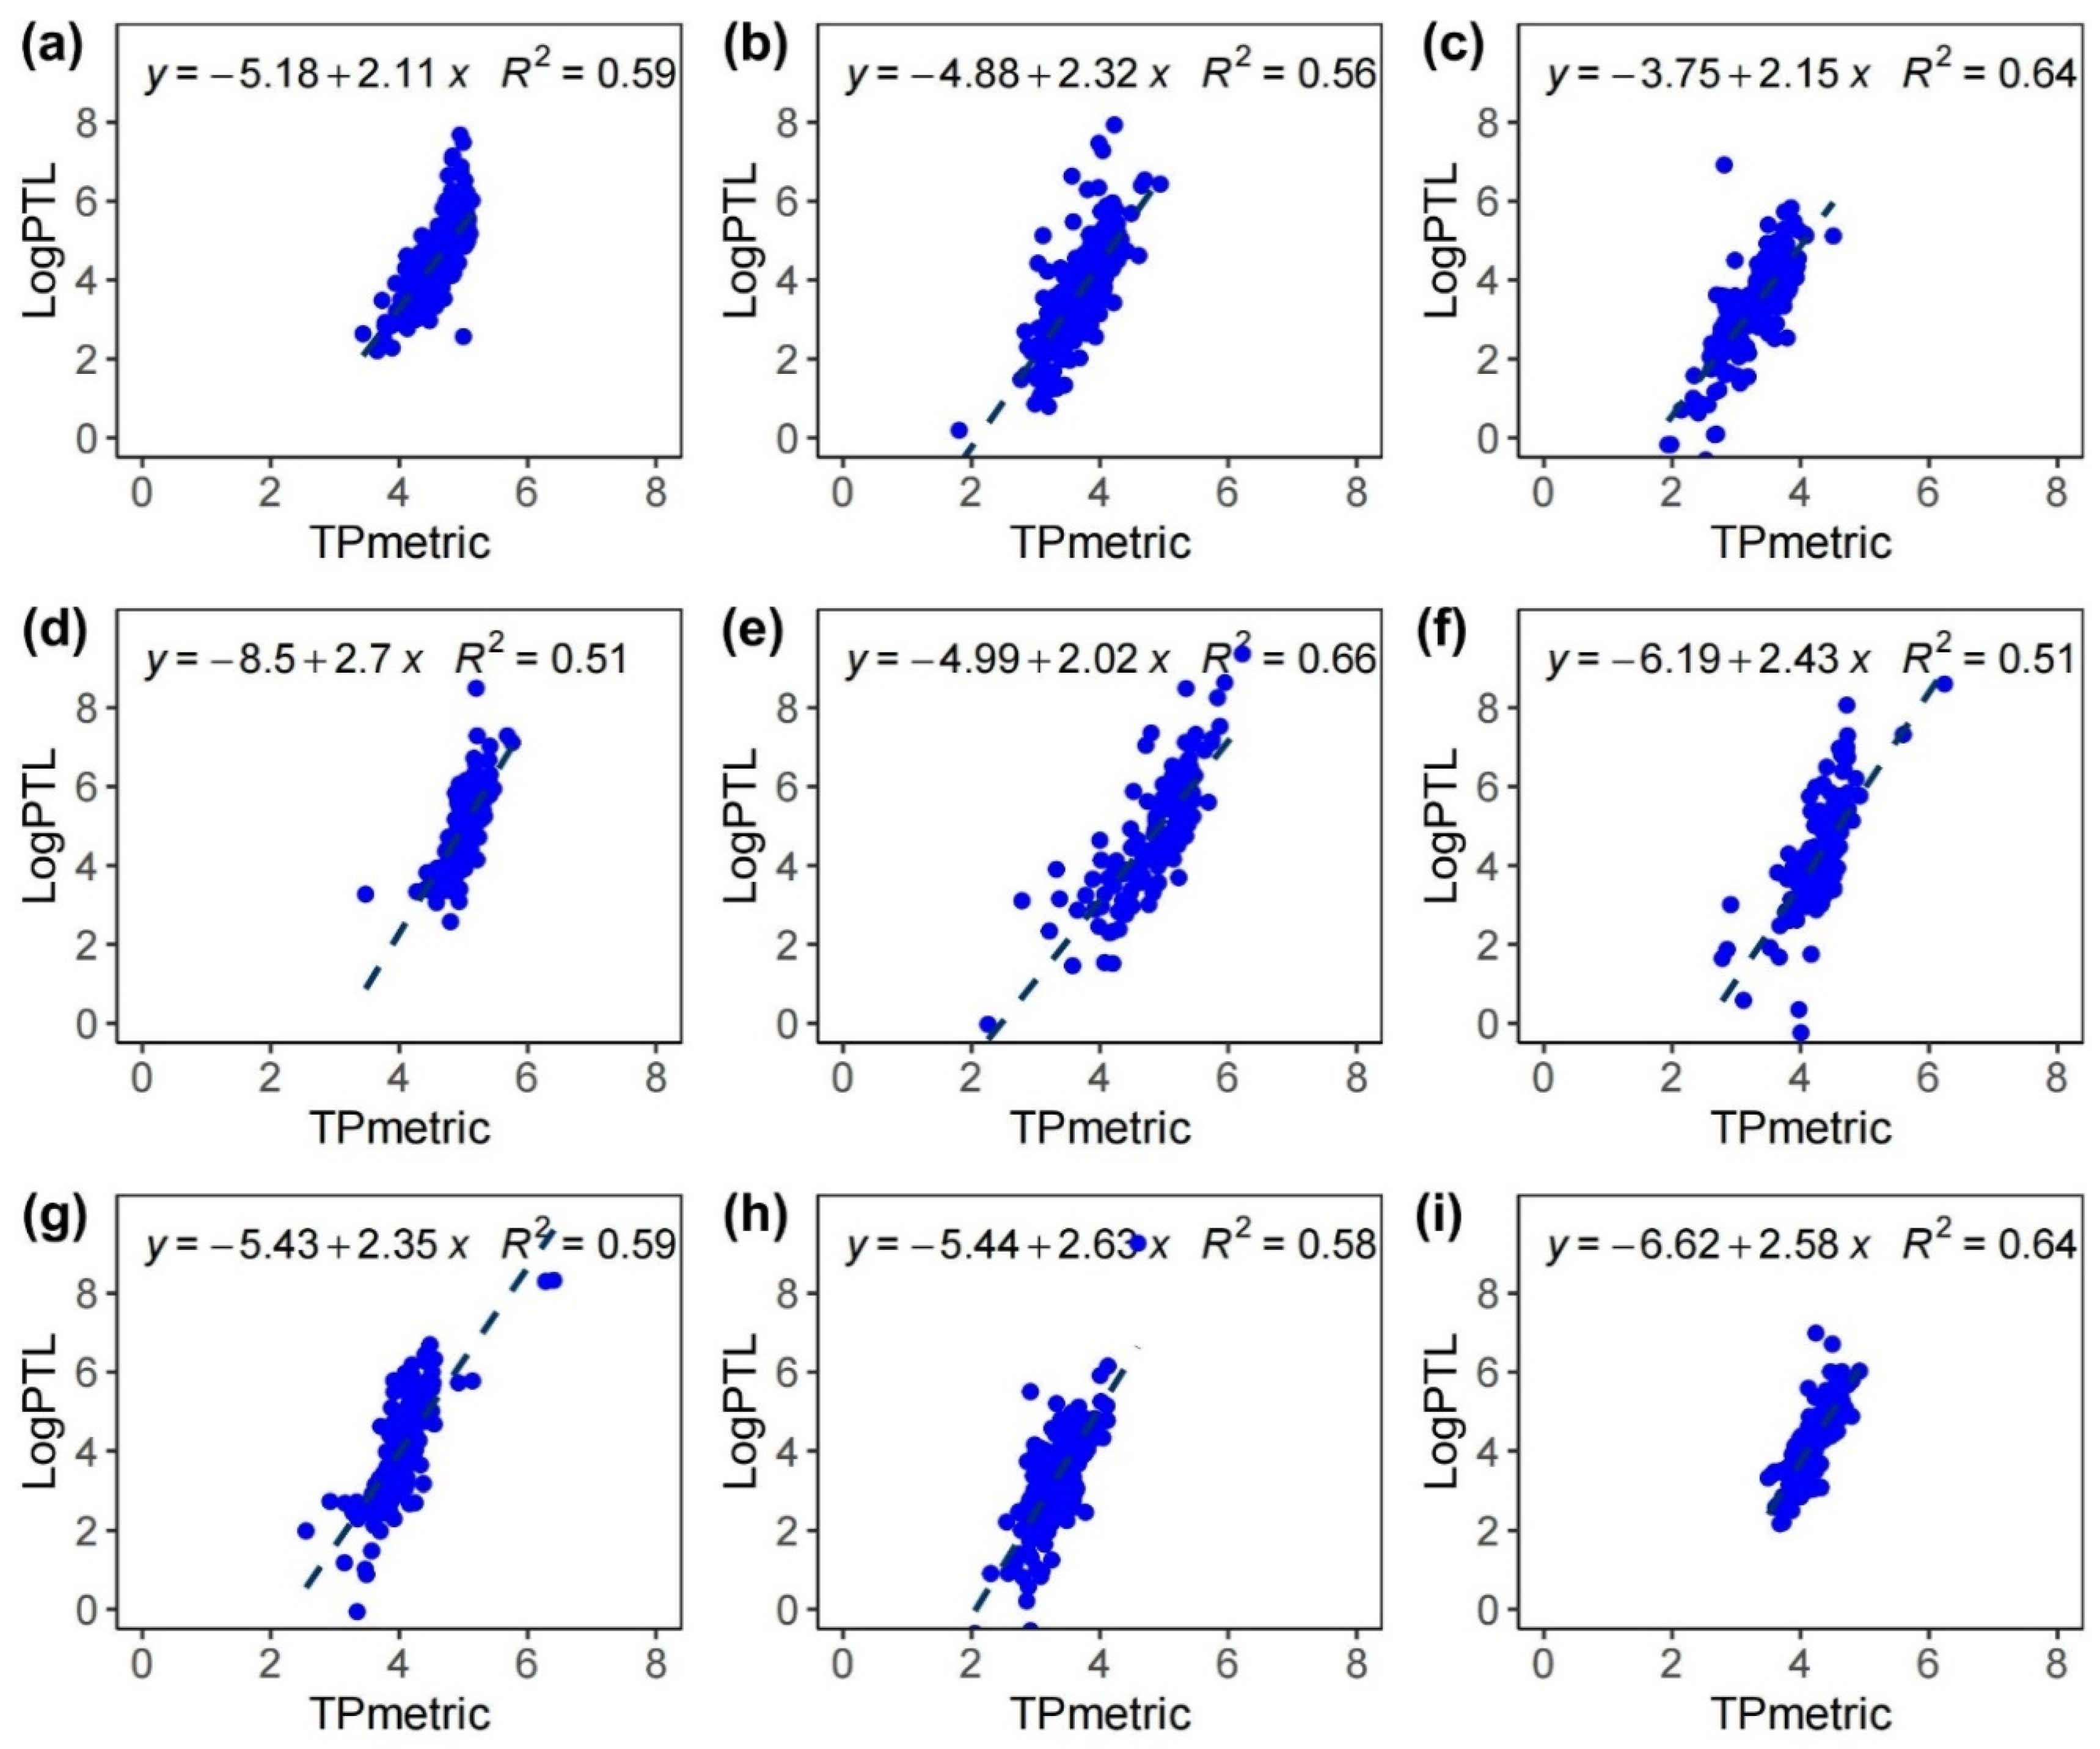
The root mean square error of prediction, an error estimate provided by bootstrapping, was 0.224. DI-TP correlated well with measured TP in each ecoregion with the coefficient of determination ranging from 51% in TPL and NPL to 66% in the SPL ecoregion (Figure 3). DI-TP concentrations were high in the PLNLOW region (specifically SPL and TPL) but low in the WMTNS and EHIGH regions (in particular, WMT, SAP, and NAP), which is similar to the nutrient status in lakes [51]. The strong relationship between DI-TP and measured TP showed the effectiveness of reconstructed TP and laid a solid foundation for evaluating the effects of wetlands on removing P from streams and rivers.

3.3. Effects of the Spatial Scale of Wetlands on Removing DI-TP

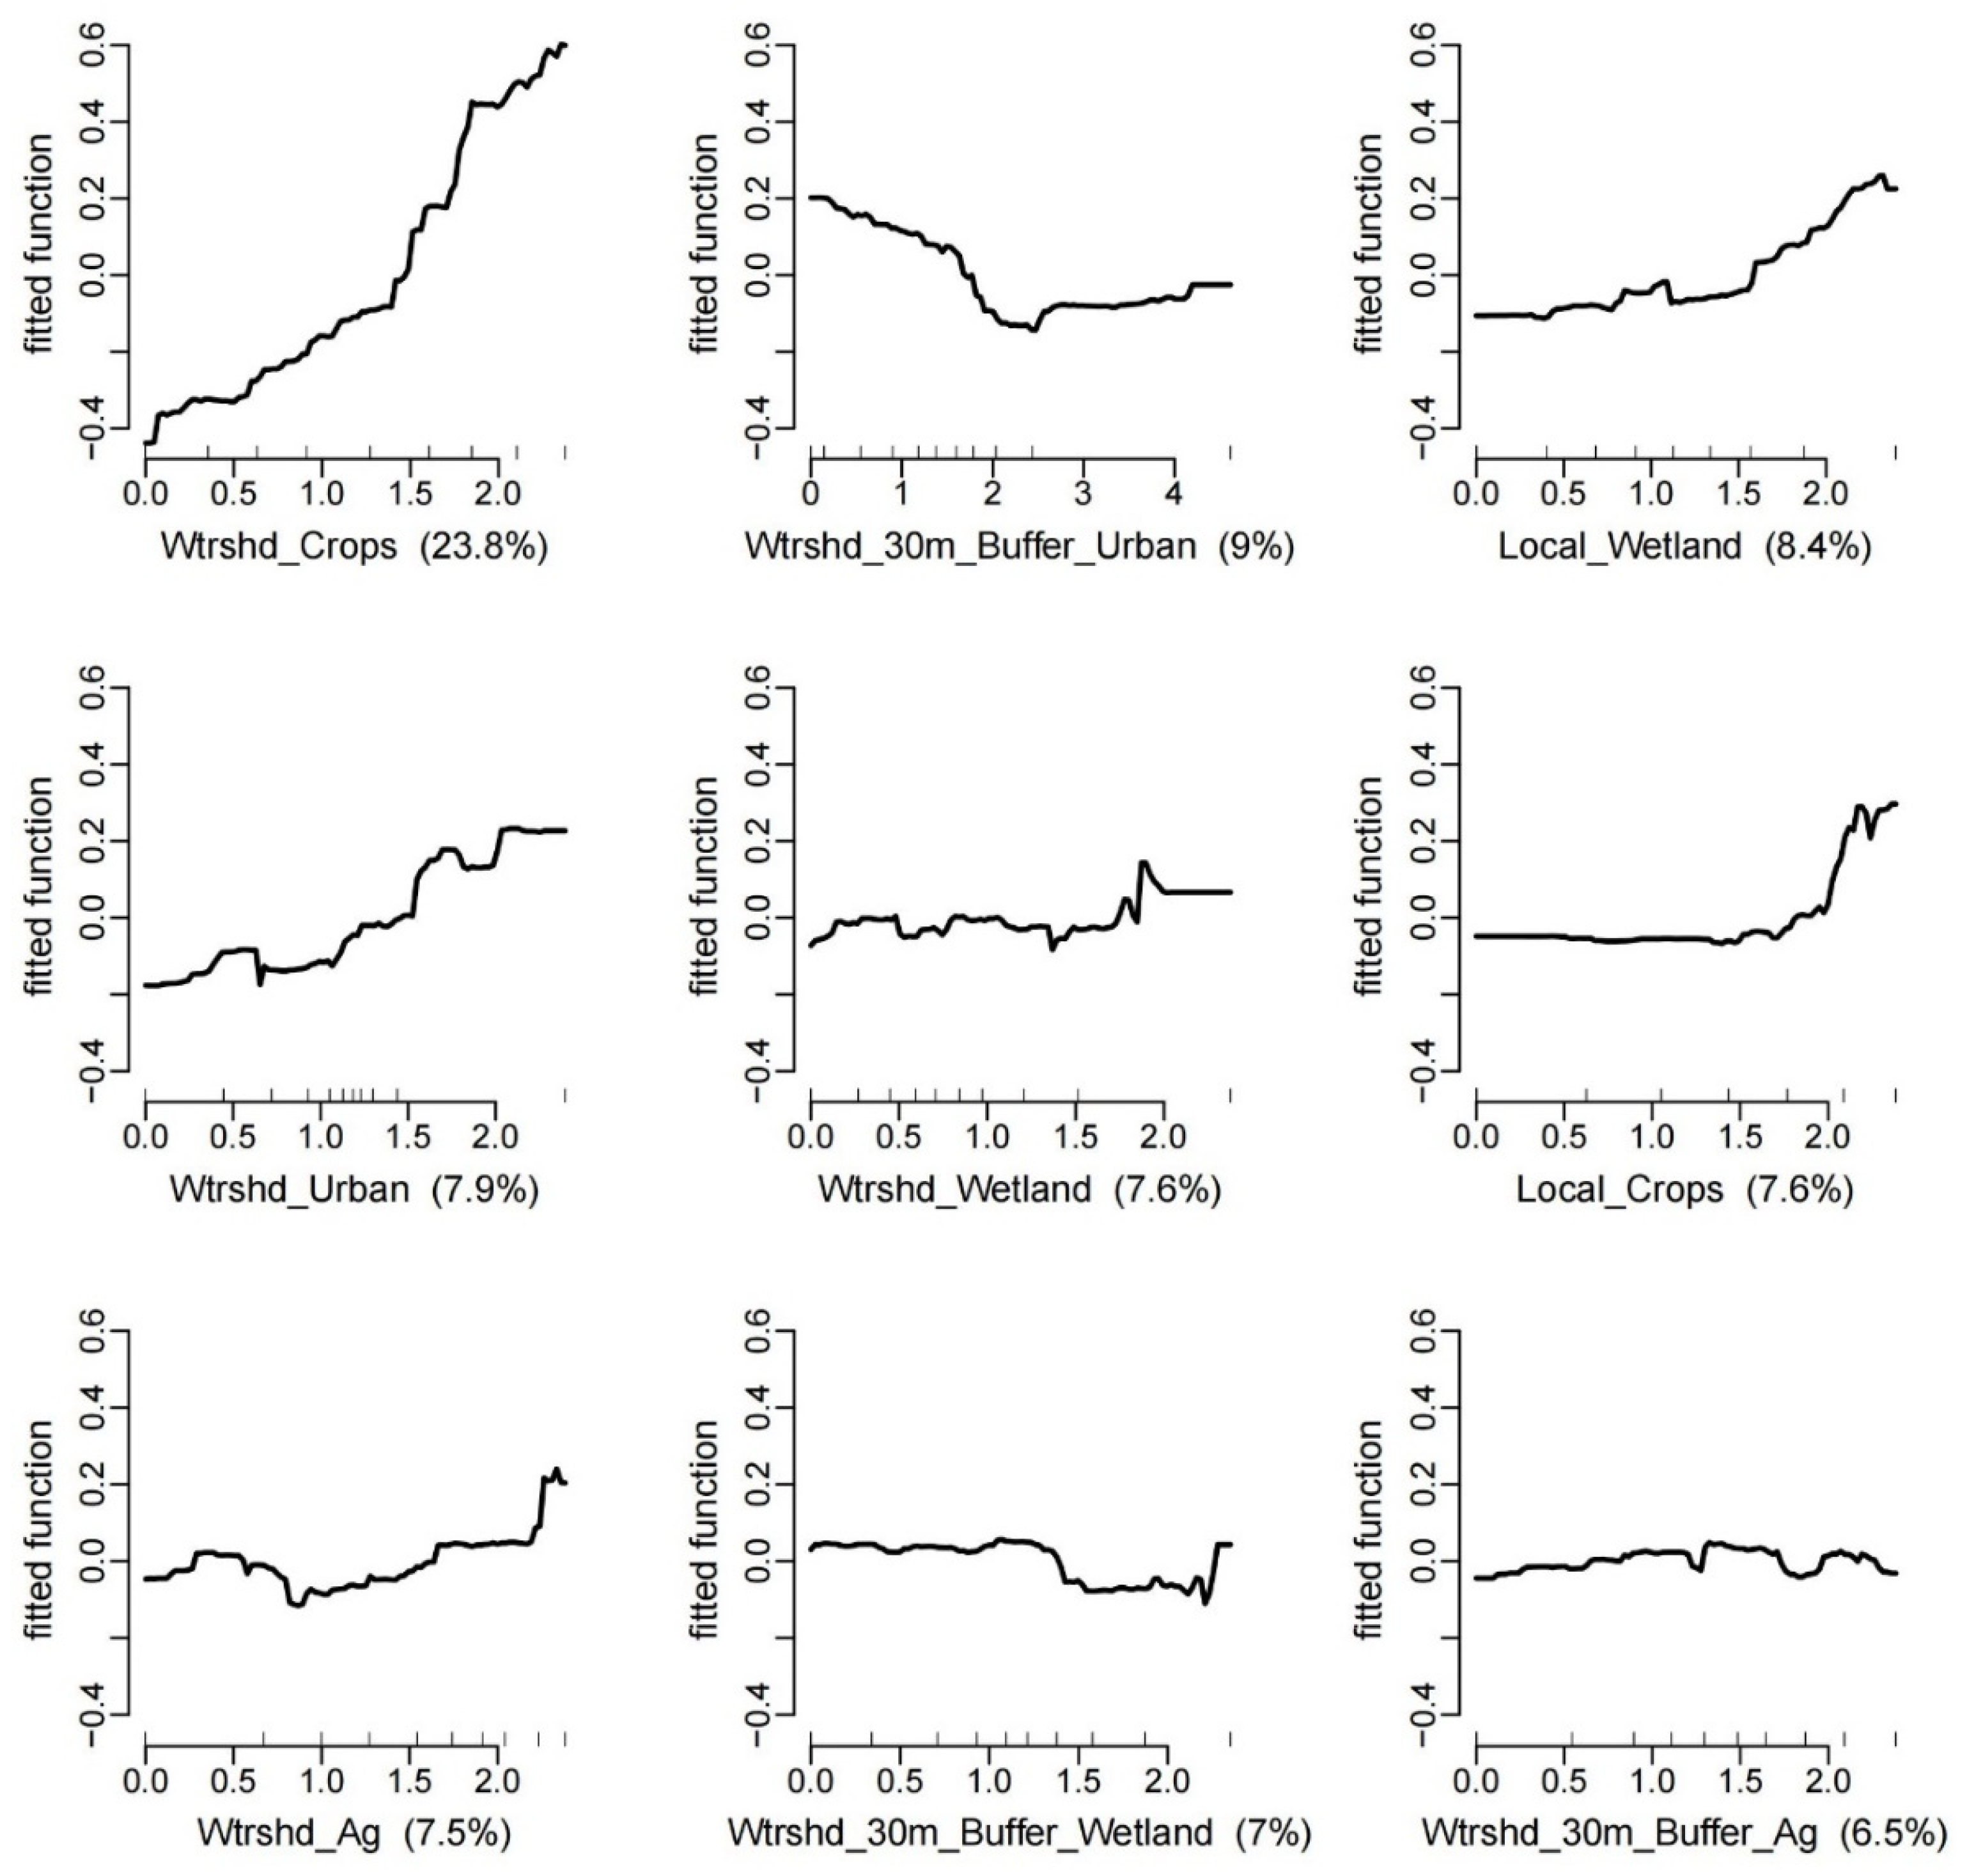
The PDPs showed a higher relative influence value for Local_Wetland on the DI-TP concentration (8.4%) than that of Wtrshd_Weltand (7.6%), and Wtrshd_30m_buffer_Wetland (7%) (Figure 4), which was unexpected. The top three LULC variables that explained the most variation in DI-TP concentration were Wtrshd_Crops (23.8%), Wtrshd_30m_Buffer_Urban (9%), and Local_Wetland (8.4%), confirming that agriculture and urban land use are important contributors to water quality degradation in streams and rivers.

3.4. Effects of Wetlands on Removing DI-TP Under Different Levels of HDA

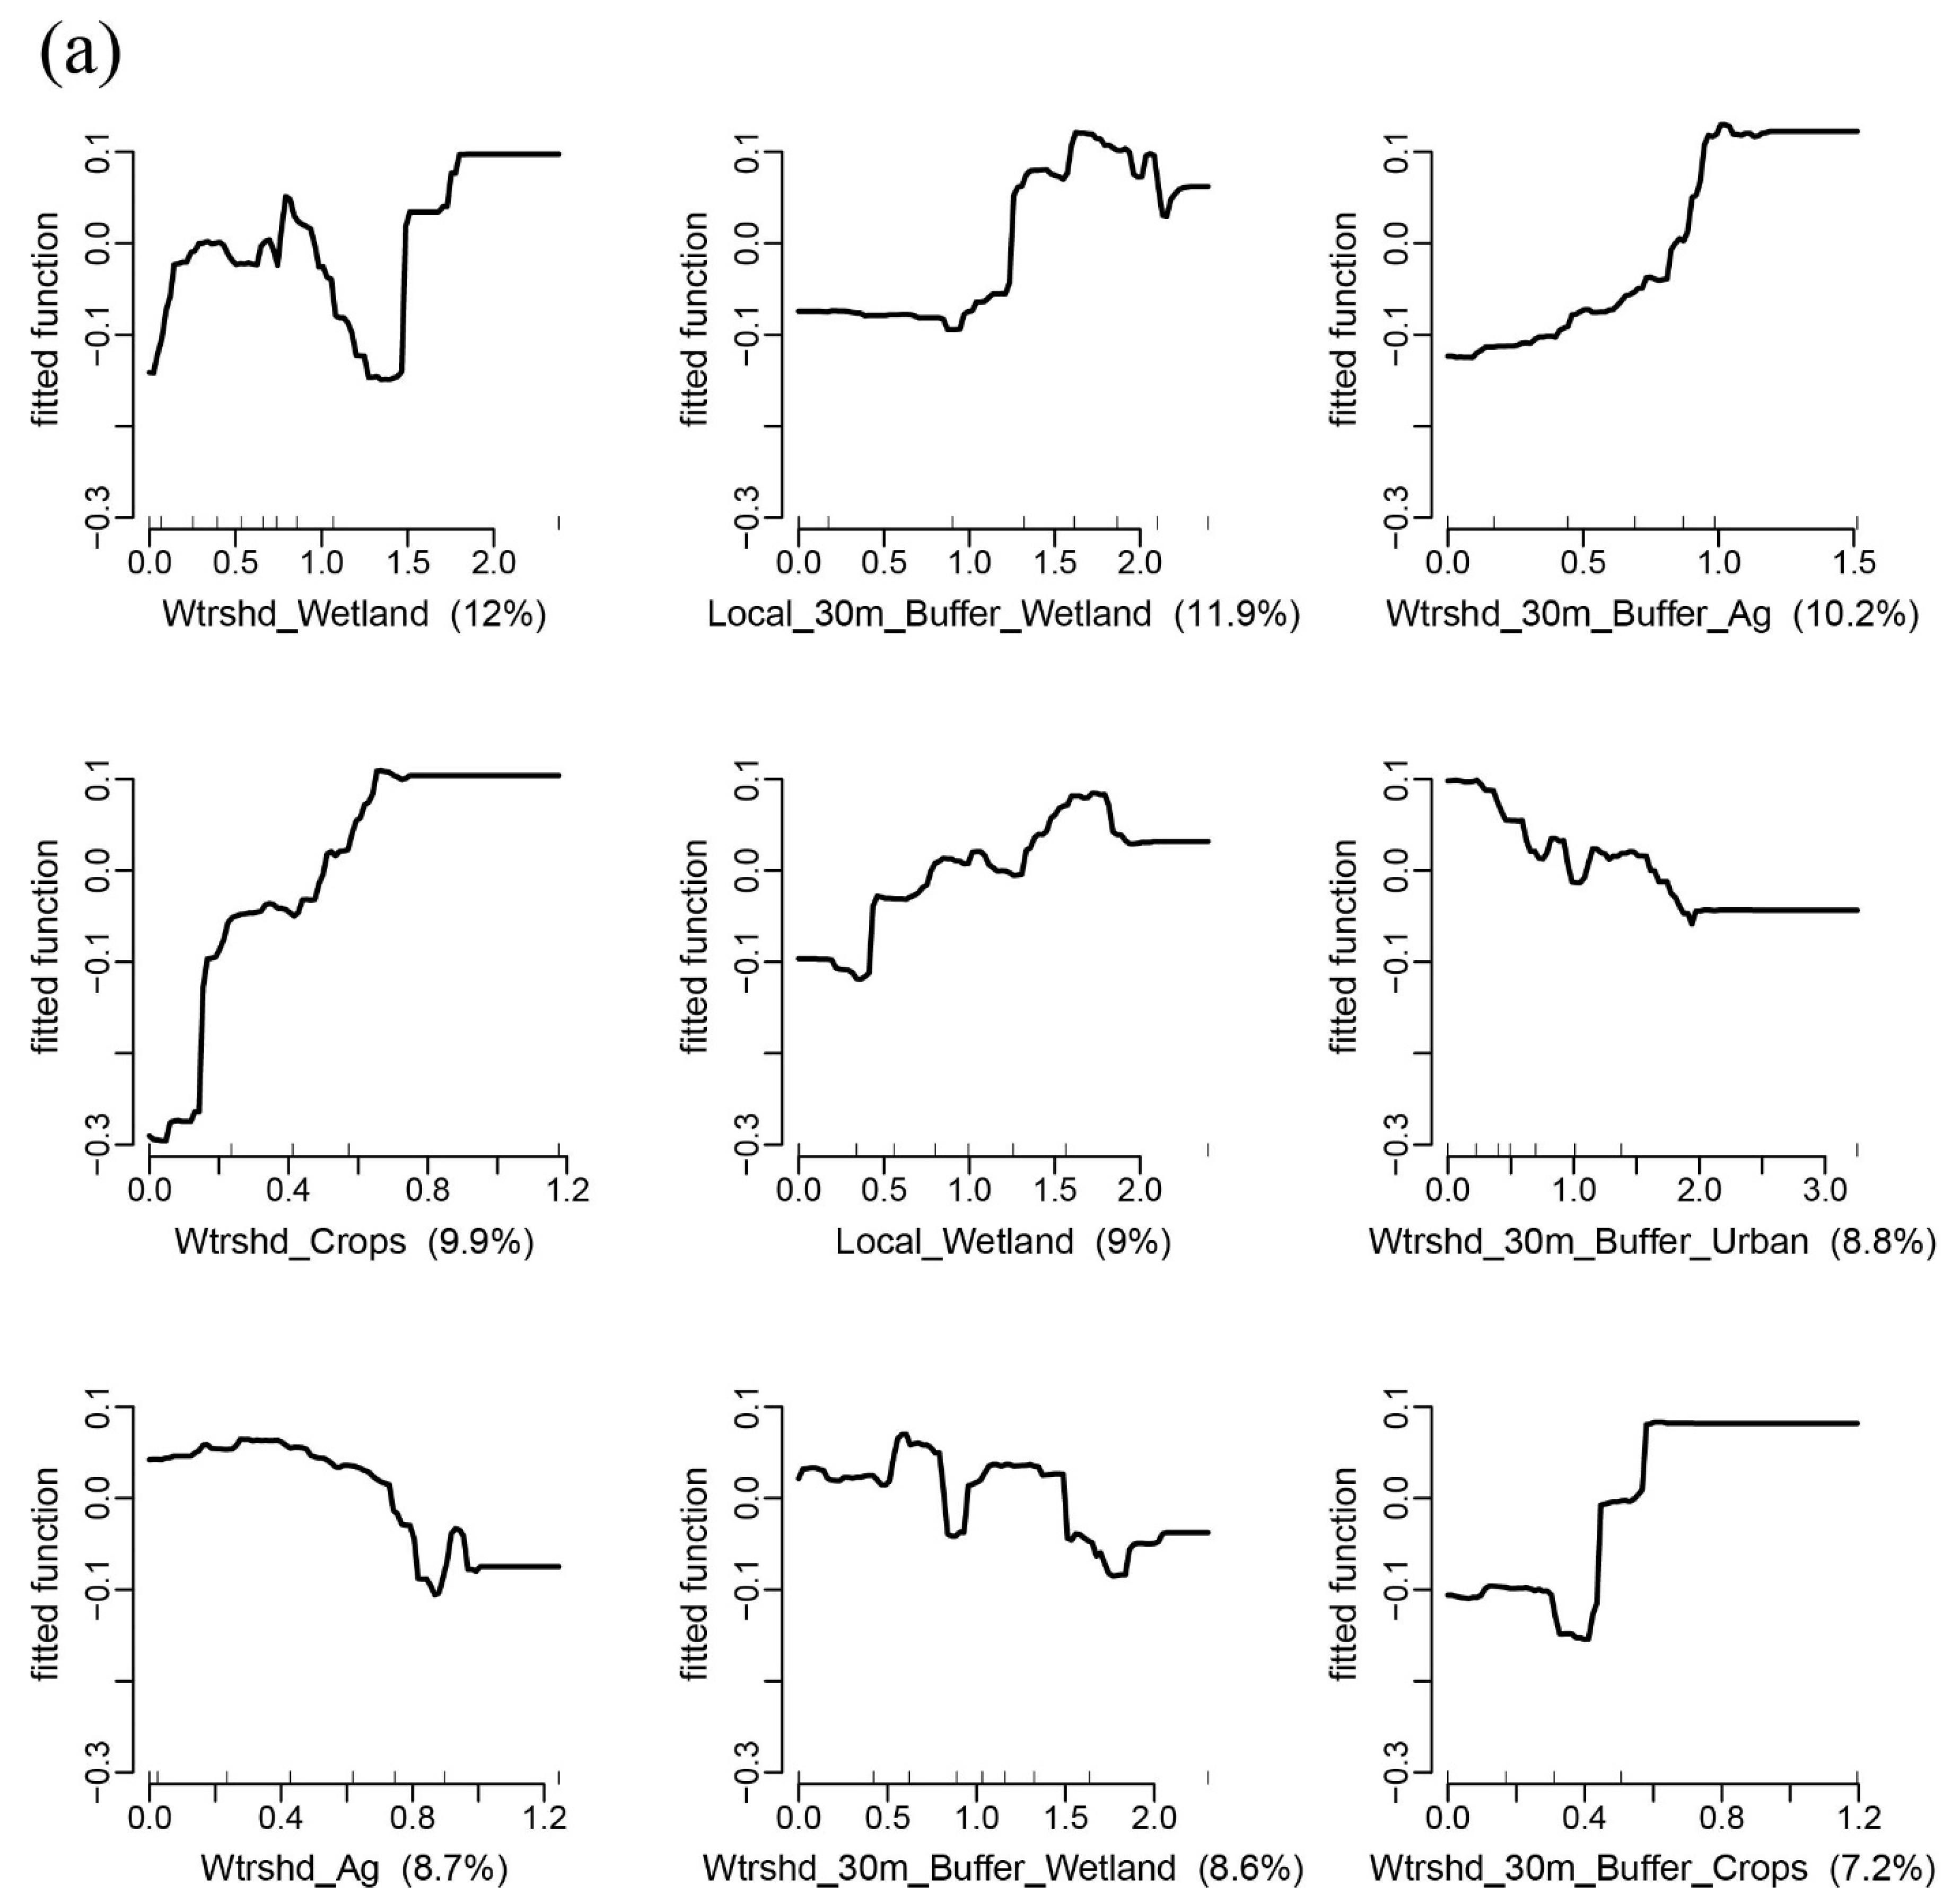
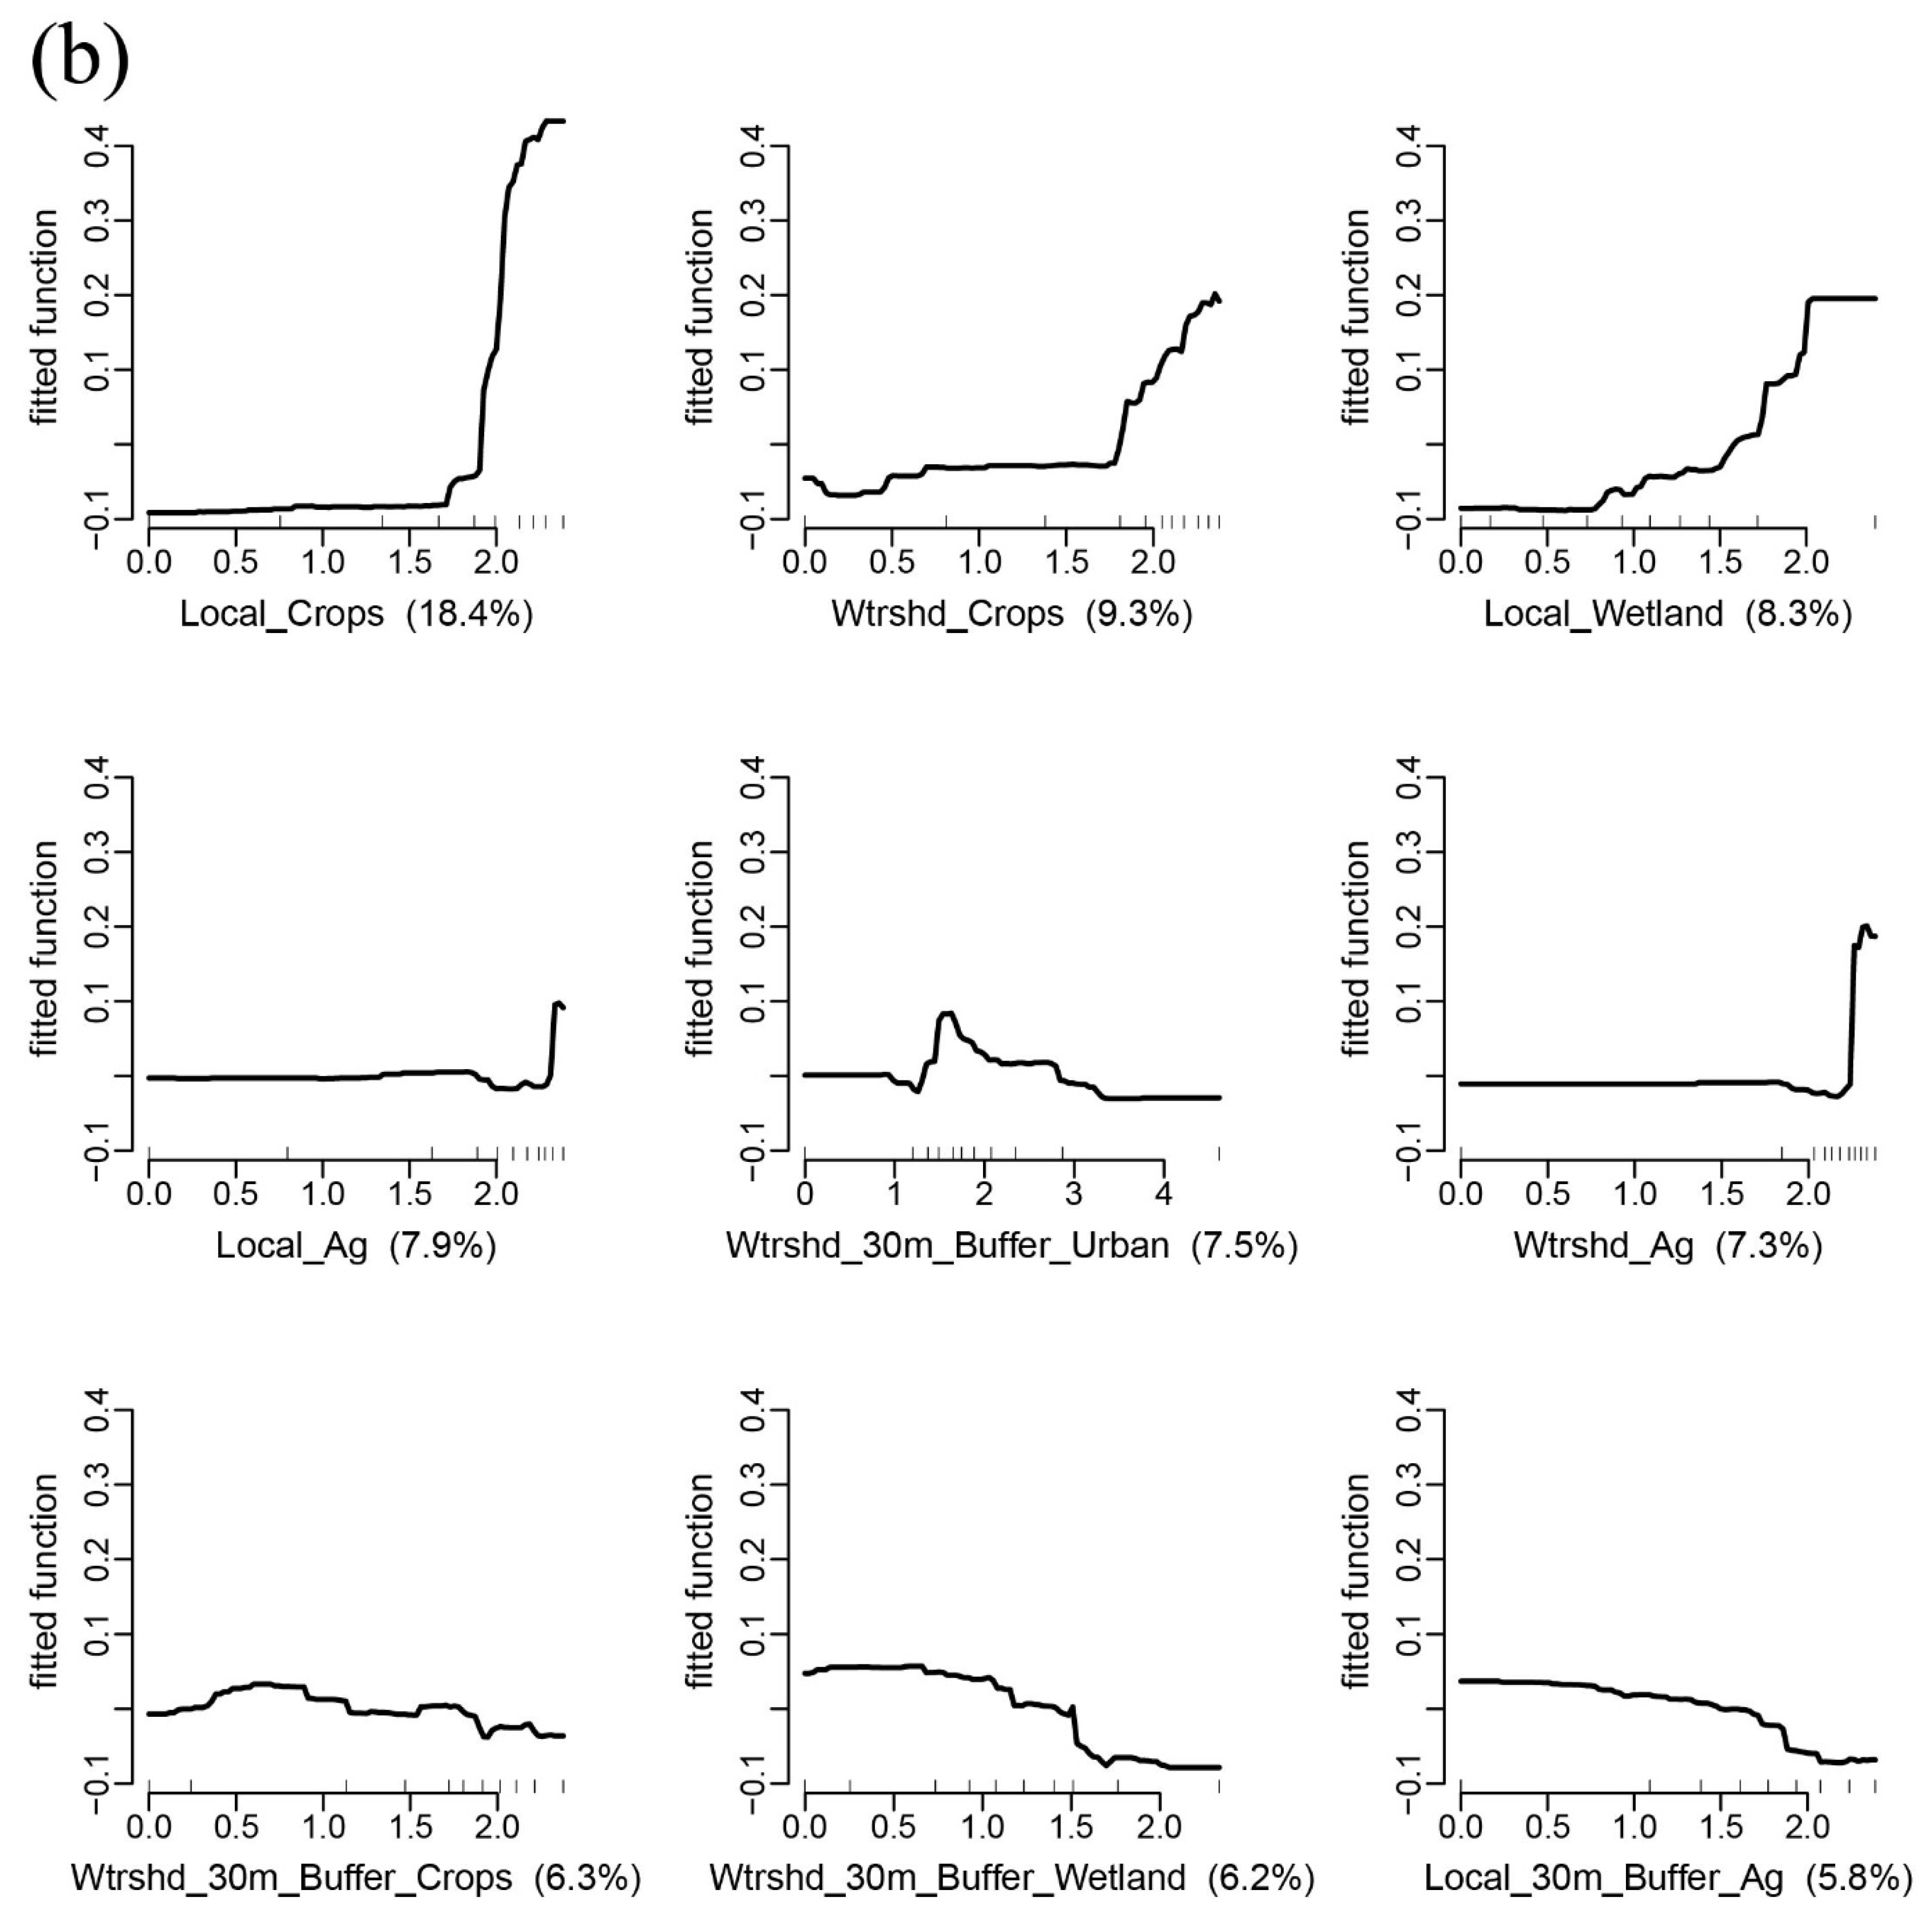
According to %WD, 468 out of 1871 sites were classified as low-disturbed sites, and high- and medium-disturbed sites were 468 and 934, respectively (Figure 1). The sampling sites in the WMTNS region were less affected by human disturbance, while the high-disturbed sites were mainly distributed in the mid to east ecoregions, in particular, the TPL ecoregion. From the PDPs, under high levels of HDA, Local_Crops was the top variable explaining the variation of DI-TP concentration (18.4%). This was followed by Wtrshd_Crops (9.3%) and Local_Weltand (8.3%) (Figure 5b). However, Wtrshd_Weltand (12%) and Local_30m_Buffer_wetland (11.9%) were the top two variables explaining the variation in DI-TP concentrations under low levels of HDA (Figure 5a). In other words, wetlands were more effective at explaining the variability in DI-TP concentration under low levels of HDA.

3.5. Interactions Between Spatial Scale and Level of HDA

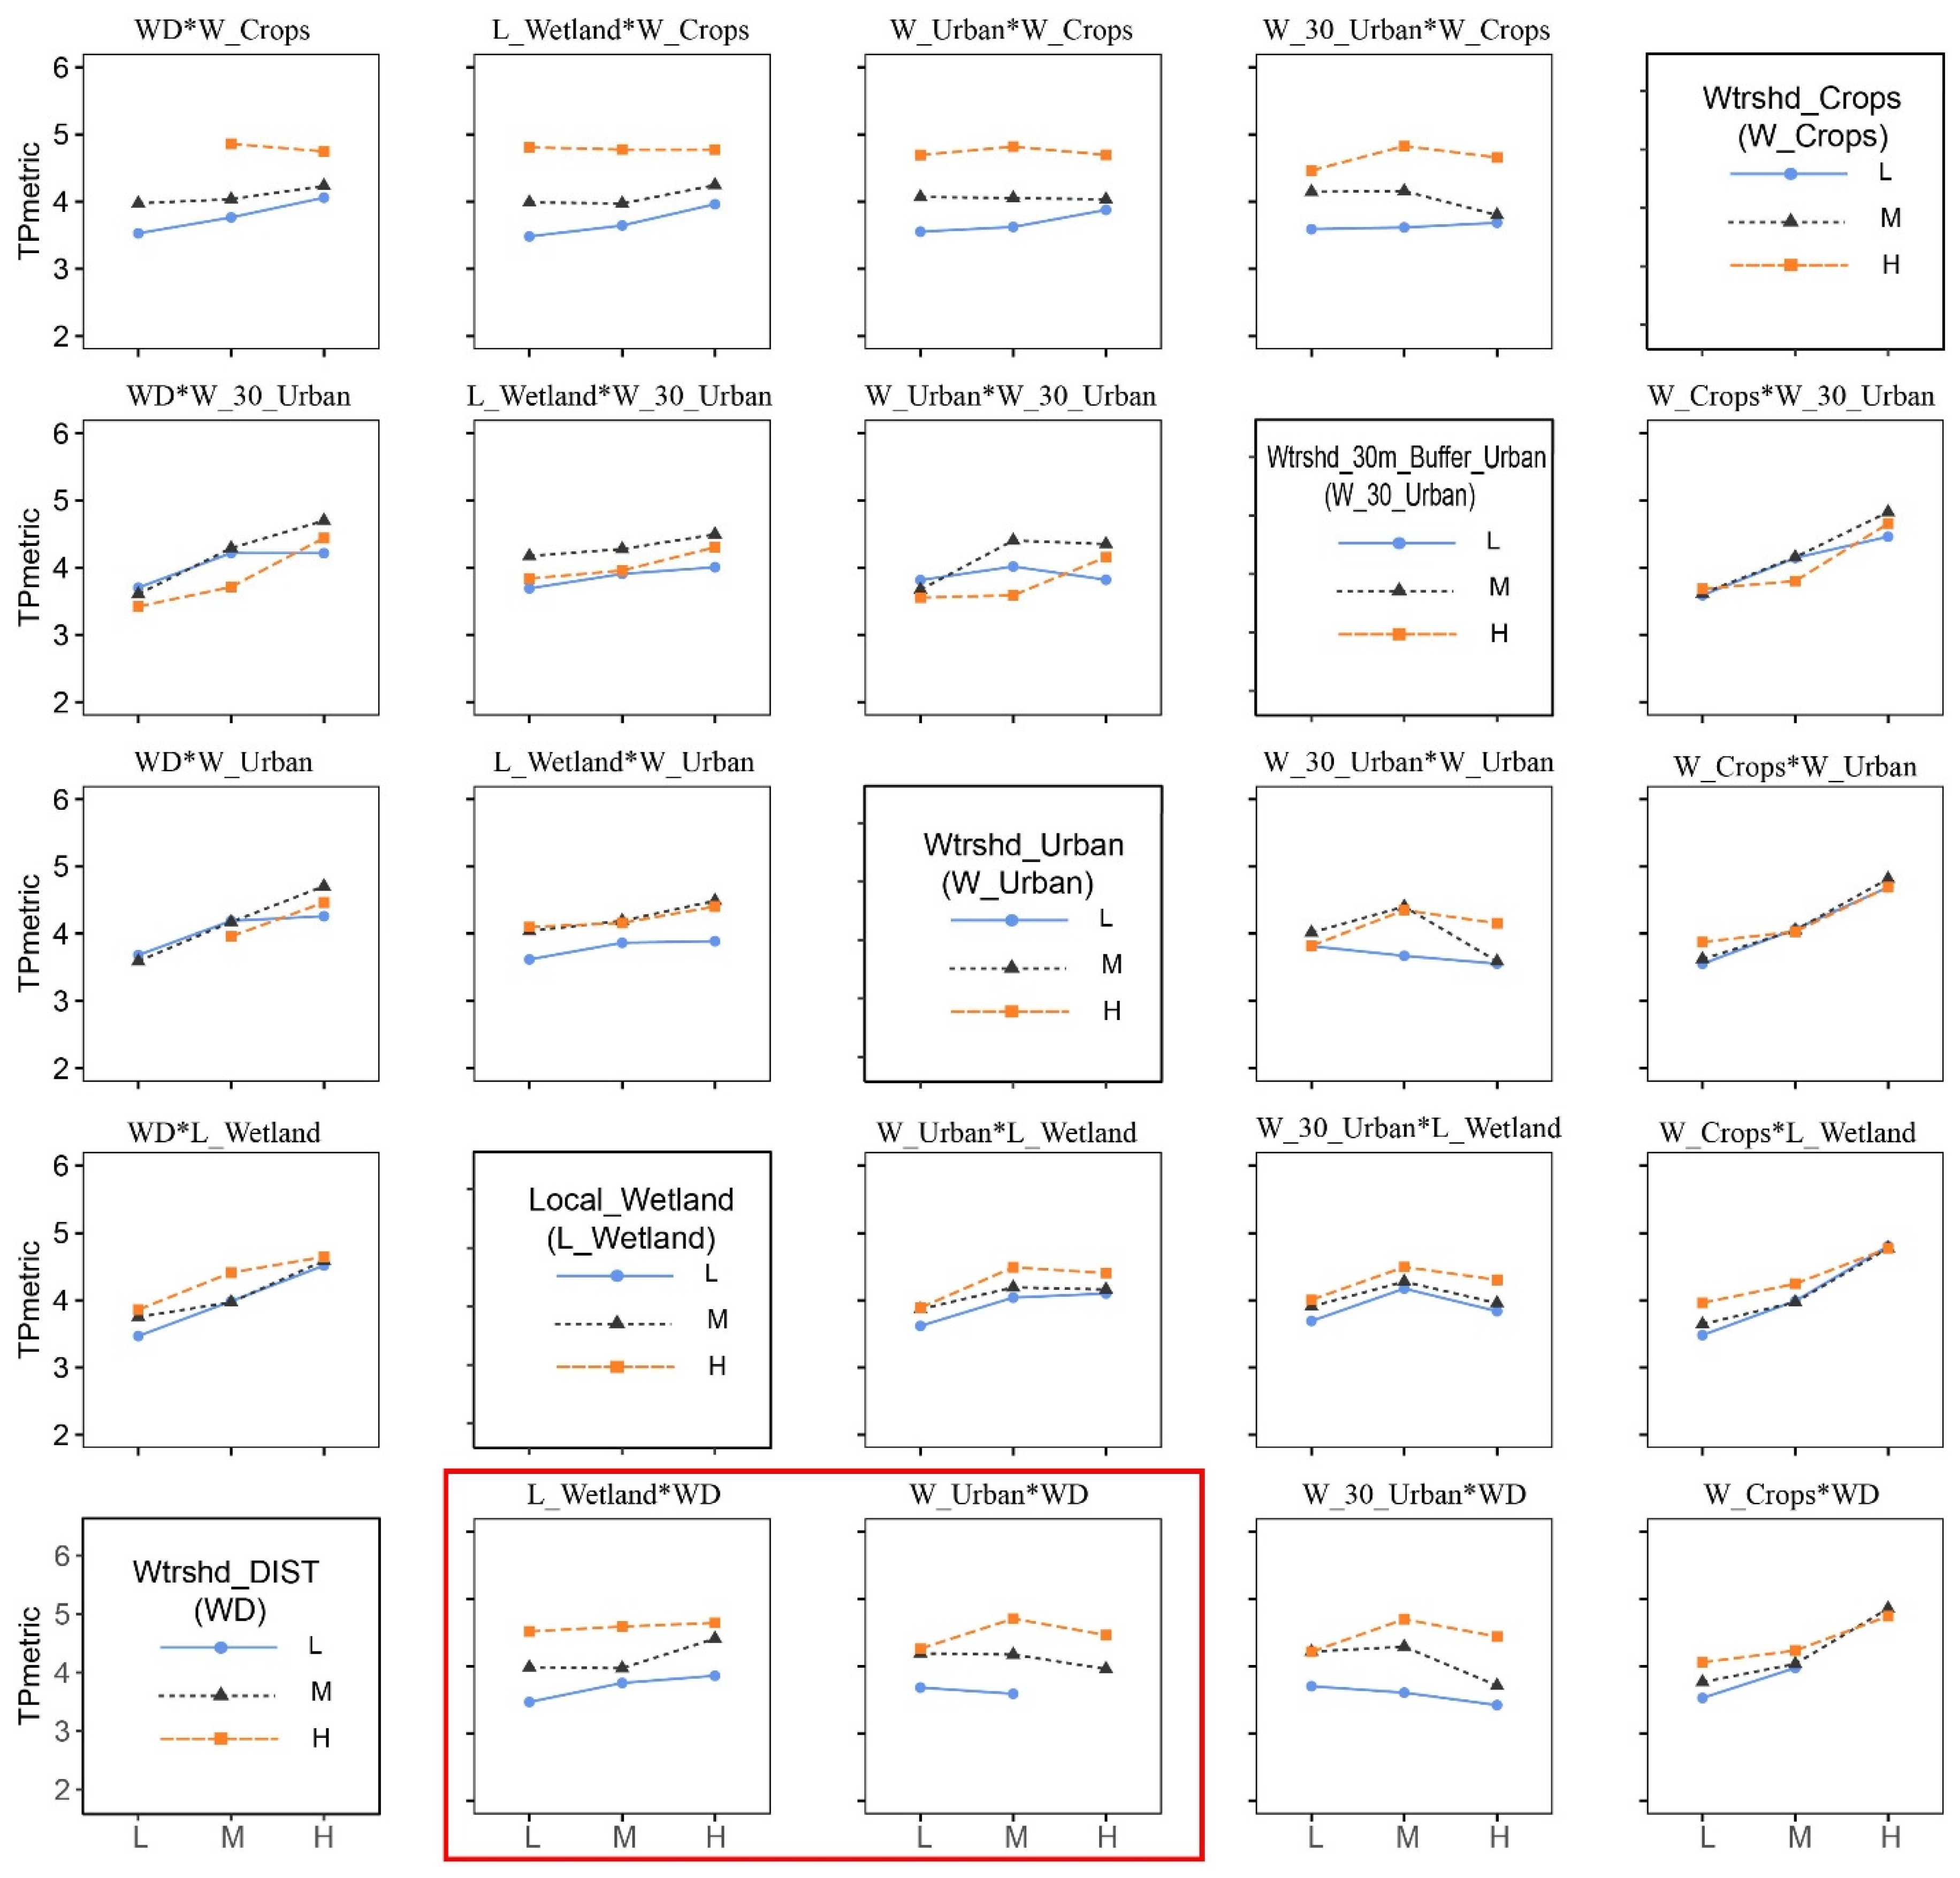
To analyze the interaction between LULC variables and %WD, four wetland variables and the top four LULC variables that had high relative influence values on DI-TP concentrations, were selected (Wtrshd_Crops, Wtrshd_30m_Buffer_Urban, Wtrshd_Urban, Local_Crops, Figure 4). Only four LULC variables were selected because analyzing ten or more LULC variables resulted in a failure to run ANOVA in R. Five significant interactions were detected between %WD and wetlands: (1) Wtrshd_DIST:Local_Wetland, (2) Wtrshd_DIST:Wtrshd_30m_Buffer_Urban:Local_30m_Buffer_Wetland, (3) Wtrshd_DIST:Wtrshd_30m_Buffer_Urban:Local_Wetland, (4) Wtrshd_DIST:Wtrshd_Crops:Wtrshd_Wetland, (5) Wtrshd_DIST:Local_Wetland:Wtrshd_Urban:Wtrshd_Wetland (Table 1). Compared with watershed-scale wetlands, %WD interacted more with local-scale wetlands. Moreover, the interaction between watershed-scale wetlands and %WD was affected by watershed-scale LULC variables (e.g., Wtrshd_Urban and Wtrshd_Crops) (Table 1). A visual analysis of the interactions between %WD and the variables Local_Wetland, Wtrshd_Urban, Wtrshd_30m_Buffer_Urban, and Wtrshd_Crops showed there was a positive interaction between %WD and Local_Wetland (F-value = 8.171, p-value < 0.001). Moreover, the DI-TP concentration increased with an increase in the level of %WD (e.g., the plots in red frame in Figure 6), which was consistent with our previous results (Figure 5b).

4. Discussion

4.1. Reconstructed DI-TP

The large coefficients of determination ranging from ~50% to 66% (Figure 3) indicated DI-TP was a valuable indicator to reflect the nutrient status of the surveyed waters. The effectiveness of DI-TP at reflecting nutrient conditions in the water has been reported by many other researchers. In New Jersey streams and rivers, Ponader et al. found nutrients (especially P) explained a significant amount of variation in the diatom species composition, and that the DI-TP inference model performed well at evaluating nutrient condition [25,52]. Other studies have also shown that diatom inference models can provide a better assessment of nutrient status than one time sampling of TP in the streams of southern Ontario [53], the western US [26], and the Scandinavian Peninsula [27], showing similar coefficients of determination between DI-TP and TP (~50%). Moreover, Stevenson et al. found that DI-TP can better model Cladophora condition than one-time sampling of TP in a two-month survey of streams in the US states of Michigan and Kentucky [54]. In man-made lakes, the performance of DI-TP on modeling cyanobacteria dominance and potential nitrogen-fixing cyanobacteria biomass was shown to be as effective as using measurements of TP, TN and mean field temperature [29,55].

4.2. Effects of Spatial Scale of Wetlands

Our results confirmed that the percentage of row crops and urban land use had the largest negative effect on TP concentration in streams and rivers [9,46,56,57]. A detailed discussion on this topic is beyond the scope of this paper. In the present study, local-scale wetlands were positively related to changes in DI-TP concentration, and performed better at modeling DI-TP concentrations than watershed-scale wetlands (Figure 4), which contradicts our first hypothesis. One possible explanation for this result is that riparian wetlands, being close to streams and rivers, frequently exchange water with these systems [58] and significantly affect their nutrient conditions [59,60]. Without riparian wetlands in the Black River watershed in southern Ontario, the TN and TP concentrations in streams would increase by 260.5% and 890.9%, respectively [61]. Gilliam found that riparian wetlands played an important role in reducing nutrient concentrations in streams compared to watershed wetlands because most of the water purification occurred in the upper riparian zone [62]. In addition, Smucker et al. reported that a riparian buffer zone that has wetland and forest coverage >65%, can considerably reduce the relative abundance of high-phosphorus diatoms in northeastern US streams [63]. Geological factors influencing riparian wetlands could also affect their ability to improve water quality in streams. In the streams of Michigan, Stevenson et al. reported that the proportion of riparian wetlands and river basins with high soil permeability were negatively correlated with the relative abundance of high-nutrient diatoms [64]. Therefore, analyzing diatom species composition could be helpful for thoroughly evaluating the effects of riparian wetlands on reducing TP concentration in streams.
Watershed- (or regional-) scale wetlands could be effective at removing nutrients in downstream waters provided there was a sufficient coverage of wetlands in the watershed. Verhoeven et al. proposed that the minimum percentage of wetlands in the watershed should not be lower than 2–7% to effectively improve the water quality in streams and rivers [16]. In the present study, only 435 out of 1871 sites met this requirement (percentage of watershed scale wetlands ˃2%), which would imply that most wetlands at the watershed scale were unable to efficiently reduce the nutrient concentration for the majority of the NRSA sites. On the other hand, the nutrient removal ability of watershed-scale wetlands could be undermined as a result of more complex interactions between LULC variables and the level of HDA in the watershed, that may not be important at the local scale. For example, as the spatial scale increases from a stream or river, the complexity of hydrological processes related to surface runoff and confluence also increases [12].

4.3. Effects of HDA on Wetlands

Evaluating the effects of HDA in wetlands on the water quality in streams using large wetland samples is challenging due to the difficulties in quantifying HDA type, intensity, and the extent of the wetlands. Moreover, the combination of characteristics that influence water quality in streams and rivers could be different from one ecoregion to another [9,15]. Our results showed that the DI-TP removal ability of wetlands decreased with an increase in level of HDA (Figure 5), which is in accordance with results of Sileshi et al. [65]. However, a stable wetland ecosystem could abruptly change from one status to another under great environmental stressors [66] and its ecological structure and function would change accordingly. For example, point and non-point source nutrient pollution could directly or indirectly degrade wetland vegetation [67] and undermine the nutrient retention function of wetlands [65]. The critical loads of P [68,69] and N [16,70] of wetlands (i.e., loading limits) have been proposed as effective indicators to evaluate the change point of a wetland’s nutrient removal ability. Under a high level of HDA, the decrease in the ability of wetlands to remove nutrients from streams and rivers could be due to the limited number of P-binding sites of the soil when the input of nutrients exceeds the wetland loading limits [17,71,72].
Historically, TP concentrations in streams have been negatively correlated with the percentage of wetland area in watersheds [2,40,73,74]. However, in this study, a decrease in DI-TP concentration was not obvious with an increase in wetland coverage (Figure 4; Figure 5a,b). One possible reason for this result is that the percentage of watershed scale wetland cover that can effectively improve the water quality in streams and rivers (>2%) is small (23.3%) and a significant relationship may not exist between watershed scale wetland cover and TP concentration in water [16,56]. On the other hand, the relationship between DI-TP concentration and wetland coverage could be affected by cross-scale interactions [75] (e.g., various hydrologic characteristics) and the relationship could be different from one region to another [14].

4.4. Interactions Between Spatial Scale and HDA in Wetlands

Our results showed that local scale wetlands have a significant effect on DI-TP concentrations under various levels of HDA. The significant interaction between HDA and local scale wetlands could be because of the geographical closeness between local scale wetlands and streams and rivers [67,76]. Many researchers have found that freshwater ecosystems are embedded in a complex mosaic of terrestrial and human features which drive freshwater processes (e.g., water and species richness), that makes them the most diverse and complex ecosystems globally [9,14,77]. Therefore, not only the effect of individual factors (i.e., HDA and local scale wetlands) but also the influence of interactions should be considered when thoroughly evaluating the role that wetlands play in removing nutrients from streams and rivers.
Our results also showed that the interaction between HDA and different spatial scales of LULC variables (e.g., Wtrshd_DIST:Local_Wetland:Wtrshd_Urban:Wtrshd_Wetland) significantly influenced the DI-TP concentration in streams and rivers, and the interaction between watershed-scale wetlands and HDA was affected by Wtrshd_Urban and Wtrshd_Crops (Table 1). When all LULC variables were included, HDA was more influenced by watershed-scale LULC variables than local-scale LULC variables (Table 1). Although we did not compare the performance of different spatial scales of LULC variables in driving nutrient conditions in streams and rivers among different ecoregions (e.g., three aggregated regions or nine level III ecoregions), the more important effect of watershed-scale LULC variables could be related to their cross-scale landscape features (e.g., hydrological connectivity) [14,78]. In lakes, Fergus et al. found that the relationship between local-scale wetlands and TP in different regions was affected by the amount of agriculture in the region [14]. However, it is hard to accurately identify these cross-scale interactions and to thoroughly understand how these ecological processes operate among different spatial scales for a variety of reasons. For example, the lack of high-frequency and high-resolution data for streams/lakes, technical expertise (e.g., statistical techniques and training in ecoinformatics tools), and collaboration among teams [78].

5. Conclusions and Further Research

By using diatom-inferred total phosphorus (DI-TP) to evaluate an extensive dataset of wetlands on the removal of nutrients from streams and rivers at various spatial scales and under different levels of human disturbance activities (HDA), we found that (1) compared with watershed-scale wetlands, local-scale wetlands performed better at removing DI-TP from streams and rivers; (2) wetlands were more efficient at removing DI-TP from streams and rivers under low levels of HDA; (3) interactions existed between HDA and the spatial scale of wetlands, particularly for local-scale wetlands. The interaction between watershed scale wetlands and HDA was affected by other types of land use and land cover (LULC) variables (e.g., percentage of urban land use and row crops in watersheds), highlighting the complexity and importance of cross-scale interactions. Our results show that DI-TP can be effectively used to evaluate the ability of wetlands to remove nutrients from streams and rivers.
For further research, it would be valuable to classify wetlands into different groups (e.g., marshes, swamps, bogs, and fens) because nutrient efflux from wetlands is also dependent on the wetland type [17]. The level of HDA does affect the nutrient removal ability of wetlands; however, it is challenging to quantify the type, intensity, and extent of HDA in and around wetlands. In addition, it is not clear the combination of characteristics that influence water quality in streams and rivers. To address this issue, we suggest establishing an HDA multimetric index (MMI) (e.g., HDAI) [15] which is made up of a suite of human disturbance metrics. Similarly to the methods used to evaluate MMI performances in reflecting lake diatom condition [79], the performance of an HDA MMI can be evaluated by relating it to the nutrient condition in streams and rivers. To thoroughly explore the drivers of water quality in streams and rivers would be helpful for evaluating the ability of wetlands to remove nutrients from streams and rivers, but it is beyond the scope of this study. Further studies on this topic should consider principles of freshwater landscape ecology (e.g., individual wetland varies in its patch characteristics, and these characteristics are a function of patch context, which is defined by the terrestrial and human landscapes) [77].

Author Contributions

Conceptualization, H.L., X.Y., X.Z. and B.L.; Methodology, H.L., X.Y. and B.L.; Formal analysis, H.L.; Writing—original draft preparation, H.L.; Writing—review and editing, H.L., X.Y., X.Z. and B.L.; Supervision, B.L.; Project administration, B.L. All authors have read and agreed to the published version of the manuscript.

Funding

This paper is supported by the Project of Natural Science Foundation of Hebei Province (D2020201003) and the Hebei Natural Science Foundation (C2022201042).

Data Availability Statement

The original contributions presented in this study are included in the article. Further inquiries can be directed to the corresponding authors.

Acknowledgments

We thank Jan Stevenson at Michigan State University for providing the LULC data and his revision on the manuscript.

Conflicts of Interest

The authors declare no conflicts of interest.

Appendix A

Table A1. A statistical summary of major water chemistry indices and land use data of the selected stream and river sampling sites. Reference and highly disturbed refer to the reference and trashed designations for sites used in the NRSA survey, respectively.
VariableSite
Designation
Percentile
525507595
TP (µg/L)Reference2.7711.0220.2239.0680.75
Highly-
disturbed
15.1267.14149.64284.941190.91
T N (µg/L)Reference38.00154.00264.00482.501086.00
Highly-
disturbed
187.00547.80955.501856.507406.50
Conductivity
(µS/cm)
Reference25.1357.70147.52410.992059.39
Highly-
disturbed
61.51254.04484.35850.993205.58
pHReference6.717.467.978.318.54
Highly-
disturbed
7.127.828.098.298.56
Color
(Pt-Co)
Reference3.007.0012.0020.0050.00
Highly-
disturbed
5.0011.0017.0040.0067.07
Turbidity
(NTU)
Reference0.301.483.246.0418.83
Highly-
disturbed
1.304.3613.4738.06278.21
Watershed
Crops
Reference0.000.000.381.505.22
Highly-
disturbed
0.000.452.185.338.63
Watershed
Urban
Reference0.000.561.432.032.64
Highly-
disturbed
0.541.462.192.625.27
Watershed
Ag
Reference0.000.001.423.476.68
Highly-
disturbed
0.081.844.566.689.06
Watershed
Wetland
Reference0.000.260.811.674.68
Highly-
disturbed
0.000.470.991.734.20
Local CropsReference0.000.000.000.973.10
Highly-
disturbed
0.000.001.385.158.57
Local UrbanReference0.000.001.422.253.73
Highly-
disturbed
0.001.122.083.228.29
Local AgReference0.000.000.593.166.20
Highly-
disturbed
0.000.734.076.709.01
Local WetlandReference0.000.000.932.916.82
Highly-
disturbed
0.000.271.352.725.98
Figure A1. Diagram of the four spatial scales (i.e., watershed scale, watershed 30 m buffer scale, local scale and local 30 m buffer scale) used to evaluate effects of wetlands on removing nutrients in streams and rivers.
Water 17 02865 g0a1

References

  1. VanZomeren, C.M.; Berkowitz, J.F.; Lemke, A.M.; Kirkham, K.G. Soil P Storage Capacity in Agricultural Treatment Wetlands: Can a System Designed for N Reduction Also Retain P? Wetlands 2020, 40, 503–514. [Google Scholar] [CrossRef]
  2. Lemke, A.M.; Kirkham, K.G.; Wallace, M.P.; VanZomeren, C.M.; Berkowitz, J.F.; Kovacic, D.A. Nitrogen and Phosphorus Removal Using Tile-Treatment Wetlands: A 12-Year Study from the Midwestern United States. J. Environ. Qual. 2022, 51, 797–810. [Google Scholar] [CrossRef] [PubMed]
  3. Skinner, M. Wetland Phosphorus Dynamics and Phosphorus Removal Potential. Water Environ. Res. 2022, 94, e10799. [Google Scholar] [CrossRef] [PubMed]
  4. Ury, E.A.; Arrumugam, P.; Herbert, E.R.; Badiou, P.; Page, B.; Basu, N.B. Source or Sink? Meta-Analysis Reveals Diverging Controls of Phosphorus Retention and Release in Restored and Constructed Wetlands. Environ. Res. Lett. 2023, 18, 083002. [Google Scholar] [CrossRef]
  5. Zhang, W.; Li, H.; Xu, D.; Xia, T. Wetland Destruction in a Headwater River Leads to Disturbing Decline of In-Stream Nitrogen Removal. Environ. Sci. Technol. 2024, 58, 2774–2785. [Google Scholar] [CrossRef]
  6. Lintern, A.; Webb, J.; Ryu, D.; Liu, S.; Bende-Michl, U.; Waters, D.; Leahy, P.; Wilson, P.; Western, A. Key Factors Influencing Differences in Stream Water Quality across Space. Wiley Interdiscip. Rev. Water 2018, 5, e1260. [Google Scholar] [CrossRef]
  7. Zhang, J.; Li, S.; Jiang, C. Effects of Land Use on Water Quality in a River Basin (Daning) of the Three Gorges Reservoir Area, China: Watershed versus Riparian Zone. Ecol. Indic. 2020, 113, 106226. [Google Scholar] [CrossRef]
  8. Lei, C.; Wagner, P.D.; Fohrer, N. Effects of Land Cover, Topography, and Soil on Stream Water Quality at Multiple Spatial and Seasonal Scales in a German Lowland Catchment. Ecol. Indic. 2021, 120, 106940. [Google Scholar] [CrossRef]
  9. Sliva, L.; Williams, D.D. Buffer Zone versus Whole Catchment Approaches to Studying Land Use Impact on River Water Quality. Water Res. 2001, 35, 3462–3472. [Google Scholar] [CrossRef]
  10. Tanaka, M.O.; de Souza, A.L.T.; Moschini, L.E.; de Oliveira, A.K. Influence of Watershed Land Use and Riparian Characteristics on Biological Indicators of Stream Water Quality in Southeastern Brazil. Agric. Ecosyst. Environ. 2016, 216, 333–339. [Google Scholar] [CrossRef]
  11. Mello, K.d.; Valente, R.A.; Randhir, T.O.; dos Santos, A.C.A.; Vettorazzi, C.A. Effects of Land Use and Land Cover on Water Quality of Low-Order Streams in Southeastern Brazil: Watershed versus Riparian Zone. Catena 2018, 167, 130–138. [Google Scholar] [CrossRef]
  12. Xu, Q.; Yan, T.; Wang, C.; Hua, L.; Zhai, L. Managing Landscape Patterns at the Riparian Zone and Sub-Basin Scale Is Equally Important for Water Quality Protection. Water Res. 2023, 229, 119280. [Google Scholar] [CrossRef]
  13. Mitchell, M.E.; Shifflett, S.D.; Newcomer-Johnson, T.; Hodaj, A.; Crumpton, W.; Christensen, J.; Dyson, B.; Canfield, T.J.; Richmond, S.; Helmers, M.; et al. Ecosystem Services in Iowa Agricultural Catchments: Hypotheses for Scenarios with Water Quality Wetlands and Improved Tile Drainage. J. Soil Water Conserv. 2022, 77, 426–440. [Google Scholar] [CrossRef] [PubMed]
  14. Fergus, C.E.; Soranno, P.A.; Cheruvelil, K.S.; Bremigan, M.T. Multiscale Landscape and Wetland Drivers of Lake Total Phosphorus and Water Color. Limnol. Oceanogr. 2011, 56, 2127–2146. [Google Scholar] [CrossRef]
  15. Lomnicky, G.A.; Herlihy, A.T.; Kaufmann, P.R. Quantifying the Extent of Human Disturbance Activities and Anthropogenic Stressors in Wetlands across the Conterminous United States: Results from the National Wetland Condition Assessment. Environ. Monit. Assess. 2019, 191 (Suppl. S1), 324. [Google Scholar] [CrossRef] [PubMed]
  16. Verhoeven, J.T.; Arheimer, B.; Yin, C.; Hefting, M.M. Regional and Global Concerns over Wetlands and Water Quality. Trends Ecol. Evol. 2006, 21, 96–103. [Google Scholar] [CrossRef]
  17. Fisher, J.; Acreman, M. Wetland Nutrient Removal: A Review of the Evidence. Hydrol. Earth Syst. Sci. 2004, 8, 673–685. [Google Scholar] [CrossRef]
  18. Mitsch, W.J.; Day, J.W.; Zhang, L.; Lane, R.R. Nitrate-Nitrogen Retention in Wetlands in the Mississippi River Basin. Ecol. Eng. 2005, 24, 267–278. [Google Scholar] [CrossRef]
  19. Darwiche-Criado, N.; Comín, F.A.; Masip, A.; García, M.; Eismann, S.G.; Sorando, R. Effects of Wetland Restoration on Nitrate Removal in an Irrigated Agricultural Area: The Role of In-Stream and Off-Stream Wetlands. Ecol. Eng. 2017, 103, 426–435. [Google Scholar] [CrossRef]
  20. Hering, D.; Johnson, R.K.; Kramm, S.; Schmutz, S.; Szoszkiewicz, K.; Verdonschot, P.F.M. Assessment of European Streams with Diatoms, Macrophytes, Macroinvertebrates and Fish: A Comparative Metric-Based Analysis of Organism Response to Stress. Freshw. Biol. 2006, 51, 1757–1785. [Google Scholar] [CrossRef]
  21. Liu, B.; Chen, S.; Liu, H.; Guan, Y. Blue-Green Algae Enhanced Performance of Diatom-Based Multimetric Index on Defining Lake Condition under High Level of Human Disturbance. Sci. Total Environ. 2020, 730, 138846. [Google Scholar] [CrossRef]
  22. Liu, B.; Li, D.; Chen, S.; Wu, N.; Guan, Y. Improving Biological Condition Assessment Accuracy by Multimetric Index Approach with Microalgae in Streams and Lakes. Sci. Total Environ. 2021, 771, 145417. [Google Scholar] [CrossRef]
  23. Stevenson, R. Refining Diatom Indicators for Valued Ecological Attributes and Development of Water Quality Criteria. In Advances in Phycological Studies; Ognjanova-Rumenova, N., Manoylov, K., Eds.; Pensoft Publishers: Moscow, Russia, 2006; pp. 365–383. [Google Scholar]
  24. Pan, Y.; Stevenson, R.J.; Hill, B.H.; Herlihy, A.T.; Collins, G.B. Using Diatoms as Indicators of Ecological Conditions in Lotic Systems: A Regional Assessment. J. N. Am. Benthol. Soc. 1996, 15, 481–495. [Google Scholar] [CrossRef]
  25. Ponader, K.C.; Charles, D.F.; Belton, T.J. Diatom-Based TP and TN Inference Models and Indices for Monitoring Nutrient Enrichment of New Jersey Streams. Ecol. Indic. 2007, 7, 79–93. [Google Scholar] [CrossRef]
  26. Stevenson, R.J.; Pan, Y.; Manoylov, K.M.; Parker, C.A.; Larsen, D.P.; Herlihy, A.T. Development of Diatom Indicators of Ecological Conditions for Streams of the Western US. J. N. Am. Benthol. Soc. 2008, 27, 1000–1016. [Google Scholar] [CrossRef]
  27. Pajunen, V.; Kahlert, M.; Soininen, J. Stream Diatom Assemblages as Environmental Indicators—A Cross-Regional Assessment. Ecol. Indic. 2020, 113, 106183. [Google Scholar] [CrossRef]
  28. Keatley, B.E.; Bennett, E.M.; MacDonald, G.K.; Taranu, Z.E.; Gregory-Eaves, I. Land-Use Legacies Are Important Determinants of Lake Eutrophication in the Anthropocene. PLoS ONE 2011, 6, e15913. [Google Scholar] [CrossRef] [PubMed]
  29. Liu, B.; Chen, S.; Liu, H.; Guan, Y. Modeling Cyanobacteria Biomass by Surface Sediment Diatoms in Lakes: Problems and Suggestions. Ecol. Model. 2020, 430, 109056. [Google Scholar] [CrossRef]
  30. Gasiorowski, M.; Sienkiewicz, E.; Ciolko, U.; Kaucha, K.; Kupryjanowicz, M.; Szal, M. Cultural Eutrophication of a Central European Lowland Lake from the Bronze Age to the Present Recorded in Diatom and Cladocera Remains. Catena 2021, 204, 105404. [Google Scholar] [CrossRef]
  31. Omernik, J.M. Ecoregions of the Conterminous United States. Ann. Assoc. Am. Geogr. 1987, 77, 118–125. [Google Scholar] [CrossRef]
  32. USEPA. National Rivers and Streams Assessment: Site Evaluation Guidelines; Rep. EPA 841-B-07-008; U.S. Environmental Protection Agency: Washington, DC, USA, 2007. Available online: https://www.epa.gov/national-aquatic-resource-surveys/national-rivers-streams-assessment-2008-2009-site-evaluation (accessed on 10 February 2024).
  33. USEPA. National Rivers and Streams Assessment: Field Operations Manual; Rep. EPA 841-B-07-009; U.S. Environmental Protection Agency: Washington, DC, USA, 2007. Available online: https://www.epa.gov/national-aquatic-resource-surveys/national-rivers-streams-assessment-2008-2009-field-operations (accessed on 10 February 2024).
  34. USEPA. National Rivers and Streams Assessment: Laboratory Methods Manual; Rep. EPA 841-B-07-010; U.S. Environmental Protection Agency, Office of Water and Office of Research and Development: Washington, DC, USA, 2008. Available online: https://www.epa.gov/national-aquatic-resource-surveys/national-rivers-streams-assessment-2008-2009-laboratory (accessed on 10 February 2024).
  35. USEPA. National Rivers and Streams Assessment: Quality Assurance Project Plan; Rep. EPA 841-B-07-007; U.S. Environmental Protection Agency, Office of Water and Office of Research and Development: Washington, DC, USA, 2008. Available online: https://www.epa.gov/national-aquatic-resource-surveys/national-rivers-streams-assessment-2008-2009-quality-assurance (accessed on 10 February 2024).
  36. Krammer, K.; Lange-Bertalot, H. Bacillariophyceae, 1 Teil: Naviculaceae. In Süsswasserflora von Mitteleuropa; Band 2/1; Spektrum Akademischer Verlag: Heidelberg, Germany, 1999. [Google Scholar]
  37. Krammer, K.; Lange-Bertalot, H. Bacillariophyceae, 2 Teil: Bacillariaceae, Epithemiaceae, Urirellaceae. In Süsswasserflora von Mitteleuropa; Band 2/2; Spektrum Akademischer Verlag: Heidelberg, Germany, 1999. [Google Scholar]
  38. Krammer, K.; Lange-Bertalot, H. Bacillariophyceae, 3 Teil: Centrales, Fragilariaceae, Eunotiaceae. In Süsswasserflora von Mitteleuropa; Band 2/3; Spektrum Akademischer Verlag: Heidelberg, Germany, 2008. [Google Scholar]
  39. Krammer, K.; Lange-Bertalot, H. Bacillariophyceae, 4 Teil: Achnanthaceae, Kritische Ergänzungen zu Achnanthes s.l., Navicula s.str., Gomphonema. In Süsswasserflora von Mitteleuropa; Band 2/4; Spektrum Akademischer Verlag: Heidelberg, Germany, 2008. [Google Scholar]
  40. Zedler, J.B. Wetlands at Your Service: Reducing Impacts of Agriculture at the Watershed Scale. Front. Ecol. Environ. 2003, 1, 65–72. [Google Scholar] [CrossRef]
  41. Hogan, D.M.; Walbridge, M.R. Urbanization and Nutrient Retention in Freshwater Riparian Wetlands. Ecol. Appl. 2007, 17, 1142–1155. [Google Scholar] [CrossRef] [PubMed]
  42. ter Braak, C.J.; van Dame, H. Inferring pH from Diatoms: A Comparison of Old and New Calibration Methods. Hydrobiologia 1989, 178, 209–223. [Google Scholar] [CrossRef]
  43. Fritz, S.C.; Cumming, B.F.; Gasse, F.; Laird, K. Diatoms as indicators of hydrologic and climatic change in saline lakes. In The Diatoms: Applications for the Environmental and Earth Sciences; Stoermer, E.F., Smol, J.P., Eds.; Cambridge University Press: Cambridge, UK; New York, NY, USA, 1999; pp. 41–72. [Google Scholar]
  44. Elith, J.; Leathwick, J.R.; Hastie, T. A Working Guide to Boosted Regression Trees. J. Anim. Ecol. 2008, 77, 802–813. [Google Scholar] [CrossRef] [PubMed]
  45. Ridgeway, G. Generalized Boosted Regression Models: Documentation on the R Package ‘gbm’, Version 1.5-7. 2006. Available online: https://www.rdocumentation.org/packages/gbm/versions/1.5-7/topics/gbm-package (accessed on 11 May 2024).
  46. Liu, B.; Chen, S.; Liu, H.; Guan, Y. Changes in the Ratio of Benthic to Planktonic Diatoms to Eutrophication Status of Muskegon Lake through Time: Implications for a Valuable Indicator on Water Quality. Ecol. Indic. 2020, 114, 106284. [Google Scholar] [CrossRef]
  47. Pillsbury, R.; Stevenson, R.J.; Munn, M.D.; Waite, I. Relationships between Diatom Metrics Based on Species Nutrient Traits and Agricultural Land Use. Environ. Monit. Assess. 2019, 191, 228. [Google Scholar] [CrossRef]
  48. Soranno, P.A.; Cheruvelil, K.S.; Wagner, T.; Webster, K.E.; Bremigan, M.T. Effects of Land Use on Lake Nutrients: The Importance of Scale, Hydrologic Connectivity, and Region. PLoS ONE 2015, 10, e0135454. [Google Scholar] [CrossRef]
  49. Heiberger, R.M.; Holland, B. Statistical Analysis and Data Display: An Intermediate Course with Examples in R; Casella, G., Fienberg, S.E., Olkin, I., Eds.; Springer Texts in Statistics; Springer: New York, NY, USA, 2015; pp. 377–426. [Google Scholar] [CrossRef]
  50. Dahl, T.E. Wetlands Losses in the United States, 1780’s to 1980’s; U.S. Department of the Interior, Fish and Wildlife Service: Washington, DC, USA, 1990; 13p. [Google Scholar]
  51. Herlihy, A.T.; Kamman, N.C.; Sifneos, J.C.; Charles, D.; Enache, M.D.; Stevenson, R.J. Using Multiple Approaches to Develop Nutrient Criteria for Lakes in the Conterminous USA. Freshw. Sci. 2013, 32, 367–384. [Google Scholar] [CrossRef]
  52. Ponader, K.C.; Charles, D.F.; Belton, T.J.; Winter, D.M. Total Phosphorus Inference Models and Indices for Coastal Plain Streams Based on Benthic Diatom Assemblages from Artificial Substrates. Hydrobiologia 2008, 610, 139–152. [Google Scholar] [CrossRef]
  53. Winter, J.G.; Duthie, H.C. Epilithic Diatoms as Indicators of Stream Total N and Total P Concentration. J. N. Am. Benthol. Soc. 2000, 19, 32–49. [Google Scholar] [CrossRef]
  54. Stevenson, R.J.; Pan, Y.; Van Dam, H. Assessing Environmental Conditions in Rivers and Streams with Diatoms. In The Diatoms: Applications for the Environmental and Earth Sciences, 2nd ed.; Stoermer, E.F., Smol, J.P., Eds.; Cambridge University Press: Cambridge, UK, 2010; pp. 66–67. [Google Scholar]
  55. Liu, B.; Hou, W.; Kattel, G.; Li, D.; Yan, X. Advancing Potential of Diatom Indicators for Stream and Lake Water Quality Assessment against Nutrient-Induced Pollution. J. Appl. Phycol. 2023, 35, 721–737. [Google Scholar] [CrossRef]
  56. Shi, X.; Mao, D.; Song, K.; Xiang, H.; Li, S.; Wang, Z. Effects of Landscape Changes on Water Quality: A Global Meta-Analysis. Water Res. 2024, 260, 121946. [Google Scholar] [CrossRef] [PubMed]
  57. Li, D.; Si, Y.; Yan, X.; Kattel, G.; Kang, X.; Liu, B. Effect of Nutrient Enrichment and Climate Change on Historical Changes of the Cyanobacterial Community in a Shallow North Temperate Lake in China. Anthropocene 2025, 49, 100460. [Google Scholar] [CrossRef]
  58. Leibowitz, S.G.; Hill, R.A.; Creed, I.F.; Compton, J.E.; Golden, H.E.; Weber, M.H.; Rains, M.C.; Jones, C.E.; Lee, E.H.; Christensen, J.R.; et al. National Hydrologic Connectivity Classification Links Wetlands with Stream Water Quality. Nat. Water 2023, 1, 370–380. [Google Scholar] [CrossRef] [PubMed]
  59. Shi, P.; Zhang, Y.; Li, Z.; Li, P.; Xu, G. Influence of Land Use and Land Cover Patterns on Seasonal Water Quality at Multi-Spatial Scales. Catena 2017, 151, 182–190. [Google Scholar] [CrossRef]
  60. Yan, Z.; Li, P.; Li, Z.; Xu, Y.; Zhao, C.; Cui, Z. Effects of Land Use and Slope on Water Quality at Multi-Spatial Scales: A Case Study of the Weihe River Basin. Environ. Sci. Pollut. Res. 2023, 30, 57599–57616. [Google Scholar] [CrossRef]
  61. Yang, W.; Liu, Y.; Ou, C.; Gabor, S. Examining Water Quality Effects of Riparian Wetland Loss and Restoration Scenarios in a Southern Ontario Watershed. J. Environ. Manag. 2016, 174, 26–34. [Google Scholar] [CrossRef]
  62. Gilliam, J. Riparian Wetlands and Water Quality. J. Environ. Qual. 1994, 23, 896–900. [Google Scholar] [CrossRef]
  63. Smucker, N.J.; Detenbeck, N.E.; Morrison, A.C. Diatom Responses to Watershed Development and Potential Moderating Effects of Near-Stream Forest and Wetland Cover. Freshw. Sci. 2013, 32, 230–249. [Google Scholar] [CrossRef]
  64. Stevenson, R.J.; Novoveska, L.; Riseng, C.M.; Wiley, M.J. Comparing Responses of Diatom Species Composition to Natural and Anthropogenic Factors in Streams of Glaciated Ecoregions. Nova Hedwig. 2009, 135, 1–13. [Google Scholar]
  65. Sileshi, A.; Awoke, A.; Beyene, A.; Stiers, I.; Triest, L. Water Purifying Capacity of Natural Riverine Wetlands in Relation to Their Ecological Quality. Front. Environ. Sci. 2020, 8, 39. [Google Scholar] [CrossRef]
  66. Kéfi, S.; Guttal, V.; Brock, W.A.; Carpenter, S.R.; Ellison, A.M.; Livina, V.N.; Seekell, D.A.; Scheffer, M.; Van Nes, E.H.; Dakos, V. Early Warning Signals of Ecological Transitions: Methods for Spatial Patterns. PLoS ONE 2014, 9, e92097. [Google Scholar] [CrossRef] [PubMed]
  67. Xiong, Y.; Mo, S.; Wu, H.; Qu, X.; Liu, Y.; Zhou, L. Influence of Human Activities and Climate Change on Wetland Landscape Pattern—A Review. Sci. Total Environ. 2023, 879, 163112. [Google Scholar] [CrossRef] [PubMed]
  68. Richardson, C.; Qian, S.; Craft, C.; Qualls, R. Predictive Models for Phosphorus Retention in Wetlands. Wetl. Ecol. Manag. 1996, 4, 159–175. [Google Scholar] [CrossRef]
  69. Richardson, C.J.; Qian, S.S. Long-Term Phosphorus Assimilative Capacity in Freshwater Wetlands: A New Paradigm for Sustaining Ecosystem Structure and Function. Environ. Sci. Technol. 1999, 33, 1545–1551. [Google Scholar] [CrossRef]
  70. Bobbink, R.; Lamers, L. Effects of Increased Nitrogen Deposition. In Air Pollution and Plant Life, 2nd ed.; Bell, J.N.B., Treshow, M., Eds.; John Wiley & Sons: Chichester, UK, 2002; pp. 201–235. [Google Scholar]
  71. Nichols, D.S. Capacity of Natural Wetlands to Remove Nutrients from Wastewater. J. Water Pollut. Control Fed. 1983, 55, 495–505. [Google Scholar]
  72. Rutledge, J.M.; Chow-Fraser, P. Landscape Characteristics Driving Spatial Variation in Total Phosphorus and Sediment Loading from Sub-Watersheds of the Nottawasaga River, Ontario. J. Environ. Manag. 2019, 234, 357–366. [Google Scholar] [CrossRef]
  73. Johnston, C.A.; Detenbeck, N.E.; Niemi, G.J. The Cumulative Effect of Wetlands on Stream Water Quality and Quantity: A Landscape Approach. Biogeochemistry 1990, 10, 105–141. [Google Scholar] [CrossRef]
  74. Hogan, D.M.; Jordan, T.E.; Walbridge, M.R. Phosphorus Retention and Soil Organic Carbon in Restored and Natural Freshwater Wetlands. Wetlands 2004, 24, 573–585. [Google Scholar] [CrossRef]
  75. Peters, D.P.; Bestelmeyer, B.T.; Turner, M.G. Cross-Scale Interactions and Changing Pattern–Process Relationships: Consequences for System Dynamics. Ecosystems 2007, 10, 790–796. [Google Scholar] [CrossRef]
  76. Zheng, Y.; Zhang, G.; Wu, Y.; Xu, Y.J.; Dai, C. Dam Effects on Downstream Riparian Wetlands: The Nenjiang River, Northeast China. Water 2019, 11, 2038. [Google Scholar] [CrossRef]
  77. Soranno, P.A.; Cheruvelil, K.S.; Webster, K.E.; Bremigan, M.T.; Wagner, T.; Stow, C.A. Using Landscape Limnology to Classify Freshwater Ecosystems for Multi-Ecosystem Management and Conservation. Bioscience 2010, 60, 440–454. [Google Scholar] [CrossRef]
  78. Soranno, P.A.; Cheruvelil, K.S.; Bissell, E.G.; Bremigan, M.T.; Downing, J.A.; Fergus, C.E.; Filstrup, C.T.; Henry, E.N.; Lottig, N.R.; Stanley, E.H. Cross-Scale Interactions: Quantifying Multi-Scaled Cause–Effect Relationships in Macrosystems. Front. Ecol. Environ. 2014, 12, 65–73. [Google Scholar] [CrossRef]
  79. Liu, B.; Stevenson, R.J. Improving Assessment Accuracy for Lake Biological Condition by Classifying Lakes with Diatom Typology, Varying Metrics and Modeling Multimetric Indices. Sci. Total Environ. 2017, 609, 263–271. [Google Scholar] [CrossRef]
Figure 1. Ecoregions and the distribution of low- and high-disturbance sites screened according to levels of HDA across the conterminous US. Low and high levels of HDA were determined according to the percentage of watershed agriculture (%Ag) and watershed urban (%Urban) of wetlands (Section 2.3).
Water 17 02865 g001
Figure 2. Spatial distribution of local and watershed scale wetlands and other three major LULC variables (urban, agriculture and row crops) across the conterminous US from 2008 to 2009.
Water 17 02865 g002aWater 17 02865 g002b
Figure 3. Scatterplot and fitted linear equation between log( x )-transformed TP (LogPTL) and log( x )-transformed DI-TP (TPmetric) in each of the nine ecoregions. (a) CPL; (b) SAP; (c) NAP; (d) TPL; (e) SPL; (f) NPL; (g) XER; (h) WMT; (i) UMW.
Water 17 02865 g003
Figure 4. Partial dependence plots of DI-TP concentration as fitted functions of the top 9 predictor variables at all 1871 sites. Relative influence values are in parentheses. All axes are normalized for BRT execution and better visualization.
Water 17 02865 g004
Figure 5. Partial dependence plots of DI-TP concentration as fitted functions of the top 9 predictor variables at (a) 468 low-disturbed sites, (b) 468 high-disturbed sites. Relative influence values are in parentheses. All axes are normalized for BRT execution and better visualization.
Water 17 02865 g005aWater 17 02865 g005b
Figure 6. Effects of interactive variables on DI-TP concentration. Wtrshd_DIST indicated watershed disturbance (i.e., %WD). In WD*L_Wetland, the x-axis represented three levels of %WD, with different colors indicating three levels of Local_Wetland.
Water 17 02865 g006
Table 1. Factorial ANOVA table showing significant interactions between spatial scale and level of HDA on wetlands. Wtrshd_DIST indicated watershed disturbance (i.e., %WD).
InteractionDfSum SqMean SqF Valuep Value
Wtrshd_DIST:Wtrshd_Crops37.952.6511.295<0.001
Wtrshd_DIST:Wtrshd_30m_Buffer_Urban47.671.928.174<0.001
Wtrshd_DIST:Local_Wetland47.671.928.171<0.001
Wtrshd_DIST:Wtrshd_Urban33.631.215.158<0.01
Wtrshd_DIST:Wtrshd_30m_Buffer_Urban:Local_30m_Buffer_Wetland52.80.562.391<0.05
Wtrshd_DIST:Wtrshd_30m_Buffer_Urban:Local_Wetland83.970.52.117<0.05
Wtrshd_DIST:Wtrshd_30m_Buffer_Urban:Wtrshd_Urban35.011.677.124<0.001
Wtrshd_DIST:Wtrshd_Crops:Local_Crops31.940.652.757<0.05
Wtrshd_DIST:Wtrshd_Crops:Wtrshd_Wetland63.390.572.41<0.05
Wtrshd_DIST:Local_Wetland:Wtrshd_Urban:Wtrshd_Wetland32.310.773.287<0.05
Wtrshd_30m_Buffer_Urban:Local_Wetland44.611.154.912<0.001
Wtrshd_30m_Buffer_Urban:Wtrshd_30m_Buffer_Wetland43.790.954.035<0.01
Wtrshd_30m_Buffer_Urban:Wtrshd_Urban49.562.3910.189<0.001
Wtrshd_30m_Buffer_Urban:Wtrshd_Wetland44.251.064.531<0.01
Wtrshd_30m_Buffer_Urban:Local_Crops:Local_30m_Buffer_Wetland84.040.512.155<0.05
Wtrshd_30m_Buffer_Urban:Wtrshd_Urban:Wtrshd_30m_Buffer_Wetland42.980.743.175<0.05
Wtrshd_30m_Buffer_Urban:Wtrshd_Urban:Wtrshd_Wetland42.790.72.974<0.05
Wtrshd_30m_Buffer_Urban:Wtrshd_Wetland:Wtrshd_30m_Buffer_Wetland42.70.672.873<0.05
Wtrshd_30m_Buffer_Urban:Local_Wetland:Wtrshd_Urban:Local_Crops2214.27<0.05
Wtrshd_30m_Buffer_Urban:Local_Wetland:Wtrshd_Wetland:Wtrshd_30m_Buffer_Wetland21.850.923.937<0.05
Wtrshd_30m_Buffer_Urban:Wtrshd_Wetland:Local_Crops:Wtrshd_30m_Buffer_Wetland11.031.034.392<0.05
Wtrshd_Crops:Local_30m_Buffer_Wetland42.350.592.501<0.05
Wtrshd_Crops:Local_Wetland46.491.626.916<0.001
Wtrshd_Crops:Wtrshd_30m_Buffer_Urban43.50.883.732<0.01
Wtrshd_Crops:Wtrshd_30m_Buffer_Wetland44.061.024.333<0.01
Wtrshd_Crops:Wtrshd_Wetland43.870.974.13<0.01
Wtrshd_Crops:Local_Wetland:Local_Crops63.760.632.671<0.05
Wtrshd_Crops:Wtrshd_Urban:Wtrshd_Wetland53.460.692.949<0.05
Wtrshd_Crops:Wtrshd_Wetland:Local_30m_Buffer_Wetland63.320.552.363<0.05
Wtrshd_Crops:Wtrshd_30m_Buffer_Urban:Local_Wetland:Wtrshd_Wetland21.610.83.422<0.05
Wtrshd_Urban:Local_Crops42.870.723.061<0.05
Wtrshd_Wetland:Local_30m_Buffer_Wetland42.790.72.971<0.05
Wtrshd_Wetland:Wtrshd_30m_Buffer_Wetland33.851.285.475<0.001
Local_Wetland:Local_Crops45.191.35.53<0.001
Local_Wetland:Wtrshd_Urban42.520.632.685<0.05
Local_Wetland:Wtrshd_Urban:Wtrshd_30m_Buffer_Wetland42.270.572.415<0.05
Disclaimer/Publisher’s Note: The statements, opinions and data contained in all publications are solely those of the individual author(s) and contributor(s) and not of MDPI and/or the editor(s). MDPI and/or the editor(s) disclaim responsibility for any injury to people or property resulting from any ideas, methods, instructions or products referred to in the content.