1. Introduction
Water intended for human consumption comes into contact with various construction materials used in collection, supply, treatment, storage, and distribution systems, as well as in building networks, all the way to the consumer’s tap. These materials used in supply structures may have the capacity to change the quality of water intended for human consumption, thereby reducing the level of safety and protection of human health [
1,
2].
The managing bodies are responsible for ensuring that the materials used in the water supply system, from its source to the end of its distribution, do not cause changes in water quality that significantly reduce the level of protection of consumers’ health [
3].
In the context of this study and concerning materials in contact with water, ‘material’ refers to any prepared form of a substance or combination of substances suitable for use in a manufacturing process, and may be organic, metallic or inorganic [
4,
5].
When managing water quality in supply systems, it is essential to consider the potential interactions between the water and the materials that comprise the building network or that are added to the water during its treatment. The materials and chemical products used in water supply systems can affect water quality through various processes, including (i) changes to the chemical properties of the water; (ii) contributions to bacteriological development/microbiological activity; (iii) changes to the physical and organoleptic properties of the water; and (iv) the leaching or migration of potentially toxic substances [
3,
6,
7,
8].
The choice of material must be made considering the specifications for use, the characteristics of the water distributed (which may be fouling or aggressive), the location of the pipes, economic aspects, the fittings to be used, and the heterogeneous mix of materials [
8].
Depending on their formulation, materials can potentially leach metals and organic substances into the water, altering its organoleptic, physicochemical, and toxic properties [
5].
The nature of these interactions depends on the nature of the materials used. Materials can be grouped into three classes: (i) organic, which includes plastics, rubbers, silicones, coatings, and lubricants; (ii) metallic, which includes metals particularly steel, copper, ductile iron and metal alloys (e.g., brass); and (iii) cementitious, which includes cement in their composition (e.g., mortar, cement and cement-based composites) [
8,
9].
Traditionally, drinking water distribution systems have been constructed mainly from metallic materials. Public systems are mostly made from cast iron and steel, with or without an internal lining of cementitious materials. Galvanized steel and copper are the primary materials used in domestic systems, with lead pipes still employed in some countries for domestic distribution [
10].
There is a trend to replace metallic materials, particularly in public distribution systems, with organic materials, particularly plastics. One of the primary reasons for the change in material selection is the impact of corrosion on metallic pipe materials, affecting both the quality of drinking water and the service life of the pipes. A second reason is the use of installation techniques that make the process more accessible and economical [
11].
Different materials can be used throughout the supply system for seals, tanks, pipes, linings, taps, and meters. These can be made from a variety of materials, including copper, steel, iron, polyvinyl chloride (PVC), polyethylene (PE), polypropylene (PP), concrete, epoxy resins, and lead (in increasingly smaller quantities over the years). Lisbon’s distribution network consists mainly of high-density polyethylene, ductile iron, fiber cement, cast iron, and reinforced concrete. Polymeric materials are currently the most widely used in the manufacture of pipes.
However, special attention has been given to rubber-based products in the distribution network. Rubber belongs to the group of elastomers, which are polymers with high elasticity (elastic recovery, i.e., they almost always return to their original shape after undergoing large deformations), ductility (they can withstand large deformations without breaking), and flexibility [
12].
Elastomers are used in various applications, including O-rings, gaskets, flexible connectors, compensators, and pipe joints, within a water supply system. Nitrile rubber, styrene–butadiene rubber, and ethylene–propylene diene monomers are examples of synthetic elastomers that can be used in distribution systems. Natural elastomers include natural rubber, isoprene, neoprene, and polyurethane (PUR) [
12].
As potentially unsuitable materials can impact water quality, European Standards (EN) have been published that specify the tests to be carried out for each type of material. Since the migration of compounds and the oxidation of material surfaces can cause organoleptic changes and alter the safety of the water, it is necessary to control the materials used in the supply system to ensure the protection of human health [
13,
14].
Routine laboratory migration tests on organic materials can be used to assess the potential of the material to alter water characteristics such as odor, turbidity, color, and taste. They also determine the chemical constituents and assess the potential leaching of substances into the water, as well as the material’s ability to react with chlorine in the water [
15].
The approval of materials to be used in the distribution system, which may come into contact with water, is granted by the assessment of a dossier on the material in question, which demonstrates that tests have been carried out on the influence of the materials on water intended for human consumption, following European or national standards. The EN 12783-1 [
14] and EN 12873-2 [
13] standards have been adopted to assess the leaching of organic substances from non-metallic and cementitious materials used in the distribution network. These test standards have been accredited by the Portuguese Accreditation Institute (IPAC) and are routinely used in EPAL’s water analysis laboratory.
Typically, migration waters are analyzed by gas chromatography coupled to mass spectrometry (GC-MS) after liquid–liquid extraction (LLE) to assess organic materials or cementitious materials that contain an organic compound in their formulation [
16].
Over the years, legislation on supply systems and materials in contact with water intended for human consumption has been ambiguous and/or silent. Given the variety of products on the market, it is challenging to monitor and verify compliance with water quality parameters related to the migration of hazardous compounds [
2]. The documentation provided by suppliers is often challenging to assess, and in some cases, it is non-existent, inadequate, or unclear.
The first reference to substances or materials in contact with water intended for human consumption was in Article 10 of Directive 98/83/EC on the quality of water intended for human consumption [
17]. This article states that “Member States shall take the necessary measures to ensure that substances or materials used in new installations for the treatment and distribution of water intended for human consumption, or any impurities associated with such substances or materials, do not remain in that water in concentrations higher than those laid down in the Directive”.
The current European Water Quality Directive, Directive 2184/2020, Article 11, establishes the minimum hygiene requirements for materials and products in contact with water intended for human consumption. This article establishes deadlines for defining methods and procedures for testing and approving substances used in manufactured materials to be included in the European positive lists, as well as their conditions of use and migration limits [
2].
Organic materials must be subjected to tests analyzing various criteria, such as leaching of total organic carbon, organoleptic evaluation, the maximum tolerable concentration at the tap of substances on the positive lists, unexpected substances (by GC-MS), increased microbial growth, and the potential to reduce the concentration of chlorine used as a disinfectant in drinking water [
4].
Substances that are precursors to certain organic substances should be included in the European positive lists currently being developed by the European Chemicals Agency (ECHA). Where substances or their reaction products do not have a reference value, their concentration in drinking water must be less than 0.1 µg/L, in accordance with the precautionary principle [
4].
These requirements will take effect on 31 December 2026, for all materials and products that come into contact with drinking water in new installations or when existing installations are renovated in connection with the collection, treatment, storage, and distribution of water.
The aim is to make the consumption of tap water even safer and to reduce the bureaucratic burden of approving these types of materials and products, both for companies and national administrations, by harmonizing the criteria for assessing their suitability for contact with water intended for human consumption across Europe.
To date, no legislation, either at the EU or national level, defines the approval mechanisms for materials used in contact with water intended for human consumption to ensure that they do not affect water quality. However, some legislation lays down general provisions on this issue.
Since 1998, the European Commission has been discussing the implementation of a standard approval scheme for materials in contact with water intended for human consumption. The 4MSI (4 Member State Initiative) group, made up of 4 main members (UK, France, Germany and the Netherlands), tried to develop an outline for a European approval system.5 Its subgroup (SG-OM) developed several proposals that were submitted to the European Commission and used as a reference for a European authorization scheme in Directive 2020/2184 [
2]. The document produced by this group, entitled “Requirements and test methods for products made of organic materials in contact with drinking water—4MSI Draft Common Approach on Organic Materials—Part C”, has the main objective of developing data for the construction of the European approval scheme for materials in contact with water and describes the maximum tolerable limits of compounds that can be found after migration testing of materials used in drinking water distribution systems [
5].
The Drinking Water Directive requires that substances, compositions, and constituents used in materials that come into contact with drinking water be registered in one of the four positive lists. This ensures that water remains safe from the water source to the tap. These lists aim to create a harmonized framework across the EU, allowing the free movement of goods while ensuring that all materials in contact with drinking water are subject to the same high safety and quality standards.
On 23 April 2024, the EU Commission published six legal acts, three implementing decisions (EU 2024/365, EU 2024/367, EU 2024/368) [
18,
19,
20] and three delegated regulations (EU 2024/369, EU 2024/370, EU 2024/371) [
21,
22,
23] to supplement the Drinking Water Directive.
Considering the problematic nature of materials in contact with water, this work aims to characterize the leachates of a rubber material after exposure to demineralized water using LLE-GC/MS. The method is based on the migration procedure outlined in EN 12873-1 [
14] and extends the analysis of migration waters by determining several additional physicochemical parameters to characterize these migration waters better. This allows us to evaluate the contribution of organic or inorganic material to the movement of water and assess the significant change in drinking water properties. Therefore, a group of physicochemical parameters used in routine analysis (pH, turbidity, electrical conductivity, and color) was selected because it allows for a much faster, easier, and more reliable assessment of any changes in drinking water.
2. Materials and Methods
2.1. Reagents and Standards
Merck (Darmstadt, Germany) provided ten analytical grade deuterated standards (DS): benzene-d6, chlorobenzene-d5, p-xylene-d10, phenol-d5, naphthalene-d8, 1-methylnaphthalene-d10, 2,6-di-tert-butyl-4-methylphenol-d21 (BHT-d21), hexadecane-d34, phenanthrene-d10, and squalane-d62.
Ultrapure water was obtained from an ultrapure water system, Mili Q (Millipore, Burlington, MA, USA). Dichloromethane for trace analysis (RS-Atrasol, 99.95%) and acetone RS (RS Acetone—Pestipur) were provided by Carlo Erba (Cornaredo, Milan, Italy).
Individual DS stock solutions were prepared by dissolving each standard in acetone at several concentrations (8000 mg/L, 2000 mg/L, 1000 mg/L, and 400 mg/L). These solutions were stored in glass-stoppered bottles at −18 ± 5 °C in the absence of light. Intermediate solutions of DS were prepared in acetone at three concentration ranges: (i) 100 mg/L, (ii) 200 mg/L, and (iii) 800 mg/L. A working mixture solution of DS solutions was prepared by diluting each stock solution in acetone (spiking solutions) or dichloromethane (control standard solutions). These DS solutions were used as an internal standard (1-methylnaphthalene-d10) or as surrogates (all DS, except 1-methylnaphthalene-d10).
The sulphuric acid and sodium hydroxide from Supelco were used for liquid–liquid extraction (LLE). Migration studies were performed with demineralized water obtained by reverse osmosis, Elga Centra R200 (Veolia, Clichy, France).
2.2. Rubber Material
The rubber used in the water supply system has been selected and subjected to migration tests (
Table 1). The amount of material used for each test depends on the surface-to-volume ratio (S/V) of each material. This study adopted two S/V, 5 and 10.
2.3. Migration Assays
The migration tests, which follow the requirements of EN 12873-1, were carried out over 29 days using demineralized water [
14]. The blank assay was also analyzed under the same conditions as the material migration tests.
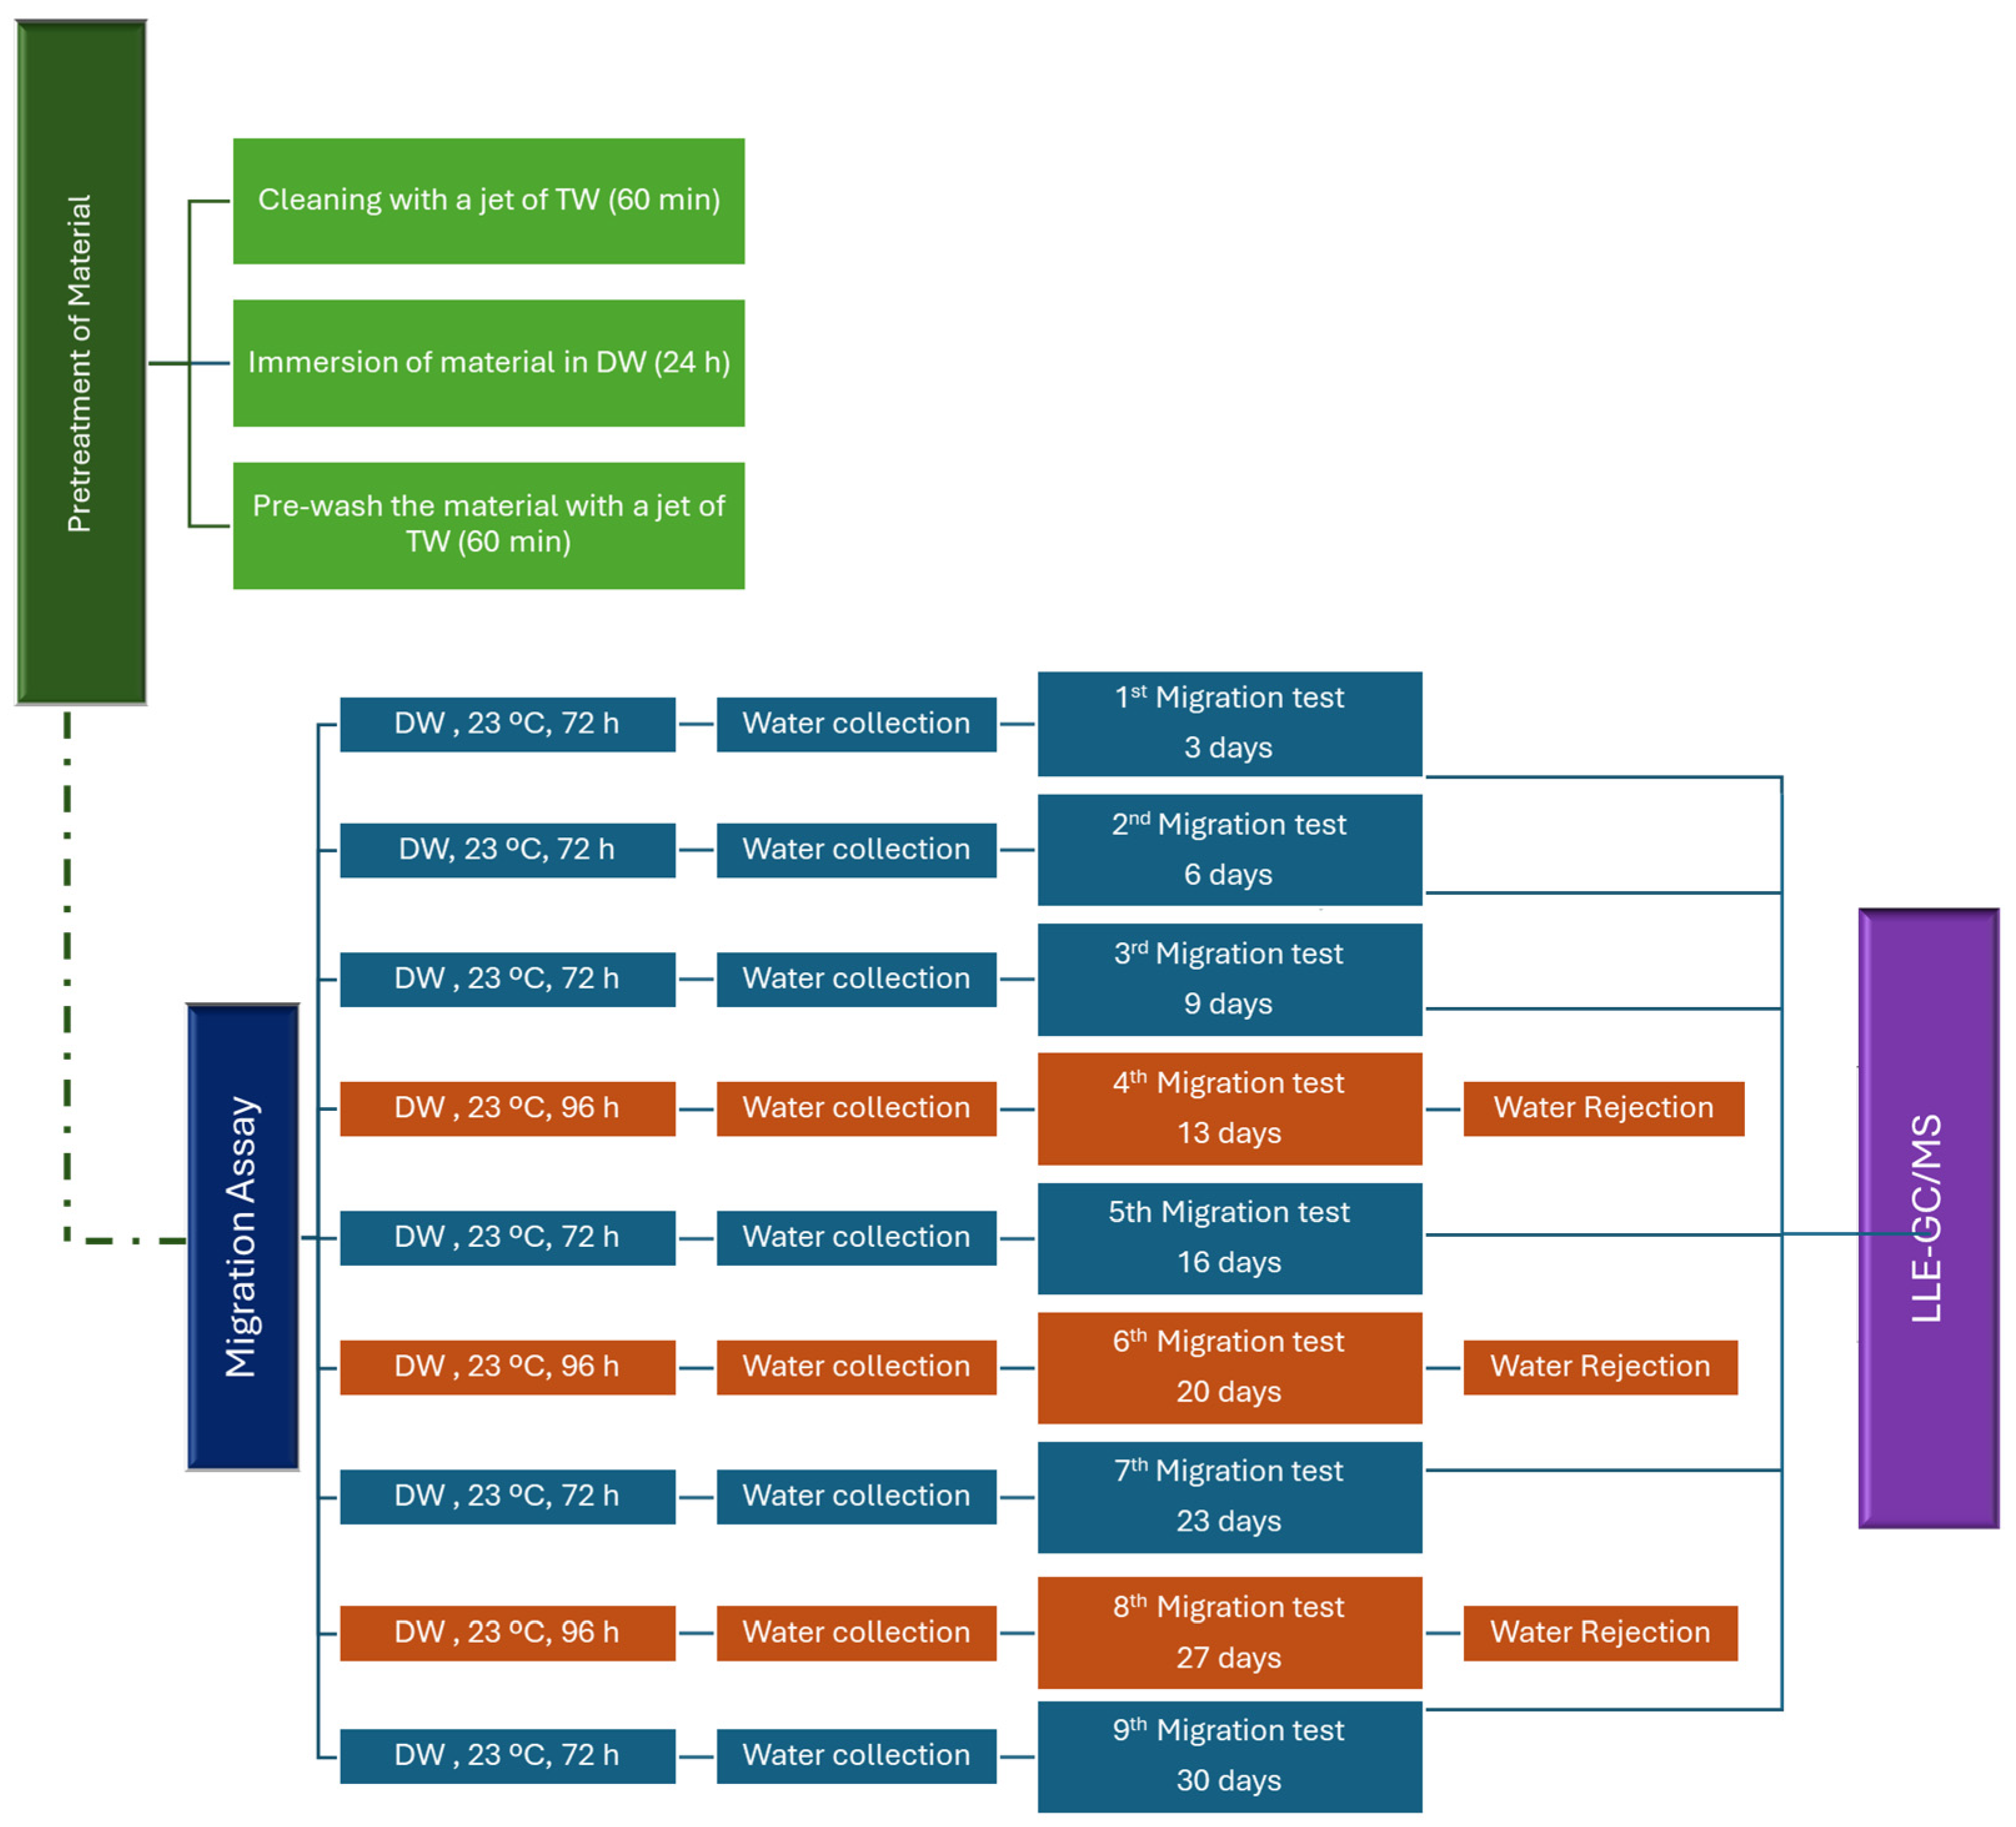
The migration tests were conducted over 29 days, including one day of pre-treatment and 28 days of the procedure. These were followed by a screening analysis of unexpected substances by a semi-quantitative method (SQM) (
Figure 1). Two replicates were performed for each migration test.
The tests included a pre-treatment phase consisting of cleaning the materials with a jet of tap water (TW) for 60 min, followed by immersion in demineralized water (DW) for 24 h. After this treatment, the immersion water was discarded, and the materials were again cleaned with a jet of tap water for 60 min. After pre-treatment, the migration test involved immersing the materials in the test water at 23 °C for 72 h. At the end of these three days, the migration water was collected and analyzed by LLE-GC-MS (1st migration). A further eight migration procedures were carried out at 3 to 4-day intervals, after which the demineralized water was replaced. Migration waters of days 6, 9, 16, 23, and 30 were analyzed by LLE-GC-MS (considered as 2nd, 3rd, 5th, 7th, and 9th migration waters). The migration waters of days 13, 20, and 27 were discarded (4th, 6th, and 8th migration waters) as defined in EN 12873-1 [
14].
The concentration of the unexpected substances in the migration waters was obtained from Equation (1), where
is the concentration of the substance leached from the material, expressed in mg/L (or µg/L),
is the concentration of the substance measured in the migration water, expressed in mg/L (or µg/L), and
is the concentration of the substance measured in the blank test, expressed in mg/L (or µg/L).
The migration rate of a given substance (
—measured in mg dm
−2 d
−1 (or µg dm
−2 d
−1)) in the migration water is calculated from its concentration in that water, according to Equation (2):
where
t is the duration of the migration test, expressed in days (3 days in the performed test), and
S/
V is the surface area/volume ratio, expressed in dm
−1. The estimated concentration at the consumer tap (
CTap) was determined using the migration rate from the 3rd migration test and the conversion factor (
CF) of each material, according to Equation (3).
The
CTap should be compared with the maximum tolerable concentration at the tap (
MTCTap).
CTap ≤
MTCTap at the 3rd migration period (10th day of testing) or, if extended testing is required, at the 9th migration period (31st day of testing) [
18].
The
MTCTap for unexpected substances shows different values for identified substances with a known
MTCTap and unexpected substances without a known
MTCTap. For the first one, the value is the
MTCTap of the substance, and for the second one, the
MTCTap is 1.0 µg/L. For the unidentified substances, designed as unknowns, the
MTCTap is 1.0 µg/L for individual substances and 5.0 μg/L for the sum of the unidentified substances [
18].
In water supply systems, rubber is a minor component of fittings and ancillaries, accounting for less than 1% of the assembled product (i.e., joints and gaskets). For components with an internal diameter of less than 80 mm (domestic, building) or between 80 mm and 300 mm (service pipes), the CF is 0.02 and 0.01, respectively [
18].
2.4. Analysis by LLE-GC-MS
The potential organic contaminants (POC) from migration waters were extracted using liquid–liquid extraction (LLE).
The extraction material (borosilicate glass separating funnels and Turbovap tubes) was pre-rinsed with dichloromethane. 500 mL of water samples (migration waters) were transferred to a glass separating funnel and acidified with 3 mL of sulfuric acid (0.5 mol/L). This sample was spiked with 100 µL of DS spiking solution. 50 mL of dichloromethane was added, and the water sample was shaken vigorously for 3 min. After the separation of the phases, the organic layer was collected in the Turbovap tube. One more extraction was carried out in an acidic medium. 6 mL of sodium hydroxide solution (0.5 mol/L) was added to the aqueous phase, and the extraction was repeated with 50 mL of dichloromethane. A second extraction was carried out under alkaline conditions. Around 200 mL of organic extract was collected in these four extractions [
16].
The organic extract was concentrated to 0.5 mL in the TurboVap evaporation system (Biotage, Uppsala, Sweden) at 28 °C and with a nitrogen (99.9995%) flow (99.9995%) of 0.2 bar. It was then diluted to 0.5 mL with dichloromethane, giving a concentration factor of 1000. The final extracts were stored in 2 mL vials for chromatographic analysis.
The quantification of organic compounds in the samples (migration waters) was performed by gas chromatography–mass spectrometry (GC-MS) using equipment from Agilent Technologies, 7890 B GC-5977 A MS with a 7693 autosampler and an HP-5MS (5% phenyl-methylpolysiloxane) column, 60 m × 0.250 mm × 0.25 µm, manufactured by Agilent J&W Columns. The GC–MS parameters were as follows: injection volume was 1 µL; injection temperature was 250 °C; a purge flow to split vent of 25 mL/min, with a splitless time of 1.5 min. The initial oven temperature was set to 33 °C for 6 min, ramped to 85 °C at 4 °C/min, and then held for 2 min. A second ramp to 300 °C, at 10 °C/min, was held for 25 min. The carrier gas (helium) flow rate was set to 1 mL/min, and the transfer line temperature was set to 280 °C. The mass spectrometer was scanned from m/z 20 to 650 after a solvent delay of 8.0 min. The source and quadrupole temperatures were 200 °C and 150 °C, respectively. The chromatographic run is completed in 67.5 min.
The equipment uses two software programs, one for quantitative analysis and a second for qualitative analysis: Agilent MassHunter workstation software—Quantitative Analysis, Agilent version B.07.00/Built 7.0.7045 and Agilent MassHunter workstation software—Qualitative Analysis, Agilent version B.07.7024 (Agilent Technologies; Santa Clara, CA, USA).
The automated data processing workflow included automatic peak detection, deconvolution, library searches for compound identification and calculation of estimated concentration. The method used for this data processing included predetermined parameters and thresholds, such as signal-to-noise ratio (S/N), peak detection limits, deconvolution, library search criteria, and compound identification and target match criteria.
When searching for POC (unexpected and unknown substances) in samples in full scan mode, analyte identification can be achieved by comparing the mass spectrum obtained for the analyte in the sample with the instrument’s mass spectrum library (NIST 2011 Mass Spectral Library). The mass spectral data are analyzed against the entire mass spectrum library, and three numbers are calculated for each compound. The three numbers are: Match Factor (Match), Reverse Match Factor (R. Match), and Probability (%). The identification of the analyte is based on the probability calculated by the software, considering the correct identification of the analyte with a match and reverse match greater than 700, and probabilities greater than 50%. The general guidelines suggested by NIST for Match Factor scores are as follows: a score of >900 is considered an excellent match, 800–900 is a good match, 700–800 is a fair match, and a score of <600 is a poor match [
24,
25]. For isomeric compounds, if the match and reverse match are greater than 800 (excellent), probabilities between 30% and 50% are acceptable.
The quantification of each POC is performed by comparing its response with the appropriate internal standard as follows:
- i.
Compounds with retention times between d6-benzene and d8-naphthalene are quantified against the internal standard d5-chlorobenzene;
- ii.
Compounds eluted between d8-naphthalene and d34-hexadecane are quantified against the internal standard d21-BHT;
- iii.
Compounds eluted after d34-hexadecane are quantified against the internal standard d10-phenanthrene.
The concentration of each compound identified in the sample is given by Equation (4):
where
APOC is the peak area of any POC in the sample;
CIS is the concentration of the internal standard in the extract (mg/L);
AIS is the peak area of the internal standard in the sample;
VS is the volume of water sample used in the extraction, mL; and
Ve is the volume of organic extract after concentration, mL.
In the migration assays, this concentration represents the (Equation (1)).
2.5. Workflow of Rubber Migration Studies
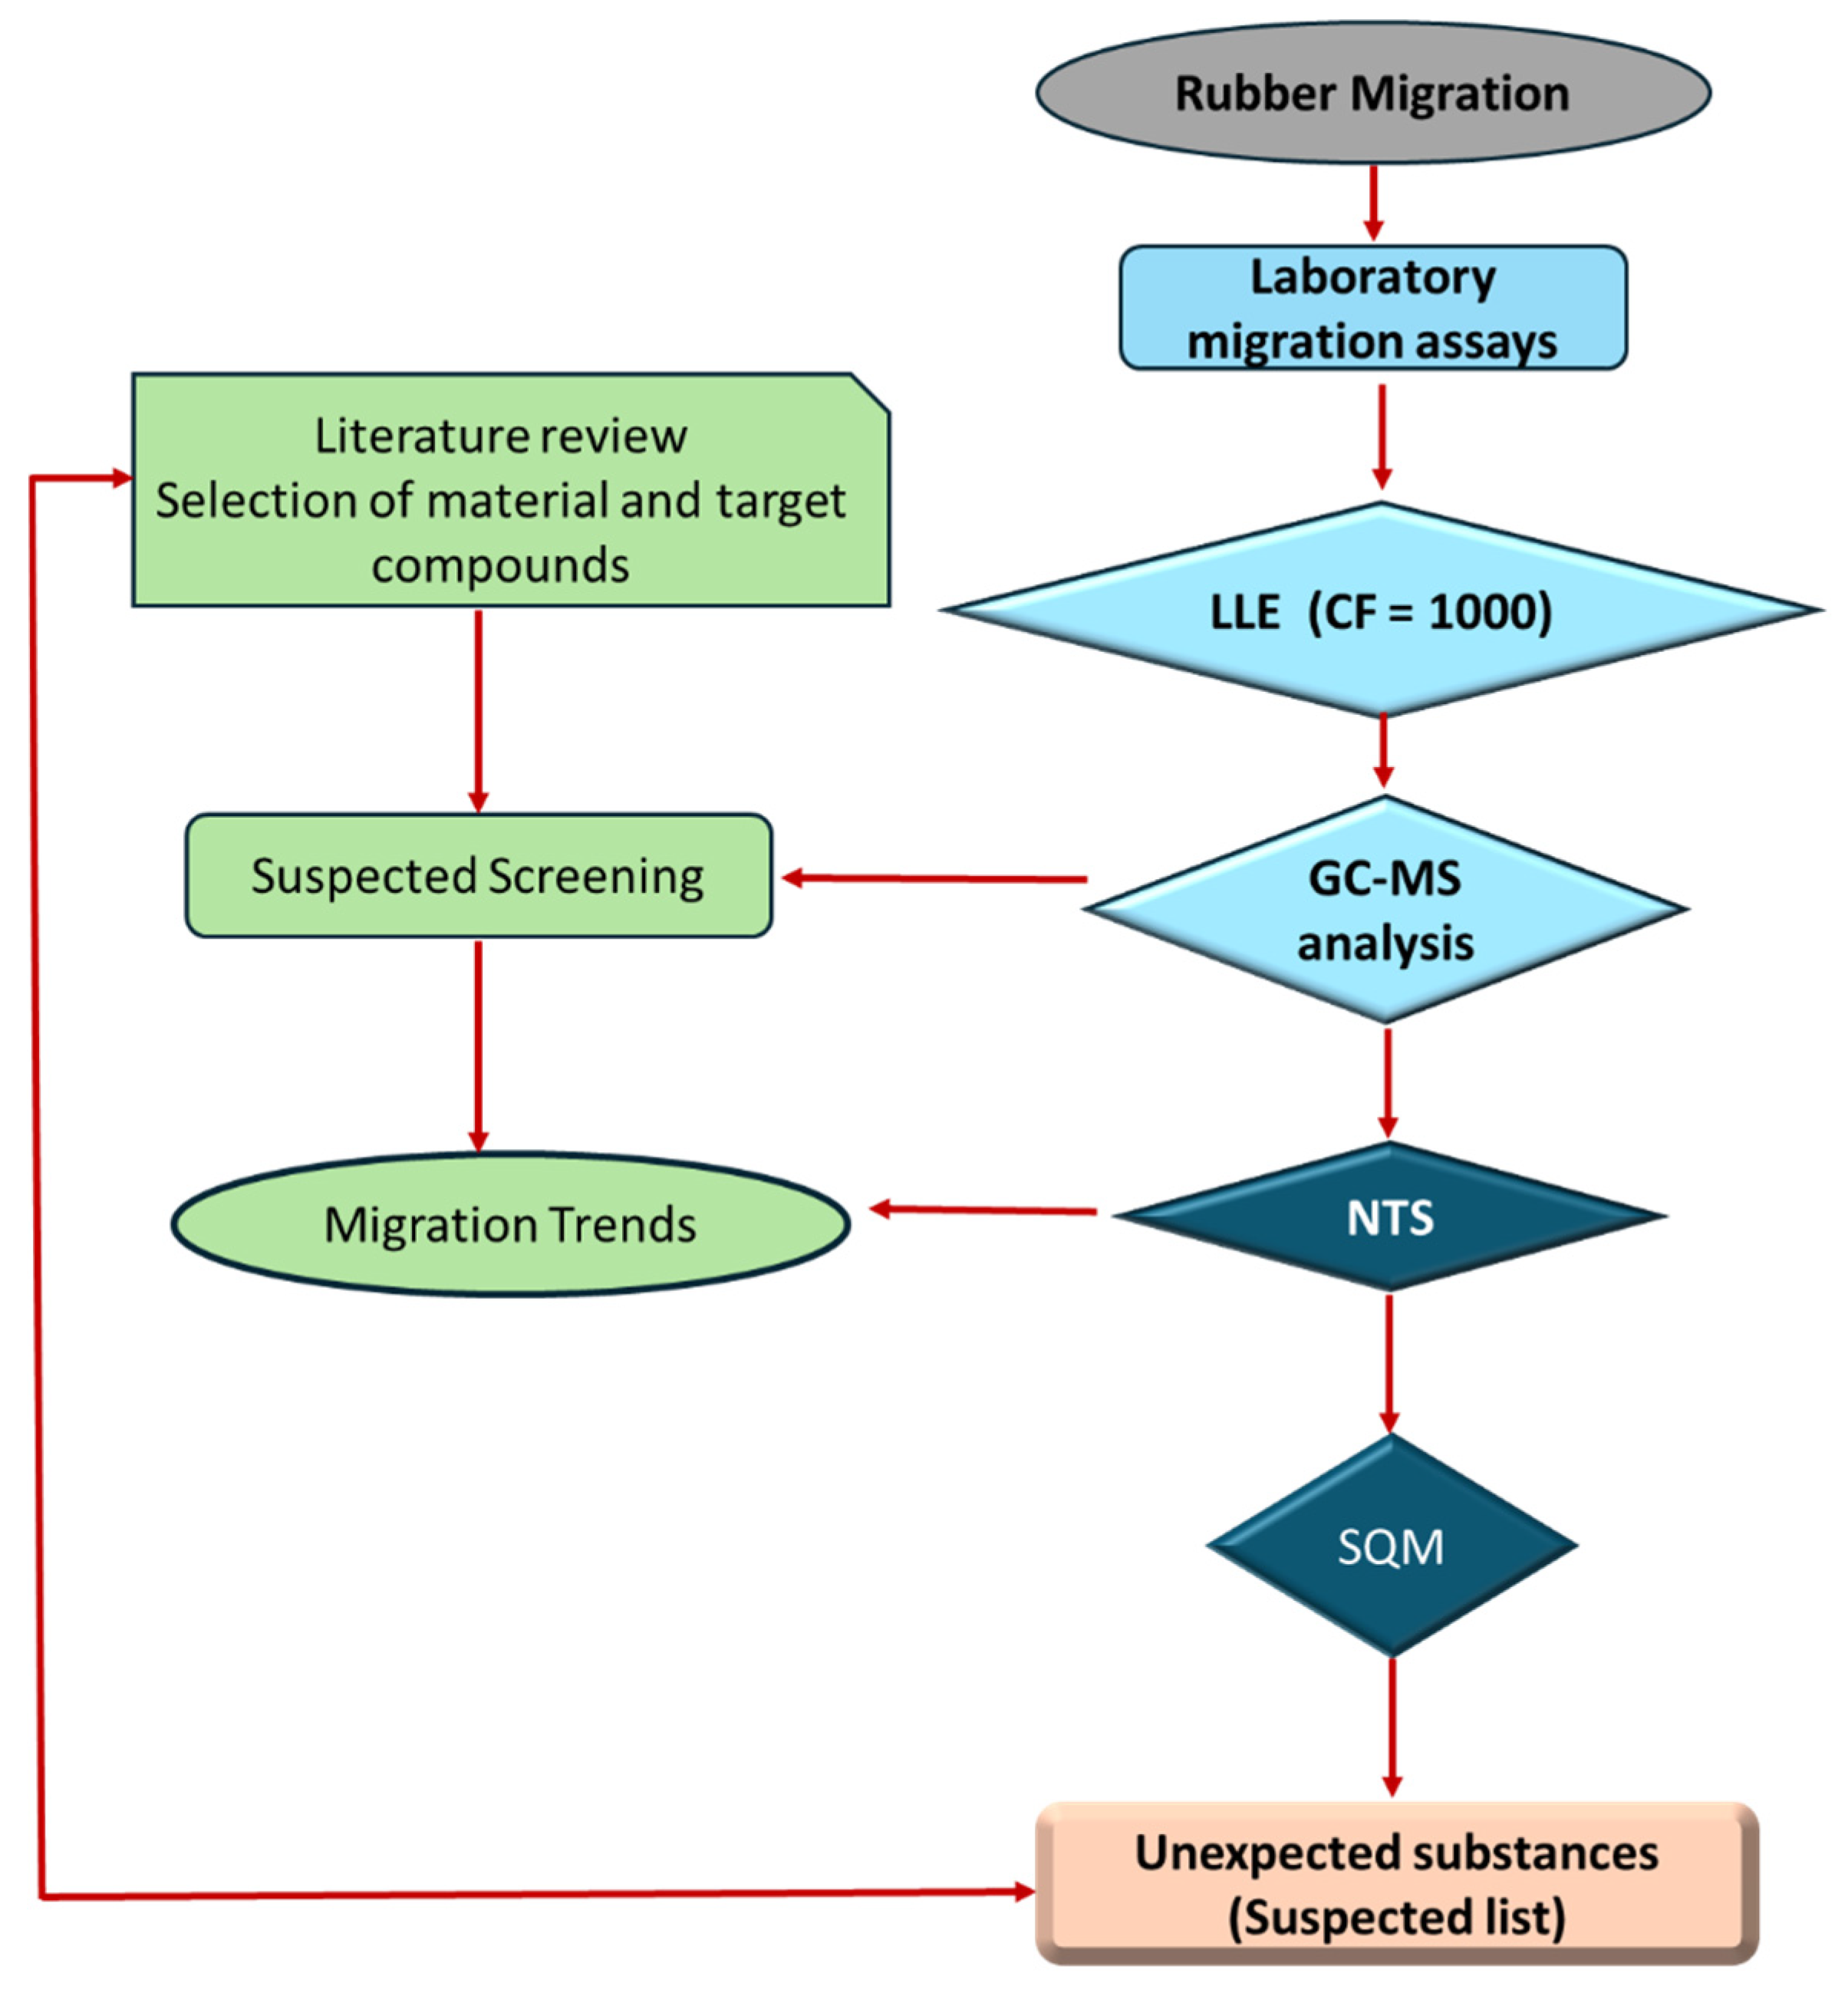
The study began with a comprehensive review of existing studies on rubber migration in water to select the best available laboratory method for identifying unexpected organic substances, the main target compounds, and the main migration of organic compounds from rubber, with the aim of future application of a target analysis (quantitative method). The rubber material of interest was selected based on its importance to the intended application, as determined through a literature review.
Figure 2 shows the workflow for rubber migration studies.
2.6. Migration Water Assays
The migration waters were also characterized by pH, turbidity, electrical conductivity, color, and oxidation–reduction potential (ORP).
The pH was measured using a pH meter, Crison, model micropH 2002 (Barcelona, Spain) with a glass electrode (Crison, Barcelona, Spain). It was calibrated and checked using pH standards (pH 4, pH 7, pH 6 and pH 9) supplied by Crison (Barcelona, Spain).
Turbidity was measured using nephelometry with Eutech TN-100/T-100 equipment, supplied by Eutech Instruments (Thermo Fisher Scientific Inc., Waltham, MA, USA). The equipment was calibrated and checked using several formazin turbidity standards (0.02, 20, 100, and 800 UNT) supplied by Eutech.
Electrical conductivity was determined with a CyberScan CON 200, supplied by Eutech Instruments (Thermo Fisher Scientific Inc.), and the calibration and control of the equipment were performed using several conductivity standards (84, 147, 1413, and 12,880 μS cm−1, 25 °C) supplied by Reagecon (Shannon, Co. Clare, Ireland).
The redox potential was measured using a potentiometer, Crison, model micropH 2002 (Barcelona, Spain), with an ORP electrode supplied by Eutech Instruments (Thermo Fisher Scientific Inc.). An ORP standard control of 220 mV was used.
A Hitachi U-2000 UV-VIS spectrophotometer (Tokyo, Japan) was used to quantify color at 456 nm with six platinum–cobalt (Pt-Co) standard solutions (SMEWW 2120 C) [
26].
2.7. Quality Control and Quality Assurance
All the glassware was left at 55 °C overnight before use. For quality and assurance purposes, at least one blank sample (BS), one duplicate (DD), one control standard (column test solution), and one recovery assay (REC) were performed for each sample batch (daily analysis and chromatographic run). The efficiency of the extraction procedure was evaluated by comparing the peak areas of the internal standards d8-naphthalene, d10-phenanthrene, and d62-squalane obtained in the GC column test solution with those in the extracts. The recovery of these three internal standards in the extracts should be greater than 50%.
To assess the efficiency of the concentration step for the extracts in the turbovap, the response of the most volatile standard (d6-benzene) should be evaluated to ensure that the losses of this compound during the concentration step do not exceed 70%. Therefore, the recovery should be higher than 30%.
If any of the internal standards are missing from the chromatogram or if the recoveries of the internal standards d8-naphthalene, d10-phenanthrene, and d62-squalane are less than 50%, the sample extraction step has not been carried out correctly, or the GC-MS is not working properly. The procedure was therefore repeated.
In the turbovap blank test, if the loss of d6-benzene is greater than 70%, the extract concentration step has not been carried out correctly, or the GC-MS is not functioning properly.
The mean value of the duplicate samples should be less than 25%. If this criterion is met, the reported value is the mean of the duplicates. If not, the highest value of these duplicates is reported.
The independent GC column test solution (control standard solution) must differ by less than 20% from the GC column test solution (for deuterated standards used in the semi-quantitative method).
3. Results and Discussion
3.1. Characterization of Migration Waters
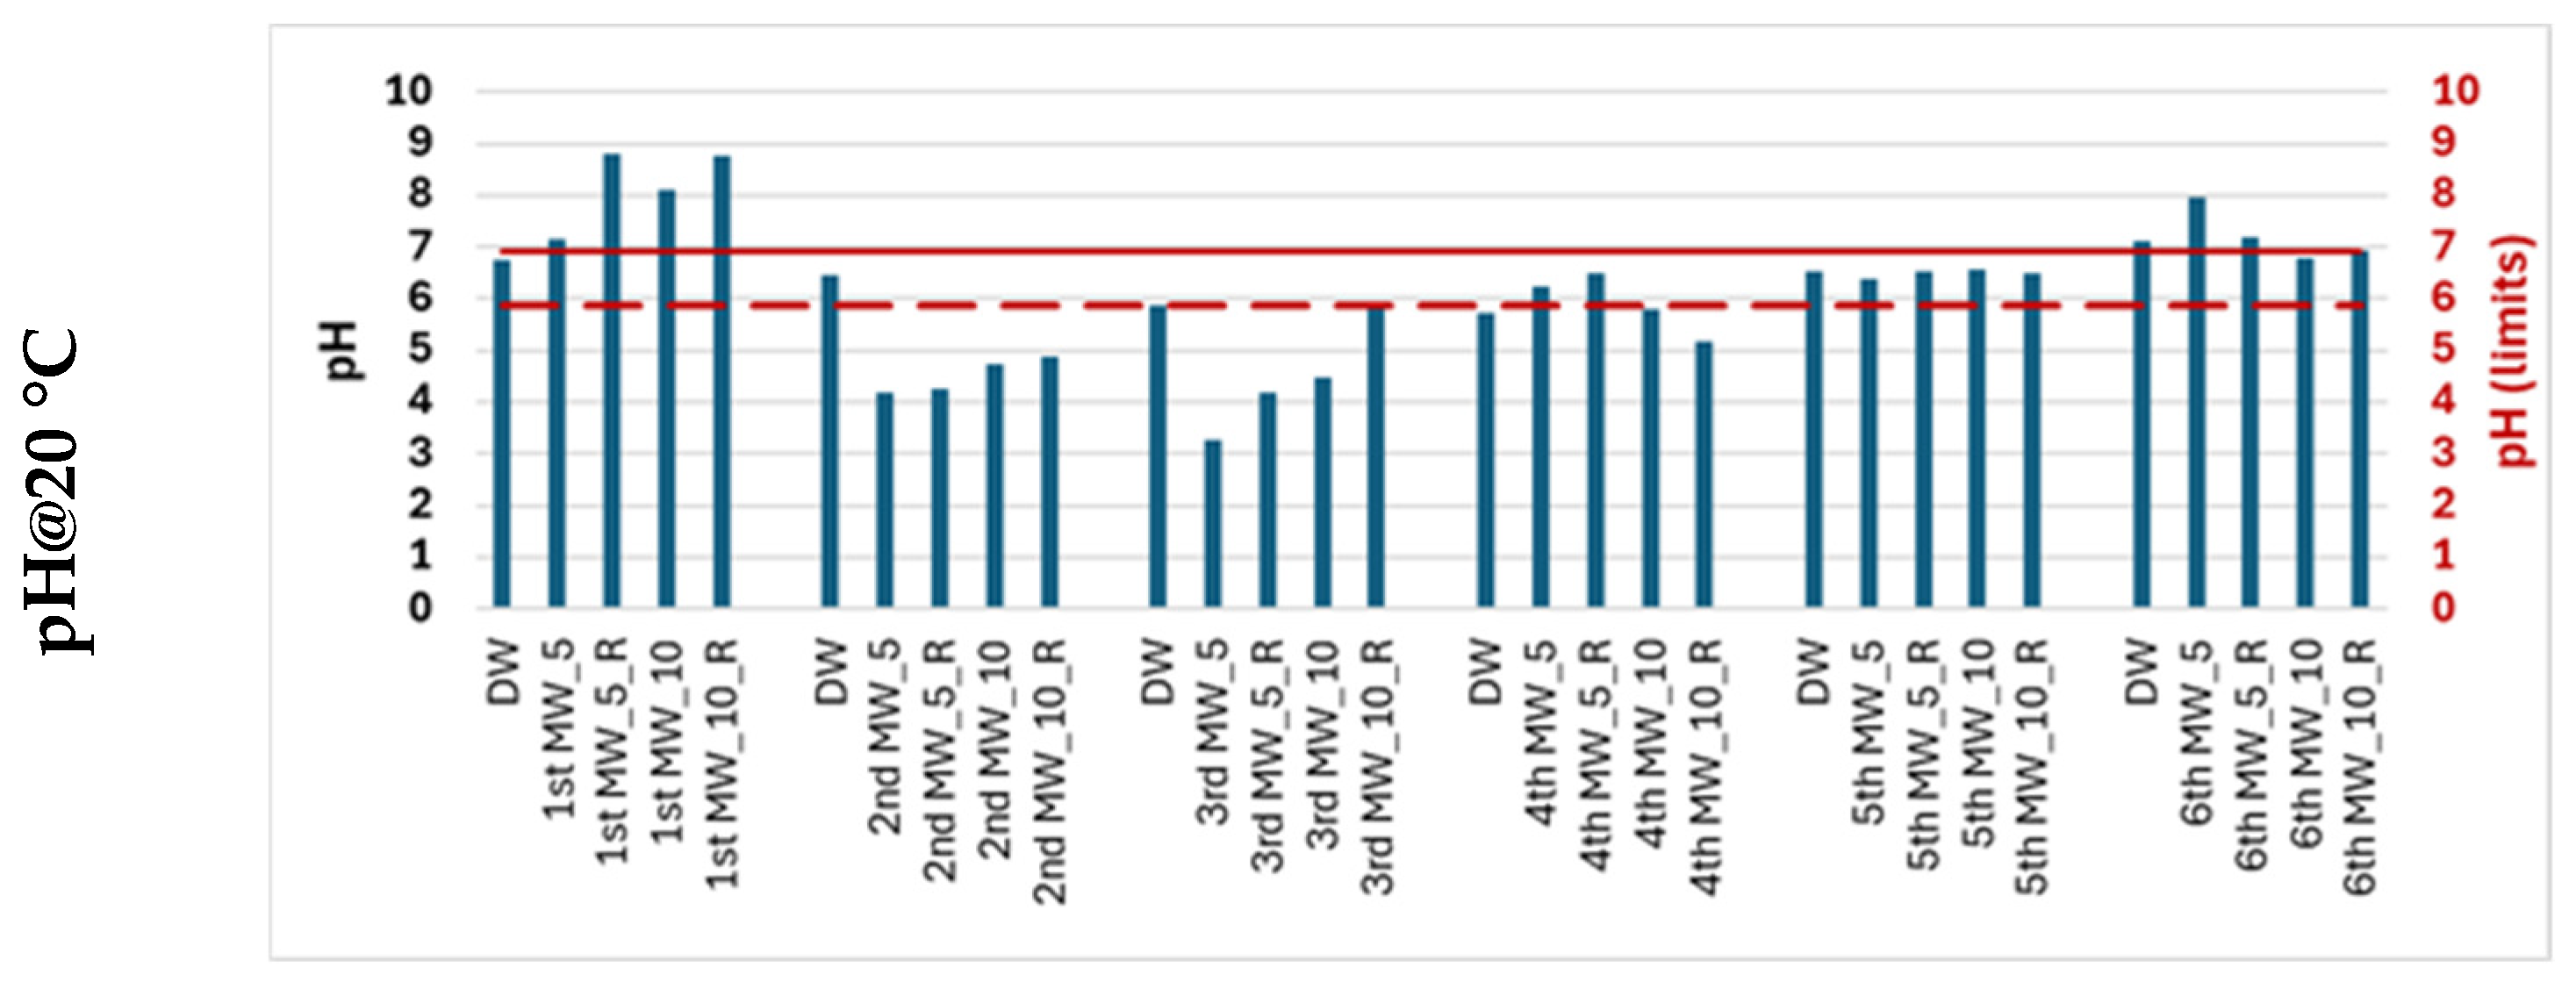
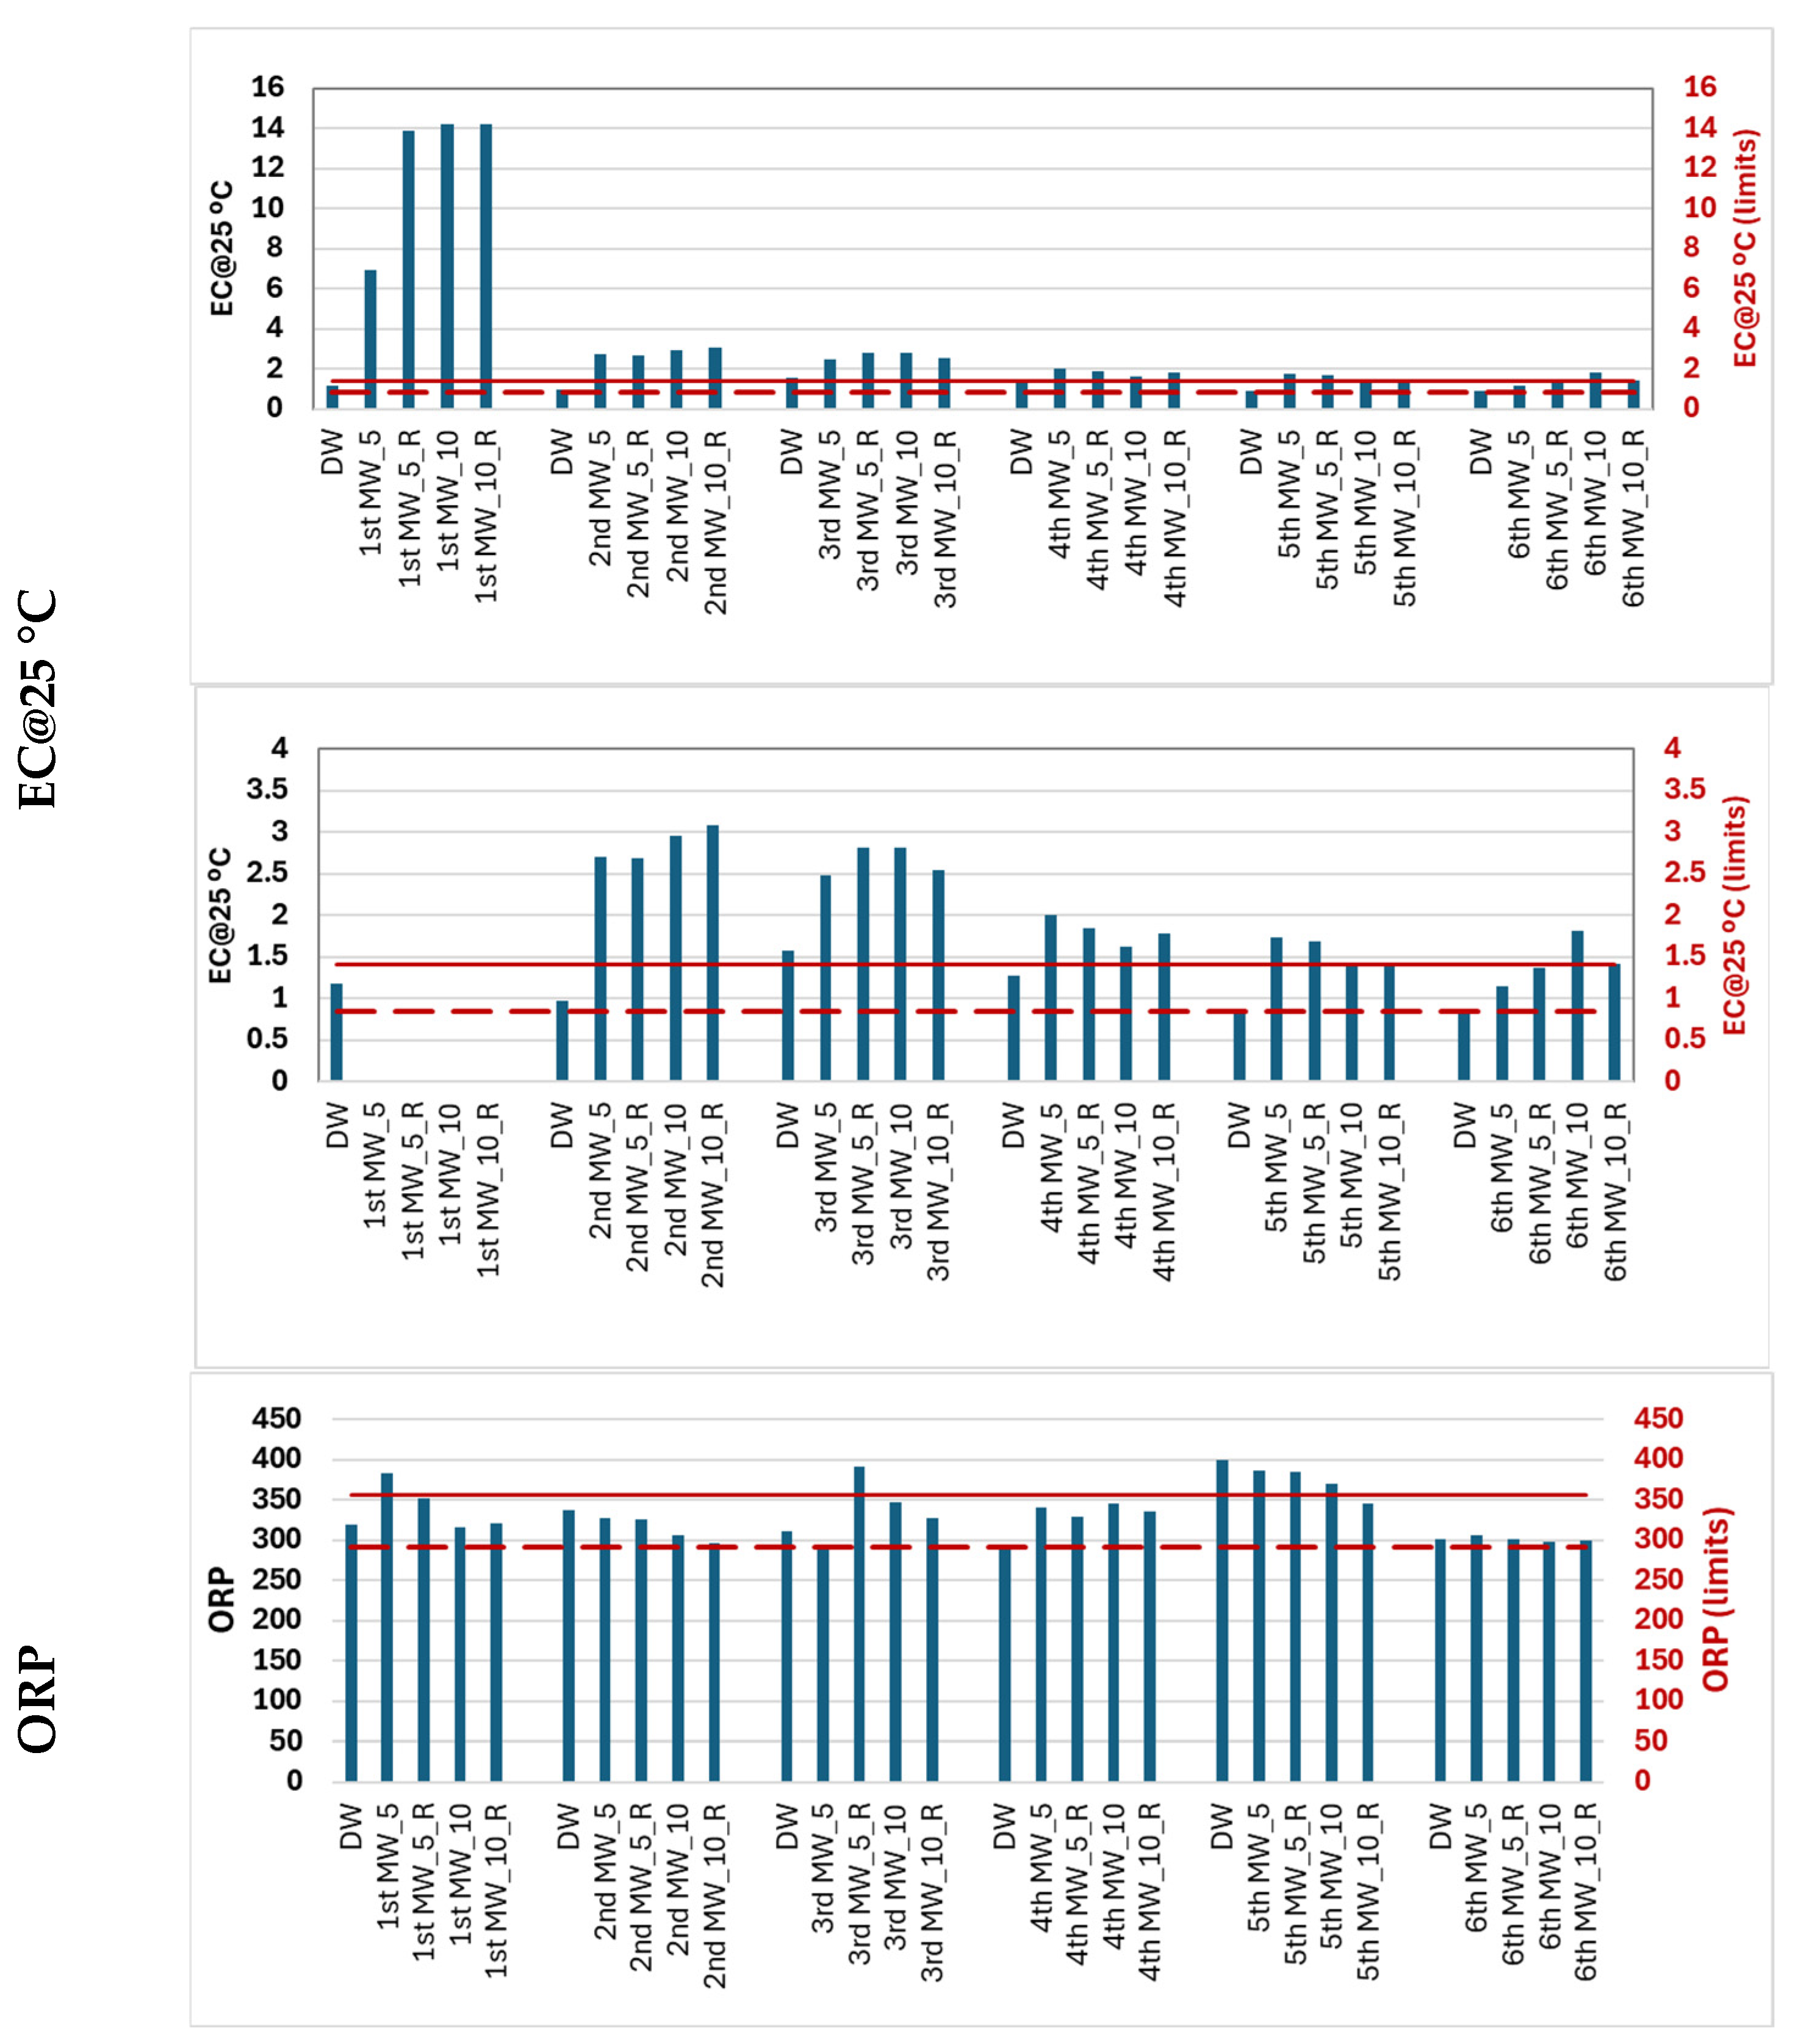
Due to the simplicity of the potentiometric, turbidimetric and spectrophotometric methods, five water quality parameters were used to characterize migration waters over the one-month migration period. Demineralized water (DW) was analyzed simultaneously during each migration period. The average (Avg) and standard deviation (SD) of the values obtained for each water quality parameter were determined. The Avg ± SD was used to define the maximum (___) and minimum (---) acceptable limits to ensure that there are no significant differences in water quality due to water exposure to the rubber material.
Figure 3 shows the quality profile of the migration water.
There was no change in the turbidity or color of the migration water throughout the tests. All values were below the respective analytical thresholds (TUR < 0.26 UNT and color < 2.5 mg/L Pt/Co). Consequently, these parameters are not good indicators of the quality of the migration water.
The DW used on the different days of the migration tests had a pH of 6.41 ± 0.52. The average pH of the migration waters varied between 4.5 (2nd and 3rd migration) and 8.2 (1st migration). There were statistically significant differences between the pH values of the different migration waters (p < 0.05). The second and third migration waters have lower pH values (acidic), and the first migration waters have higher pH values (alkaline). The increase or decrease in pH is associated with the acidic or basic nature of the substances that are leached from the rubber material. According to the migration tests, alkaline substances are leached in the first phase, followed by acidic substances, and then alkaline substances again. This behavior is similar in both replicates and for both S/V ratios. Among the group of alkaline substances and in agreement with the identified substances, organic compounds containing amines stand out. The acidic nature of the leached compounds may result from hydrolysis or oxidation of rubber components, leading to the formation of carboxylic acids, phenolic acids, or sulfur-based acidic species.
The DW had an EC of 1.13 ± 0.28 µS/cm at 25 °C on the different days of the migration tests. The average EC of the migration waters ranged from 1.4 µS/cm @ 25 °C (6th migration) to 12.3 µS/cm @ 25 °C (1st migration). There were statistically significant differences between the EC values of the different migration waters (p < 0.05).
The EC of the 1st migration water is 4 times higher than the conductivity of the other migration waters. As observed for pH, the EC values for the 2nd and 3rd migration waters are significantly different from the remaining waters.
The oxidation–reduction potential (ORP) of DW was 323 ± 32 mV. Although the ORP changes in the migratory waters were not as pronounced (302–372 mV), they were statistically significant (p < 0.05). The ORP of the 5th migration water was higher than that of the other migration waters.
Although there were significant changes in the pH, EC, and ORP of some migration waters, the values were not sufficiently different from those of demineralized water to meet the requirements of the parametric values for drinking water. Therefore, these changes alone are not an indication of a change in water quality.
3.2. Visual Inspection of Chromatograms from Migration Studies
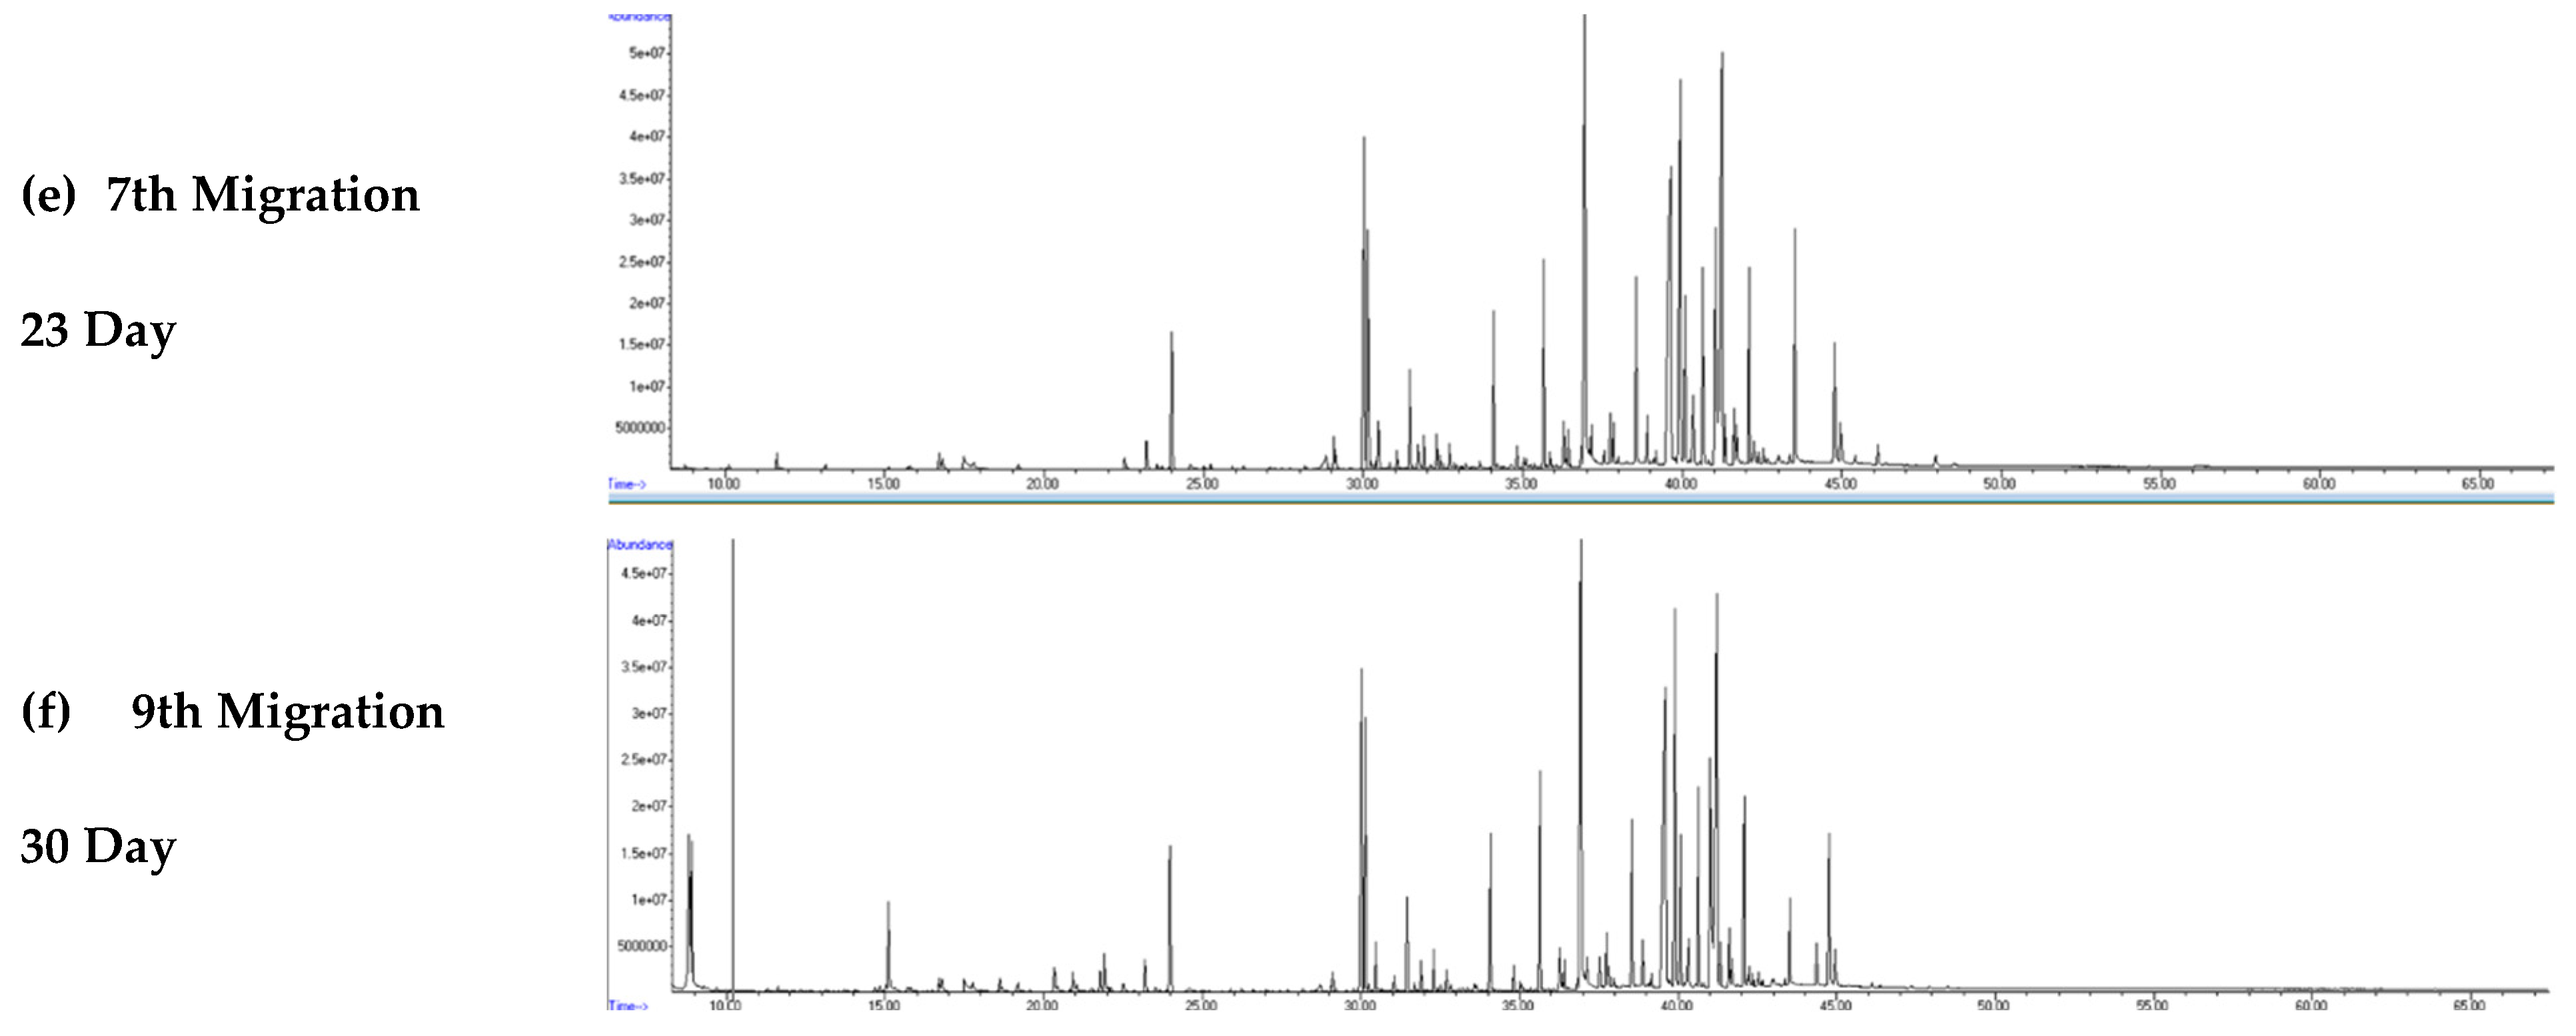
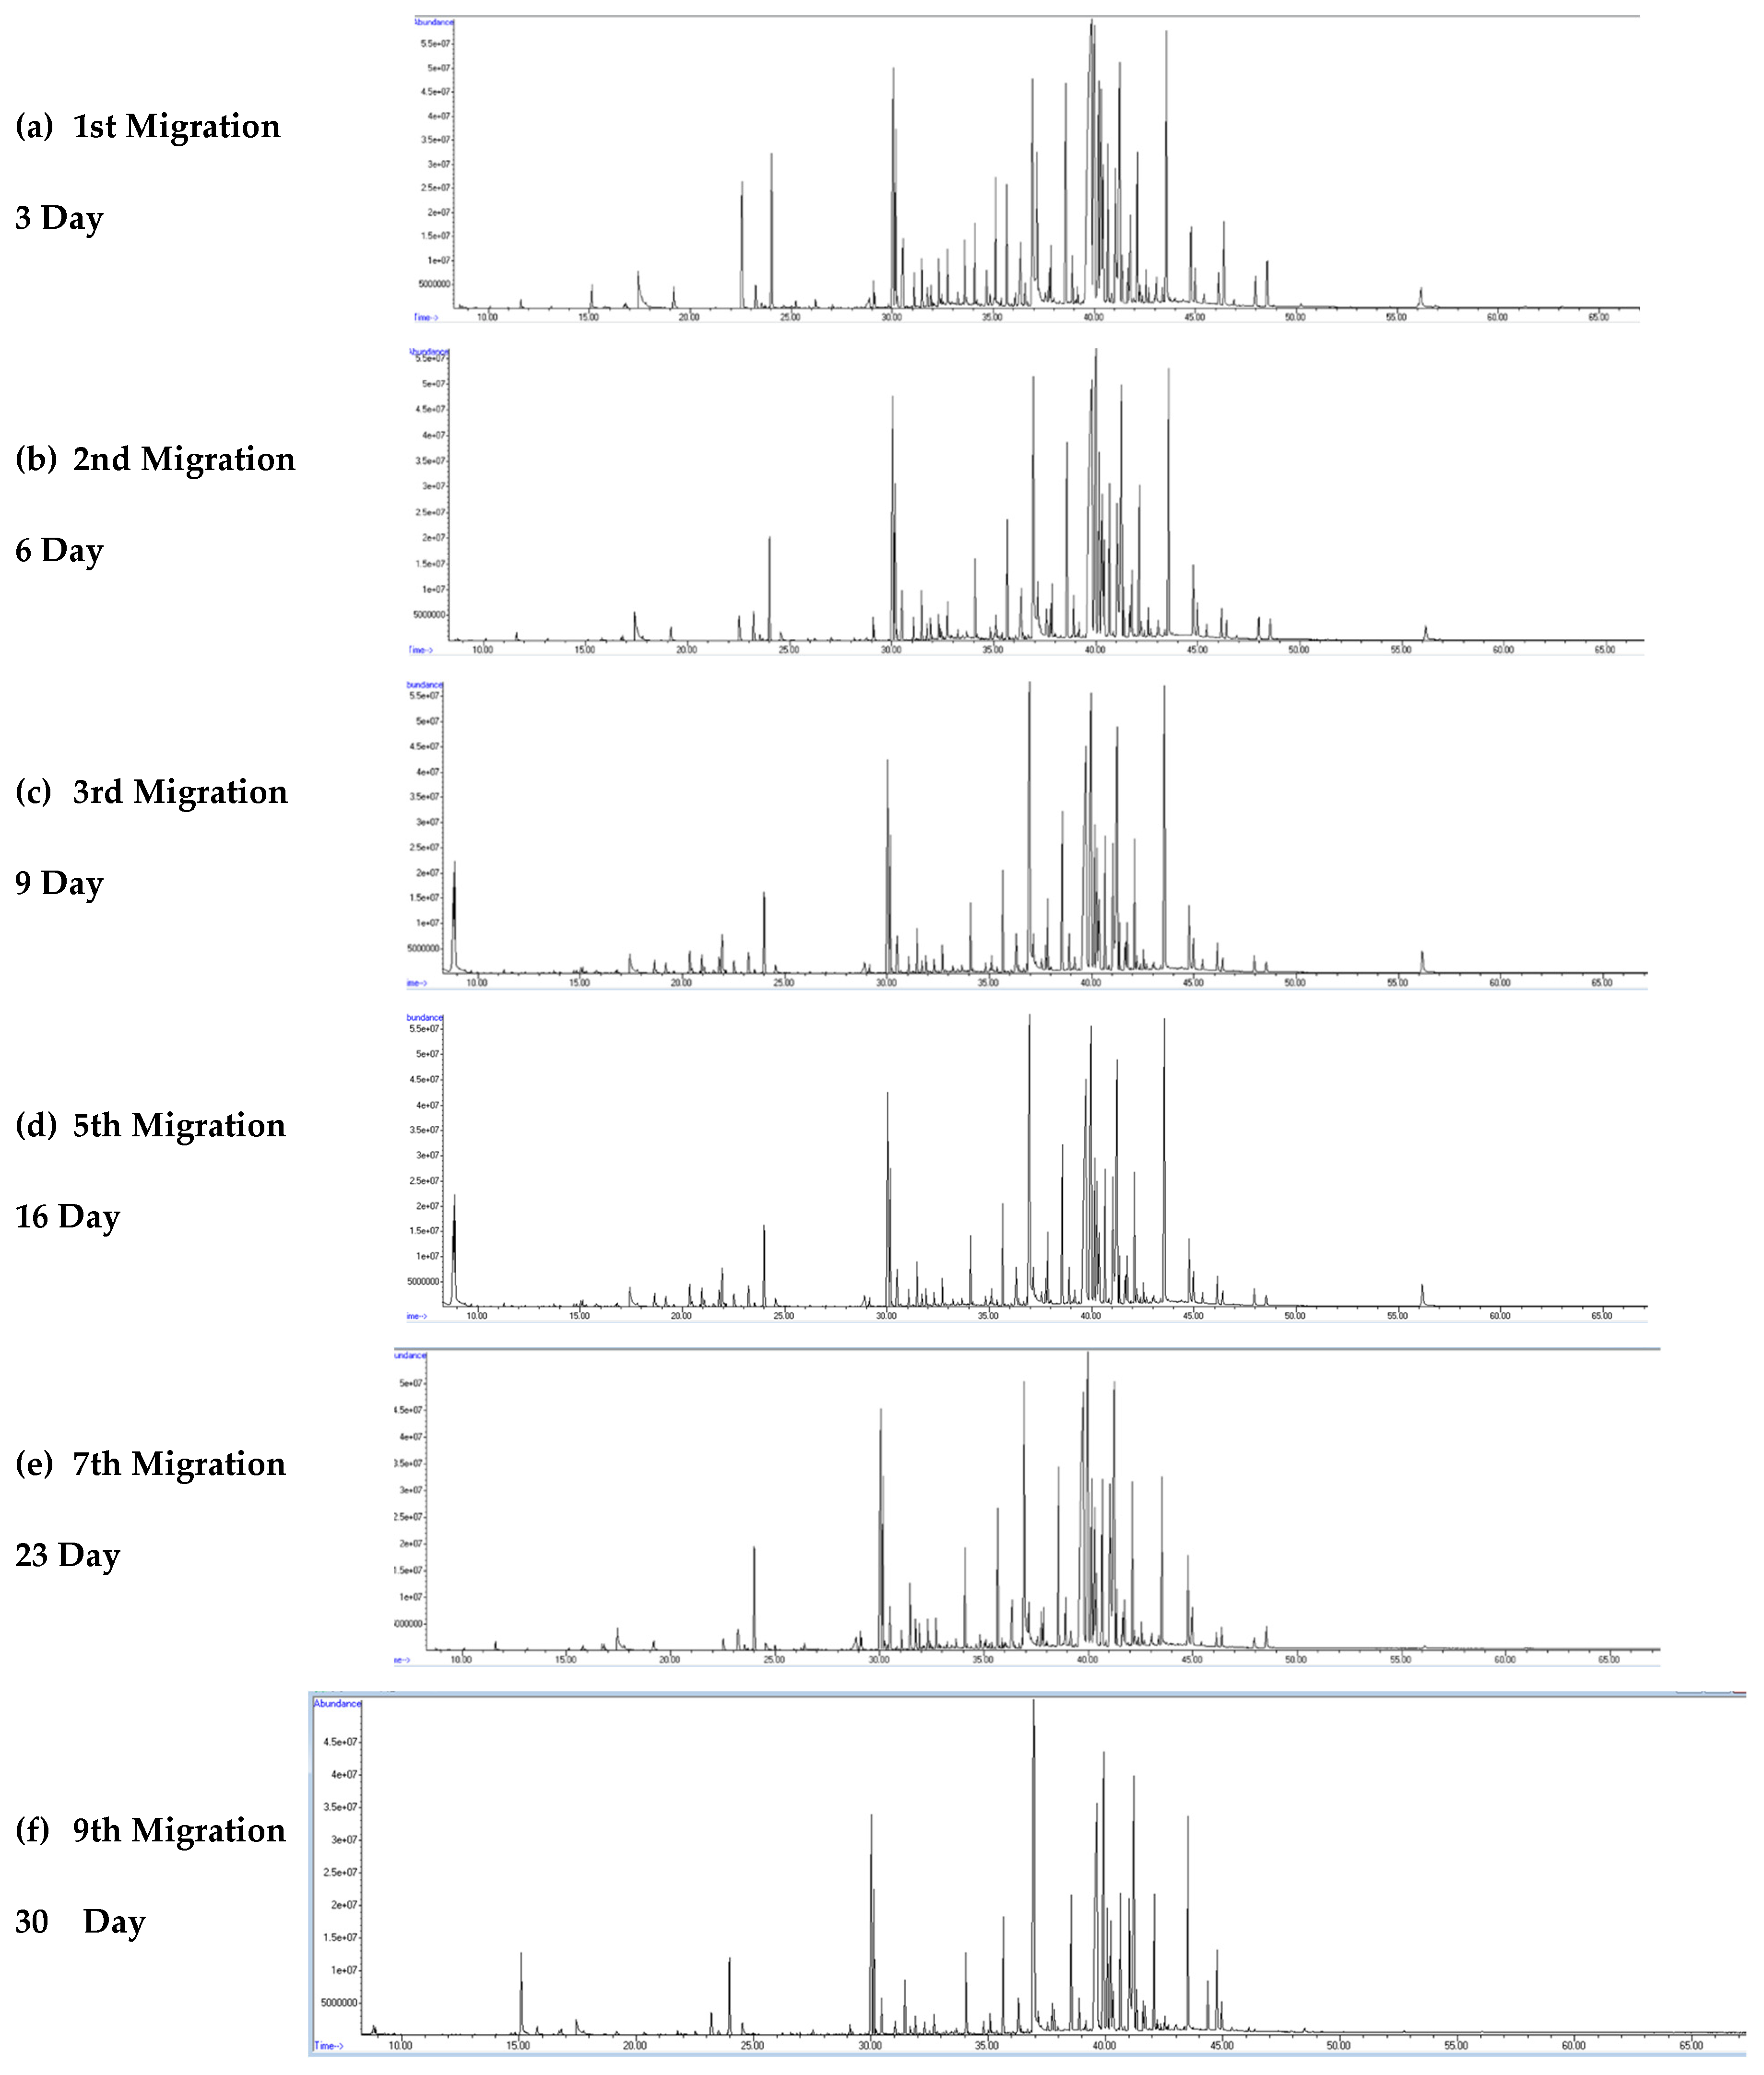
Figure 4a–f and
Figure 5a–f show the GC–MS total ion chromatograms (TICs) of the migration water samples for all migration periods, namely, 3, 6, 9, 16, 23, and 30 days for the rubber material at S/V = 5 and S/V = 10, respectively.
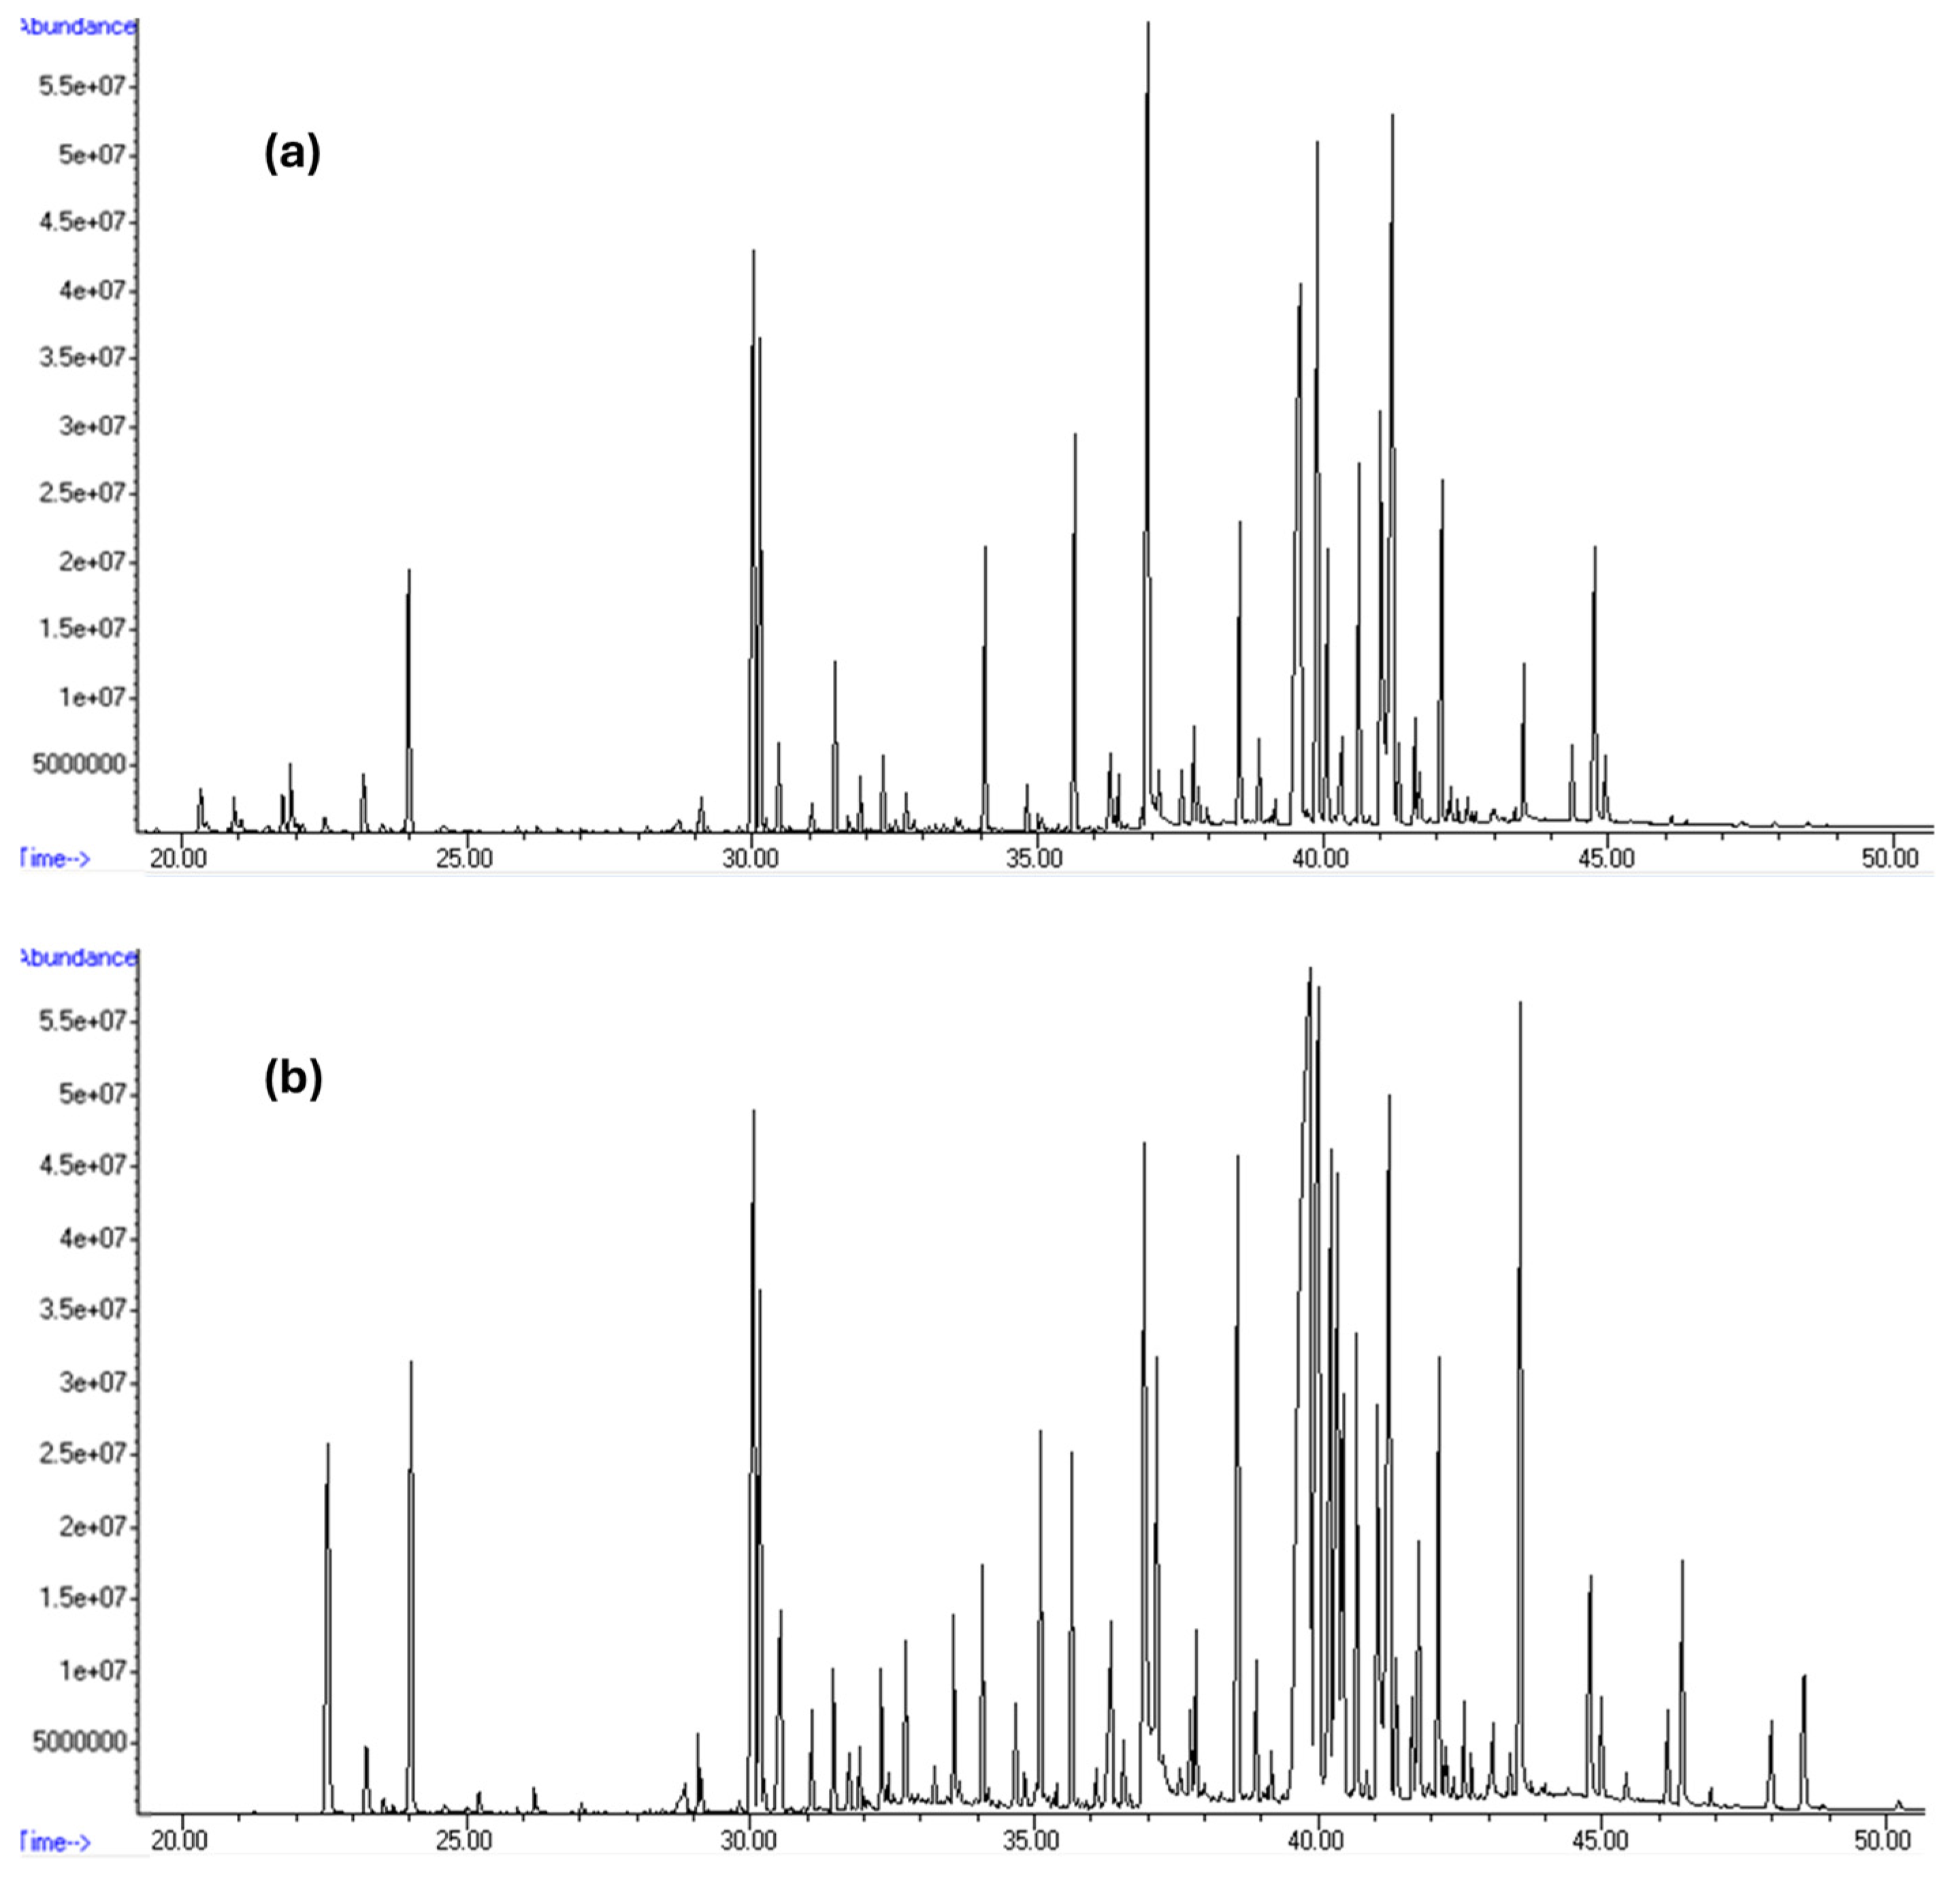
The rubber leachates (migration waters) contain many organic compounds, as indicated by the high number of chromatographic peaks observed throughout the various migration tests. The intensity and diversity of these peaks vary throughout the chromatographic run and are very significant between 20 and 40 min. The number and area of the chromatographic peaks were higher in the migration waters with rubber material (S/V = 10).
For better visualization,
Figure 6 compares LLE-GC–MS TICs from the analysis of the first 3-day migration of the rubber material at S/V = 5 and S/V = 10, with retention times ranging from 20 min to 50 min.
The corresponding chromatographic peaks were spectrally analyzed to assess the chemical nature of the organic compounds leached from the rubber.
3.3. Semi-Quantitative Method: POC Characterization
Tables S1–S24 (
Supplementary Materials) show the results of the six rubber material migration tests for one month of testing. To facilitate the identification of the POC, all tables contain the same number of compounds, ordered by retention time and identified by a unique number (N). The tables include the largest POC identified in the migration assays (87 compounds). It is therefore possible to assess the nature of the compounds leached throughout the migration period.
Table 2 summarizes the results of the six migration tests. Although 87 compounds were quantified in the different migration waters, the maximum number of compounds per test was 74 (1st migration, S/V = 5). One of the migration tests behaved very differently from the others and was therefore excluded from the overall evaluation (3rd migration, S/V = 5); only its replicate was considered.
The total number of compounds per test ranged from 22 to 74, with a median of 36 compounds per migration test. The total number of unknowns per test ranged from 4 to 21, with a median of 7 compounds per migration test.
The sum of the concentration of the substance leached from the rubber material () ranged from 581.9 µg/L (1st migration, S/V = 5) to 1512.3 µg/L (4th migration, S/V = 10), with a median concentration of 811.5 µg/L.
The estimated concentration of unexpected substances at the consumer tap (
CTap1 and
CTap2) for both CF (0.02 or 0.01) in each migration test was lower than the corresponding
MTCTap [
18]. In addition, the higher
CTap1 and
CTap2 were 0.4029 µg/L and 0.2015 µg/L, respectively (5th migration, S/V = 10).
Regarding the unknowns, the sum of CTap1 and CTap2 in migration waters was between 0.0842 and 0.334 µg/L and 0.0421–0.167 µg/L, respectively. Therefore, the unknowns had a CTap ≤ MTCTap, and their sum was less than 5.0 µg/L. In conclusion, CTap ≤ MTCTap for the 3rd migration period (10th day of testing). The next migration tests (4th to 6th migration) were optional to evaluate the profile of unexpected substances and the behavior of the rubber materials.
However, in water supply systems, rubber represents only a small part of the fittings/ancillaries, accounting for less than 1% of the total assembly (joints and gaskets). Consequently, the CF is very small (0.02 and 0.01). When this rubber material is applied to higher components, the CTap can be higher than the MTCTap.
The majority of POC were considered unexpected substances with no known MTCTap. Therefore, most of the MTCTap values were defined as 1 µg/L. Only seven compounds showed a known MTCTap, namely cyclohexylamine (N5), benzonitrile (N8), 2-ethyl-1-hexanol (N11), benzothiazole (N18), 2-benzothiazolone (N46), 2-mercaptobenzothiazole (N58), and the antioxidant BKF (N78). The MTCTap values ranged from 0.1 µg/L (N8, N18, N46), 2.1 µg/L (N5), 75 µg/L (N78), 100 µg/L (N58) and 1500 µg/L (N11). The concentrations of these compounds did not exceed the corresponding MTCTap in any of the migration tests.
All the unexpected substances can be grouped according to their role in rubber materials: additives (antioxidants, plasticizers, processing aids, stabilizers), curing agents (vulcanization accelerators, crosslinking agents), degradation products (byproducts from oxidation, hydrolysis, or decomposition), and miscellaneous compounds that are not directly recognizable as traditional rubber additives but may be minor constituents, intermediates, or impurities [
27,
28].
Figure 7 shows the
CTap1 values of representative unexpected substances quantified in migration waters. These substances are grouped by their potential role in the rubber industry, and the data are from all migration assays (1st–6th).
Regarding additives, the migration waters contained several unexpected substances belonging to the group of antioxidants/stabilizers, such as t-butyl-p-cresol (BHT), 6-tert-butyl-2,4-xylenol, the antioxidant BKF, and 2,2,4-trimethyl-1,2-dihydroquinoline. With regard to the group of plasticizers and processing aids, the migration waters contained 2-phenoxy-ethanol, 2-ethyl-1-hexanol, lauryl ethoxylate, tributyl phosphate and 1-dodecanol. There are also other functional additives, such as benzenesulfanilide (a potential anti-scorching agent) and dibenzylmethylamine (which can act as a catalyst or stabilizer) [
29,
30].
A large number of the compounds present in the migration waters were curing agents. Some of these are sulfur-based accelerators, including benzothiazole, 2-(methylthio) benzothiazole, 2-mercaptobenzothiazole, 2-cyclohexylaminobenzothiazole, N-methylbenzothiazoline-2-thione, and 2,2′-thiobisbenzothiazole. Other compounds belong to the group of isocyanate & urea-based crosslinkers, such as isocyanate-cyclohexane, isothiocyanate-cyclohexane, N-benzyl-N’-cyclohexyl-isourea, 1,3-dicyclohexylurea, N,N’-dicyclohexyloxamide, and N, N’-dibenzyl urea [
31].
Three of these compounds, benzothiazole, 2-benzothiazole, and 2-mercaptobenzothiazole (N18, N46, and N58), are leached from each material for all surface-to-volume ratios of the material from the first to the last migration test (1–6 migration assays).
The 2-ethyl-1-hexanol (N11), the benzonitrile (N8), and the antioxidant BKF (2,2′-methylene bis (4-methyl-6-tert-butylphenol) (N78) occur almost exclusively in the leachate of the first migration test.
The cyclohexylamine (N5) leaches up to the 5th migration assay.
In the rubber industry, various chemicals and compounds are added to rubber formulations to achieve desired properties, such as durability, flexibility, heat resistance, and environmental stability [
32]. All seven of these compounds with a known
MTCTap are associated with rubber materials, primarily in the context of rubber manufacture and processing.
Cyclohexylamine (N5) is used in the manufacture of certain rubber accelerators. For example, it reacts with 2-mercaptobenzothiazole to form N-cyclohexyl-2-benzothiazole sulfenamide (CBS), a widely used accelerator in rubber vulcanization processes [
33].
Benzonitrile (N8) and related nitriles can be utilized as chemical intermediates in the synthesis of antioxidants and stabilizers that enhance rubber properties, such as resistance to oxidation and degradation [
34].
2-ethyl-1-hexanol (N11) is commonly used as a plasticizer in the polymer industry, including rubber manufacturing. It is often used to soften rubber and improve its resistance to environmental stress cracking [
35].
Benzothiazole (N18) is commonly used as an accelerator in the vulcanization process to accelerate the cross-linking reaction with sulfur, thereby strengthening the rubber. Benzothiazoles are also used as corrosion inhibitors, industrial biocides, and vulcanization accelerators in the production of rubber [
36,
37].
2-mercaptobenzothiazole (N58) is a primary accelerator in the vulcanization of rubber, increasing the cross-linking efficiency between rubber molecules. It promotes the reaction between rubber and sulfur, improving the strength and elasticity of the finished material [
38].
2-benzothiazolone (N46) is less common than 2-mercaptobenzothiazole (N58), but it is related to benzothiazole compounds and may be present as an impurity or byproduct in rubber processing [
39].
The antioxidant BKF (N78) is used to prevent oxidative degradation in rubber formulations. It effectively protects rubber from deterioration caused by heat, oxygen, and certain metals. As a result, it prolongs the useful life of rubber products and helps maintain their physical properties [
40].
