Article

Early Warning Technology for Heavy Metal Contaminant Leakage Based on Self-Potential Method

1
Department of Electronic Engineering, Guangxi University of Science and Technology, Liuzhou 545616, China
2
Zhe Jiang Environment Technology Co., Ltd., Hangzhou 310013, China
*
Author to whom correspondence should be addressed.
Water 2025, 17(19), 2839; https://doi.org/10.3390/w17192839
Submission received: 29 July 2025 / Revised: 15 September 2025 / Accepted: 25 September 2025 / Published: 28 September 2025
(This article belongs to the Section Water Quality and Contamination)

Abstract

Heavy metal contamination poses significant environmental risks to groundwater and soil, necessitating efficient early-warning technologies for leakage detection. This study proposes a novel early-warning approach for heavy metal leakage using the self-potential (SP) method. A coupled numerical model integrating seepage, ion diffusion, and electric potential fields was developed within the COMSOL Multiphysics platform in order to elucidate the dynamic response mechanism of SP signals to advancing seepage fronts. Key findings reveal that the SP signal responds 1.5 h earlier than the contaminant diffusion front (Case 1), providing a critical early-warning window. The leakage process exhibits a distinct bipolar SP anomaly pattern (negative upstream/positive downstream), with the most significant response observed at the downstream toe area. Consequently, an optimized monitoring strategy prioritizing downstream deployment is proposed and validated using a representative landfill model. This SP-based technology offers a promising solution for real-time environmental risk monitoring, particularly in ecologically sensitive zones.

1. Introduction

Heavy metal contamination poses a global threat to groundwater and soil security, with industrial effluents transporting toxic ions along subsurface pathways to create persistent ecological hazard [1]. Conventional detection methods struggle to provide early warnings for rapidly expanding contaminant plumes, limiting timely intervention. This limitation underscores an urgent need for cost-effective and high-sensitivity technologies capable of real-time leakage front monitoring.
Current approaches for leakage detection primarily rely on geophysical methods and in situ water sampling. While established techniques have demonstrated utility, significant limitations hinder their effectiveness in providing early warning for rapidly advancing contaminant plumes. Geophysical methods like Electrical Resistivity Tomography (ERT) exploit conductivity contrasts but often exhibit insufficient sensitivity to low-concentration contaminants or early-stage leakage [2]. Ground Penetrating Radar (GPR) suffers from signal attenuation in conductive media, limiting its depth penetration [3]. Induced Polarization (IP) requires complex electrochemical models for accurate interpretation of leakage signals [4]. Transient Electromagnetic Method (TEM) offers enhanced shallow resolution but faces challenges in deep subsurface imaging [5]. Surface wave methods (e.g., MASW) struggle with precise contaminant type identification and boundary delineation [6]. Magnetic Resonance Sounding (MRS), while powerful for characterizing aquifers, is costly and sensitive to site conditions like electromagnetic noise [7]. Artificial isotope tracing provides insights into solute transport but poses environmental risks and lacks real-time monitoring capability [8]. Emerging sensor technologies, such as vertical graphene sensors, show promise for continuous monitoring but face challenges with deployment costs and performance degradation under harsh environmental conditions [9]. Plant biosensors offer novel biological detection mechanisms but suffer from response time lag and require precision improvements [10]. Even advanced approaches like machine learning-assisted ERT, which enhance sensitivity and reduce false positives, are constrained by the need for extensive training datasets and significant computational resources [11]. Collectively, these limitations underscore the urgent need for novel early-warning technologies characterized by low cost, high sensitivity, the capability for real-time response to advancing leakage fronts, and ease of deployment.
The Self-Potential (SP) method, a passive geophysical technique, exhibits unique potential for overcoming these early-warning bottlenecks. Its strengths stem from its non-invasiveness and environmental compatibility: SP measurements involve only surface electrode arrays recording natural voltage differences, eliminating the need for external excitation sources and avoiding secondary pollution risks. This makes SP particularly suitable for long-term monitoring in ecologically sensitive areas. Furthermore, its simple equipment and rapid deployment offer significant cost advantages over mainstream techniques like ERT or GPR, enabling efficient screening over large areas. Crucially, SP is highly sensitive to electrokinetic phenomena (primarily streaming potentials) generated by fluid flow, allowing it to directly detect the advancement of leakage fronts, the evolution of contaminant plume boundaries, and the migration of redox fronts. These characteristics, combined with its potential for integration with other data sources like ERT and hydrological models [12], establish SP as a promising tool for early leakage warning.
Recent years have witnessed growing global research interest in SP’s environmental monitoring potential [13]. Beyond successful landfill leachate monitoring and contaminated groundwater plume tracing, significant progress has occurred in dam seepage detection [14]. Ahmed et al. (2019), through combined experimental embankment studies and numerical modeling, found that subsurface fluid flow states near leaks (particularly inertial flow effects characterized by Reynolds number) and insulating materials (e.g., PVC pipes) can significantly attenuate or mask leakage-related SP anomalies, providing critical insights for complex field interpretation [15]. Conversely, Guo et al. (2022) jointly applied ERT and SP to identify three major seepage pathways in a Chongqing earth-rock dam; the inverted seepage current source distribution closely matched borehole validation, robustly demonstrating the method’s 3D imaging effectiveness and showing that resistivity constraints enhance seepage source localization [16]. Advancing fundamental seepage research, Hu et al. (2025) combined lab experiments with SP monitoring to analyze rainwater infiltration SP responses [17]. Within a mechanistic hydrogeophysical coupling framework, they delineated multi-component SP signal contributions and confirmed its dynamics effectively characterize infiltration progress stages [17]. Addressing landfill leachate challenges, Sun et al. (2024) proposed a joint inversion strategy integrating resistivity and SP data to improve 3D imaging precision of leakage zones and contaminant plumes [18]. Furthermore, Mehanee et al.’s (2023) rapid SP imaging algorithm extends utility to geothermal characterization and mineral exploration [19].
Despite these advances validating SP’s leakage monitoring potential, a quantitative understanding of its dynamic response mechanisms to heavy metal leakage fronts and corresponding warning thresholds remains lacking. This study aims to address the following critical scientific questions: (1) How can the spatial transport pathway of heavy metal contaminants be predicted based on SP signal characteristics, particularly their response to the advancing contamination front? (2) How do different geological media conditions affect the amplitude of the SP signal response upon leakage occurrence? (3) How do SP signal variation characteristics differ at monitoring points across spatial locations, and how can this inform optimal monitoring network design? The core objectives are to: (1) elucidate the dynamic SP signal response mechanisms during heavy metal contaminant leakage front expansion; (2) quantitatively evaluate the lead time and spatial extent of the SP signal response relative to the contaminant concentration field; (3) establish effective early-warning threshold criteria based on the intrinsic relationship between SP signal features and leakage front evolution, providing theoretical support for real-time heavy metal leakage monitoring and early warning.

2. Materials and Methods

2.1. Formation Mechanisms of Natural Electric Fields

The Self-Potential (SP) method probes subsurface processes by measuring naturally occurring electrical potential differences, which typically range from microvolts to millivolts. In environmental monitoring applications, the observation system comprises non-polarizing electrodes (e.g., Ag/AgCl electrodes) coupled with high-precision voltmeters, deployed at the surface, in boreholes, or within water bodies to capture leakage-associated anomalous signals. Primary mechanisms governing SP anomalies include redox reactions, electrokinetic effects driven by seepage flow, and ionic diffusion phenomena [20].
The redox-induced electric field originates from electrochemical interactions between electronic conductors (e.g., sulfide ore bodies or graphite) and groundwater environments: In the oxidizing zone above the groundwater table, where oxygen penetration occurs, ore bodies undergo oxidative dissolution, releasing electrons and acquiring a positive surface charge. Concurrently, the surrounding solution becomes enriched with anions (e.g., SO42−, Cl) generated during oxidation, forming a localized negative potential region at the ore-solution interface relative to the conductor’s potential [21]; This spatial charge separation constitutes the fundamental mechanism underlying naturally occurring electric fields, which are widely applied in mineral exploration and groundwater contamination monitoring.
The electrokinetic effect (commonly referred to as the streaming potential in geophysical contexts) dominates in hydrogeological systems with active fluid flow. It arises from fluid migration through porous media, where a fixed charge layer forms on rock grain surfaces due to preferential anion adsorption or mineral dissolution [22]. This inherent negative surface charge attracts a counterbalancing cloud of positively charged ions (cations) from the pore water, forming an electrical double layer. When a hydraulic gradient drives water to seep through the porous matrix, it shears this double layer, dragging the mobile portion of the cations along with the flow. This net advective transport of electrical charge constitutes a streaming current. In response, a counter-acting electric field, the streaming potential, spontaneously arises to oppose the charge separation. The strength of this resulting electric field is directly proportional to the hydraulic gradient and is governed by the interfacial electrochemistry (zeta potential) and the physical properties of the fluid (viscosity and electrical conductivity). Consequently, a measurable potential gradient is established parallel to the flow path, with upstream regions characteristically exhibiting a relative negative potential and downstream areas a relative positive potential (Figure 1a). During subsurface leakage events, this mechanism produces a characteristic dipole anomaly that is a primary target for SP surveys.
Ionic diffusion effects (diffusion potentials) stem from differential ionic mobilities at interfaces between solutions of contrasting concentrations (e.g., Cl mobility typically exceeds Na+) [23]. This process is driven by a gradient in chemical activity, causing ions to diffuse at different rates. The more mobile anions migrate ahead of the cations, resulting in relative enrichment of negative charges (more negative potential) on the lower-concentration side of the diffusion direction and positive charge enrichment (more positive potential) on the higher-concentration side (Figure 1b). This charge separation creates a weak electric field that acts to counteract further diffusive dispersal, eventually reaching a steady-state potential. During leakage events, diffusion potentials typically superimpose upon streaming potentials, though their contribution remains significantly smaller than that of streaming potentials—a distinction particularly pronounced during periods of active seepage [24].

2.2. Governing Equations for Multiphysics Coupling

When simulating the SP field induced by heavy metal contaminant leakage, as previously stated, the streaming potential (EK) constitutes the dominant mechanism, with the contribution of diffusion potential being negligible. Thus, the coupled model developed in this study focuses exclusively on the streaming potential generated by seepage flow. Under the assumption of quasi-static conditions (neglecting electromagnetic induction), the SP field arising from seepage satisfies the charge conservation law for steady-state current flow, expressed by the current continuity equation:
j = 0
Here, j (A/m2) denotes the total current density. Within the low-frequency approximation of Maxwell’s equations (displacement currents negligible) and absence of source/sink terms, current density is conserved. The current density is governed by the constitutive equation [25]:
j = σ φ + Q ^ V u
where σ represents the electrical conductivity of the porous medium (S/m), φ is the self-potential, Q ^ V is the volumetric excess charge density (C/m3), quantifying the effective excess charge per unit pore volume [26], and u is the Darcy velocity. Combining Equations (1) and (2) yields the governing elliptical partial differential equation for the self-potential [22]:
σ φ = Q ^ V u
During contaminant leakage, Richards’ equation governs fluid flow in variably saturated porous media [27]:
u = κ μ p ρ g , κ = κ s κ r ( S e )
This equation describes fluid motion in porous media, where u is the Darcy velocity vector (fluid volume per unit time per unit area). The negative sign indicates flow opposes the pressure gradient direction. κ represents the effective permeability, determined by the saturated permeability κ s (intrinsic permeability under full saturation) and the relative permeability κ r ( S e ) (dimensionless factor < 1, accounting for permeability reduction at partial saturation). μ is the fluid dynamic viscosity (resistance to flow), p is the pressure gradient driving flow from high to low pressure, ρ g is the gravity term (with g the gravitational acceleration vector), accounting for gravitational effects.
The hydraulic properties of the unsaturated soil are characterized by the classical van Genuchten model [28]. The relationship between effective saturation S e and capillary pressure head H p is defined by:
S e = ( 1 + α | H p | n ) m H p < 0 1 H p 0
In Equation (5), S e is the effective saturation, H p is the capillary pressure head ( α negative value indicates an unsaturated state, and α positive value indicates a saturated state) (unit: m), the scale parameter related to pore size, n (pore size distribution index), and m (empirical coefficient, usually taken as m = 1 − 1/n) are the core parameters of the van Genuchten model, which are used to describe the nonlinear relationship between capillary pressure and saturation in the unsaturated state. This equation is widely used to simulate the flow problems of unsaturated to saturated porous media such as soil moisture transport and seepage in oil and gas reservoirs.

3. Case Studies

3.1. Numerical Modeling Framework

This study established a numerical model based on self-potential (SP) principles using the COMSOL Multiphysics® 6.1 platform, a finite element method-based environment for solving partial differential equations governing multiphysics coupling phenomena [29]. Recognized as an essential tool for pollutant leakage simulations due to its robust fully coupled solving capability and effective handling of complex boundary conditions [30,31], the platform was employed to implement an integrated framework coupling three critical physical processes: the Richards equation governing unsaturated soil fluid flow dynamics, the Diluted Species Transport module governing heavy metal ion advection, diffusion, and dispersion, and the Electric Currents module simulating electrokinetic potential generation. This approach overcomes traditional single-physics limitations by dynamically linking seepage driving forces, ionic transport mechanisms, and SP signal generation, thereby enabling synchronous resolution of the spatiotemporal evolution of hydraulic-chemical-electrical processes during contaminant leakage events.

3.2. Case 1: Dynamic Response Mechanism and Lead Time Analysis

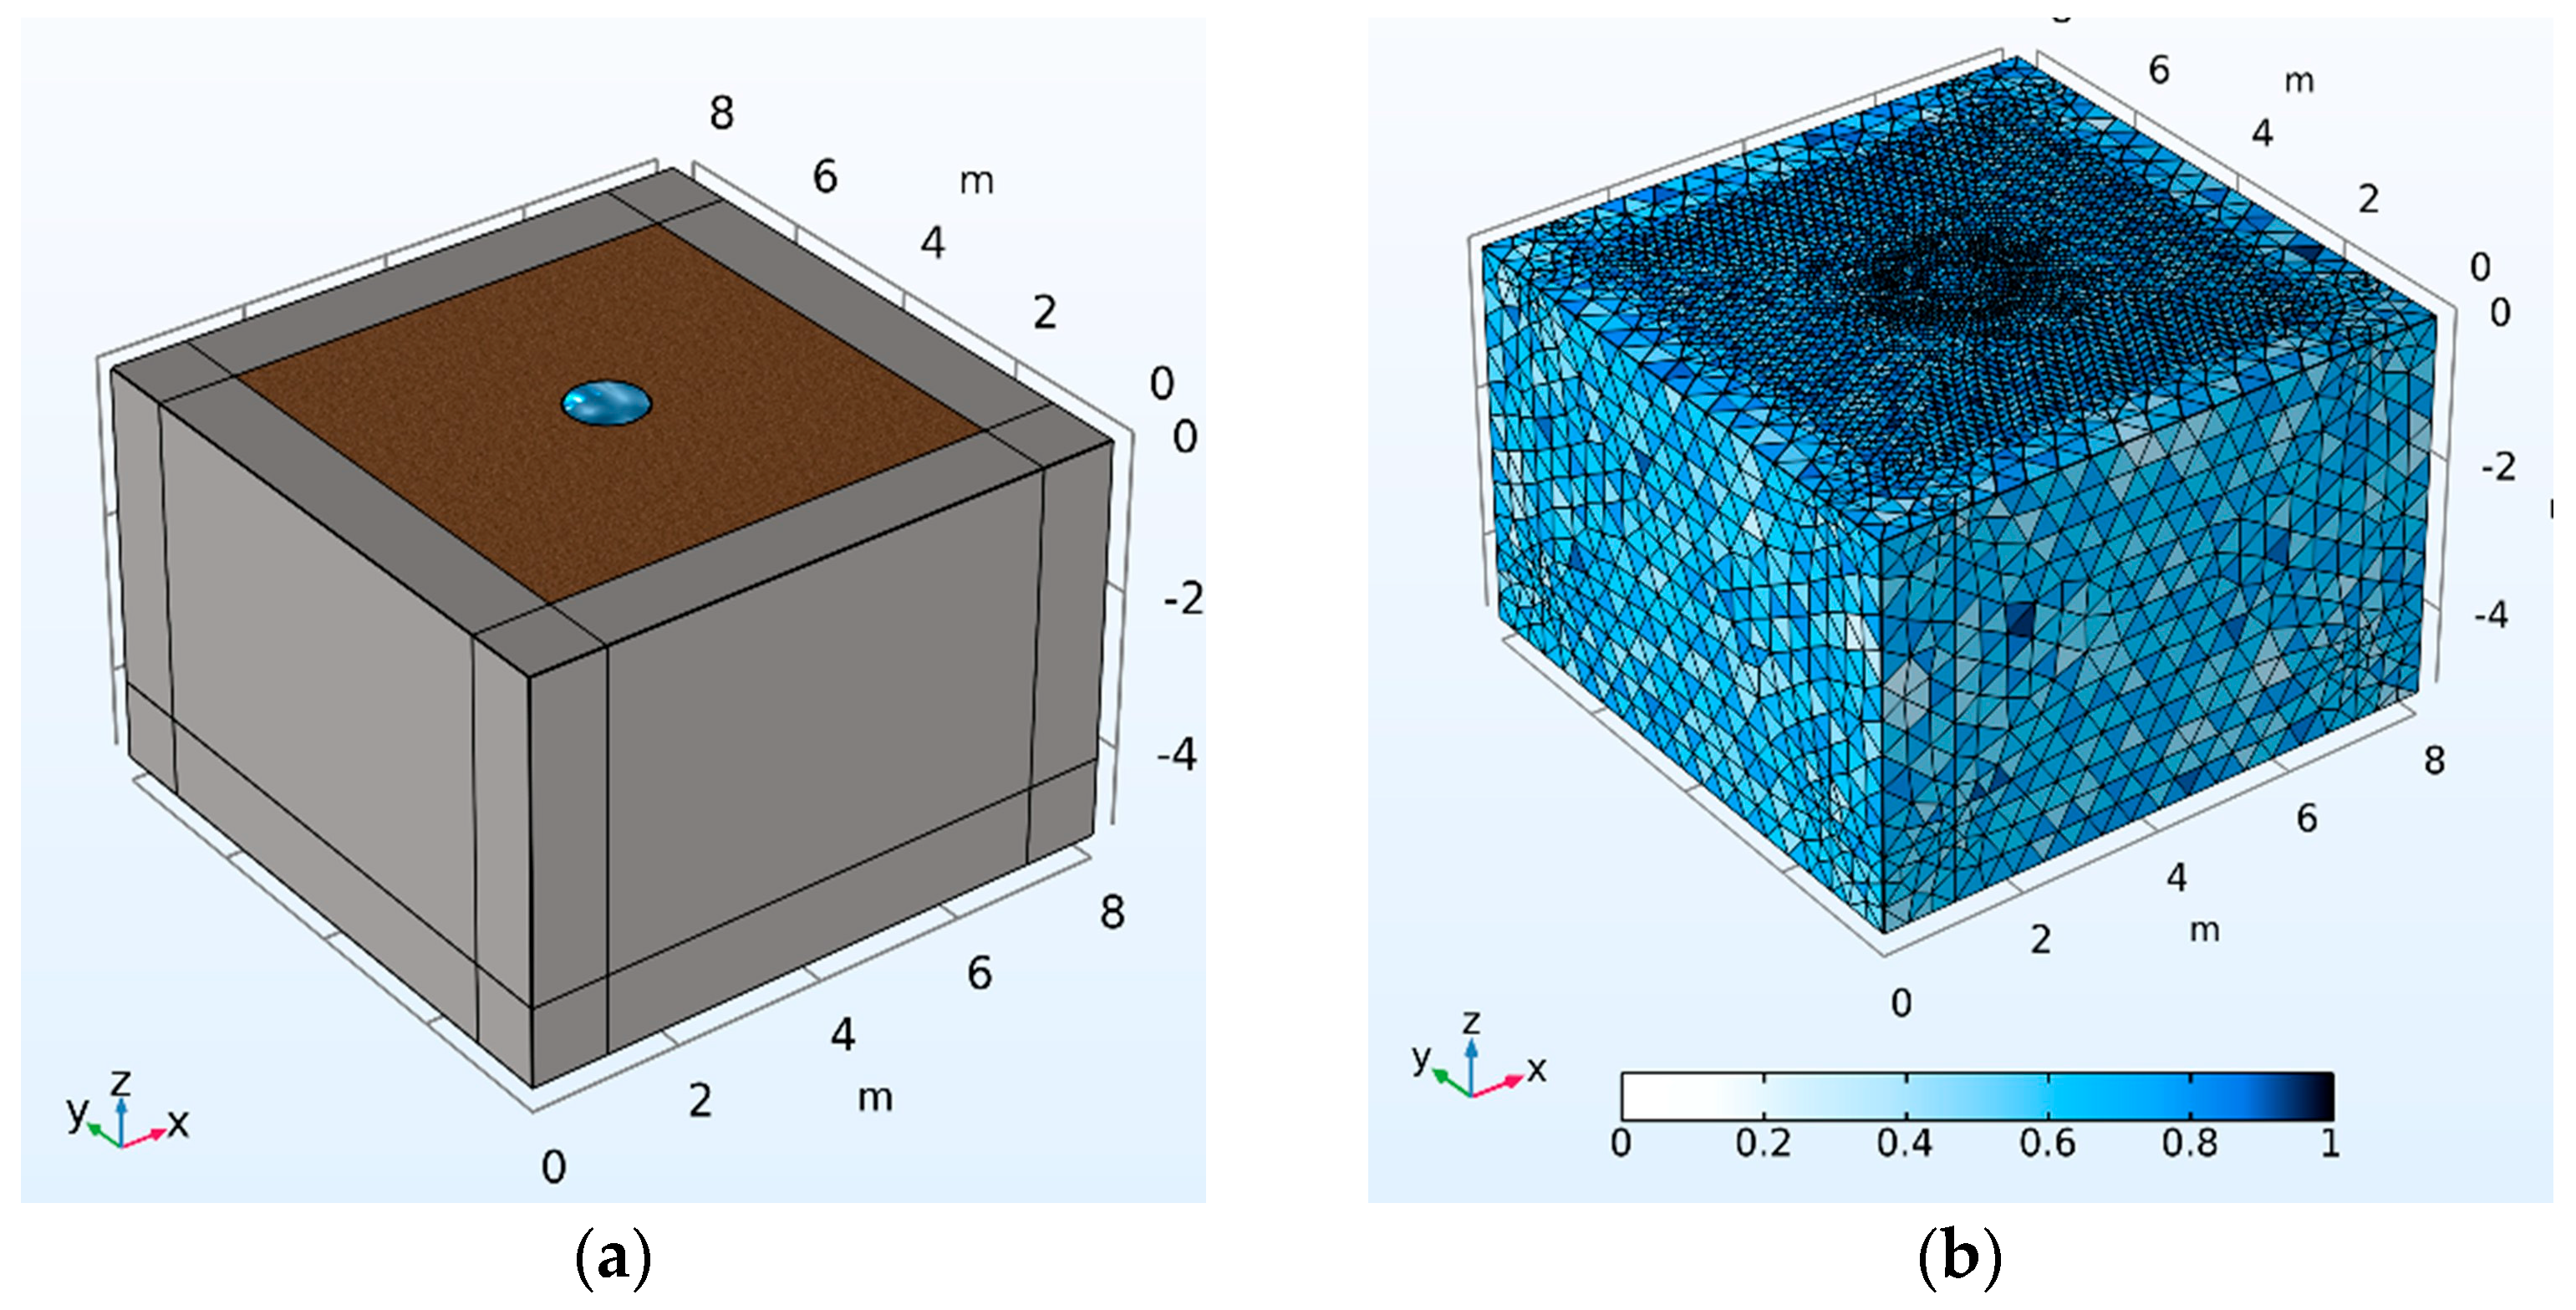
The first case study validates the proposed methodology by investigating the intrinsic relationship and dynamic temporal response between contaminant concentration fields and self-potential (SP) signals during leakage. We established a three-dimensional leakage model (Figure 2) based on SP principles and multiphysics coupling theory, simulating the migration of heavy metal-contaminated fluid (NaCl solution) through unsaturated soil. The computational domain comprises a typical loam profile measuring 8 m (length) × 8 m (width) × 5 m (depth). To accurately capture the dynamic evolution of the leakage front, the domain was discretized using higher-order tetrahedral elements with local mesh refinement in the primary leakage pathway (Figure 2b), ensuring grid quality met convergence requirements for multiphysics coupling. Crucially, no predefined flow paths were imposed to authentically replicate the infiltration behavior of contaminated fluid into natural soil matrices. Boundary conditions were configured as follows: For the electric current field, electrical insulation was enforced at the soil-atmosphere interface, while grounding boundaries were applied to all other domain surfaces; for the flow field, a constant pressure boundary was imposed at the contaminant inlet. Additionally, infinite element domains were incorporated at the computational boundaries to minimize truncation artifacts in potential distribution calculations.
To facilitate efficient multiphysics coupling, key geoelectrical and hydrological material properties were defined within the COMSOL Multiphysics platform (Table 1), ensuring parameters were rigorously calibrated against actual field conditions. The electrical conductivity (σ) of the soil exhibits a dynamic dependence on its water saturation (Sw), governed by Archie’s law [32]:
σ soil = 1 F σ w S e m
where σ soil is the electrical conductivity of the unsaturated soil matrix, F is the formation factor (ranging 1.2–2.5; experimental value: 2), σ w is the pore fluid conductivity, S e is the water saturation, and m is the saturation exponent (ranging 1.5–2.5; experimental value: 2). The relative permittivity of the soil is characterized by the Topp equation [33]:
ε r , soil = 3.03 + 9.3 θ + 146 θ 2 76.7 θ 3
where ε r , soil is the soil relative permittivity and θ is the volumetric water content.
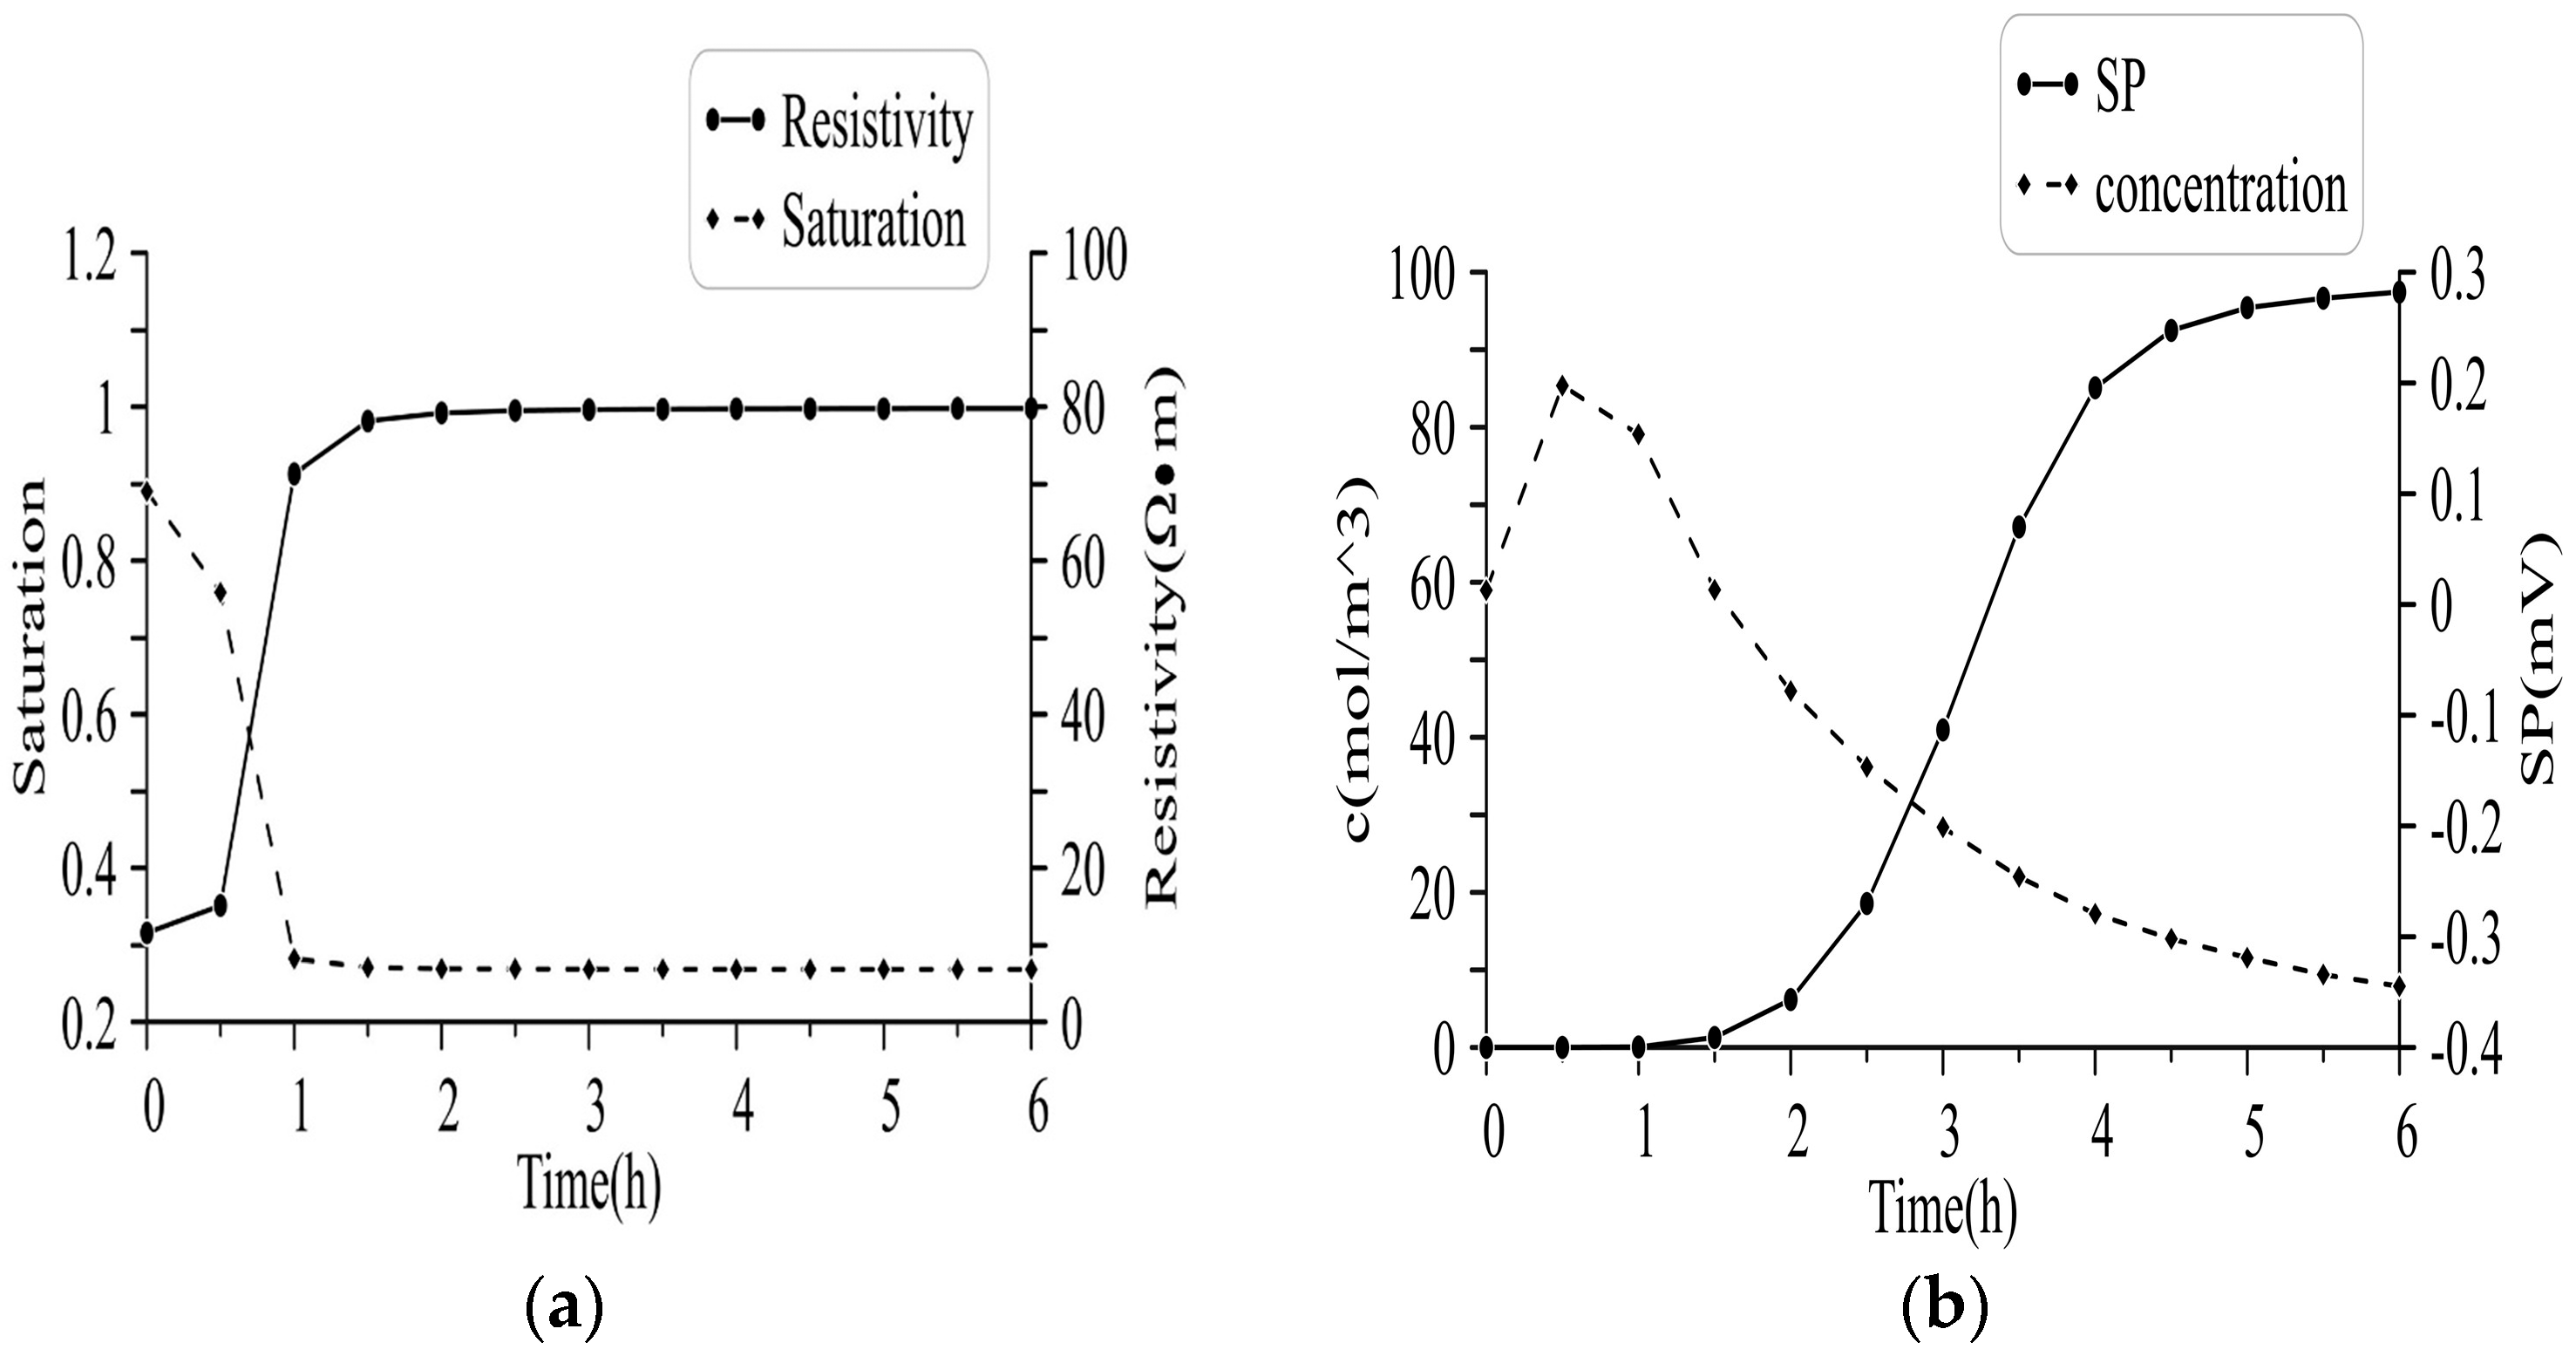
We focused on analyzing transient evolution patterns of key physical parameters at coordinate (4, 4, −3) directly below the leakage source (Figure 3). Figure 3a reveals the spatiotemporal evolution of water saturation and electrical resistivity at this location. Approximately 0.5 h after leakage initiation, water saturation exhibited an abrupt increase, reaching full saturation within 0.5 h (t ≈ 1.0 h), indicating rapid arrival of the contaminant flow front at this depth. Concurrently, resistivity decreased sharply, exhibiting a trend highly synchronized with saturation changes and demonstrating a strong negative correlation. This behavior aligns with Archie’s law, where increased pore-water content (elevated saturation) and enhanced pore-water conductivity from contaminant intrusion collectively amplify bulk soil conductivity. Figure 3b presents the temporal evolution of self-potential (SP) and contaminant concentration (c). Contaminant concentration (solid line in Figure 3b) remained relatively stable during initial leakage stages (t < 2 h), with significant increase commencing only after t ≈ 2 h. Compared to water saturation’s rapid rise at t ≈ 0.5 h (Figure 3a), this delayed concentration response indicates substantial retardation of contaminant transport relative to the advancing seepage front. During early leakage stages (t < 0.5 h), the monitoring point downstream of the primary flow path exhibited a weak positive SP anomaly relative to background values (dashed line in Figure 3b). As the seepage front arrived (t ≈ 0.5–1.0 h) and saturated the region, sustained downward flow drove accumulation of negative charges, causing SP values to decrease rapidly after t ≈ 0.5 h and establishing a pronounced negative potential anomaly beyond t ≈ 1.0 h.
Critically, the significant SP variation (initiating at t ≈ 0.5 h) preceded a detectable increase in contaminant concentration (commencing at t ≈ 2 h) by approximately 1.5 h. This temporal lead originates from the dominance of electrokinetic coupling (streaming potential): the advancing water front alone generates substantial SP response without requiring arrival of slowly diffusing contaminant ions.
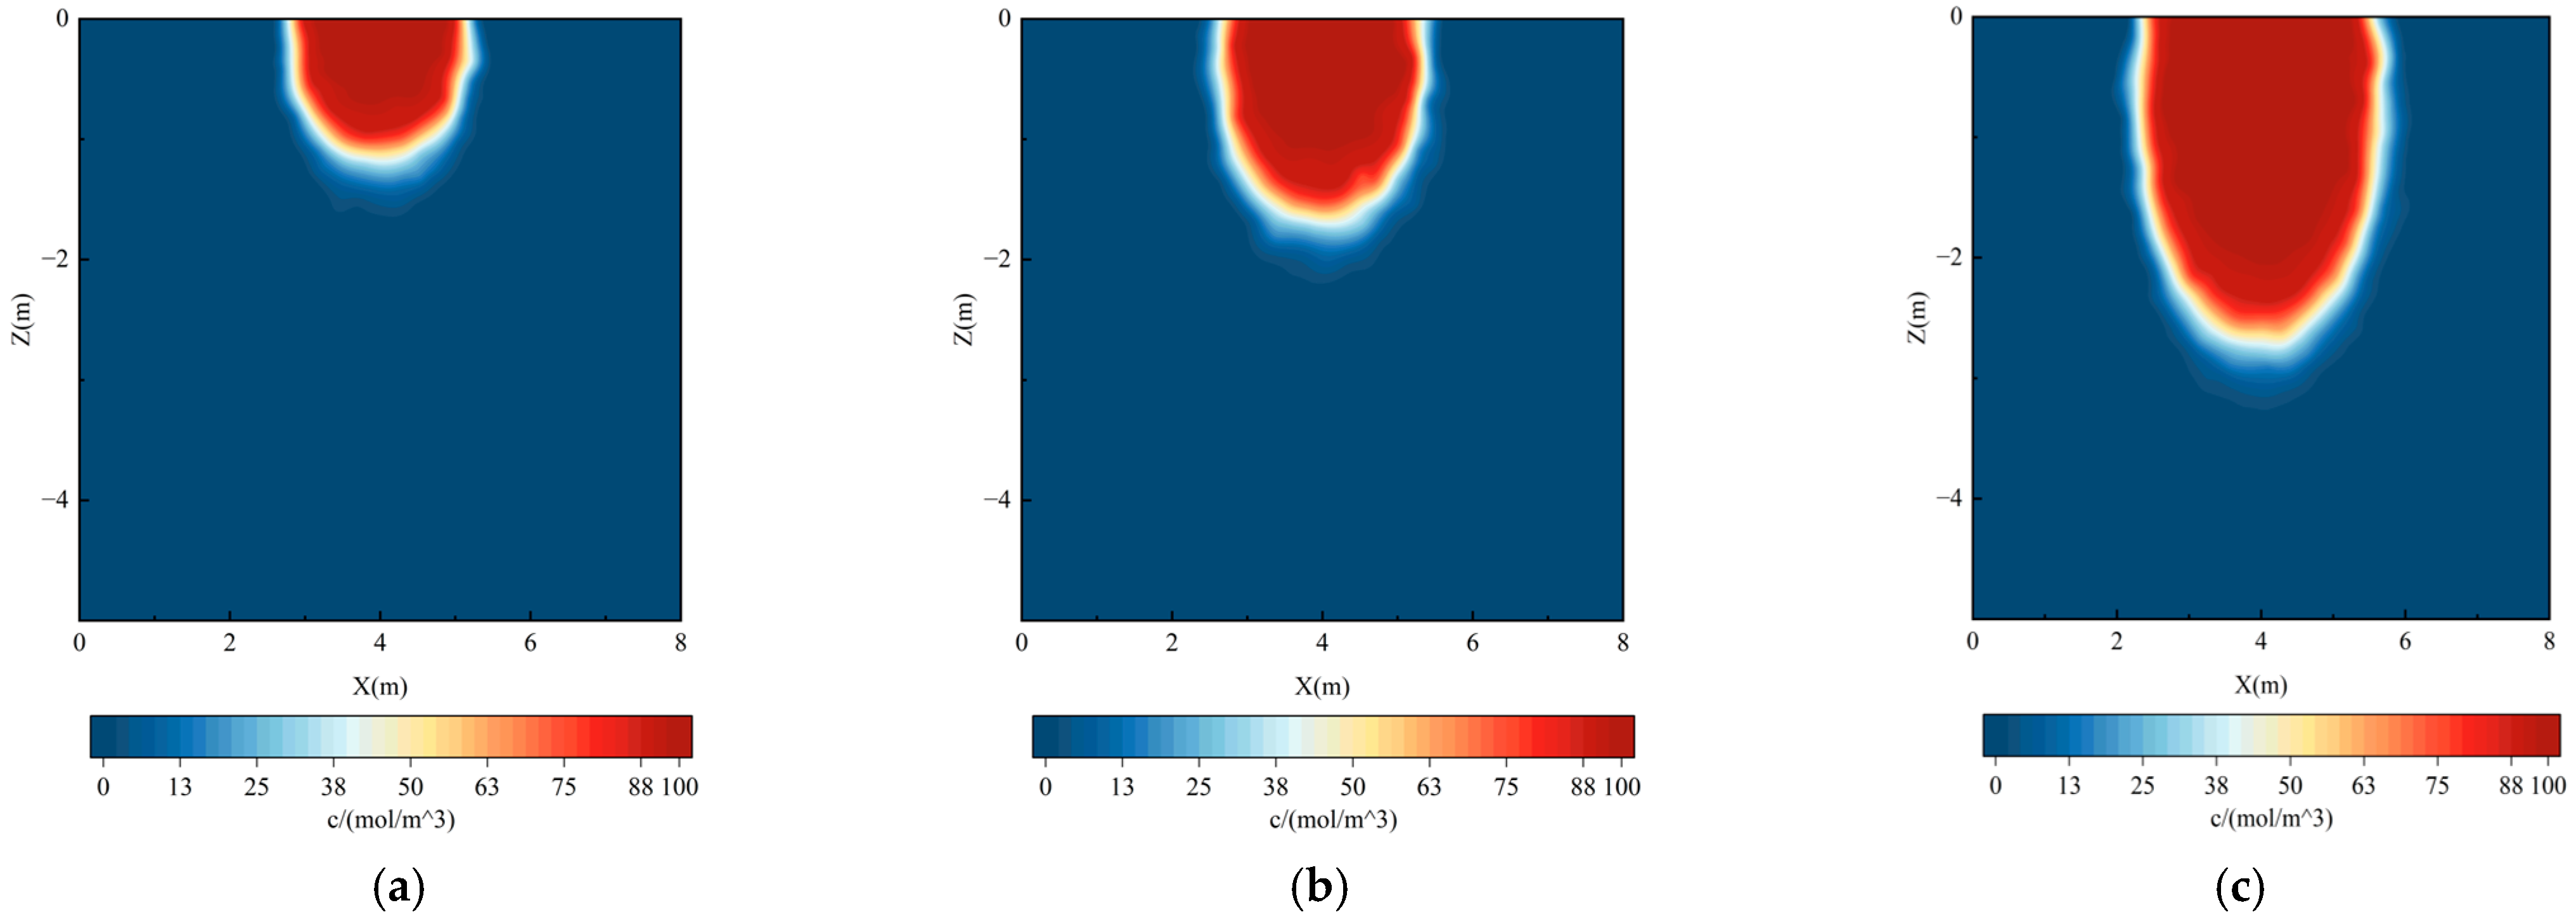
To elucidate spatiotemporal disparities between contaminant concentration fields and SP anomalies, we analyzed the Y = 4 m cross-section. Time-lapse comparisons between Figure 4 (SP anomalies) and Figure 5 (contaminant concentrations) reveal the leading response characteristics of SP signals relative to leakage fronts. During initial leakage (Figure 4a and Figure 5a), the contaminant concentration field (Figure 5a) remained highly localized near the leakage source, whereas the SP anomaly field (Figure 4a) had already developed a distinct dipole structure: characterized by a negative potential anomaly zone at the leakage point and a positive anomaly zone approximately 2m downward. This spatial disparity demonstrates that the advective front advanced significantly faster than the diffusive contaminant front. In the intermediate stage (Figure 4b and Figure 5b), the SP dipolar structure intensified with the positive anomaly expanding toward the downstream toe region, while contaminant migration (Figure 5b) remained spatially constrained—its advancing front lagging behind the seepage front (compared to SP anomaly progression in Figure 4b), with estimated migration velocity less than one-third of the seepage front velocity. In the advanced stage (Figure 4c and Figure 5c), SP anomalies developed greater spatial complexity with positive anomalies extending to the domain base, whereas contaminants on the Y = 4 m plane (Figure 5c) had penetrated only ~2m depth. Critically, the SP anomaly fronts consistently preceded the contaminant concentration fronts throughout all stages. This spatial lead stems from the inherent advantage of electrokinetic coupling (streaming potential): hydraulic front propagation directly generates electrical responses without requiring slow diffusive transport of contaminant ions. Thus, the emergence of persistent positive SP anomalies at downstream monitoring zones provides diagnostic evidence of seepage front arrival, offering critical lead time for initiating contamination mitigation measures.

3.3. Case 2: Landfill Application and Monitoring Strategy Optimization

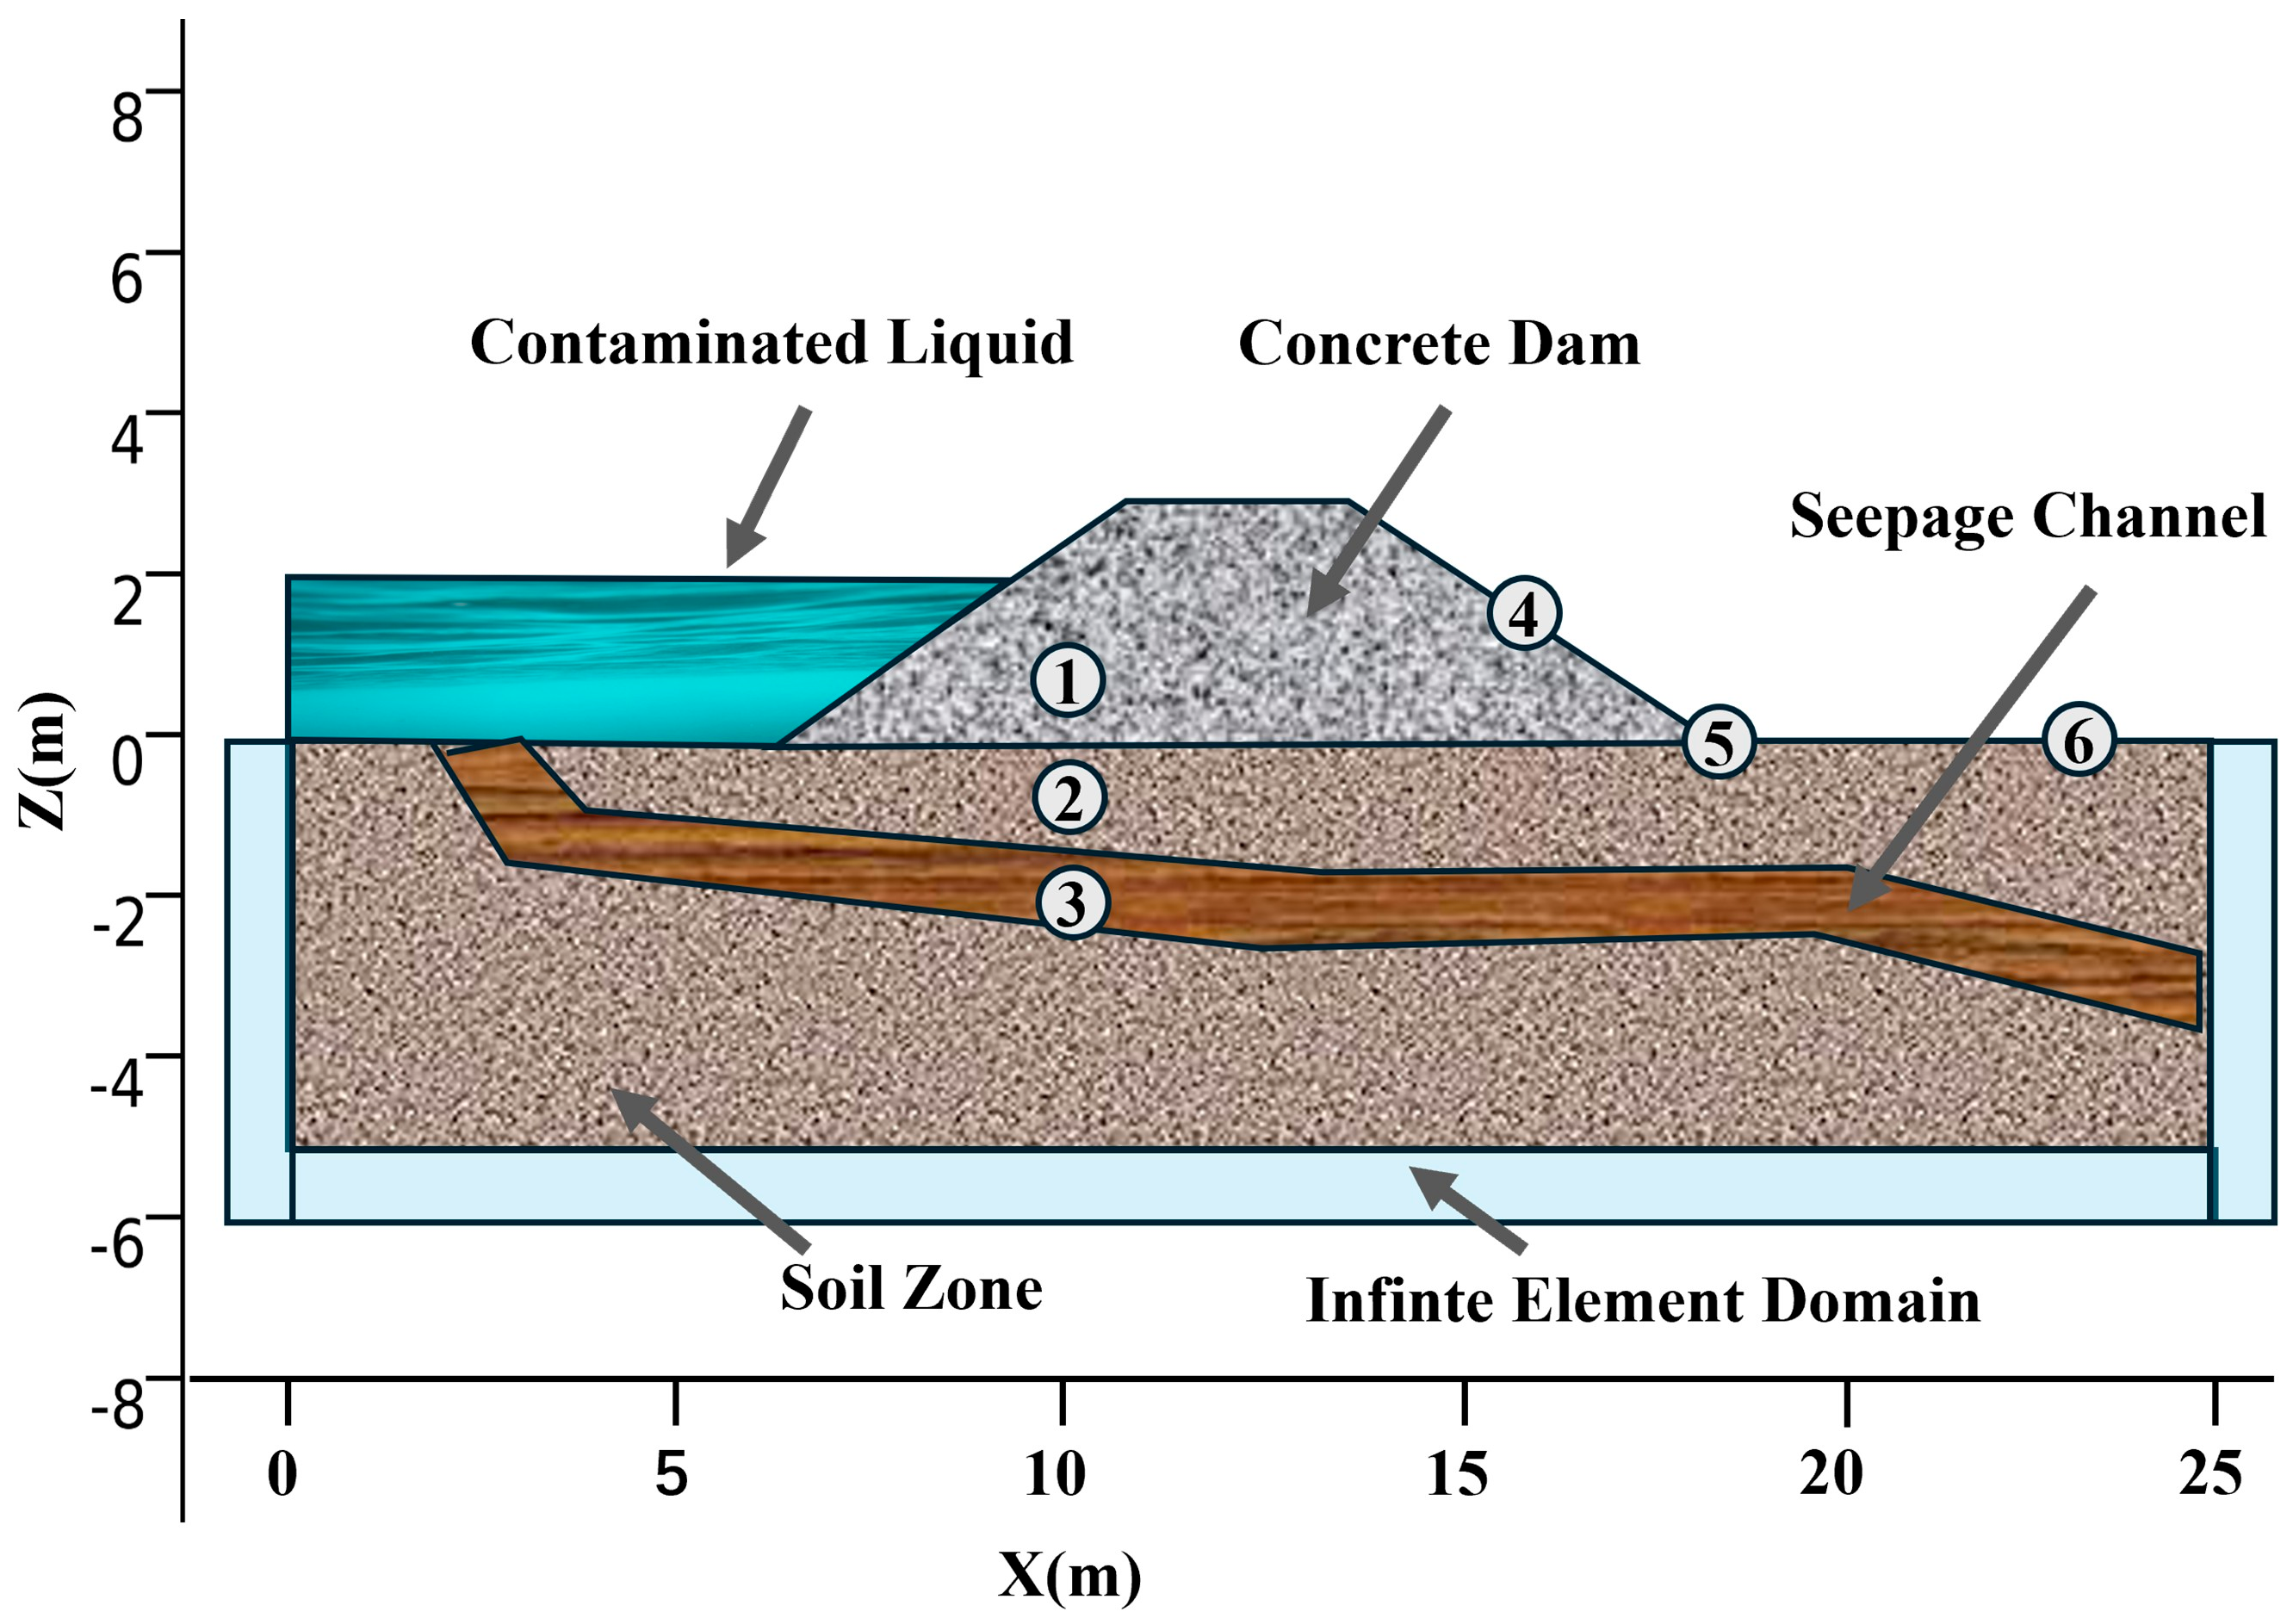
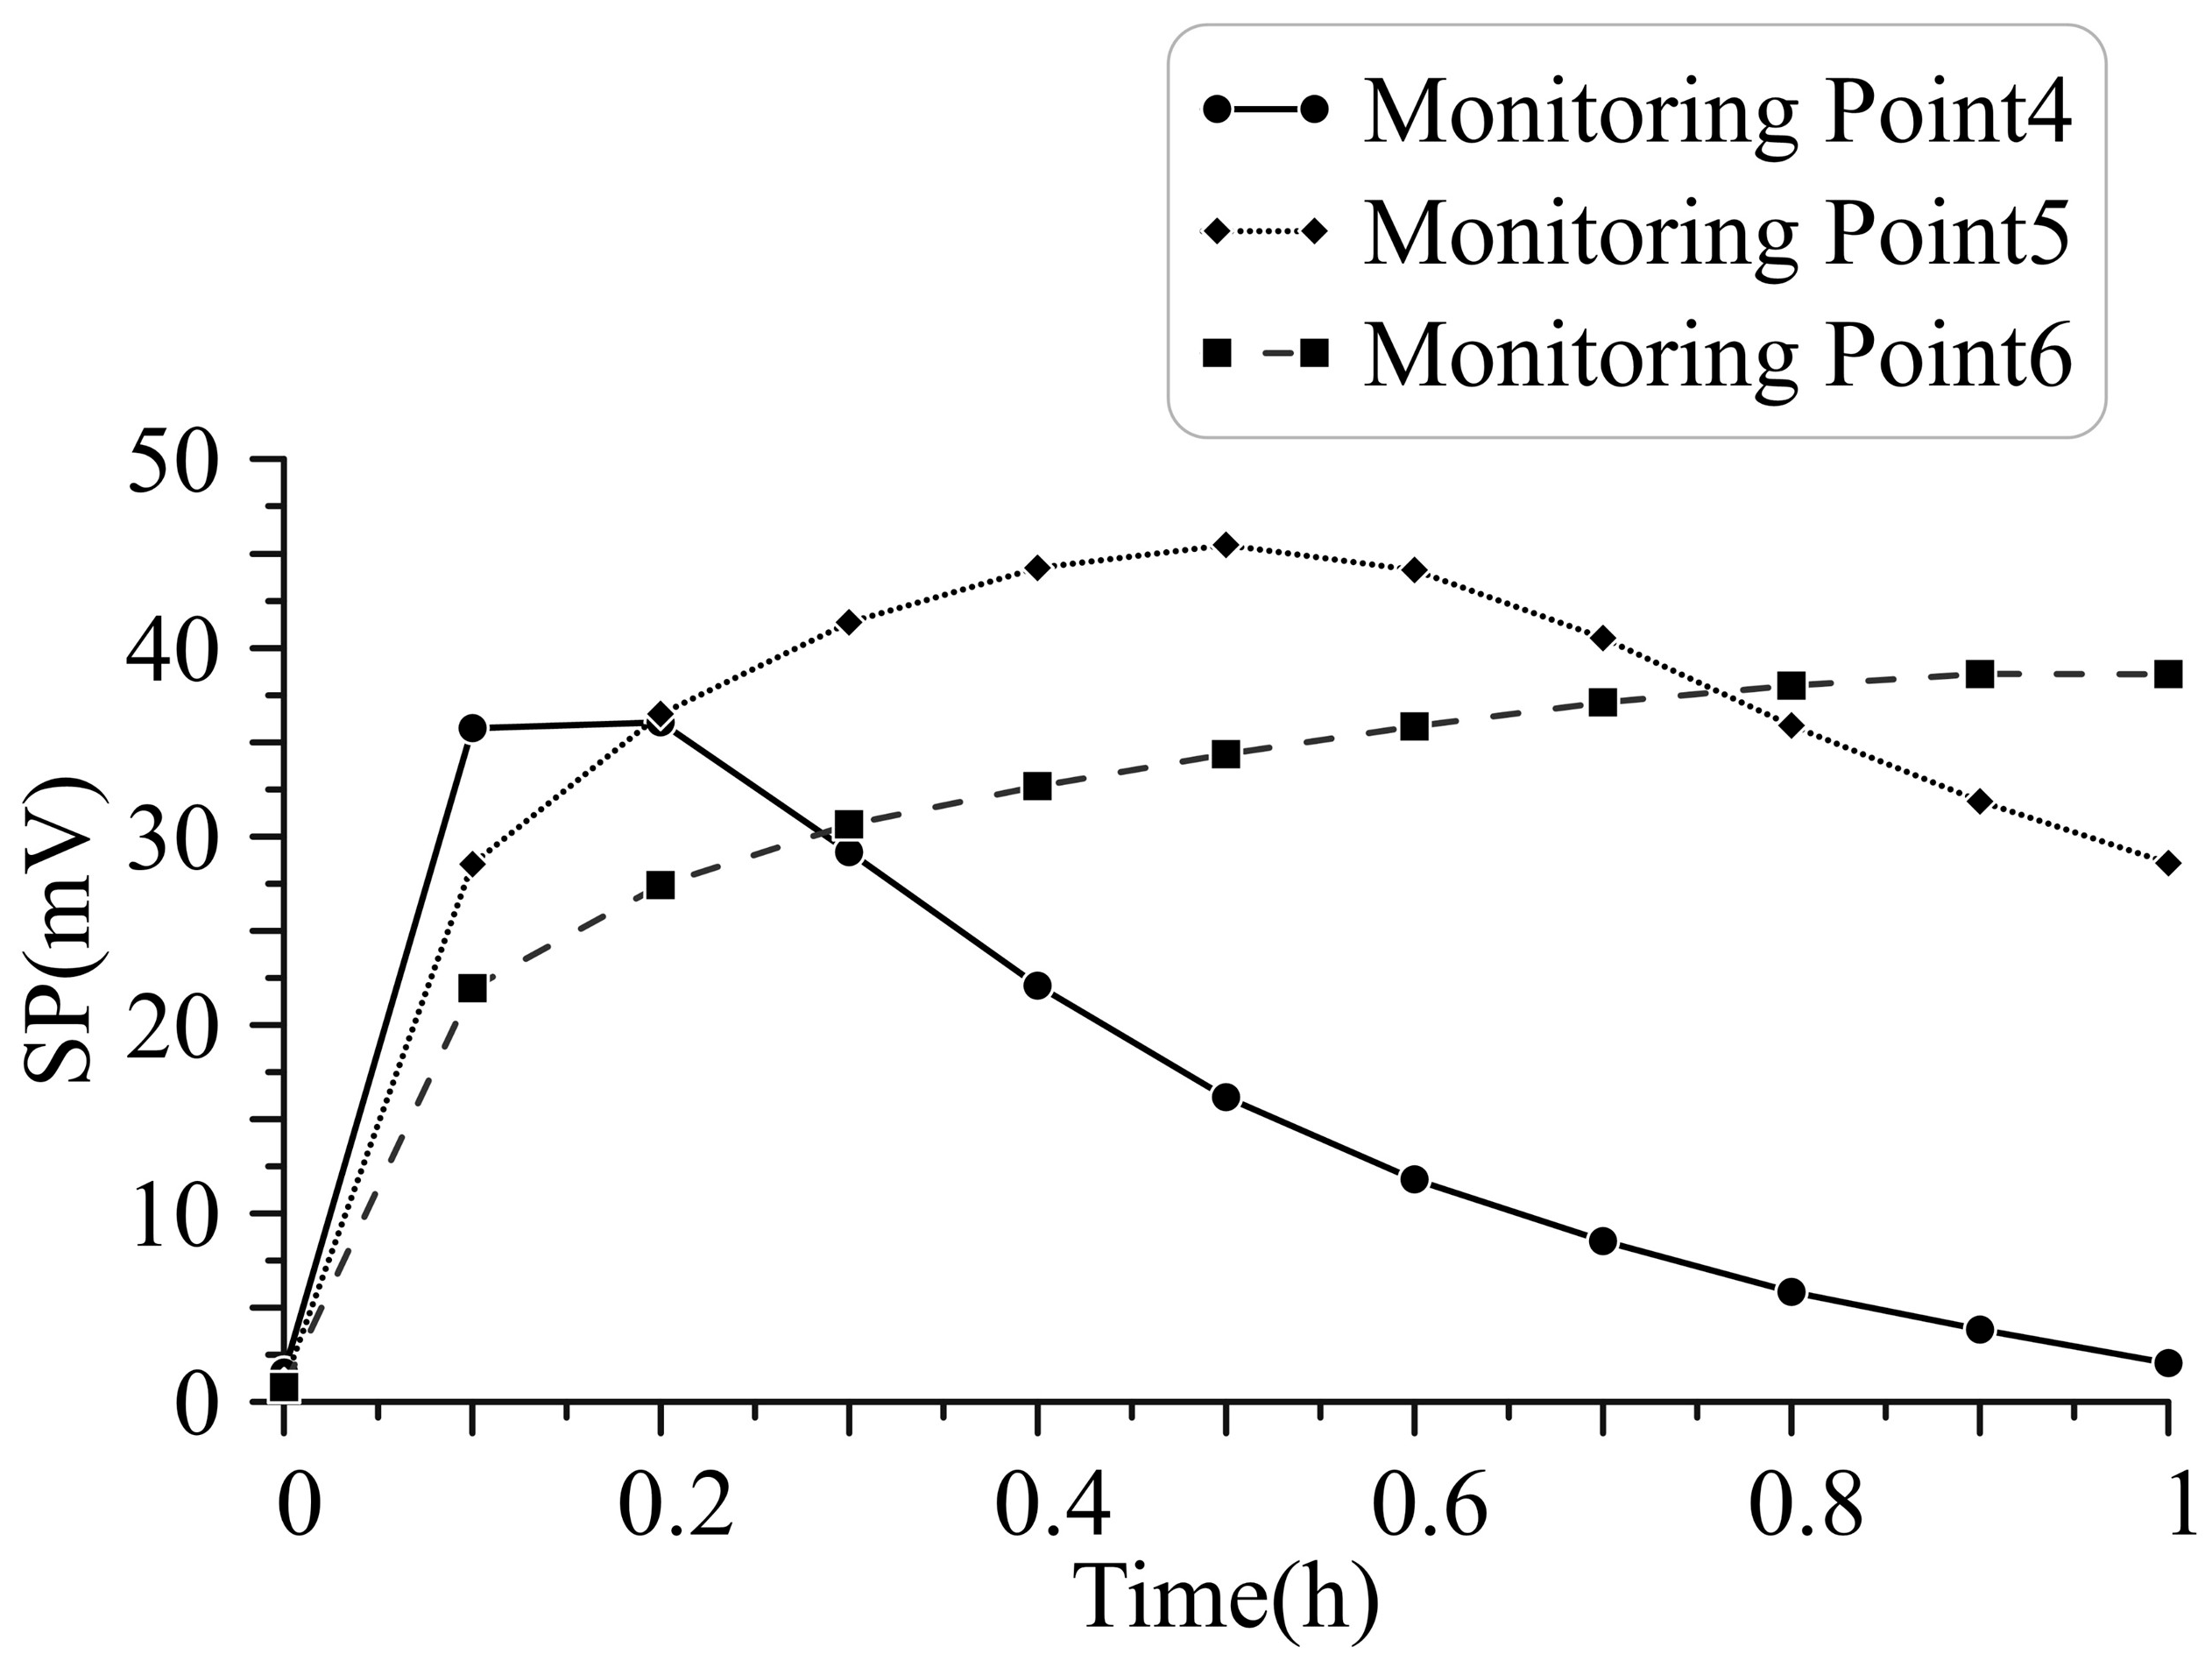
To evaluate the applicability of self-potential (SP) monitoring in realistic landfill environments, this study investigates SP signal amplitude variations under different leakage rates and spatial response heterogeneity across monitoring points. These findings will inform optimal sensor deployment strategies. We established a representative landfill leakage model with containment dam structures (Figure 6), incorporating design standards for sanitary landfills including basal soil layers and concrete containment dams. Soil properties matched Case 1 (Table 1), while critical parameters for the concrete dam and simulated preferential leakage pathway (simulating a liner defect) are provided in Table 2. Two monitoring arrays were implemented (Figure 6): Group 1 (Points 1–3) positioned across different media (Point 1: concrete dam; Point 2: basal soil; Point 3: leakage pathway) to assess media-dependent leakage rate effects on SP amplitude; Group 2 (Points 4–6) distributed along the leakage path (Point 4: proximal upstream; Point 5: mid-path; Point 6: downstream toe) to evaluate spatial response characteristics.
Simulation results (Figure 7, corresponding to monitoring Points 1–3 in Figure 6) demonstrate that while self-potential (SP) signals at monitoring points in different media (Points 1–3) exhibit similar temporal trends, their amplitudes differ substantially. Point 1 (concrete dam) showed minimal SP variation amplitude, consistent with its extremely low permeability and consequently minimal leakage flux. Point 2 (basal soil layer) exhibited moderate SP amplitude increases corresponding to higher leakage flux. Point 3 (preferential leakage pathway) generated maximum SP amplitudes due to the highest permeability and leakage flux. This establishes a clear positive correlation between SP signal amplitude and local leakage flux.
Figure 8 (corresponding to Figure 6 model) presents the spatial response of SP signals at monitoring points positioned along the leakage pathway (Points 4–6). Point 6 (downstream toe region) exhibited the most pronounced SP variation amplitude during initial leakage stages, attributable to its immediate proximity to the primary leakage source near the preferential pathway outlet. Notably, Points 4 (proximal upstream) and 5 (mid-path) also generated significant SP amplitudes despite their upstream locations. As leakage progressed, Point 4 displayed a distinct downward signal trend first, followed subsequently by Point 5. Conversely, Point 6 maintained a sustained positive SP trend throughout the monitoring period.

4. Discussion

This study quantitatively elucidates the dynamic response mechanism of the Self-Potential (SP) method to heavy metal contaminant leakage fronts and validates its potential as an early-warning technology, by developing a transient coupled model integrating seepage, ionic diffusion, and electrical potential fields. Key findings demonstrate that the advancement of the seepage front is the primary driver of significant SP anomalies. The underlying physical basis lies in the electrokinetic effect (streaming potential) induced by fluid flow. The characteristic bipolar configuration spatial pattern of these anomalies provides an intrinsic electrical fingerprint for the real-time tracking of seepage pathway evolution. Critically, the SP signal exhibits significant temporal precedence in its response to the advancing seepage front relative to contaminant migration (Case 1). At monitoring points, the electrical potential exhibits rapid change following the arrival of the water seepage front, whereas a substantial rise in contaminant concentration demonstrably lags. This divergence arises because the SP response directly senses fluid motion itself, without requiring the slower processes of contaminant ion diffusion or advective transport. This fundamental difference in physical mechanism confers a unique advantage upon SP over conventional, concentration-dependent geophysical methods such as Electrical Resistivity Tomography (ERT). While ERT, Ground Penetrating Radar (GPR), and Induced Polarization (IP) are highly effective for mapping the spatial extent of contamination, they require the contaminant plume to sufficiently alter the subsurface physical properties (e.g., electrical conductivity) to generate a detectable anomaly. This inherent dependency results in the insufficient sensitivity observed during the early stages of leakage and within zones of low contaminant concentration—a key limitation that SP effectively overcomes [34]. Consequently, the SP method offers a unique advantage for capturing rapidly expanding leakage fronts.
For practical implementation, monitoring point placement is paramount to warning sensitivity (Case 2). The study confirms that SP signal amplitudes are most pronounced near critical downstream areas along the seepage path. This enhanced response is attributed to the fact that such locations typically constitute seepage convergence zones with higher flow velocities, in which geometric conditions favor enhanced charge accumulation and the generation of strong streaming potentials. In contrast, locations remote from the primary seepage path or shielded by low-permeability structures (e.g., concrete dam structures, Monitoring Point 1) exhibit markedly weaker responses. These findings robustly support an optimized deployment strategy: prioritizing dense monitoring arrays within potential downstream discharge zones (e.g., toe slopes) to capture the sustained enhancement of positive potential anomalies as a core criterion for early warning of seepage front arrival. Leveraging the significant positive correlation established between SP signal amplitude and local seepage velocity (Case 2), SP monitoring offers not only qualitative detection of leakage initiation but also holds considerable potential for quantitative estimation of leakage rates. Compared to mainstream geophysical techniques like ERT, Ground Penetrating Radar (GPR), and Induced Polarization (IP), SP demonstrates distinct advantages in response speed (for front detection) and deployment cost. The crucial warning time window of approximately 1.5 h gained in downstream critical zones provides valuable time for implementing emergency pollution control measures (e.g., source containment, pump initiation), thereby effectively mitigating environmental contamination risks.
However, the study also reveals challenges for field-scale SP application: Firstly, within very low-permeability media (e.g., intact concrete, dense clay layers), minimal fluid flow results in weak streaming potential signals, potentially compromising monitoring effectiveness. Secondly, the streaming potential coupling coefficient, a key parameter governing the signal strength per unit flow, exhibits spatial variability driven by lithology, pore structure, and pore fluid chemistry (e.g., contaminant type, ionic strength, pH). This variability and uncertainty pose significant challenges for quantitative SP signal interpretation and the establishment of universal early-warning thresholds. Furthermore, model simplifications, such as neglecting diffusion potentials, assuming homogeneous media, and omitting complex background noise, potentially impact prediction accuracy. Future research should focus on the further validation and optimization of this approach in more complex, heterogeneous geological models and real-world field settings. Exploring joint inversion frameworks that integrate SP data with complementary methods like ERT and hydrological modeling—leveraging ERT for constraining the background electrical conductivity field—holds strong potential for significantly enhancing both leakage source localization accuracy and SP quantitative interpretation capabilities. Additionally, investigating the SP response characteristics under diverse contaminant types (impacting excess charge) and typical geological media will be essential for establishing a more robust early-warning indicator system.

5. Conclusions

This study establishes a rigorous theoretical foundation for deploying the Self-Potential (SP) method as an early-warning system for heavy metal contaminant leaks. Central to this capability is the method’s distinctive lead-time advantage: numerical simulations reveal that SP signals exhibit pronounced perturbations following the arrival of the hydraulic front, preceding detectable contaminant concentration changes by a practically significant margin. This temporal precedence arises because SP directly responds to electrokinetic coupling from fluid flow dynamics (streaming potentials), bypassing the slower advection-diffusion processes governing solute transport. Consequently, SP provides a critical early-warning window unavailable to concentration-dependent monitoring techniques like ERT.
Furthermore, SP anomalies serve as high-fidelity spatial indicators of subsurface flow paths. Leakage events generate a diagnostic dipolar potential structure that is characterized by upstream negative anomalies and robust positive anomalies concentrated at discharge zones (e.g., toe slopes or dam foundations). The persistent intensification of these downstream positive signals constitutes a definitive signature of seepage front advancement. Accordingly, strategic sensor deployment at high-sensitivity locations—identified as potential discharge pathways—maximizes detection of high-amplitude anomalies. This optimized deployment protocol demonstrably enhances both the sensitivity and operational reliability.
While challenges persist concerning signal attenuation in ultra-low permeability media (e.g., intact concrete) and spatial variability in electrokinetic coupling coefficients, our mechanistic model provides a physical basis for quantitative SP interpretation. Future work will prioritize field-scale validation in heterogeneous geological settings, multiphysics-enabled joint inversion with ERT/hydrological data to constrain source localization, and the development of AI-driven adaptive thresholds for intelligent early-warning platforms.

Author Contributions

Conceptualization, F.W. and H.L.; methodology, H.L.; software, F.W. and Y.L.; formal analysis, F.W. and H.L.; data curation, F.W. writing—original draft preparation, F.W.; writing—review and editing, W.Z. and X.J.; visualization, G.W. All authors have read and agreed to the published version of the manuscript.

Funding

This work was financially supported by National Key Research and Development Program of China (2022YFE0134600), Key Research and Development Program of GuangXi (AB22080055), and National Key Research and Development Program of China (2021YFA0715404).

Data Availability Statement

The raw data supporting the conclusions of this article will be made available by the authors on request.

Acknowledgments

The authors sincerely would like to thank the editors and the reviewers for their valuable suggestions.

Conflicts of Interest

Author Wei Zhang was employed by the company Zhe Jiang Environment Technology Company. The remaining authors declare that the research was conducted in the absence of any commercial or financial relationships that could be construed as a potential conflict of interest.

References

  1. Liu, R.; Xie, X.; Hou, Q.; Han, D.; Song, J.; Huang, G. Spatial distribution, sources, and human health risk assessment of elevated nitrate levels in groundwater of an agriculture-dominant coastal area in Hainan Island, China. J. Hydrol. 2024, 634, 131088. [Google Scholar] [CrossRef]
  2. Suknark, P.; Buddhawong, S.; Wangyao, K. Investigating the effect of waste age and soil covering on waste characteristics prior to landfill mining using an electrical resistivity tomography technique. J. Environ. Manag. 2023, 339, 117898. [Google Scholar] [CrossRef]
  3. Gamal, M.; Di, Q.; Zhang, J.; Fu, C.; Ebrahim, S.; El-Raouf, A.A. Utilizing Ground-Penetrating Radar for Water Leak Detection and Pipe Material Characterization in Environmental Studies: A Case Study. Remote Sens. 2023, 15, 4924. [Google Scholar] [CrossRef]
  4. Abdulsamad, F.; Revil, A.; Ahmed, A.S.; Coperey, A.; Karaoulis, M.; Nicais, S.; Peyras, L. Induced polarization tomography applied to the detection and the monitoring of leaks in embankments. Eng. Geol. 2019, 254, 89–101. [Google Scholar] [CrossRef]
  5. Ye, Z.; Ye, Y. Identification of shallow subsurface targets using an improved transient electromagnetic radar method. Tunn. Undergr. Space Technol. 2024, 151, 105866. [Google Scholar] [CrossRef]
  6. Kondracka, M.; Stan-Kleczek, I.; Sitek, S.; Ignatiuk, D. Evaluation of geophysical methods for characterizing industrial and municipal waste dumps. Waste Manag. 2021, 125, 27–39. [Google Scholar] [CrossRef]
  7. Li, F.; Li, K.; Su, A.; Tang, H. Detection of landslide groundwater based on magnetic resonance sounding given complex topography. Eng. Geol. 2024, 331, 107453. [Google Scholar] [CrossRef]
  8. Richter, D.; Goeppert, N.; Goldscheider, N. New insights into particle transport in karst conduits using comparative tracer tests with natural sediments and solutes during low-flow and high-flow conditions. Hydrol. Process. 2022, 36, e14472. [Google Scholar] [CrossRef]
  9. Yang, Q.; Hong, C.; Yuan, S.; Wu, P. Development and Verification of a Vertical Graphene Sensor for Tunnel Leakage Monitoring. ACS Appl. Mater. Interfaces 2024, 17, 3962–3972. [Google Scholar] [CrossRef] [PubMed]
  10. Sears, R.G.; Rigoulot, S.B.; Occhialini, A.; Morgan, B.; Kakeshpour, T.; Brabazon, H.; Barnes, C.N.; Seaberry, E.M.; Jacobs, B.; Brown, C.; et al. Engineered gamma radiation phytosensors for environmental monitoring. Plant Biotechnol. J. 2023, 21, 1745–1756. [Google Scholar] [CrossRef]
  11. Liu, R.; Jiang, S.; Ou, J.; Kouadio, K.L.; Xiong, B. Multifaceted anomaly detection framework for leachate monitoring in landfills. J. Environ. Manag. 2024, 368, 122130. [Google Scholar] [CrossRef]
  12. Revil, A.; Ghorbani, A.; Zhao, X.; Mouyeaux, A.; Barrere, L.; Richard, J.; Peyras, L.; Vaudelet, P. Groundwater flow paths using combined self-potential, electrical resistivity, and induced polarization signals. Geophys. J. Int. 2024, 239, 798–820. [Google Scholar] [CrossRef]
  13. Rani, P.; Piegari, E.; Di Maio, R.; Vitagliano, E.; Soupios, P.; Milano, L. Monitoring time evolution of self-potential anomaly sources by a new global optimization approach. Application to organic contaminant transport. J. Hydrol. 2019, 575, 955–964. [Google Scholar] [CrossRef]
  14. Bai, L.; Huo, Z.; Zeng, Z.; Liu, H.; Tan, J.; Wang, T. Groundwater flow monitoring using time-lapse electrical resistivity and Self Potential data. J. Appl. Geophys. 2021, 193, 104411. [Google Scholar] [CrossRef]
  15. Ahmed, A.S.; Revil, A.; Steck, B.; Vergniault, C.; Jardani, A.; Vinceslas, G. Self-potential signals associated with localized leaks in embankment dams and dikes. Eng. Geol. 2019, 253, 229–239. [Google Scholar] [CrossRef]
  16. Guo, Y.; Cui, Y.-a.; Xie, J.; Luo, Y.; Zhang, P.; Liu, H.; Liu, J. Seepage detection in earth-filled dam from self-potential and electrical resistivity tomography. Eng. Geol. 2022, 306, 106750. [Google Scholar] [CrossRef]
  17. Hu, K.; Huang, Q.; Han, P.; Zhang, Y.; Mo, C.; Li, S.; Jougnot, D. Characterization of rainwater infiltration within a controlled experiment by self-potential monitoring and modeling. J. Hydrol. 2025, 660, 133348. [Google Scholar] [CrossRef]
  18. Sun, X.; Qian, X.; Xu, Y.; Nai, C.; Liu, Y. Neglected flow direction detection in landfill water cycle: Precise characterization of leachate distribution through joint inversion of electrical resistivity and self-potential data. Water Cycle 2024, 5, 223–233. [Google Scholar] [CrossRef]
  19. Mehanee, S.A.; Essa, K.S.; Soliman, K.S.; Diab, Z.E. A fast imaging method for the interpretation of self-potential data with application to geothermal systems and mineral investigation. Sci. Rep. 2023, 13, 13548. [Google Scholar] [CrossRef] [PubMed]
  20. Hu, K.; Jougnot, D.; Huang, Q.; Looms, M.C.; Linde, N. Advancing quantitative understanding of self-potential signatures in the critical zone through long-term monitoring. J. Hydrol. 2020, 585, 124771. [Google Scholar] [CrossRef]
  21. Abbas, M.; Jardani, A.; Ahmed, A.S.; Revil, A.; Brigaud, L.; Begassat, P.; Dupont, J.P. Redox potential distribution of an organic-rich contaminated site obtained by the inversion of self-potential data. J. Hydrol. 2017, 554, 111–127. [Google Scholar] [CrossRef]
  22. Soldi, M.; Guarracino, L.; Jougnot, D. An effective excess charge model to describe hysteresis effects on streaming potential. J. Hydrol. 2020, 588, 124949. [Google Scholar] [CrossRef]
  23. Rembert, F.; Jougnot, D.; Luquot, L.; Guerin, R. Interpreting Self-Potential Signal during Reactive Transport: Application to Calcite Dissolution and Precipitation. Water 2022, 14, 1632. [Google Scholar] [CrossRef]
  24. Hu, K.; Huang, Q.; Tang, M.; Xue, L.; Han, P. Self-potential variations associated with the slip of Huangnibazi Landslide. J. Appl. Geophys. 2024, 220, 105275. [Google Scholar] [CrossRef]
  25. Chen, Y.-F.; Chen, H.; Deng, J.-Z.; Liu, S.-M.; Tang, W.-W.; Wang, S. Three-dimensional forward modeling and response characteristics analysis of foundation pit leakage electric-field considering electrokinetic effect. Appl. Geophys. 2022, 19, 117–131. [Google Scholar] [CrossRef]
  26. Boleve, A.; Vandemeulebrouck, J.; Grangeon, J. Dyke leakage localization and hydraulic permeability estimation through self-potential and hydro-acoustic measurements: Self-potential ‘abacus’ diagram for hydraulic permeability estimation and uncertainty computation. J. Appl. Geophys. 2012, 86, 17–28. [Google Scholar] [CrossRef]
  27. Richards, L.A. Capillary Conduction of Liquids Through Porous Mediums. J. Appl. Phys. 1931, 1, 318–333. [Google Scholar] [CrossRef]
  28. Hayek, M. Analytical solution for steady vertical flux through unsaturated soils based on van Genuchten-Mualem model. J. Hydrol. 2024, 634, 131066. [Google Scholar] [CrossRef]
  29. Jafari, A.; Vahab, M.; Broumand, P.; Khalili, N. An eXtended finite element method implementation in COMSOL multiphysics: Thermo-hydro-mechanical modeling of fluid flow in discontinuous porous media. Comput. Geotech. 2023, 159, 105458. [Google Scholar] [CrossRef]
  30. Onaa, C.; Olaobaju, E.A.; Amro, M.M. Experimental and numerical assessment of Light Non-Aqueous Phase Liquid (LNAPL) subsurface migration behavior in the vicinity of groundwater table. Environ. Technol. Innov. 2021, 23, 101573. [Google Scholar] [CrossRef]
  31. Shen, H.; Huang, Y.; Illman, W.A.; Su, Y.; Miao, K. Migration behaviour of LNAPL in fractures filled with porous media: Laboratory experiments and numerical simulations. J. Contam. Hydrol. 2023, 253, 104118. [Google Scholar] [CrossRef] [PubMed]
  32. Aranda, N.; Elis, V.R.; Prado, R.L.; Miguel, M.G.; Alves de Godoy Leme, M.; Conicelli, B.; Guzman, O. Electrical resistivity methods to characterize the moisture content in Brazilian sanitary landfill. Environ. Monit. Assess. 2021, 193, 277. [Google Scholar] [CrossRef] [PubMed]
  33. Dawrea, A.; Zytner, R.G.; Donald, J. Enhanced GPR data interpretation to estimate in situ water saturation in a landfill. Waste Manag. 2021, 120, 175–182. [Google Scholar] [CrossRef]
  34. Meng, F.; Wang, J.; Zhao, Y. Mapping and monitoring dense non-aqueous phase liquid source zone by fused surface and cross-borehole electrical resistivity tomography. J. Hazard. Mater. 2024, 478, 135618. [Google Scholar] [CrossRef] [PubMed]
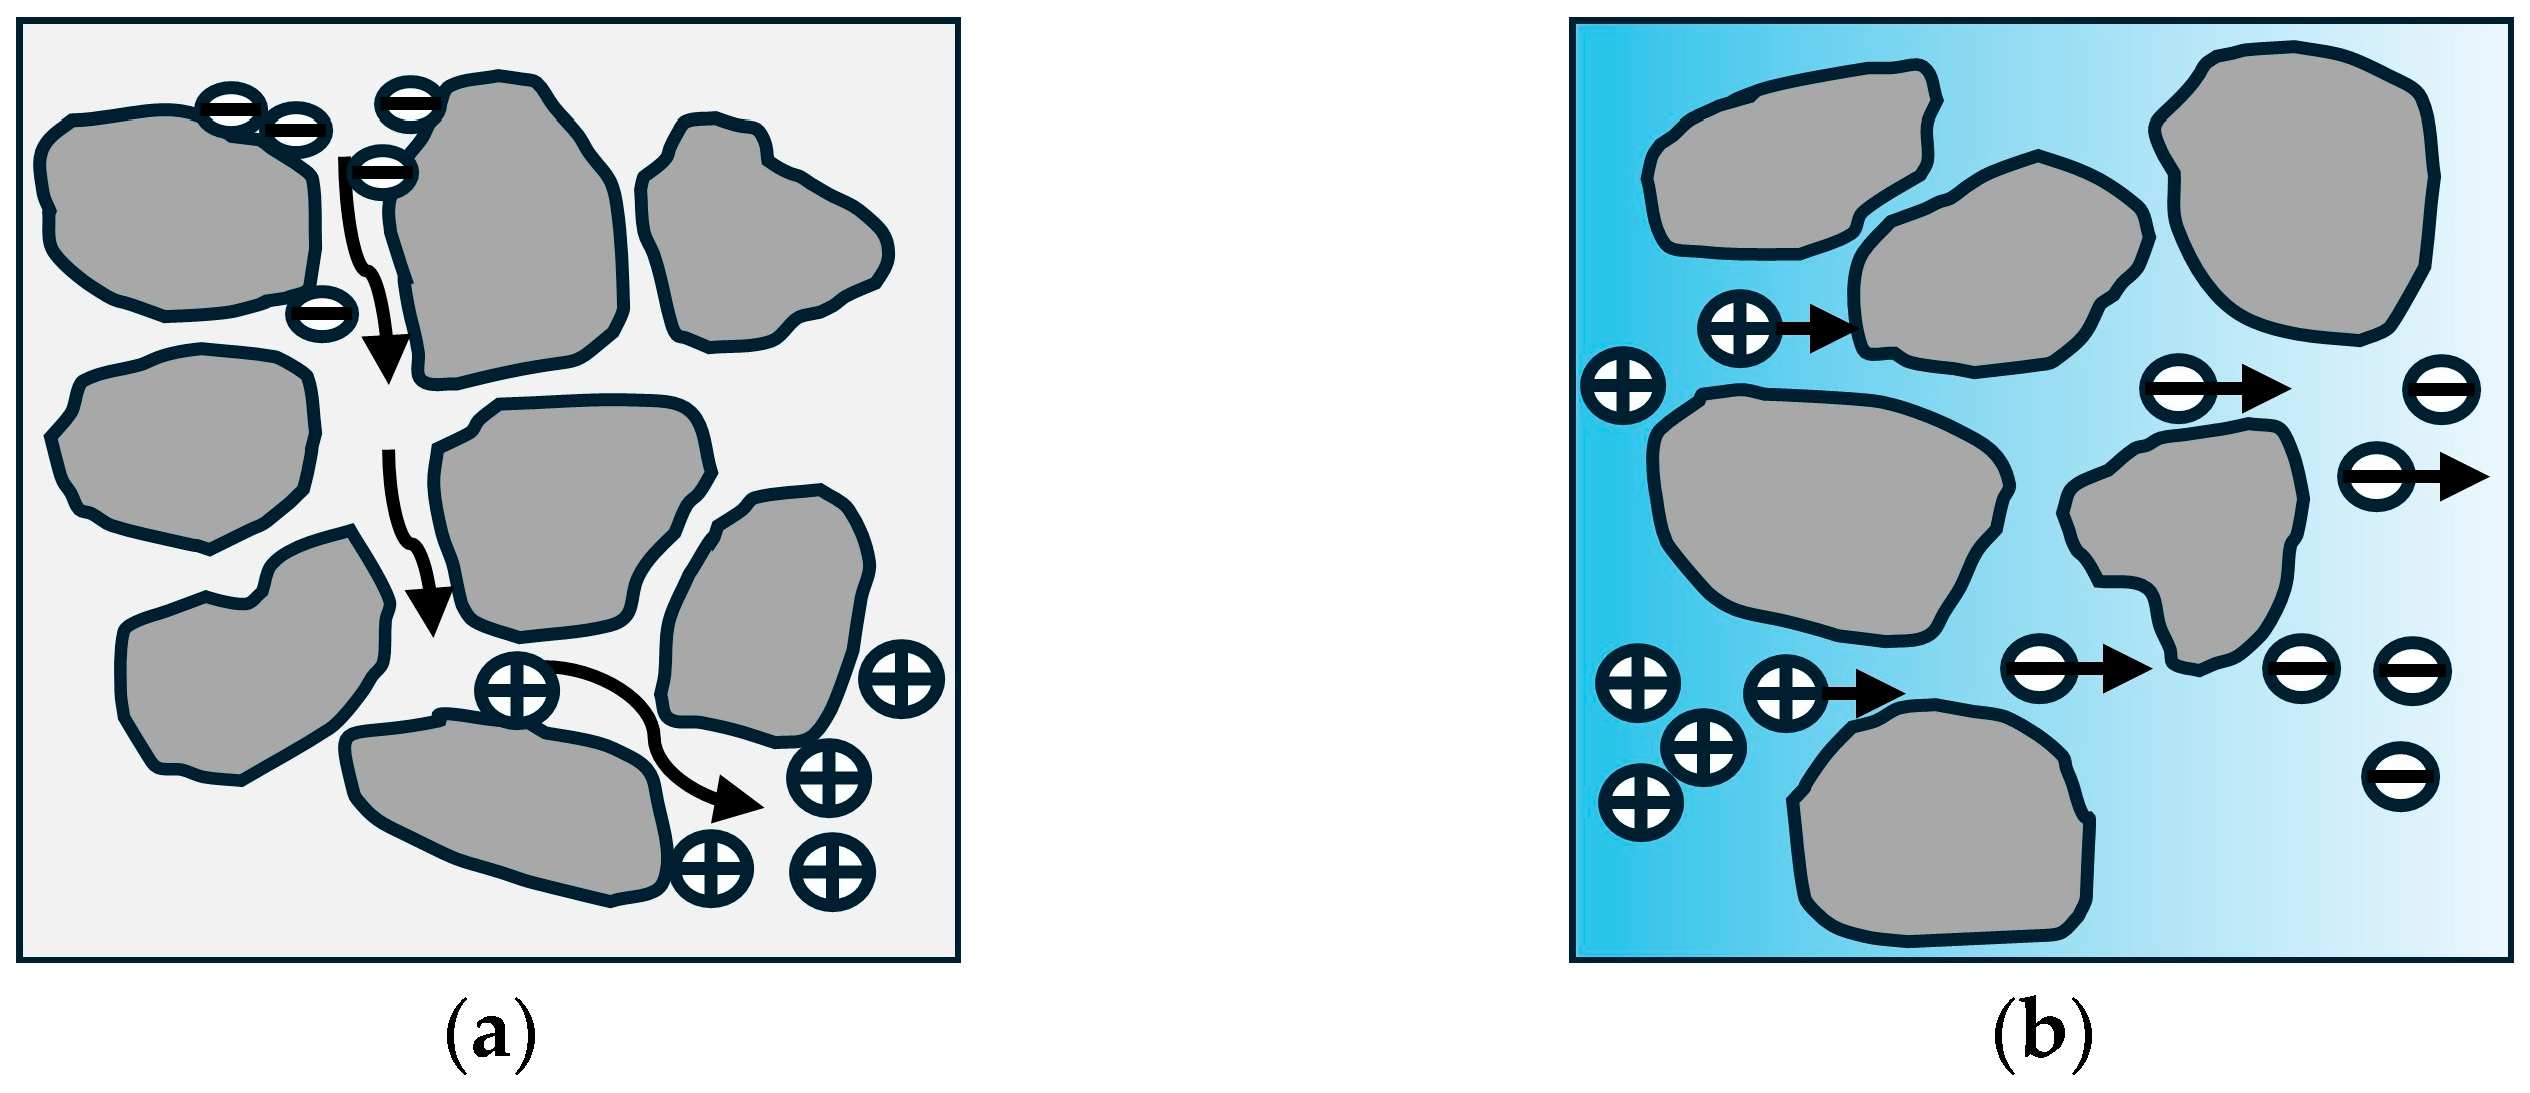
Figure 1. Formation mechanisms of spontaneous electric fields. (a) Seepage-induced field. (b) Diffusion-induced field.
Water 17 02839 g001
Figure 2. Three-dimensional leakage model setup. (a) Schematic diagram of the model domain. (b) Computational mesh with local refinement.
Water 17 02839 g002
Figure 3. Transient evolution of key parameters at the monitoring point (4, 4, −3). (a) Water saturation and electrical resistivity. (b) Spontaneous potential (SP) and contaminant concentration.
Water 17 02839 g003
Figure 4. Temporal evolution of SP anomaly distribution on the Y = 4 m cross-section. (a) Initial leakage stage (t = 0.5 h). (b) Intermediate leakage stage (t = 2 h). (c) Advanced leakage stage (t = 5 h).
Water 17 02839 g004
Figure 5. Temporal evolution of contaminant concentration distribution on the Y = 4 m cross-section. (a) Initial leakage stage (t = 0.5 h). (b) Intermediate leakage stage (t = 2 h). (c) Advanced leakage stage (t = 5 h).
Water 17 02839 g005
Figure 6. Schematic diagram of the landfill leakage model with monitoring points.
Water 17 02839 g006
Figure 7. SP response at monitoring points within different media (Points 1–3).
Water 17 02839 g007
Figure 8. SP response at monitoring points along the leakage pathway (Points 4–6).
Water 17 02839 g008
Table 1. Material properties for Case 1 simulation.
Material PropertySoilContaminated Liquid
Permeability/(m2)1.3·10−11——
Density/(kg/m3)13001000
Porosity0.3391
Dynamic viscosity/(Pa·s)——0.001
Concentration/(mol/m3)0.01100
Relative permittivityTopp equation——
Electrical conductivityArchie’s law——
Table 2. Material properties for Case 2 (landfill) simulation.
Material PropertyConcrete DamSeepage Channel
Permeability/(m2)1.3∙10−131.3∙10−9
Density/(kg/m3)13001000
Porosity0.10.6
Dynamic viscosity/(Pa·s)0.0010.001
Concentration/(mol/m3)00.01
Relative permittivityTopp equationTopp equation
Electrical conductivityArchie’s lawArchie’s law
Disclaimer/Publisher’s Note: The statements, opinions and data contained in all publications are solely those of the individual author(s) and contributor(s) and not of MDPI and/or the editor(s). MDPI and/or the editor(s) disclaim responsibility for any injury to people or property resulting from any ideas, methods, instructions or products referred to in the content.