Article

Assessment of Wetlands in Liaoning Province, China

1
Liaodong University School of Science, Dandong 118000, China
2
College of Animal Science and Veterinary Medicine, Jinzhou Medical University, Jinzhou 121001, China
3
Key Laboratory of Ecosystem Network Observation and Modeling, Institute of Geographic Sciences and Natural Resources Research, Chinese Academy of Sciences, Beijing 100101, China
4
Beijing Key Laboratory of Wetland Services and Restoration, Institute of Ecological Conservation and Restoration, Chinese Academy of Forestry, Beijing 100091, China
5
Sichuan Zoige Wetland Ecosystem Research Station, Tibetan Autonomous Prefecture of Aba 624500, China
*
Author to whom correspondence should be addressed.
Water 2025, 17(19), 2827; https://doi.org/10.3390/w17192827
Submission received: 14 August 2025 / Revised: 22 September 2025 / Accepted: 24 September 2025 / Published: 26 September 2025
(This article belongs to the Special Issue Impacts of Climate Change & Human Activities on Wetland Ecosystems)

Abstract

In recent years, under the dual pressures of climate change and human activities, wetlands in Liaoning Province, China, are increasingly threatened, raising concerns about regional ecological security. To better understand these changes, we developed a vulnerability assessment framework integrating a 30 m wetland dataset (2000–2020) with multi-source environmental and socio-economic data. Using the XGBoost–SHAP model, we analyzed wetland spatiotemporal evolution, driving mechanisms, and ecological vulnerability. Results show the following: (1) ecosystem service functions exhibited significant spatiotemporal differentiation; carbon storage has generally increased, water conservation capacity has significantly improved in the northern region, while wind erosion control and soil retention functions have declined due to urban expansion and agricultural development; (2) driving factors had evolved dynamically, shifting from population density in the early period to increasing influences of precipitation, vegetation index, GDP, and wetland area in later years; (3) ecologically vulnerable areas demonstrated a pattern of fragmented patches coexisting with zonal distribution, forming a three-level spatial gradient of ecological vulnerability—high in the north, moderate in the central region, and low in the southeast. These findings demonstrate the cascading effects of natural and human drivers on wetland ecosystems, and provide a sound scientific basis for targeted conservation, ecological restoration, and adaptive management in Liaoning Province.

1. Introduction

As one of the most important and valuable ecosystems on earth, wetlands play a key role in hydrological regulation, biodiversity conservation, carbon sink function and climate regulation, and are known as the “kidneys of the earth” [1]. At the same time, wetlands are one of the most fragile ecosystems in the world and face serious threats. Since 1700, the global inland wetland area has shrunk by approximately 21% (confidence interval: 16–23%), primarily due to conversion to cropland and other land uses [2]. Wetland degradation directly reduces biodiversity. It also leads to ecological problems such as frequent floods and extreme droughts, which may destabilize wetland ecosystem functions or even lead to their collapse [3]. Therefore, it is necessary to analyze the spatial and temporal evolution of wetlands and to reveal the mechanisms driving these changes. Building a scientific system to assess ecological vulnerability is both the basis for sustainable management and a strategic need for national ecological security.
The evolution of wetland patterns is a complex process shaped by natural and human factors [4]. At the naturally driven dimension, climate is fundamental. Temperature and precipitation affect the spatial distribution of wetlands directly and indirectly by regulating the hydrological cycle [5]. Geomorphology and soils also play key roles: topography controls wetland type and hydrology [6], while soil texture and organic matter determine ecological functions [7]. In the anthropogenically driven dimension, land-use change (especially urban expansion and agricultural resettlement) has become a major driver of wetland loss [8]. The construction of linear projects (e.g., roads) and hydraulic facilities (e.g., reservoirs), in particular, have caused persistent ecological disturbances to wetlands by fragmenting ecological corridors and altering hydrological cycles [9]. Although the academic community has initially explored the direct influence of multiple factors on the evolution of wetland patterns using spatial statistics and other methods [10], due to the scaling effect caused by spatial heterogeneity and the nonlinear coupling between multiple elements, the climate–topography–soil–human activity cascade-driven (direct or indirect) mechanisms still have significant cognitive gaps. Therefore, developing a multi-factor synergy model to quantitatively analyze the direct effects and indirect transmission paths of each driving factor is of great scientific value to establish a decision-making system for wetland conservation based on ecological processes.
The Liaoning wetlands are the most representative coastal wetlands in Northeast China and serve as a nationally important ecological reserve. They are also a critical stopover on the East Asia–Australasia migratory route, supporting over 200 species of migratory waterbirds annually, including the nationally protected Grus japonensis, which accounts for more than 60% of the global population, and the endangered black-billed gull (Larus saundersi) [11], which accounts for more than 30% of the global population. In recent years, wetlands in Liaoning Province have been facing severe ecological challenges. On the one hand, the decrease in precipitation and the frequent occurrence of extreme droughts due to climate change have significantly altered the hydrological characteristics of wetlands. Long-term meteorological records (2000–2020) reveal an overall declining trend in annual precipitation and enhanced interannual variability. In particular, 2001, 2007, and 2014 were representative drought years, each with markedly below-average precipitation, which caused severe water shortages in many wetlands. For example, in Panjin wetland, the precipitation in the growing season of 2007 was 15% lower than normal, which directly led to the lagging development of reeds and the decrease in plant height [12]. On the other hand, human activities such as urban expansion, agricultural development, and petroleum and natural gas resource extraction have led to reductions in reed swamp area (17.39% loss of natural wetlands in Liaodong Bay from 2000 to 2009) [13], declines in benthic biodiversity, and a marked weakening of wetland ecosystem functions. For example, petroleum and natural gas development in the Liaohe Delta has reduced wetland area by 37%, forcing Grus japonensis nesting sites to migrate to less disturbed edge areas [14,15]. However, the current study mostly focuses on the impact analysis of a single stressor (e.g., only climate or only human activities) and lacks a comprehensive assessment of the vulnerability of wetland systems under the “natural-anthropogenic” composite pressures. In particular, the failure to effectively integrate multi-dimensional driving factors such as climate variability, agricultural settlement, and industrial development, and to construct a vulnerability assessment model with regional adaptability [16,17], has severely restricted the accurate prediction and management decisions of wetland ecosystem degradation risk in Liaoning Province.
Based on this, this study focused on Liaoning Province as the research area, and used the InVEST model to quantitatively assess the spatial and temporal distribution characteristics of wetland ecosystem services during 2000–2020, focusing on analyzing the dynamic changes in the key service functions, such as carbon storage, windbreak and sand fixation, water conservation, and soil retention. Based on the PLUS model and random forest algorithm, the driving mechanisms of wetland pattern evolution were systematically analyzed. This study innovatively coupled the XGBoost-SHAP model and structural equation model (SEM) to construct a multi-scale analysis framework, and this multi-model fusion approach not only advances the theoretical framework of wetland ecosystem vulnerability assessment but also provides a sound scientific basis for the development of differentiated wetland protection policies. The results of the study will help to promote the sustainable management of wetland ecosystems in Northeast China and achieve the coordinated promotion of ecological protection and regional high-quality development. Therefore, understanding the driving mechanisms and ecological vulnerability of wetlands is crucial for regional ecological security and sustainable management. However, the specific objectives that address these gaps have not been explicitly articulated in previous studies. Therefore, this study’s aims are as follows:
(1)
Quantify the spatiotemporal evolution of wetland ecosystem services (carbon storage, water retention, soil retention, and wind-erosion control) in Liaoning Province from 2000 to 2020;
(2)
Identify the main driving pathways of natural and anthropogenic factors, distinguishing direct and indirect effects;
(3)
Construct a regional ecological vulnerability assessment framework and propose zonal management recommendations.

2. Materials and Methods

2.1. Study Area

The wetland ecological–economic zone of Liaoning Province (118°50′–125°47′ E, 38°43′–43°26′ N) covers 14 prefectural-level cities, including Shenyang, Dalian, and Anshan, covering a total area of approximately 1.48 × 10⁵ km2. The region is centered on the Liaohe Delta wetland and relies on the Bohai Rim city cluster. It has a temperate monsoon climate, with an average annual temperature of 7–11 °C, annual precipitation of 500–1000 mm, and four distinct seasons. The hydrological system contains major rivers such as the Liao, Hun, Taizi, and Daling, forming a composite coastal–estuarine wetland ecosystem.
By 2023, wetlands in Liaoning Province covered about 1.916 million hectares, with 26 wetland nature reserves, 40 wetland parks, and 31 provincially important wetlands established. These wetlands are mainly distributed in the Liaohe Delta, Liaodong Bay, and Shuangtai estuary, playing a vital role in regional ecological security and migratory bird conservation. The study area is shown in Figure 1.

2.2. Data Source

The Global 30 m Yearly Wetland Distribution Dataset (GWL_FCS30D) for 2000–2020 was used as the base data source for this study. This dataset classifies wetlands into two systems, inland wetlands (permanent water bodies, woody marshes, herbaceous marshes, floodplains, and salt marshes), and coastal wetlands (mangroves, salt marshes, and mudflats), with a total of eight subcategories [18]. In order to match the spatial resolution of the multi-source driver data, this study resampled the original 30 m raster data into 1 km grid cells by a GIS spatial aggregation method and calculated the wetland occupancy ratio of each cell using an area-weighted algorithm, thereby generating a spatially continuous time-series dataset.
Meteorological data for this study were obtained from the National Earth System Science Data Center (https://www.geodata.cn/, accessed on 1 August 2025), including air temperature, precipitation, evapotranspiration, and aridity. Annual values were derived by averaging or summing the monthly data. Soil data were obtained from OpenLandMap (https://openlandmap.org, accessed on 1 August 2025), a dataset that provides soil attribute data at six standard depths (0, 10, 30, 60, 100, and 200 cm) at 250 m spatial resolution, and soil pH, soil water content, soil sand content, and soil carbon content were extracted at 30 cm depth, while soil clay content and bulk density were used to represent near-surface soil properties. The spatial distribution data of 1:1 million landform types and population density data in China were obtained from the Resource and Environmental Science Data Center of the Chinese Academy of Sciences (https://www.resdc.cn/, accessed on 1 August 2025), and the 1 km-resolution DEM was generated by resampling based on the latest SRTMV4.1 data, and the slope data were calculated.
The nighttime light data with a spatial resolution of 500 m used in this study were obtained from the Harvard University database (https://databases.hollis.harvard.edu, accessed on 1 August 2025). The data were integrated with multi-source remote sensing data from DMSP-OLS (Defense Meteorological Satellite Program Operational Linescan System) and SNPP-VIIRS (Suomi National Polar-orbiting Partnership Visible Infrared Imaging Radiometer Suite) multi-source remote sensing data. NPP and NDVI data were obtained using MOD17A3HGF data and MOD13A2 data provided by the National Aeronautics and Space Administration (NASA), with MOD13A2 NDVI data synthesized into annual values using the maximum value composite (MVC) method, based on a temporal resolution of 16 days. Land-use data were obtained from Yang and Huang et al. [19], which included nine major classifications: cropland, forests, shrubs, grasslands, water bodies, snow and ice, wasteland, impervious surfaces, and wetlands. Socio-economic data including rural population, year-end total population, total agricultural output, and county-level GDP were obtained from the National Statistical Yearbook. Detailed information is shown in Table 1.

2.3. Research Methods

2.3.1. Assessment of Wetland Ecosystem Service Functions

This study employed the InVEST model to quantitatively assess wetland ecosystem services in Liaoning Province, focusing on four modules: carbon storage, water conservation, soil conservation, and wind erosion control [20,21].
The carbon stock module is calculated based on the correspondence between land use/cover types and carbon pools, and the key formula is
C t o t a l = ( C a b o v e , i + C b e l o w , i + C s o i l , i + C d e a d , i ) × A i
where Cabove,i, Cbelow,i, Csoil,i and Cdead,i denote the carbon densities (Mg/ha) of biomass, below-ground biomass, soil organic matter, and litter for land use types of category i, respectively, and Ai is the area of land use types of category i. This module realizes the spatial and temporal dynamic assessment of regional carbon stock by integrating multi-period land use data and carbon density parameters.
The water conservation module applies Budyko’s coupled water–energy balance theory to quantify the water conservation capacity by calculating the difference between precipitation and actual evapotranspiration. The key formula is
W Y = P A E T Q s u r f
where WY is the water conservation capacity, P is the precipitation, AET is the actual evapotranspiration (obtained from the potential evapotranspiration PET corrected by Budyko’s equation), and Qsurf is the surface runoff.
The soil conservation module is based on the modified universal soil loss equation (RUSLE) and evaluates soil conservation by comparing potential soil erosion (Epot) with actual soil erosion (Eact). The formula is as follows:
E p o t   =   R × K × L S × C × P
E a c t = R × K × L S × C × P × S D R
where R, K, LS, C and P represent rainfall erosivity, soil erodibility, topography, vegetation cover and management measure factors, respectively, and SDR denotes the sediment delivery ratio, which accounts for topography and stream channel characteristics.
The Modified Wind Erosion Equation (RWEQ) was used in the wind erosion prevention module to assess the effectiveness of wind erosion prevention by analyzing the difference between the potential wind erosion (SLp) and the actual wind erosion (SLr). Its core calculation formula is as follows:
S L p   =   2 Z S 2 × Q m a x × e ( z / s ) 2
S L r = 2 Z S 2 × Q m a x × e ( z / s ) 2 × C
In the formula, Qmax is the maximum soil transport volume, which is related to wind force, soil erodibility, surface roughness, soil crust and climate. z is the wind speed; s is the soil transport distance. c is the vegetation cover factor, which indicates the inhibitory effect of the vegetation on the wind erosion.

2.3.2. Modeling Framework for Drivers of Wetland Pattern Evolution

In this study, the XGBoost-SHAP model and partial least squares structural equation modeling are used to analyze the hierarchical paths of natural-socioeconomic factors and the multi-scale transmission mechanisms:
XGBoost–SHAP is a machine-learning-based feature importance analysis approach that enables scientific interpretation of complex drivers by constructing an integrated decision tree to capture nonlinear relationships among variables and quantifies each feature’s contribution to the predicted outcome using the Shapley value from game theory [22]. In this study, the XGBoost-SHAP model was used to identify and analyze the key drivers of wetland pattern changes. The degree of influence of each driver on the evolution of wetland pattern was assessed by the SHAP value, and larger absolute SHAP values indicate stronger explanatory power of a feature for wetland area changes. Meanwhile, the synergistic or antagonistic effects among drivers were identified through feature interaction analysis. Compared with traditional statistical methods, the XGBoost-SHAP model can better handle high-dimensional nonlinear data and provides intuitive rankings of feature importance as well as the direction of influence.
The partial least squares structural equation model (PLS-PM) is a correlation-based structural equation modeling method, and the model consists of two parts: (1) the external model, which is used to describe the relationship between the observed variables and the latent variables; (2) the internal model, which is used to describe the relationship between the latent variables. variables. Among them, latent variables are constructs that cannot be directly measured but are inferred from observed variables [23]. In this study, we categorized temperature and precipitation as meteorological factors; sand and clay content as soil factors; elevation and slope as topographical factors; and city location and population density as social factors. Each factor not only directly affects the distribution of wetlands but also interacts with each other. PLS-SEM analysis was conducted using the ‘plspm’ package in R to assess the potential relationships among the variables in the study. The coefficient of determination (R2) was used to assess the explanatory power of the model, goodness-of-fit (GOF) was used to measure the overall fit of the model, and average extracted variance (AVE) was used to test the validity of the model.

2.3.3. Ecosystem Vulnerability Assessment

Ecological vulnerability comprises ecological exposure, ecological sensitivity, and ecological adaptive capacity, while social vulnerability comprises social exposure, social sensitivity, and social adaptive capacity. Ecological exposure was assessed by measuring the degree of human activity occupancy of net primary productivity (HANPP) and distance to wetlands. HANPP was calculated as the difference between potential and actual NPP, with potential NPP estimated using the Thornthwaite Memorial model [19]. Ecological sensitivity, on the other hand, included the ratio of HANPP to potential NPP, along with abiotic indicators such as soil organic carbon, precipitation, temperature, and slope. Ecological adaptive capacity reflected wetland ecosystem growth conditions and habitat quality, measured by indicators such as NDVI. After calculating the above indicators, the min-max standardization method was used to normalize them to the range of 0 to 1 to ensure the comparability between different indicators; the coefficient of variation method was used to assign weights to each indicator [24]. After completing the indicator normalization and weight assignment, the ecosystem vulnerability index (EVI) was calculated by the composite index method. According to the characteristics of the study area, the EVI was classified into five levels using a composite index approach: potential vulnerability (level I), slight vulnerability (level II), moderate vulnerability (level III), severe vulnerability (level IV), and extreme vulnerability (level V) [25].
E V I = j = 1 n ( W j × Y j )
where n denotes the number of indicators, Wj and Yj are the standardized value and weight of the jth indicator, respectively.

3. Results

3.1. Characteristics of Spatial and Temporal Evolution of Wetland Patterns in Liaoning Province

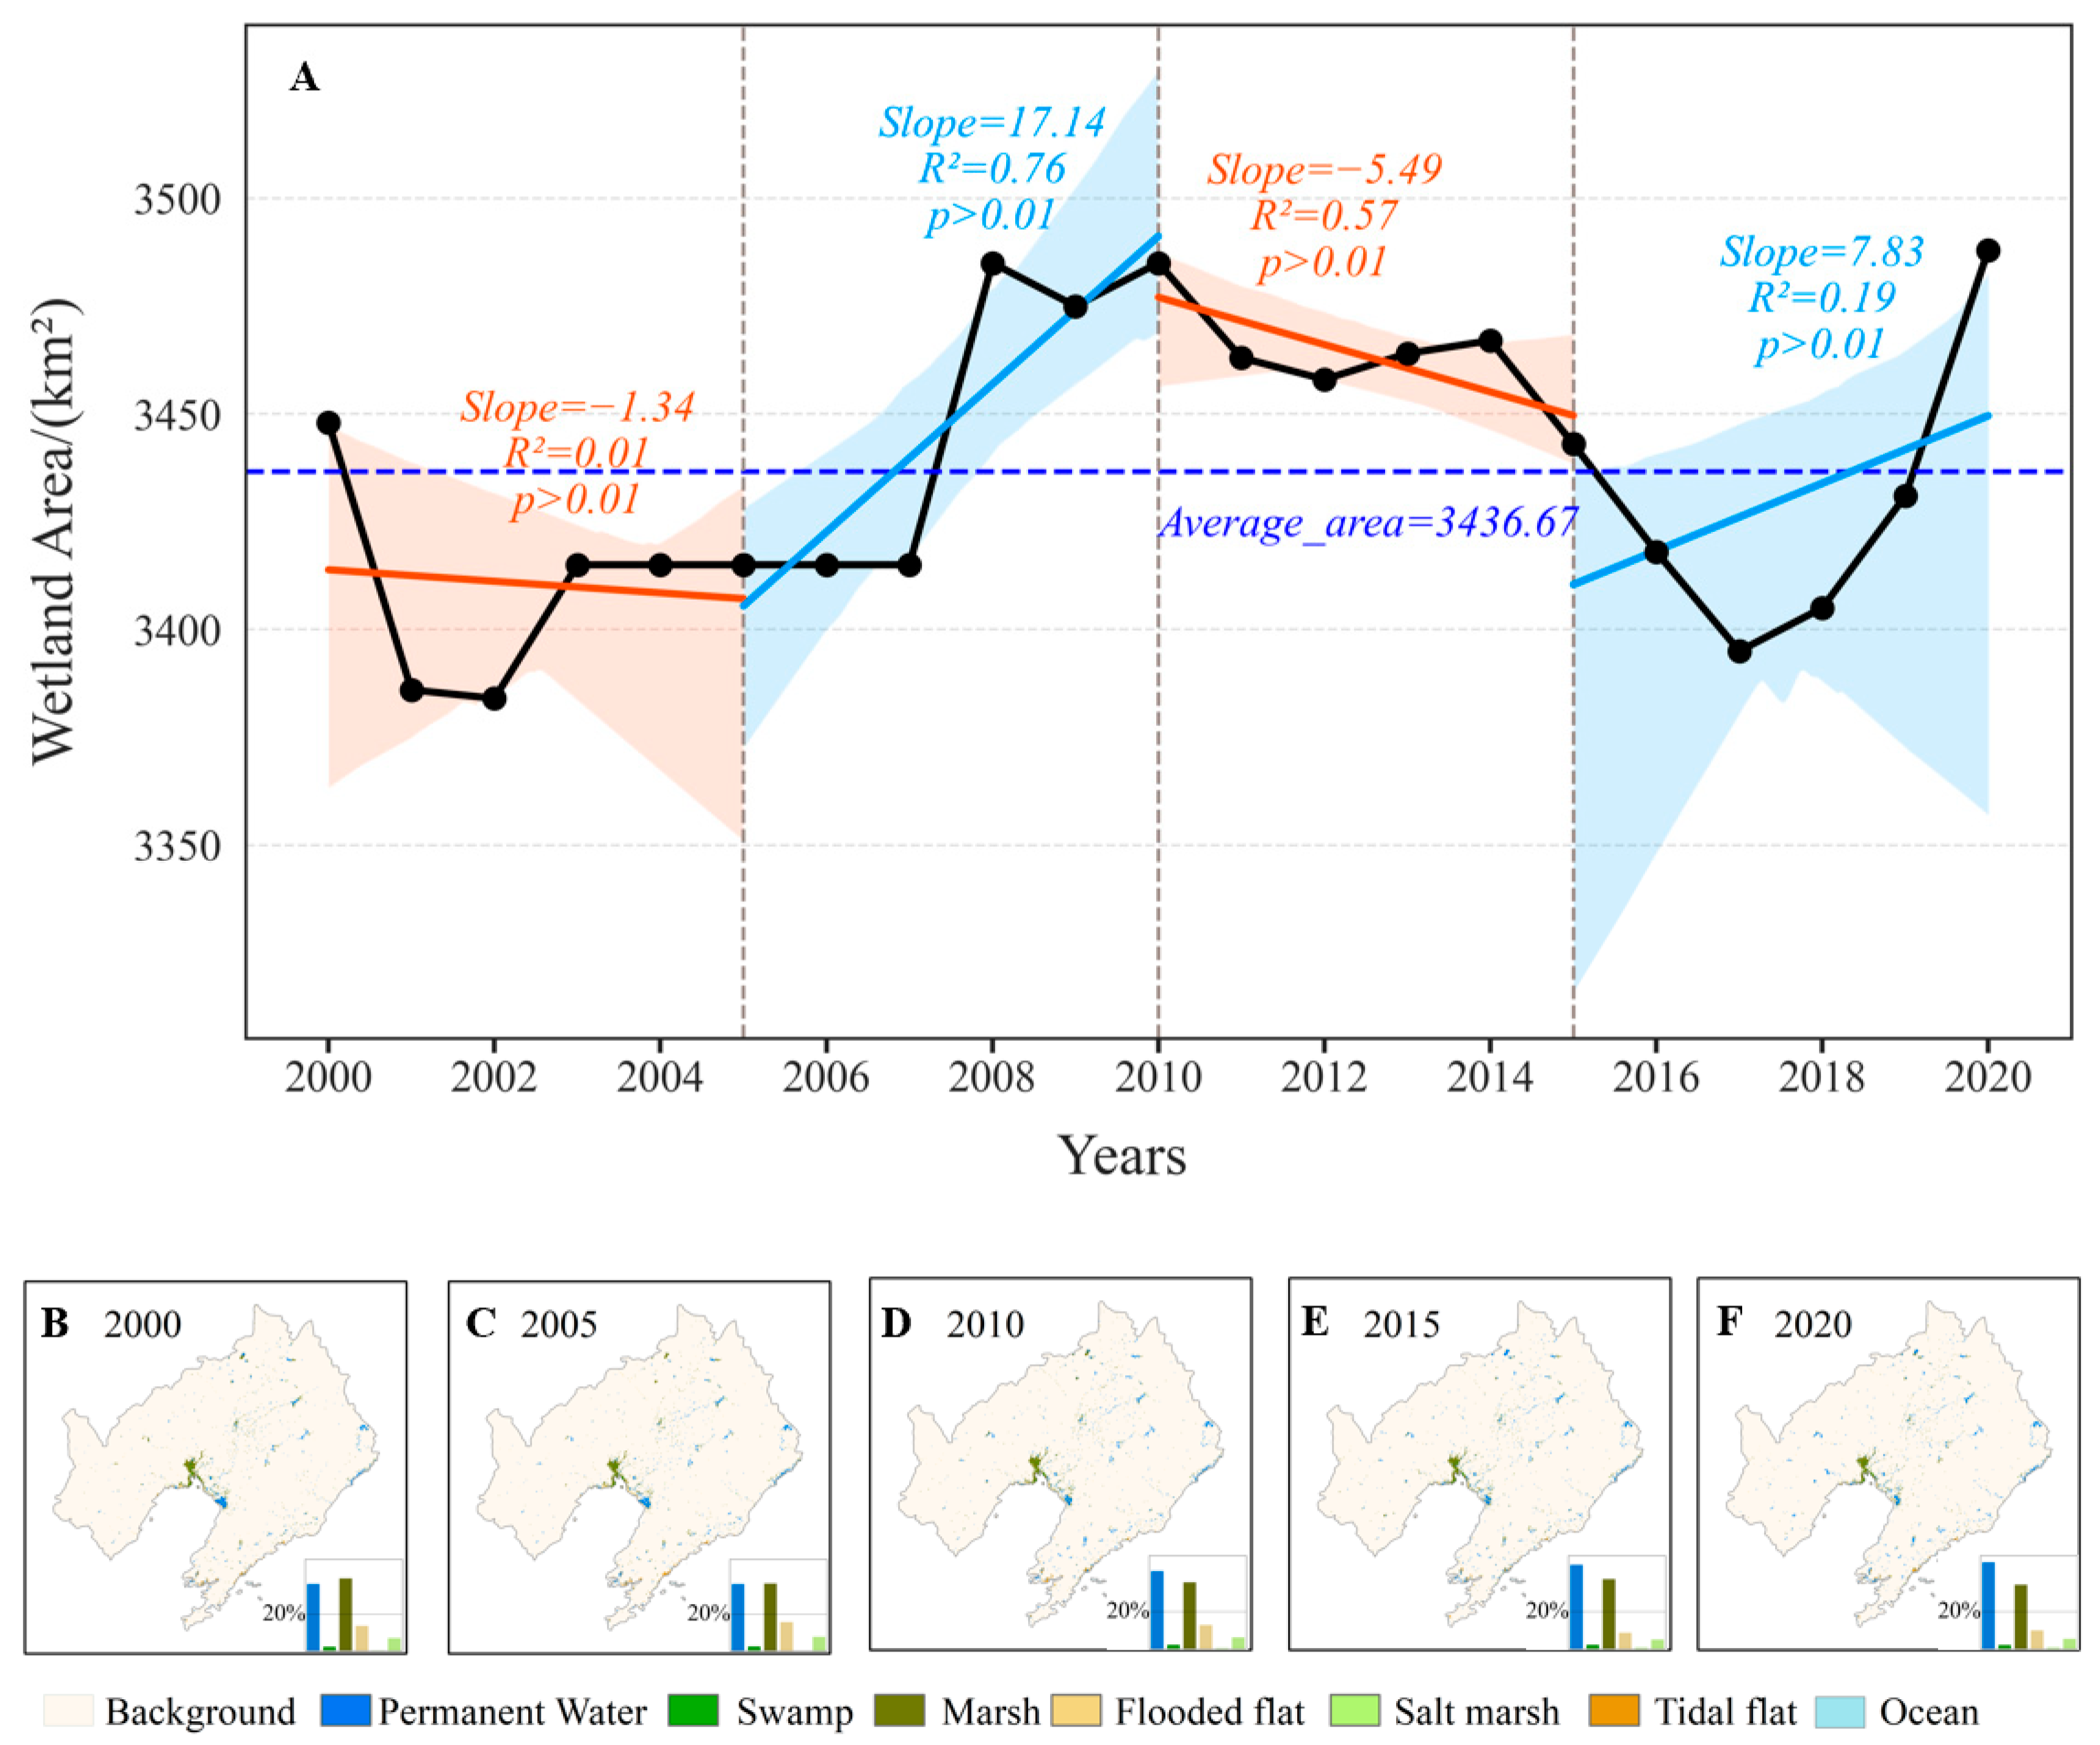
From 2000 to 2020, the wetland area in Liaoning Province exhibited a distinct V-shaped trend with three stages (Figure 2A). The area decreased from 2000 to 2005, increased rapidly from 2005 to 2010, and then fluctuated around an average of 3436.67 km2 after 2010. In terms of the change in wetland types (Figure 2B–F), the area of permanent water bodies continued to decline, with their proportion decreasing from about 60% to 40%; the area of herbaceous marshes increased steadily, with their proportion rising from about 25% to 35%; and the area of flood plains showed a fluctuating trend of increasing, then decreasing, then increasing, indicating that the wetland structure was continuously optimized under ecological restoration policies, although the system remained to some extent unstable.

3.2. Changes in Ecosystem Services of Wetlands in Liaoning Province

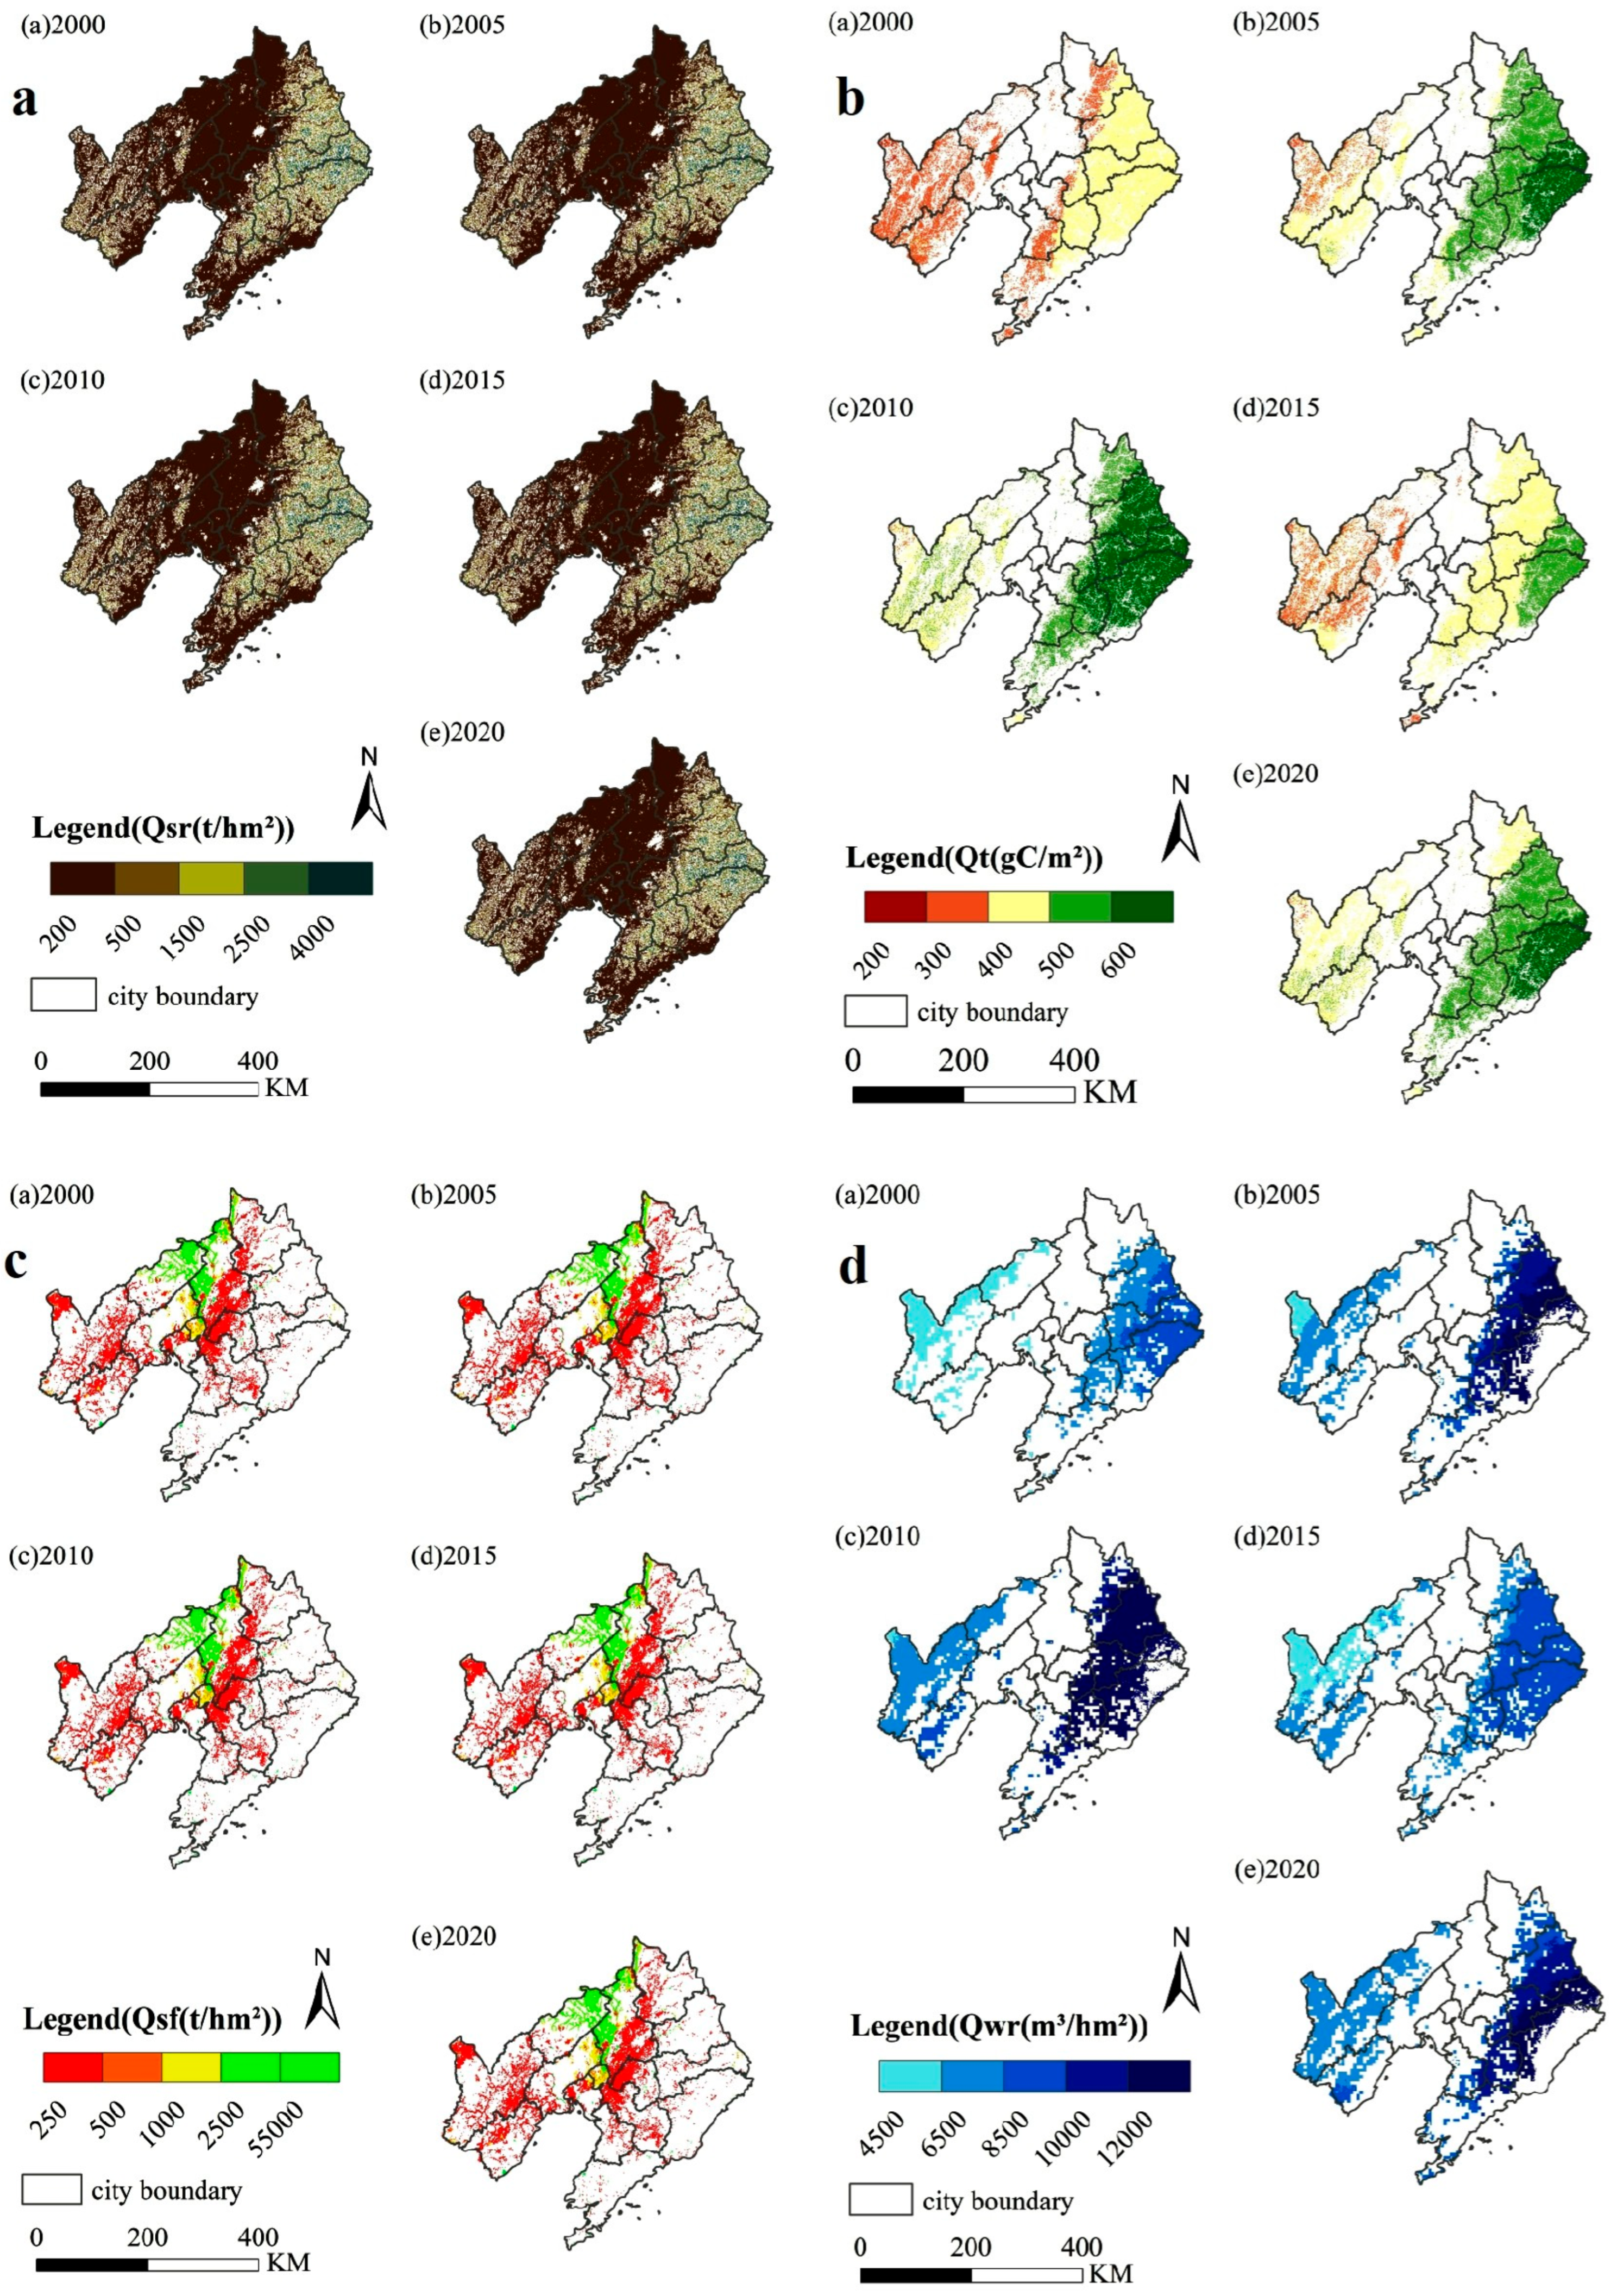
Figure 3 shows the changes in the four ecosystem service functions of wetland ecosystems in Liaoning Province from 2000 to 2020, namely carbon storage, water conservation, soil conservation, and wind erosion control. Among them, soil conservation (Qsr) decreased and then increased from 2000 to 2020, with little interannual variation in spatial distribution. High-value areas were mainly located in the eastern and western mountainous areas with good vegetation cover and the water conservation project area, while the soil conservation in the central urban and cropland areas was relatively low (Figure 3a); carbon storage (Qt) showed a fluctuating upward trend, with high-value areas concentrated in the forests and wetlands of the eastern mountainous region, and the low-value areas distributed in the central urban and cropland areas (Figure 3a,b); wind erosion control (Qsf) first declined and then increased. High-value areas were mainly the windbreak forest belts and well-preserved grasslands, while degraded grasslands and unvegetated sandy lands had lower values (Figure 3c); the amount of water retention (Qwr) rises in phases, and the high value area is the area around the mountainous forests and wetlands, and the urban and arid farmland are lower (Figure 3d).

3.3. Analysis of Drivers of Wetland Pattern Evolution

3.3.1. Influence of Driving Factors on the Evolution of Wetland Pattern

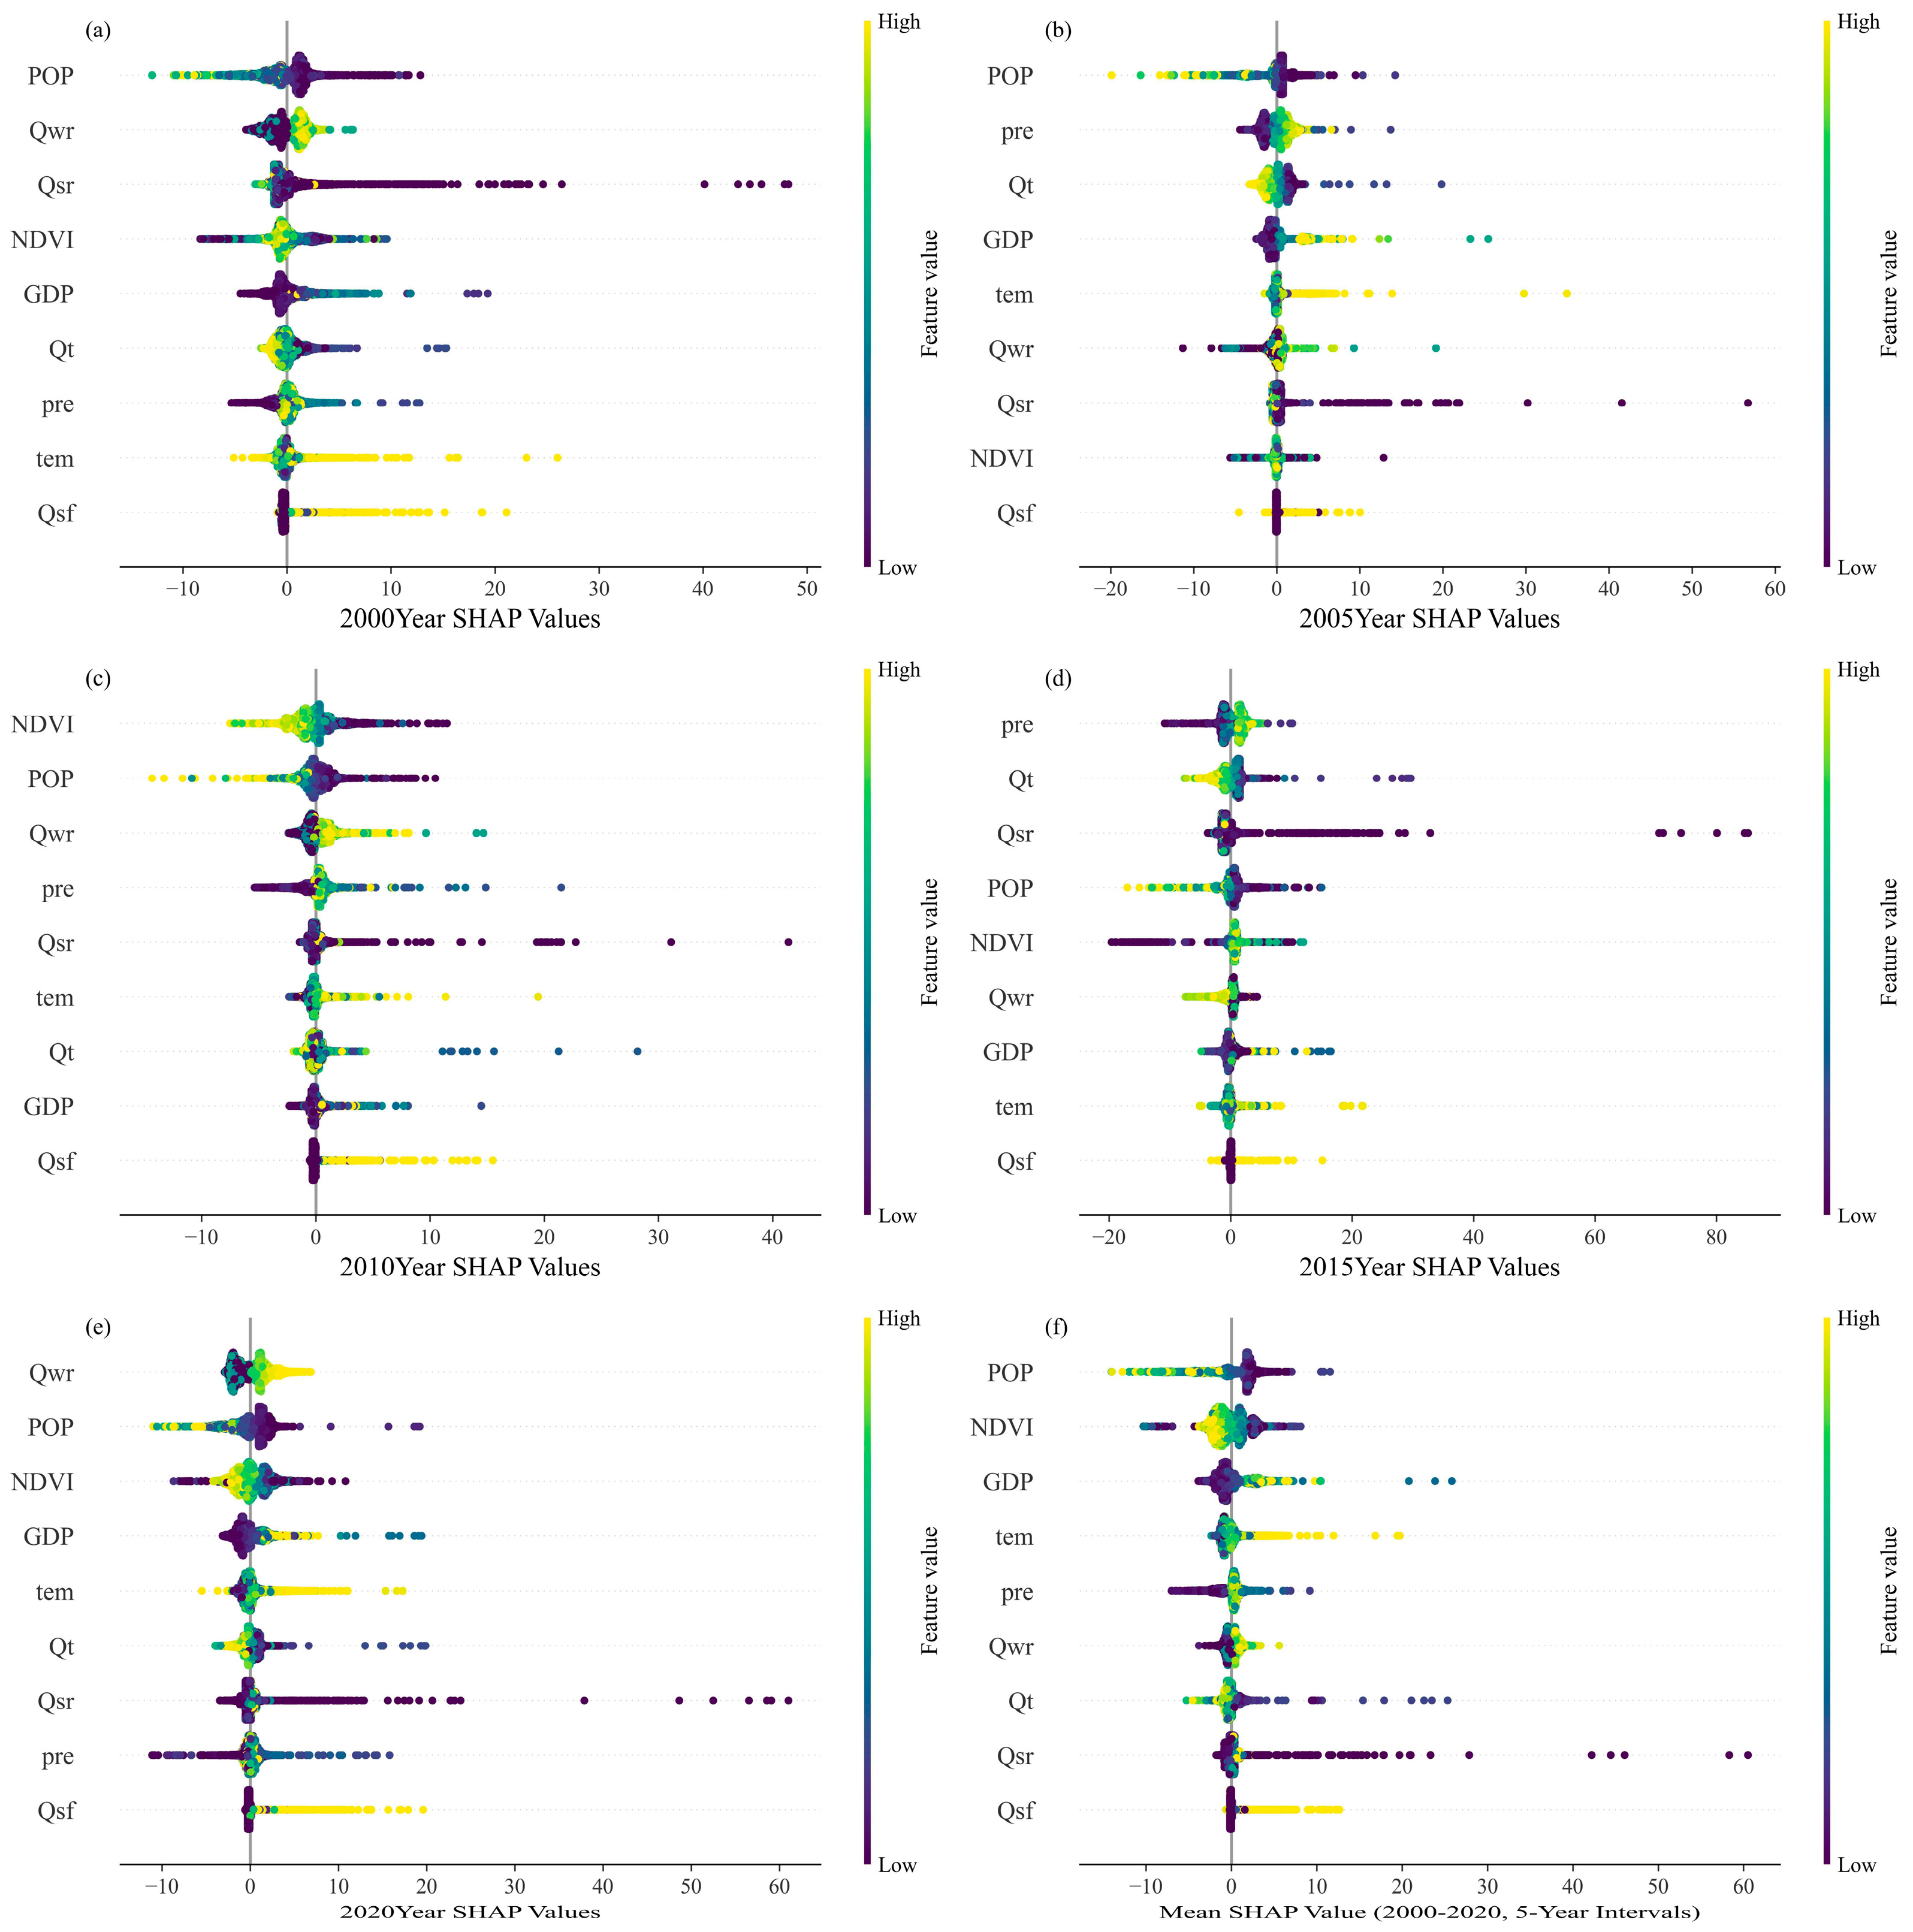
In this study, the drivers of wetland distribution patterns were analyzed based on the XGBoost-SHAP model (Figure 4). From the inter-annual average, the order of importance of the drivers on the changes in wetland distribution patterns (expressed as the mean value of |SHAP|) during the period of 2000–2020 was as follows: POP > NDVI > GDP > DEM > PRE > Qwr > Qt > Qsr > Qsf. From the different years, the impacts of drivers on wetland distribution patterns were as follows: 2000 and 2005, 2000 and 2005, 2000 and 2005, 2000 and 2005, respectively. Population density was the most important driver of wetland distribution patterns changes in 2000 and 2005, with |SHAP| mean values of 1.58 and 1.20, respectively, and NDVI emerged as the most sensitive indicator reflecting vegetation dynamics in 2010 (|SHAP| mean value of 1.19), which indirectly indicates the influence of climatic factors and land use intensity on wetland patterns. Precipitation had the most significant effect on wetland pattern in 2015, with a |SHAP| mean value of 1.32. In 2015, precipitation had the most significant influence on the wetland pattern, with a mean value of 1.32, and in 2020, the most important driving factor was water conservation, with a mean value of 1.55. |SHAP|. Overall, population density was the main driving force for the change in wetland distribution pattern in the early stage of the study, and the impacts of natural and socio-economic factors, such as precipitation, NDVI, GDP, etc., on the wetland distribution pattern were enhanced gradually with the time of study, indicating a dynamic evolution in the mechanisms driving wetland distribution pattern changes.

3.3.2. Influence of Direct and Indirect Factors on the Evolution of Wetland Patterns

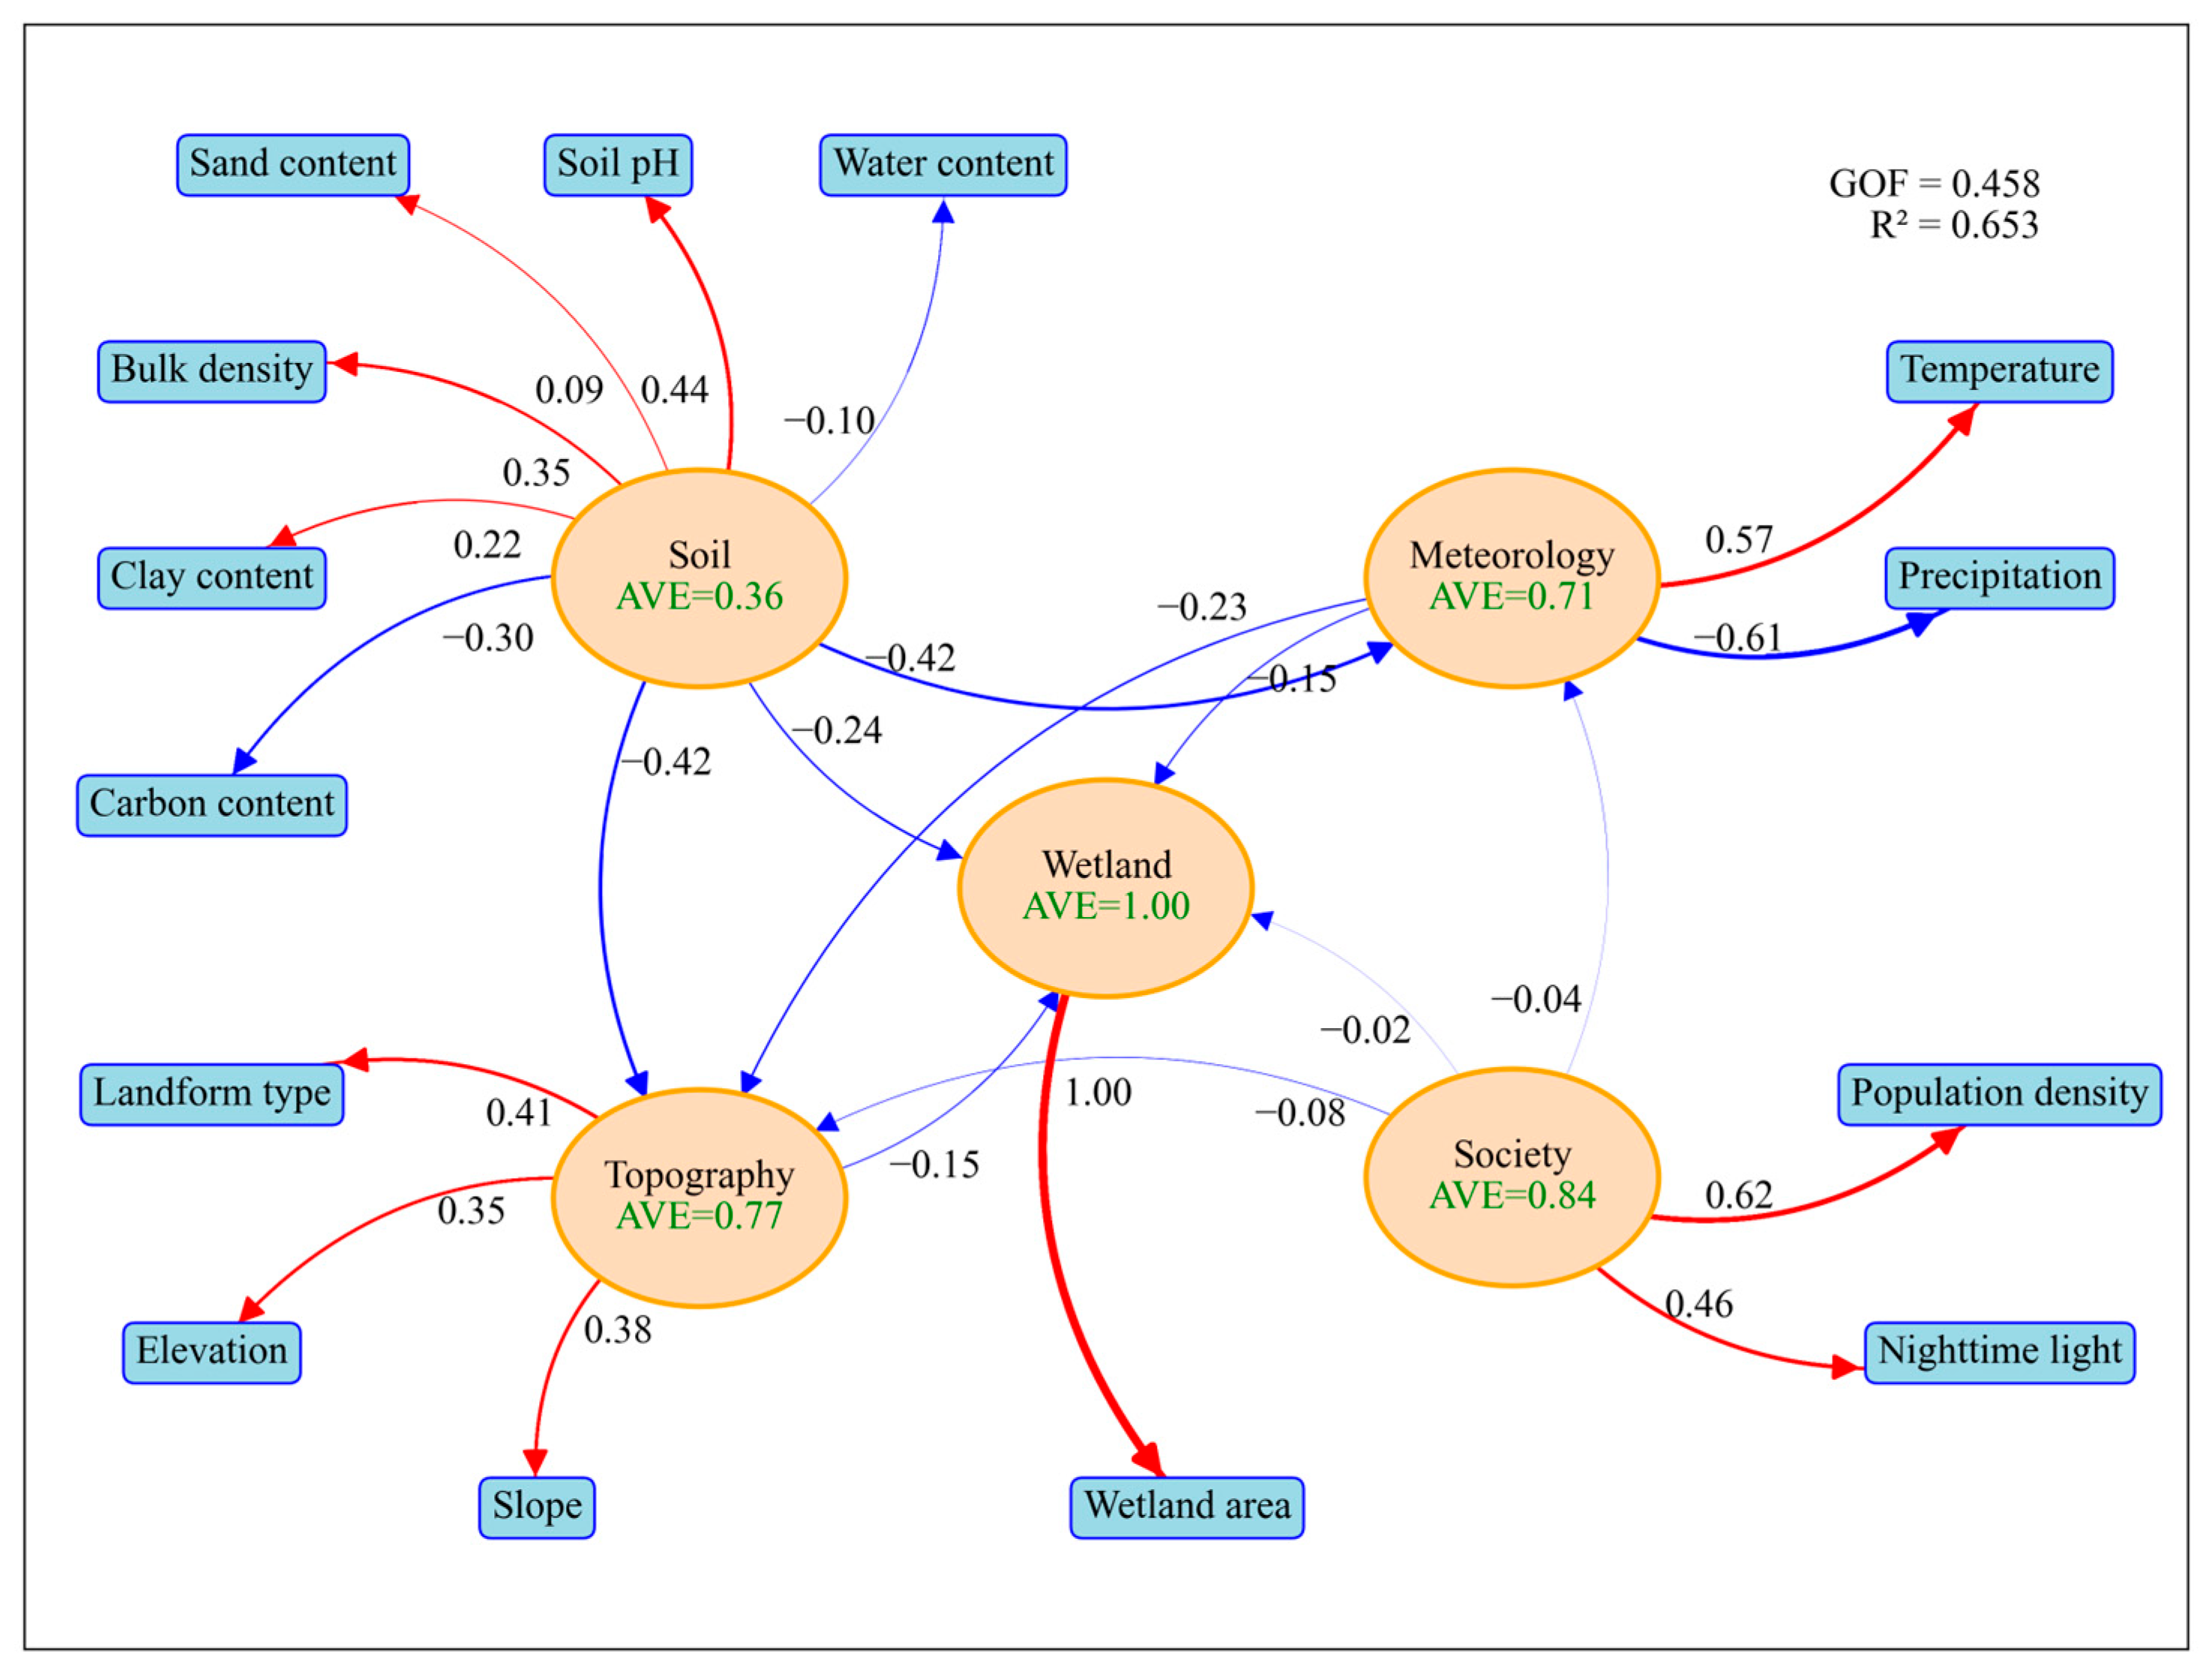
In this study, partial least squares structural equation modeling (PLS-PM) was used to systematically analyze the mechanisms by which multidimensional potential factors influence the spatial differentiation of wetlands. The model test results show that the GOF value reached 0.458, significantly higher than the benchmark of 0.36, confirming a good overall model fit. The R2 was 0.653, exceeding the conventional threshold of 0.3, indicating that the constructed variable system effectively explained wetland pattern evolution. In addition, the AVEs of the latent variables all exceeded 0.3, verifying a robust covariance relationship between the observed and corresponding latent variables. The AVEs of the latent variables were all higher than 0.3, which verified that the relationship between the explicit variables and corresponding latent variables was robust. The path coefficients in the model indicate the direct or indirect influence between each latent variable (Figure 5). Positive values indicate positive effects and negative values indicate negative effects. The results show that soil factors (e.g., soil texture, pH, moisture, and carbon content) emerged as the core constraints on wetland pattern evolution through direct inhibitory effects, whereas topographic factors influenced wetlands via multidirectional pathways, primarily through topography–climate coupling.

3.4. Spatial and Temporal Patterns of Wetland Ecosystem Vulnerability in Liaoning Province

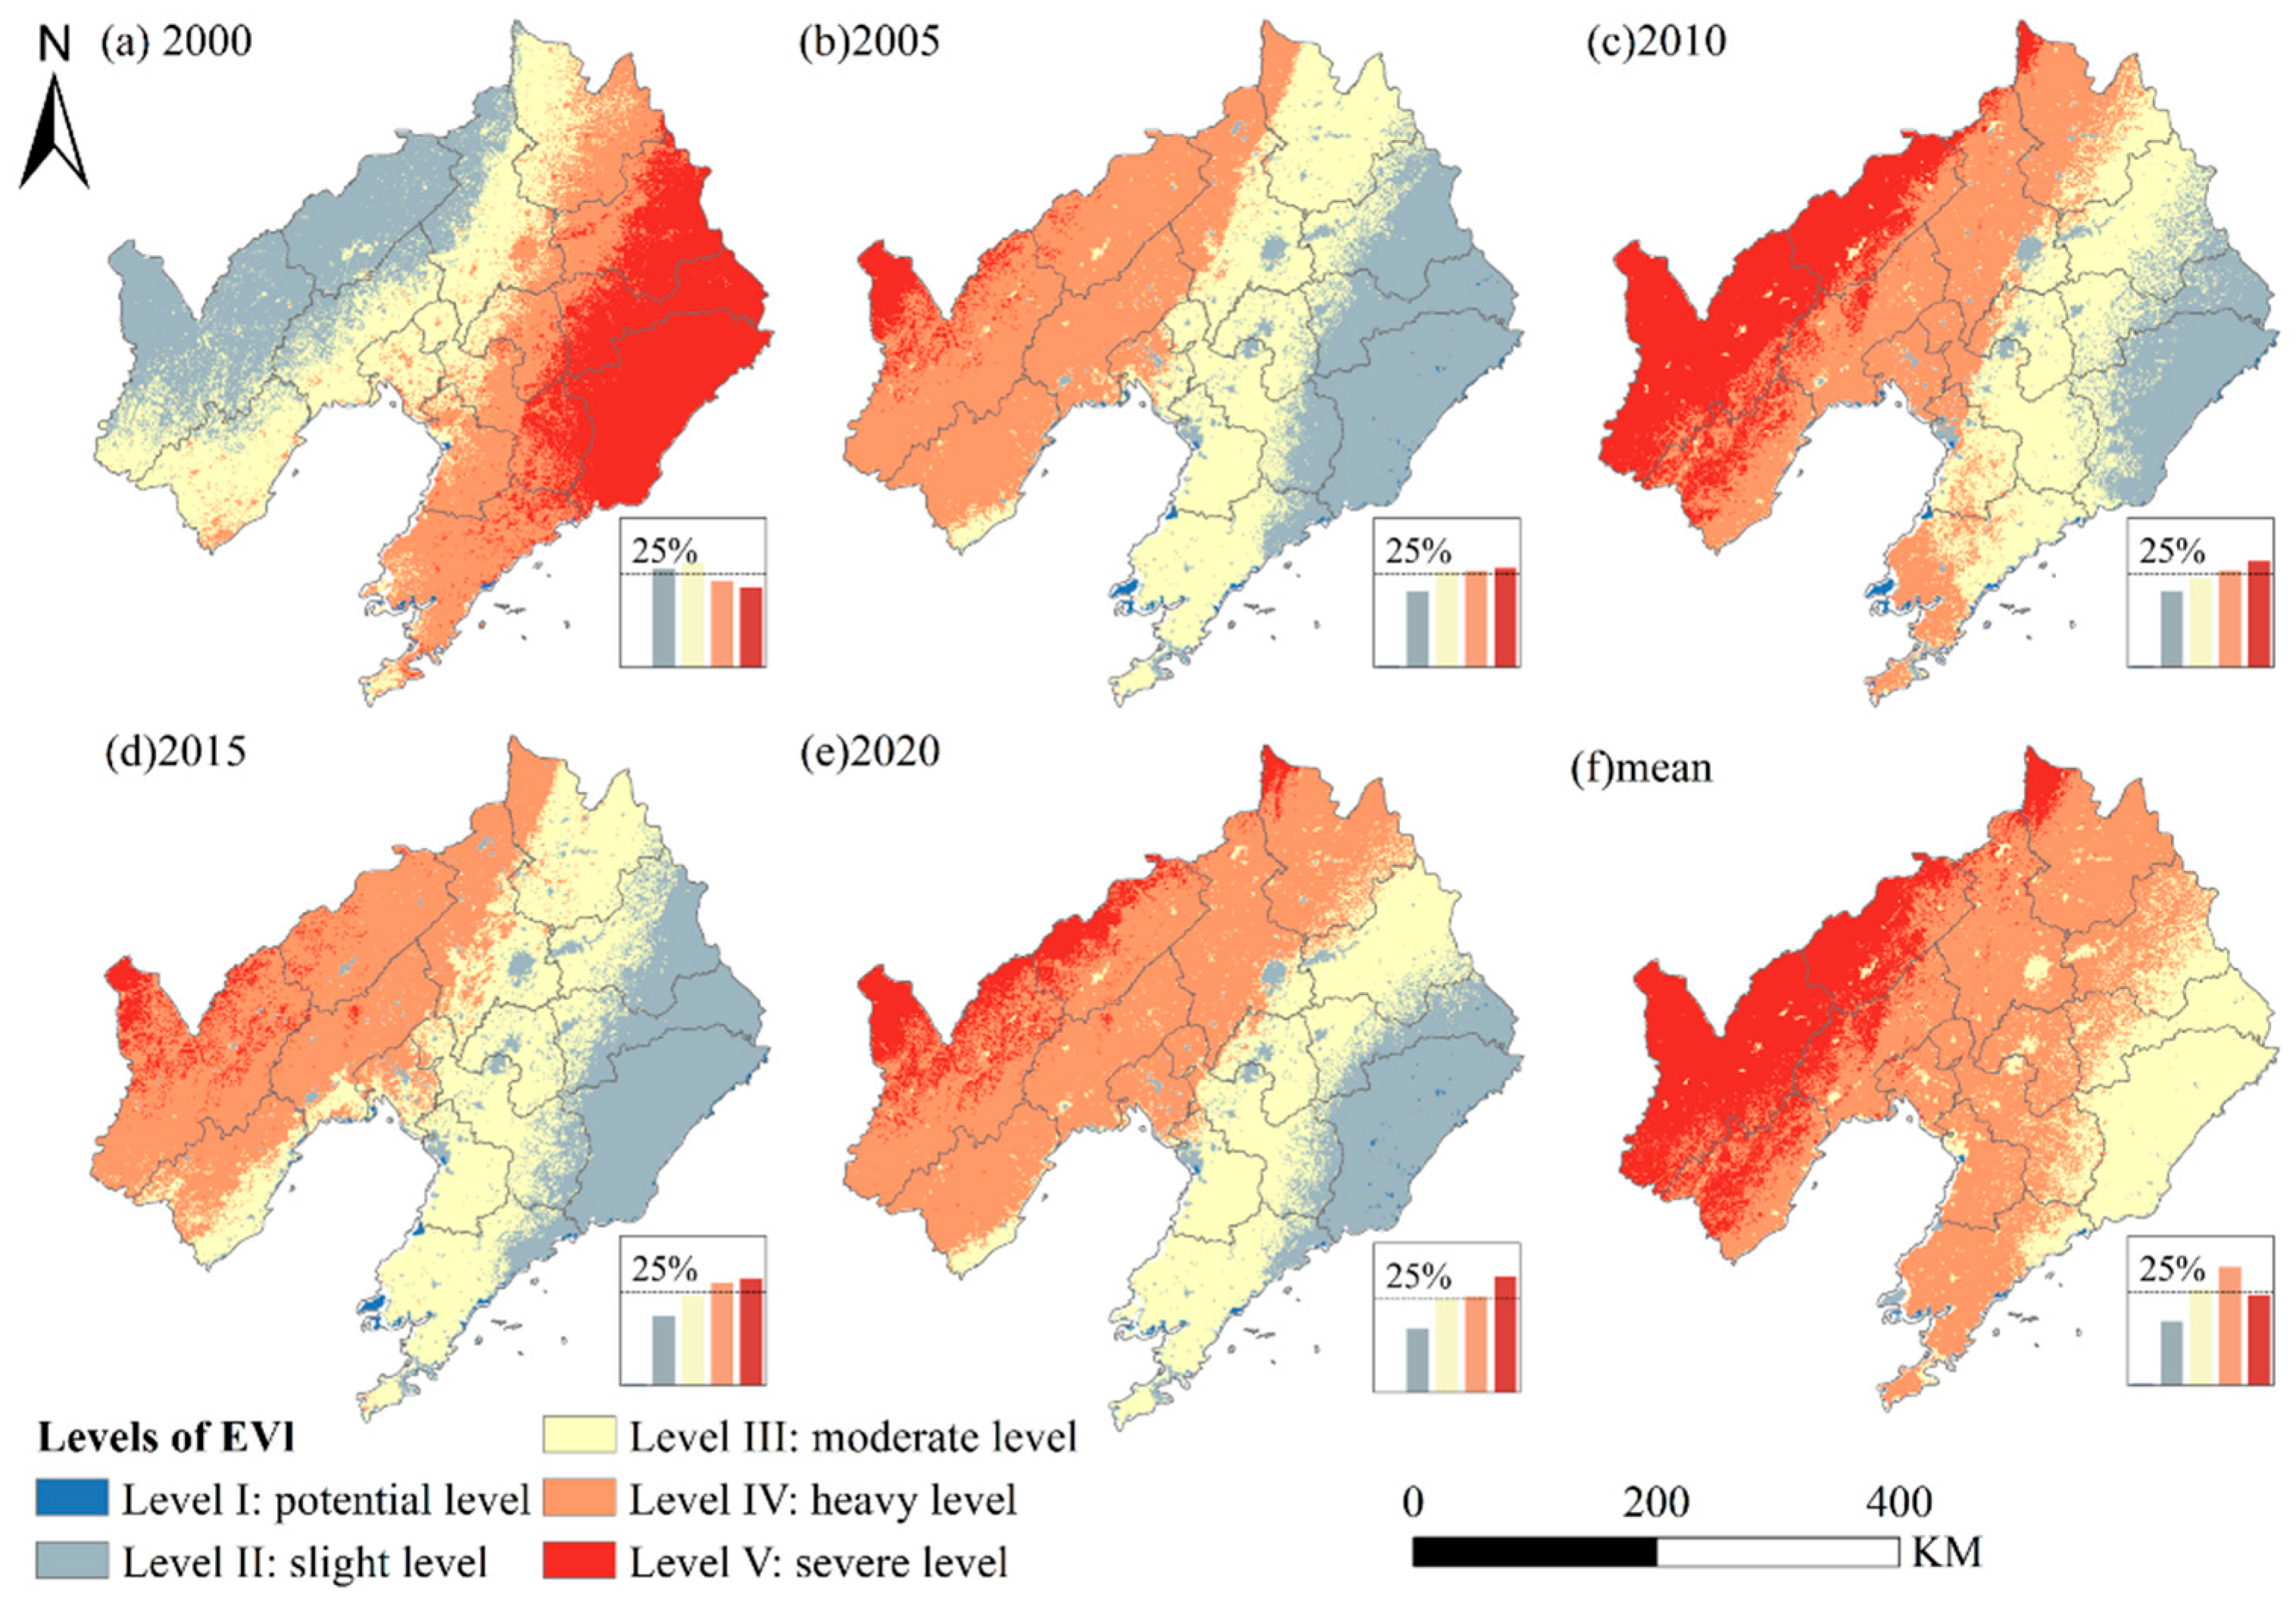
From 2000 to 2020, the spatial distribution of wetland ecosystem vulnerability was characterized by a strip-like pattern of ’high in the northwest and low in the southeast” (Figure 6) Overall, the EVI fluctuated in phases, showing slight alleviation initially but a gradual increase over time. The northern and western regions have been maintained at the severe to extremely severe vulnerability level for a long time, while the southeastern coastal and southern regions are relatively stable, with low ecological vulnerability. In terms of temporal evolution, the EVI in 2020 was higher than in 2000, indicating that ecosystem resistance to disturbances weakened progressively, especially in the central and northwestern regions. The proportion of mildly vulnerable areas (class II) in central areas such as Liaocheng and the line from Shenyang to Fushun declined significantly, while the severely (class IV) and very severely (class V) vulnerable areas expanded significantly, and the distribution pattern was characterized by “block concentration with edge fragmentation”, reflecting the aggregation effect of local ecological pressure. The analysis of spatial pattern shows that the northern hilly and sandy areas have maintained high vulnerability for a long time due to poor water and heat conditions and heavy human interference; the central urban belt has continued to deteriorate due to high construction intensity and wetland compression; and the EVI grade of the southeastern coastal area and part of the southern area (e.g., Dalian, Dandong, etc.) has declined, which indicates that ecological restoration policies have achieved stage-by-stage results. Overall, a three-tier ecological vulnerability gradient emerged: high in the north, increasing in the center, and decreasing toward the southern edge.
The reversal of ecological vulnerability levels observed between 2000 and 2005 can be attributed to the combined effects of climate anomalies and intensive human activities. During the early 2000s, severe drought events in Liaoning Province led to reduced precipitation and significantly altered wetland hydrological regimes, which weakened water retention and vegetation growth, thereby expanding the extent of high-vulnerability areas (Levels IV–V) [12]. At the same time, large-scale agricultural reclamation, urban expansion, and petroleum and natural gas exploitation intensified wetland degradation and habitat fragmentation, especially in the Liaohe Delta and Liaodong Bay [13,14]. After 2005, however, the implementation of ecological protection and restoration measures, such as wetland conservation projects and land-use regulation policies, gradually improved vegetation cover and stabilized ecosystem functions. Consequently, severe-vulnerability areas (Level V) decreased, while moderate- and slight-vulnerability areas (Levels II–III) expanded during 2005–2020 [14].

4. Discussion

4.1. Characteristics of Spatial and Temporal Evolution of Wetland Ecosystem Service Functions in Liaoning Province

Wetland ecosystem service function in Liaoning Province exhibited significant spatiotemporal differentiation during 2000–2020, and its evolution process was influenced by the multiple effects of natural environment change, human activity disturbance and ecological protection policy implementation. Based on the assessment results of multi-dimensional indicators, the core ecosystem service functions such as carbon storage, water conservation, wind erosion control, and soil conservation showed obvious regional variability in different geographical units. In terms of carbon sink function, overall during the study period increased, indicating that wetlands play a vital role in carbon fixation, and that their sink capacity has been enhanced in recent years with the strengthening of ecological protection policies. In the northern region, higher natural vegetation cover and ecological restoration measures (e.g., returning farmland to wetlands) supported carbon stock growth. This growth was further strengthened by increased precipitation and vegetation restoration [26,27,28]. The spatial differentiation of the water-source nutrient function is particularly significant. In the northern part of the country, the water-sourcing capacity continues to increase due to the increase in regional precipitation, vegetation restoration, and the stabilization or expansion of wetland areas; however, in the central and eastern parts of the country, the water-sourcing function declines due to the shrinkage of wetland areas as a result of the rapid urbanization and industrialization process. This phenomenon is particularly prominent in the Liao–Zhong–South urban agglomeration, where high-intensity human activities have seriously weakened the hydrological regulation function of wetlands [29]. The performance of the Liaodong coastal area is particularly typical, where large-scale land development, agricultural expansion, and infrastructure construction caused continuous wetland loss, leading to ecological problems such as increased soil erosion and reduced wind erosion control, posing a serious challenge to the regional ecological security pattern. This pattern of spatial heterogeneity reflects the differentiated impacts of human activities and natural processes on the ecosystem services of wetlands.

4.2. Wetland Patterns in Liaoning Province Drivers of Wetland Evolution

The analysis of the drivers of wetland patterns reveals the combined influence of natural environmental factors and human socio-economic activities on the structure and function of wetland ecosystems, which provides a scientific basis for accurately predicting the future trends of wetland evolution [1]. The study shows that the wetland distribution pattern is synergistically driven by multi-dimensional natural and socio-economic factors, and its driving mechanisms exhibit significant heterogeneity across spatial and temporal scales. In the early stage of this study, social factors, especially population density, were the dominant drivers of wetland pattern evolution [30]. An increase in population density is usually accompanied by an increase in the intensity of land development, which has a direct impact on the natural distribution and ecological functions of wetlands. For example, Rebelo et al. [31] and Mondal et al. [32] pointed out that population growth is one of the main anthropogenic factors affecting the change in wetland landscape patterns. The study by Hu et al. [33] also showed that population growth and the urbanization process are important factors influencing wetland landscape fragmentation. At the later stage of the study, the coupling of anthropogenic disturbances to wetland ecosystems and natural factors became more and more prominent with socio-economic development. For example, precipitation has always been a key natural factor influencing wetland patterns, but its influence became increasingly pronounced during the study period. As an important water recharge for wetland ecosystems, changes in precipitation can directly affect hydrological conditions, vegetation growth and ecosystem functions of wetlands [34]. In addition, precipitation may also indirectly change the ecological structure and function of wetlands by affecting soil water content, vegetation cover and evapotranspiration processes [35]. Some studies have found that precipitation has become a key natural factor determining the evolution of wetland patterns in the context of global climate change, especially in arid or semi-arid regions, where precipitation fluctuations play a decisive role in the survival and evolution of wetlands [36]. Meanwhile, the explanatory power of indicators such as NDVI, GDP, and wetland area also increased significantly. NDVI here reflects vegetation cover and biomass conditions, which are influenced by climatic fluctuations and human land-use activities, and thus indirectly capture changes in wetland patterns.
Overall, the interactions among these factors show clear dependencies: precipitation directly enhances water retention, which in turn promotes vegetation growth and strengthens carbon storage. NDVI values mirror vegetation responses, serving as a sensitive indicator of climatic variability and anthropogenic disturbance rather than a direct causal driver. Population growth and GDP expansion drive land-use changes that reduce wetland extent, thereby weakening Qwr and NDVI and indirectly diminishing Qt. In areas with steep slopes or sandy soils, reduced vegetation cover accelerates soil erosion, lowering soil conservation, while in open coastal zones the loss of vegetation increases exposure to wind, reducing wind erosion control. These linkages highlight that wetland ecosystem services are shaped not by single drivers but by the coupled effects of climate variability and human activities.

4.3. Vulnerability of Wetland Ecosystems in Liaoning Province

The spatial distribution of ecological vulnerability is not only influenced by natural factors (e.g., climate, topography, soil), but also closely related to human activities (e.g., urbanization, industrialization, agricultural expansion). Natural factors determine the sensitivity of ecosystems to environmental change by shaping their structure and functioning. Human activities, in turn, exacerbate or mitigate vulnerability by altering land-use patterns, resource use, and ecosystem service provision [37]. For example, changes in climatic conditions such as precipitation and temperature directly affect the hydrological dynamics and vegetation distribution in wetlands, which in turn affects ecosystem stability [38,39]. Topography and soil properties also determine the responsiveness of ecosystems to hydrological and climatic perturbations [31]. In Liaoning Province, rapid urbanization and industrial development have intensified land use changes, especially in the Liaohe Delta and the central urban belt. These changes have fragmented wetland ecosystems and weakened their resilience and adaptability [13,14,40]. In this study, the spatial distribution of ecological vulnerability of wetlands in Liaoning Province showed a three-tier spatial gradient of “high in the north, second in the center, and low in the southeast”, forming a composite distribution pattern dominated by fragmented patches and complemented by banded structures. This spatial heterogeneity reflects not only the differences in natural conditions, but also the spatial differences in the intensity of human activities. The northern region is more sensitive to climate change and human disturbance because of harsher natural conditions. These include low precipitation, frequent droughts, strong winds and sandstorms, infertile soils, and weaker ecosystem resilience. Some studies have found that in recent years, wetland ecosystems in Northwest Liaoning have been severely degraded and ecological vulnerability has risen significantly due to climate drought and increased land desertification [40]. The ecological vulnerability of the central region is in the middle; in contrast, the ecological vulnerability of the southeastern region is higher due to the rich precipitation and high vegetation cover, which makes the ecosystem relatively stable. The region is rich in wetland resources and has a strong ecosystem resilience, which is more adaptable to climate change and human activities [41,42]. In conclusion, the spatial distribution of wetland ecological vulnerability in Liaoning Province is the result of the joint action of natural conditions and human activities, and its change trend is closely related to regional ecological security. In the future, wetland protection and ecological restoration measures should be strengthened to enhance ecosystem resilience to cope with the combined pressures of climate change and human activities.

4.4. Ecological Restoration and Management Suggestions

Based on the spatiotemporal evolution of wetland ecosystem services and ecological vulnerability in Liaoning Province, this paper proposes the following ecological restoration and management strategies. These measures aim to enhance the stability and sustainability of wetland ecosystems.
(1)
Strengthen ecological protection and restoration projects
The strategy of prioritizing the protection of key areas must be implemented. For the ecologically fragile areas and high-value wetland distribution areas such as northwest Liaoning, a hierarchical protection system should be constructed, focusing on promoting ecological restoration projects such as returning farmland to wetlands, restoring hydrological connectivity, and reconstructing vegetation communities. If wetlands continue to be lost, the region will face cascading ecological risks. These include biodiversity decline, the collapse of natural buffers against floods and droughts, and the erosion of ecological resilience that underpins regional security and sustainable development. These consequences would not only intensify environmental instability but also heighten risks to local communities and long-term economic sustainability. The dynamic monitoring and early warning system should also be strengthened. Remote sensing, ground observations, and model simulations need to be integrated to establish a comprehensive wetland ecological monitoring network that links aerial and terrestrial systems. In particular, it is necessary to establish an early warning mechanism for wetland degradation and realize the change from passive management to active prevention and control.
(2)
Optimize the spatial development pattern of the national territory
Implement spatial control strategies. In ecologically sensitive areas such as the Liaodong Coast, ecological red lines should be delineated and development intensity strictly controlled. Wetland protection must also be embedded as a binding requirement in territorial spatial planning. Green development mode should be innovated. The “wetland +” composite ecosystem and develop green industries such as ecological breeding and wetland tourism should be promoted to realize the win–win situation of ecological and economic benefits.

4.5. Limitations and Future Work

This study has several limitations. The ecosystem service estimations were entirely based on model simulations (e.g., InVEST, RUSLE, and the wind erosion equation), without direct field-based validation. Although these models are widely used and validated in other ecological contexts, the lack of plot-level measurements inevitably introduces uncertainties. Future research should establish long-term monitoring plots and conduct field experiments to validate and calibrate model outputs, thereby improving the robustness of regional ecosystem service assessments.

5. Conclusions

This study systematically evaluated the spatiotemporal evolution of wetland ecosystem services in Liaoning Province (2000–2020) and analyzed the driving mechanisms of wetland spatial patterns and ecosystem vulnerability. The main conclusions are as follows:
(1)
Carbon storage gradually increased, and water conservation capacity was significantly enhanced in the northern part of the province. In contrast, windbreak, sand fixation, and soil conservation functions declined under the influence of urban expansion and land-use change.
(2)
Population density was the dominant driving factor in the early stage, but with the passage of time, the influence of precipitation, NDVI, GDP and wetland area on the evolution of wetland pattern gradually increased, and the driving mechanism showed significant spatial heterogeneity.
(3)
The ecologically fragile areas show a pattern of “coexistence of fragmented patches+ banded distribution”, forming a three-level spatial gradient of ecological fragility: high in the north, second in the center, and low in the southeast.

Author Contributions

Conceptualization, C.Z.; Software, Y.H.; Formal analysis, Z.Y.; Investigation, Y.Z., C.Z. and S.W.; Resources, C.W.; Data curation, Y.Z. All authors have read and agreed to the published version of the manuscript.

Funding

This research was funded by the Joint Natural Science Foundation of Liaoning Province (2023-MSLH-065); the 2025 Innovation and Entrepreneurship Training Program for College Students in Liaoning Province; the 2025 Key Research Program of the Joint Natural Science Foundation of Liaoning Province (2025JH1), and the 2026 Key Research Program of the Joint Natural Science Foundation of Liaoning Province (2026JH1).

Data Availability Statement

The original contributions presented in the study are included in the article, further inquiries can be directed to the corresponding author.

Conflicts of Interest

The authors declare no conflicts of interest.

References

  1. Xu, X.; Chen, M.; Yang, G.; Jiang, B.; Zhang, J. Wetland ecosystem services research: A critical review. Glob. Ecol. Conserv. 2020, 22, e01027. [Google Scholar] [CrossRef]
  2. Fluet-Chouinard, E.; Stocker, B.D.; Zhang, Z.; Malhotra, A.; Melton, J.R.; Poulter, B.; Kaplan, J.O.; Goldewijk, K.K.; Siebert, S.; Minayeva, T.; et al. Extensive global wetland loss over the past three centuries. Nature 2023, 614, 281–286. [Google Scholar] [CrossRef]
  3. Leifeld, J.; Menichetti, L. The underappreciated potential of peatlands in global climate change mitigation strategies. Nat. Commun. 2018, 9, 1071. [Google Scholar] [CrossRef]
  4. Xiong, Y.; Mo, S.; Wu, H.; Qu, X.; Liu, Y.; Zhou, L. Influence of human activities and climate change on wetland landscape pattern-A review. Sci. Total Environ. 2023, 879, 163112. [Google Scholar] [CrossRef] [PubMed]
  5. Shen, X.; Jiang, M.; Lu, X.; Thompson, J.R. Protect and restore small wetlands. Science 2024, 384, 1415. [Google Scholar] [CrossRef]
  6. Lisenby, P.E.; Tooth, S.; Ralph, T.J. Product vs. process? the role of geomorphology in wetland characterization. Sci. Total Environ. 2019, 663, 980–991. [Google Scholar] [CrossRef] [PubMed]
  7. Hinson, A.L.; Feagin, R.A.; Eriksson, M.; Najjar, R.G.; Herrmann, M.; Bianchi, T.S.; Kemp, M.; Hutchings, J.A.; Crooks, S.; Boutton, T. The spatial distribution of soil organic carbon in tidal wetland soils of the continental United States. Glob. Change Biol. 2017, 23, 5468–5480. [Google Scholar] [CrossRef]
  8. Penfound, E.; Vaz, E. Modelling future wetland loss with land use landcover change simulation in the Greater Toronto and Hamilton Area: The importance of continued greenbelt development restrictions. Habitat Int. 2024, 143, 102974. [Google Scholar] [CrossRef]
  9. Qu, Y.; Zeng, X.; Luo, C.; Zhang, H.; Liu, Y.; Wang, J. Constructing wetland ecological corridor system based on hydrological connectivity with the goal of improving regional biodiversity. Environ. Manag. 2024, 368, 122074. [Google Scholar] [CrossRef] [PubMed]
  10. Zhou, Y.; Li, X.; Zhang, J. Ecological restoration and carbon sink enhancement in wetlands of Liaoning Province. J. Geogr. Sci. 2020, 30, 456–470. [Google Scholar]
  11. Xu, H.; Li, D.; Hou, X.; Yu, X.; Liu, Y.; Li, X.; Li, B.; Chen, L.; Wang, X.; Xia, S. Home range and habitat disturbance identification for a vulnerable shorebird species. Home range and habitat disturbance identification for a vulnerable shorebird species (Larus saundersi) in the Yellow River Delta, China. J. Coast. Res. 2021, 37, 737–748. [Google Scholar] [CrossRef]
  12. Wu, J.; Li, Y.; Zhang, X.; Cai, H. Spatiotemporal Variation Patterns of Drought in Liaoning Province, China, Based on Copula Theory. Atmosphere 2024, 15, 1063. [Google Scholar] [CrossRef]
  13. Wang, B.; Du, Y.; Xu, J. GIS/RS-based health assessment and landscape dynamics of coastal wetlands: A case study of Liaodong Bay. J. Liaoning Norm. Univ. 2013, 31, 84–89. [Google Scholar]
  14. Fan, H.; Xu, H. Changes in landscape pattern vulnerability of the Liaohe River Delta wetland. Prog. Geogr. 2016, 31–32. [Google Scholar]
  15. Ludlow, S.; Davis, S. Oil and Natural Gas Development Influence Nest-Site Selection and Nest Survival of Upland-Nesting Waterfowl and Shorebirds. Wildl. Soc. Bull. 2018, 42, 57–66. [Google Scholar] [CrossRef]
  16. Peng, Y. Vulnerability analysis of river basin aquatic ecosystems: A case study of the Liaohe River Basin. Environ. Prot. Circ. Environ. Prot. Circ. Econ. 2013, 33, 47–50+53. [Google Scholar]
  17. Malekmohammadi, B.; Jahanishakib, F. Vulnerability Assessment of Wetland Landscape Ecosystem Services Using Driv-er-Pressure-State-Impact-Response (DPSIR) Model. Ecol. Indic. 2017, 82, 293–303. [Google Scholar] [CrossRef]
  18. Zhang, X.; Liu, L.; Zhao, T.; Wang, J.; Liu, W.; Chen, X. Global annual wetland dataset at 30 m with a fine classification system from 2000 to 2022. Sci. Data 2024, 11, 310. [Google Scholar] [CrossRef]
  19. Huang, Y.; Chen, S.L.; Jiang, H.; Chen, W.J.; Mo, X.H. Assessment of the impact of land use changes on net primary productivity using human appropriation of net primary productivity in Anji, China. Appl. Ecol. Environ. Res. 2021, 19, 4331–4348. [Google Scholar] [CrossRef]
  20. Ding, T.; Chen, J.; Fang, Z.; Chen, J. Assessment of coordinative relationship between comprehensive ecosystem service and urbanization: A case study of Yangtze River Delta urban. Ecol. Indic. 2021, 133, 108454. [Google Scholar] [CrossRef]
  21. Nelson, E.; Mendoza, G.; Regetz, J.; Polasky, S.; Tallis, H.; Cameron, D.R.; Chan, K.M.A.; Daily, G.C.; Goldstein, J.; Kareiva, P.M.; et al. Modeling multiple ecosystem services, biodiversity conservation, commodity production, and tradeoffs at landscape scales. Front. Ecol. Front. Ecol. Environ. 2009, 7, 4–11. [Google Scholar] [CrossRef]
  22. Lundberg, S.M.; Erion, G.; Chen, H.; DeGrave, A.; Prutkin, J.M.; Nair, B.; Katz, R.; Himmelfarb, J.; Bansal, N.; Lee, S.-I. From local explanations to global understanding with explainable AI for trees. Nat. Mach. Intell. 2020, 2, 56–67. [Google Scholar] [CrossRef]
  23. Tenenhaus, M.; Vinzi, V.E.; Chatelin, Y.M.; Lauro, C. PLS path modeling. Comput. Stat. Data Anal. 2005, 48, 159–205. [Google Scholar] [CrossRef]
  24. Wu, X.; Huang, X. Screening of urban environmental vulnerability indicators based on coefficient of variation and anti-image correlation matrix method. Indicators 2023, 150, 110196. [Google Scholar] [CrossRef]
  25. Cai, Y.; Guo, X.; Liu, J.; Wang, D.; Zheng, J. Ecological geological vulnerability assessment in Northern Shanxi Province (China) based on sensitivity resilience pressure (SRP) model. Sci. Rep. 2025, 15, 8063. [Google Scholar] [CrossRef]
  26. Cheng, C.; Li, M.; Xue, Z.; Zhang, Z.; Lyu, X.; Jiang, M.; Zhang, H. Impacts of climate and nutrients on carbon sequestration rate by wetlands: A meta-analysis. Chin. Geogr. Sci. 2020, 30, 483–492. [Google Scholar] [CrossRef]
  27. Liu, H.B.; Yang, L.P.; Gao, J.Q.; Li, Q.W.; Li, X.L.; Feng, J.G.; Yu, F.H. Increasing plant diversity enhances soil organic carbon storage in typical wetlands of northern China. Front. Plant Sci. 2024, 15, 1467621. [Google Scholar] [CrossRef] [PubMed]
  28. Zhou, T.; Niu, A.; Huang, Z.; Ma, J.; Xu, S. Spatial relationship between natural wetlands changes and associated influencing factors in mainland China. ISPRS Int. J. Geo- Inf. 2020, 9, 179. [Google Scholar] [CrossRef]
  29. Xu, T.; Weng, B.; Yan, D.; Wang, K.; Li, X.; Bi, W.; Li, M.; Cheng, X.; Liu, Y. Wetlands of international importance: Status, threats, and future protection. Int. J. Environ. Res. Public Health 2019, 16, 1818. [Google Scholar] [CrossRef]
  30. Asselen, S.V.; Verburg, P.H.; Vermaat, J.E.; Janse, J.H. Drivers of wetland conversion: A global meta-analysis. PLoS ONE 2013, 8, e81292. [Google Scholar] [CrossRef]
  31. Rebelo, L.M.; Finlayson, C.M.; Nagabhatla, N. Remote sensing and GIS for wetland inventory, mapping and change analysis. J. Environ. Manag. 2009, 90, 2144–2153. [Google Scholar] [CrossRef]
  32. Mondal, B.; Dolui, G.; Pramanik, M.; Maity, S.; Biswas, S.S.; Pal, R. Urban expansion and wetland shrinkage estimation using a GIS-based model in the East Kolkata Wetland, India. Ecol. Indic. 2017, 83, 62–73. [Google Scholar] [CrossRef]
  33. Hu, P.P.; Li, F.; Hu, D.; Chen, X.C.; Liu, Y.L.; Wang, Y. Change of wetland landscape patterns and its driving factors in pearl river Delta urban agglomeration. Technology 2021, 11, 418–427. [Google Scholar]
  34. Zhang, M.; Gong, Z.; Zhao, W.; Duo, A. Landscape pattern change and the driving forces in Baiyangdian wetland from 1984 to 2014. Acta Ecol. Sin. 2016, 36, 4780–4791. [Google Scholar] [CrossRef]
  35. Xie, J.; Wang, Z.M.; Ren, C.Y. Analysis of seasonal changes of wetland landscape patterns derived from remote sensing data. Acta Ecol. Sin. 2014, 34, 7149–7157. [Google Scholar] [CrossRef]
  36. Zhang, N.; Lei, Y.; Li, W.; Wang, H.; Liu, C.; Wang, J.; Cui, L. Changes and Driving Factors of Wetland Landscape Pattern in the Middle Reaches of the Yellow River from 1990 to 2020. Terr. Ecosyst. Conserv. 2023, 3, 13–25. [Google Scholar]
  37. Turner, B.L., II; Kasperson, R.E.; Matson, P.A.; McCarthy, J.J.; Corell, R.W.; Christensen, L.; Eckley, N.; Kasperson, J.X.; Luers, A.; Martello, M.L.; et al. A framework for vulnerability analysis in sustainability science. Proc. Natl. Acad. Sci. USA 2003, 100, 8074–8079. [Google Scholar] [CrossRef]
  38. Song, C.; Xiang, H.; Chen, M.; Du, S. Spatiotemporal variability in ecological vulnerability of Songnen Plain from 1980 to 2020. Bull. Soil Water Conserv. 2023, 43, 366–374. [Google Scholar]
  39. Dai, X.; Gao, Y.; He, X.; Liu, T.; Jiang, B.; Shao, H.; Yao, Y. Spatial-temporal pattern evolution and driving force analysis of ecological environment vulnerability in Panzhihua City. Environ. Sci. Pollut. Res. 2021, 28, 7151–7166. [Google Scholar] [CrossRef]
  40. Li, R.; Han, R.; Yu, Q.; Qi, S.; Guo, L. Spatial heterogeneous of ecological vulnerability in arid and semi-arid area: A case of the Ningxia Hui autonomous region, China. Sustainability 2020, 12, 4401. [Google Scholar] [CrossRef]
  41. Li, D.; Huan, C.; Yang, J.; Gu, H. Temporal and spatial distribution changes, driving force analysis and simulation prediction of ecological vulnerability in Liaoning Province, China. Land 2022, 11, 1025. [Google Scholar] [CrossRef]
  42. Sun, C.Z.; Yan, X.L.; Zhong, J.Q. Evaluation of the landscape patterns vulnerability and analysis of spatial correlation patterns in the lower reaches of Liaohe River Plain. Acta Ecol. Sin. 2014, 34, 247–257. [Google Scholar] [CrossRef]
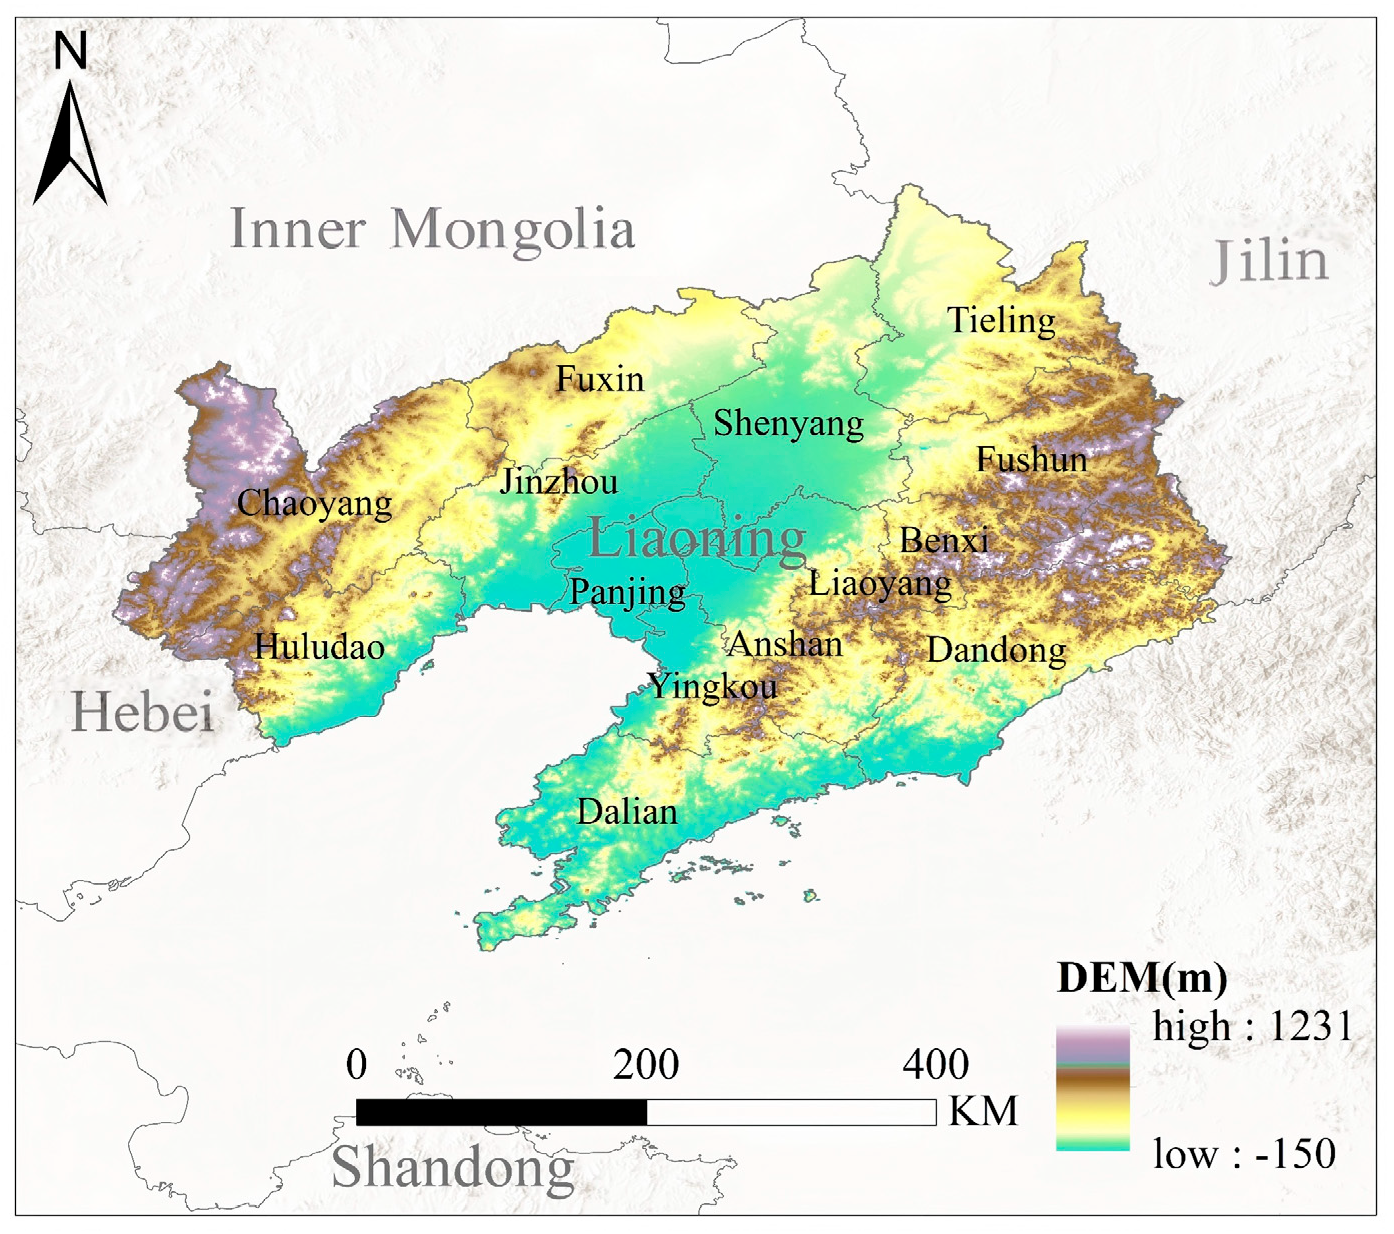
Figure 1. Spatial Patterns of Elevation in Liaoning Eco-Economic Zone in 2020.
Water 17 02827 g001
Figure 2. Spatial and temporal evolution of wetland patterns in Liaoning Province from 2000 to 2020 (A): Wetland area change; (BF): Wetland types and their area percentages in 2000, 2005, 2010, 2015, and 2020, respectively.
Water 17 02827 g002
Figure 3. Ecosystem Service Functions of Wetlands in Liaoning Province in 2000, 2005, 2015, and 2020. (a) Soil Conservation Function (Qsr); (b) Carbon Storage (Qt); (c) Wind Erosion Control (Qsf); (d) Water Retention (Qwr).
Water 17 02827 g003
Figure 4. SHAP values of the driving factors influencing wetland distribution pattern changes in Liaoning Province: (a) 2000; (b) 2005; (c) 2010; (d) 2015; (e) 2020; (f) mean SHAP values (2000–2020, 5-year intervals). POP: Population Density; NDVI: Normalized Difference Vegetation Index; GDP: Gross Domestic Product; DEM: Elevation; PRE: Precipitation; Qwr: Water Retention; Qt: Carbon Storage; Qsr: Soil Conservation; Qsf: Wind Erosion Control.
Water 17 02827 g004
Figure 5. Relationships between different variables and wetland distribution based on PLS-PM. (Red arrows represent positive relationships and blue arrows represent negative relationships. The thickness of the arrows indicates the magnitude of the path coefficients).
Water 17 02827 g005
Figure 6. Distribution of ecological vulnerability levels during 2000–2020. (a) Year of 2000. (b) Year of 2005. (c) Year of 2010. (d) Year of 2015. (e) Year of 2020. (f) Average level between 2000 and 2020.
Water 17 02827 g006
Table 1. Data Source and related information.
Data TypeData NameSpatial ResolutionYearData Source
Wetland dataWetland data30 m2000–2020Global 30 m wetland time series 2000–2022
Climate dataAverage annual temperature1 km2000, 2005, 2010, 2015, 2020National Earth SystemScience Data left
Annual precipitation1 km2000, 2005, 2010, 2015, 2020
Potential evapotranspiration1 km2000, 2005, 2010, 2015, 2020
Soil dataSoil pH250 m-Openlandmap dataset
Sand content250 m-
Water content250 m-
Carbon content250 m-
Clay content250 m-
Soil Bulk Weight250 m-
Topographic and geomorphological dataDEM1 km-Data left for Resource and Environmental Sciences, Chinese Academy of Sciences
Slope1 km-
Landform type1 km-
Remote sensing ecological dataNPP1 km2000, 2005, 2010, 2015, 2020NASA Earth Observing System Data and Information System
NDVI1 km2000, 2005, 2010, 2015, 2020
Land use dataLand use data30 m2000, 2005, 2010, 2015, 2020Land cover dataset for 30 m years in China, 1990–2021.
Socio-economic dataNight light500 m2000, 2005, 2010, 2015, 2020Harvard University Database
Population density1 km2000, 2005, 2010, 2015, 2020Resource and Environment Science Data left, Chinese Academy of Sciences
City Residency--
Statistics-2000, 2005, 2010, 2015, 2020Statistical Yearbook by Region
Disclaimer/Publisher’s Note: The statements, opinions and data contained in all publications are solely those of the individual author(s) and contributor(s) and not of MDPI and/or the editor(s). MDPI and/or the editor(s) disclaim responsibility for any injury to people or property resulting from any ideas, methods, instructions or products referred to in the content.