1. Introduction
Natural hazards significantly affect both the natural and human environment, often resulting in destructive consequences and substantial material losses. They encompass a wide range of phenomena, including earthquakes, volcanic eruptions, and gravitational processes such as landslides, rockfalls, and avalanches, as well as hydrological hazards like flash floods, river floods, forest fires, desertification, storms, and hurricanes [
1,
2,
3]. The drivers of extreme events are diverse, ranging from large-scale processes such as the differential heating of continents and oceans that generate monsoons, to local factors like the orographic and altimetric influence of relief forms (e.g., vertical climatic zoning, orographic barriers). In temperate zones, a sudden rise in spring temperatures can accelerate snowmelt, triggering floods.
Areas prone to flooding and flash flooding require targeted measures to reduce impacts when hazards occur. In addition to hydrotechnical constructions designed to mitigate flood damage, the spatial distribution of emergency units and the structure of the road network play a crucial role in shaping the effectiveness of response efforts [
4,
5].
Travel accessibility is heavily conditioned by road quality, network density, and proximity to emergency centers managed by the Inspectorate for Emergency Situations, (called ISU units). Disruptions such as inundated roads, damaged bridges, or landslides introduce discontinuities that hinder rapid intervention. Accessibility in the context of emergencies has been the subject of several studies. Borowska-Stefańska and Wiśniewski [
6] emphasized that while floods cannot be fully prevented, preparedness through optimal evacuation planning is essential. Full accessibility simulations are critical to identifying potential bottlenecks in transport networks prior to an event, thereby facilitating the development of efficient evacuation strategies. Similarly, Papilloud and Keiler [
7] analyzed evacuation routes in relation to residential distribution, showing that vulnerability can persist even in well-connected areas.
Other contributions have emphasized access to essential services during hazard conditions. Gangwal et al. [
8] investigated the impact of flood-related road disruptions on hospital access for vulnerable communities, demonstrating that reduced travel speeds and network failures significantly increase travel times. Their work underscores the need for targeted investments in critical infrastructure to enhance community resilience. Florath et al. [
9] advanced this approach by developing a multi-scale framework to assess road accessibility under hazard conditions. Their methodology integrates the identification of damaged road segments with network analyses using metrics such as inter-center connectivity, central node proximity, free-flow indices, and rerouting efficiency. Results revealed substantial shifts in accessibility when roads were impaired, confirming the cascading effects of hazard-induced disruptions.
Recent research has further refined methodological approaches to accessibility analysis. Loreti et al. [
10] introduced accessibility metrics for flood-affected areas that move beyond percolation models, focusing instead on how local towns maintain (or lose) access to critical services during extreme events. Morelli and Cunha [
11], in turn, developed resilience metrics to evaluate urban road networks under flood conditions, proposing network continuity and alternative efficiency as key measures of functional capacity. Both approaches demonstrate the importance of quantifying accessibility not only spatially but also dynamically, in relation to hazard-induced disruptions.
Transport accessibility also plays a broader role in urban development. Ford et al. [
12] demonstrated that accessibility is not only central to emergency response but also a driver of sustainable urban growth. Using a GIS-based methodology applied to London, they showed how accessibility can be measured across multiple transport modes, with implications for reducing environmental impacts. Similarly, Ertugay and Duzgun [
13] emphasized the relationship between accessibility, equity, and service distribution, arguing that accessibility analyses should guide infrastructure planning and national or regional policy strategies.
In the Romanian context, hazard research has highlighted both the challenges and opportunities of integrating accessibility analyses into emergency management. Stăncalie et al. [
14] used GIS and Earth observation technologies to support flood management after the 2000 floods, while other works on various river basins in Romania utilized flood potential indices and machine learning to improve hazard mapping [
15,
16,
17,
18]. Chelariu et al. [
19] proposed GIS-based modeling of shelter placement and pedestrian evacuation in rural mountain catchments, providing insights highly relevant to communities in steep Carpathian basins. Puie and Mihai [
20] extended this line of research by analyzing the dual impacts of rockfalls and floods on transport corridors, showing how multi-hazard interactions compromise both road and rail access. Complementary efforts, such as landslide-hazard mapping project [
21,
22], also underscore the necessity of integrating slope instability data into national risk management strategies, especially in the Carpathian region.
River basin-level research on road accessibility is insufficient in Romania. There are no detailed maps regarding emergency interventions, comparative scenarios of travel at different speeds, or studies simulating how this distribution was due to the presence of hydrological hazards.
Flood response operations in Romania are coordinated by the ISU, with intervention teams stationed at specialized points distributed according to population density. Response times, however, are highly dependent on road slope, quality, and density, as well as the number and spatial distribution of ISU centers. Although a greater number of centers generally improve coverage, multiple obstacles persist. Flooding, debris, or landslides may render key roads impassable, while bridges can be destroyed by strong currents, completely isolating localities when they represent the sole access route. Road foundation undermining further exacerbates risks, leading to collapses. These interruptions delay intervention, often compounding damage. Moreover, effective planning is hampered by outdated road maps, insufficiently detailed hazard data, and incomplete knowledge of flood frequencies or landslide susceptibilities.
Against this backdrop, the present study aims to address the accessibility of emergency intervention teams in the Vărbilău Catchment, Romania, under flood and landslide scenarios. This region has experienced multiple events requiring urgent evacuation and emergency support, yet no dedicated accessibility analysis has been carried out. Our approach builds on GIS-based methods to evaluate road accessibility, update road maps with field-verified information, and model intervention scenarios. The findings are designed to inform decision-makers responsible for transport planning and hazard response, offering insights for strengthening resilience through improved accessibility modeling.
2. Study Area and Methodology
2.1. Study Area
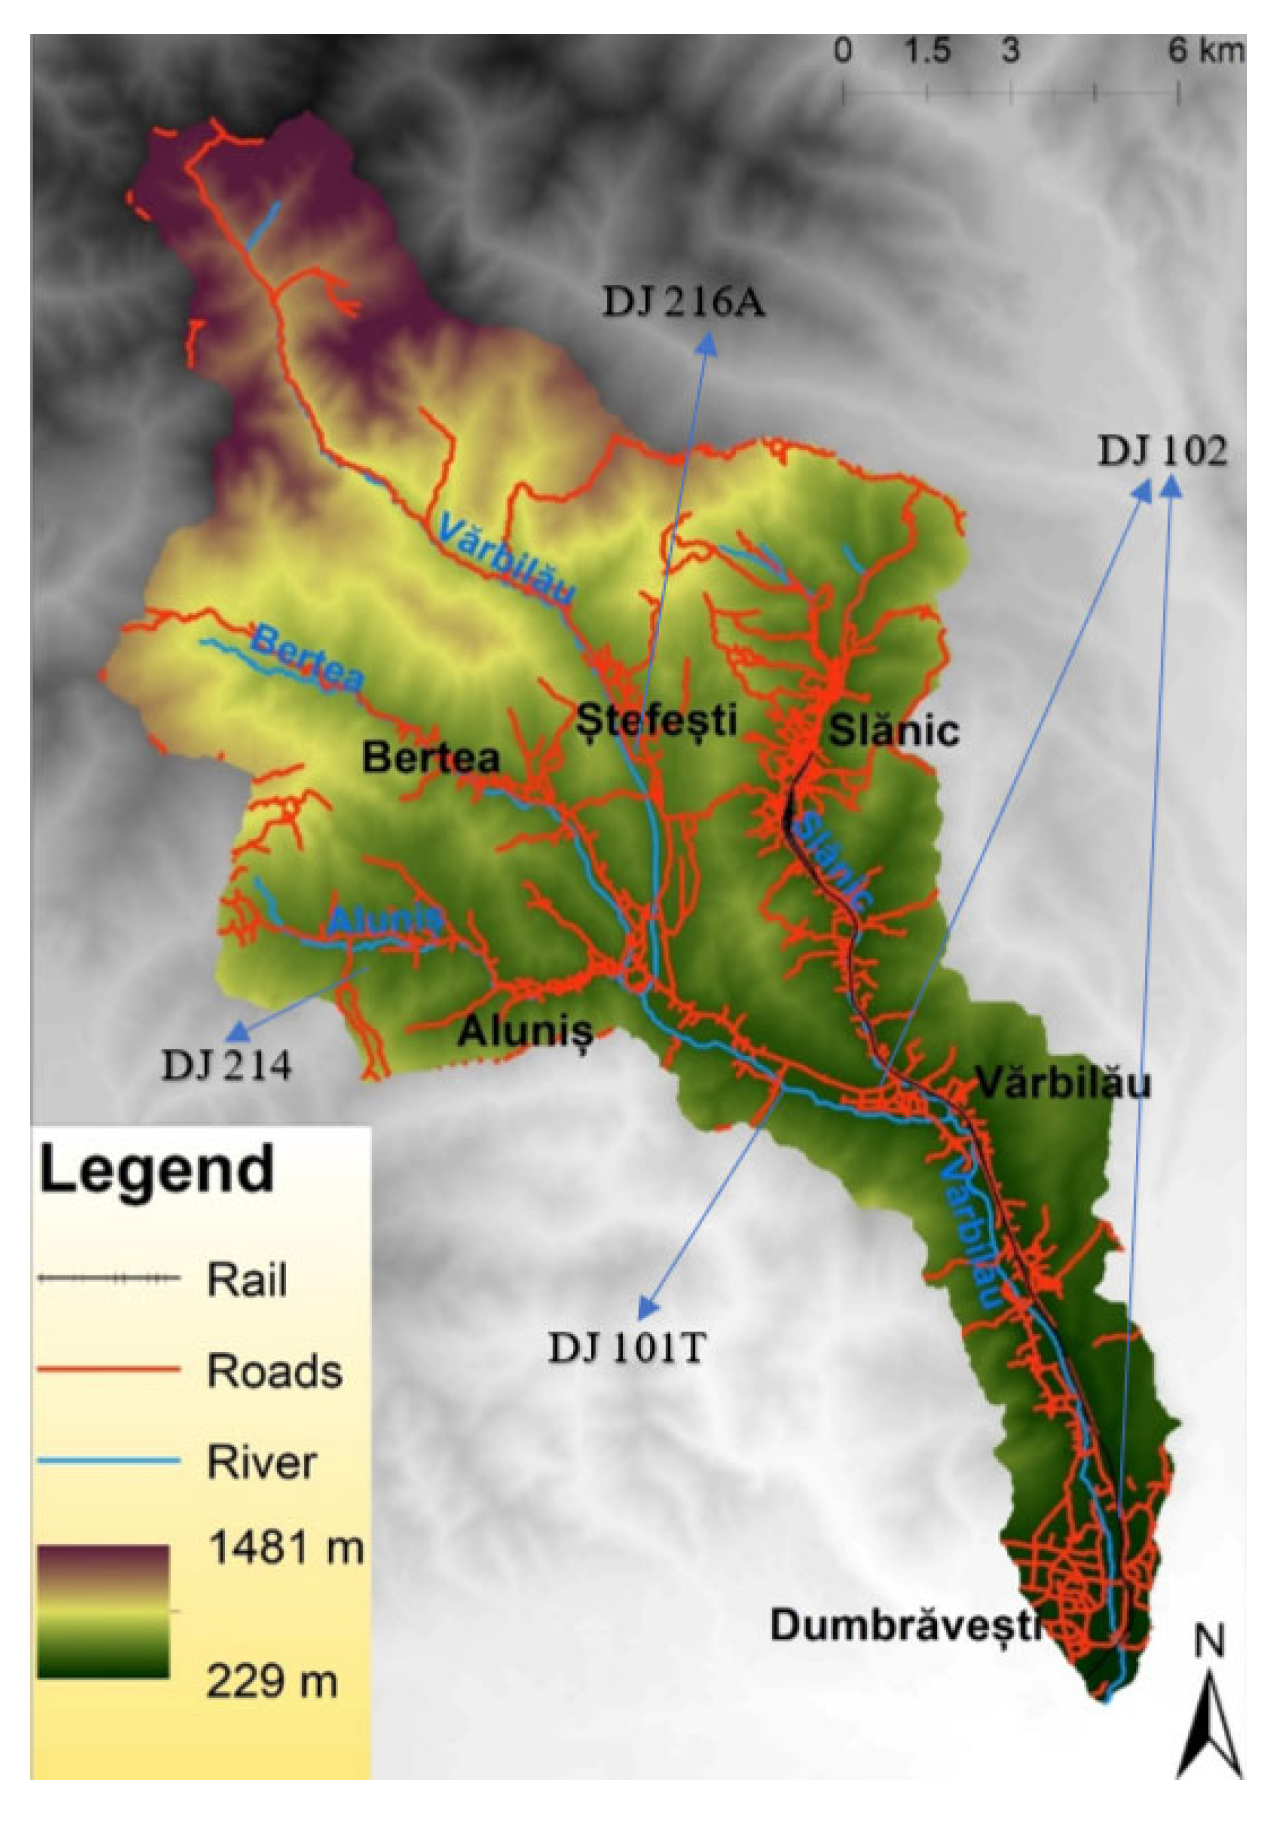
The Vărbilău catchment is located near the 45° north parallel, approximately 100 km north of Bucharest, in Prahova County, Romania (
Figure 1). The area’s relief, vegetation, and river network strongly influence the layout of roads and human settlements. Population density is highest in the central and southern valleys, while mountainous areas are sparsely inhabited, with densities approaching 0 inhabitants per km
2 [
23]. The total population of the study area is approximately 30,000 [
24]. Most towns are situated close to rivers, making them particularly susceptible to flooding. Localities such as Vărbilău, Dumbrăvești, and Aluniș (
Figure 2) exhibit higher road densities, while Slănic—the only town in the catchment—has a very high road density [
24]. Bertea and Ștefești show average road density, whereas Lutu Roșu, in the northern part of the catchment, has relatively low road density. The primary road in the catchment is County Road DJ 102, which connects Slănic with Dumbrăvești in the south and provides the main route to Ploiești, the nearest major city.
Other significant roads include DJ 101T, linking Bertea and Vărbilău; DJ 216A, connecting Ștefești to DJ 101T; and DJ 214, which provides access between Aluniș and the western part of the catchment. Overall, the road network allows easier travel from north to south in the eastern and southern areas, while in the central and western regions, movement is more accessible along a northwest–southeast direction.
Figure 3a shows the layout of Vărbilău commune, situated at the confluence of two rivers—a position that increases its exposure to flood risk. Given this vulnerability, assessing the locality’s accessibility is essential for effective emergency response and evacuation planning. Preliminary observations suggest that although the commune is intersected by key roads, including DJ 101T, some peripheral areas may be underserved. During floods, low-lying roads near the rivers are particularly susceptible to water coverage or structural damage, potentially causing delays in intervention. Understanding the road configuration and identifying critical points within the network is vital for improving the resilience of this locality.
Figure 3b illustrates the Dumbrăveşti commune, where the nearby rail embankment can influence flooding [
25] and impact accessibility—a topic that will be discussed further in the
Section 3.
Figure 3c presents Aluniș village, highlighting the Strâmba neighborhood north of the Civic Center. This area is especially vulnerable to flooding, making adequate coverage by emergency response units critical.
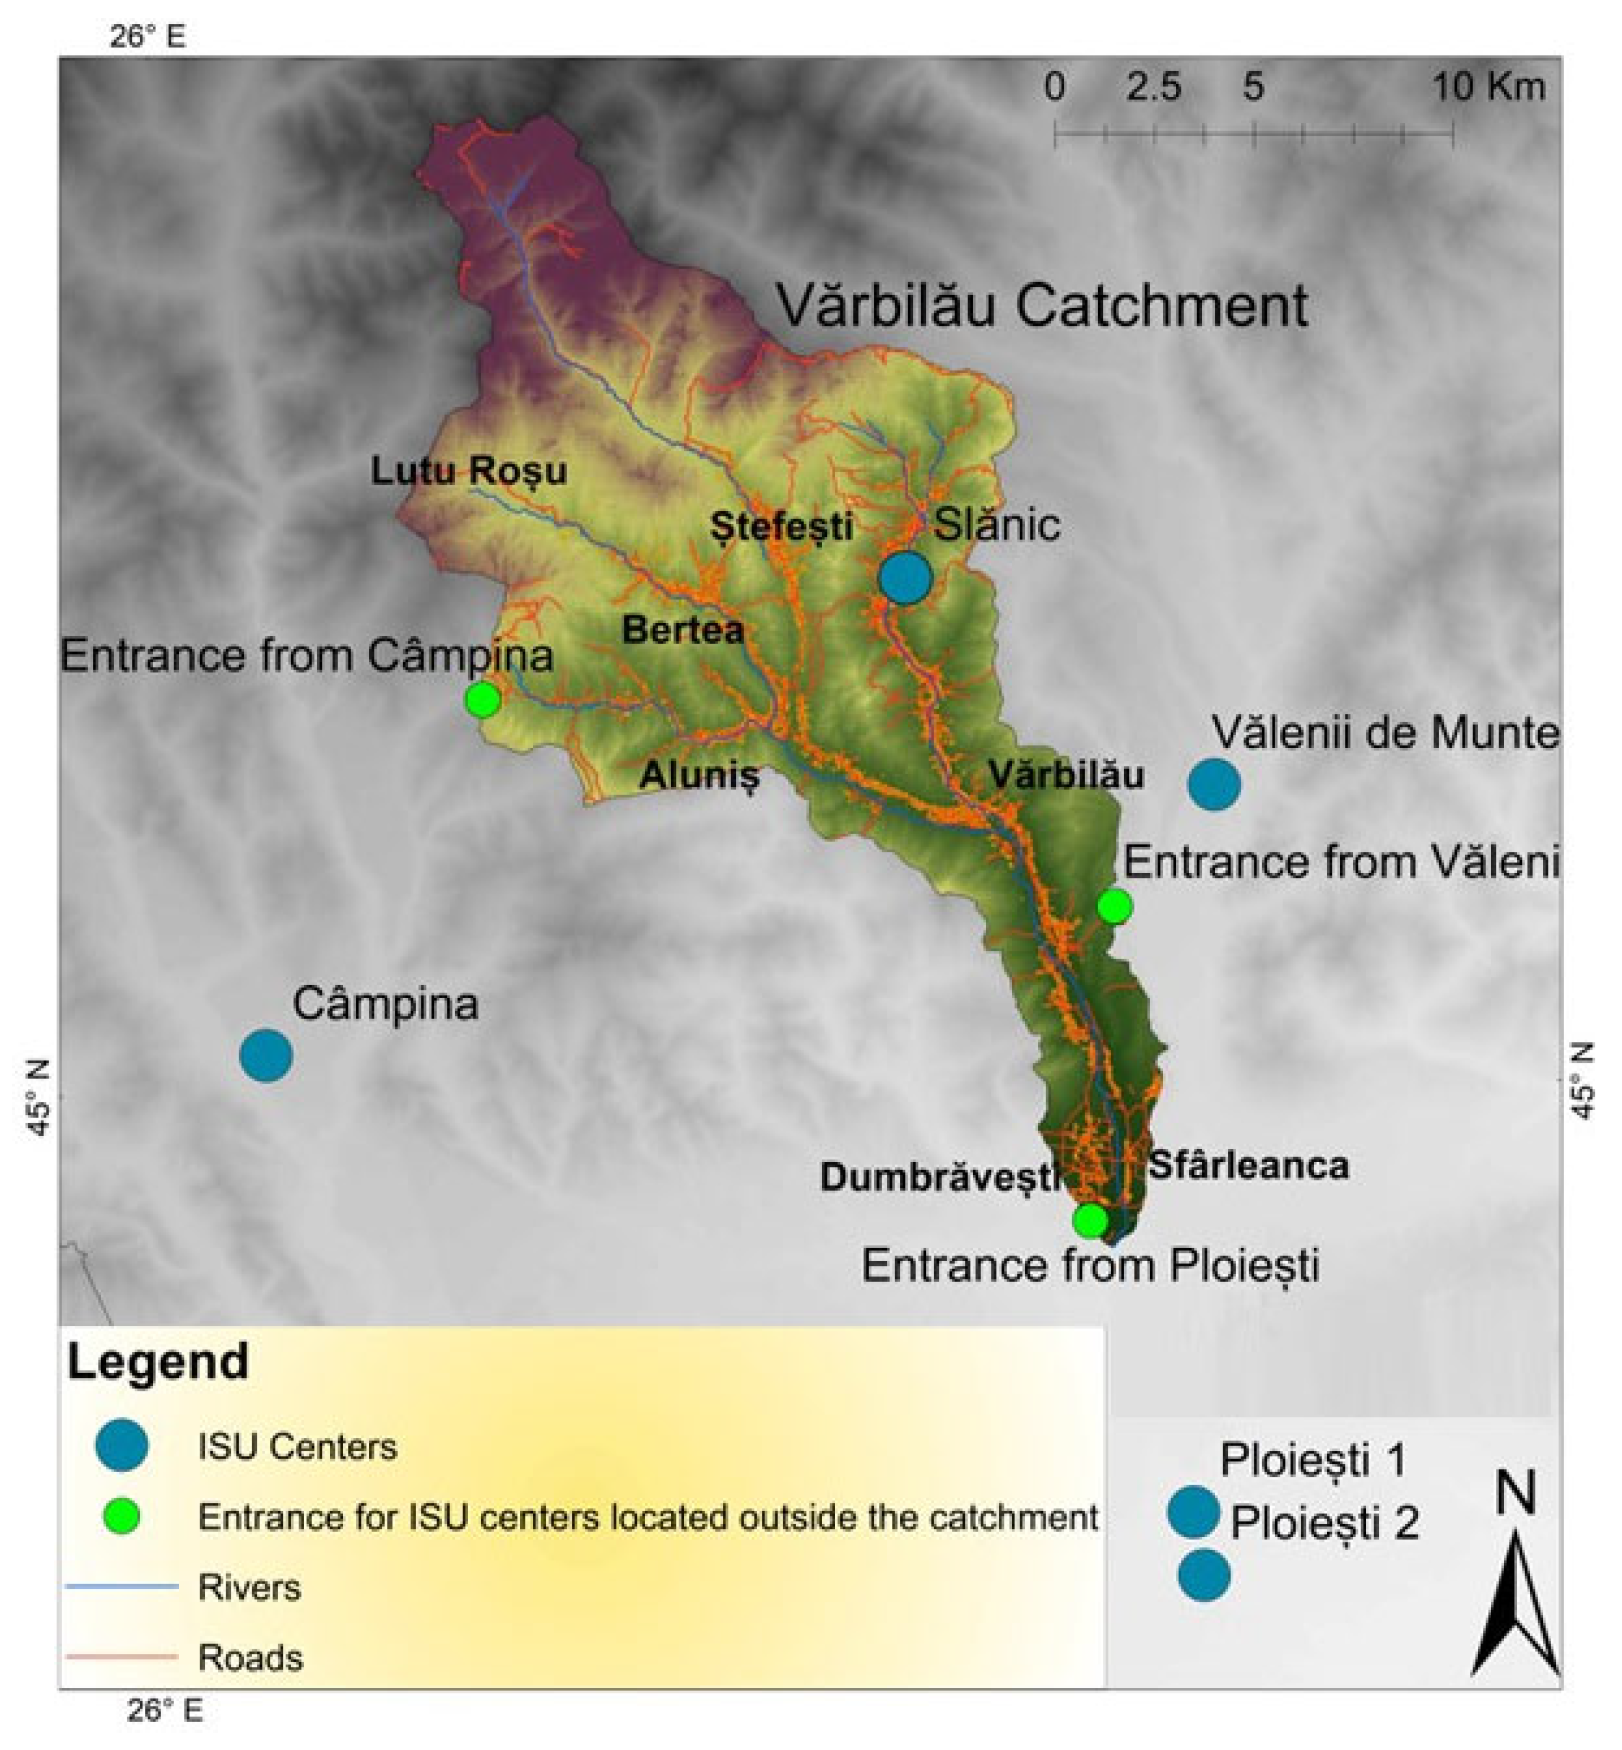
Emergency intervention in the region is provided by several ISU centers located in Ploieşti (which hosts two ISU units), Câmpina, and Vălenii de Munte (
Figure 4).
Within the hydrographic basin, the only intervention center is a small unit based in Slănic. In addition to the road network, the area is also served by a railway line connecting Ploieşti to Slănic, which may provide alternative logistical options in the event of road disruptions.
The Vărbilău Catchment has experienced several exceptional events in recent years, underlining the importance of analyzing road accessibility in the context of recurrent natural hazards, as follows:
June 2021—Aluniş village: Heavy flooding occurred after a tributary of the Aluniş River overflowed its banks, inundating nearby households. Following its confluence with the Aluniş, additional households and the main road were flooded. The localities of Vărbilău and Ştefești were also affected.
June 2019—Slănic Prahova town: Torrential rains triggered flash floods that damaged roads and households.
July 2018—Vărbilău commune: Rapid floods originating from surrounding hills covered roads, independent of flows from the Slănic or Vărbilău rivers.
Landslide at Lutu Roşu (monitored since 1978): The county road DJ 101T, which connects Lutu Roşu with Bertea, has repeatedly been blocked by active sliding. Restoration works are ongoing.
April 2024—Slănic town center: Land subsidence affected an area of several dozen square meters, with a breach depth of around 2 m. Dozens of residents were evacuated.
These events highlight the hydrological vulnerability of the basin and demonstrate the critical importance of ensuring reliable road accessibility for both local communities and emergency response.
The following subchapters will present a detailed analysis of how these emergency centers serve the Vărbilău Catchment. Specific intervention scenarios will be examined, with a focus on two localities (Lutu Roşu and Dumbrăveşti-Sfȃrleanca) where landslides and flooding frequently disrupt road access, posing significant challenges to timely emergency response.
2.2. Methodology
Identifying accessibility within a region is a fundamental step in emergency planning. It supports the design of travel routes from intervention centers to affected zones and facilitates the evacuation of populations to designated shelter areas. Moreover, understanding accessibility is essential for evaluating the capacity and effectiveness of emergency response authorities [
26]. The findings of this study, which present the results of an accessibility analysis within the Vărbilău Catchment, provide a significant contribution to broader research aimed at defining optimal intervention strategies under various hazard scenarios.
To achieve this objective, both field observations and GIS-based analysis were employed. Fieldwork focused on identifying road types, the location of ISU centers, and access routes used by emergency services operating from outside the Vărbilău Catchment. GIS analysis, performed using ArcMap 10.2.2, facilitated the creation of maps that present current accessibility conditions within the catchment. In addition to general accessibility for emergency units, several potential intervention scenarios are examined.
Field surveys covered primary, secondary, and forest roads to approximate travel speeds between intersections. These speeds were then integrated with a GIS-based road database. Supplementary information was also collected, including road classification (county, communal, forest), road surface quality, network density, access points into the catchment, and distances from intervention centers to the areas they serve during emergencies.
Table 1 summarizes the categories, types, formats, and sources of the data used. The road network data are stored in shapefile (shp) format, specifically as polyline vector data compatible with GIS software.
This geospatial database enables the evaluation of accessibility across the road network in the Vărbilău Catchment and the quantification of road segments affected by flooding. Building data were stored in polygon shapefile format and were used to quantify the number of flooded structures within the study area. Elevation information was provided by a Digital Elevation Model (DEM) in raster format, with a spatial resolution of 30 × 30 m. For the development of accessibility maps, shapefiles (shp) were required, including with point-type data representing the locations of intervention facilities. Using this dataset, a comprehensive road accessibility map was created. All maps were generated by the authors using ArcMap environment, with corrections applied to improve the accuracy and usability of the road network. To ensure the functional road network model, several adjustments were necessary:
Assignment of travel speeds: Each road segment was attributed a realistic travel speed (according to the legislation and the road situation).
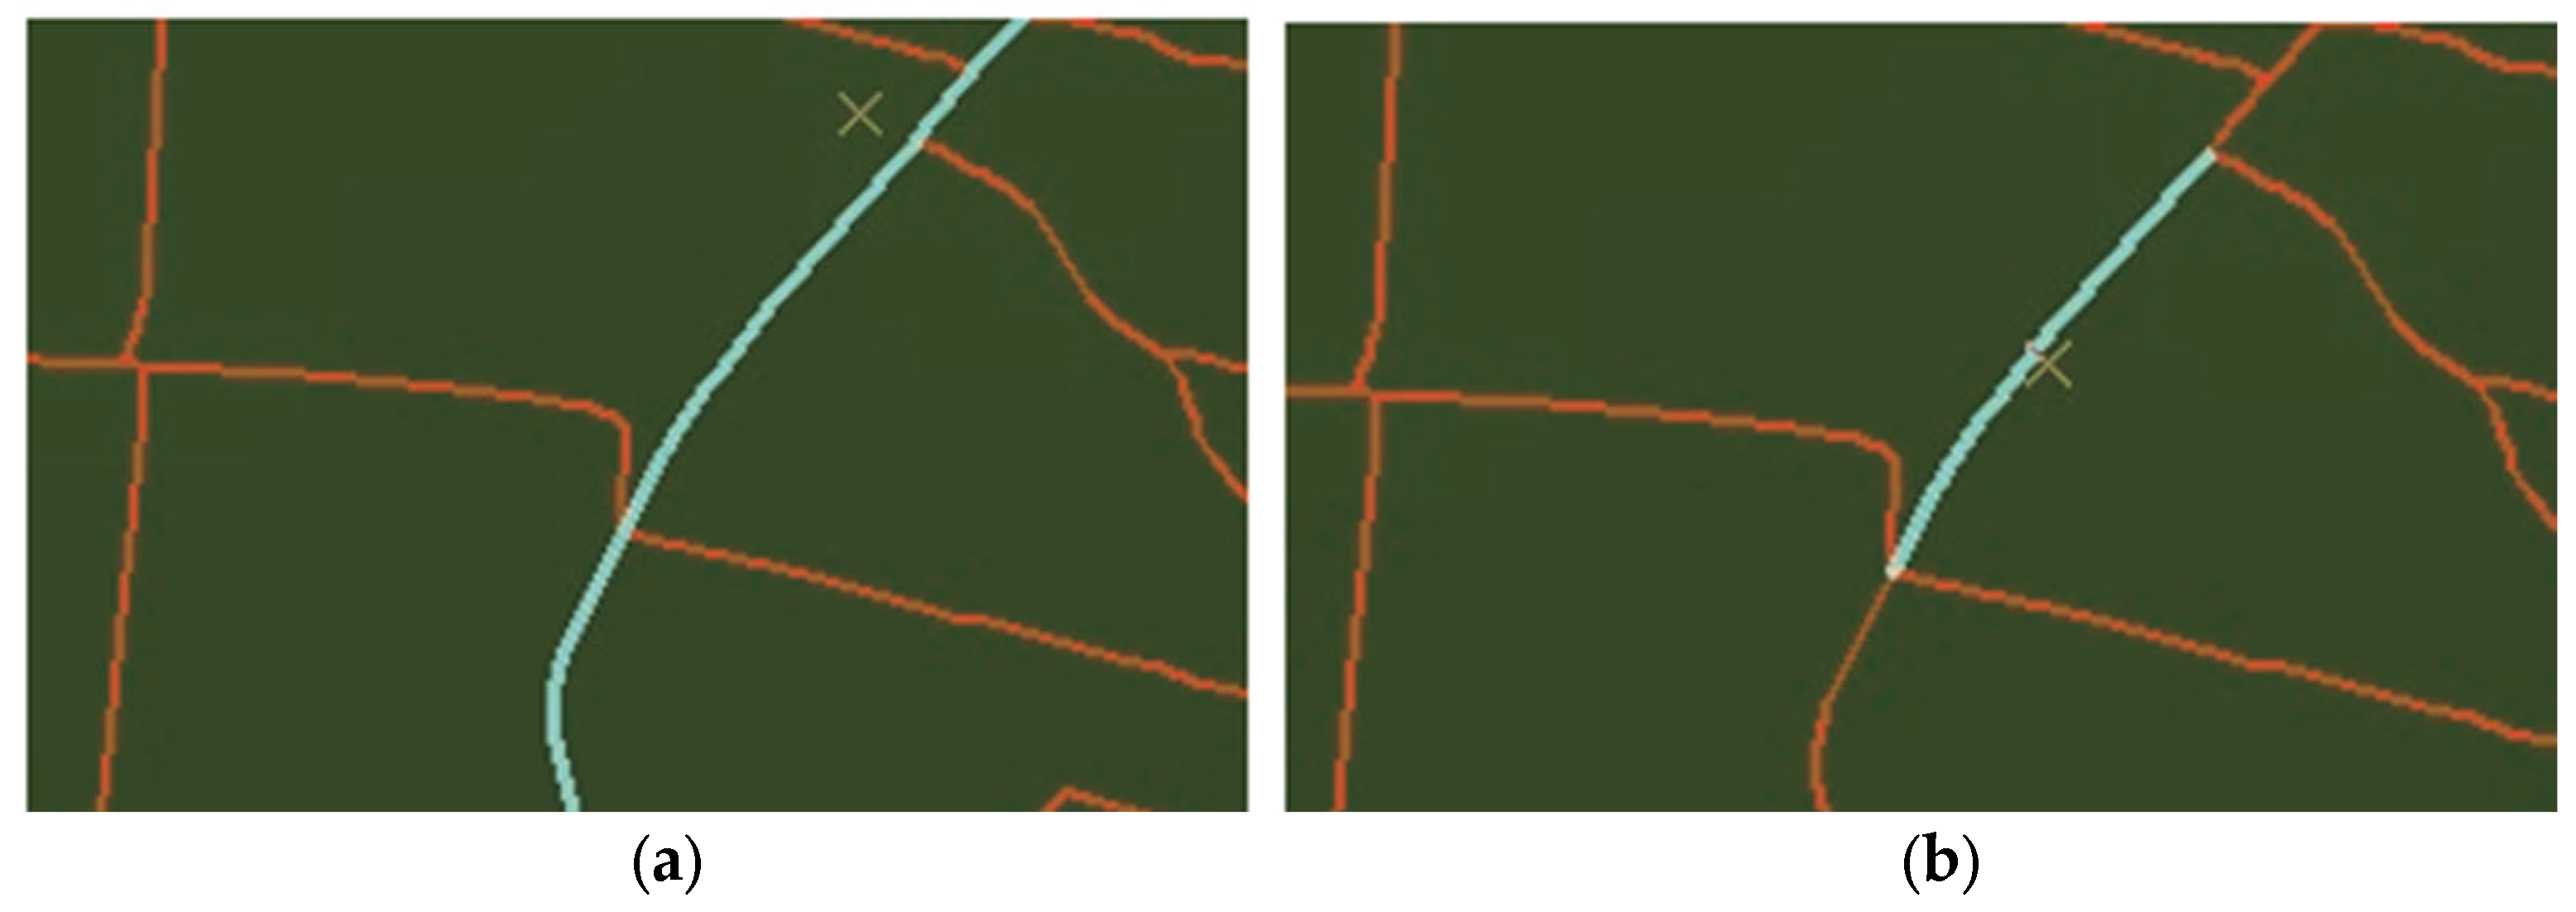
Verification of intersections: Road connections were carefully checked to confirm that segments converged at a single junction point. Segments that extended beyond intersections without a common node were not recognized in the GIS network, which would otherwise prevent accurate accessibility calculations.
Figure 5a illustrates a road segment with an incorrect network topology. Each line representing a road must terminate at a junction point to ensure proper connectivity, meaning each road should exist as a segment between two junctions. At a cross-shaped (“x”) intersection, for example, all road segments must meet at a single point.
Errors of this type were identified using the Topology extension in ArcToolbox (Data Management Tools) and were manually corrected with the Split Tool in the GIS Editor. Hundreds of such corrections were made.
Figure 5b shows a properly structured road segment. The Vărbilău watershed polygon was defined using the
Merge function from the Geoprocessing toolbox, which combined the Slănic and Bertea subbasins with Vărbilău into a single, unified basin. The corrected road network was then integrated into this watershed polygon, with each segment characterized by multiple attributes relevant to the accessibility model. Hydrological and elevation data were incorporated using the
Clip function, which extracted the river network and DEM layers for the study area.
The length of each road segment was automatically calculated based on distances between intersections or from road edges to the nearest junction. Travel time was estimated by adding a new “minutes” field to the road attribute table and computing values with the Field Calculator. A new network dataset was then created in the GIS Catalog, using the minutes field as a cost attribute for network analysis [
27].
The Service Area feature of ArcGIS Network Analyst was employed to calculate the regions accessible within specified time intervals from each emergency facility. Four facilities were defined: Câmpina, Vălenii de Munte, and Ploieşti (serving as entry points into the Vărbilău Catchment), and Slănic (the only ISU center located within the catchment). Default time thresholds [
28] were set at <10 min, 10–20 min, 20–30 min, 30–40 min, and >40 min. These intervals represent estimated driving times from each facility into surrounding areas. Based on these parameters, service area maps were generated, allowing for the identification of potential coverage gaps and regions at risk of delayed intervention.
2.3. Data Collection and Analysis
To quantify accessibility, a scoring system was applied to travel times: a score of 5 was assigned to areas reachable in less than 10 min, 4 to areas within 10–20 min, 3 to 20–30 min, 2 to 30–40 min, and 1 to areas requiring more than 40 min [
29]. Raster layers were generated in GIS for each of the four ISU emergency units, resulting in individual accessibility maps. A composite accessibility map for the entire Vărbilău Catchment was then created using the Raster Calculator tool. This map was obtained by summing the raster layers of the four ISU centers, thereby integrating their respective service areas into a single representation of emergency accessibility. The composite map reflects the combined influence of the road network and the spatial distribution of intervention facilities, offering a comprehensive overview of accessibility conditions across the catchment [
30].
To refine this model, a weighting system was incorporated into the raster-based analysis by applying multipliers that accounted for the relative importance and operational capacity of each intervention center [
31], i.e.,
where
R = the sum of rasters of the time travel maps for each emergency point, taking into account the road network (general accessibility map);
MapS = the raster for Slănic ISU point;
MapC = the raster for Câmpina ISU point;
MapV = the raster for Vălenii de Munte ISU point;
MapP = the raster for Ploieşti ISU point.
No multiplier was applied to the Slănic center, as it is a minor facility located within the Vărbilău Catchment. Similarly, the Câmpina center, although a major facility, was not weighted because of its distance from the catchment (approximately 20 km) and its limited accessibility via a winding, hilly route. In contrast, the Vălenii de Munte center, located only 5 km from the catchment boundary and benefiting from easier access, was assigned a multiplier of 2. The Ploieşti center, situated about 12 km away and hosting two major ISU detachments, was given the highest weight, with a multiplier of 4 [
32]. These multipliers were integrated in the raster calculation, allowing the composite accessibility model to more accurately represent the relative influence and capacity of each intervention.
The general accessibility map was generated using a raster calculation formula, resulting in values ranging from 8 (indicating low accessibility) to 28 (indicating high accessibility). To classify these values, five intervals were established using the
Natural Breaks classification method within the GIS environment. This method identifies natural groupings in the data distribution to define class boundaries. The resulting intervals were then imported into the KNIME tool, where they were reclassified into five accessibility categories using the
Rule Engine node. This node functions similarly to a formula in Excel, allowing conditional logic to reassign values. The reclassified output is presented in
Table 2. Reclassification was essential to improve the interpretability of accessibility data.
The classification scheme is as follows:
Value 1 (8–9): Least served areas;
Value 2 (9–11): Poorly served areas;
Value 3 (11–16): Moderately served areas;
Value 4 (16–22): Well-served areas;
Value 5 (22–28): Best served areas.
This step simplifies the visualization and interpretation of accessibility levels across the Vărbilău Catchment, enabling decision-makers to more easily identify areas where improvements to the emergency response infrastructure may be required.
The following section presents the methodology for analyzing two scenarios related to emergency road accessibility. These scenarios simulate potential constraints in the availability of intervention centers, providing insight into how emergency coverage may shift under limited-resource conditions.
Scenario 1 assumes the unavailability of the Ploieşti intervention center. This situation could arise if teams from Ploieşti are deployed to other emergencies outside the catchment, forcing reliance on the remaining centers.
Scenario 2 considers a more severe case in which both the Ploieşti and Vălenii de Munte teams are unavailable. This reflects a situation where simultaneous emergencies in neighboring areas require units from other locations—such as Câmpina or Slănic—to assume full responsibility for the Vărbilău Catchment.
For Scenario 1, the general accessibility formula was adjusted to exclude the Ploieşti multiplier and raster layer. The formula applied was as follows:
where
R = composite raster of travel-time maps for available intervention centers (general accessibility map);
MapS = the raster for Slănic ISU point;
MapC = the raster for Câmpina ISU point;
MapV = the raster for Vălenii de Munte ISU point.
In this case, the Vălenii de Munte ISU center was assigned a weight of 2 to reflect its greater relative importance compared to the Slănic and Câmpina centers, owing to its proximity to the Vărbilău Catchment and its strategic role in emergency response. Individual accessibility maps were first generated for each of the three centers, then reclassified into the five-class scale. These reclassified rasters were then subsequently merged to produce a composite accessibility map representing the intervention capacity in the absence of the Ploieşti unit.
For Scenario 2, the general accessibility formula was further reduced to exclude both the Ploieşti and Vălenii de Munte centers. The formula applied was as follows:
where
R = composite raster of travel-time maps for the available intervention centers (general accessibility map);
MapS = the raster for Slănic point;
MapC = the raster for Câmpina point.
In this scenario, only the Slănic and Câmpina centers were considered, reflecting a severe limitation of emergency resources within the catchment. To refine the results, obstacles were introduced in GIS to simulate conditions such as blocked roads, thereby generating updated accessibility maps. Subsequently, hydraulic modeling was performed in Hydrologic Engineering Center River Analysis System (HEC-RAS) to delineate flooded surfaces. These outputs were exported into GIS and overlaid with the accessibility layers, enabling the assessment of how flooding further constrains emergency response capacity under this worst-case scenario.
3. Results
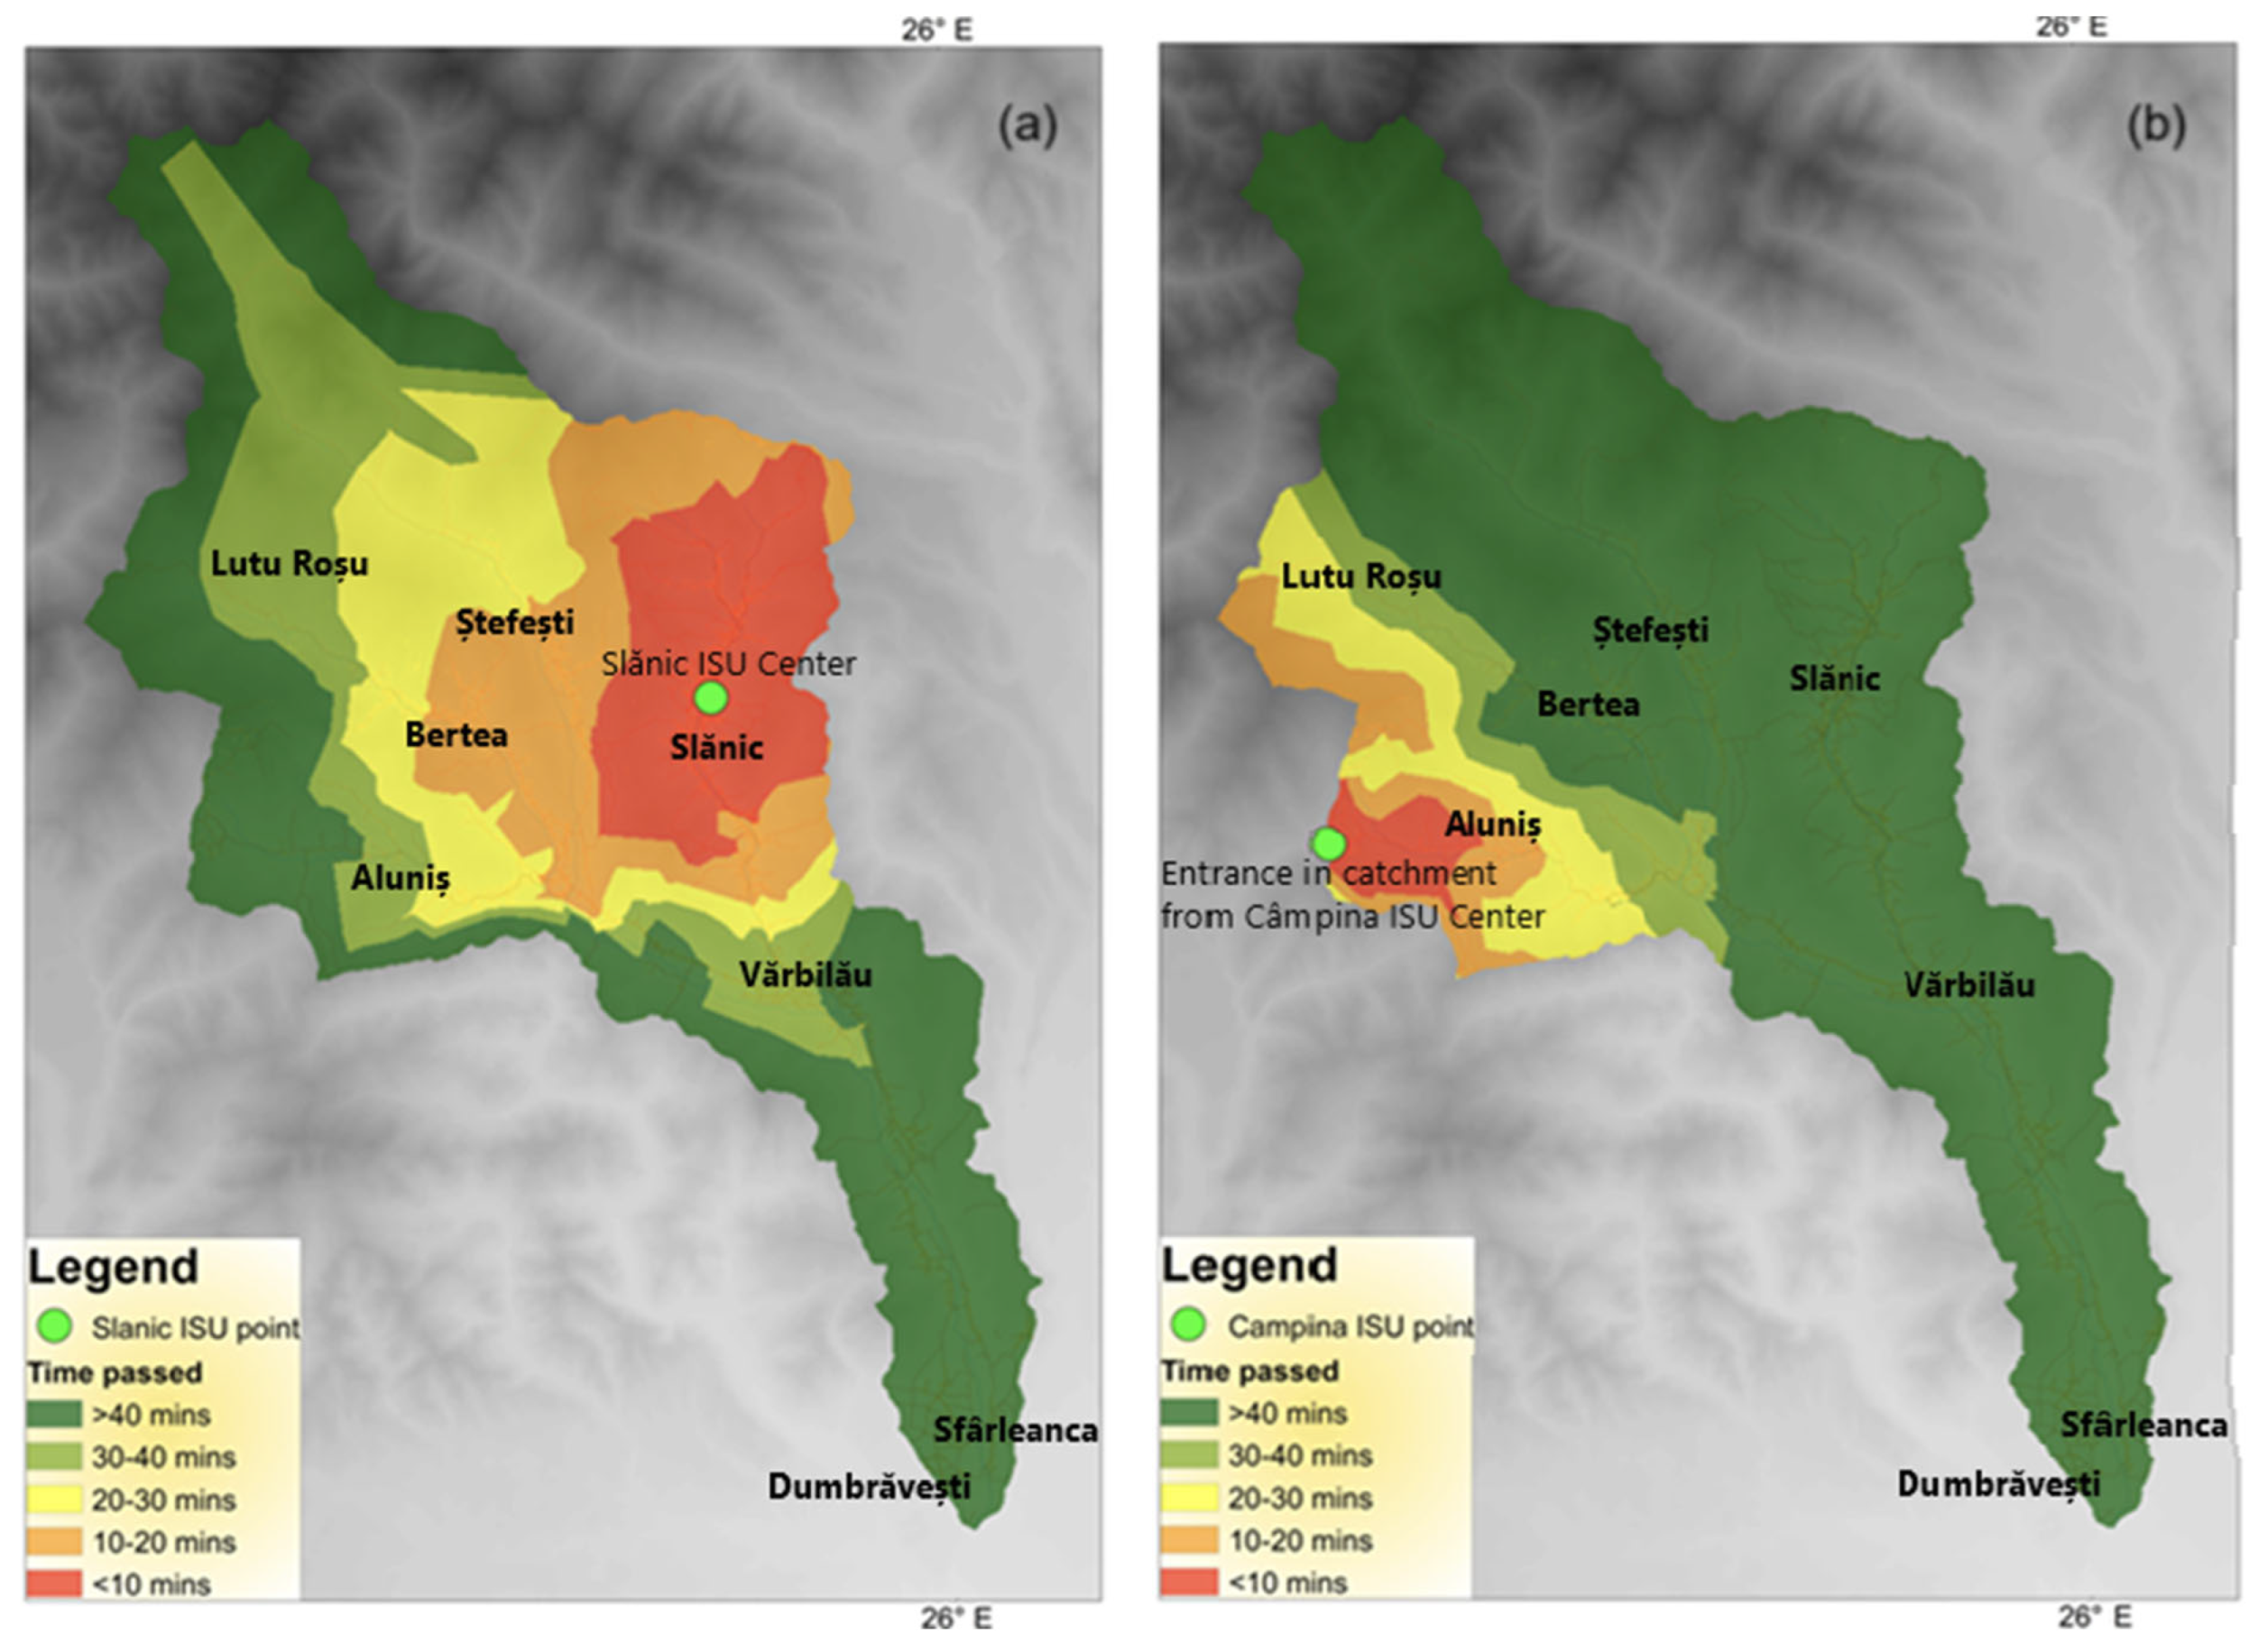
3.1. Accessibility from the Slănic ISU Center
The Slănic ISU center is strategically located within the Vărbilău Catchment, making it highly effective in serving Slănic town and its immediate surroundings, typically within 10 min. This efficiency is supported by the area’s favorable topography, high road density, and modernized infrastructure. The extensive and well-maintained network ensures broad coverage across the locality. However, accessibility declines with increasing distance from the center. The least served zones are in the southern, western, and northern parts of the catchment.
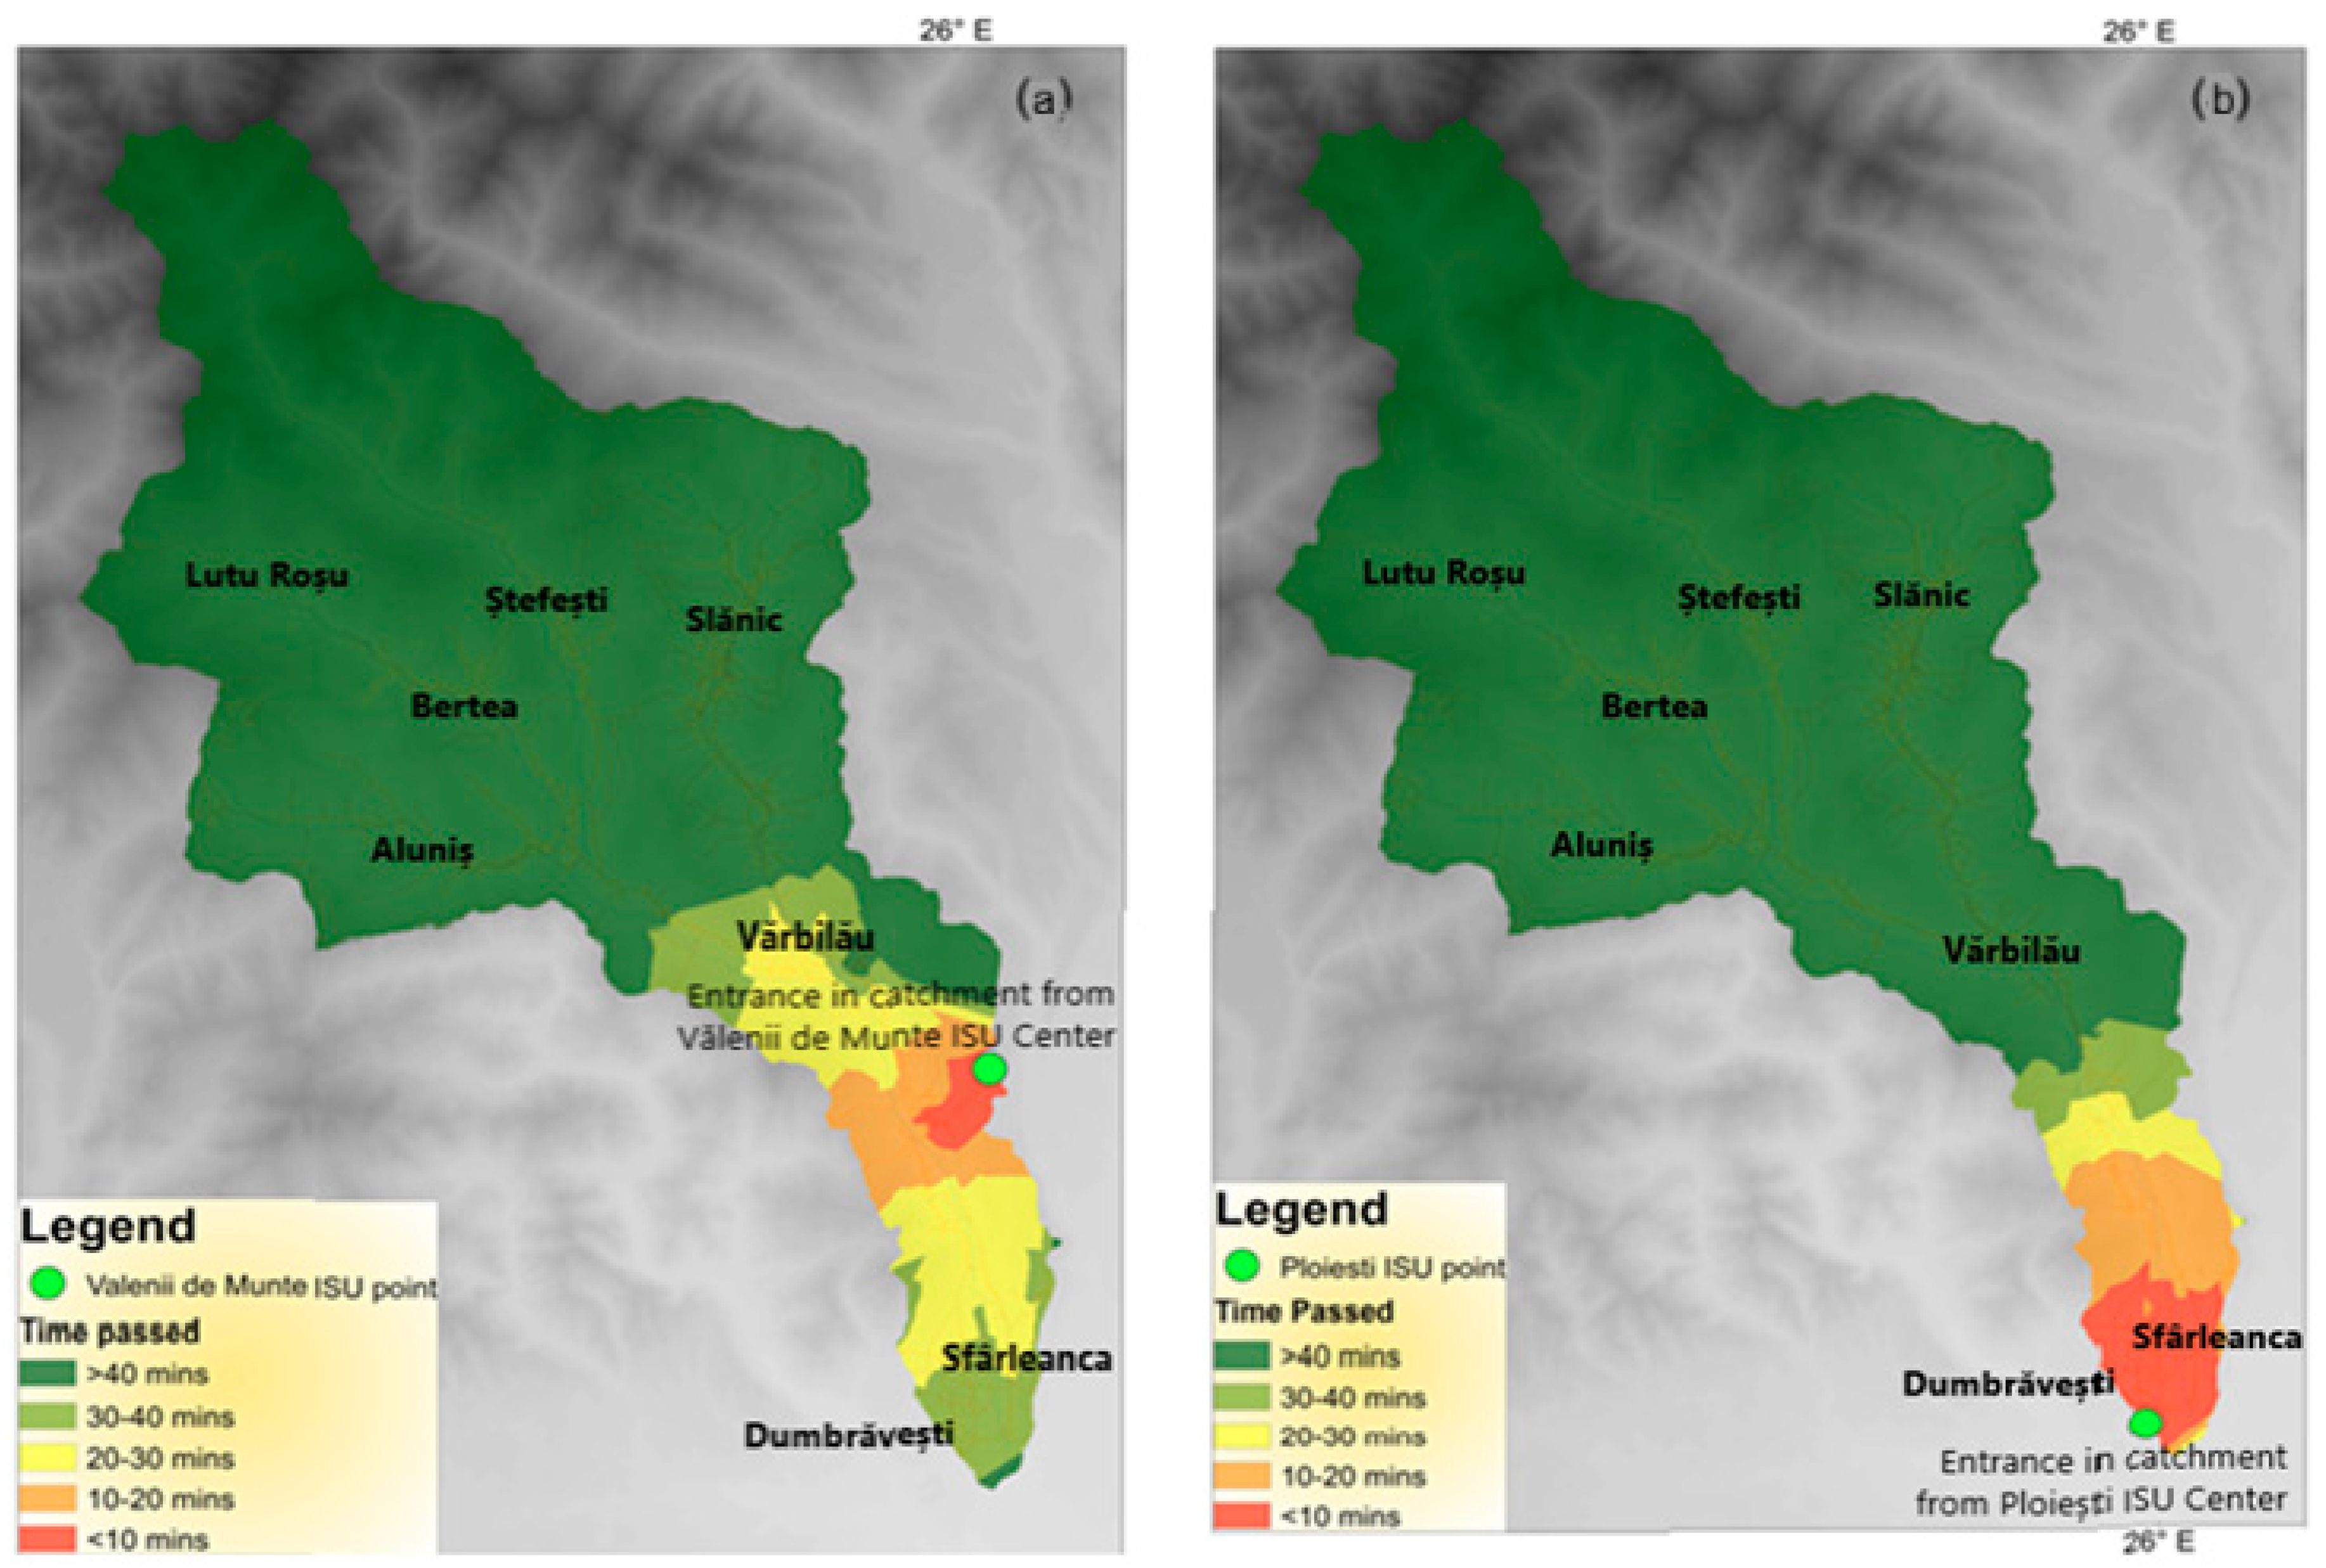
Travel times to nearby localities such as Bertea and Ştefeşti are 10–20 min. Although Ştefeşti is geographically close, its hilltop location forces emergency teams to either use a narrow-elevated road or a longer detour; both routes result in similar travel times. More distant localities, including Vărbilău, Scurteşti (north of Ştefeşti), and Aluniş, require 20–30 min. A major concern in the area is the vulnerability of the main road between Slănic and Vărbilău to flooding. Peripheral areas face additional challenges. In western Aluniş, Lutu Roşu, and southern Vărbilău, unpaved or degraded roads increase travel times to 30–40 min. The most remote areas, such as Dumbrăveşti and Sfârleanca, require over 40 min to reach.
The maps of travel time from Slănic and Câmpina ISU are presented in
Figure 6. Despite these limitations, the Slănic center holds strategic value. Centrally located near key assets such as the salt mine and the train station, it enables rapid intervention in the basin’s most populated areas.
However, its equipment and resources are limited, and large-scale emergencies—particularly flooding—are likely to require intervention from the better-equipped Vălenii de Munte team.
3.2. Accessibility from the Câmpina ISU Center
The Câmpina ISU center lies west of the Vărbilău Catchment and serves as a primary entry point for emergency units. Access is via the Aluniş–Câmpina road, a winding and narrow route that requires 40–50 min to reach the catchment entrance. Once inside the catchment, the best-served locality is western Aluniş (~10 min from the entrance). Given similar response times from Câmpina and Vălenii de Munte (approximately 60 min total), the Câmpina unit is likely to respond here if the Vălenii team is unavailable. Second-tier accessibility zones (10–20 min) include eastern Aluniş, the flood-prone Strâmba neighborhood, and Ostrovu village [
3].
Other areas are less accessible. Lutu Roşu, prone to landslides, requires 20–30 min under favorable weather, but poor conditions can significantly delay response. Livadea, between Aluniş and Vărbilău, lies within the 30–40 min range. The least served areas from Câmpina include Slănic, Vărbilău, and Dumbrăveşti, due to their distance from the western entry point. Bertea is particularly disadvantaged, requiring 30–40 min of travel inside the catchment in addition to the 40–50 min needed to reach the entrance. Accessibility here is further reduced by a sparse, lower-quality road network and terrain constraints.
Despite its robust equipment and operational capabilities, the Câmpina center’s major limitation is its location outside the catchment and the time-consuming route required to access it. As outlined in the
Section 2.2, the Slănic and Câmpina centers were not assigned multipliers in the emergency accessibility maps, reflecting their secondary role compared to the more influential Ploieşti and Vălenii de Munte facilities.
3.3. Accessibility from the Vălenii de Munte ISU Center
The Vălenii de Munte ISU center, located at the southeastern entrance of the catchment, provides relatively rapid intervention to the nearby localities. The best-served area is Coţofeneşti village (southern Vărbilău), located only about 5 km from the entrance. The southeastern locality of Poiana Vărbilău can also be reached in under 10 min, making it the most accessible settlement from this unit. The southern section of Vărbilău village lies within the 10–20 min zone, while central Vărbilău falls into the 20–30 min range. Northern Vărbilău and Dumbrăveşti, despite their denser road networks, require 30–40 min. Overall, a significant portion of the central and northern catchment remains underserved by Vălenii de Munte due to distance and network limitations. Travel times exceed 40 min for more distant areas such as Slănic, Bertea, and Ştefeşti—exceeding 50 min when accounting for the 10 min approach from Vălenii to the catchment entrance.
The elongated north–south alignment of the southern catchment, combined with a single access road and hilly terrain, further constrains emergency coverage. Nevertheless, Vălenii de Munte remains closer than Câmpina, providing a partial advantage despite these challenges.
Figure 7 presents the time travel maps from Vălenii de Munte and Ploieşti.
3.4. Accessibility from the Ploiești ISU Center
The Ploieşti ISU facility, located just south of Dumbrăveşti, serves the southern part of the catchment efficiently. Benefiting from a dense, modern road network and flat terrain, it ensures travel times of less than 10 min to Dumbrăveşti and Sfârleanca. Settlements immediately north of Dumbrăveşti fall within the 10–20 min zone, while Poiana Vărbilău lies within 20–30 min. However, travel times to central and northern settlements, including Vărbilău village and Slănic, exceed 40 min, owing to longer distances and topographic barriers. The approach from Ploieşti to the catchment entrance itself takes ~25 min.
Ploieşti hosts two fully equipped ISU emergency centers, reflecting its status as a major urban center. Given its resources and relative proximity, Ploieşti is expected to play a primary role (together with Vălenii de Munte) in managing hazard events in the catchment. In contrast, Slănic and Câmpina are more likely to play only secondary or localized roles.
According to the emergency accessibility methodology, Ploieşti was assigned a multiplier of 4, reflecting its dual facilities, superior equipment, and relatively short distance to the catchment. Vălenii de Munte received a multiplier of 2, acknowledging its good equipment and closer location, albeit with only one center.
Based on
Figure 6 and
Figure 7, the southern Vărbilău village, Dumbrăveşti, Slănic, and western Aluniş represent areas that are reachable within 10 min from the nearest intervention center.
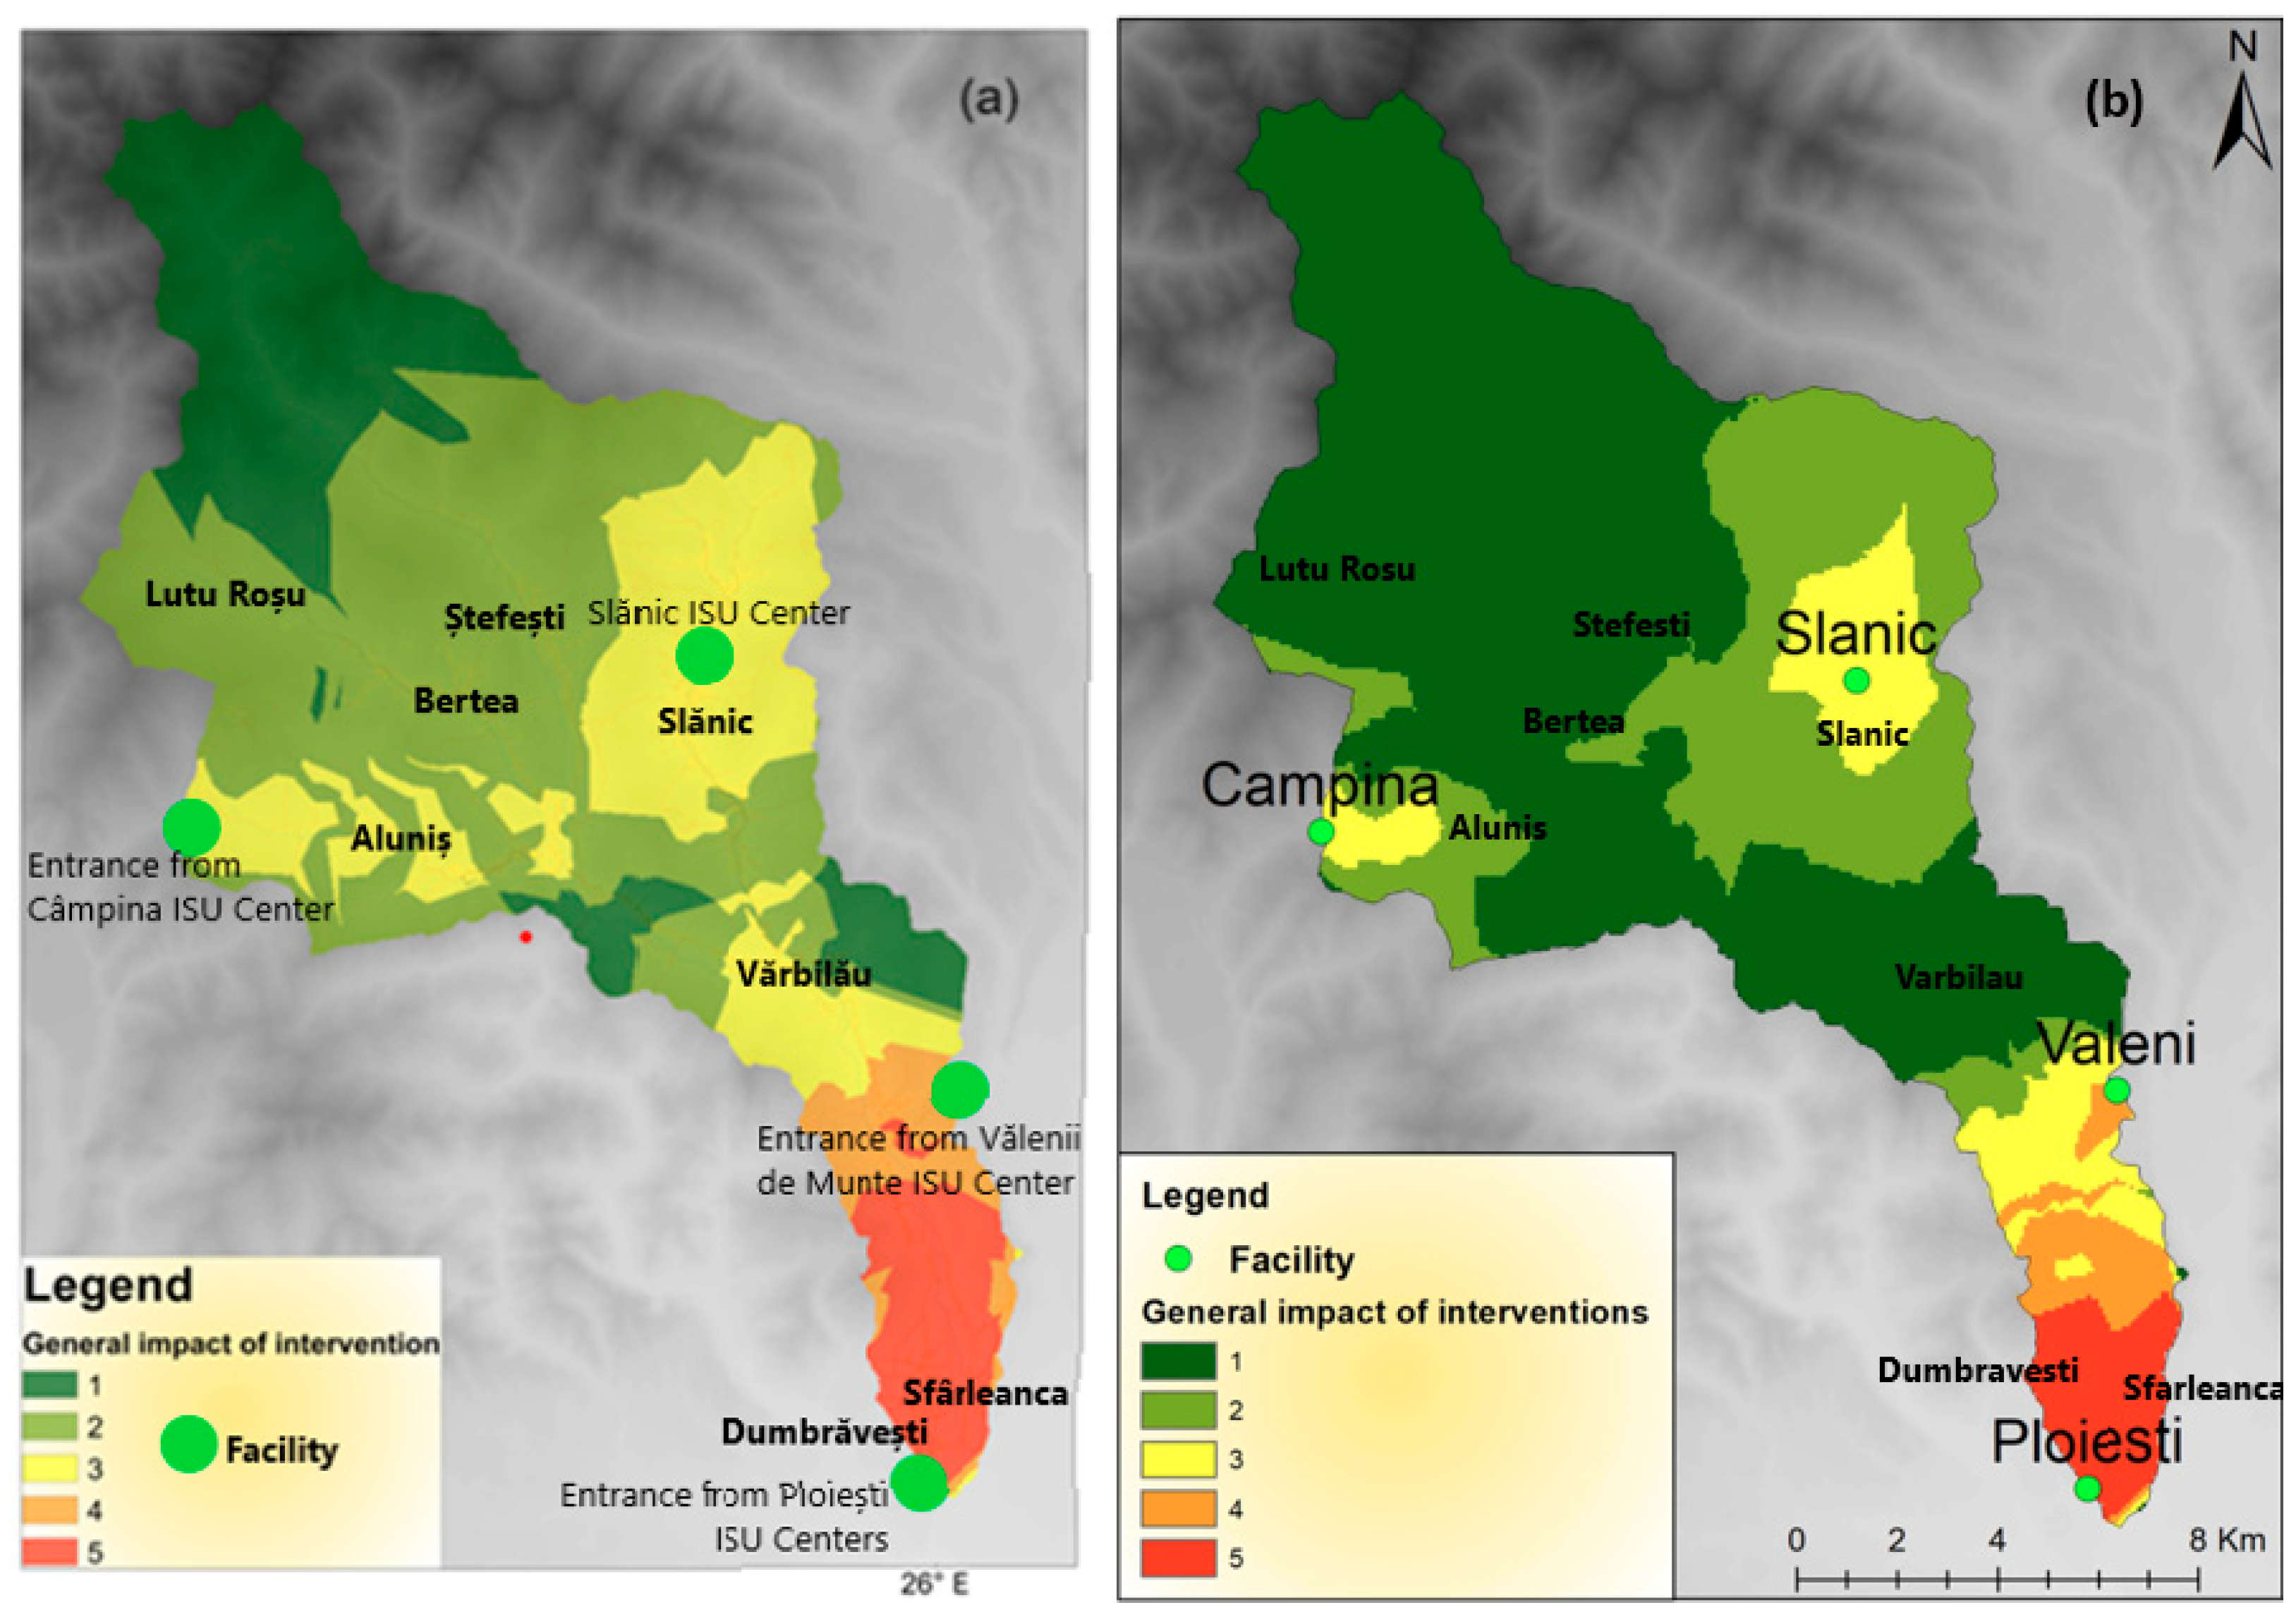
Figure 8 presents the accessibility index map, created using GIS raster analysis tools such as the Raster Calculator and reclassification methods, which synthesize the time travel results into a comprehensive spatial index.
The highest accessibility zones (assigned scores of 4 and 5) are concentrated in the southern part of the Vărbilău catchment, particularly around Dumbrăveşti. This area benefits from a dense and high-quality road network, short travel distances, and proximity to well-equipped ISU centers in Ploieşti and Vălenii de Munte, which hold greater operational significance compared to the smaller facilities at Slănic and Câmpina. Moderately accessible areas (scoring 3) are distributed across the northeastern, central, and parts of the western regions of the catchment. These intermediate scores are influenced by longer travel distances from Câmpina, the lower strategic importance of the Slănic team, and reduced road density in key localities such as Vărbilău and Aluniş. The least served areas (score 2) include Ştefeşti, Bertea, and parts of the Vărbilău commune, where hilly terrain, lower road density and quality, and greater distance from emergency facilities pose significant challenges for timely intervention. Finally, the least accessible or inaccessible zones (scoring 1) are found primarily in the northern part of the catchment, where mountainous terrain dominates, as well as in the eastern and western outskirts of the Vărbilău commune, which are also located in rugged, hilly landscapes. These areas present the highest risk for delayed or obstructed emergency response.
The accessibility in the Vărbilău Catchment is summarized in
Table 3.
3.5. Accessibility in Scenario 1
In Scenario 1, where the ISU Ploiești center is unavailable, the best-served areas (scoring 4 and 5) are concentrated in the central–southern part of the catchment, especially within Vărbilău commune (including villages such as Coţofeneşti and Poiana Vărbilău). Their good accessibility is largely due to their proximity to the Vălenii de Munte center, which proves more strategically important than the Slănic and Câmpina facilities. Nevertheless, these high-accessibility areas remain limited in extent, constrained by sparse road networks, inconsistent road quality, and restricted access from the remaining operational ISU centers.
By contrast, the least served zones are located mainly in the northern and central sectors, such as Bertea, Ştefeşti, and Lutu Roşu. These areas are defined by poor road infrastructure and geographical isolation in hilly or forested terrain, resulting in intervention times exceeding 40 min and accessibility scores of only 1 or 2. In such cases, emergency response would most likely depend on the Slănic and Câmpina intervention teams. The Slănic area itself scores moderately (3) but, due to its relative proximity to several vulnerable locations, remains the most probable intervention point in this scenario. This outcome underscores that local proximity can offset lower institutional capacity, emphasizing the importance of accessibility in effective emergency planning.
Overall, Scenario 1 results in a reduced yet still functional emergency service coverage compared to the baseline scenario that includes Ploiești. In this context, the Vălenii de Munte ISU team is the most likely to be mobilized, owing to its proximity to the Vărbilău basin and its stronger equipment and operational capacity relative to the Slănic center.
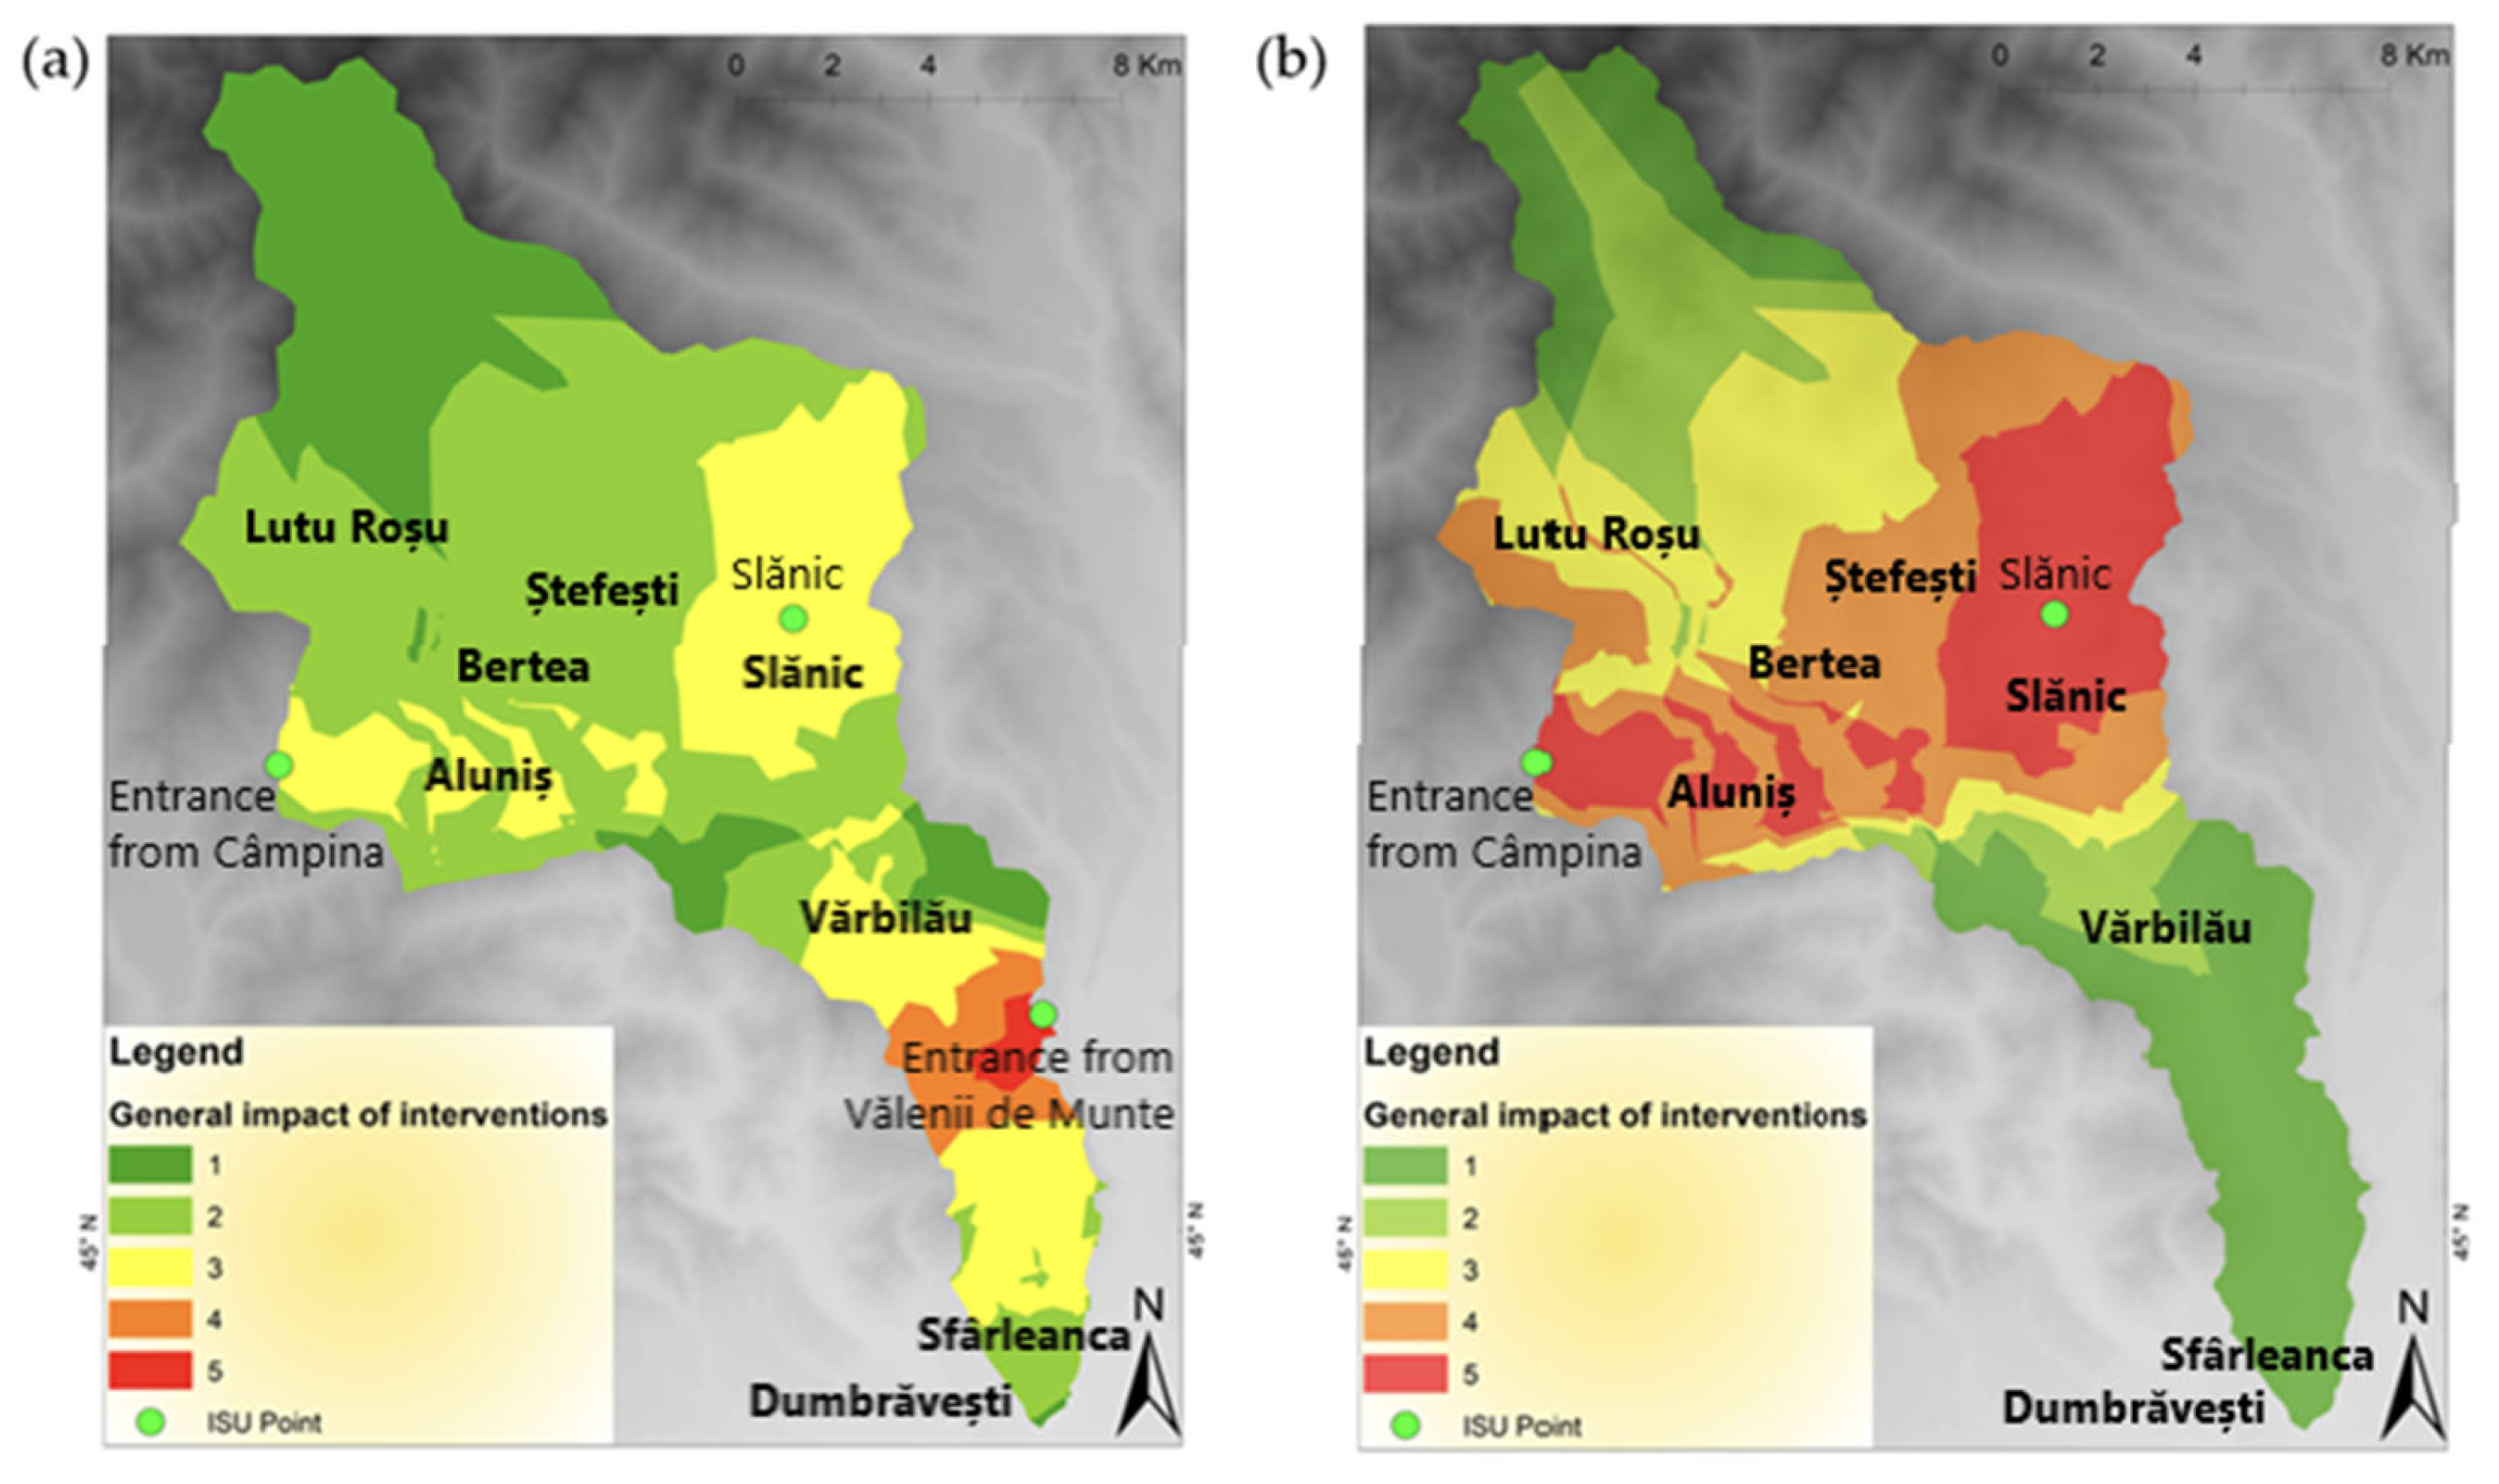
Accessibility scores have been reclassified on a 1–5 scale, and the accessibility map corresponding to Scenario is presented in
Figure 9a.
3.6. Accessibility in Scenario 2
Scenario 2 is illustrated in
Figure 9b, which shows the reclassified accessibility map when only the Slănic and Câmpina ISU centers are operational. The best-served areas (scores 4 and 5) include Aluniş, Ostrovu, and Slănic, benefiting from their proximity to the Slănic center and the Câmpina entrance point. However, this does not imply superior service compared to Scenario 1, when the Ploieşti and Vălenii de Munte centers were still active. In this scenario, the southern part of the catchment becomes the least served (scores 1 and 2), since two critical centers—Ploieşti and Vălenii de Munte, both essential due to their equipment and closeness to densely populated zones—are excluded. For instance, Dumbrăveşti and Vărbilău village, with higher population densities, experience a substantial decline in accessibility. Vărbilău, in particular, scores only 1–2, corresponding to intervention times exceeding 40 min from Slănic [
33]. By contrast, Aluniş can be reached within 10–20 min from the Câmpina entrance, while Slănic and its surroundings are accessible in under 10 min. Within this limited context, the Slănic ISU emerges as the most likely facility to be mobilized, mainly due to geographic proximity, despite its restricted resources.
This scenario highlights the importance of maintaining multiple, well-equipped emergency facilities. Reclassifying travel times into accessibility scores (1–5) proves crucial for visualizing relative service levels, enabling planners to quickly identify underserved areas. It also reinforces the critical role of facility location, road network quality, and response time in emergency planning. In general, a greater number of operational centers translates into faster response times and improved redundancy.
4. Discussion
Following the above analyses, flood extent and impact are examined for selected areas of the Vărbilău Catchment to demonstrate the importance of maintaining good accessibility and understanding the time required for emergency interventions.
4.1. Critical Accessibility Cases—Lutu Roșu and Sfârleanca
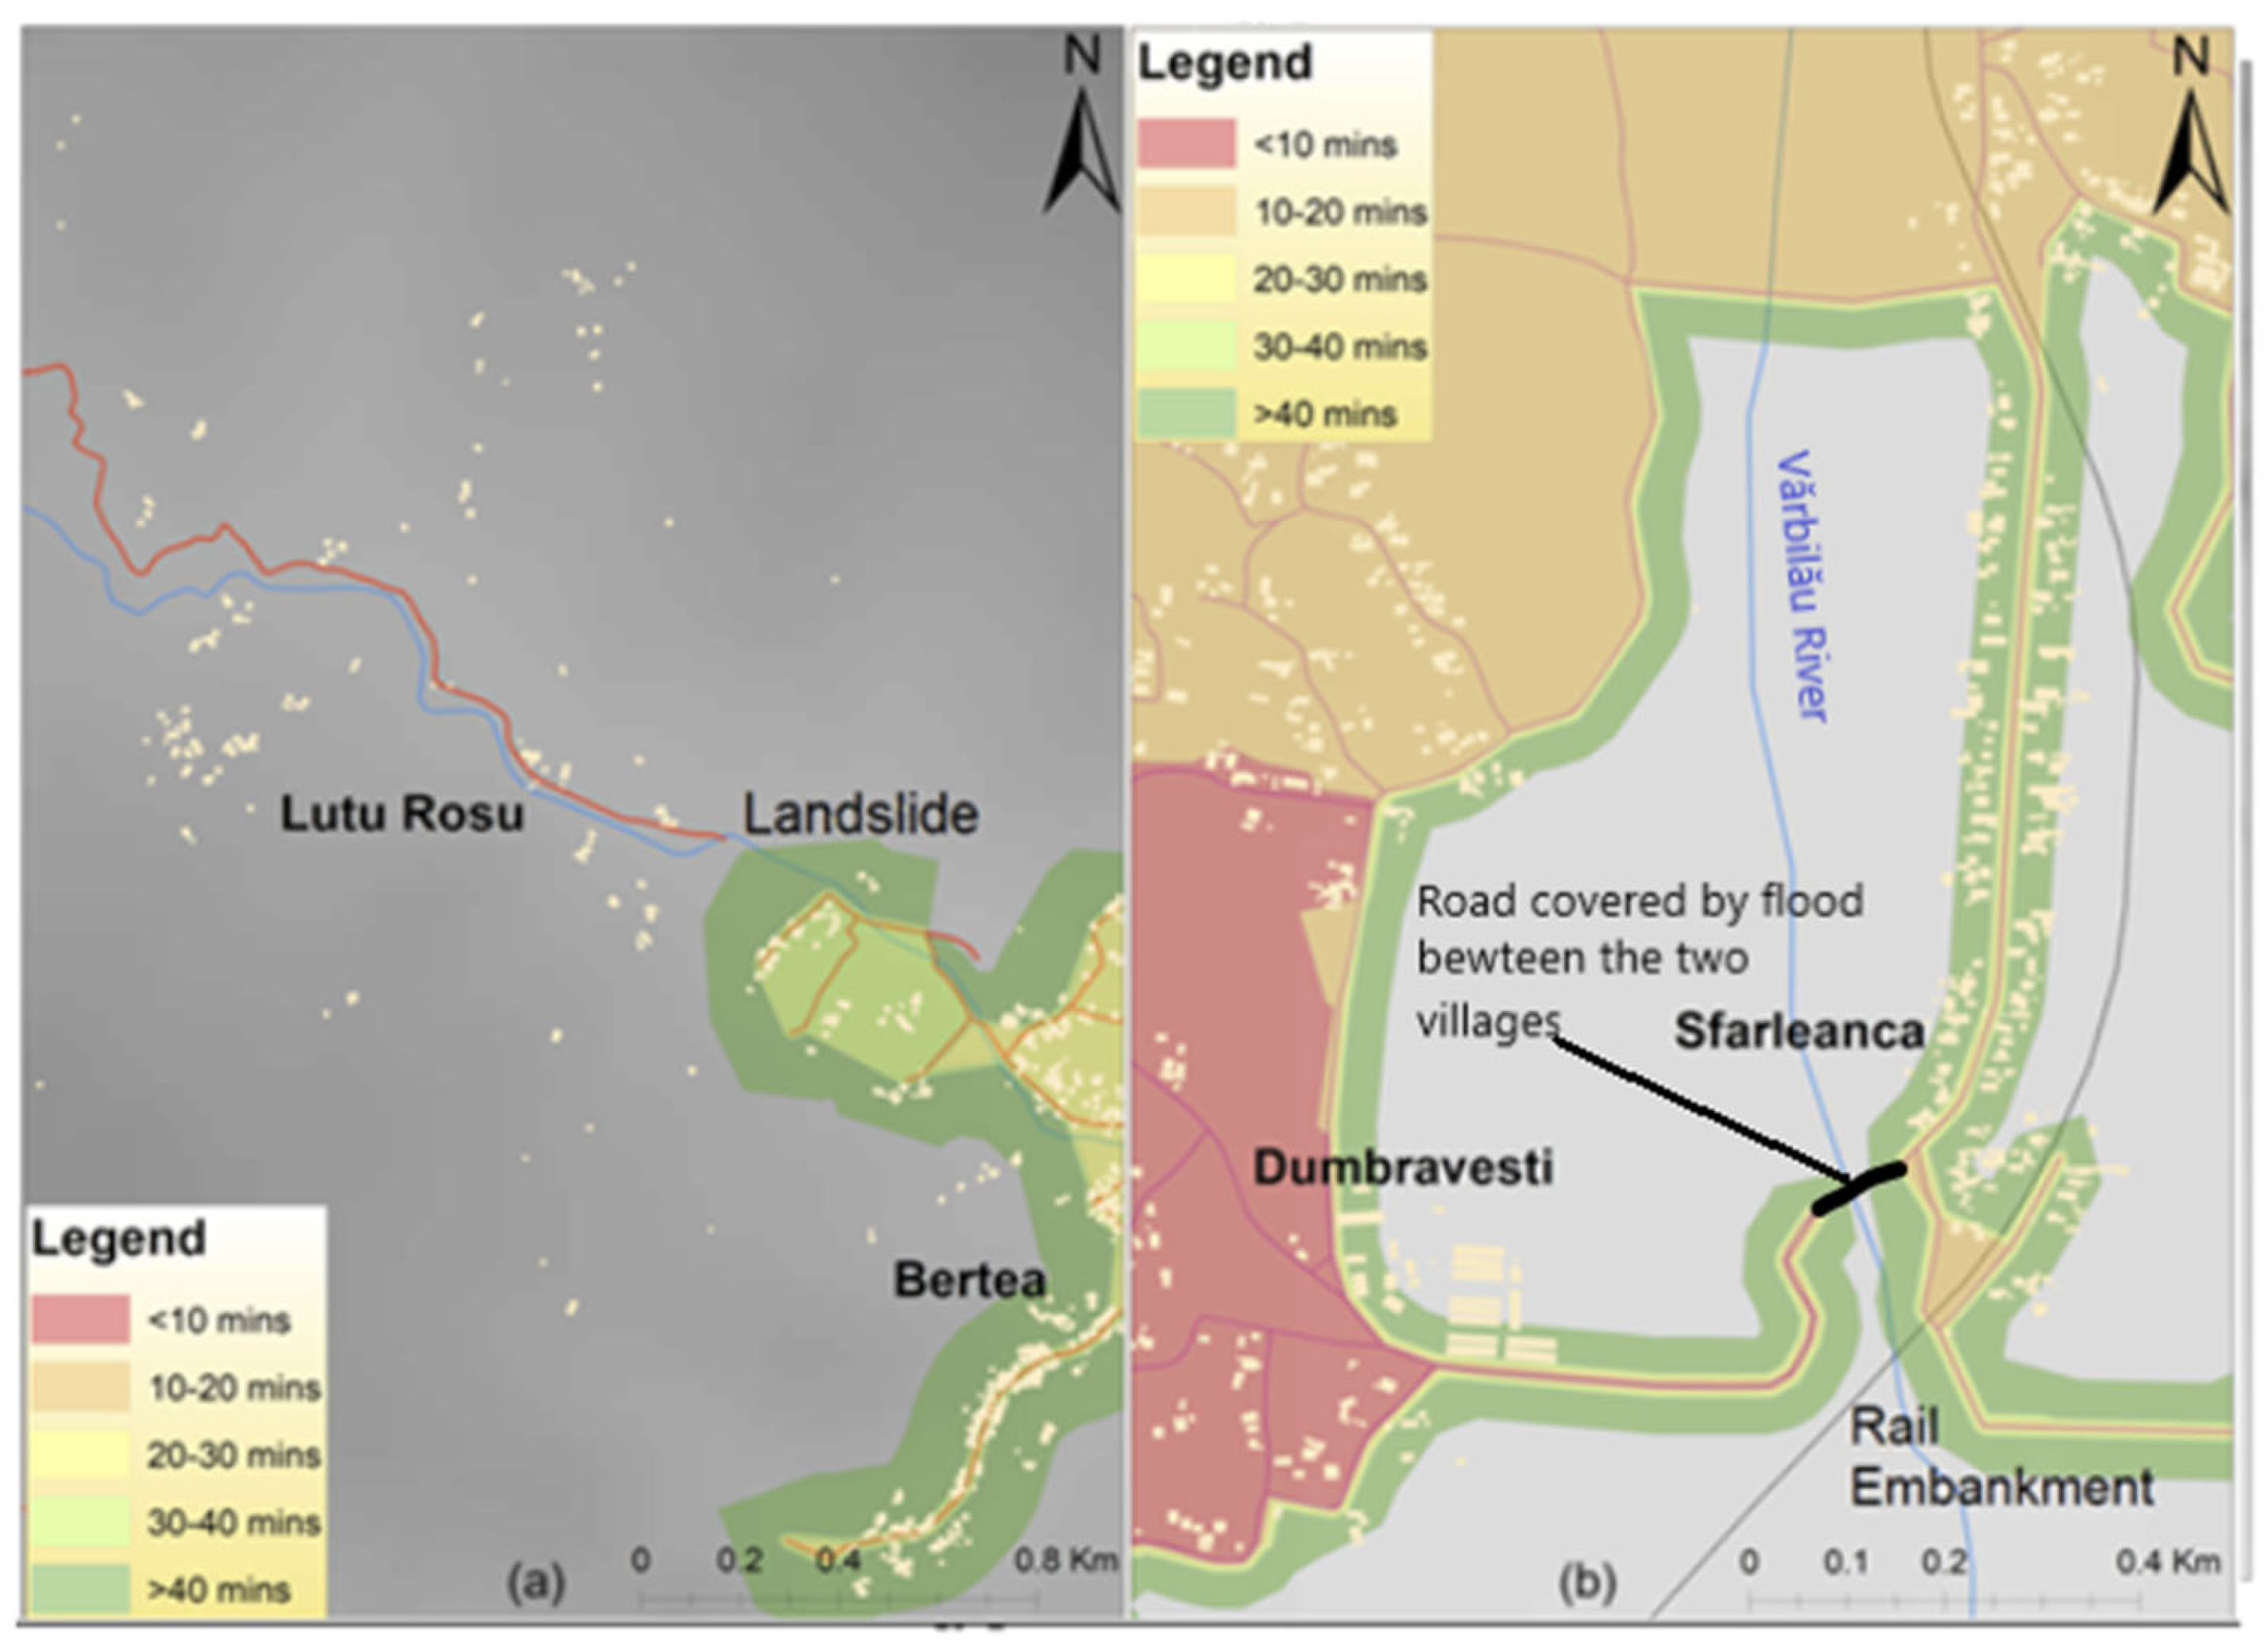
Two examples further illustrate the compounding effects of hydrologic hazards on accessibility within the Vărbilău catchment: Lutu Roșu and Sfârleanca. In Lutu Roșu, a landslide destroyed the only access road (DJ 101T), completely isolating the village. As shown in
Figure 10a, no alternative route connects its approximately 200 households with the neighbor village, Bertea, making emergency access impossible for ISU vehicles during such events.
Field observations confirmed that during heavy rainfall, even when the access road to Lutu Roșu remains technically passable, it often becomes muddy and unsafe, forcing authorities to close it temporarily. Although a modernized road now connects the village externally, the internal road network remains gravel-paved, offering poor accessibility under adverse weather conditions. This chronic isolation, compounded by weak infrastructure and limited economic opportunities, has contributed to gradual depopulation, with many residents relocating to urban areas.
In Sfârleanca, a different hazard—flooding—periodically cuts off road access between Dumbrăveşti and the village, particularly near a railway embankment (
Figure 10b). Under normal conditions, ISU crews from Ploieşti can reach Dumbrăveşti in less than 10 min and Sfârleanca within 10–20 min. However, when floodwater submerges the road, crews are forced to reroute northward, extending travel times to approximately 40 min. Flood modeling [
25] confirms that water accumulation near the railway embankment expands the floodplain, severely disrupting accessibility.
4.2. Flooding in Vărbilău
Another event that is briefly presented to support is the flooding that took place on July 2018 in the Vărbilău village (served either by Slănic ISU Center of Vălenii de Munte), when the recorded discharges were 98.6 m
3/s for the Slănic River and 199 m
3/s for the Vărbilău River before their confluence. Out of 28,398 m of roads, 2029 m (7.14%) were flooded, while 139 buildings (4.69%) out of 2963 were affected. The total flooded area was 0.75 km
2, with greater expansion downstream of the confluence. Simulations of this event and two other scenarios are presented in detail in [
34], indicating the following:
For a reduced flow (50 m3/s for the Slănic River and 100 m3/s for the Vărbilău River), the flood extent decreased slightly, affecting 5.61% of roads and 3.75% of buildings, with a total area of 0.62 km2.
For an increased flow (150 m3/s for the Slănic River and 300 m3/s for the Vărbilău River): Flooding impacted 2274 m of roads and 151 buildings, covering 0.81 km2.
4.3. Flooding in Aluniş (June 2021)
In June 2018 and June 2021, flash-flood events happened at the confluence between the Strâmba and Aluniș Rivers, affecting the Aluniș village. Simulation conducted for the last event, conducted for steady flow conditions, with the measured discharges of 50 m
3/s for Strâmba, 100 m
3/s for Aluniş before the confluence, and 150 m
3/s after the confluence, indicated that flooding affected a significant number of buildings due to the villages’ location along narrow valleys. The confluence area, relatively flat and exposed to flows from both north and west, shows the largest flood extent. In Strâmba, flooding exhibited flash-flood characteristics due to the steep slopes, isolating several houses as road sections became submerged. The Civic Center was the most affected, e.g., [
3]:
The school (830 m2), town hall (248 m2), and cultural hall (526 m2) completely flooded.
The church partially flooded, with ~220 m3 of water entering the building.
A total of 285 houses and annexes were inundated, with a combined flooded perimeter of nearly 20,000 m.
Flooded road length reached 3.5 km, leaving many houses completely isolated.
4.4. Comparison of Scenarios 1 and 2 and Linkage to Resilience Literature
The outcomes of Scenarios 1 and 2 (synthesized in
Table 4) can be seen within broader resilience theory, particularly through the framework of the 4Rs—robustness, redundancy, resourcefulness, and rapidity—proposed by Bruneau et al. [
35].
Robustness refers to the inherent strength of a system to withstand disruption without significant loss of function. In Scenario 1, the continued operation of the Vălenii de Munte center demonstrates robustness, as its higher equipment levels and strategic positioning buffer against the loss of Ploiești. Conversely, Scenario 2 reveals a fragile system, where reliance on only Slănic and Câmpina leads to substantial accessibility gaps in high-population areas such as Vărbilău and Dumbrăveşti.
Redundancy—the presence of substitutable components that provide backup during failure—is central to both scenarios. Scenario 1 illustrates how redundancy through Vălenii de Munte compensates for the absence of Ploiești, ensuring that emergency response remains viable across much of the catchment. In Scenario 2, the erosion of redundancy (loss of both Ploiești and Vălenii de Munte) leaves the system highly vulnerable, with response times exceeding 40 min in several zones.
Resourcefulness denotes the capacity to mobilize assets and reconfigure operations under constrained conditions.
In both scenarios, the relative importance of smaller units (Slănic, Câmpina) increases, showing how geographic proximity can partly offset lower institutional strength. This adaptive use of available centers exemplifies resourcefulness but also underscores its limitations when facilities lack sufficient capacity.
Rapidity concerns the speed with which service is restored, or response is delivered. The accessibility scoring demonstrates that rapidity is spatially uneven: while Slănic ensures responses under 10 min locally, other areas such as Bertea or Dumbrăveşti fall well outside acceptable thresholds (>40 min), highlighting inequities in resilience across the network. These findings align with the broader literature on resilience, which stresses that both network redundancy and robustness are critical in mitigating hazard impacts [
36,
37]. Redundancy ensures flexibility and fallback options when nodes fail, while robustness determines whether remaining components can sustain acceptable performance levels. The case study illustrates how strategic facility location, road connectivity, and institutional capacity interact to determine resilience outcomes. As Holling [
38] emphasized, resilient systems are those that can absorb shocks and reorganize without collapsing; in this case, Scenario 1 approximates such resilience, while Scenario 2 exposes systemic fragility.
4.5. Sensitivity Analysis
The comparison regarding road accessibility for intervention teams was also conducted to evaluate how travel speed influences accessibility. In GIS, speeds of 50–60 km/h were initially assigned to modernized roads (
Figure 11a). These values were then reduced to 30 km/h on the same roads to observe changes in served areas and to assess the overall impact of reduced travel speed on accessibility. For non-modernized and forest roads, travel speeds remained unchanged.
The speed of 50 km/h is the legal limit inside localities, but Romanian legislation permits an increase of up to 10 km/h in emergency situations. The limit of 30 km/h was selected based on the travel speeds experienced during flooding periods in the region.
After recalculating accessibility using the same raster-based method applied in the initial analysis, the new spatial distribution revealed notable differences. Specifically, well-served areas decreased in size (
Figure 11b), while less-served areas expanded. From this point, the discussion will focus on the results obtained with the reduced travel speed (30 km/h), since the baseline situation was already presented.
At a travel speed of 30 km/h, the area with accessibility index 5 (very good accessibility) is reduced to approximately half of the original extent (
Figure 11b). Under these conditions, only the villages of Dumbrăvești and Sfârleanca remain very well served by ISU teams. This is due to the high density of modernized roads and the proximity of three ISU centers (Vălenii de Munte, Ploieşti 1, and Ploieşti 2). The area with accessibility index 4 (well-served) also decreases compared to the initial situation. It now largely overlaps with the northern half of the previous best-served area, covering the north of Dumbrăvești and the south of Vărbilău commune.
A small well-served area is also visible near the access road from Vălenii de Munte. Under these conditions, interventions in index 4 areas would most likely be carried out from Vălenii de Munte.
The area with accessibility index 3 (moderate accessibility) is significantly smaller than in the initial analysis. Notably, the center of Vărbilău commune has declined from index 3 to index 1 (very poorly served). Remaining index 3 areas are found only in Slănic, Aluniş, and the southern part of Vărbilău, where interventions would likely be covered by the ISU centers in Vălenii de Munte, Slănic, and Câmpina. This reduction is mainly explained by greater distances from intervention points, the limited number of ISU centers in the north and center, and the poorer quality of the road network.
Areas with index 2 surround those with index 3, particularly around Aluniş and Slănic, as well as a smaller section of Vărbilău commune. However, their extent is also smaller compared to the initial situation, when index 2 covered the largest area.
In contrast, the area with accessibility index 1 (very poorly served) increases substantially in the 30 km/h scenario. These poorly served zones now dominate much of the north and center, including Ştefeşti, Vărbilău, Ostrovu, and Bertea. This is explained by the low travel speed, poor road quality, low road density, and the long distances from ISU centers.
As seen above, an important consideration in an analysis such as ours concerns the choice of weights assigned to road types, travel speeds, and facility importance. While the weighting scheme was informed by field observations, it inevitably involves a degree of subjectivity. Different weighting assumptions can shift the spatial pattern of accessibility scores, with direct implications for where ISU teams are expected to intervene first during emergencies. For instance, assigning greater weight to main roads emphasizes connectivity along the southern corridor, while increasing the influence of secondary and tertiary routes may highlight vulnerabilities in northern communes. This sensitivity suggests that emergency planning must recognize weighting as not only a technical decision but also a strategic one, since it determines priority zones for infrastructure investment, resource allocation, and mobilization protocols. To address this limitation, future research could conduct sensitivity analyses or apply multi-criteria decision-making (MCDM) approaches to test how different weighting schemes alter accessibility outcomes. Such efforts would enhance the robustness of planning tools and provide ISU teams with more flexible guidance under varying hazard conditions.

