Article

Historical Evolution and Future Trends of Riverbed Dynamics Under Anthropogenic Impact and Climatic Change: A Case Study of the Ialomița River (Romania)

1
Faculty of Geography, University of Bucharest, 1 Nicolae Bălcescu Boulevard, 010041 Bucharest, Romania
2
National Institute of Hydrology and Water Management, 97E București-Ploiești Road, 013686 Bucharest, Romania
*
Author to whom correspondence should be addressed.
Water 2025, 17(14), 2151; https://doi.org/10.3390/w17142151
Submission received: 5 June 2025 / Revised: 16 July 2025 / Accepted: 17 July 2025 / Published: 19 July 2025
(This article belongs to the Special Issue Climate Change and Hydrological Processes, 2nd Edition)

Abstract

Riverbed dynamics are natural processes that are strongly driven by human and climatic factors. In the last two centuries, the anthropogenic influence and impact of climate change on European rivers has resulted in significant degradation of riverbeds. This research paper aims to determine the historical evolution (1856–2021) and future trends of the Ialomița riverbed (Romania) under the influence of anthropogenic impact and climate change. The case study is a reach of 66 km between the confluences with the Ialomicioara and Pâscov rivers. The localisation in a contact zone between the Curvature Subcarpathians and the Târgoviște Plain, the active recent tectonic uplift of the area, and the intense anthropogenic intervention gives to this river reach favourable conditions for pronounced riverbed dynamics over time. To achieve the aim of the study, we developed a complex methodology which involves the use of Geographical Information System (GIS) techniques, hierarchical cluster analysis (HCA), the Mann–Kendall test (MK), and R programming. The results indicate that the evolution of the Ialomița River aligns with the general trends observed across Europe and within Romania, characterised by a reduction in riverbed geomorphological complexity and a general transition from a braided, multi-thread into a sinuous, single-thread fluvial style. The main processes consist of channel narrowing and incision alternating with intense meandering. However, specific temporal and spatial evolution patterns were identified, mainly influenced by the increasingly anthropogenic local influences and confirmed climate changes in the study area since the second half of the 20th century. Future evolutionary trends suggest that, in the absence of river restoration interventions, the Ialomița riverbed is expected to continue degrading on a short-term horizon, following both climatic and anthropogenic signals. The findings of this study may contribute to a better understanding of recent river behaviours and serve as a valuable tool for the management of the Ialomița River.

1. Introduction

Riverbed dynamics are natural processes that are highly influenced by climatic and anthropogenic factors [1,2]. In this context, climate change and direct human interventions within the fluvial system could cause major imbalances in the natural dynamic geomorphological behaviour of the river.
Currently, climate change is a fact, driven by anthropogenic influence through greenhouse emissions, already influencing weather and climate extremes all over the world [3]. As an effect of anthropogenic climate change, the streamflow indicates alteration on a local and regional scale across various parts of the world. However, on a global scale, no consistent trends are observed [4]. Regarding Europe, the analysis of the river discharges between 1950 and 2010 shows various trends within the streamflow of decreasing in the southern part, mixed in the central part, and increasing in the northern part [5].
The study of river channel dynamics over the last two centuries (100–150 years) is considered a fundamental tool from a river management perspective which can provide essential information to understand past and present dynamics and, more importantly, to identify possible future evolutionary trends [6,7].
Throughout the last two decades, many studies have used cartographic materials such as topographic maps and remote sensing products to reconstruct river behaviour over time, assessing qualitative and quantitative morphological changes in riverbeds worldwide [8,9,10,11,12,13,14,15,16,17].
In Europe, studies have investigated the geomorphic behaviour of the rivers over the last two centuries in response to natural and anthropogenic factors among the majority of European countries: Italy [2,7,18,19,20,21,22,23,24,25,26,27,28,29], Ukraine [30], Spain [31,32,33,34], Poland [19,35,36,37,38], Scotland [39], Slovenia [40], Slovakia [41], France [6,42,43,44], Germany [45,46], Russia [47], Albania [48], Croatia [49], Hungary [50,51,52,53,54], Czech Republic [55], and Austria [56]. Among the European rivers, there is observed a degradation trend of riverbeds, mainly highlighted by narrowing and incision processes, as a result of both human intervention and climate change.
Authors of most studies of this type consider that river channel evolution in the last up to 250 years is a consequence of the climate changes that occurred after the Little Ice Age (LIA), specifically a global warming, associated with anthropogenic impact [57].
In Romania, the fluvial processes align with the evolutionary trend observed for European rivers [57], but with a delay in the channel response to long-term anthropogenic influence [58]. In terms of vertical dynamics, represented by the changes in elevation, the riverbed dynamics were analysed at the geologic scale, focusing on the longitudinal evolution of the rivers [59], or on a contemporary scale [57,60,61,62,63,64], over the past century. Regarding riverbed planform dynamics, the studies made on Romanian rivers consist of diachronic analysis based on historical cartographic data and remote sensing over approximately 150 years [57,63,65,66,67,68,69,70,71,72,73,74,75,76,77,78,79].
Regardless of the geographical location, the majority of studies take into account increasingly accentuated anthropogenic intervention along with the effects of the climate regime and climate change on riverbed dynamics. Channel narrowing and incision primarily highlight a categorical trend of riverbed complexity reduction.
We select for analysis the Ialomița River reach between the confluences with the Ialomicioara and Pâscov rivers (66 km) because we consider it to have favourable conditions for an accentuated riverbed dynamic, such as the location at the contact between the lower Subcarpathians and the high plain units, active recent tectonic uplift of the area, a sedimentary lithology within the watershed, and a high degree of anthropisation. Furthermore, the Prahova River, a tributary of the Ialomița which evolved in similar geographic conditions, presents intense riverbed dynamics over time and a general trend of degradation, a fact highlighted by several studies [66,69,75,76]. Based on this reasoning, we consider that the studied river reach may present the same evolution pattern and trends.
The selection of the 166-year period of analysis was motivated and conditioned by the early cartographic sources required, the first qualitative map of the study area being realised starting with the second half of the 19th century.
The aim of the study is to determine the historical evolution (1856–2021) and future trends of the Ialomița riverbed under the influence of anthropogenic impact and climate change. The specific objectives are to (a) collect and integrate the historical cartographical sources into the GIS environment; (b) define a uniform, standardised, and semi-automated method for river planform measurements; (c) assess the historical geomorphic planform riverbed evolution between 1856 and 2021; (d) perform hierarchical cluster analysis (HCA) to identify spatial patterns in riverbed dynamics; (e) identify trends in time series of hydrological and climatic parameters using the Mann–Kendall (MK) test; and (f) assess the anthropogenic influence on the riverbed dynamics.

2. Study Area

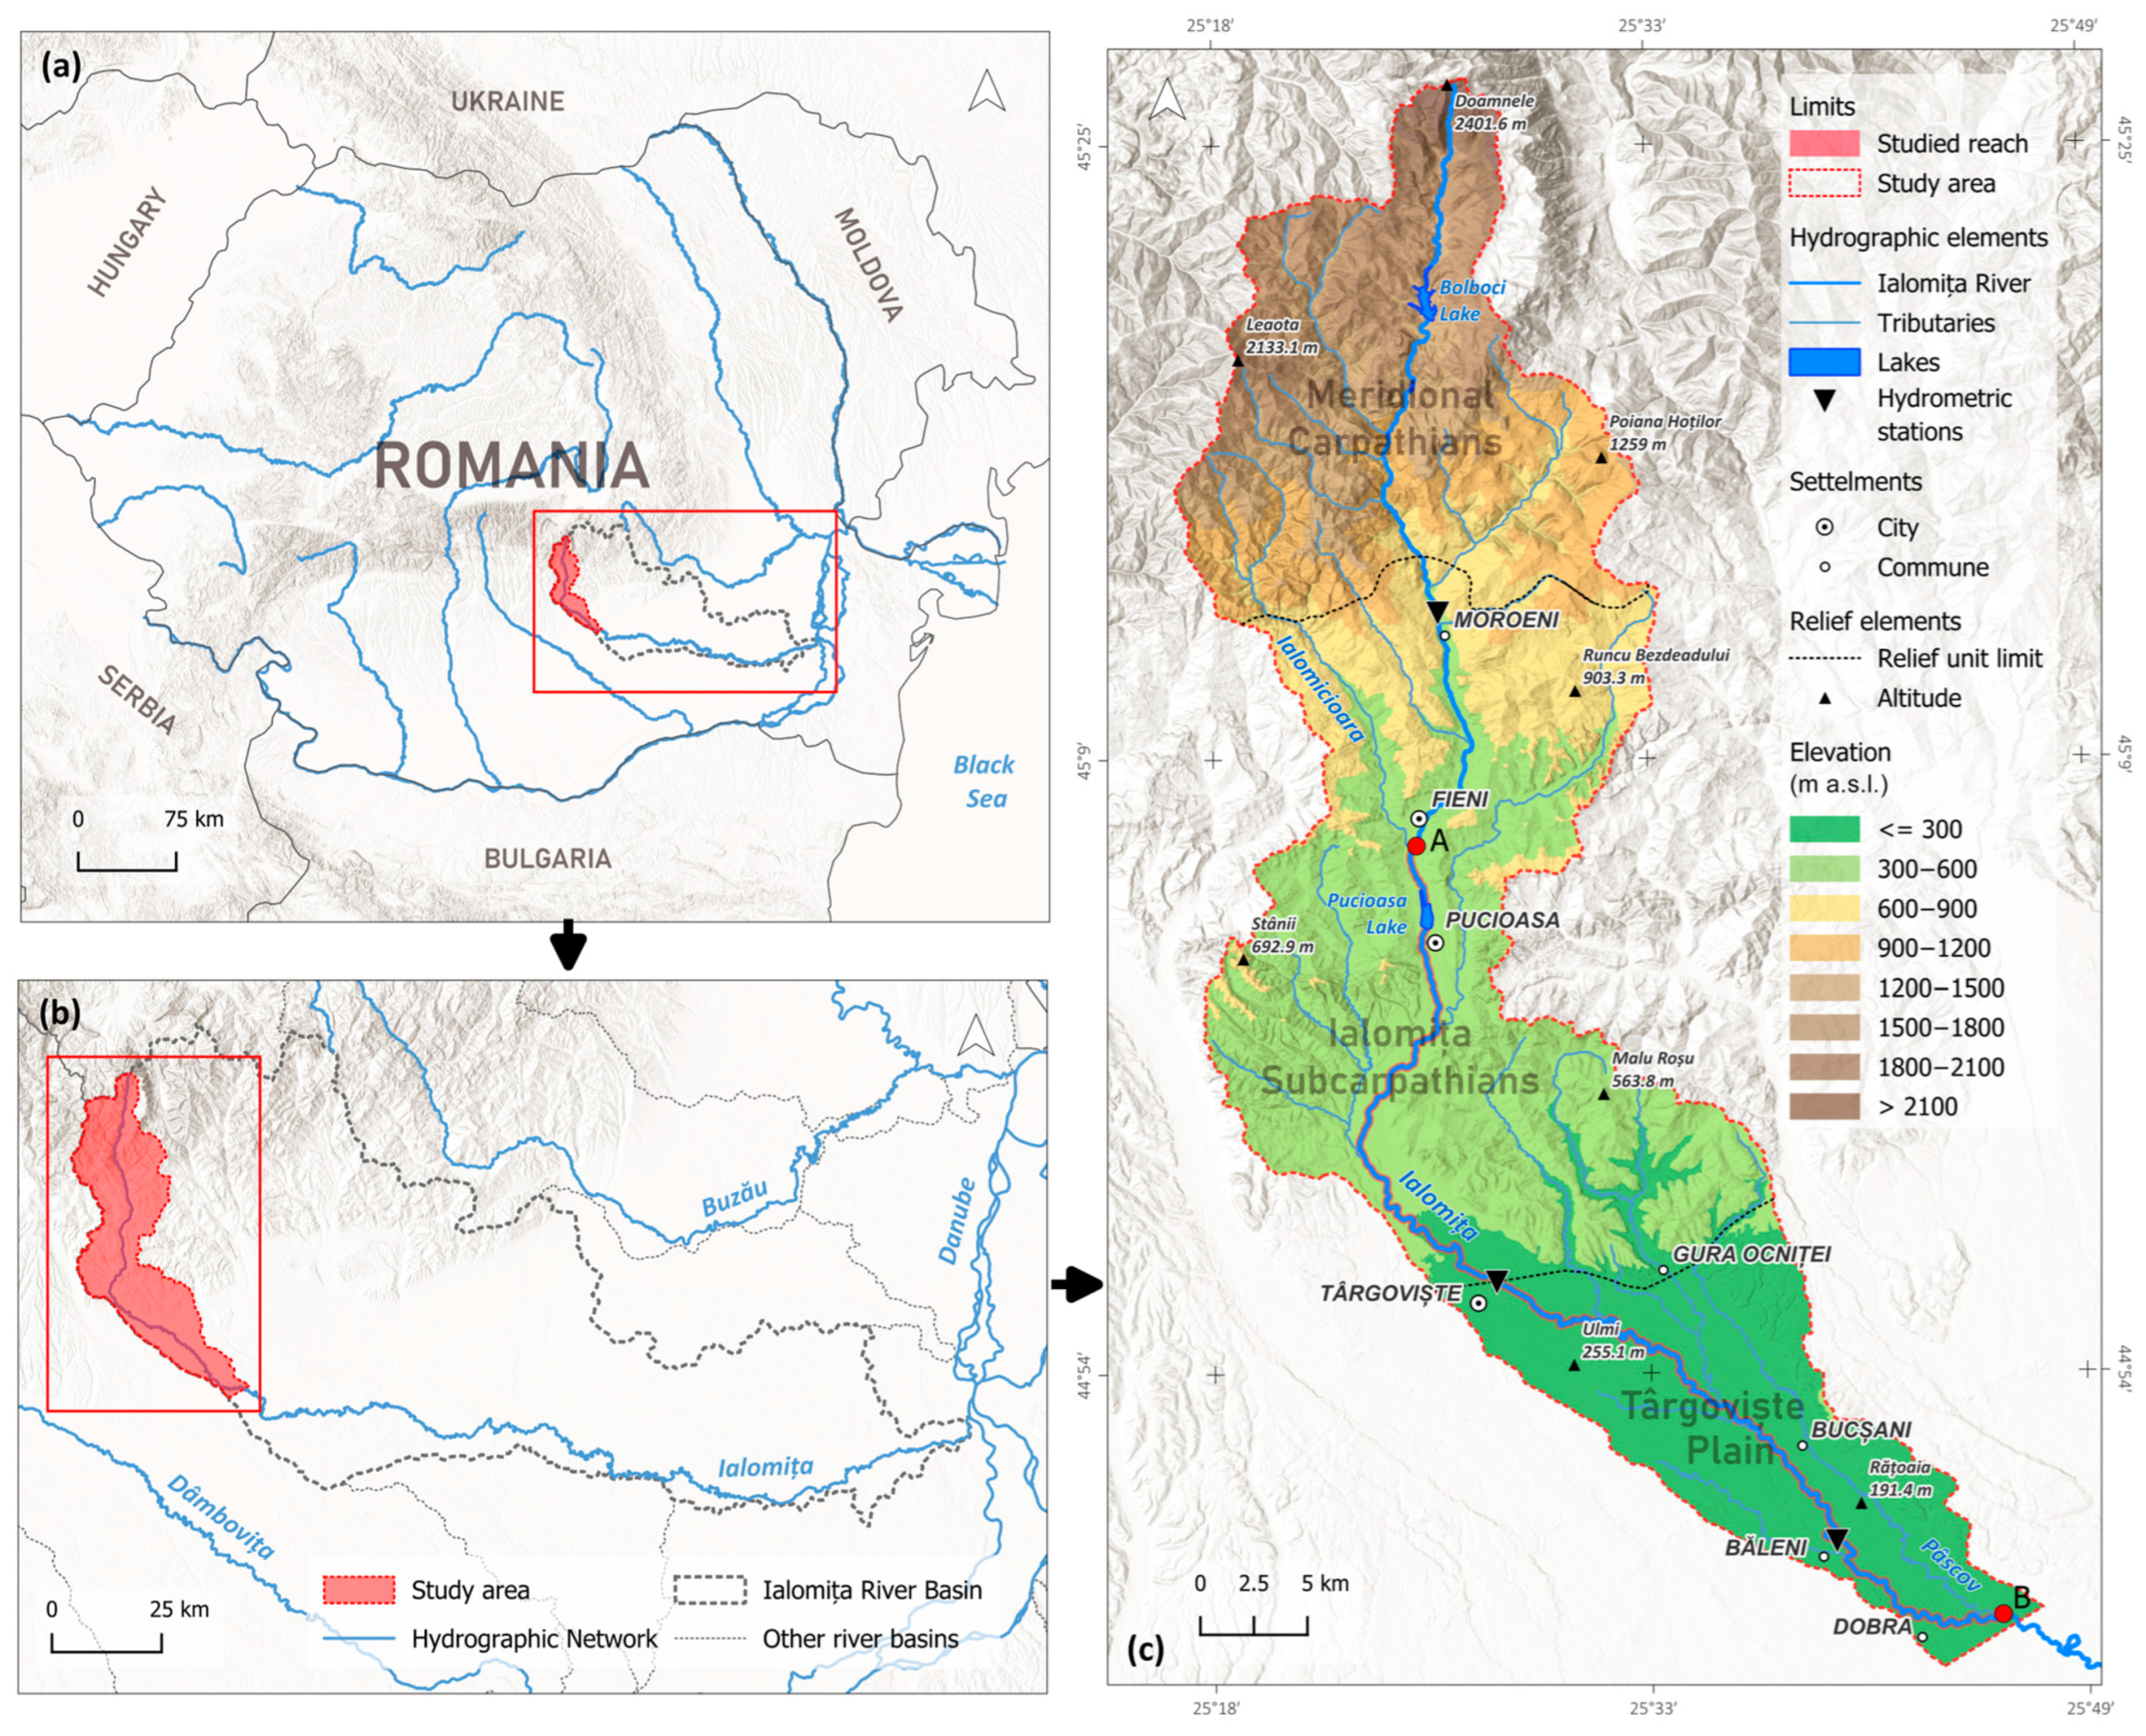
2.1. General Setting

The study area covers the upper part of the Ialomița river basin, upstream of the confluence with the Pâscov river, situated in the central-eastern part of Romania (Figure 1a,b).
It has a surface of 1045 km2 representing around 10% of the entire catchment area of 10,350 km2 [80]. Within the study area, the investigated river reach crosses the southern part of the catchment, between the confluences with the rivers Ialomicioara at the north (25°25′ E, 45°07′ N) and Pâscov at the south (25°45′ E 44°47′ N) (Figure 1c).
The Ialomița River is one of the southern Romanian Carpathian rivers, gathering its springs in the Bucegi Mountains from a maximum altitude of 2406 m a.s.l. under the name of the Obârșiei Valley. Downstream, the main course of the Ialomița river is formed by the convergence with two other valleys, Șugările and Doamnele. The length of the river is 417 km, with a watershed area of 10,350 km2 [80], an altitude difference of 2272 m, a sinuosity coefficient of 1.98, and an average slope of 5.35‰. Regarding the analysed river sector, it has a length of 66.3 km (in 2021), a sinuosity coefficient of 1.48, and a level difference of only 272 m, a value due to the sector development in approximately equal proportions in the Subcarpathian and the plain areas. The average slope is 4.12‰.
According to palaeographic evolution of the area, the current course of the Ialomița River took shape in the last 2.5 million years under the action of Wallachian orogenic movements, along with the other rivers in the Subcarpathian bend area located south of the Trotuș Fault. Until the Upper Pliocene, the major morphological changes in the relief, interruption, elevation, or subsidence would not have allowed the finalisation of the Ialomița Valley [57].
The geotectonic structure presents high complexity through the localisation at the contact between the large morpho-structural units of the territory of Romania, the Carpathian Orogen, and the Moesic Platform. The area is divided into different parts: the Infrabucovinic Nappe and the Ceahlău Nappe in the mountains; the Curbicortical Flysch Nappe, the Macla Nappe, the Tarcău Nappe, and the Subcarpathian Nappe in the hills; and the Carpathian Avantfosse in the lower hills and especially in the plains [81,82]. The positioning of the upper river sector within the Curvature Subcarpathians implies more intense riverbed dynamics due to the specific tectonic uplift of the area and the sedimentary lithology, which lead to high sediment loading of the water [76].
The study area covers all the major relief steps, starting with the Bucegi and Leaota Mountains in the north, the hilly Ialomița Subcarpathians area in the centre, and the Târgoviște and Cricov Plains in the south. The altitude range is between 157 m a.s.l., located near the confluence zone with the Pâscov River, and 2406 m a.s.l. at the Mecetul Turcesc Peak. Regarding the studied river reach, it crosses only the Subcarpathian and Plain units between the altitudes of 157 and 432 m a.s.l.
The climate is temperate–continental of transitional type [83], mainly determined by the Mediterranean influences [84]. Among the climatic parameters, the mean precipitation and temperature (1950–2022) over the study area are 745.3 mm and 9.01 °C, respectively. However, these vary significantly depending on altitude because of the relief amplitude of over 2200 m.
From a hydrological point of view, the flow regime of the Ialomița river observed at the hydrometric stations within the study area (Figure 1c) is characterised by mean multiannual discharges of 4.25 m3/s at Moroeni (1961–2022), 7.61 m3/s at Târgoviște (1976–2022) and 8.37 m3/s at Băleni (1961–2022). These discharges fluctuate between a minimum and maximum of 0.88 m3/s (2011) and 9.26 m3/s (2005) at Moroeni, 3.11 m3/s (1992) and 16.59 m3/s (2005) at Târgoviște, and 1.92 m3/s and 18.27 m3/s at Băleni.
Regarding seasonal variability, the Ialomița River is highly influenced by climatic factors and is characterised by a pluvio-nival flow regime with distinct seasonal characteristics. The mean monthly values indicate the highest discharges in Spring, determined by snowmelt combined with precipitation, and in Summer, mainly influenced by convective rainfall. Peak mean monthly discharges are observed in May and June of 8.08 m3/s and 6.18 m3/s at Moroeni, 15.51 m3/s and 12.03 m3/s at Târgoviște, and 15.52 m3/s and 12.85 m3/s at Băleni. The discharges gradually decrease in Autumn and Winter to minimum values of 1.90 m3/s in January at Moroeni, 4.52 m3/s in October at Târgoviște, and 5.01 m3/s in January at Băleni.
The mean annual suspended-sediment discharge is 7.08 kg/s (1976–2022) at Târgoviște and 15.17 kg/s (1961–2022) at Băleni. The seasonal variability is correlated with the flow regime, with the highest mean values in Spring–Summer in May and June of 12.57 kg/s and 15.56 kg/s at Târgoviște and 33.95 kg/s and 28.14 kg/s at Băleni. The sediment supply decreases towards Autumn and Winter, with minimum values of 1.94 kg/s in October at Târgoviște and 5.50 kg/s in January at Băleni.

2.2. River Management and Anthropogenic Intervention

The first river management activities in the study area started between 1928 and 1930 with the construction of the Scropoasa–Dobrești hydrotechnical complex in the upper sector of the watershed. Major hydrotechnical projects continued until 1988, resulting in a total of eight dam reservoirs, of which four were placed on the main course of the Ialomița River [85]. Among these, Lake Pucioasa is the only one located on the river reach (Figure 1c). A brief technical characterisation of the dams and associated reservoirs is presented in Table 1 [80,86].
In addition to dams, the main channelisation structures on the Ialomița River include levees, embankments, and gabions to control lateral erosion along with grade control structures to manage vertical erosion.
Most of these structures were built at the same time as the construction of the Pucioasa Reservoir in 1975, which raised the local erosion level on average by 15 m. This caused intense sedimentation in the sector upstream of the dam, which is in dynamic equilibrium, and downward erosion downstream to the contact with the plain area (at Târgoviște), where were built successive simple and cascade weirs [87].
Gravel mining in Romania was at its peak during the communist period, especially in the period 1970–1989, when large-scale construction projects were in progress [62]. In recent times, although mining activity is permitted and regulated under specific conditions, some companies and individuals extract gravel illegally, as Armaș [76] mentions for the Prahova River.
The development of settlements adjacent to the river influences the dynamics of the riverbed. The greatest pressure is exerted by the urban centres of Fieni, Pucioasa, and Târgoviște, located in the Subcarpathian area (Figure 1c). The expansion of anthropogenic space along the river leads to the narrowing of the riverbed’s freedom space. Additionally, water withdrawals for economic activities and for supplying the population have contributed to a reduction in river flow.
A particular case of economic activity’s influence on riverbed dynamics is the thermal power station from Doicești, functional between the 1950s and the 2010s. During this period of time, ash deposits resulting from the burning of fuels for electricity production were formed in the floodplain zone, restricting the lateral dynamics of the riverbed.

3. Materials and Methods

We approached a complex methodology, the entire workflow following the steps depicted in the flowchart of the study (Figure 2).
Data collection was the first step, gathering cartographic, climatic, hydrologic, anthropogenic, and field survey observation data. The integration and processing in the GIS environment were carried out using QGIS software version 3.22, some work steps being semi-automated in Model Designer. We processed and analysed the data to create graphic materials using Microsoft Excel and R version 4.2.2. Statistical analysis was also performed using R. At the end of the workflow chart, all the analysis results converge in order to assess the Ialomița riverbed’s historical evolution (1856–2021) and future trends.

3.1. Data Collection

3.1.1. Cartographic Data Description

For the study, six cartographic materials were collected, four of them representing the most qualitative historical topographic maps available for the territory of Romania and the other two orthorectified aerial photographs. These materials were published between 1856 and 2021, covering a time period of 166 years. An overview of cartographic data sources, including the names of the maps, the publishers and publishing periods, scale, projection, and land survey periods can be observed in Table S1.
Wallachia—The second military survey of the Habsburg Empire can be considered the first qualitative topographic map of the former Wallachia, the southern region of present-day Romania. The map gives valuable and detailed information of the study area in the middle of the 19th century, taking into account the relative map sheet high scale of 1:57,600. Its quality is considered satisfactory, as the topographic survey was conducted using a triangulation network consisting of 468 points. The error between the original and the current measurements is estimated to be less than 20 m [88,89].
The “Plan Director de Tragere”, translated as Firing Master Plan, represents the first topographic map of the entire territory of Romania, in Lambert projection, drawn up as a result of the military needs arising from the outbreak of the First World War [90]. A total of 2118 maps were made [91] at a scale of 1:20,000, reprinted between 1954 and 1959 without significant changes such as updating the names of settlements or redrawing with actualised conventional symbols [90].
Starting in the second half of the 20th century, The Romanian Military Topographic Directorate created a new set of topographic maps realised in the transverse cylindrical projection Gauss–Krüger at scale 1:25,000. There are 1818 map sheets with dimensions of 5′ latitude and 7′30″ longitude, published in 2 editions [92]. The first edition used land surveys between 1954 and 1955 and was printed between 1958 and 1961 [93]. After more than 20 years, the second edition of the topographic maps was produced, the data collection being made from aerial images and topographical surveys carried out from 1974 to 1978. The map sheets were edited between 1974 and 1986 and printed between 1975 and 1987 [92].
Map sheets of the topographical maps described above used in the study and their sources are presented in Table 2.
The most recent cartographic data used in the study are the orthophoto maps from 2005 and 2021, at 50 cm spatial resolution and ±1.5 m precision [96]. Unlike the other sources, the orthophoto plans are natively generated in digital format and are projected in the Romanian national coordinate reference system, Stereo 70 (EPSG:3844). These were provided by the Faculty of Geography, University of Bucharest.

3.1.2. Climatic and Hydrological Data

Regarding the climatic data, we set out to analyse climate parameters of precipitation and temperature at daily time steps, yearly averaged over the study area between 1950 and 2022.
To cover the entire time interval, we selected and combined 3 open-access climatic databases: European Climate Assessment and Dataset (ECAD) [97], Romanian Daily Gridded Climatic Dataset (ROCADA) [98], and European Meteorological Observations (EMO-1) [99]. Although the ECAD data cover the whole period, the other datasets were selected for the interval 1961–2022, because they are more reliable, several gauging stations being used for the interpolation. Table 3 provides details about these datasets.
From a hydrological point of view, we collected information from the hydrometric station Băleni, located in the southern part of the study area (Figure 1c), about 10 km upstream from the end of the studied river sector. The data span the period from 1961 to 2022 and consist of river discharge (Q) and suspended load discharge (R), aggregated at a yearly scale, and the most significant floods. The National Institute of Hydrology and Water Management provided these data.

3.1.3. Anthropogenic Elements and Field Survey

Regarding the human factor in the riverbed dynamics, we documented and inventoried the anthropogenic interventions within the Ialomița River in the study area, which include dams, embankments, low-head dams/sills, and gravel pits. This was performed mainly based on the interpretation of cartographic materials and aerial orthorectified imagery used in the study (Table S1) and of satellite imagery obtained from Google Earth Pro.
To validate the results of the study, a field campaign was carried out in September 2024 along the studied river reach. We focused mainly on the locations of bridges, which are the most accessible, and some areas where we noticed radical changes in the riverbed.

3.2. GIS Processing and Integration

3.2.1. Georeferencing

Except for the orthorectified aerial photographs, georeferencing is necessary for the other cartographic materials, bringing them all into a unitary coordinate system. Elements such as the age and the quality of the topographic survey and the map drawing and the projection system of the historical sources require the use of different georeferencing methods depending on the characteristics of each map. It is essential to choose the optimal method for this process, minimising errors and obtaining results as close as possible to the reality in the field.
Thus, we processed Wallachia—Second military survey of the Habsburg Empire and “Plan Director de Tragere” using the raster-to-raster georeferencing type [100]. Taking into account the age and the general poor quality and accuracy of the maps, we selected the Thin Plate Spline (TPS) transformation algorithm, the most appropriate for this type of map [101,102]. Considering that TPS optimises local accuracy despite global accuracy [102], we focused on placing as many control points as possible near the river in order to maintain the accuracy in the riverbed area. We used churches and main road intersections, common elements found in the 2021 orthophoto plan, as control ground points (CGPs).
For both editions of the Military Topographic Maps, which have a generally good quality and a quite accurate coordinate system, a different approach was utilised. The georeferencing was performed using coordinates at the intersections of the map grid in the Gauss–Krüger projection, zone 5 (EPSG:28405), later reprojected in Stereo 70. We choose the projective transformation algorithm, considered particularly useful for scanned maps [102].
All the maps were brought in the Romanian national coordinate reference system—Stereo 70 (EPSG:3844) using the QGIS Georeferencing Plugin. Table 4 shows that the total number of CGPs used varies for each map.
A manual georeferencing validation was performed by overlaying the georeferenced maps on recent orthophotos. Thus, we visually assessed the accuracy and correctness of the georeferencing by comparing stable planimetric elements over time, such as roads and railway intersections, bridges, buildings (especially churches), lakes, and land parcel boundaries. Altimetric features such as river terraces were also compared with a Digital Elevation Model (DEM). If the georeferencing was not satisfactory, we reviewed the placement of the CGPs in areas with significant errors.

3.2.2. Riverbed Planform Mapping

Riverbed configuration planforms were extracted from all six cartographic sources (Table S1) using QGIS 3.22 version. In order to calculate the parameters from the next work stage, the following initial elements were digitised:
  • The riverbed channel planform (polygon) or wetted channel [6,103], which represents the space covered by the river’s water, including secondary channels.
  • The thalweg of the river (line) or central axis of the main channel [6], digitised as the approximative centreline of the main channel. In the case of orthophotos, this can vary. The imagery clearly distinguishes between shallow and deep water, indicating that the thalweg corresponds to the deeper portion of the channel.
  • The active channel (polygon) [7,21], riverbed [22], fluvial area [6], or active belt/band [104] representing the area including the riverbed channel and the sedimentation zones near the channel, including bare and less vegetated bars. It may correspond with the bankfull stage of the channel, sometimes named the low floodplain.
The digitisation process was manually performed by a single operator at a constant scale in order to maintain a high level of accuracy [7,105].

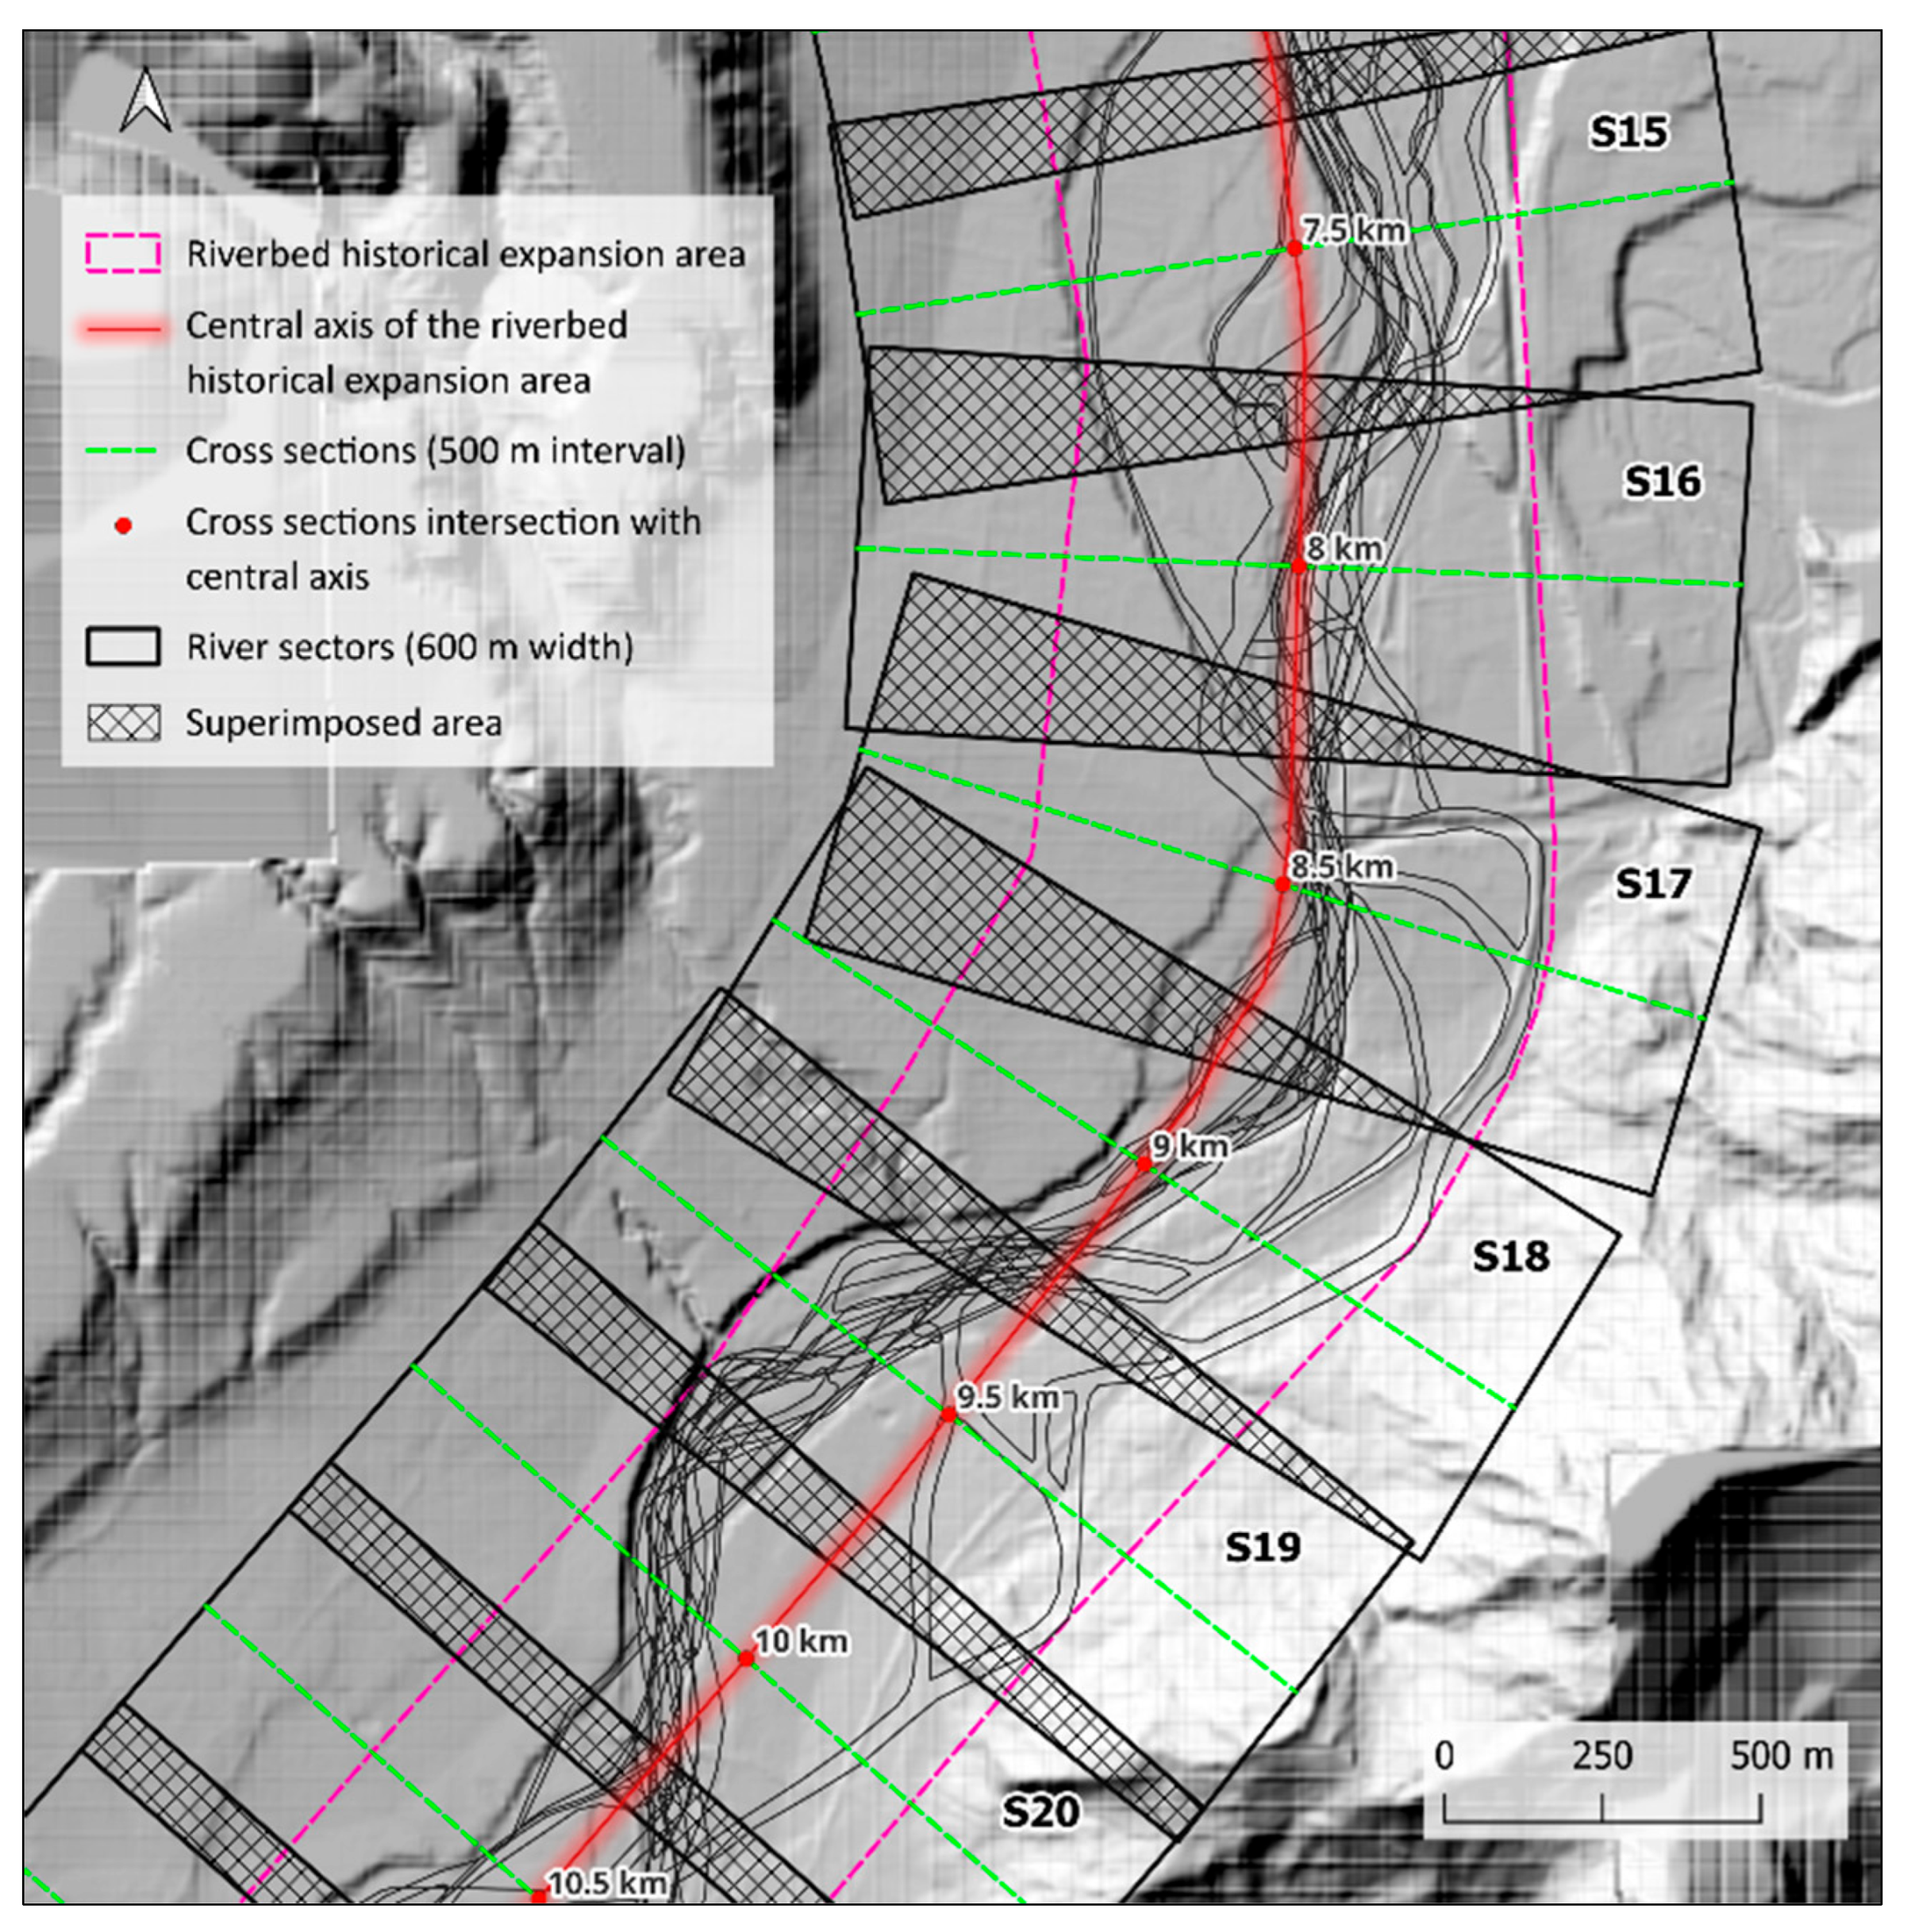
3.2.3. Riverbed Segmentation

Riverbed segmentation is necessary to carry out a unitary and systematic analysis. To do this, we aggregated the channel planform from all six periods, resulting in a historical expansion area of the riverbed between 1856 and 2021. Based on this, there was delineated a polygon which follows the generalised extent and direction of the riverbed in time (Figure 3). Using the v.voronoi.skeleton QGIS tool, a central axis was automatically computed and then smoothed to avoid sudden changes in river flow direction. Thus, it resulted in a centreline of the historical extent of the riverbed over a length of 54 km.
The riverbed segmentation was performed by generating perpendicular lines at 500 m along the historical centreline, resulting in a total of 109 transects, including the beginning and end of the studied reach. These were used for the calculation of the widths and number of channels. For the calculation of areas and sinuosity, polygon sectors were generated having in the centre the transects, with a width of the same 500 m and resulting in the same number of transects (109).
To avoid excluding from the analysis parts of the riverbed where the river changes direction significantly, the polygons were expanded by 50 m on both sides, resulting in a new width of 600 m instead of the initial value of 500, to encompass the entire historical expansion area within the sectors. This approach leads to the overlapping of polygons (Figure 3), but they remain perpendicular to the historical centreline, preserve the same areas [6], and provide full coverage.
Both segmentation elements, the transects (T) and the sector polygons (S), were used as distinct methods (Table 5) to calculate geomorphometric parameters and indices in the next step.

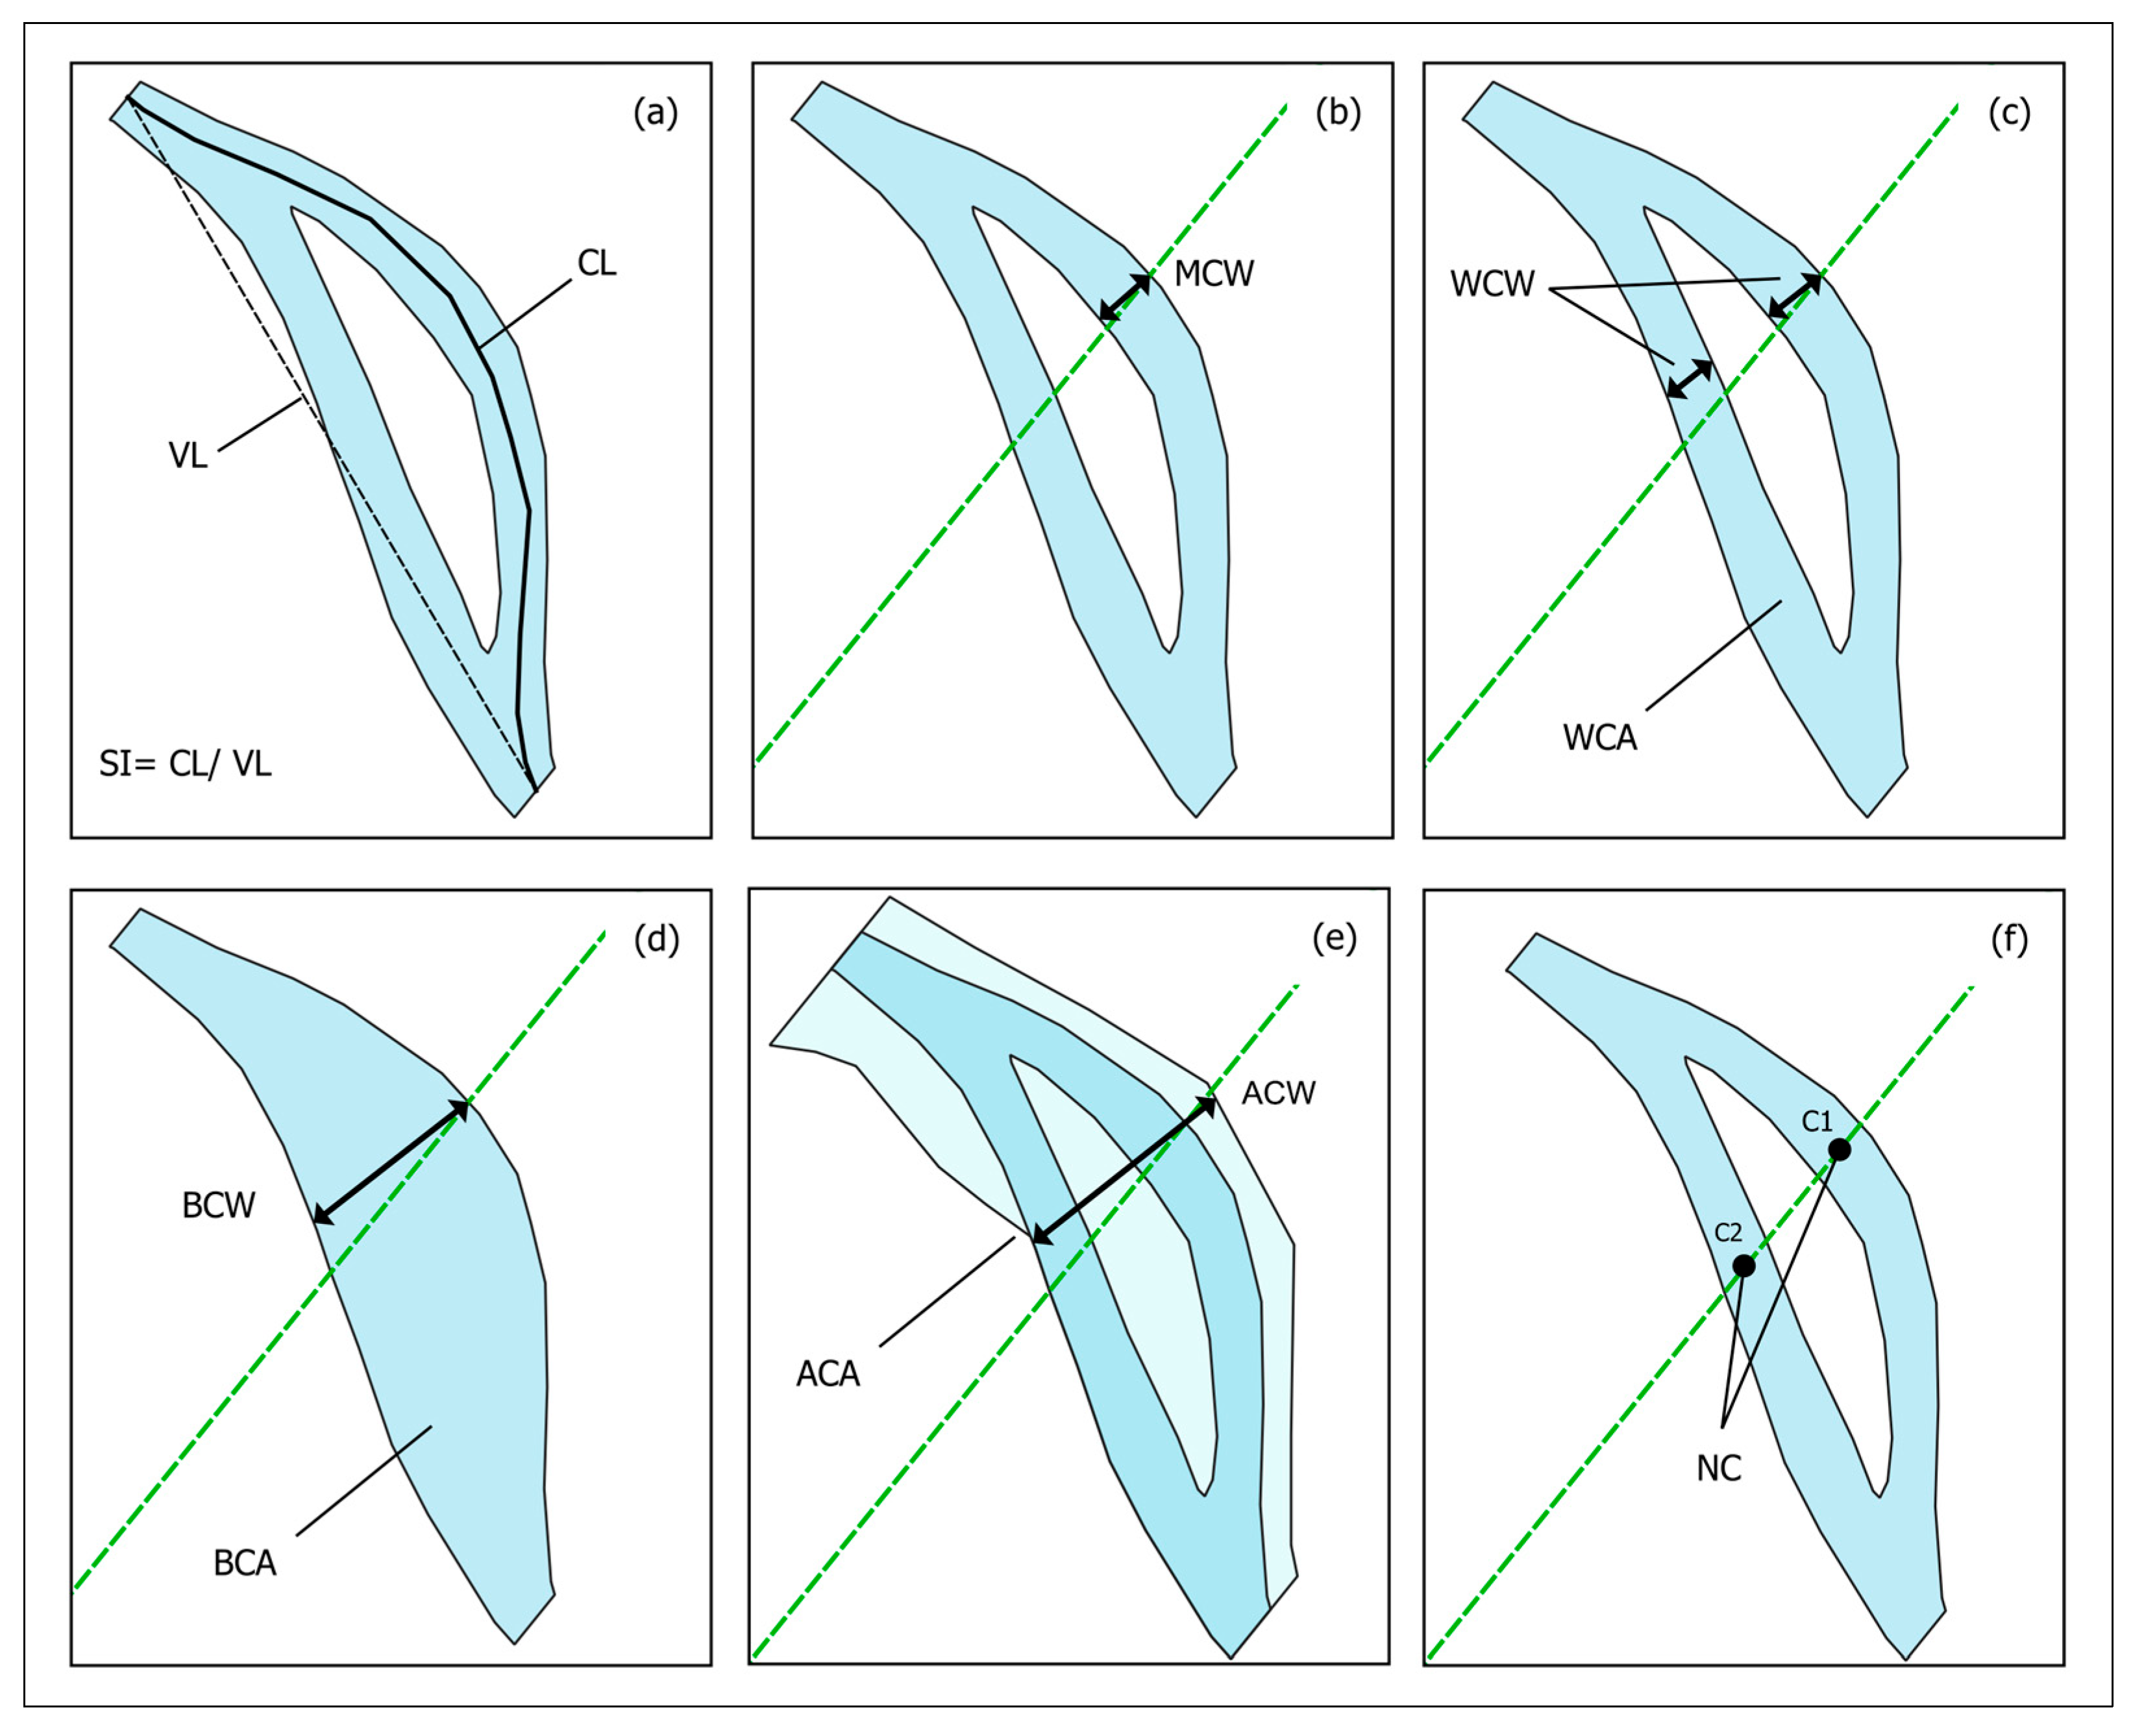
3.3. Geomorphometric Measurements

3.3.1. Parameters and Indices Measurements

Based on the planforms digitised in the previous stage and the segmentation methodology (Figure 3), 9 parameters and 2 indices were measured and calculated. A summary of these is presented in Table 5.
Channel length (CL) was already presented in the previous section, representing the sinuous length of the main channel within a river sector. This parameter is used for the calculation of the sinuosity index (SI) [106], defined as the ratio between CL and the valley length (VL)—the straight length between the endpoints of the CL (Figure 4a). The SI was calculated according to Equation (1):
SI   = C L V L
In terms of widths, the measurements were performed using the transects which intersect the river channel planform and the active channel area. Thus, four parameters resulted: the main channel width (MCW) (Figure 4b); the wetted channel width (WCW), including the MCW and the width of the secondary channels (Figure 4c); the bankfull river channel width (BCW), which is formed from the WCW and the sand bars or isles between the channels (Figure 4d). These measurements need to be perpendicular to the central axis of the intersected elements. Consequently, the initial transects were manually adjusted.
The areas were calculated using the method explained earlier (Figure 3), by looking at where the sector polygons meet the riverbed shape. Three area parameters resulted: wetted channel area (WCA) (Figure 4c), derived from the initial manually digitised river planform; bankfull river channel area (BCA), resulting from dissolving the WCA into a single polygon, without gaps (Figure 4d); and active channel area (ACA) (Figure 4e), previously digitised.
In addition to these, the number of channels (NC) was as measured using the transects, counting the points of intersection between the cross-section line and the wetted channel of the river (Figure 4f).
The thalweg migration (TM) was assessed by measuring the distance between the intersection point of the transect with the thalweg line for successive time periods.
These parameters were carried out for all the cartographic sources analysed in the study (Table 1).

3.3.2. Processing Automation

Considering that the cross-sections do not always cross the channel perpendicularly, the width calculation cannot be fully automated; transects should be manually adjusted for every time period and sector in order to maintain the accuracy of the measurements. Furthermore, all model inputs must be prepared and reviewed in advance.
Subsequently, the parameter calculation was automated in the GIS environment using QGIS Model Designer (Figure 5). The result consists of a spreadsheet at both sector and transect scales for each parameter or index calculated across the study time span (1856–2021).
The model was applied one period at a time.

3.4. Data Analysis and Postprocessing

All the riverbed geomorphological parameters and indices calculated in the previous section of the study, along with the climatic, hydrological, and human interventions, were statistically processed and graphically represented in order to provide a simple and better visualisation and interpretation. These actions were made using R 4.2.2 through RStudio GUI, QGIS 3.22, and Microsoft Excel.
For the climatic data, we extracted daily mean areal precipitation over the studied watershed between 1950 and 2022 (73 years) using the “terra” R package, version 1.6.53 [107]. Then, they were aggregated into yearly mean values.
We used the Mann–Kendall (MK) non-parametric test [108,109] to detect monotonic trends in the yearly time series of precipitation and temperature over the study area and river flow gauged at the hydrometric station. The test was performed using the “Kendall” R package, version 2.2.1 [110]. The key equations of the MK test are provided as follows, starting with the MK statistic S, which is calculated as
S = i = 1 n 1 j = i + 1 n s g n x j x i ,
where x j and x i are the values in years j and k, with j > k and n the total number of years.
The sgn() is the sign function, defined as
s g n x j x i = 1 ,       if   x j x k > 0 0 ,   if   x j x k = 0   1 ,   if   x j x k < 0
The distribution of the MK statistic S is approximated by a normal distribution for large n, with mean = 0 and standard deviation given by Equation (4).
V a r S = n n 1 2 n + 5 i = 1 t t i t i 1 2 t i + 5 18
where n is the number of observations, t is the number of tied groups in the time series, t i the number of ties of extent i. To test the statistical significance of the trend, the standardised Z test was calculated according to Equation (5). For this analysis, we set the significance level at α = 0.10 for a two-tailed hypothesis test.
Z = S 1 V a r ( S )   i f   S > 0 0       i f   S = 0 S + 1 V a r ( S )   i f   S < 0
The strength and the direction of the trend is described by the Kendall’s Tau correlation coefficient (τ). Assuming there are no ties into the data series, this is calculated according to Equation (6):
τ = C D n ( n 1 ) / 2
where C is the number of concordant pairs, D is the number of discordant pairs, and n is the number of observations.
The R package “changepoint”, version 2.3, [111] was utilised to identify changes and breakpoints in data series of precipitation, temperature, and discharges.
HCA was used to group the river sectors into clusters which have common characteristics and the same spatial pattern of evolution. The analysis was performed using the base statistics package in R [112], the Euclidean method for the distance matrix, and Ward’s D2 method for the clustering algorithm. A similar approach HCA was also performed for the Garonne River, France [6].

4. Results

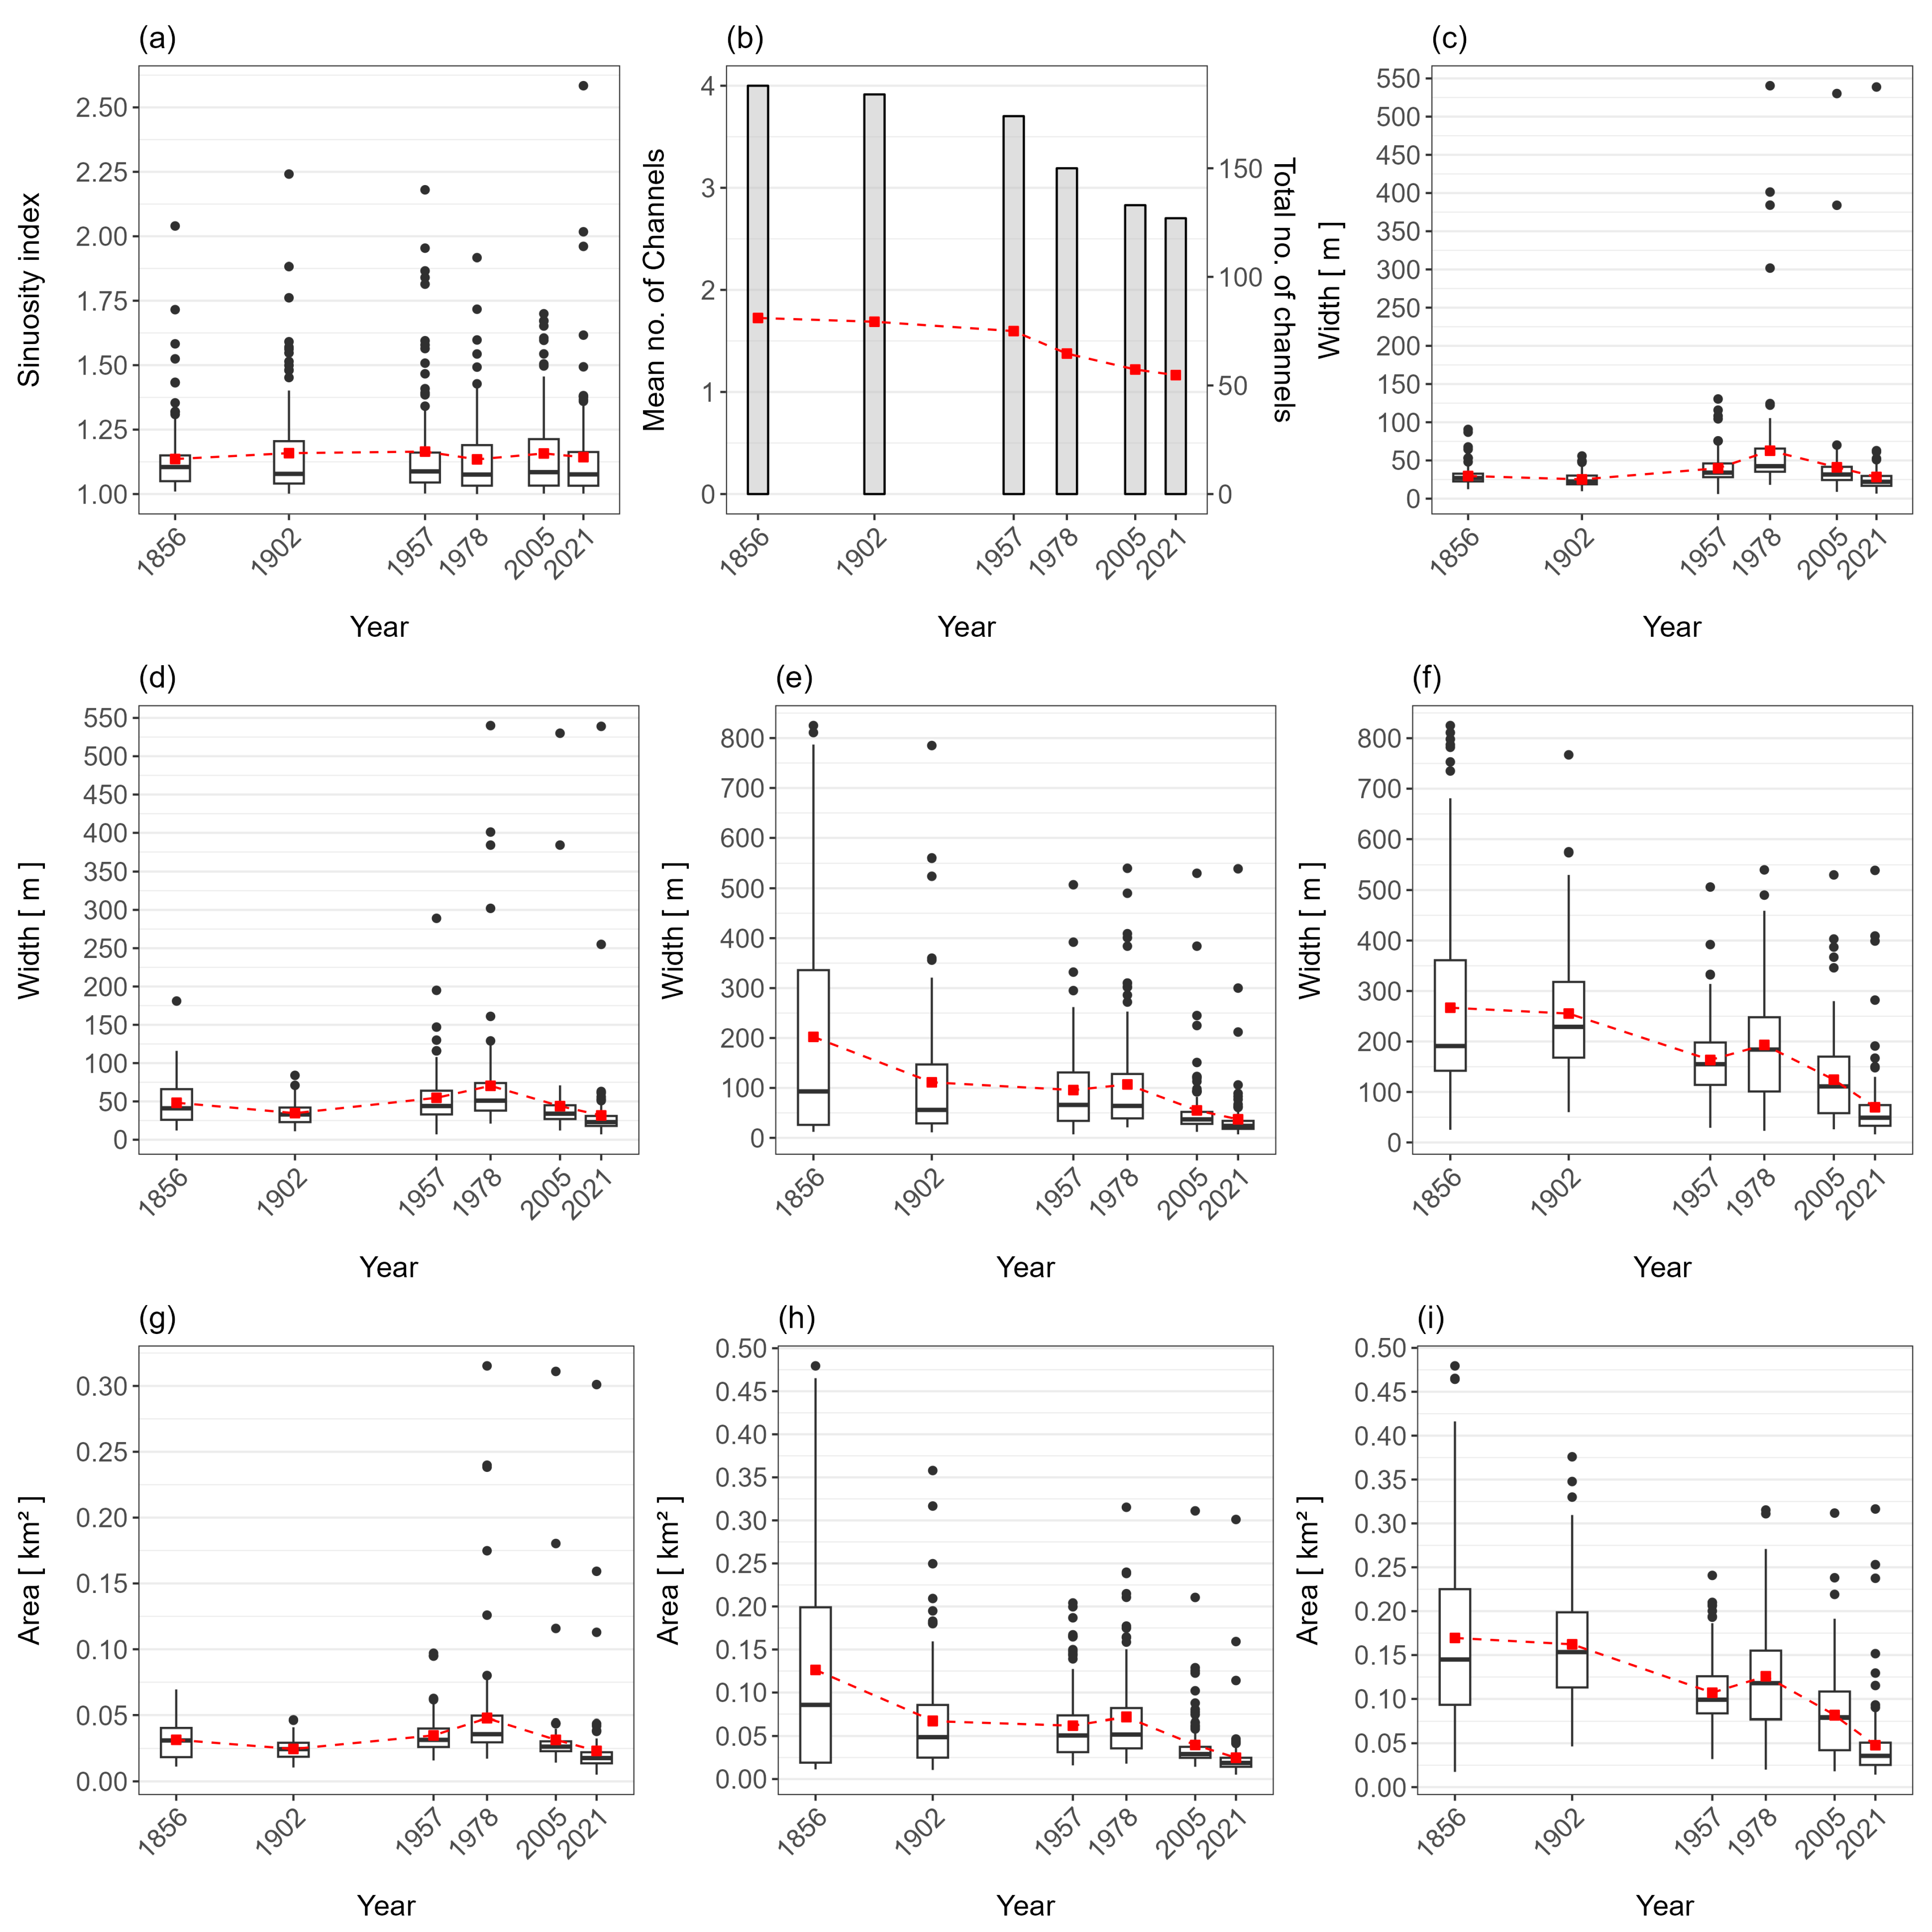
4.1. Morphometric Analysis of River Reach Between 1856–2021

4.1.1. Entire River Reach

The SI, ACA, BCA, and WCA (Figure 6a,b) were calculated for the entire river reach, and several changes occurred during 1856—2021. We observed a general downward trend in all the parameters, with some upward oscillations in 1902, 1957, and 1978.
The sinuosity index describes the river reach as moderately sinuous. Its values reduce from 1.24 in 1856 to 1.21 in 2021, the general trend being of decrease (Figure 6a). However, 1902 deviates significantly, reaching a value of 1.29.
The areas occupied by different riverbed parts show the same downward trend, as can be observed in Figure 6b. BCA undergoes the most significant changes, becoming almost five times smaller, from 10.6 km2 in 1856 to 2.3 km2 in 2021. The period 1902–1978 indicates a stationary trend, with areas between 5 and 7 km2. In terms of ACA, the area drops continuously from 15.6 km2 in 1856 to 4.3 km2 in 2021, with a growth in 1957. WCA shows a weak decrease compared with the other parameters, from 2.94 km2 in 1856 to 2.12 km2 in 2021. It can also be observed that the proportion between the parameters becomes smaller (Figure 6b). In 1856, BCA and WCA are 68% and 17% from the area of ACA. This changed in 2021, where BCA is 52% and WCA 49%.
Yearly rates of change indicate the amplitude of the morphological changes in river parameters depending on each time interval. The sinuosity index (SI) decreases at a rate of 0.02% per year, with the most active periods occurring between 1856 and 1902, 1903 and 1957, and 2006 and 2021 (Table 6).
The area measurements indicate, in general, negative values between 1856 and 2021 (Table 6). The bankfull channel area (BCA) has the highest rate of change of −2.23% per year, followed by the active channel area (ACA), with −1.57% per year. The changes in wetted channel area (WCA) are significantly lower (−0.23 per year). The period 1958–1978 is the only one in which all the parameters show a positive rate of change.

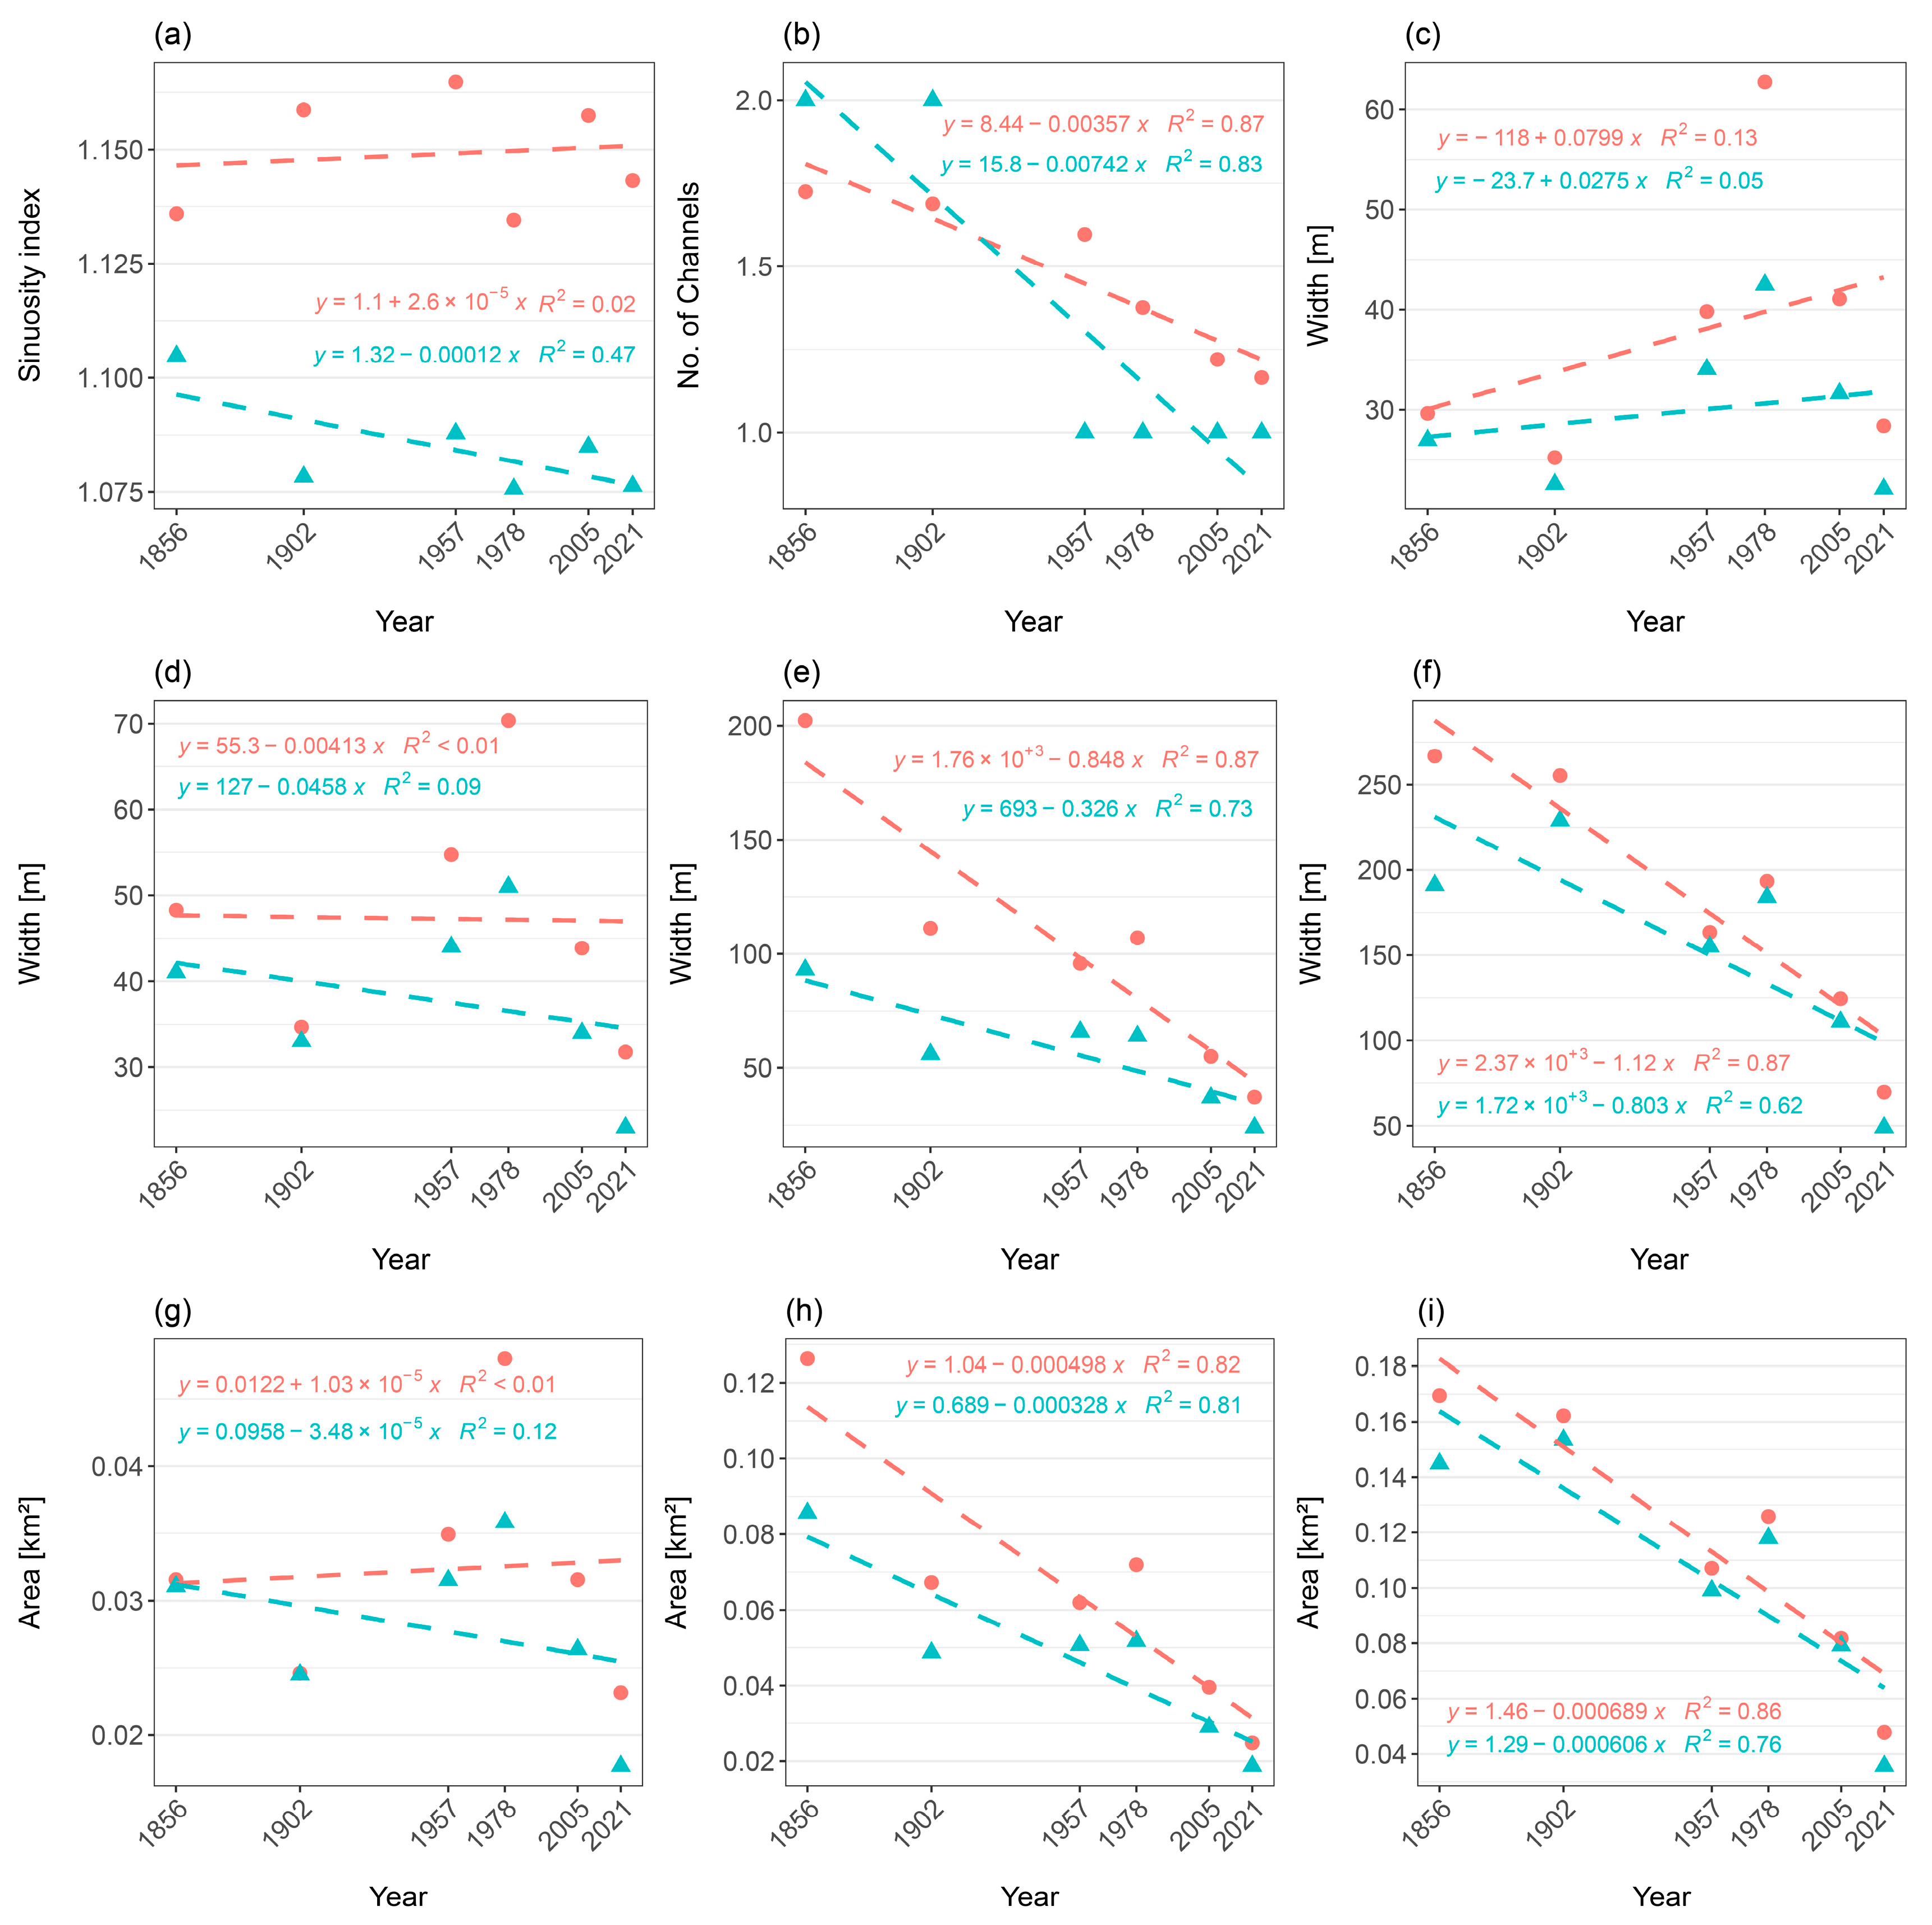
4.1.2. Sector Scale Analysis

The analysis of the riverbed at the sector scale between 1856 and 2021 shows a general downward trend in most of the parameters and indices values, which indicates a reduction in the geomorphological complexity of the riverbed (Figure 7a–i).
Regarding the sinuosity index (SI), the median values indicate a slight tendency of the riverbed to become less sinuous. The mean values confirm this, oscillating between 1.136 in 1856, 1.59 in 1902, and reaching 1.143 in 2021. The outliers represent, in most of the cases, meandering sectors of the river (SI > 1.5) (Figure 7a).
The absolute and mean number of riverbed channels is represented in Figure 7b. The mean values decrease slowly from 1.72 in 1865 to 1.60 in 1957, followed by a sudden drop to 1.38 in 1978 and 1.17 in 2021. This indicates the transition to a single-thread channel.
We analysed the widths in terms of the main channel (MCW), wetted channel, bankfull channel (BCW), and active channel (ACW) (Figure 7c–f).
MCW is, in general, low between 1856 and 1902 (<30 m), rises between 1902 and 1978 (mean over 50 m), and then drops to similar values as initially. Also, the spread of the middle 50% indicates a more homogenous main channel in 1956, 1902, and 2021 than in the other periods, especially 1978 (Figure 7c).
WCW follows the MCW values and distribution, except in 1856, where the width and the spread of the interquartile range are significantly higher, showing more variability (Figure 7d). This indicates a multithread riverbed, with secondary channels contributing to increasing the value. In both situations, the outliers over 300 m which have appeared since 1978 represent the width of Pucioasa Lake, located in the northern part of the reach.
The bankfull channel width follows an obvious downward trend, highlighted by the changes in mean and median values as well as the data distribution (Figure 7e). Between 1856 and 2021, the mean BCW decrease was from 202 to 37 m, with more than 90 m being lost just in the period 1856–1902. The median width reduces from 93 to 24 m. Regarding the distribution of the data, the BCW spread of the widths becomes smaller in time: the middle 50% decreases from ~300 m in 1856 to 18 m in 2021, indicating a general intense shrinking and narrowing of the riverbed. A considerable number of outliers have appeared since 1978.
In terms of ACW, the mean and median values indicate a negative trend, divided into two stages of decrease: 1856–1957 from 267 and 191 m to 163 and 155 m; 1978–2005 from 193 and 184 m to 70 and 40 m. Also, the range of variability decreased, the middle 50%, reaching from ~220 m to 40 m, became more than 5 times smaller in 2021 than in 1856. The same years show significant outlier values (Figure 7f).
The area parameters data distribution is quite similar to their width correspondents (WCW–ACA, BCW–BCA, ACW–ACA), indicating a strong correlation between these parameters. At the same time, this is a confirmation that the measurements are correct and representative, considering that the method used was different: transects for the widths and polygon sectors for the areas (Figure 4).
WCA, BCA, and ACA between 1856 and 2021 maintain the same downward trend as the other parameters/indices. Regarding wetted channel area (WCA), the mean values decrease from 0.032 km2 in 1856 to 0.023 km2 in 2021. During this period, a deviation occurs from 1957 to 1978, where the area reaches 0.048 km2. Looking at the median values (less influenced by extreme values), this deviation from the trend became smaller (Figure 7g). The bankfull channel area (BCA) became, in general, circa five times smaller from 1856 (0.13 km2—mean and 0.086 km2—median) to 2021 (0.025 km2—mean and 0.019 km2—median). There are observed periods of decreasing, between 1856 and 1902 and 1978 and 2021, and relative stability between 1902 and 1978. Also, the variation in the areas decreased; the interquartile range became considerably smaller (Figure 7h). The active channel area (ACA) drops from 0.169 km2 (mean) and 0.145 km2 (median) in 1856 to 0.048 km2 (mean) and 0.036 km2 (median) in 2021. The year 1978 deviates from the trend (Figure 7i).

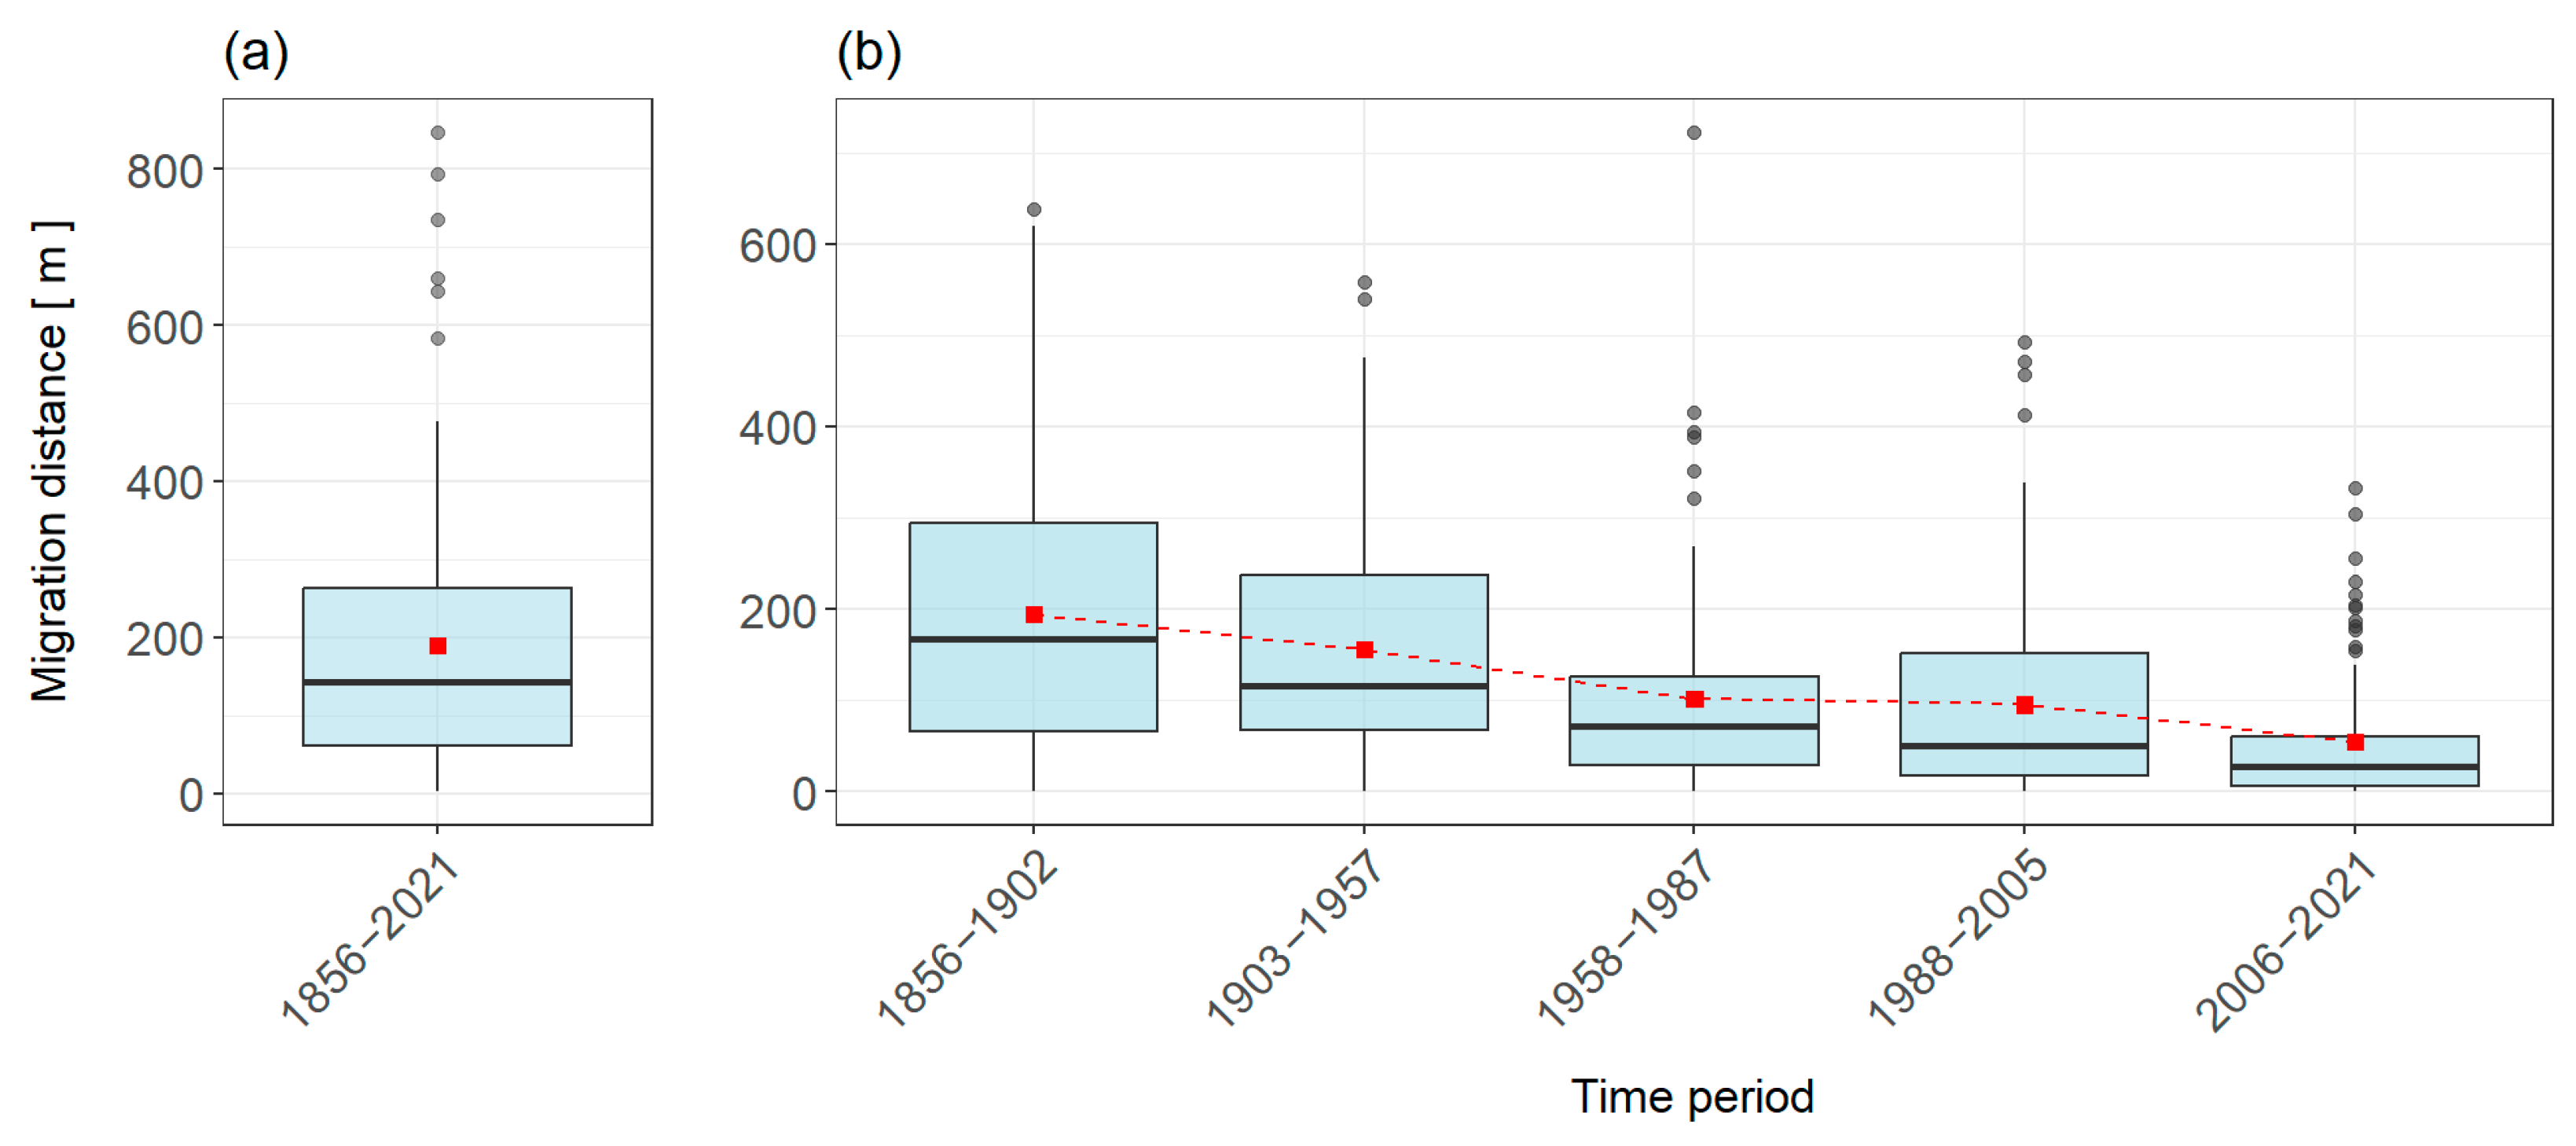
4.1.3. Riverbed Migration

We assessed the riverbed migration by measuring the displacement of the thalweg for each sector between successive periods, which became smaller along with the advance in time, as shown in Figure 8. For the entire period of the study (1856–2021), the riverbed has moved, on average, by 190 m and the median by 142 m. The interquartile range extends between approx. 60 and 260 m, showing a moderate spread of 200 m. Some outliers exceed 600 m, indicating drastic changes in the riverbed that are most likely caused by anthropogenic intervention (Figure 8a).
Analysing each time period, it is observed that the median migration distance continuously decreases from 167 m in 1856 to 142 m in 2021. The average values keep the same trend except for the period 1988–2005, where the mean is dragged up by high values and outliers. The spread of the migration distance interquartile range gradually decreases from period to period, showing a clear lower variability in time. The middle 50% reduced more than five times, from 284 m between 1856 and 1902 to 55 m between 2006 and 2021. Additionally, Figure 8b shows a positive skew in the distribution across all periods.
We also calculated the rate of migration for each time span and the full period. The average rate of riverbed migration between 1856 and 2021 is approx. 1.14 m/year. Regarding the changes between each time step, the values are as follows: 1856–1902: 4.15 m/year, 1903–1957: 2.91 m/year, 1958–1978: 3.4 m/year, 1988–2005: 5.27 m/year, and 2006–2021: 3.44 m/year.

4.2. HCA

The clustering analysis of the riverbed was performed in order to identify spatial patterns in riverbed dynamics by grouping the river sectors into clusters with common characteristics or which share the same evolutionary trend. We used for the analysis the indices and parameters presented in Table 5, except for CL, MCW, and TM, which negatively affect the clustering. Therefore, 8 parameters and indices for 109 river sectors were included in the HCA. Following several tests, we considered 5 clusters to be representative and to indicate specific spatial patterns in riverbed dynamics. The hierarchical cluster dendrogram (Figure 9) displays the analysis’s result, clusters being highlighted.
The agglomerative coefficient of the HCA is 0.89, which indicates a strong clustering structure. The cluster robustness was assessed trough the silhouette score [113], indicating a low averaged width of 0.11, which suggests a weak separation between the identified clusters. In the context of the fluvial system and the study, this reflects the geomorphic behaviour and complexity of riverbed dynamics. River sectors’ gradual morphological transitions and uneven temporal evolutionary trajectories across six different periods lead to an overlapping of the clusters, affecting robustness. However, we consider that the low silhouette score does not necessarily mean a poor clustering structure, but rather, it is a reflection of the river geomorphological behaviour. In order to characterise the clusters, Figure S1 shows the z-scores for the analysed geomorphometric parameters at the sector level. Figure 10 also displays the spatial distribution of the clusters.
Cluster 1 includes 32 sectors located predominantly in the northern part of the studied reach (Figure 10). These are characterised by consistent high values for most of the parameters, which persisted throughout the analysed period until 1957 or 2005 for some sectors. The z values are generally up to 2.5, sometimes reaching 5 (Figure S1). In 2005 and 2021, the values of the wetted channel, bankfull channel, and active channel parameters are the same or similar.
Cluster 2 contains 20 highly dynamic sectors over the analysed period, except 1856. During 1902–2021, these sectors exhibit mostly sustained meandering activity. However, in 1957 and 1978, some sectors developed anastomosed fluvial characteristics. Z-scores correspondingly capture these elements, showing generally high values starting with 1902 (Figure S1). Mostly, these sectors are located in the plain area (Figure 10).
Cluster 3 is formed from two sectors, which suffered drastic changes starting in 1978. The riverbed widths and areas increased significantly and remained larger up until 2021. The z-score shows up to eight times standard deviations above the mean in terms of widths and areas (Figure S1). The SI and NC remain almost the same. These correspond with Lake Pucioasa, located near the city with the same name (Figure 10).
Cluster 4 contains 23 sectors, generally highly influenced by anthropogenic activity and mainly located in the middle and upper part of the studied reach (Figure 10). A transition is observed from a multi-thread channel in 1856–1902, or just 1902 in some cases, to a single-thread, low sinuous or straight channel. According to Figure S1, the majority of the parameters have z-scores up to 5 from 1856/1902 to 1978. In subsequent periods leading to 2021, the parameter values exhibit a declining trend, with their z-scores converging under the mean.
The expansion of built space in the riparian zones and hydrotechnical developments has caused an intense narrowing of the riverbed by reducing the river’s freedom space [114] gradually over time.
Cluster 5 includes 32 sectors, located predominantly in the southern part of the studied reach (Figure 10), which are generally characterised by a low sinuous or meandered channel, considering the evolution over the entire analysed period (1856–2021). Between 1902/1957 and 2005, certain river sectors exhibited pronounced geomorphological dynamics, as evidenced by high z-scores (generally up to 2.5). Notably, the sinuosity index (SI) reached significantly higher values (z up to 7.5), while the number of channels (NC) also showed marked deviations (Figure S1). These spatial patterns highlight zones of intense fluvial activity, particularly where meandering processes dominate or where wandering prevails in multi-thread channels.

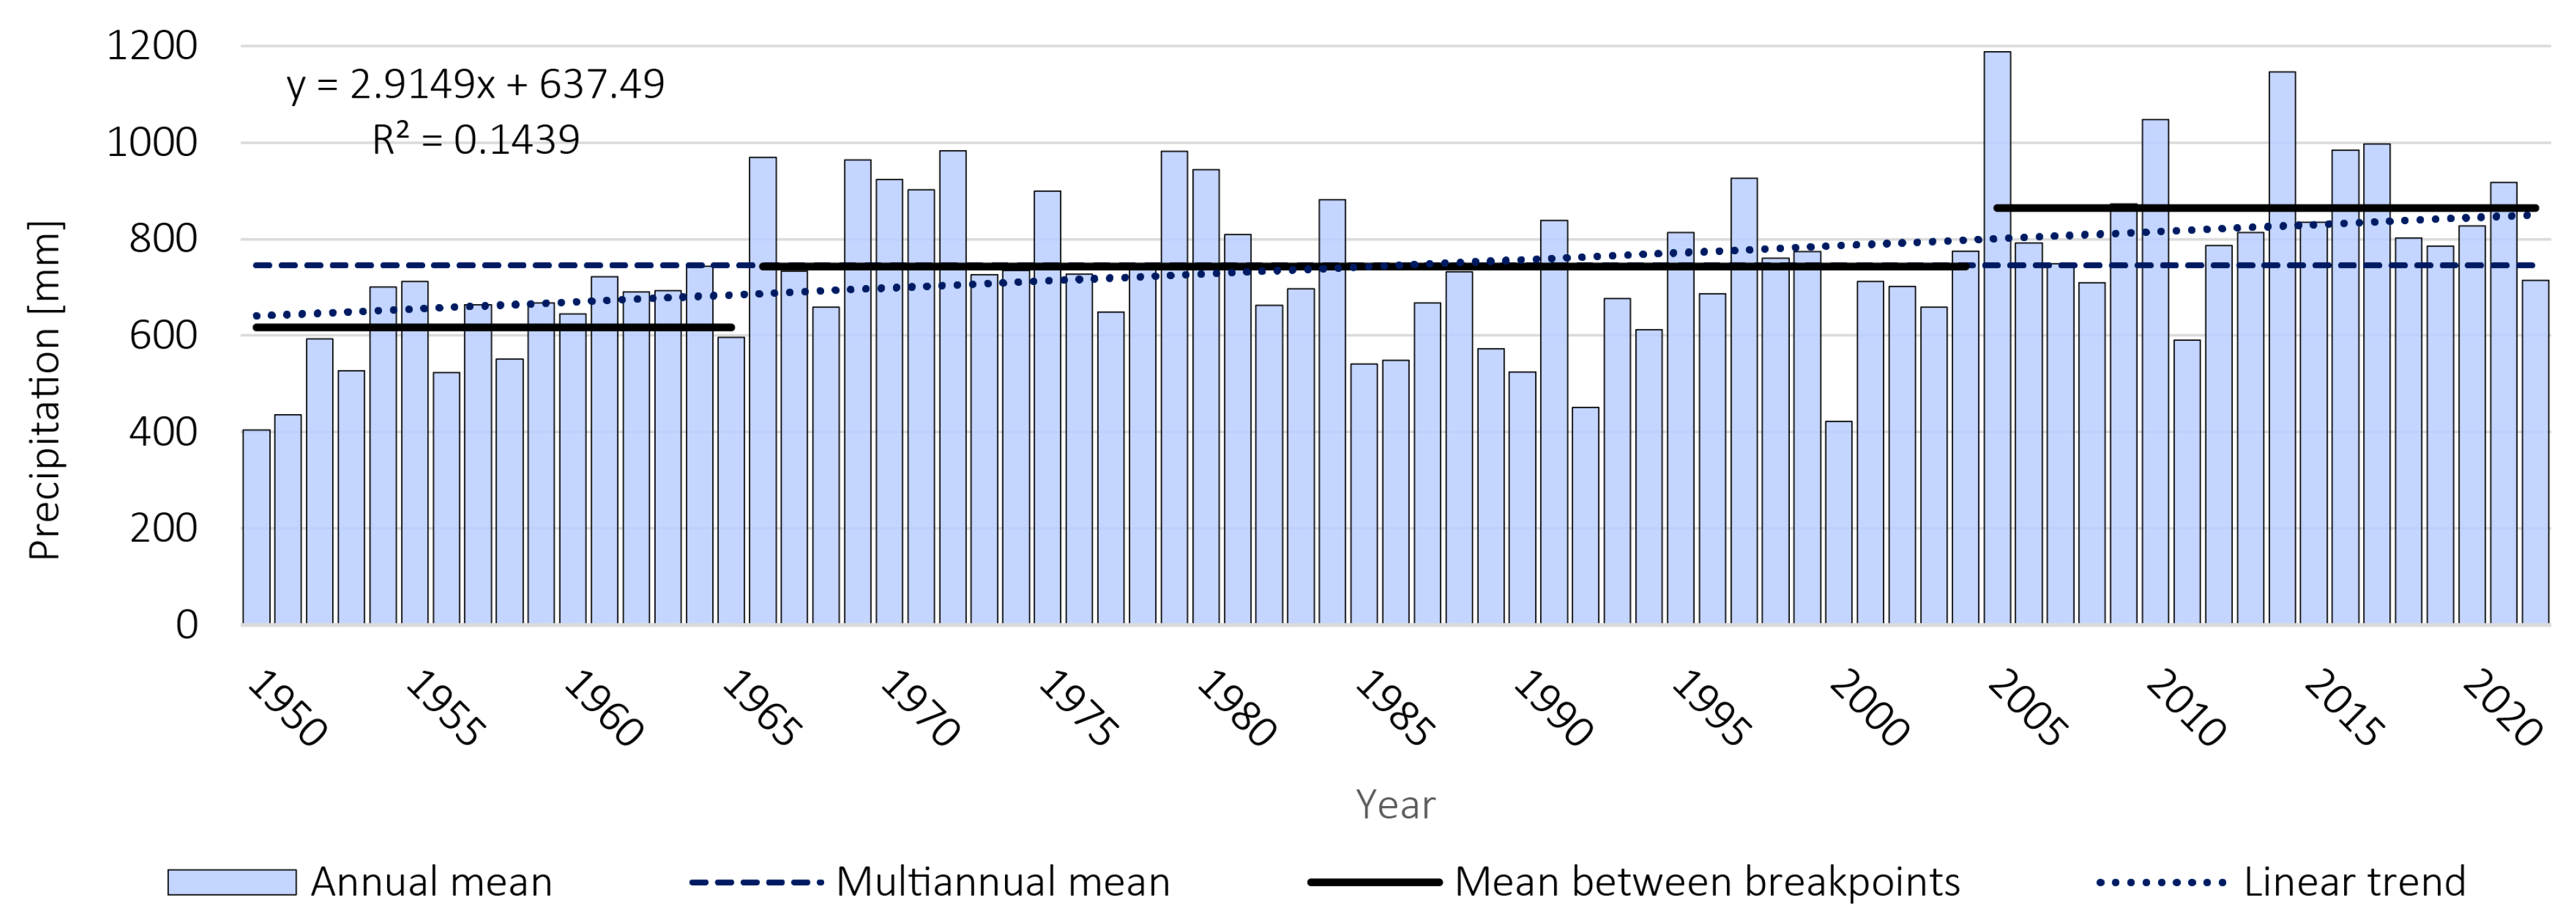
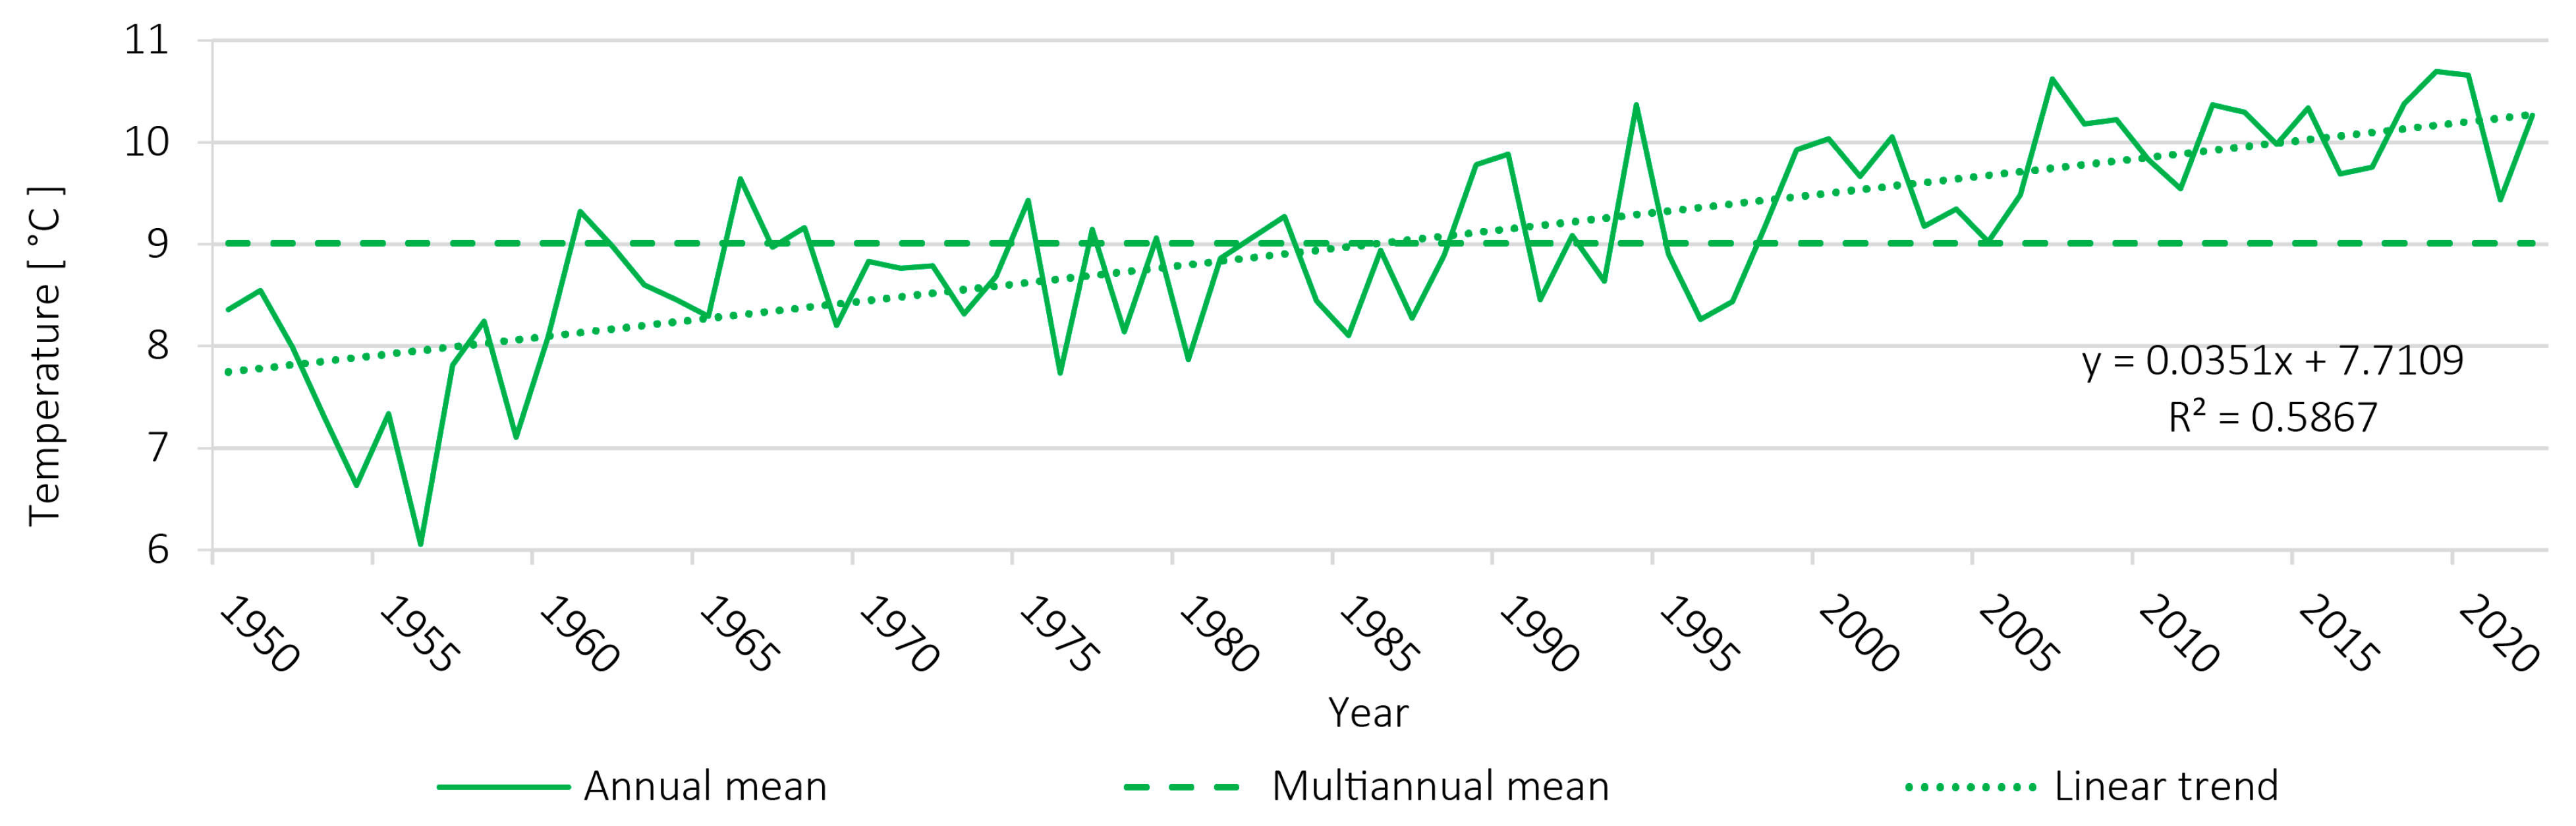
4.3. Climatic Regime and Trend

Figure 11 shows the mean annual precipitation over the study area. The precipitation values range from minimums of 404.3 mm (1950) and 421.8 mm (2000) to maximums of 1146.3 mm (2014) and 1188 mm (2005). The average mean multi-annual precipitation is 745.3 mm. A slightly upward trend is observed, confirmed by the MK test (τ = 0.285, p-value = 0.0004). Based on two changepoints identified in 1965 and 2002, three periods are distinguished which confirm the upward trend of precipitation:
  • From 1950 to 1965—with a range between 404 mm (1950) and 743 (1964) and with a mean of 617 mm.
  • From 1966 to 2004—with a minimum of 422 mm in 2000 and a maximum of 973 mm in 1972. The mean value is 743 mm, which is more than 100 mm higher than the other period.
  • From 2005 to 2022—with a mean value of 864 mm, annual values ranging between 590 mm in 2011 and 1188 mm in 2005. We observe the same increase in the mean value (over 100 mm) as in the previous period.
The mean annual temperature shows a clear continuous upward trend in the study area between 1950 and 2022 (Figure 12), which confirms there is climate warming in the area. The multiannual mean temperature is 9.01 °C, with annual average values between the minimum of 6.06 °C (1956) and maximum of 10.69 °C (2019). This positive trend is confirmed by the MK test, which indicates a strong rank correlation coefficient of 0.573, statistically significant at p-value = 2.22 × 10⁻¹⁶ A breakpoint was identified in the temperatures in 1998, from which point the annual average is permanently above the multi-annual average. This finding suggests a permanent change in the climatic regime in the study area.

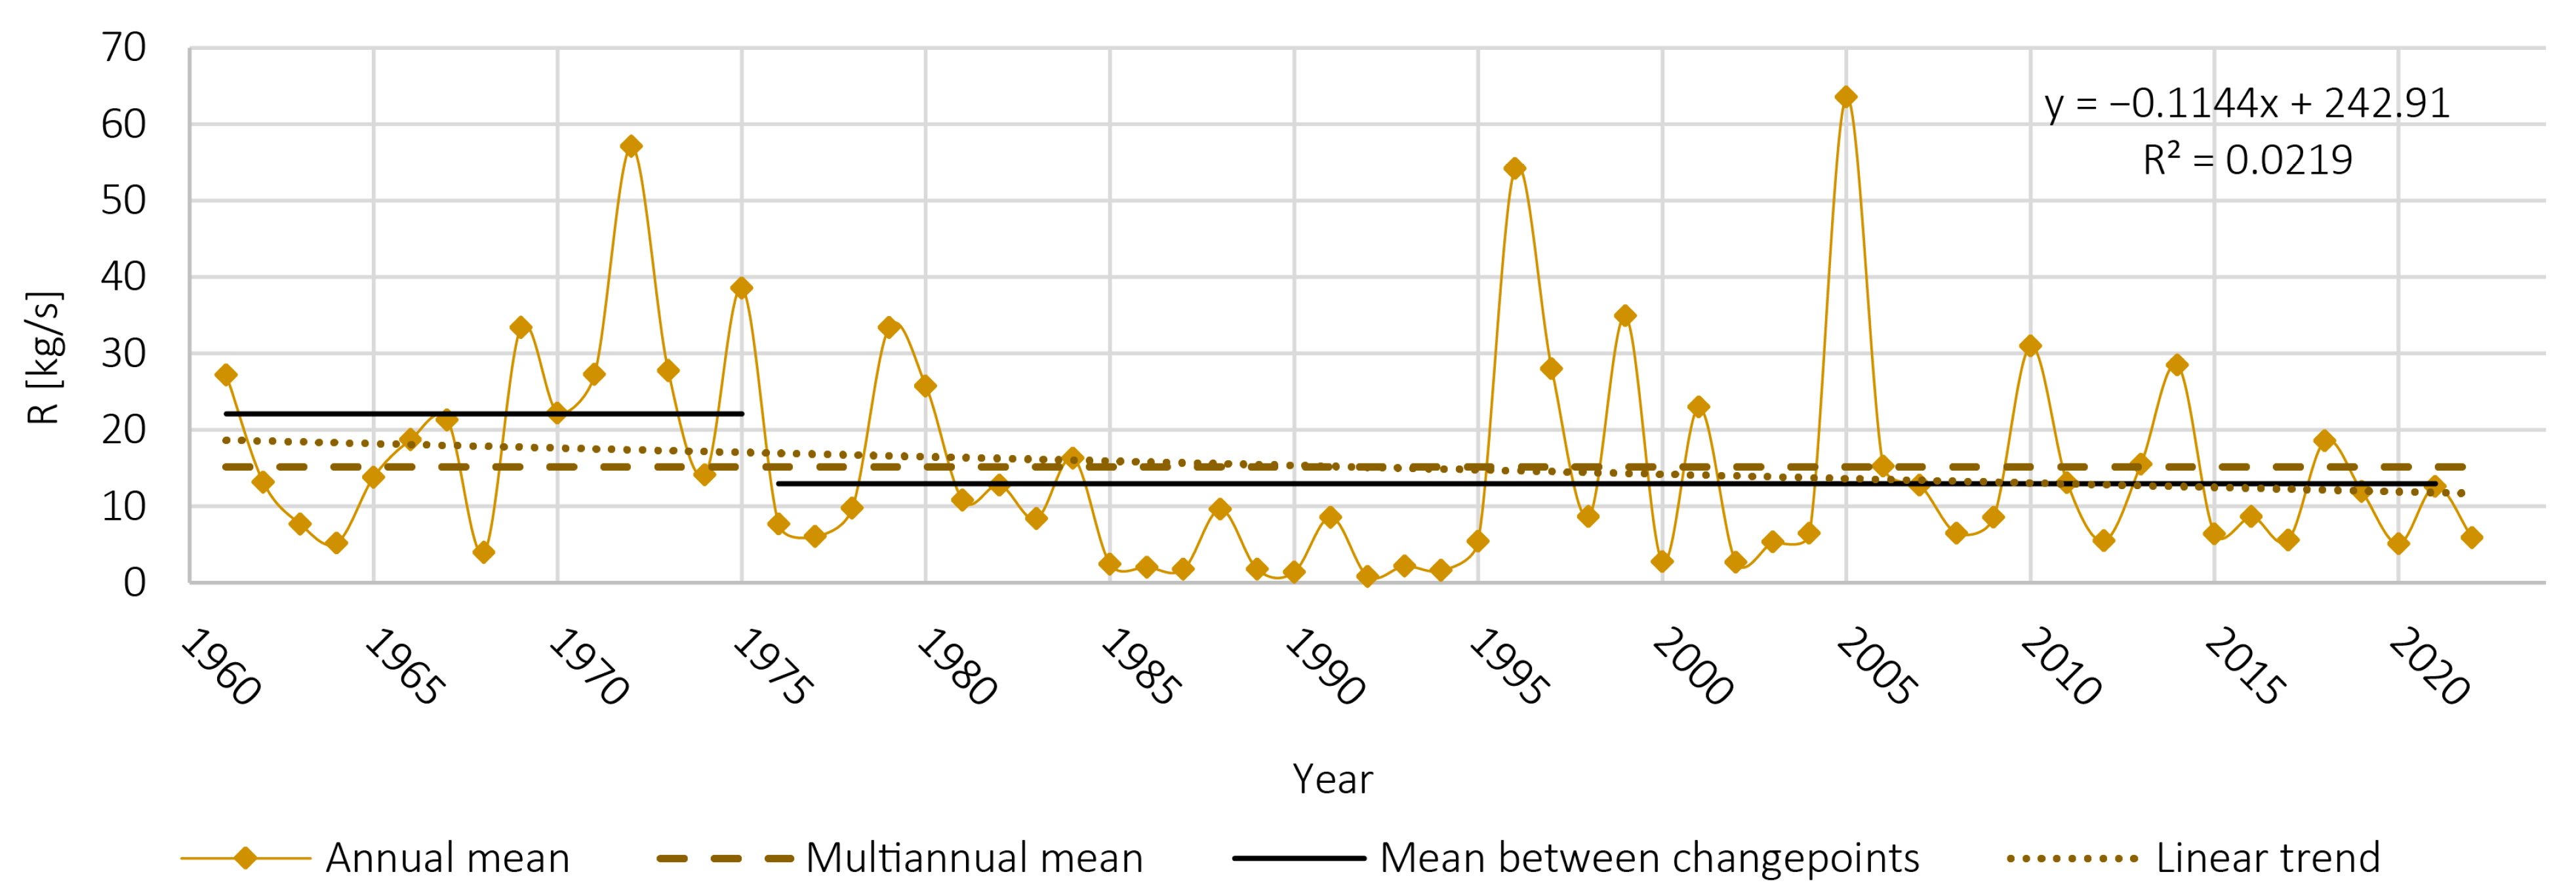
4.4. Hydrological Regime and Trend

The general evolutionary trend of the mean annual discharge shows a slight decrease (Figure 13a).
The whole period can be split into three parts, divided by the breakpoints detected in 1984 and 2003:
  • The first period (1961–1984) has the highest discharge, with a mean of 10.5 m3/s.
  • Starting with 1985, the second period begins and lasts until 2003, characterised by a drastic change in the flow. The mean discharge drops by half, reaching 5.03 m3/s.
  • The third period (2004–2022) shows an equally sudden return of the discharges near the values in the first period. The mean discharge is 8.97 m3/s.
According to the MK test applied for 1961–2022, a small negative trend is observed, but it is not significant (τ = −0.112, p-value = 0.20).
The maximum annual discharge (Figure 13b) stretches between values of 28 m3/s in 2000 and 745 m3/s in 2001. Also, a few peaks in the maximum flow are highlighted, respectively, 1972, 1975, 1982, 1991, 1997, 2001, and 2005, with Q > 400 m3/s, representing the most significant floods between 1961 and 2022. A weak negative trend is observed, confirmed with the MK test, but is not significant (τ = −0.103, p-value = 0.242).
The minimum discharge (Figure 13c) annual values range between 0.07 m3/s in 1964 and 3.03 m3/s in 2005, showing a general slightly upward trend (τ = −0.15, p-value = 0.087).
Regarding the suspended load discharge (R) (Figure 14), the mean multiannual value is 15.17 kg/s, with a minimum of 0.84 kg/s in 1992 and a maximum of 63.54 kg/s in 2005. The general evolutionary trend shows a slight decrease, as in the case of average flows, confirmed by the MK test, not statistically significant (τ = −0.105, p-value = 0.229). Furthermore, the entire period can be divided by a change point detected in 1975:
  • Period 1961–1975, with a mean of 22.09 kg/s;
  • Period 1976–2022, where the mean value of R is 12.97 kg/s, significantly lower than before the change point, especially between 1985 and 1995, the values being under 10 kg/s.

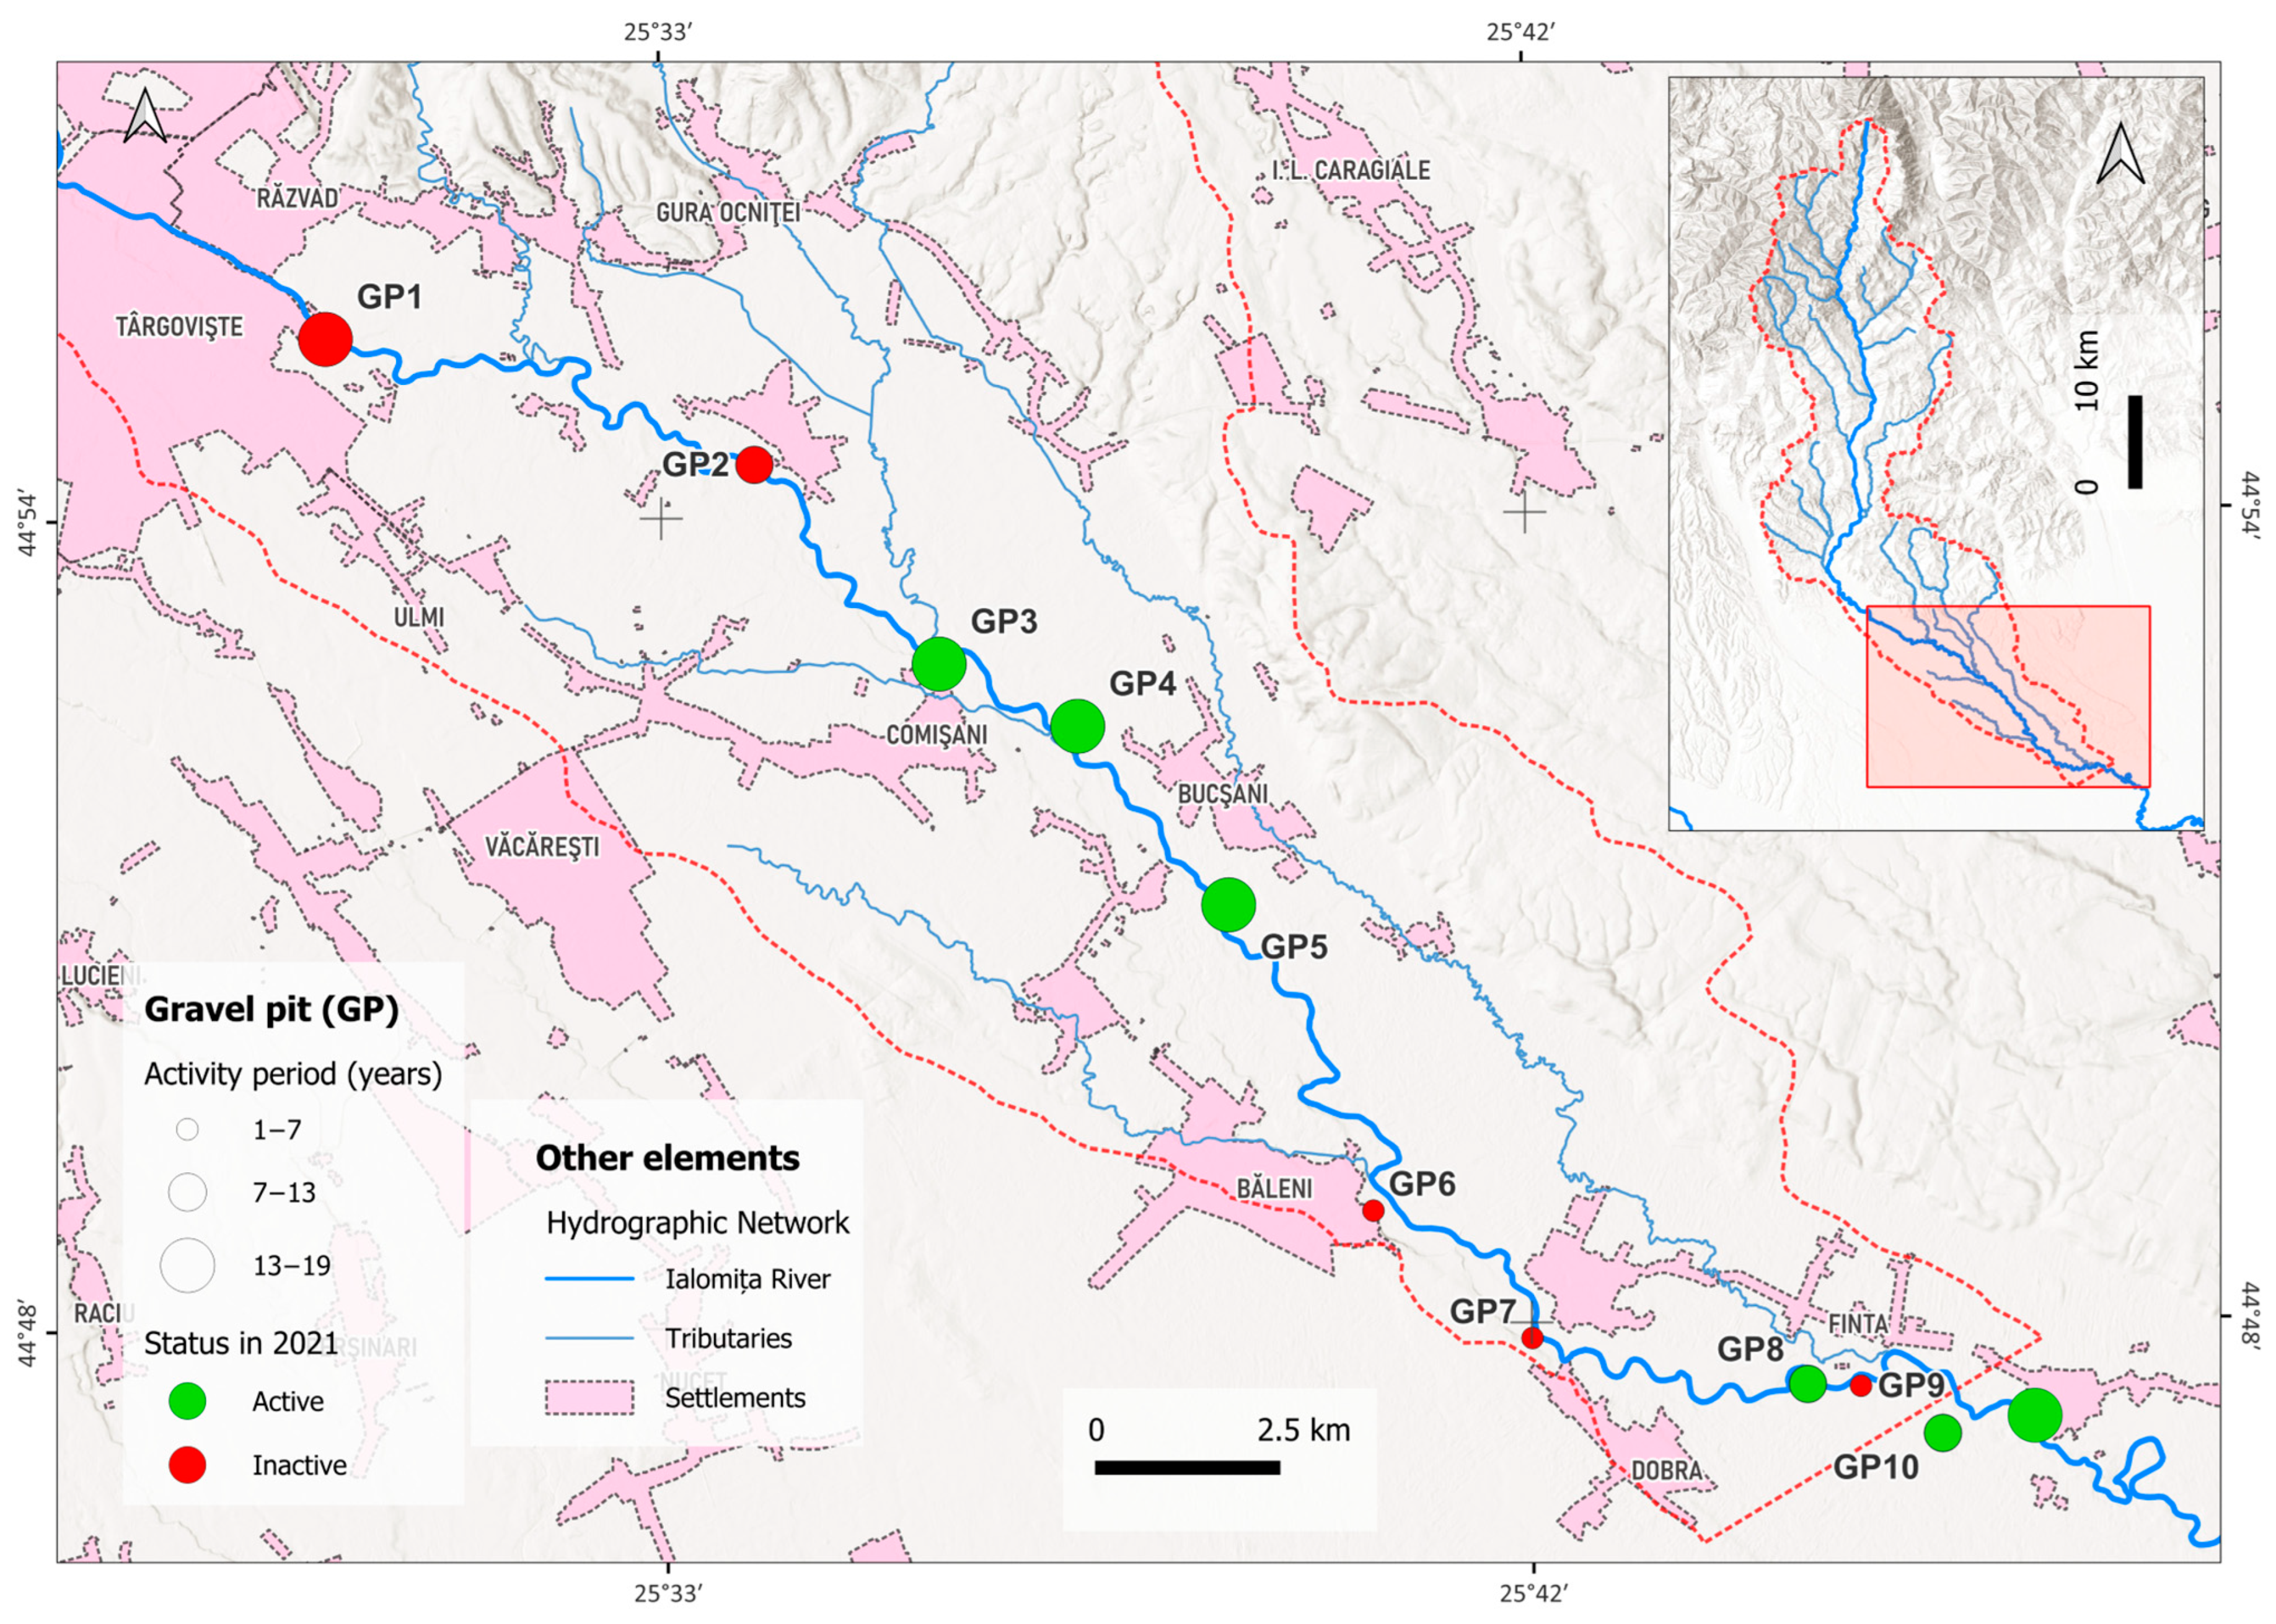
4.5. Anthropogenic Activity Assessment

Analysing the cartographic sources between 1856 and 2021, the river bank protection structures are scarcely present until 2005 (around 2 km), followed by a sudden increase in 2021, reaching 15.7 km, mainly concrete embankments realised to protect the settlements near the river. Regarding bed erosion, we were unable to identify on the historical cartographic sources any hydrotechnical structures prior to 2005, at which point 11 locations were found, reaching 13 by 2021.
Analysing the topographic maps, we were unable to identify any gravel mining activity in the studied Ialomița reach riverbed and floodplain on the map from 1978.
Starting with 2002, by analysing satellite images through Google Earth Pro, we identified 11 gravel pits (GPs) located in the plain area, downstream to Târgoviște city (Figure 15). Among these, six of them were still active in 2021, with a mining activity of up to 19 years for GP3, GP4, GP5, GP11 and up to 13 years for GP8 and GP10. Although GP10 and GP11 are not in the limits of the study area, we included them in the analysis because they can influence the riverbed due to their proximity.

4.6. Present Riverbed Dynamics

The field survey performed in 2024 shows that the Ialomița River is still becoming narrower and deeper in the area we studied, as shown in Figure 16.
The amplitude of the river deepening process depends on the relief unit, which is greater in the Subcarpathian zone. In some places, very intense incision reaches up to approximately 10 m (Figure 16b,c) and extends significantly in length, taking on the appearance of a canyon (Figure 16d). In this zone, the river channel loses its connectivity with the floodplain, leading to an irreversible geomorphic transition into a new terrace. In the plain area, the downcutting is weaker (Figure 16f) but can still create problems for anthropogenic developments in the riverbed.
Road infrastructure elements such as bridges are the most affected by the incision into the riverbed, a fact observed during the field survey (Figure 16a,e,g). We observe significant local scour at the base of the bridge’s piers, which remain suspended (Figure 16a). In the case of other types of bridges, previously deep foundation piles are now visible above the riverbed (Figure 16e,g) by over 1 metre for the bridge at Băleni (Figure 16h).
On the other hand, we observed intense lateral erosion in dynamic equilibrium zones. In this case, the narrowing and slight incision of the riverbed led to the creation of a single-thread channel that acquired intense meandering processes. As a consequence, concrete embankments were constructed, whose length increased from under 2 km in 2005 to over 15 km in 2021, to protect adjacent riverside settlements.

5. Discussion

The study results show a general decreasing trend in almost all the parameters and indices for the studied river reach, measured as a whole (Figure 6) as well as at the sector level (Figure 7). Also, the thalweg migration distance between successive years follows the same tendency (Figure 8). However, riverbed measurements in 1978 highlight a deviation from the main tendency of decreasing, as can be observed in Table 6 and Figure 7c–i. Consequently, based on the findings of this study, the interval spanning 1856 to 2021 can be divided into three distinct evolutionary periods, as follows.
The first period lasts from the mid-19th century to the beginning of the second half of the 20th century (including 1856, 1902, and 1957) and is characterised by fluvial dynamics occurring under quasi-natural, slightly disturbed conditions, especially for the period 1856–1902. Although the Scropoasa and Dobrești lakes have been formed since 1930, their limited storage capacity (Table 1) and high distance from the studied river reach make them ineffective for producing notable changes in the riverbed.
A large number of channels (Figure 7b), combined with the small values of the main channel width (Figure 7c) and the wetted channel width and area (Figure 7c,g), and with the high values of the bankfull and active channel widths and areas (Figure 7e,f,h,i), indicate that the river had a generally braided fluvial style, where the aggradation process is dominant. It is also notable that the migration of the riverbed between successive periods is accentuated (Figure 8b), which indicates a large free space of the river. Considering that the anthropogenic influence on the river is at a minimal level in this period, we cannot attribute the decreasing trend to this cause. Rather, climate change is the main driving factor in riverbed complexity reduction.
The second period is represented by the second half of the 20th century, a time when the most important anthropogenic developments of the Ialomița River took place, completed in 1988. The analysis of the riverbed in 1978 shows a clear deviation from the direction of evolution, as can be observed in Table 6 and Figure 6 and Figure 7. This is attributed to the direct influence of the construction of Pucioasa Dam (Table 1), finalised in 1975, and of the related downstream riverbed regularisation structures. The dam retains a large portion of sediment, as evidenced by the volume of water that the lake can retain decreasing from 10.6 mil. m3 in 1975 (Table 1) to 2.22 mil. m3 in 2016 [80], the lake being silted up in a proportion of 79%. The mean annual silting rate is 1.88%/year, representing a volume of approximately 200,000 m3/year.
The Pucioasa reservoir caused a decrease in suspended sediment supply (Figure 14), where a breakpoint was identified in the same year as the dam’s commissioning. This led to significant changes in riverbed dynamics, forcing the river to transition to a single-thread channel in the Subcarpathian area and a meandering–anastomosed style in the plain area. All of these changes are highlighted by the decrease in the number of channels (Figure 7b) and the increase in the width and area in 1978 (Figure 7c–i).
The finalisation of the Bolboci Dam in 1984, combined with low quantities of precipitation, led to a hydrological dry period, with values generally below the mean, identified by breakpoints from 1984 to 2004 into the mean annual discharges gauged at Baleni (Figure 13a). The suspended sediment discharge is also low, below the mean from 1985 to 1995 (Figure 14). This period favoured a narrowing process of the riverbed and the transition to a single-thread channel until the end of the century.
The third period represents the beginning of the 21st century, including 2005 and 2021, where the riverbed returns to the general descending trend of evolution. Compared with other periods, the measured parameters have significantly low values and, at the same time, a homogenous and tight distribution (Figure 7). Also, the migration distance of the thalweg is low on average, more than five times compared with 1856–1902. The variability is also lower (Figure 8). This indicates a lack of complexity in the riverbed morphology and a categorical transition to a sinuous, single-thread planform pattern.
The narrowing of the channel is associated with the incision, straightening, and deepening of the riverbed (Figure 16), accentuated by the intense gravel mining activity in the plain area starting in the 2000s. By 2021, we were inventorying 11 gravel extraction sites, half of them being active at the end of the period under review. These also have among the longest operating periods (Figure 15).
The floods could also be a factor which causes the deepening of the river channel, favoured by the instability created by the exploitation of aggregates from the riverbed. In 2001 and 2005, the largest historical floods recorded on the Ialomița River occurred, with peak discharges of 758 m3/s and 646 m3/s, respectively (Figure 13b).
HCA indicates some spatial patterns in the evolution of the Ialomița riverbed. Overall, these clusters underscore the interplay between natural fluvial dynamics and human-induced constraints, highlighting zones of both stability and intense morphological activity. Based on the analysis results (Figure 9, Figure 10, and Figure S1), the studied sector can be divided into two distinct zones, separated by the main relief units it traverses, Ialomița Subcarpathians and Târgoviște Plain, as follows:
  • The northern sector corresponds to the Subcarpathian and contact with Târgoviște Plain areas, where clusters 1, 3, and 4 are predominant. Here, the riverbed evolution is directly influenced by anthropogenic activity which occurred in the second half of the 20th century: the construction of the Pucioasa Dam and downstream riverbed regularisation structures; the development of the urban centres of Fieni, Pucioasa, and Târgoviște; and the emergence and development of industrial activities such as the Doicești thermal power plant. Also, anthropogenic activities have caused an incision in the bedrock, thus lithologically conditioning the evolution of the riverbed in some areas.
  • The southern sector overlapping the plain area generally consists of clusters 2 and 5. This area is characterised by a predominantly natural evolution of the river, the anthropogenic influence being exerted rather indirectly until the 2000s. Unlike the other zone, only rural settlements exist in the vicinity of the river. The riverbed generally has a greater space of freedom, being grafted into friable sedimentary rocks such as gravel and sand. After 2000, the appearance of the gravel pits increased the degree of anthropogenic impact with effects on the riverbed dynamics. Natural events, such as floods in 2001 and 2005, also affected the evolution of the riverbed.
Regarding the climatic component in the study area, an increasing trend in annual temperatures (τ = 0.573, p-value = 2.22 × 10⁻¹⁶) and precipitation (τ = 0.285, p-value = 0.0004) is observed. Comparatively analysing Figure 11 and Figure 13a, the annual evolution of precipitation correlates with the evolution of discharge, but their trends are opposite. High temperatures could lead to intense evapotranspiration, reducing the proportion of precipitation that becomes runoff and then streamflow by concentrating it into the river channel. Also, there is observed an increasing rain shower frequency in Romania [115,116], which can reduce contribution to the mean annual discharge, favouring surface runoff and limiting groundwater recharge. However, the fact that the Ialomița River’s flow regime is anthropogenically influenced is also a good reason why the discharge trend does not respond to the precipitation trend. Here we include the effect of dams and water withdrawals for economic activities and population supply.
Figure 17 presents linear models of the analysed parameters in the study (Table 5) which support the idea of the ongoing and continuing degradation process and transition of the Ialomița riverbed observed in the present (Figure 16) and its short-term future evolution. Strong decreasing trends are observed for the NC, BCW, ACW, BCA, and ACA (Figure 17b,e,f,h,i). A medium negative trend is observed for the median SI. MCW, WCW, and WCA (Figure 17c,d,g) remain relatively stable, being determined by long-term baseflow conditions.
According to the analysis of Rădoane et al. [57], in the past 150 years, there is observed a general tendency of channel narrowing and lateral stability in many European rivers, which facilitates the process of riverbed incision. Also, the rivers in Romania follow this trend, but with a delay of major human interventions.
A representative trend in the fluvial style of the Romanian rivers (Someș [70], Someșul Mic [74], Putna [79], Siret [78], Buzău [57], Moldova [72,73], Prahova [66,69,75,76]) is represented by a transition from complex, meandering, anastomosed, or braiding channel patterns to a simple, straight, sinuous (in certain cases with alternate bars) one. This is reflected in a general reduction in the complexity of the riverbed, also observed in the analysis carried out on the Ialomița River.
There were identified some limitations of the study, related in particular to the cartographic sources and the georeferencing process. Old topographic maps could contain significant mapping errors because of constraints in surveying technology and geodetic control. For the first cartographic source (Wallachia—Second military survey of the Habsburg Empire), the error between the original and the current measurements is estimated to be up to 20 m [88,89]. Also, a map at a scale two times smaller than the others (Table S1) inevitably leads to a greater degree of generalisation of the riverbed characteristics. In addition, the lack of common stable elements preserved over time used as control points makes the georeferencing process difficult and less accurate. For the other historical topographic maps, georeferencing leads to map distortions as well, but they are smaller through the improvements in quality over time.
Human errors in the riverbed features digitisation process are also one of the limitations of the study. These can be objectives related exclusively to the quality elements of the maps, such as map sheet physical degradation (paper degradation, fading ink and discolouration, human markings) and distortions from scanning handling and scanning artefacts. On the other hand, some errors are derived from subjective interpretation of the river morphological features, especially for orthorectified aerial images.
Other limitations are related to the uneven temporal coverage of the cartographic (1856–2021), hydrological (1961–2022), climatic (1950–2022), and anthropogenic (gravel pits inventory after 2000) data sources available for this study. This gap in temporal coverage led us to interpret our results within the broader context of climate change and anthropogenic influences based on similar studies conducted in Europe and Romania.

6. Conclusions

This paper presents the first results on the study of historical evolution and future trends of riverbed dynamics of the Ialomița River, Romania, mainly based on the analysis of successive sets of cartographic sources between 1865 and 2021. We approach a complex methodology, which allows the measurement of parameters and indices in a standardised and partially automated manner. The morphometric analysis reveals a general downward trend in riverbed sinuosity, number of channels, widths, surfaces, and thalweg migration distance. All of these indicate major changes in the Ialomița riverbed behaviour and fluvial style, its channel morphology undergoing a simplification and a transition from a complex, braided, multi-thread channel to a simple sinuous, single-thread one. The main processes consist of narrowing, incising, and straightening, alternating with intense meandering.
Changes in Ialomița River behaviour can be primarily attributed to climate change that occurred after the Little Ice Age (LIA). Our analysis over the last ~70 years confirms that climate change is underway in the study area, as reflected in upward trends in temperature and precipitation. Since the second half of the 20th century, anthropogenic influence directly on the riverbed has intensified significantly, assuming a dominant role in shaping the riverbed’s evolution.
Using HCA, we managed to identify spatial patterns in riverbed dynamics. Their evolutionary trajectory is highly dependent on the relief crossed by the river and anthropogenic influence over time.
The studied reach of the Ialomița River shares a similar historical evolution trend in riverbed dynamics with other European and Romanian rivers, which have reduced their geomorphological complexity by transition from a braided, multi-thread into a sinuous, single-thread riverbed pattern.
Field-based observations confirm the ongoing trend of riverbed degradation within the studied reach, mainly represented by the actions of narrowing and incision processes. Some bridges are already affected by downcutting at the base of the support pillars, endangering road traffic safety. Conversely, in areas affected by lateral erosion, concrete embankments have been constructed to protect the riparian settlements.
Regarding the future evolution trends, we consider the studied river reach will continue to degrade and reduce its morphological complexity on a short-term horizon, following the climate change signal and increased anthropogenic intervention. Ongoing in-channel aggregate extraction activities may intensify the riverbed incision process across the plain region. Further channel deepening in the Subcarpathian region will lead to a permanent geomorphic disconnection from the floodplain, transforming it into a new terrace. On-site observations have already identified this process. In certain zones, channel narrowing and confinement into a single-thread course may lead to intense local meandering, which could significantly impact adjacent human settlements through intense bank erosion, particularly during flood events.
We acknowledge the limitations of the study, which stem from the integration of historical cartographic sources into GIS, particularly through the heterogeneity and quality of the maps, the georeferencing process, and the interpretation of riverbed morphological features. In addition, the uneven temporal coverage of the analysed datasets represents a further constraint. Therefore, some of our statements and conclusions may be subject to a certain degree of uncertainty and generalisation, limiting our ability to fully understand the factors underlying the dynamics of the Ialomița riverbed.
The results of this study may be a useful tool in the management of the Ialomița River in the analysed area, and future anthropogenic interventions should take these into account. In the context of climate change and intensifying human activity, our findings may also contribute to a better understanding of recent behaviour of the riverbeds. Assuming that this study provides only a general overview of the river’s historical evolution and future trends, further research is needed to advance the knowledge of Ialomița riverbed dynamics.

Supplementary Materials

The following supporting information can be downloaded at: https://www.mdpi.com/article/10.3390/w17142151/s1, Table S1: Cartographic data overview; Figure S1: The z-score of the HCA.

Author Contributions

Conceptualization, A.R. and L.C.; methodology, A.R. and L.C.; software, A.R.; validation, A.R. and L.C.; formal analysis, A.R. and L.C.; investigation, A.R. and L.C.; data curation, A.R.; writing—original draft preparation, A.R. and L.C.; writing—review and editing, A.R. and L.C.; visualization, A.R.; supervision, L.C. All authors have read and agreed to the published version of the manuscript.

Funding

This paper has received funding for publication through the University of Bucharest.

Data Availability Statement

Restrictions apply to the availability of these data. The Wallachia—The second military survey of the Habsburg Empire map was obtained from Arcanum: https://maps.arcanum.com/en/map/secondsurvey-wallachia (accessed on 16 August 2023); The Romanian Military Topographic Map—1st edition was obtained from The Defence Geospatial Intelligence Agency “Division General Constantin Barozzi”; The Romanian Military Topographic Map—2nd edition and the Orthophoto maps were obtained from the Faculty of Geography, University of Bucharest. The hydrological data were obtained from The National Institute of Hydrology and Water Management. These datasets are available from the authors with the permission of each respective third-party data provider. All other raw data supporting the conclusions of this article will be made available by the authors on request.

Conflicts of Interest

The authors declare no conflicts of interest.

References

  1. Langat, P.K.; Kumar, L.; Koech, R. Monitoring River Channel Dynamics Using Remote Sensing and GIS Techniques. Geomorphology 2019, 325, 92–102. [Google Scholar] [CrossRef]
  2. de Musso, N.M.; Capolongo, D.; Caldara, M.; Surian, N.; Pennetta, L. Channel Changes and Controlling Factors over the Past 150 Years in the Basento River (Southern Italy). Water 2020, 12, 307. [Google Scholar] [CrossRef]
  3. Calvin, K.; Dasgupta, D.; Krinner, G.; Mukherji, A.; Thorne, P.W.; Trisos, C.; Romero, J.; Aldunce, P.; Barrett, K.; Blanco, G.; et al. IPCC, 2023: Climate Change 2023: Synthesis Report. Contribution of Working Groups I, II and III to the Sixth Assessment Report of the Intergovernmental Panel on Climate Change; Lee, H., Romero, J., Eds.; IPCC: Geneva, Switzerland, 2023. [Google Scholar] [CrossRef]
  4. Eyring, V.; Gillett, N.P.; Achuta Rao, K.M.; Barimalala, R.; Barreiro Parrillo, M.; Bellouin, N.; Cassou, C.; Durack, P.J.; Kosaka, Y.; McGregor, S.; et al. Human Influence on the Climate System. In Climate Change 2021: The Physical Science Basis. Contribution of Working Group I to the Sixth Assessment Report of the Intergovernmental Panel on Climate Change; Masson-Delmotte, V., Zhai, P., Pirani, A., Connors, S.L., Péan, C., Berger, S., Caud, N., Chen, Y., Goldfarb, L., Gomis, M.I., et al., Eds.; Cambridge University Press: Cambridge, UK; New York, NY, USA, 2021; pp. 423–552. [Google Scholar] [CrossRef]
  5. Caretta, M.A.; Mukherji, A.; Arfanuzzaman, M.; Betts, R.A.; Gelfan, A.; Hirabayashi, Y.; Lissner, T.K.; Liu, J.; Gunn, E.L.; Morgan, R.; et al. Water. In Climate Change 2022: Impacts, Adaptation and Vulnerability. Contribution of Working Group II to the Sixth Assessment Report of the Intergovernmental Panel on Climate Change; Pörtner, H.-O., Roberts, D.C., Tignor, M., Poloczanska, E.S., Mintenbeck, K., Alegría, A., Craig, M., Langsdorf, S., Löschke, S., Möller, V., et al., Eds.; Cambridge University Press: Cambridge, UK; New York, NY, USA, 2022; pp. 551–712. [Google Scholar] [CrossRef]
  6. David, M.; Labenne, A.; Carozza, J.-M.; Valette, P. Evolutionary Trajectory of Channel Planforms in the Middle Garonne River (Toulouse, SW France) over a 130-Year Period: Contribution of Mixed Multiple Factor Analysis (MFAmix). Geomorphology 2016, 258, 21–39. [Google Scholar] [CrossRef]
  7. Mandarino, A.; Pepe, G.; Cevasco, A.; Brandolini, P. Quantitative Assessment of Riverbed Planform Adjustments, Channelization, and Associated Land Use/Land Cover Changes: The Ingauna Alluvial-Coastal Plain Case (Liguria, Italy). Remote Sens. 2021, 13, 3775. [Google Scholar] [CrossRef]
  8. Agnihotri, A.K.; Ohri, A.; Mishra, S. Channel Planform Dynamics of Lower Ramganga River, Ganga Basin, GIS and Remote Sensing Analyses. Geocarto Int. 2020, 35, 934–953. [Google Scholar] [CrossRef]
  9. Harmar, O.P.; Clifford, N.J. Planform Dynamics of the Lower Mississippi River. Earth Surf. Process. Landf. 2006, 31, 825–843. [Google Scholar] [CrossRef]
  10. Basnayaka, V.; Samarasinghe, J.T.; Gunathilake, M.B.; Muttil, N.; Rathnayake, U. Planform Changes in the Lower Mahaweli River, Sri Lanka Using Landsat Satellite Data. Land 2022, 11, 1716. [Google Scholar] [CrossRef]
  11. Batalla, R.J.; Iroumé, A.; Hernández, M.; Llena, M.; Mazzorana, B.; Vericat, D. Recent Geomorphological Evolution of a Natural River Channel in a Mediterranean Chilean Basin. Geomorphology 2018, 303, 322–337. [Google Scholar] [CrossRef]
  12. Joyce, H.M.; Warburton, J.; Hardy, R.J. A Catchment Scale Assessment of Patterns and Controls of Historic 2D River Planform Adjustment. Geomorphology 2020, 354, 107046. [Google Scholar] [CrossRef]
  13. Langat, P.K.; Kumar, L.; Koech, R.; Ghosh, M.K. Characterisation of channel morphological pattern changes and flood corridor dynamics of the tropical Tana River fluvial systems, Kenya. J. Afr. Earth Sci. 2020, 163, 103748. [Google Scholar] [CrossRef]
  14. Rasheed, N.J.; Al-Khafaji, M.S.; Alwan, I.A. Investigation of Rivers Planform Change in a Semi-Arid Region of High Vulnerability to Climate Change: A Case Study of Tigris River and Its Tributaries in Iraq. Reg. Stud. Mar. Sci. 2023, 68, 103233. [Google Scholar] [CrossRef]
  15. Schwenk, J.; Khandelwal, A.; Fratkin, M.; Kumar, V.; Foufoula-Georgiou, E. High Spatiotemporal Resolution of River Planform Dynamics from Landsat: The RivMAP Toolbox and Results from the Ucayali River. Earth Space Sci. 2017, 4, 46–75. [Google Scholar] [CrossRef]
  16. Vercruysse, K.; Grabowski, R.C. Human Impact on River Planform within the Context of Multi-Timescale River Channel Dynamics in a Himalayan River System. Geomorphology 2021, 381, 107659. [Google Scholar] [CrossRef]
  17. Zhou, M.; Xia, J.; Lu, J.; Deng, S.; Lin, F. Morphological Adjustments in a Meandering Reach of the Middle Yangtze River Caused by Severe Human Activities. Geomorphology 2017, 285, 325–332. [Google Scholar] [CrossRef]
  18. Magliulo, P.; Bozzi, F.; Pignone, M. Assessing the Planform Changes of the Tammaro River (Southern Italy) from 1870 to 1955 Using a GIS-Aided Historical Map Analysis. Environ. Earth Sci. 2016, 75, 355. [Google Scholar] [CrossRef]
  19. Rinaldi, M.; Wyżga, B.; Surian, N. Sediment Mining in Alluvial Channels: Physical Effects and Management Perspectives. River Res. Appl. 2005, 21, 805–828. [Google Scholar] [CrossRef]
  20. Ziliani, L.; Surian, N. Evolutionary Trajectory of Channel Morphology and Controlling Factors in a Large Gravel-Bed River. Geomorphology 2012, 173–174, 104–117. [Google Scholar] [CrossRef]
  21. Surian, N.; Rinaldi, M.; Pellegrini, L.; Audisio, C.; Maraga, F.; Teruggi, L.; Turitto, O.; Ziliani, L. Channel adjustments in northern and central Italy over the last 200 years. In Management and Restoration of Fluvial Systems with Broad Historical Changes and Human Impacts; Geological Society of America Special, Papers; James, L.A., Rathburn, S.L., Whittecar, G.R., Eds.; Geological Society of America: Boulder, CO, USA, 2009; Volume 451, pp. 83–95. [Google Scholar] [CrossRef]
  22. Cencetti, C.; De Rosa, P.; Fredduzzi, A. Geoinformatics in Morphological Study of River Paglia, Tiber River Basin, Central Italy. Environ. Earth Sci. 2017, 76, 128. [Google Scholar] [CrossRef]
  23. Scorpio, V.; Aucelli, P.P.C.; Giano, S.I.; Pisano, L.; Robustelli, G.; Rosskopf, C.M.; Schiattarella, M. River Channel Adjustments in Southern Italy over the Past 150years and Implications for Channel Recovery. Geomorphology 2015, 251, 77–90. [Google Scholar] [CrossRef]
  24. Scorpio, V.; Andreoli, A.; Dinkelaker, N.; Marchese, E.; Coviello, V.; Gems, B.; Vignoli, G.; Comiti, F. Multi-decadal Quantification of Interactions between Coarse Sediment Fluxes and Channel Management in South Tyrol, Eastern European Alps. Earth Surf. Process. Landf. 2024, 49, 1869–1889. [Google Scholar] [CrossRef]
  25. Rinaldi, M. Bed-Level Adjustments in the Po River Catchment (Northern Italy). Ital. J. Eng. Geol. Environ. 2021, 2, 41–50. [Google Scholar] [CrossRef]
  26. Mandarino, A. Morphological Adjustments of the Lower Orba River (NW Italy) since the Mid-Nineteenth Century. Geomorphology 2022, 410, 108280. [Google Scholar] [CrossRef]
  27. Brenna, A.; Surian, N.; Mao, L. Alteration of Gravel-Bed River Morphodynamics in Response to Multiple Anthropogenic Disturbances: Insights from the Sediment-Starved Parma River (Northern Italy). Geomorphology 2021, 389, 107845. [Google Scholar] [CrossRef]
  28. Nones, M.; Guerrero, M.; Schippa, L.; Cavalieri, I. Remote Sensing Assessment of Anthropogenic and Climate Variation Effects on River Channel Morphology and Vegetation: Impact of Dry Periods on a European Piedmont River. Earth Surf. Process. Landf. 2024, 49, 1632–1652. [Google Scholar] [CrossRef]
  29. Brenna, A.; Bizzi, S.; Surian, N. How Multiple Anthropic Pressures May Lead to Unplanned Channel Patterns: Insights from the Evolutionary Trajectory of the Po River (Italy). CATENA 2024, 234, 107598. [Google Scholar] [CrossRef]
  30. Burshtynska, K.; Hrytskiv, N.; Zayats, I.; Babiy, L.; Fijałkowska, A.; Bakuła, K. Monitoring of Channel Deformations of the Lower Dniester Using Topographic Maps and Satellite Imagery with the Implementation of GIS Technologies. Water 2024, 16, 2148. [Google Scholar] [CrossRef]
  31. Llena, M.; Vericat, D.; Martínez-Casasnovas, J.A.; Smith, M.W. Geomorphic Adjustments to Multi-Scale Disturbances in a Mountain River: A Century of Observations. CATENA 2020, 192, 104584. [Google Scholar] [CrossRef]
  32. Baena-Escudero, R.; Rinaldi, M.; García-Martínez, B.; Guerrero-Amador, I.C.; Nardi, L. Channel Adjustments in the Lower Guadalquivir River (Southern Spain) over the Last 250 years. Geomorphology 2019, 337, 15–30. [Google Scholar] [CrossRef]
  33. Calle, M.; Alho, P.; Benito, G. Channel Dynamics and Geomorphic Resilience in an Ephemeral Mediterranean River Affected by Gravel Mining. Geomorphology 2017, 285, 333–346. [Google Scholar] [CrossRef]
  34. Fernandes, M.R.; Aguiar, F.C.; Martins, M.J.; Rivaes, R.; Ferreira, M.T. Long-Term Human-Generated Alterations of Tagus River: Effects of Hydrological Regulation and Land-Use Changes in Distinct River Zones. CATENA 2020, 188, 104466. [Google Scholar] [CrossRef]
  35. Wyżga, B.; Zawiejska, J.; Hajdukiewicz, H. Multi-thread rivers in the Polish Carpathians: Occurrence, decline and possibilities of restoration. Quat. Int. 2016, 415, 344–356. [Google Scholar] [CrossRef]
  36. Zawiejska, J.; Wyżga, B. Twentieth-Century Channel Change on the Dunajec River, Southern Poland: Patterns, Causes and Controls. Geomorphology 2010, 117, 234–246. [Google Scholar] [CrossRef]
  37. Hajdukiewicz, H.; Wyżga, B. Analysis of Historical Changes in Planform Geometry of a Mountain River to Inform Design of Erodible River Corridor. Ecol. Eng. 2023, 186, 106821. [Google Scholar] [CrossRef]
  38. Nádudvari, Á.; Czajka, A.; Wyżga, B.; Zygmunt, M.; Wdowikowski, M. Patterns of Recent Changes in Channel Morphology and Flows in the Upper and Middle Odra River. Water 2023, 15, 370. [Google Scholar] [CrossRef]
  39. Winterbottom, S.J. Medium and Short-Term Channel Planform Changes on the Rivers Tay and Tummel, Scotland. Geomorphology 2000, 34, 195–208. [Google Scholar] [CrossRef]
  40. Keesstra, S.D.; van Huissteden, J.; Vandenberghe, J.; Van Dam, O.; de Gier, J.; Pleizier, I.D. Evolution of the Morphology of the River Dragonja (SW Slovenia) Due to Land-Use Changes. Geomorphology 2005, 69, 191–207. [Google Scholar] [CrossRef]
  41. Kidová, A.; Lehotský, M.; Rusnák, M. Geomorphic Diversity in the Braided-Wandering Belá River, Slovak Carpathians, as a Response to Flood Variability and Environmental Changes. Geomorphology 2016, 272, 137–149. [Google Scholar] [CrossRef]
  42. Belletti, B.; Dufour, S.; Piégay, H. What Is the Relative Effect of Space and Time to Explain the Braided River Width and Island Patterns at a Regional Scale? River Res. Appl. 2015, 31, 1–15. [Google Scholar] [CrossRef]
  43. Bulteau, T.; Batalla, R.J.; Chapron, E.; Valette, P.; Piégay, H. Geomorphic Effects of a Run-of-the-River Dam in a Multi-Driver Context: The Case of the Upper Garonne (Central Pyrenees). Geomorphology 2022, 408, 108243. [Google Scholar] [CrossRef]
  44. Jautzy, T.; Schmitt, L.; Rixhon, G. Historical Geomorphological Adjustments of an Upper Rhine Sub-Tributary over the Two Last Centuries (Bruche River, France). Géomorphologie Relief Process. Environ. 2022, 28, 53–72. [Google Scholar] [CrossRef]
  45. Heckmann, T.; Haas, F.; Abel, J.; Rimböck, A.; Becht, M. Feeding the Hungry River: Fluvial Morphodynamics and the Entrainment of Artificially Inserted Sediment at the Dammed River Isar, Eastern Alps, Germany. Geomorphology 2017, 291, 128–142. [Google Scholar] [CrossRef]
  46. Eschbach, D.; Schmitt, L.; Imfeld, G.; May, J.-H.; Payraudeau, S.; Preusser, F.; Trauerstein, M.; Skupinski, G. Long-Term Temporal Trajectories to Enhance Restoration Efficiency and Sustainability on Large Rivers: An Interdisciplinary Study. Hydrol. Earth Syst. Sci. 2018, 22, 2717–2737. [Google Scholar] [CrossRef]
  47. Alexeevsky, N.I.; Chalov, R.S.; Berkovich, K.M.; Chalov, S.R. Channel Changes in Largest Russian Rivers: Natural and Anthropogenic Effects. Int. J. River Basin Manag. 2013, 11, 175–191. [Google Scholar] [CrossRef]
  48. Spada, D.; Molinari, P.; Bertoldi, W.; Vitti, A.; Zolezzi, G. Multi-Temporal Image Analysis for Fluvial Morphological Characterization with Application to Albanian Rivers. ISPRS Int. J. Geo-Inf. 2018, 7, 314. [Google Scholar] [CrossRef]
  49. Pavlek, K.; Faivre, S. Geomorphological Changes of the Cetina River Channels since the End of the Nineteenth Century, Natural vs Anthropogenic Impacts (the Dinarides, Croatia). Environ. Earth Sci. 2020, 79, 482. [Google Scholar] [CrossRef]
  50. Kiss, T.; Balogh, M.; Fiala, K.; Sipos, G. Morphology of Fluvial Levee Series along a River under Human Influence, Maros River, Hungary. Geomorphology 2018, 303, 309–321. [Google Scholar] [CrossRef]
  51. Kiss, T.; Fiala, K.; Sipos, G. Alterations of Channel Parameters in Response to River Regulation Works since 1840 on the Lower Tisza River (Hungary). Geomorphology 2008, 98, 96–110. [Google Scholar] [CrossRef]
  52. Kiss, T.; Blanka, V. River Channel Response to Climate- and Human-Induced Hydrological Changes: Case Study on the Meandering Hernád River, Hungary. Geomorphology 2012, 175–176, 115–125. [Google Scholar] [CrossRef]
  53. Kiss, T.; Andrási, G. Evolution of the Drava Floodplain in Hungary in the Last 100 Years. In The Drava River; Lóczy, D., Ed.; Springer: Cham, Switzerland, 2019; pp. 157–175. [Google Scholar] [CrossRef]
  54. Amissah, G.J.; Kiss, T.; Fiala, K. Morphological Evolution of the Lower Tisza River (Hungary) in the 20th Century in Response to Human Interventions. Water 2018, 10, 884. [Google Scholar] [CrossRef]
  55. Škarpich, V.; Hradecký, J.; Dušek, R. Complex transformation of the geomorphic regime of channels in the forefield of the Moravskoslezské Beskydy Mts.: Case study of the Morávka River (Czech Republic). CATENA 2013, 111, 25–40. [Google Scholar] [CrossRef]
  56. Hohensinner, S.; Habersack, H.; Jungwirth, M.; Zauner, G. Reconstruction of the Characteristics of a Natural Alluvial River–Floodplain System and Hydromorphological Changes Following Human Modifications: The Danube River (1812–1991). River Res. Appl. 2004, 20, 25–41. [Google Scholar] [CrossRef]
  57. Rădoane, M.; Perșoiu, I.; Chiriloaei, F.; Cristea, I.; Robu, D. Styles of Channel Adjustments in the Last 150 Years. In Landform Dynamics and Evolution in Romania. Springer Geography; Rădoane, M., Vespremeanu-Stroe, A., Eds.; Springer: Cham, Switzerland, 2017; pp. 489–518. [Google Scholar] [CrossRef]
  58. Bălteanu, D.; Jurchescu, M.; Surdeanu, V.; Ionita, I.; Goran, C.; Urdea, P.; Rădoane, M.; Rădoane, N.; Sima, M. Recent Landform Evolution in the Romanian Carpathians and Pericarpathian Regions. In Recent Landform Evolution: The Carpatho-Balkan-Dinaric Region; Lóczy, D., Stankoviansky, M., Kotarba, A., Eds.; Springer: Dordrecht, The Netherlands, 2012; pp. 249–286. [Google Scholar] [CrossRef]
  59. Rădoane, M.; Rădoane, N.; Dumitriu, D. Geomorphological Evolution of Longitudinal River Profiles in the Carpathians. Geomorphology 2003, 50, 293–306. [Google Scholar] [CrossRef]
  60. Dumitriu, D. Flood Events as Geomorphic Thresholds for Channel Bed Level Change. Carpathian J. Earth Environ. Sci. 2021, 16, 77–92. [Google Scholar] [CrossRef]
  61. Ioana-Toroimac, G.; Zaharia, L.; Neculau, G.; Minea, G. Impact of Channel Incision on Floods: A Case Study in The South-Eastern Subcarpathians (Romania). Geogr. Environ. Sustain. 2020, 13, 17–24. [Google Scholar] [CrossRef]
  62. Rădoane, M.; Obreja, F.; Cristea, I.; Mihailă, D. Changes in the Channel-Bed Level of the Eastern Carpathian Rivers: Climatic vs. Human Control over the Last 50 Years. Geomorphology 2013, 193, 91–111. [Google Scholar] [CrossRef]
  63. Rădoane, M.; Rădoane, N.; Cristea, A.; Dinu, O. Contemporary Changes of the Prut River Channel, Romanian Border. Rev. Geomorfol. 2008, 10, 57–71. [Google Scholar]
  64. Rădoane, M.; Pandi, G.; Rădoane, N. Contemporary Bed Elevation Changes from the Eastern Carpathians. Carpathian J. Earth Environ. Sci. 2010, 5, 49–60. [Google Scholar]
  65. Grecu, F.; Ioana-Toroimac, G.; Molin, P.; Dramis, F. River channel dynamics in the contact area between the Romanian Plain and the Curvature Subcarpathians. Rev. Geomorfol. 2014, 16, 5–12. [Google Scholar]
  66. Ioana-Toroimac, G.; Robert, D.; Grecu, F.; Zaharia, L. Evolution 2D de La Bande Active de La Haute Prahova (Roumanie) Durant Les 150 Dernières Années. Géomorphologie Relief Process. Environ. 2010, 16, 275–286. [Google Scholar] [CrossRef]
  67. Grecu, F.; Grigore, Ș.; Ioana-Toroimac, G.; Ghiţă, C. The Dynamics of the Danube Channel over the Last 150 Years (Giurgiu—Călărași Sector. Preliminary Data). In Proceedings of the Romanian Geomorphology Symposium, 33rd edition, Iași, Romania, 11–14 May 2017. [Google Scholar]
  68. Grecu, F.; Zaharia, L.; Ioana-Toroimac, G.; Armaș, I. Floods and Flash-Floods Related to River Channel Dynamics. In Landform Dynamics and Evolution in Romania. Springer Geography; Radoane, M., Vespremeanu-Stroe, A., Eds.; Springer: Cham, Switzerland, 2017; pp. 821–844. [Google Scholar] [CrossRef]
  69. Ioana-Toroimac, G. La Dynamique Hydrogéomorphologique de La Rivière Prahova (Roumanie): Fonctionnement Actuel, Évolution Récente et Conséquences Géographiques. Ph.D. Thesis, University of Bucharest, Bucharest, Romania, 2009. [Google Scholar]
  70. Perşoiu, I.; Rădoane, M. Spatial and Temporal Controls on Historical Channel Responses—Study of an Atypical Case: Someşu Mic River, Romania. Earth Surf. Process Landf. 2011, 36, 1391–1409. [Google Scholar] [CrossRef]
  71. Feier, I.; Rădoane, M. Dinamica în plan orizontal a albiei minore a râului Somesu Mic, înainte de lucrarile hidrotehnice majore (1870–1968). Analele Univ. Stefan Cel Mare Suceava Sect. Geogr. 2007, 16, 5–22. [Google Scholar]
  72. Chiriloaei, F.; Rădoane, M. The Metamorphosis of a Braided River Channel during the Last 100 Years: Moldova River as a Case Study. Rev. Geomorfol. 2015, 17, 19–28. [Google Scholar]
  73. Chiriloaei, F.A. Analiza Cantitativa a Modificarilor Albiei Raului Moldova in Sectorul Extracarpatic. Ph.D. Thesis, “ Al. I. Cuza” University, Iași, Romania, 2012. [Google Scholar]
  74. Perșoiu, I.; Hosu, M. Historical geomorphic analysis of Someșul Mic River (NW Romania) channel spatial and temporal behavior, as a background for the assessment of present day morphological state of the river. Rev. Geomorfol. 2019, 21, 59–76. [Google Scholar] [CrossRef]
  75. Brașovanu, L. Studiu Morfodinamic al Albiei Râului Prahova în Sectoarele Montan și Subcarpatic. Ph.D. Thesis, University of Bucharest, Bucharest, Romania, 2018. [Google Scholar]
  76. Armaș, I.; Gogoașe Nistoran, D.; Osaci-Costache, G.; Brașoveanu, L. Morpho-Dynamic Evolution Patterns of Subcarpathian Prahova River (Romania). CATENA 2013, 100, 83–99. [Google Scholar] [CrossRef]
  77. Grecu, F.; Ioana-Toroimac, G.; Osaci-Costache, G.; Zaharia, L.; Cocoș, O.; Hachemi, K.; Sălăjan, L. Dynamics of Islands and Danube River Channel Along Vedea-Călărași Sector (1856–2019): Hydrogeomorphological Approach. In The Lower Danube River. Earth and Environmental Sciences Library; Negm, A., Zaharia, L., Ioana-Toroimac, G., Eds.; Springer: Cham, Switzerland, 2022; pp. 43–67. [Google Scholar]
  78. Salit, F.; Arnaud-Fassetta, G.; Zaharia, L.; Madelin, M.; Beltrando, G. The influence of river training on channel changes during the 20th century in the Lower Siret River (Romania). Géomorphologie Relief Process. Environ. 2015, 21, 175–188. [Google Scholar] [CrossRef]
  79. Cristea, I. Studiul Geomorfologic al Văii Putna Vrânceană. Ph.D. Thesis, Ștefan cel Mare University, Suceava, Romania, 2011. [Google Scholar]
  80. Buzău-Ialomița Water Basin Administration Flood Risk Management Plan—Updated. Available online: https://inundatii.ro/wp-content/uploads/2022/10/PMRI_actualizat_ciclul-II_ABA-Buzau-Ialomita_versiune-preliminara-1.pdf (accessed on 23 March 2024).
  81. Geological Map of Romania, Sc. 1:200 000; Romanian Geological Institute: Bucharest, Romania, 1968.
  82. Geological Map of Romania, Sc. 1:200 000, Explanatory Note of Târgoviște Map Sheet L-35-XXVI; Romanian Geological Institute: Bucharest, Romania, 1968.
  83. Clima României. Available online: https://www.meteoromania.ro/clima/clima-romaniei/ (accessed on 18 March 2025).
  84. Dumitrescu, A.; Bojariu, R.; Birsan, M.-V.; Marin, L.; Manea, A. Recent Climatic Changes in Romania from Observational Data (1961–2013). Theor. Appl. Climatol. 2015, 122, 111–119. [Google Scholar] [CrossRef]
  85. Murărescu, O.; Bretcan, P. Management of Water Resources in Upper Ialomiţa River Basin (Carpathians, Sub-Carpathians, Romania). In Proceedings of the International Symposium on Water Management and Hydraulic Engineering, Faculty of Civil Engineering, Department of Hydraulics, Hydrology and River Engineering, University of Ss. Cyril and Methodius, Skopje, North Macedonia, 1–5 September 2009. [Google Scholar]
  86. Murătoreanu, G.; Murărescu, O.; Pehoiu, G.; Sencovici, M. GIS multitemporal analysis of remote sensing images to assess the silting of anthropogenic dam lakes in the Outer Subcarpathian area. Case study: Pucioasa Accumulation Lake, Romania. J. Sci. Arts 2021, 21, 1133–1142. [Google Scholar] [CrossRef]
  87. Loghin, V. Modificări antropice în profilul longitudinal al Ialomiței și efecte asupra proceselor de albie (Sectorul Moroeni—Târgoviște). Analele Univ. Valahia Din Târgovişte Ser. Geogr. 1997, 1, 77–84. [Google Scholar]
  88. Activitățile Cartografice și Geodezice Habsburgice în Vechea Românie. Available online: https://geo-spatial.org/vechi/articole/activitatile-cartografice-si-geodezice-habsburgice-in-vechea-romanie (accessed on 13 August 2024).
  89. Timár, G. Habsburg Geodetic and Cartographic Activities in the Old Romania. Stud. şi Cercet. Ser. Geol.-Geogr. 2008, 13, 93–102. [Google Scholar]
  90. Osaci-Costache, G. Cartografie, 2nd ed.; Editura Universitară: Bucharest, Romania, 2008. [Google Scholar]
  91. Planurile Directoare de Tragere. Available online: https://geo-spatial.org/vechi/download/planurile-directoare-de-tragere (accessed on 15 August 2024).
  92. Military Topographic Maps Sc. 1:25.000. Available online: https://www.geomil.ro/Produse/HartiTopografice25GK_35# (accessed on 15 August 2024).
  93. Năstase, A.; Osaci-Costache, G. Topografie-Cartografie, 2nd ed.; Editura Fundaţiei România de Mâine: Bucharest, Romania, 2005. [Google Scholar]
  94. Wallachia—Second Military Survey of the Habsburg Empire|Arcanum Maps. Available online: https://maps.arcanum.com/en/map/secondsurvey-wallachia (accessed on 16 August 2023).
  95. Planurile Directoare de Tragere Download Service. Available online: https://www.geo-spatial.org/vechi/maps/download-planuri-tragere.php (accessed on 7 February 2023).
  96. Color Orthophoto Map Scale 1:5000—Visualization Service. Available online: https://inspire-geoportal.ec.europa.eu/srv/eng/catalog.search#/metadata/1623228948931r5372581473647313 (accessed on 28 October 2024).
  97. Cornes, R.C.; van der Schrier, G.; van den Besselaar, E.J.M.; Jones, P.D. An Ensemble Version of the E-OBS Temperature and Precipitation Data Sets. J. Geophys. Res. Atmos. 2018, 123, 9391–9409. [Google Scholar] [CrossRef]
  98. Dumitrescu, A.; Birsan, M.-V. ROCADA: A Gridded Daily Climatic Dataset over Romania (1961–2013) for Nine Meteorological Variables. Nat. Hazards 2015, 78, 1045–1063. [Google Scholar] [CrossRef]
  99. Thiemig, V.; Gomes, G.N.; Skøien, J.O.; Ziese, M.; Rauthe-Schöch, A.; Rustemeier, E.; Rehfeldt, K.; Walawender, J.P.; Kolbe, C.; Pichon, D.; et al. EMO-5: A High-Resolution Multi-Variable Gridded Meteorological Dataset for Europe. Earth Syst. Sci. Data 2022, 14, 3249–3272. [Google Scholar] [CrossRef]
  100. Hackeloeer, A.; Klasing, K.; Krisp, J.M.; Meng, L. Georeferencing: A Review of Methods and Applications. Ann. GIS 2014, 20, 61–69. [Google Scholar] [CrossRef]
  101. QGIS User Guide—17.3 Georeferencerer. Available online: https://docs.qgis.org/3.34/en/docs/user_manual/working_with_raster/georeferencer.html (accessed on 25 March 2024).
  102. Overview of Georeferencing. Available online: https://pro.arcgis.com/en/pro-app/latest/help/data/imagery/overview-of-georeferencing.htm (accessed on 25 March 2024).
  103. Boothroyd, R.J.; Nones, M.; Guerrero, M. Deriving Planform Morphology and Vegetation Coverage From Remote Sensing to Support River Management Applications. Front. Environ. Sci. 2021, 9, 18. [Google Scholar] [CrossRef]
  104. Rădoane, M.; Perșoiu, I.; Cristea, A.; Chiriloaei, F. River Channel Planform Changes Based on Successive Cartographic Data. A Methodological Approach. Rev. Geomorfol. 2013, 15, 68–88. [Google Scholar]
  105. Nawfee, S.M.; Dewan, A.; Rashid, T. Integrating Subsurface Stratigraphic Records with Satellite Images to Investigate Channel Change and Bar Evolution: A Case Study of the Padma River, Bangladesh. Environ. Earth Sci. 2018, 77, 89. [Google Scholar] [CrossRef]
  106. Leopold, L.B.; Wolman, M.G. River Channel Patterns: Braided, Meandering, and Straight; U.S. Government Printing Office: Washongton, DC, USA, 1957. [Google Scholar] [CrossRef]
  107. Hijmans, R.J. R Package, version 1.6-53; Terra: Spatial Data Analysis; R Core Team: Vienna, Austria, 2023; Available online: https://CRAN.R-project.org/package=terra (accessed on 14 April 2025).
  108. Mann, H.B. Nonparametric Tests Against Trend. Econometrica 1945, 13, 245–259. [Google Scholar] [CrossRef]
  109. Kendall, M.G. Rank Correlation Methods, 4th ed.; Charles Griffin: London, UK, 1975. [Google Scholar]
  110. McLeod, A.I. R Package, version 2.2.1; Kendall: Kendall Rank Correlation and Mann-Kendall Trend Test; R Core Team: Vienna, Austria, 2005; Available online: https://CRAN.R-project.org/package=Kendall (accessed on 14 April 2025).
  111. Killick, R.; Haynes, K.; Eckley, I.A. R Package, version 2.3; Changepoint: An R Package for Changepoint Analysis; R Core Team: Vienna, Austria, 2006; Available online: https://CRAN.R-project.org/package=changepoint (accessed on 15 April 2025).
  112. R Core Team. R: A Language and Environment for Statistical Computing; R Foundation for Statistical Computing: Vienna, Austria, 2022. [Google Scholar]
  113. Rousseeuw, P.J. Silhouettes: A Graphical Aid to the Interpretation and Validation of Cluster Analysis. J. Comput. Appl. Math. 1987, 20, 53–65. [Google Scholar] [CrossRef]
  114. Buffin-Bélanger, T.; Biron, P.M.; Larocque, M.; Demers, S.; Olsen, T.; Choné, G.; Ouellet, M.-A.; Cloutier, C.-A.; Desjarlais, C.; Eyquem, J. Freedom Space for Rivers: An Economically Viable River Management Concept in a Changing Climate. Geomorphology 2015, 251, 137–148. [Google Scholar] [CrossRef]
  115. Manea, A.; Birsan, M.-V.; Tudorache, G.; Cărbunaru, F. Changes in the Type of Precipitation and Associated Cloud Types in Eastern Romania (1961–2008). Atmos. Res. 2016, 169, 357–365. [Google Scholar] [CrossRef]
  116. Busuioc, A.; Birsan, M.; Carbunaru, D.; Baciu, M.; Orzan, A. Changes in the Large-scale Thermodynamic Instability and Connection with Rain Shower Frequency over Romania: Verification of the Clausius–Clapeyron Scaling. Int. J. Climatol. 2016, 36, 2015–2034. [Google Scholar] [CrossRef]
Figure 1. Location of the study area within (a) Romania, (b) Ialomița catchment, and (c) the hydrographic basin.
Water 17 02151 g001
Figure 2. Flowchart of the study.
Water 17 02151 g002
Figure 3. Sector delineation procedure.
Water 17 02151 g003
Figure 4. Geomorphometric parameters and indices measurement: (a) sinuosity index (SI), defined as the ratio between channel length (CL) and valley length (VL); (b) main channel width (MCW); (c) wetted channel width (WCW) and area (WCA); (d) bankfull channel width (BCW) and area (BCA); (e) active channel width (ACW) and area (ACA); (f) number of channels (NC). The green dashed line represents the transect. The riverbeds in the images represent the area contained in a sector.
Water 17 02151 g004
Figure 5. Automated model for parameters and indices calculation.
Water 17 02151 g005
Figure 6. Evolution of parameters calculated for the entire studied river reach: (a) sinuosity index; (b) comparative view of wetted channel, fluvial, and active band areas.
Water 17 02151 g006
Figure 7. Evolution of parameters and indices calculated for the studied river reach: (a) Sinuosity index—SI, (b) Number of river channels—NC, (c) Main channel width—MCW, (d) Wetted channel width—WCW, (e) Bankfull channel width—BCW, (f) Active channel width—ACW, (g) Wetted channel area—WCA, (h) Bankfull channel area—BCA, (i) Active channel area—ACA. The box shows the first quartile (Q1) and the third quartile (Q3), the black horizontal line is the median value, the red square shows the mean value, and the red dotted line shows the mean values evolution.
Water 17 02151 g007
Figure 8. Evolution of riverbed migration distance (a) for the entire time span of the study and (b) between successive time periods.
Water 17 02151 g008
Figure 9. Dendrogram of the HCA applied on river sector data. Red rectangles represent the clusters. The number is the name of the cluster.
Water 17 02151 g009
Figure 10. Spatial distribution on riverbed sector clusters.
Water 17 02151 g010
Figure 11. Yearly precipitation evolution within the study area between 1950 and 2022.
Water 17 02151 g011
Figure 12. Yearly temperature evolution within the study area between 1950 and 2022.
Water 17 02151 g012
Figure 13. Mean (a), maximum (b), and (c) minimum annual discharge variability of the Ialomița River at the Băleni hydrometric station between 1961 and 2022.
Water 17 02151 g013
Figure 14. Annual suspended sediment discharge variability of the Ialomița River at the Băleni hydrometric station between 1961 and 2022.
Water 17 02151 g014
Figure 15. Spatial distribution and temporal evolution of gravel pits on studied river reach.
Water 17 02151 g015
Figure 16. Observed riverbed incision and its impact on bridge structures along the studied Ialomița River reach. The images are ordered from north to south as follows: (a) bridge pier erosion near Fieni; (bd) very intense riverbed incision in the Subcarpathian zone south to Pucioasa; (e) incision affecting 2 of 3 bridge piers on DC136B road near Brănești; (f) incision in the exploitation area of a former gravel pit (GP2 in Figure 15); (g) intense incision at bridge pier on DJ711B road at Băleni; (h) incision of over 1 m (length of the white ruler) at the base of the pillar. The riverbed has silted up due to the ongoing dredging of Lake Pucioasa.
Water 17 02151 g016
Figure 17. Linear models of parameters and indices versus time calculated for the studied river reach: (a) Sinuosity index—SI, (b) Number of river channels—NC, (c) Main channel width—MCW, (d) Wetted channel width—WCW, (e) Bankfull channel width—BCW, (f) Active channel width—ACW, (g) Wetted channel area—WCA, (h) Bankfull channel area—BCA, (i) Active channel area—ACA. The orange points are mean values, the blue triangles median values, and the dashed lines linear trendlines.
Water 17 02151 g017
Table 1. Technical characterisation of the dams and associated reservoirs.
Dam/Lake NameConstruction PeriodPut into ServiceDam Height (m)Total Volume of Water (mil. m3)Reservoir Use 1
Bolboci1976–198519885519.4W, H, F, O
Scropoasa1928–19301930260.55H
Dobrești1928–19301930100.04H
Pucioasa-197530.510.6W, H, F, O
Note(s): 1 W—water supply, H—hydro energy, F—flood defence, O—other uses.
Table 2. Topographic maps sheets used in the study.
Map NameNo. of Map SheetsMap Sheets NomenclatureSource
Wallachia—Second military survey of the Habsburg Empire3Section 25.26, East Column V.VI; Section 27.28, East Column V.VI; Section 27.28, East Column VII.VIIIAustrian State Archives through the Arcanum platform: https://maps.arcanum.com/en/map/secondsurvey-wallachia (accessed on 16 August 2023). [94]
“Plan Director de Tragere”93850-Voinești, 3849-Dragomirești, 3951-Fieni, 3950-Glodeni, 3949-Târgoviște, 3948-Văcărești, 4049-Ghirdoveni, 4048-Bucșani, and 4047-CornățelulGeospatial community, available online at https://www.geo-spatial.org/vechi/maps/download-planuri-tragere.php (accessed on 15 August 2024). [95]
Romanian Military Topographic Maps—1st ed.L-35-099-D-b, L-35-099-D-d, L-35-11-B-b, L-35-111-B-d, L-35-112-A-a, L-35-112-A-c, L-35-112-A-d, L-35-112-C-b, L-35-112-D-aThe Defence Geospatial Intelligence Agency “Division General Constantin Barozzi”
Romanian Military Topographic Maps—2nd ed.University of Bucharest, Faculty of Geography
Table 3. Climatic data used in the study.
Climatic Data SourceSpatial ResolutionDataset Time Interval Selected Time IntervalStations in Romania
Prec.Temp.
ECAD0.1°1950–20241950–19602926
ROCADA0.1°1961–20131961–2013188150
EMO-10.01667°1990–20222014–2022Include data from ECAD and other European databases
Table 4. Georeferencing parameters for the topographic maps.
Map NameGeoreferencing
Algorithm
Total
GCPs
RMSE
(Mean)
Wallachia—Second military survey of the Habsburg EmpireThin Plate Spline (TPS)980.0020
“Plan Director de Tragere”1150.00041
Romanian Military Topographic Maps—1st ed.Projective510.49
Romanian Military Topographic Maps—2nd ed.Already georeferenced
Table 5. Geomorphometric parameters and indices assessed in the study.
Parameter/IndexAbbreviationMethod 1, 2Measure Unit
Channel lengthCLSm
Sinuosity IndexSISdimensionless
Thalweg migrationTMTm
Wetted channel widthWCWTm
Bankfull channel widthBCWTm
Main channel widthMCWTm
Active channel widthACWTm
Number of channelsNCTdimensionless
Wetted channel areaWCASkm2
Bankfull channel areaBCASkm2
Active channel areaACASkm2
Note(s): 1 S—sector, 2 T—transect.
Table 6. Yearly rate of change (%) in calculated parameters.
Index/Parameters1856–19021903–19571958–19781988–20052006–20211856–2021
SI+0.08−0.07−0.03+0.02−0.08−0.02
WCA−0.49+0.74+1.26−1.91−1.66−0.23
BCA−0.90−0.15+0.52−2.49−2.31−2.23
ACA−0.09−0.63+0.57−1.92−2.62−1.57
Disclaimer/Publisher’s Note: The statements, opinions and data contained in all publications are solely those of the individual author(s) and contributor(s) and not of MDPI and/or the editor(s). MDPI and/or the editor(s) disclaim responsibility for any injury to people or property resulting from any ideas, methods, instructions or products referred to in the content.

