4.1. Inverse Hydrogeological Water Balance
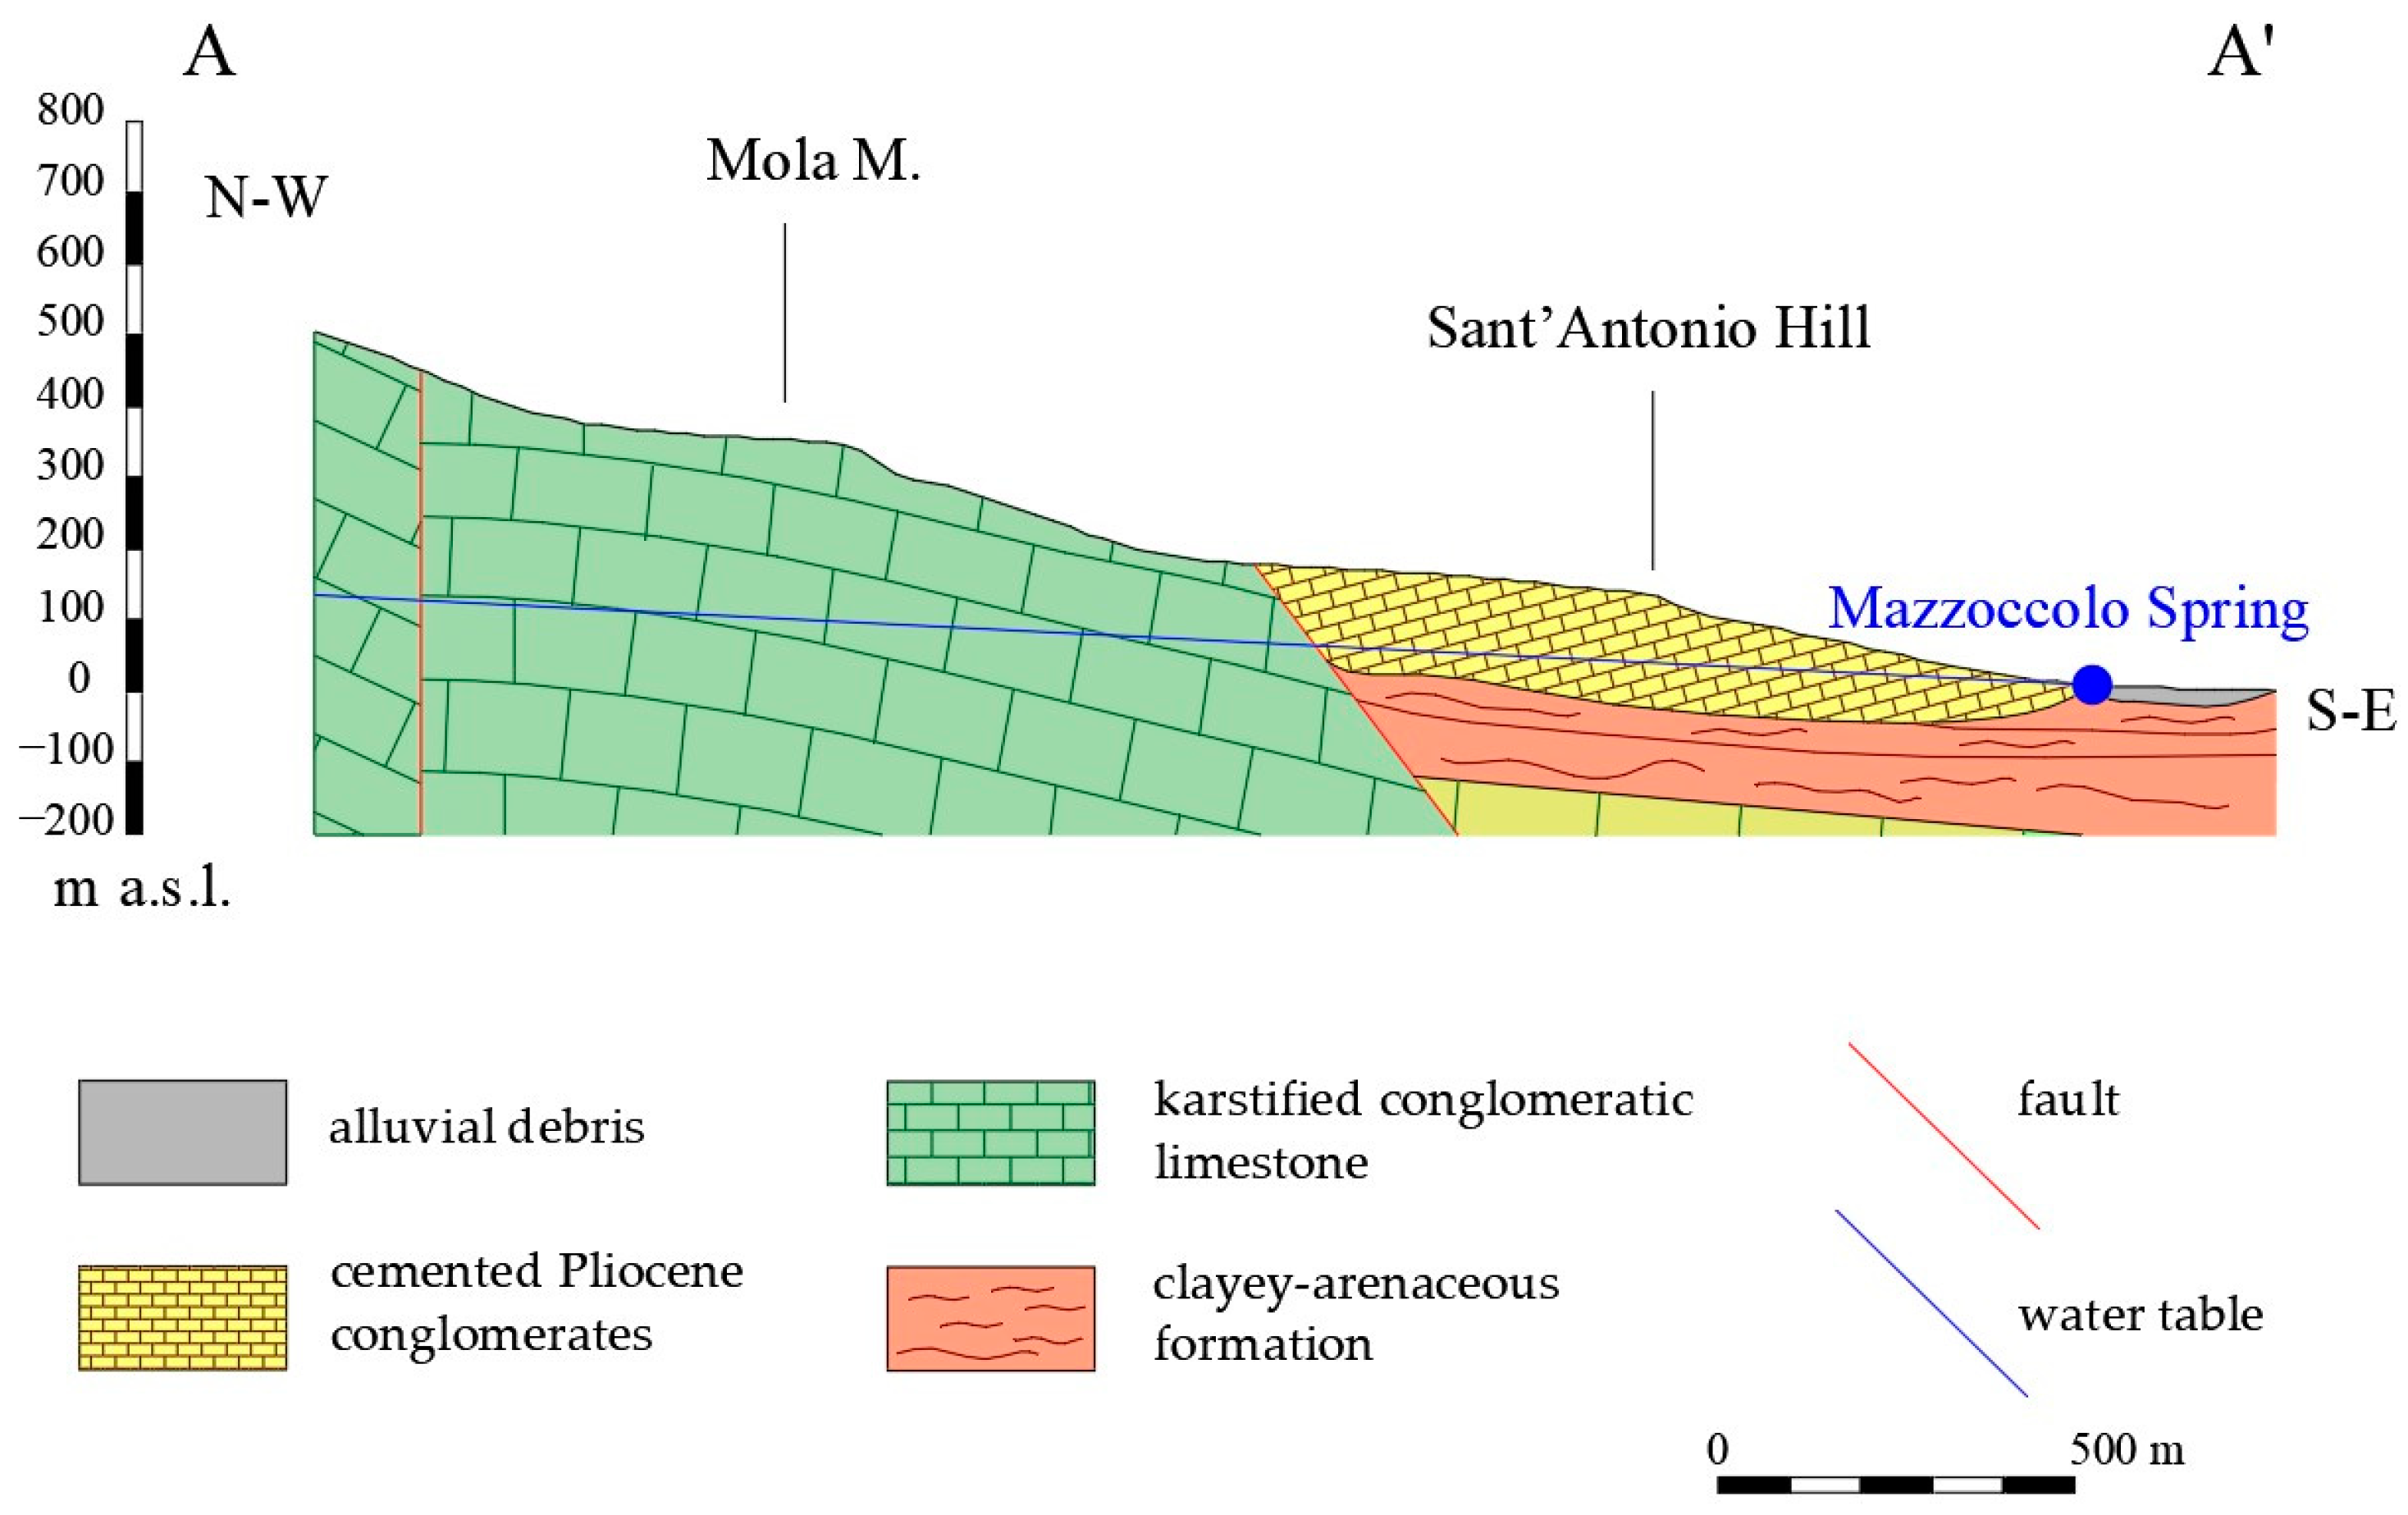
The hydrogeological basin of the Mazzoccolo Spring, covering approximately 31 km2, lies within the Aurunci Mountains, part of the larger Volsci carbonate platform. The spring is fed by a highly permeable karst limestone aquifer, underlain by nearly impermeable dolomites. This setting allows for significant groundwater storage and flow, with the spring also receiving rapid inputs through fractures and karst conduits.
The groundwater recharge has been assessed by the application of the inverse hydrogeological water balance, which is a spatial spread data method for the evaluation of aquifer recharge. The inverse hydrogeological water balance [
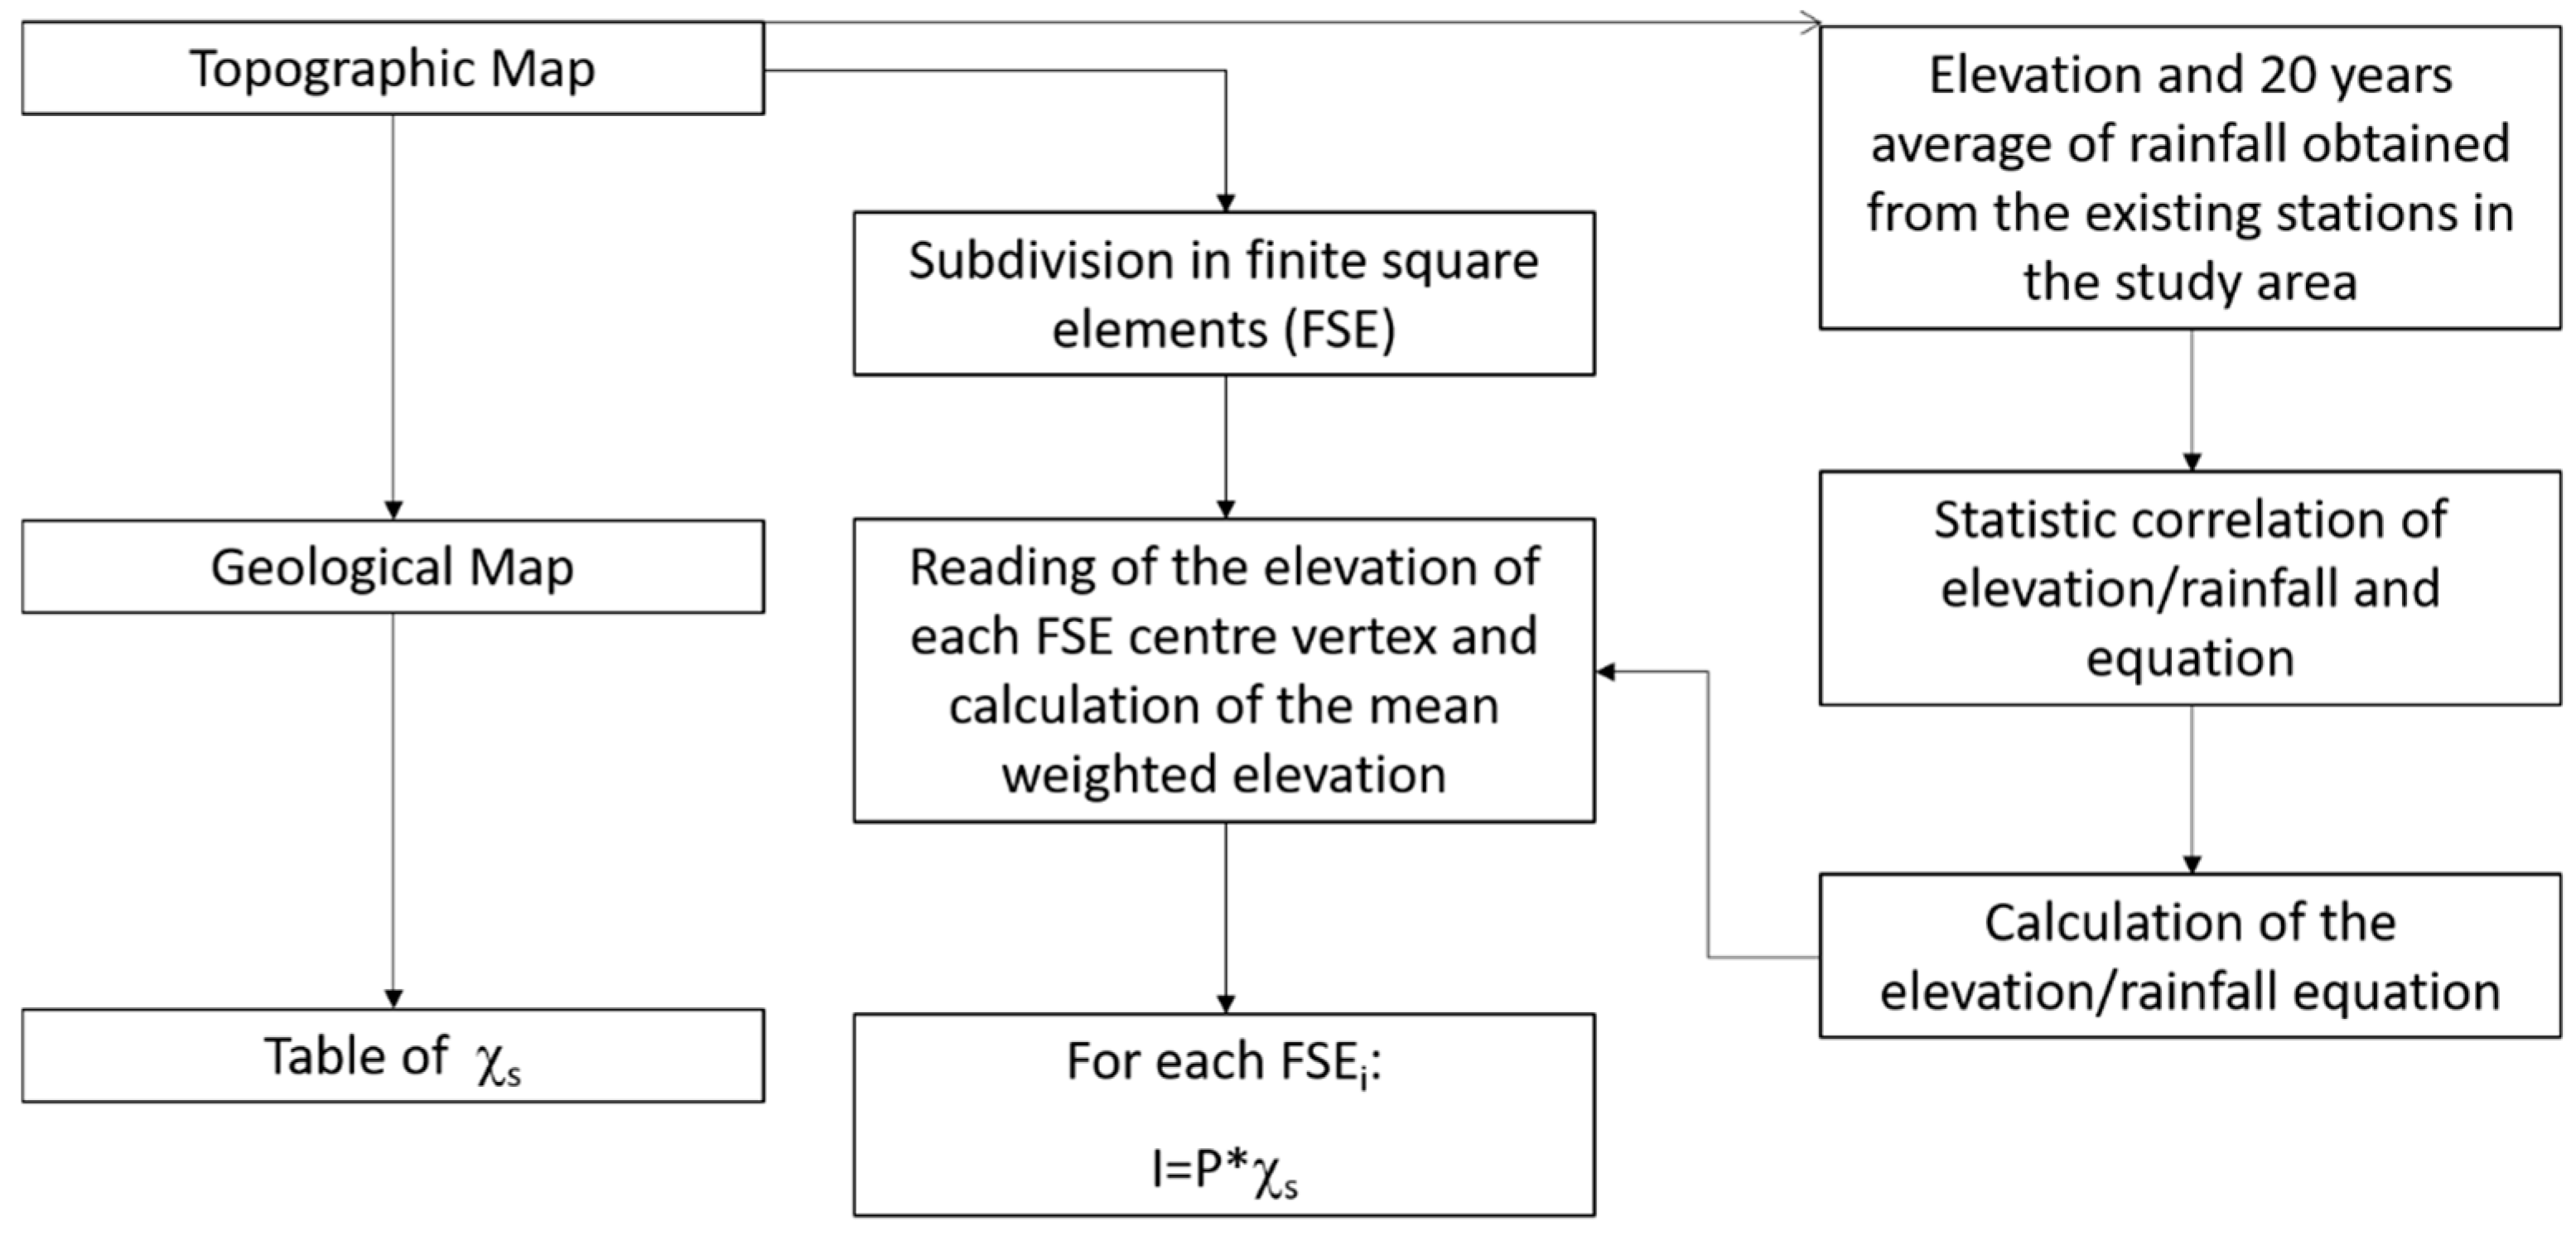
21] was applied to estimate the average annual active recharge (i.e., the effective infiltration—I) for the Mazzoccolo Spring hydrogeological basin, by a GIS support (QGIS Desktop, release 3.36). The application of this method involves a series of steps which are presented in the flowchart of
Figure 4 [
21].
As a matter of fact, starting from the Latium Region digital elevation model (DEM), the area under study has been divided in finite square elements (FSE) of 10,000 m2, and it has been obtained the discretization of the area, as asked by the applied method.
In the present study, for the evaluation of the Mazzoccolo Spring groundwater recharge, they have been considered the available rainfall data coming from 20 years of measurements, collected in three meteorological stations of the Latium Region Integrated Agrometeorological Service Network: Formia (LT01SIE), Fondi (LT08SIE), and Esperia (FR04SPE).
Annual Average Precipitation (AAP) has been calculated for each rainfall station, referred to the historical series 2004–2023, and a rainfall–altitude relationship, shown in
Figure 5, has been built. While the rainfall–elevation relationship is typically linear, for mountainous basins like this one, logarithmic or exponential relationships more accurately reflect actual conditions [
22]. This is especially true when the elevations of available meteorological stations are much lower than the basin average ones and an extrapolation from data range is necessary [
23] (
Figure 5). Choosing a linear relationship in these conditions leads to an overestimation of the average annual rainfall.
As a matter of fact, according to this relationship, it has been possible to set up the following expression, which allows to have a rainfall value for any altitude:
where AAP is the average annual precipitation, given in mm, and Q is the elevation, given in m a.s.l.
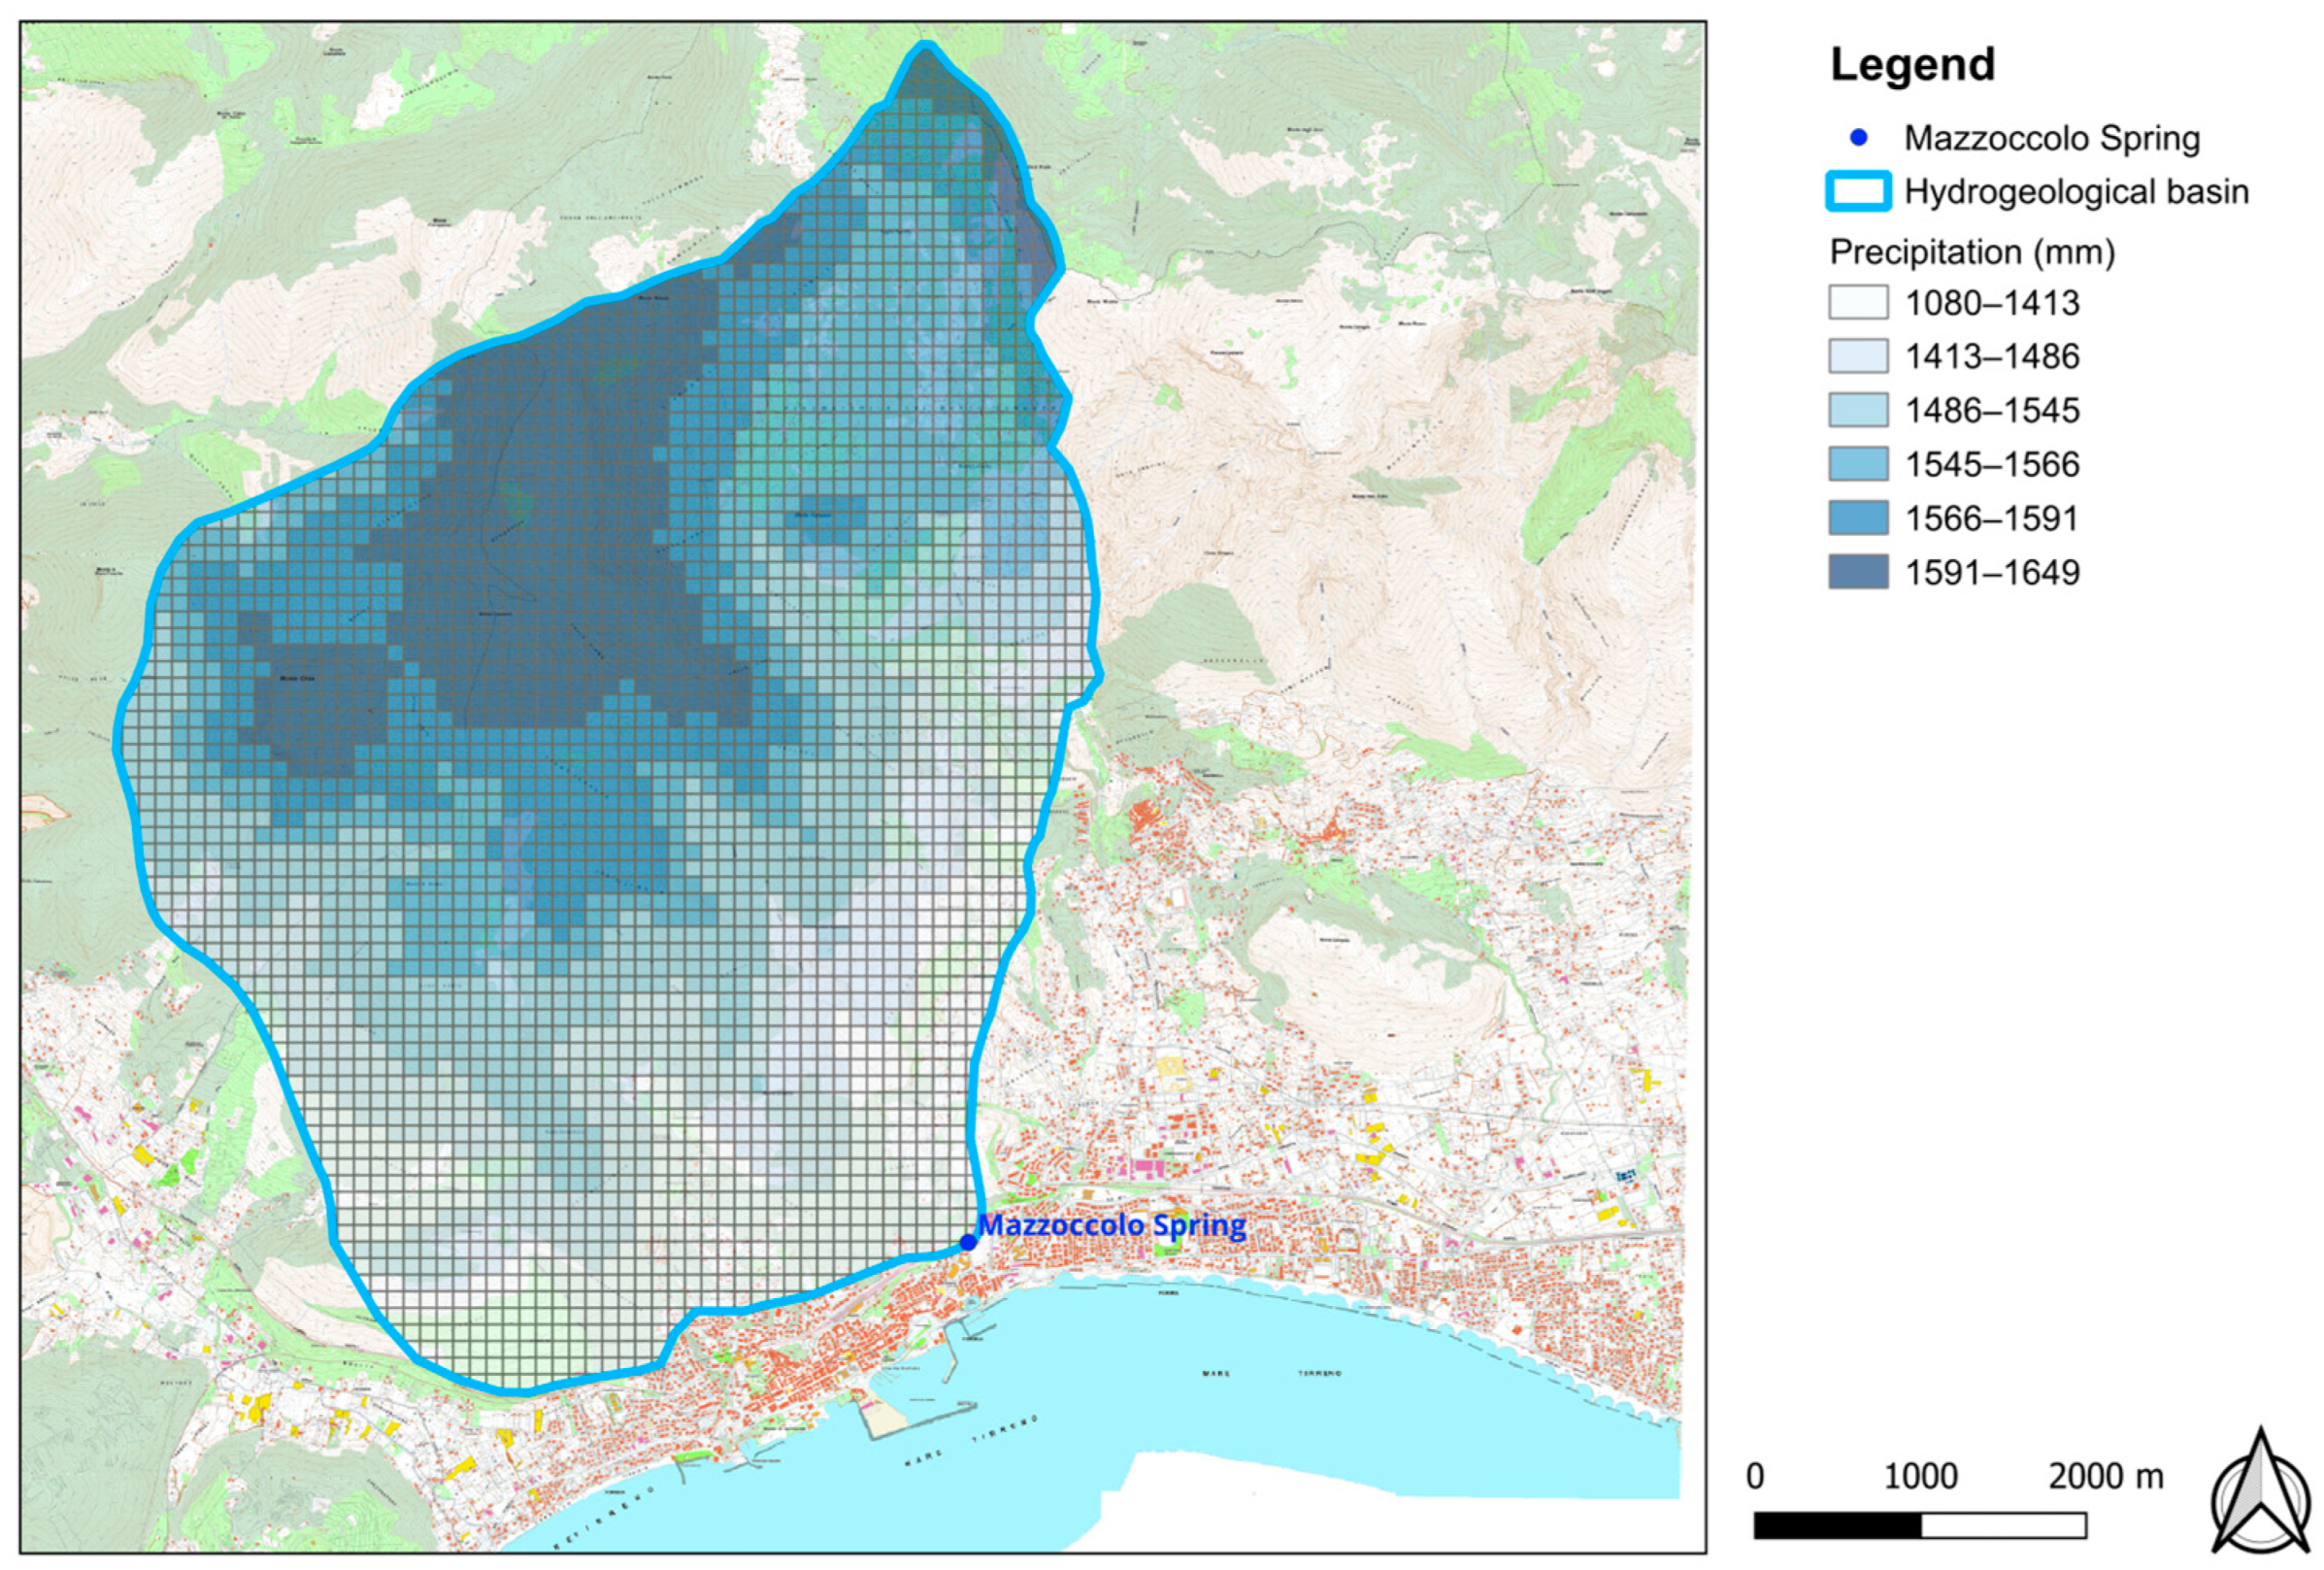
This elaboration drove to have an estimation of rainfall distribution, all over the area under study, as it is represented in
Figure 6, which highlights that inside the hydrogeological basin, the Average Annual Precipitation, between 2004 and 2023, has a maximum value of about 1649 mm at the highest elevations, in the northernmost sector of the aquifer and a minimum value of about 1080 mm in the southern part of it.
The relationship described above, valid for the whole basin, has been used to evaluate the average annual infiltration rate, given in millimeters, for each FSE of the discretization grid in the study area. The next step has been made by the match between rainfall estimation and hydrogeological properties of outcropping rock masses. The Mazzoccolo Spring basin outcropping rocks include the following formations (
Table 1), which have been assigned an average potential infiltration factor (χ
s) value as represented in
Table 1.
The value of the effective infiltration to assign to each cell is a linear function of the rainfall, whose distribution of the average annual pluviometric modulus has been calculated, applying the previously described function, related to altitude data. As a matter of fact, the effective infiltration (Ieff) has been calculated starting from rainfall (P) values and using the formula:
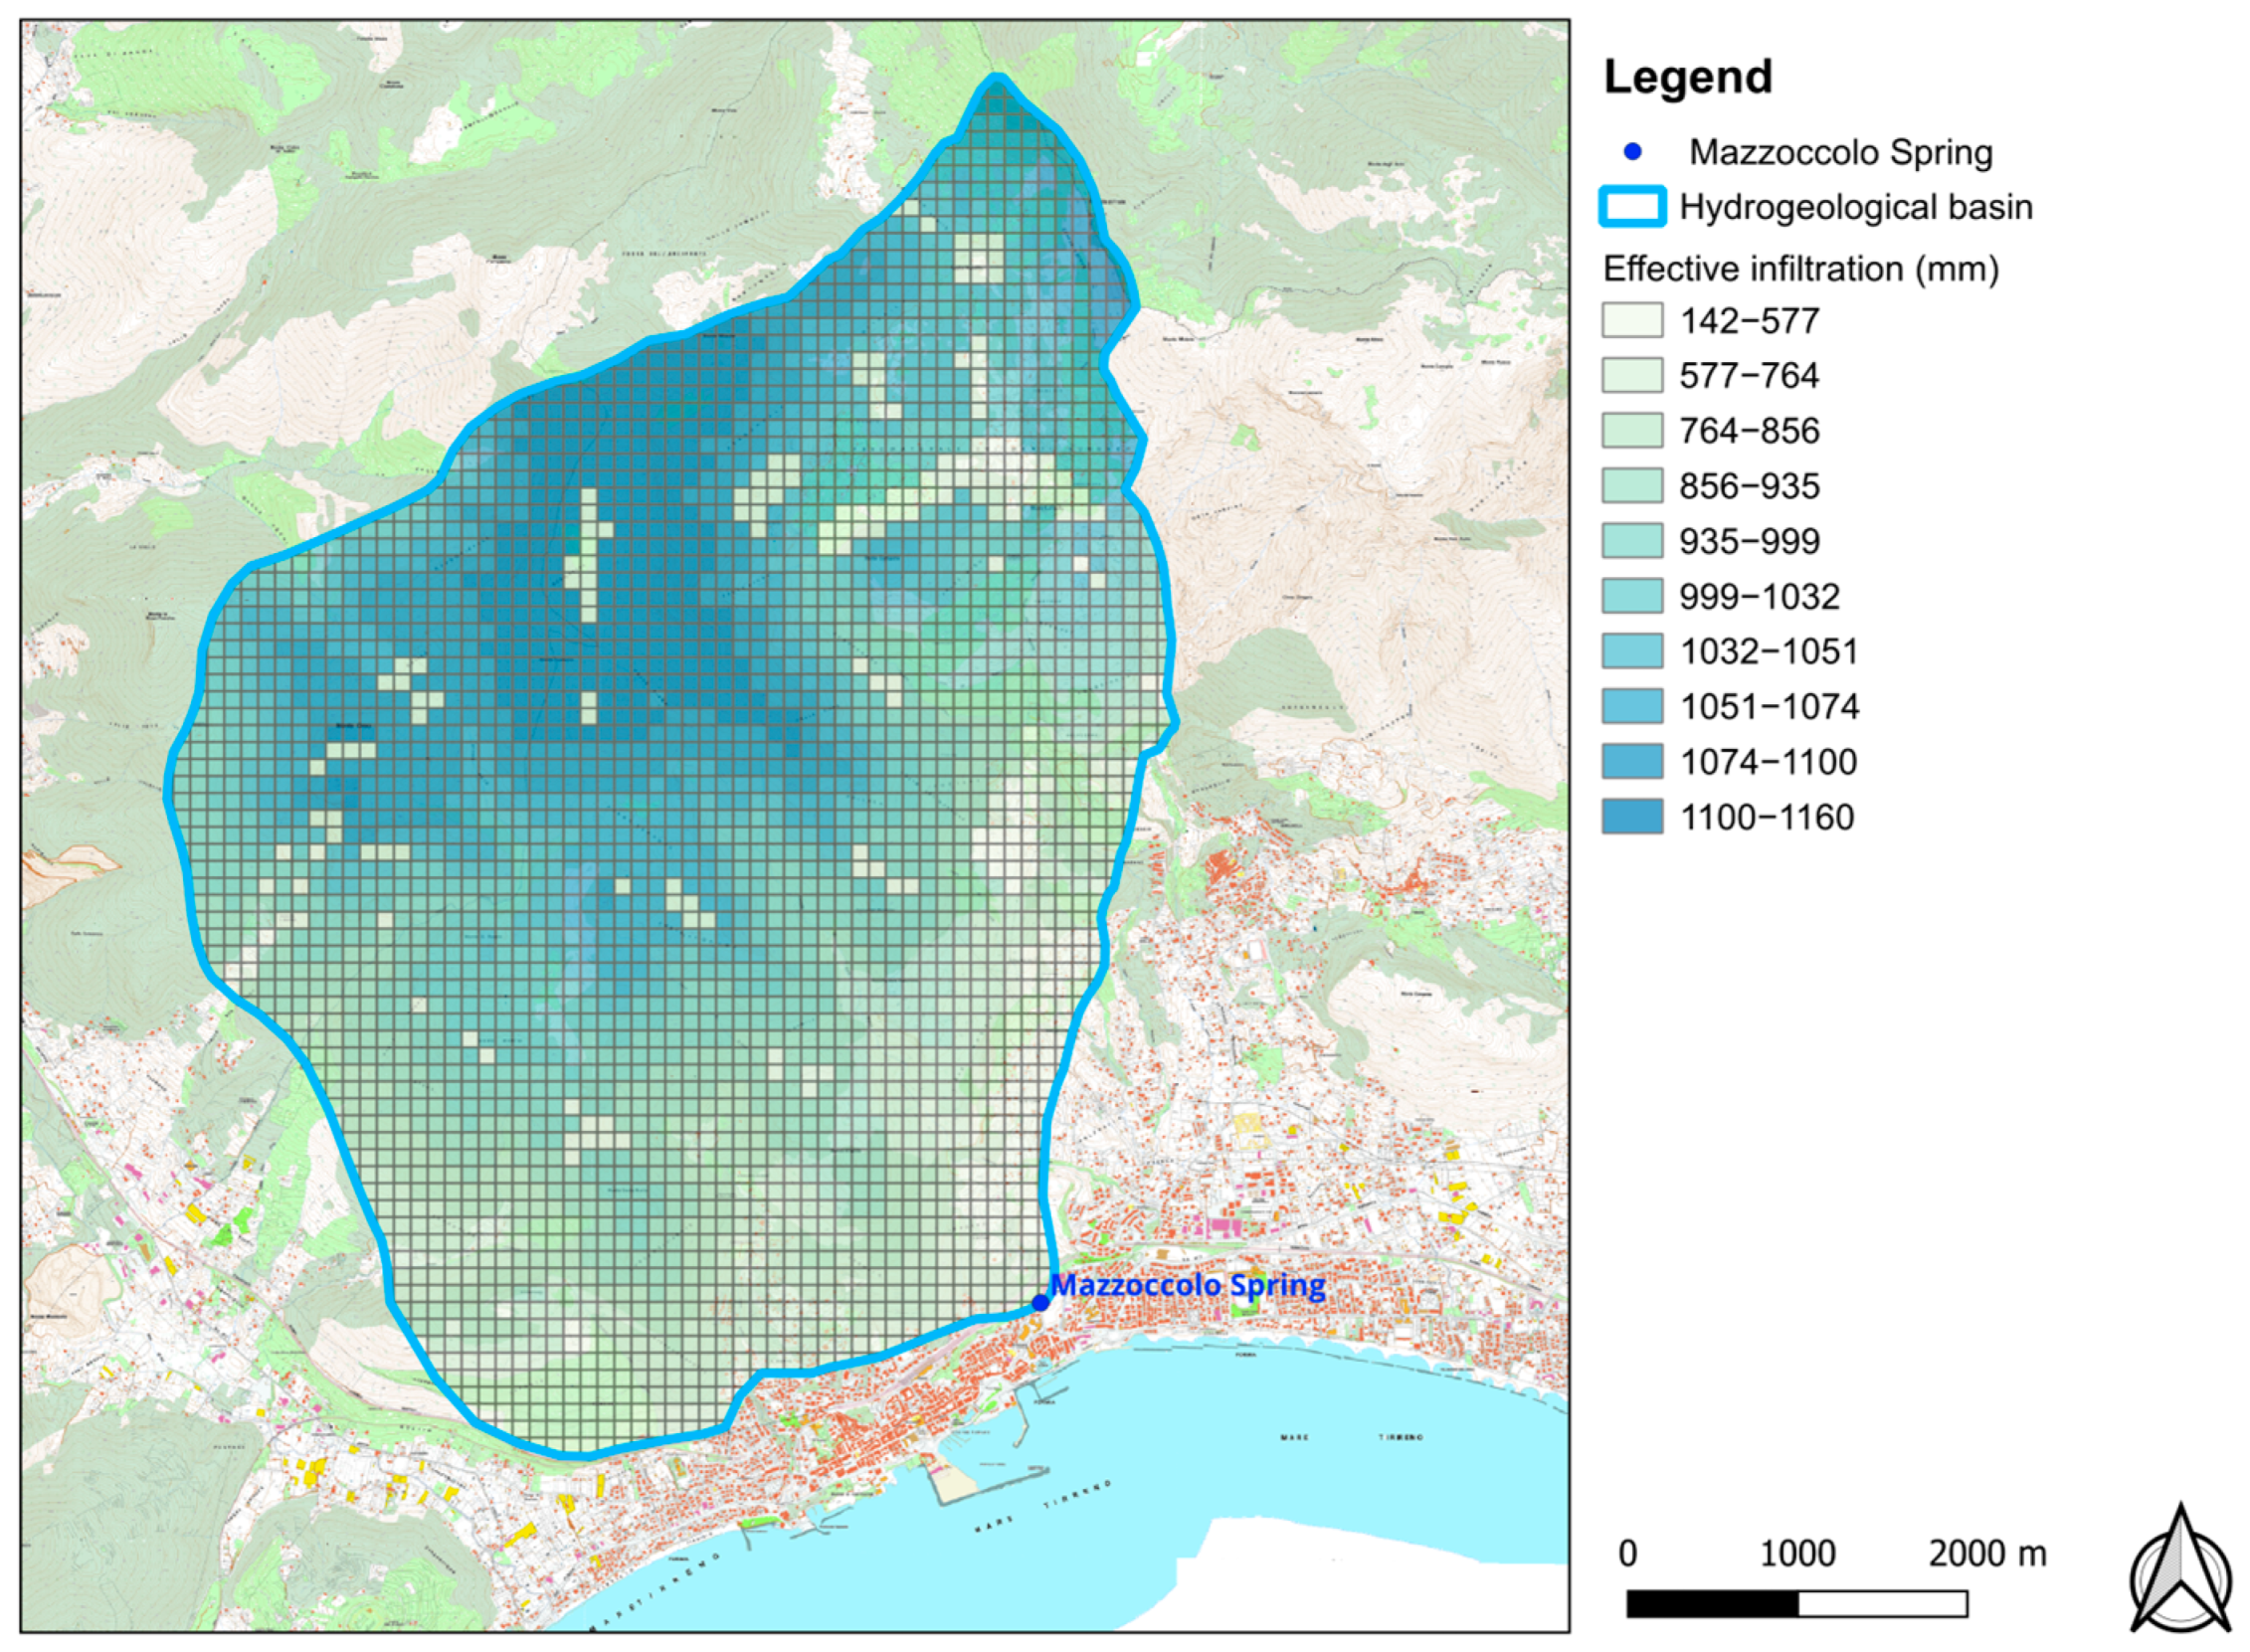
The applied methodology led to the determination of the average annual infiltration rate, given in millimeters, for each FSE of the discretization grid in the study area. These elaborations led to a spatial distribution map of infiltration represented in
Figure 7.
The main recharge areas are located at higher elevations in the northern part of the basin (
Figure 7), and the application of the method shows the importance of the aquifer feeding the Mazzoccolo Spring as a key water resource for the southern Latium with an amount of groundwater active recharge of about 28 Mm
3/year, averaged in 20 years of observations (2004–2023).
4.2. Spring Quantitaive Charaterizazion
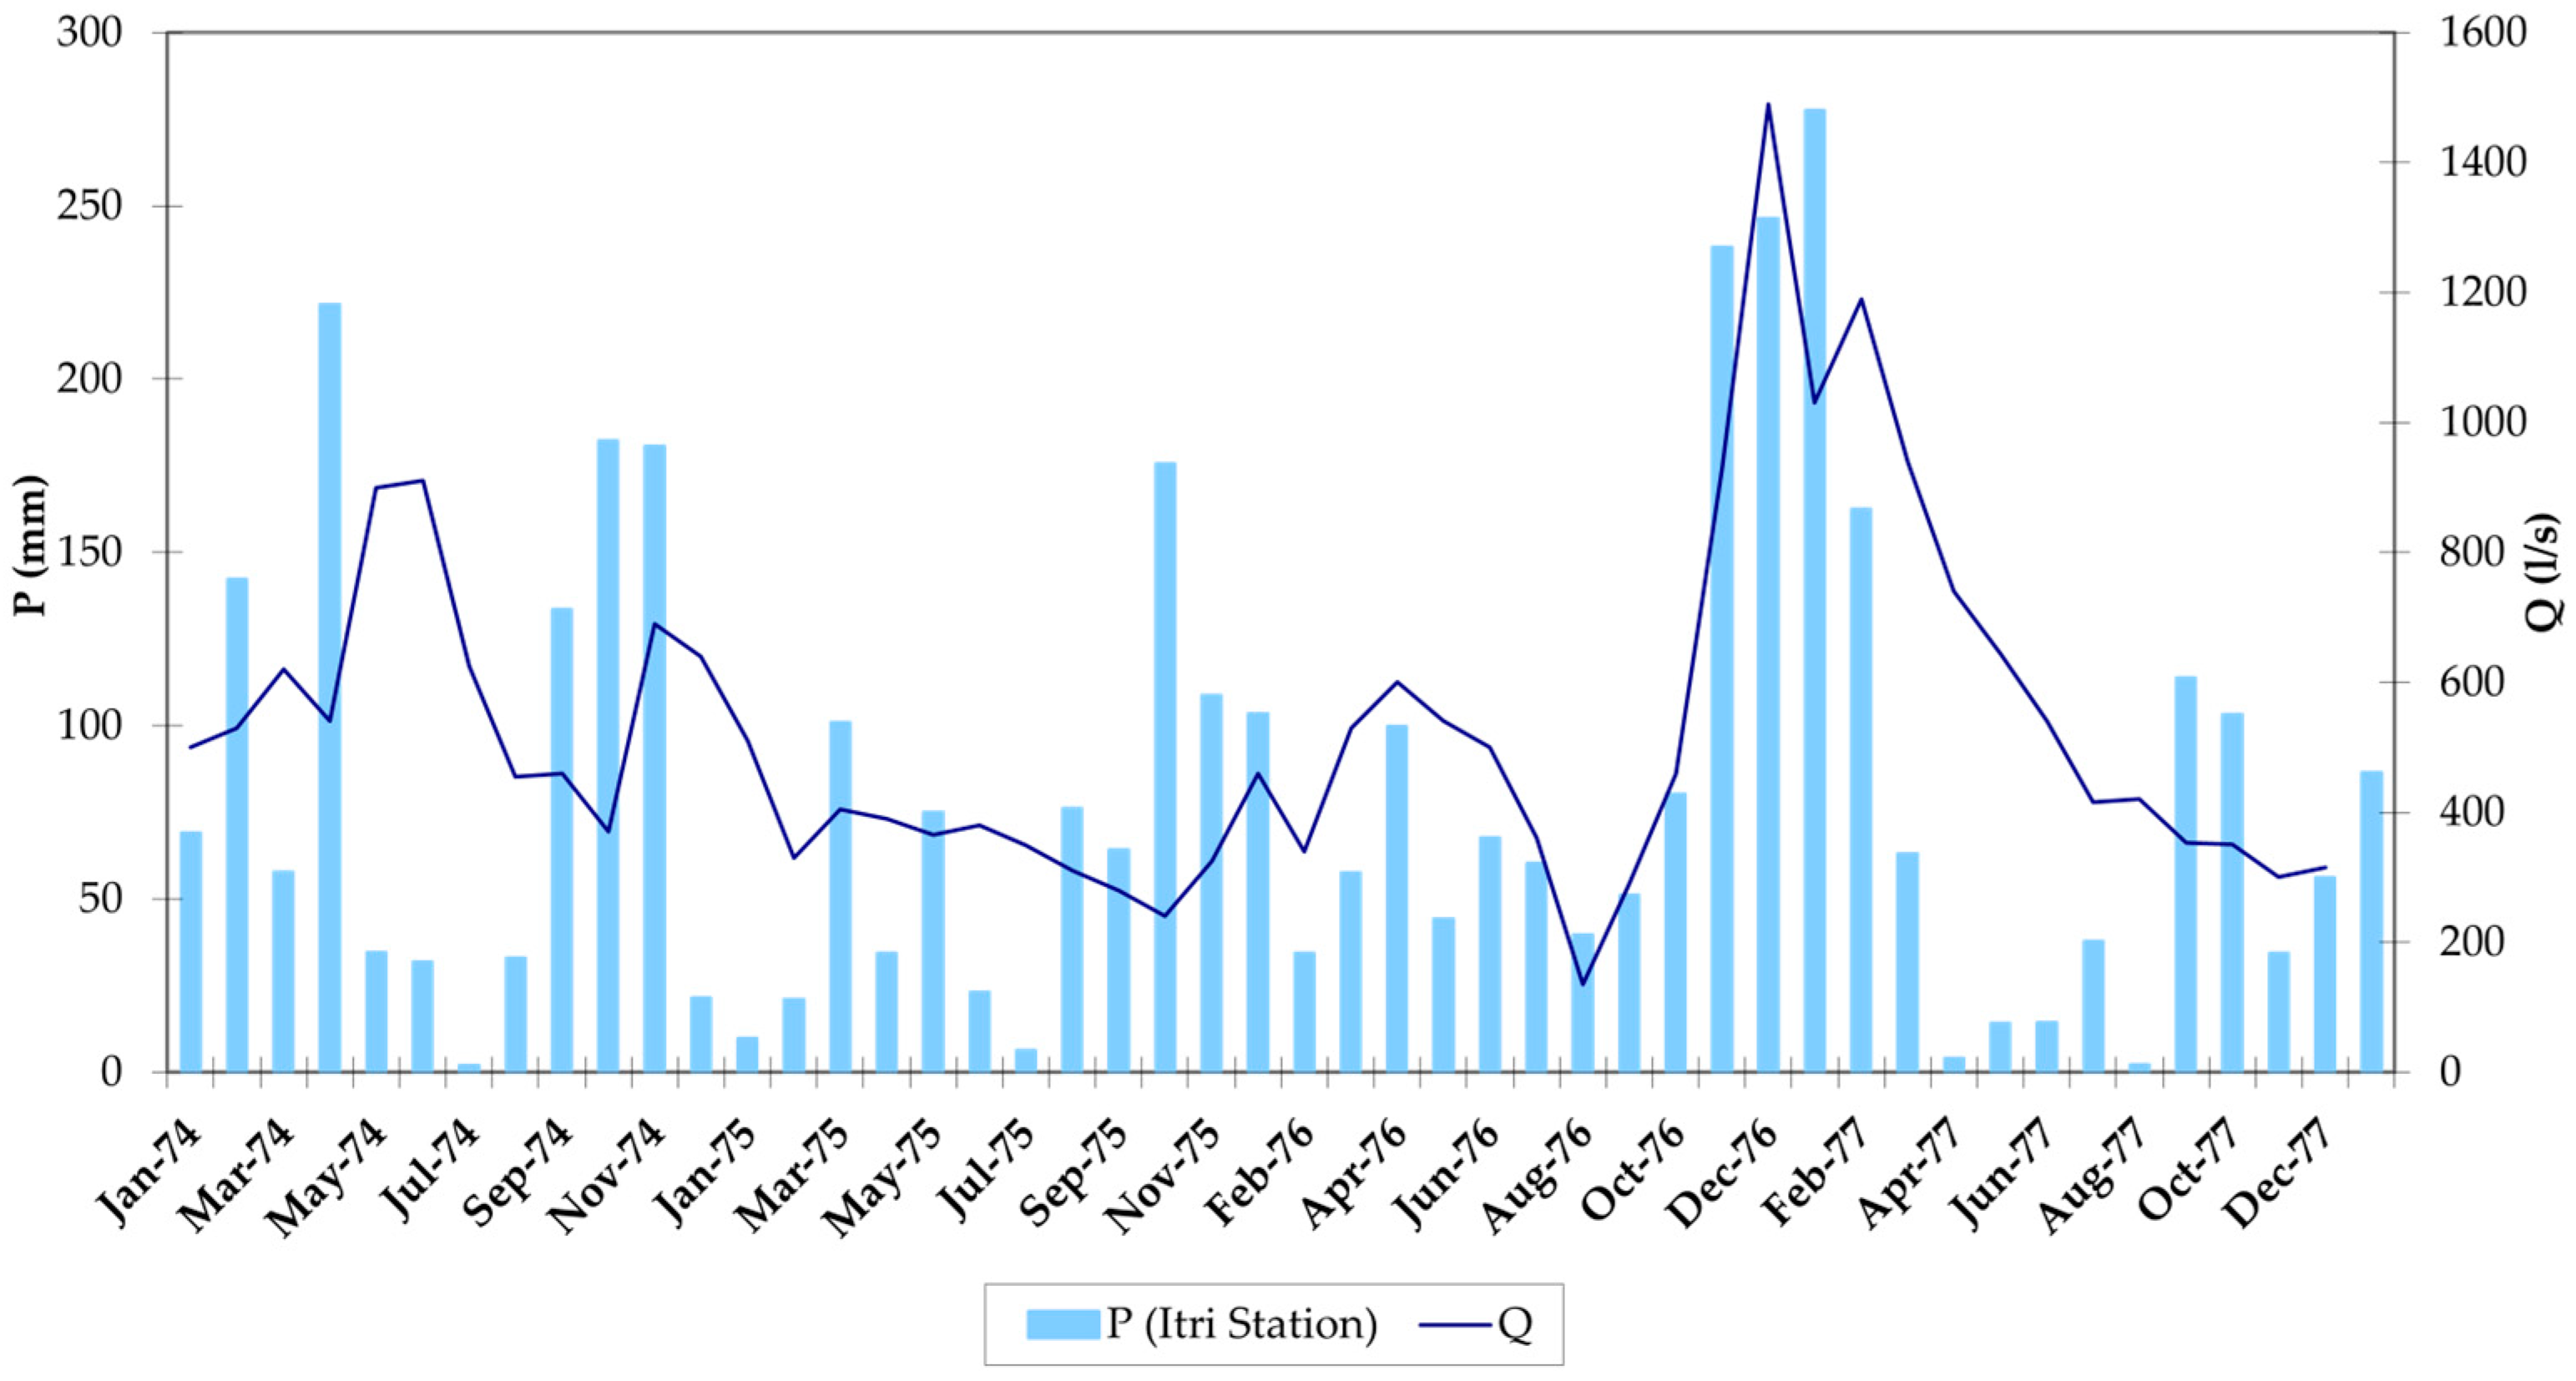
Figure 8 shows the flow rate trends from January 1974 to December 1977, compared with rainfall observations recorded at the Itri station, which provides the only historical data available on the discharge rates of the Mazzoccolo Spring, dating back to the PS29 studies (Special Project 29) carried out by the Cassa per il Mezzogiorno in the 1970s. The data clearly indicate a highly variable flow regime, characterized by sudden and short-lived peaks, which may coincide with episodes of water turbidity. Notably, there appears to be an average time lag of approximately one month between rainfall events and the corresponding discharge response at the spring.
In order to update the flow rate estimates of the Mazzoccolo Spring, a statistical forecasting model has recently been applied. This model, developed by the authors as part of ongoing research activities in collaboration with the research group [
24], was necessitated by the lack of discharge measurements following the studies carried out by the Cassa per il Mezzogiorno. Since then, the volumes captured and delivered to the network have only been measured, due also to the practical challenges of installing an effective system for monitoring the natural discharge of the Mazzoccolo Spring.
The forecasting model relies on statistical correlations between the time series of monthly discharge values and monthly rainfall data, over a minimum reference period of two years. These correlations are performed retrospectively to determine the influence of rainfall in the preceding months on the discharge value of a given month. This approach allows for a predictive estimate of the discharge rate, calculated as the sum of various contributions, each multiplied by an amplification coefficient that is specific to the spring. More specifically, each contribution is defined as the rainfall amount for the i-th month (typically ranging from the current month to six months prior), multiplied by a coefficient derived from the earlier statistical correlations.
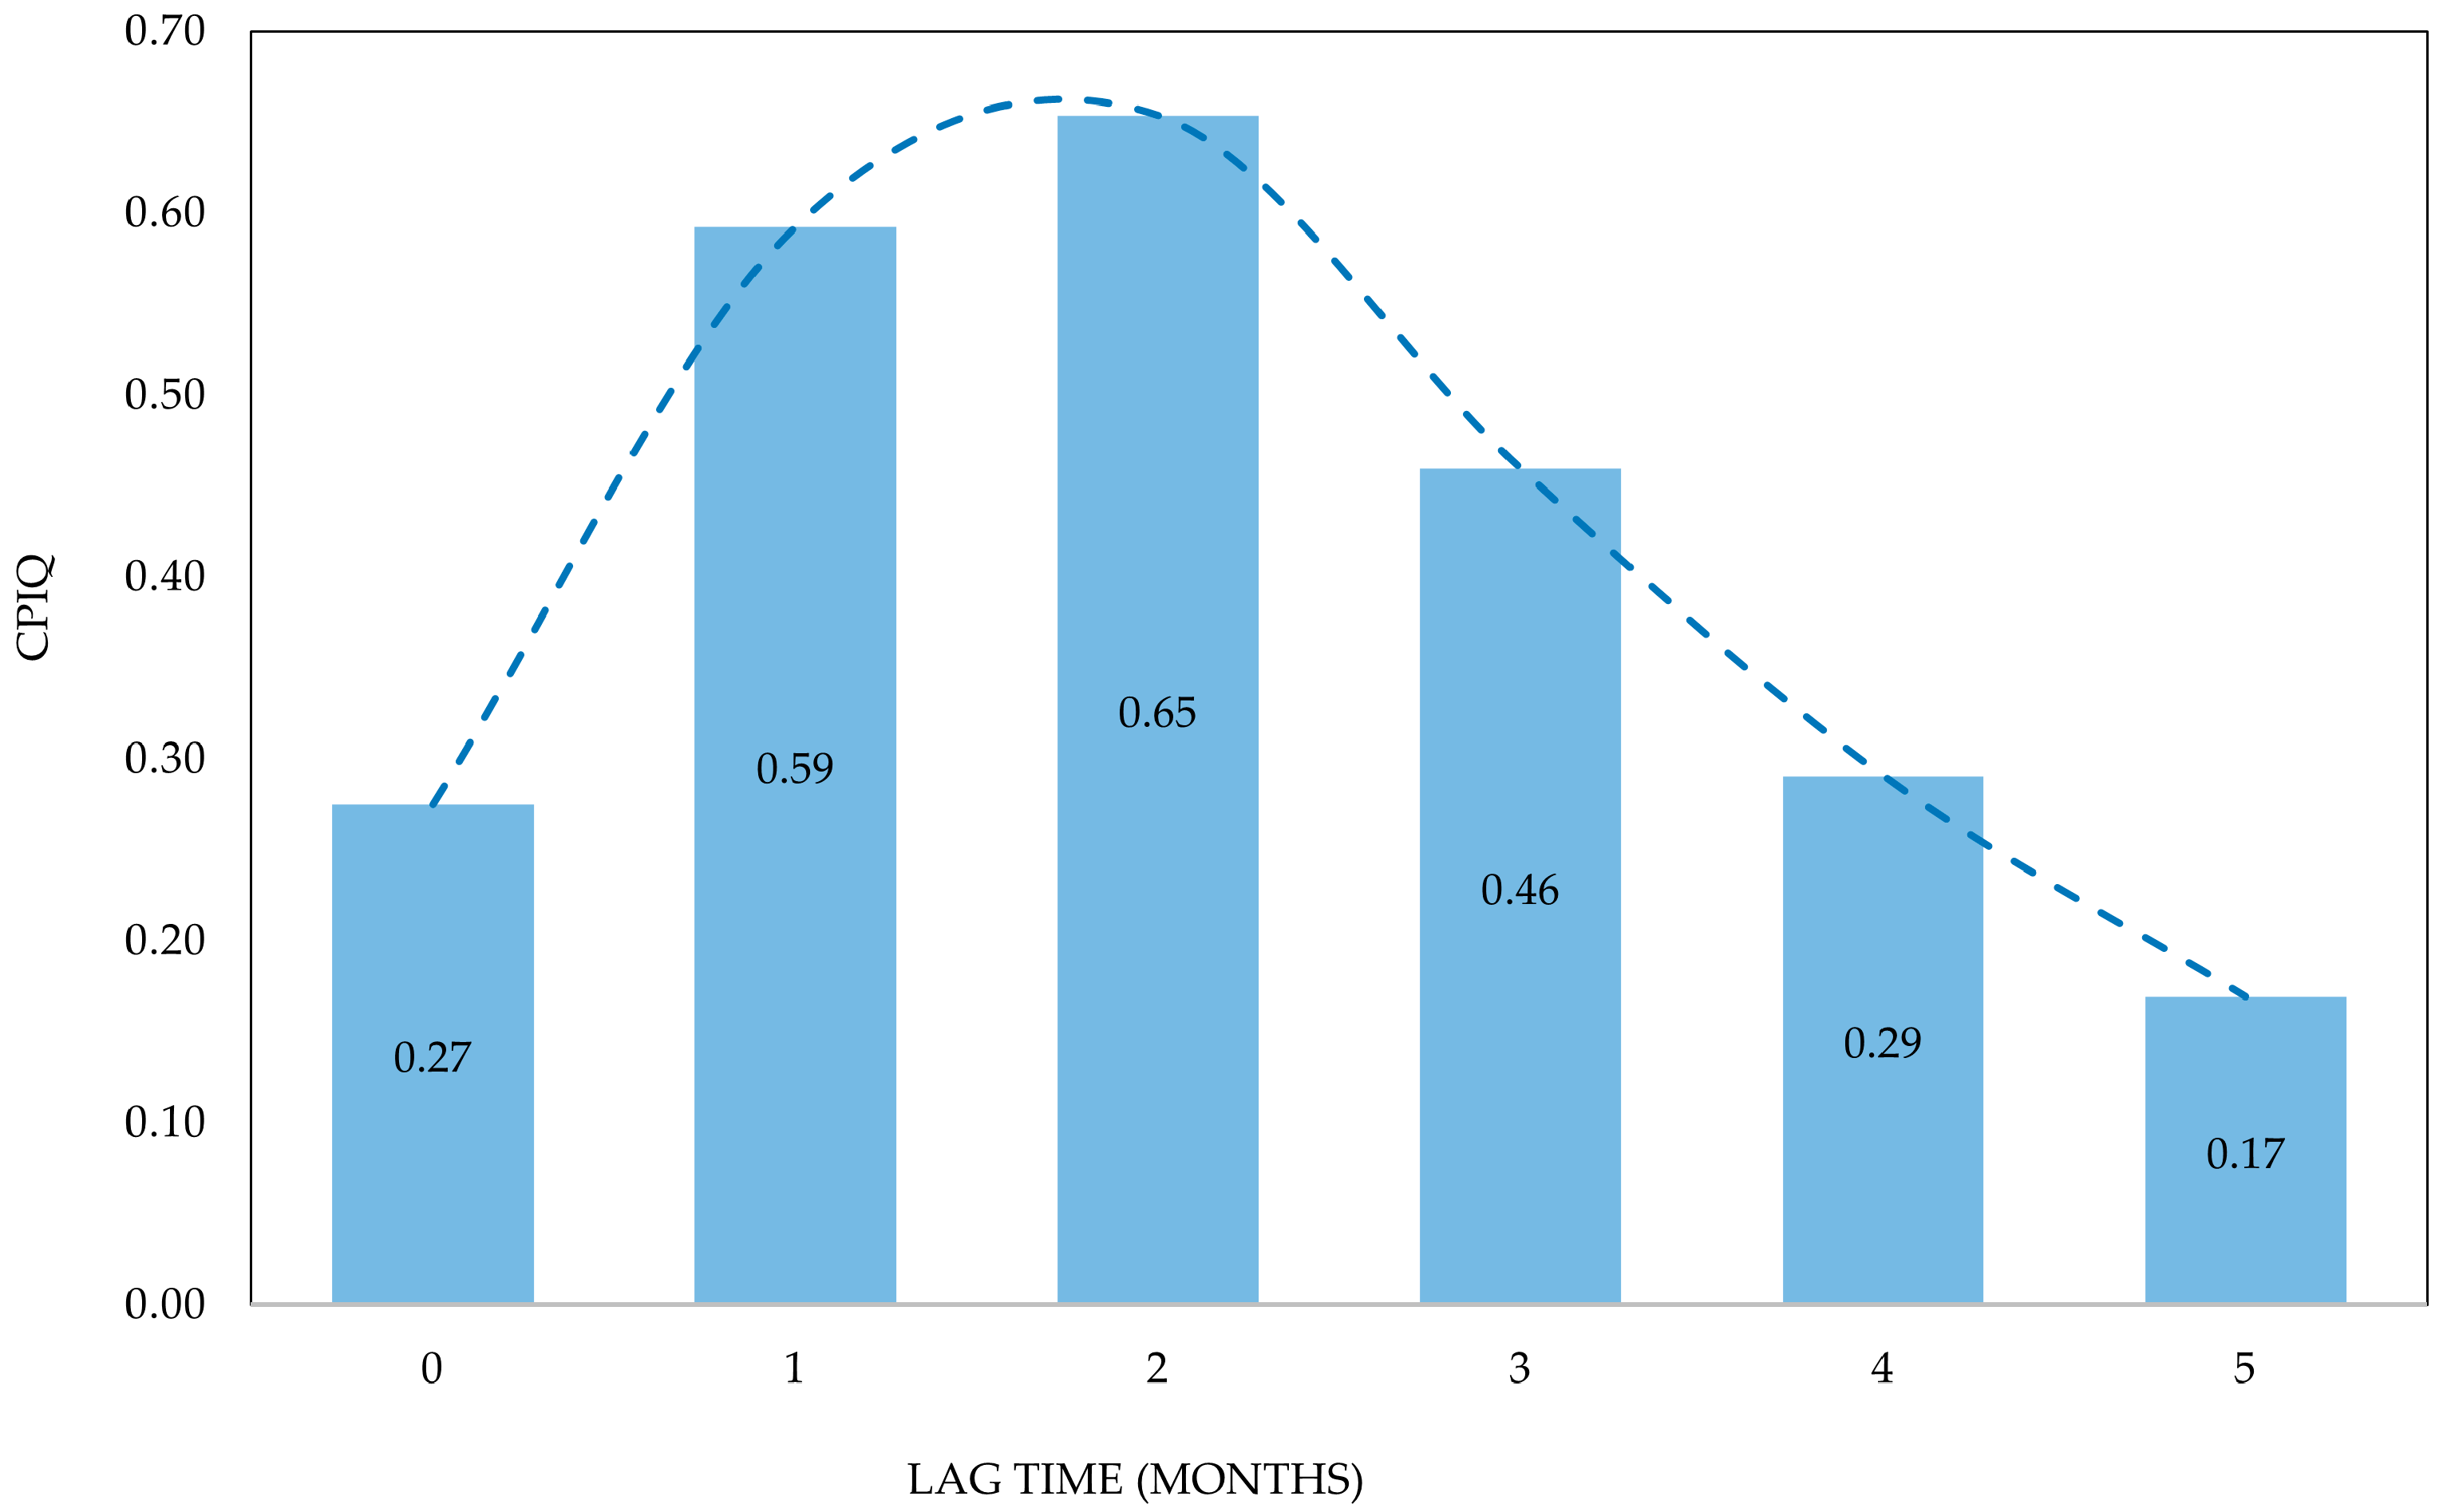
Specifically, the correlation coefficients (CPiQ) required for applying the discharge estimation model refer to the correlation between precipitation data and the historical discharge values of the spring. Springs that exhibit an impulsive response to hydrological inputs tend to show higher correlation coefficients in those months with shorter lag times (i.e., temporally “closer” to the output month). Therefore, the correlation coefficients calculated for a given spring can provide additional insight into the nature of its groundwater flow regime.
Figure 9 presents the correlation coefficients calculated for the Mazzoccolo Spring, which were used in the experimental discharge estimation model.
For this spring, the correlation analysis was carried out using data from the 1974–1977 period. In this case as well, the estimated discharge values (orange curve) and the observed values (blue curve) show similar trends (
Figure 10). The aim was to produce the most conservative estimates possible for the spring in order to ensure that the results would favor safety considerations. This approach also enabled the calibration of the forecasting model for the discharge of the Mazzoccolo Spring.
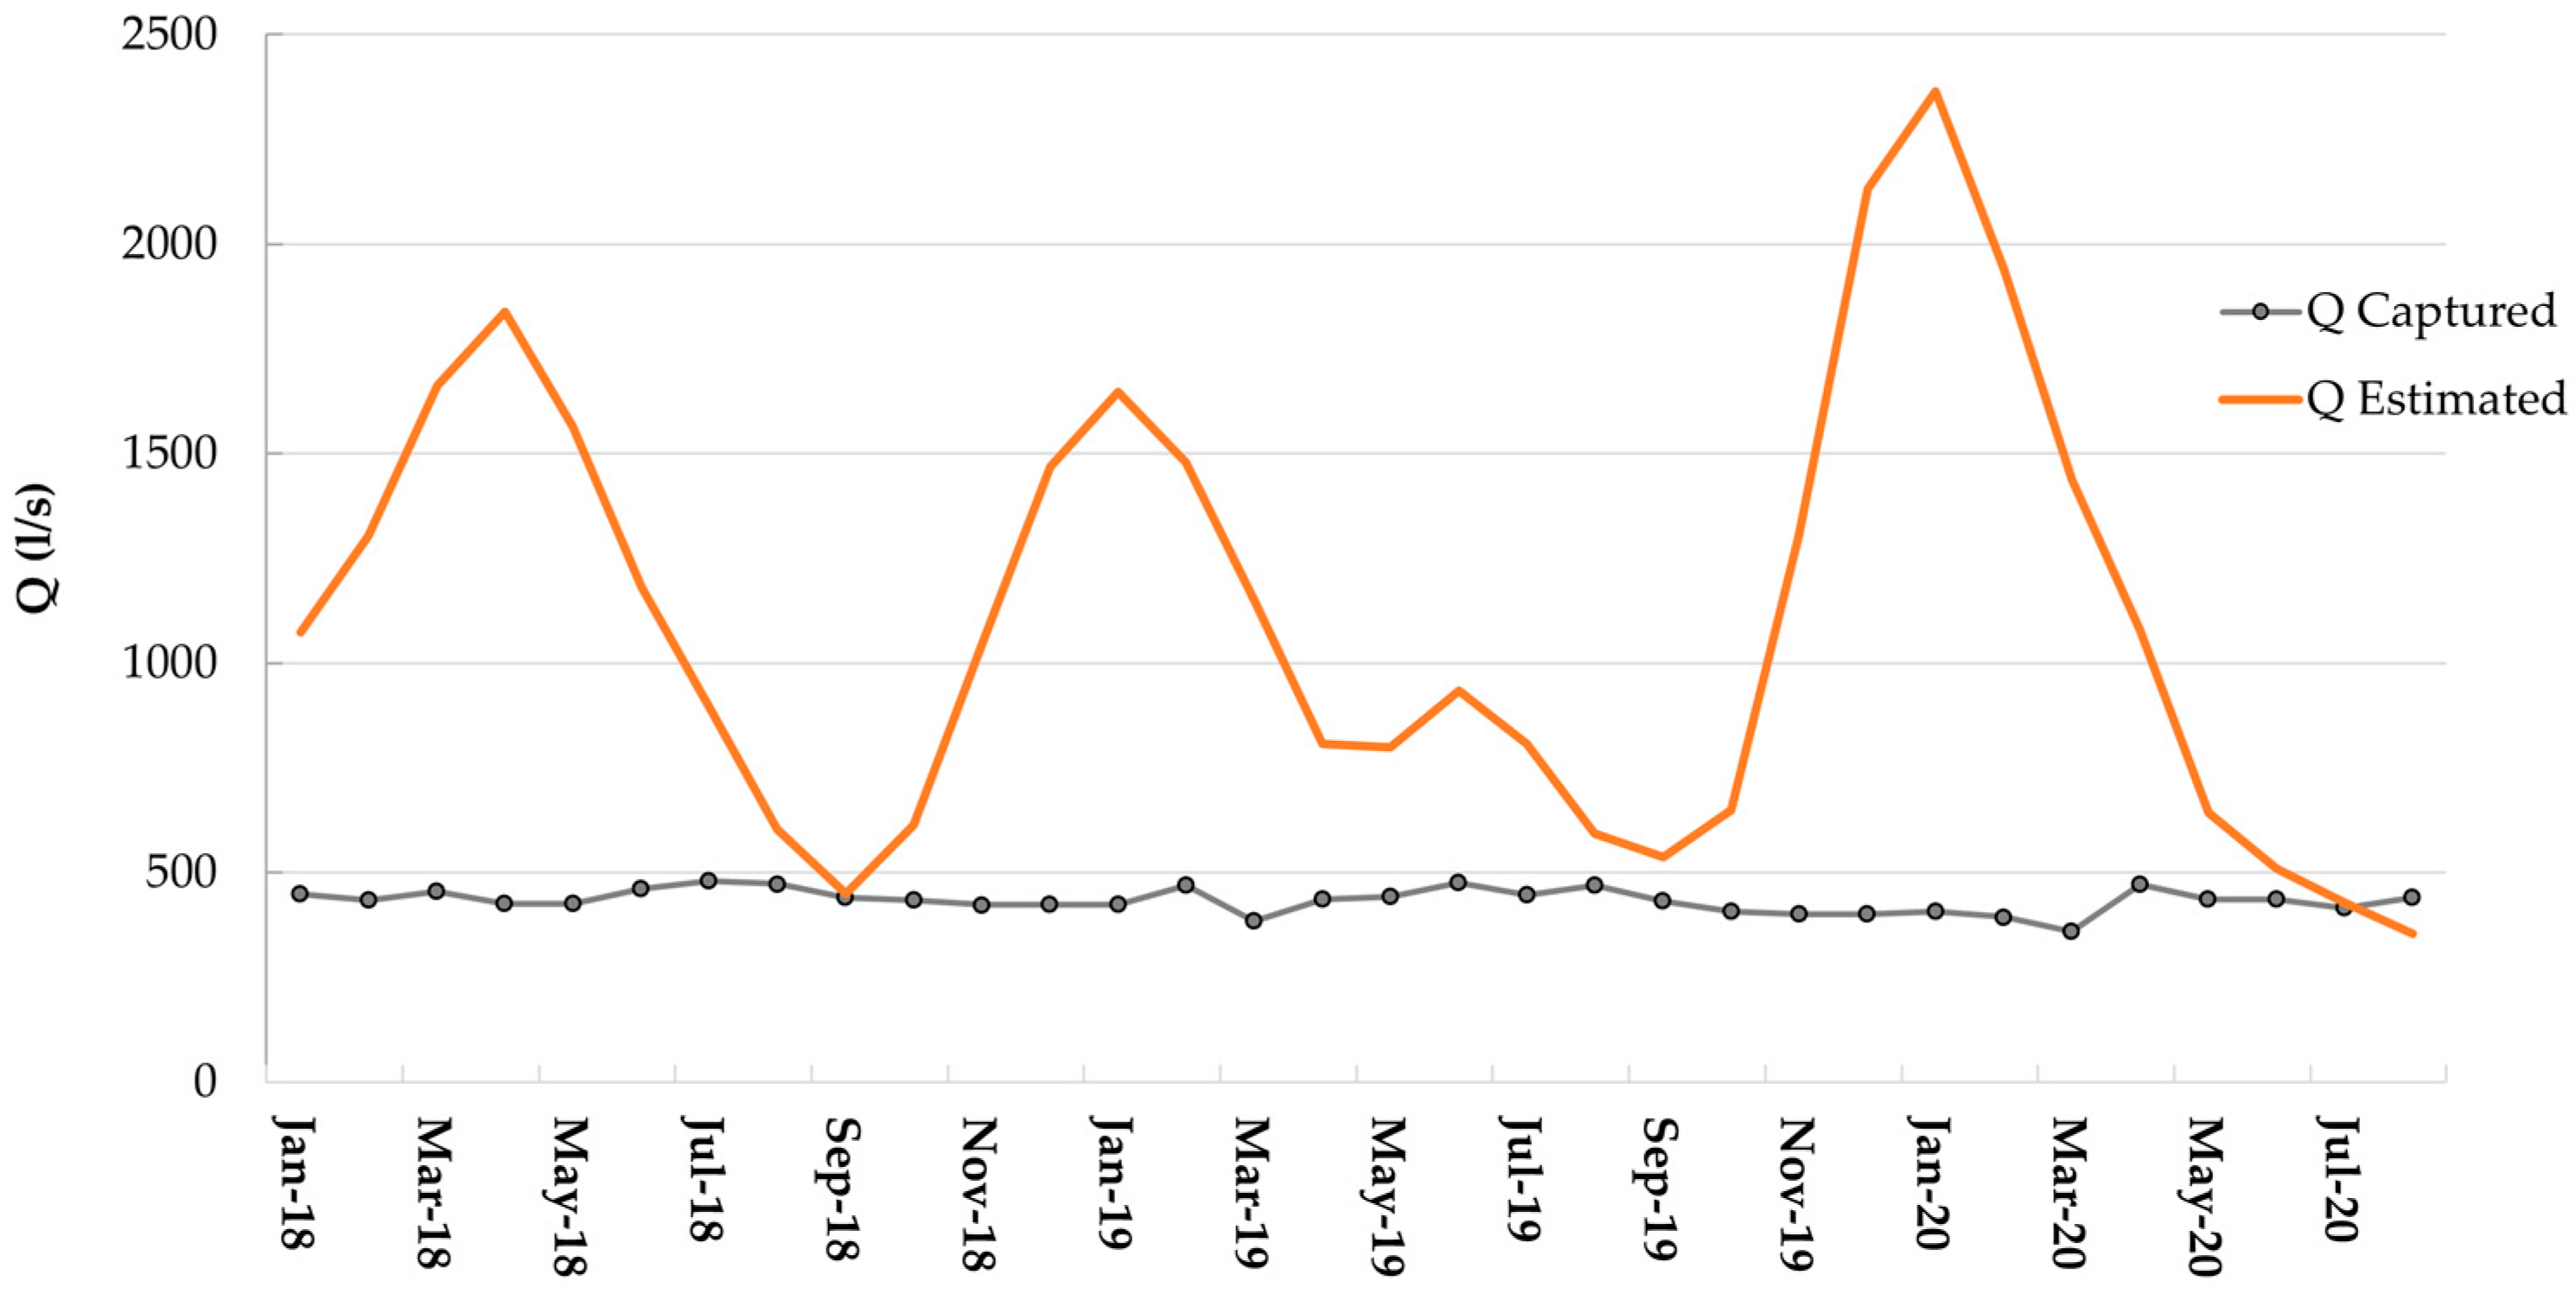
From the trend of the captured flow rates between January 2018 and July 2020, shown in
Figure 11, a general increase in the average discharge of the spring can be observed compared to the previously available historical dataset. This increase may be attributed to enhancements in the spring catchment infrastructure, as also reported in a 2013 study [
25].
To apply the previously described statistical model and obtain a realistic estimate that accounts for the long-term increase in the average discharge of the Mazzoccolo Spring, it was necessary to apply a higher amplification coefficient than the one used for the 1974–1977 period. This adjustment resulted in the simulated trend shown in
Figure 12.
In light of the above, the potential of the Mazzoccolo Spring has changed compared to the 1974–1977 period, as it currently appears capable of delivering minimum flow rates of at least 400 L/s. The application of the discharge estimation model has proven useful for providing an updated assessment of the spring flow behavior. In any case, the analysis of the captured flow rates, consistently above 400 L/s, highlights the strategic importance of the Mazzoccolo Spring and the aquifer that feeds it as a vital drinking water resource for the supply system serving not only Formia but also Gaeta, Itri, and Minturno.
4.3. Spring Qualitative Charaterizazion
For the evaluation of the potential impact of the construction and operation of the planned tunnel on both the spring and its recharge basin, it is useful to refer to the results of a physico-chemical analysis campaign conducted from May 2018 to July 2020. Starting in May 2018, monthly water samples were collected downstream of the drainage tunnel at the Mazzoccolo Spring. In October 2018, additional field surveys were carried out using a multi-parameter probe to measure key physico-chemical parameters of the spring water.
By analyzing the trends of some physico-chemical parameters and comparing them with rainfall data from the Itri pluviometric station, given the absence of real-time discharge data, it is possible to assess the hydrodynamic and hydrogeochemical behavior of the spring, which appears to be closely linked.
Figure 13 shows the comparison between precipitation trends and the temperature and electrical conductivity of the water samples.
The graph illustrates the physico-chemical response of the spring water, providing insights into the groundwater circulation within the aquifer feeding the spring. The observed trends exhibit a pattern commonly referred to in the literature as a “piston flow” effect [
26].
Such behavior is indicative of an aquifer characterized by moderate permeability and a relatively large, saturated zone. In these conditions, newly infiltrated water tends to displace older, more mineralized groundwater, leading to a marked increase in both electrical conductivity and temperature.
To accurately assess the potential impact of the tunnel on the aquifer system, it is crucial to consider that any contamination events associated with tunnel construction or operation may appear at the spring only after a delayed response, due to the dynamics of subsurface flow.
4.4. Application of the Half-Discharge Time Method for the Delineation of Protection Zones
The half-discharge time method [
27] is a widely used technique for defining the extension of a spring protection zone by calculating the time required for the discharge to decrease from its annual maximum by one half. This method determines the number of days between the occurrence of the maximum discharge and the time when the discharge reaches half value. This parameter represents the infiltration process shutdown time through the unsaturated zone and can be directly related to the emptying of the largest voids in the aquifer, which are the preferential, direct, and fastest pathways for a pollutant to travel from the surface to the spring.
This method identifies four vulnerability scenarios (
Table 2), extrapolated from Civita’s analysis of about 200 springs located in most Italian regions and other Mediterranean basin countries.
By analyzing daily flow data, particularly those tracing the initial portion of the recession curve, it is possible, using the abacus in
Figure 14, to determine the corresponding flow velocity and thus the propagation rate of a waterborne contaminant.
It is evident that, since flow velocity is inversely proportional to the overall self-purification capacity (of both the saturated and unsaturated zones) of the aquifers under consideration, particularly those with non-matrix permeability, this assessment method enables the estimation of spring vulnerability even when more rigorous studies and evaluations are not available.
However, for the application of the method based on the half-time of the annual maximum discharge, it is necessary to analyze flow rate data that represent, as accurately as possible, the peak discharge values, both maximum and minimum, recorded during a hydrological year. Therefore, as previously mentioned, it would be necessary to measure the spring discharge on at least a daily basis.
In the absence of such daily data, this study applied the half-time method to the only available discharge datasets, namely:
Daily discharge data from 1969, provided by Civita in the report “Technical opinion on the potential impacts of the Pedemontana variant to SS 7 (Appia) on the aquifer feeding the Mazzoccolo Spring in Formia (Latina)” [
15];
Monthly discharge data from the 1974–1977 period, representing the only measured flow values made available by the studies conducted under Special Project No. 29 (PS29) by the Cassa per il Mezzogiorno, since the only flow measurements held by the water utility concern captured discharge;
Monthly estimated discharge data from the 2018–2020 period, as reconstructed in the previous section.
This first part presents the results of applying the half-time method to the continuous discharge data from 1969, as provided by Civita [
27] and shown in
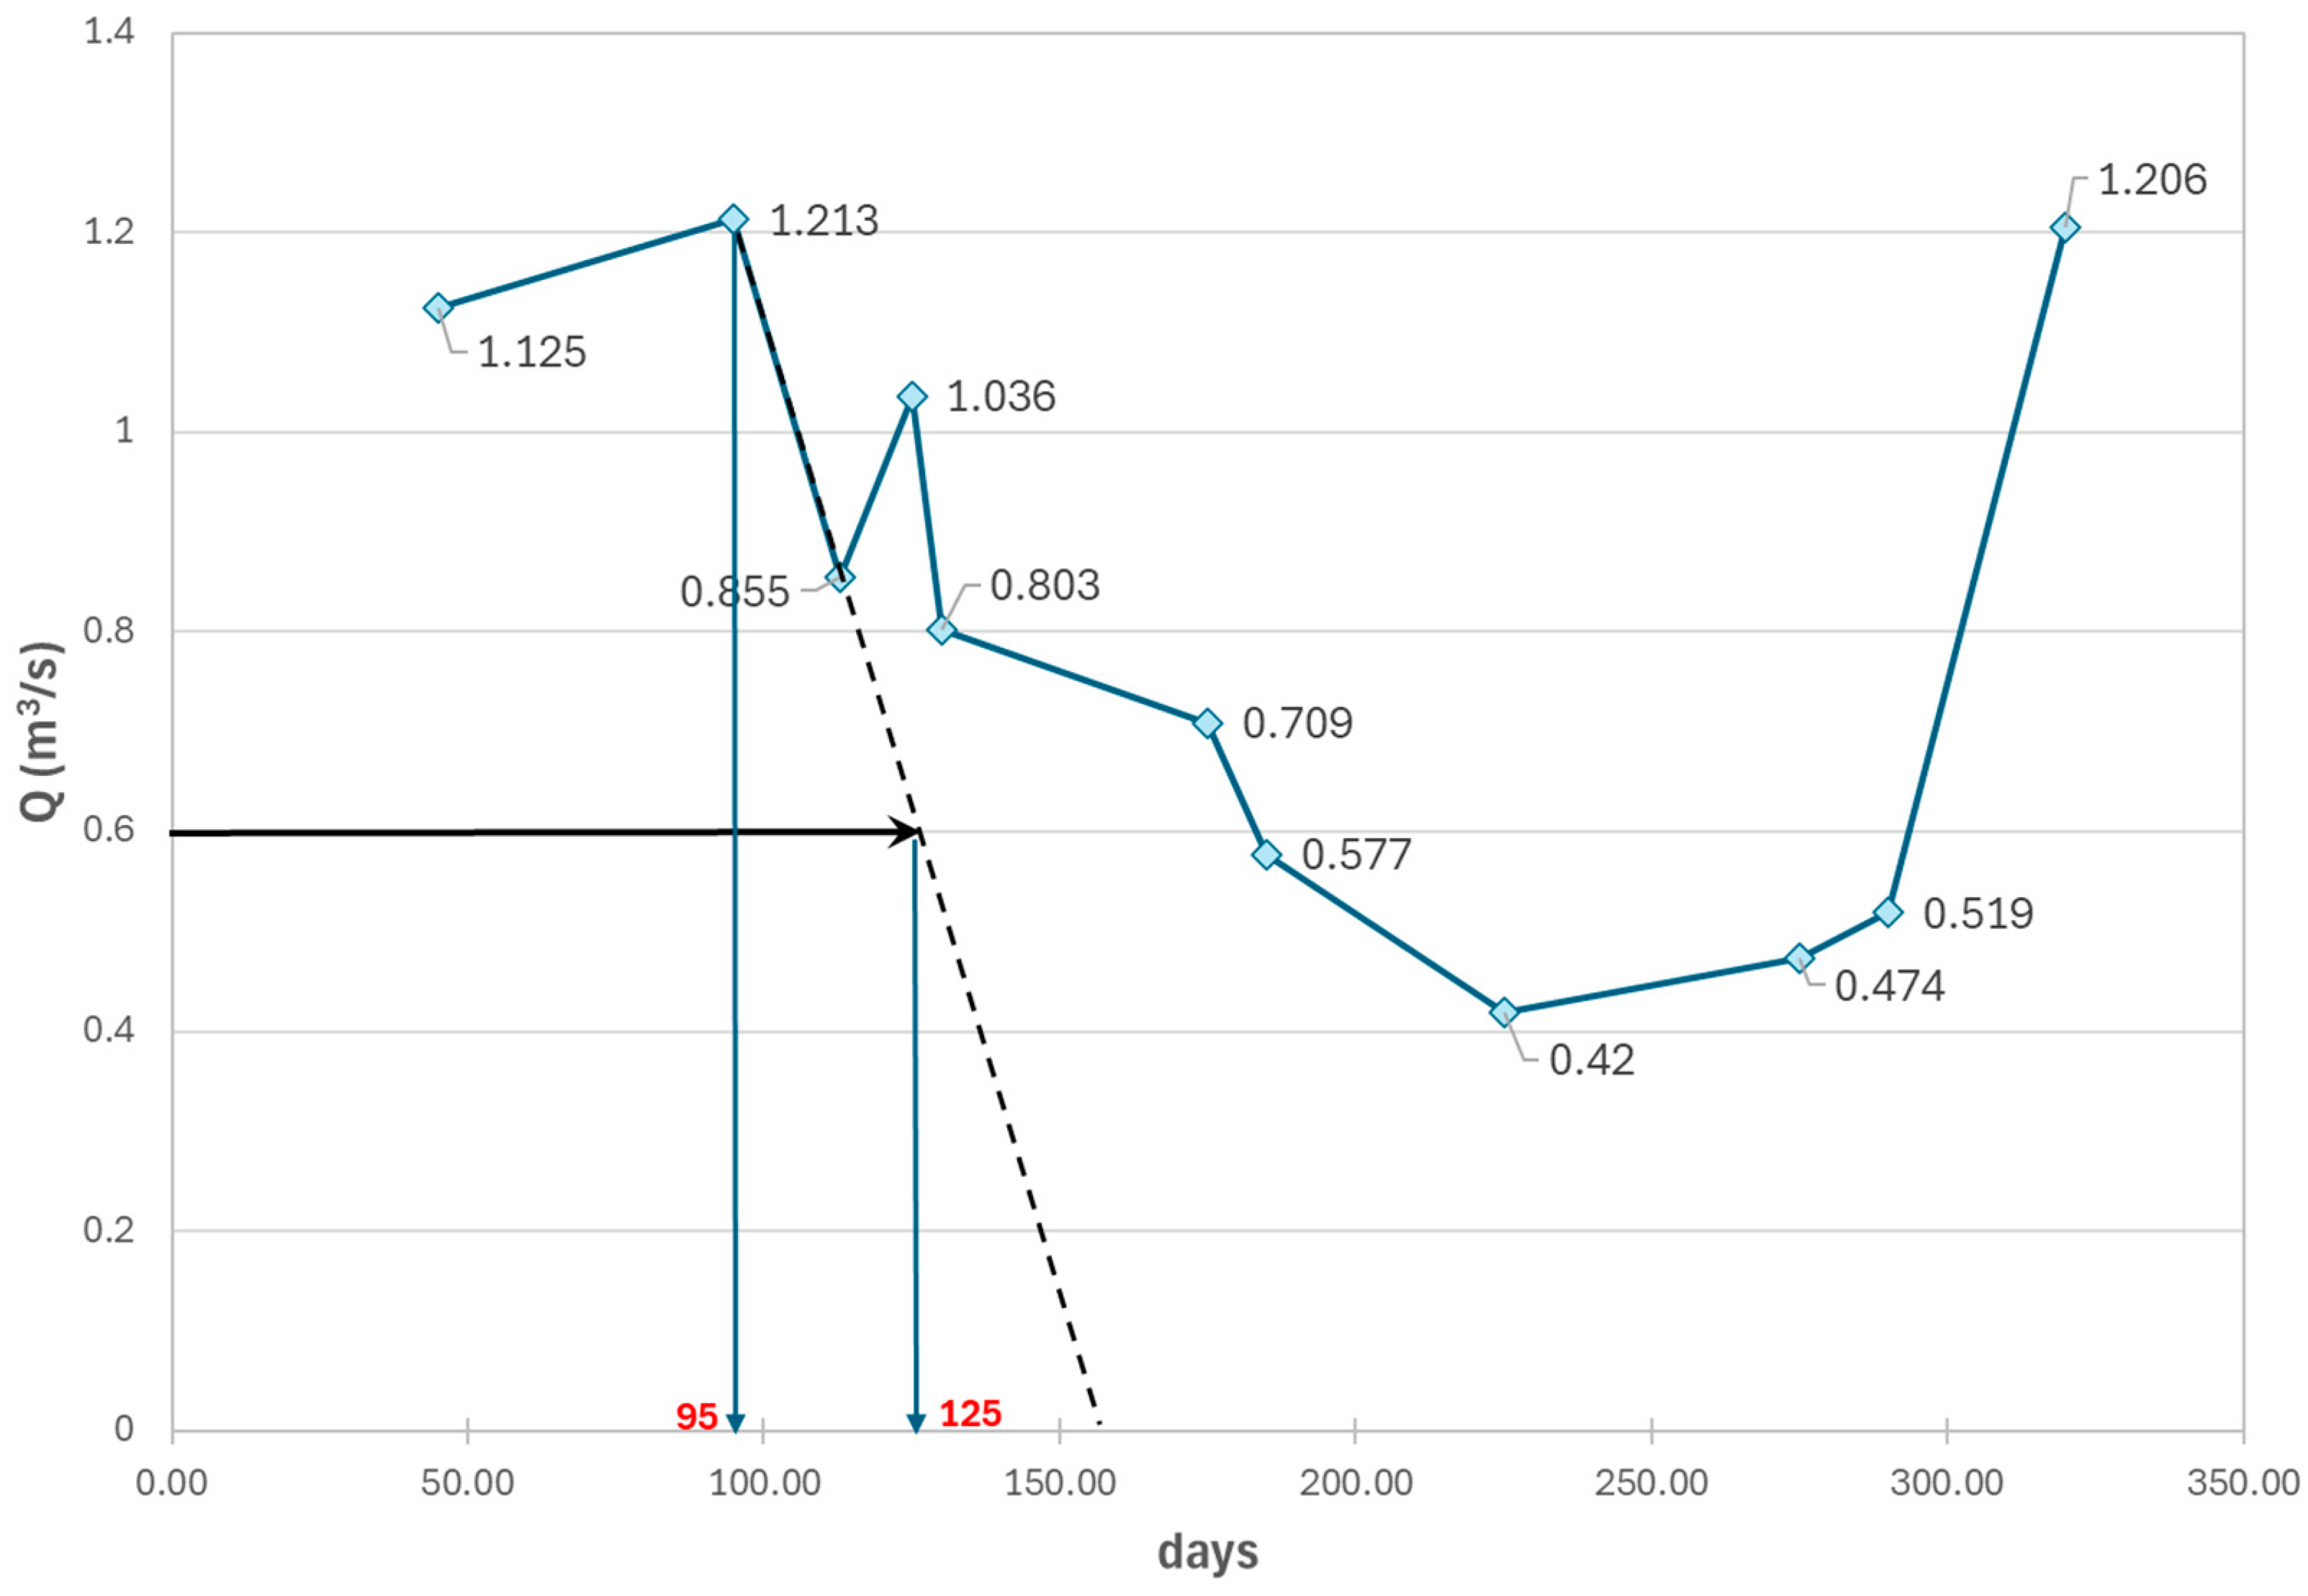
Figure 15.
As shown in
Figure 15, the maximum discharge value is 1.213 m
3/s; therefore, the half-value is 0.606 m
3/s. However, it can be observed that following this maximum discharge, another peak of considerable magnitude occurs, likely due to a subsequent intense meteorological event. It is thus reasonable to assume that the recession curve in this case does not start exactly at the time of the annual maximum discharge, but rather corresponds to the second discharge peak, after which the flow tends to decrease until reaching a minimum value (
Figure 15).
Starting from the assumption that the interest lies in studying the spring at its most vulnerable moment (i.e., during intense rainfall events) it is noted that in a karst aquifer, such as the one feeding the Mazzoccolo Spring, meteoric waters collected in catchment areas like dolines rapidly drain into swallow holes directly connected to the underground conduit network. These karst conduits act as the main collectors and therefore represent a direct pathway for flow towards the spring outlets.
Conversely, adjacent systems connected to these preferential drainage paths consist of pathways where water moves more slowly and residence times are longer. These areas thus serve as storage zones that progressively release water resources into the main conduits.
This heterogeneous structure of karst aquifers, characterized on one hand by surface recharge, both diffuse and concentrated, and on the other hand by two distinct permeability features (very high permeability in the underground conduits and lower permeability in the rock matrix), manifests in a very particular hydro-dynamic behavior. As a result, rapid and violent flood events caused by intense rainfall and concentrated infiltration in highly permeable zones do not allow filtration and self-purification processes of pollutants to occur, as typically happens in aquifers composed of unconsolidated materials.
For this reason, it was deemed appropriate to evaluate the half-time of the annual maximum discharge on the curve interpolating between the maximum discharge value and the immediately subsequent lower discharge value, to represent the flow through the preferential conduits following heavy rainfall events (
Figure 15).
Using this procedure, it was possible to identify the representative point of the half-value of the annual maximum discharge (in this case, Qmax/2 = 0.606 m3/s) precisely on the interpolated line, ideally extended to intersect the time axis.
At this point, the half-time of the annual maximum discharge was determined, which, as shown in
Figure 15, is 30 days.
This allowed the classification of the Mazzoccolo Spring into vulnerability class “C,” according to the classification proposed by Civita and previously reported in
Table 2 and the chart in
Figure 14.
Table 3 shows the geometric criteria for the design of the Absolute Protection Zone (ZPA) in different vulnerability scenarios.
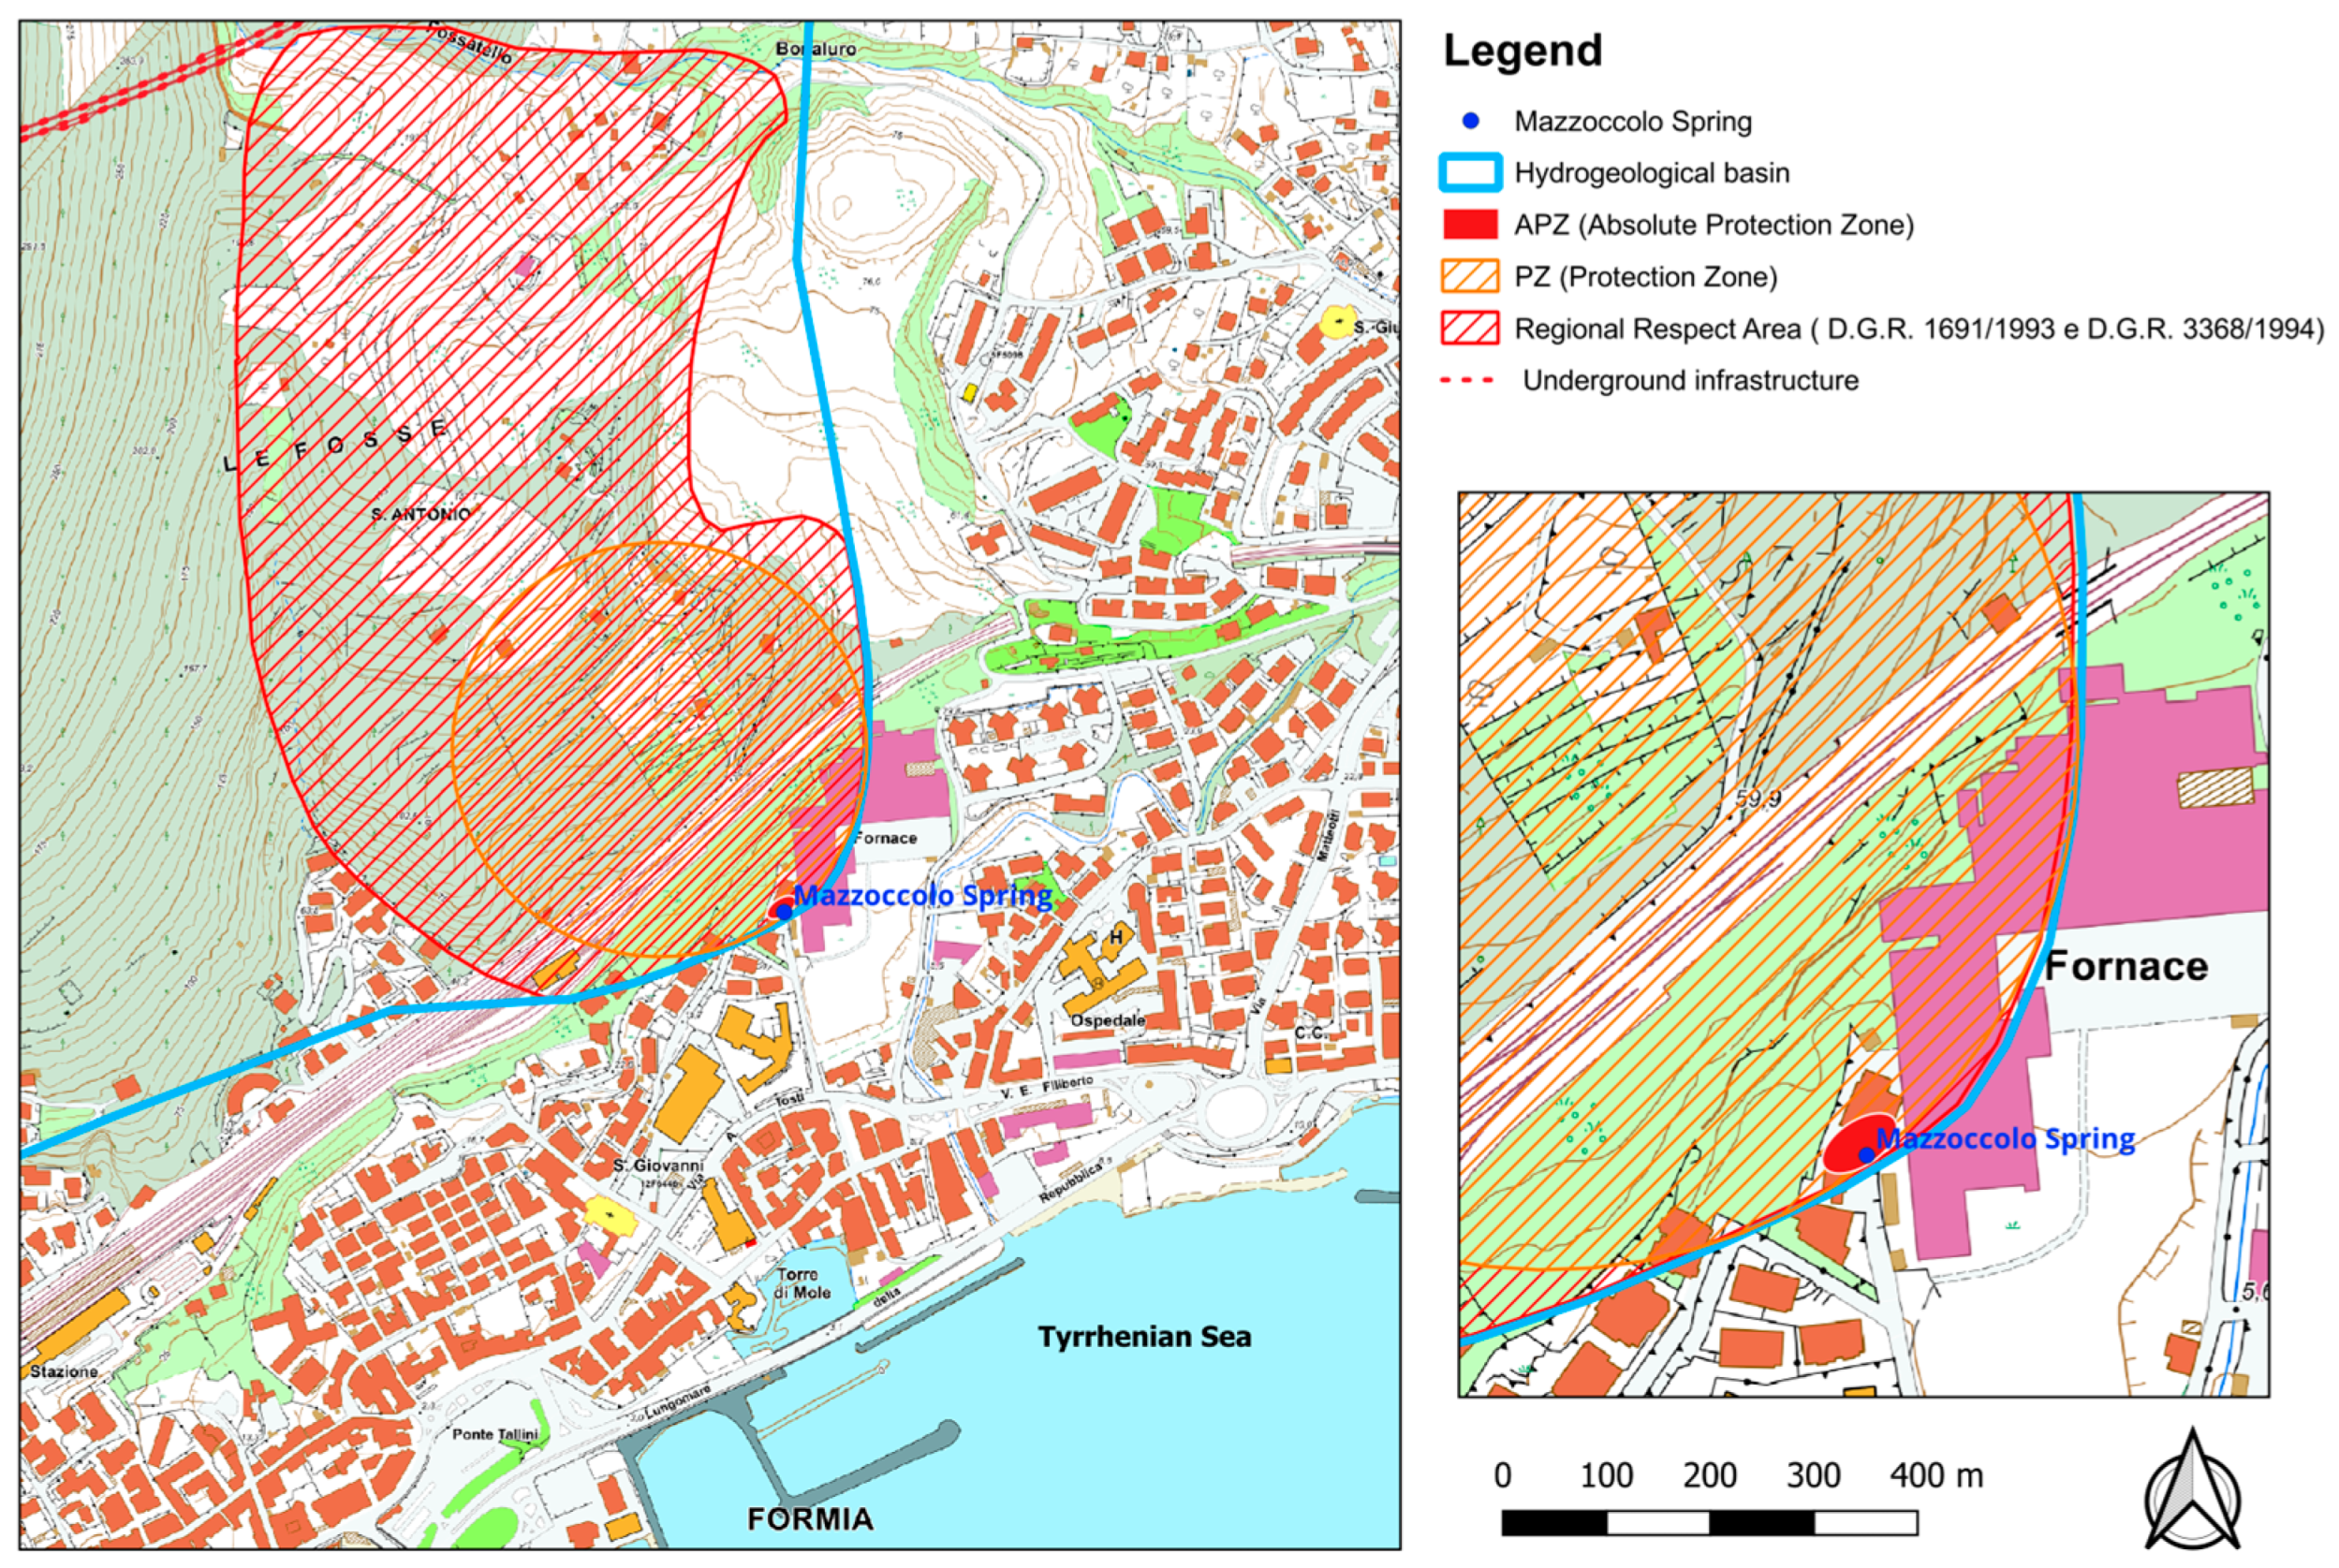
Regarding the delineation of the Absolute Protection Zone (ZPA), it includes the entire area affected by the network of drainage galleries and extends 15 m upstream and 3 m downstream, up to the boundary with recently constructed buildings located near the spring area, in accordance with the guidelines provided by Civita (
Table 3, scenario “C”). However, the 15 m extension has also been applied to the lateral boundaries of the water intake structures, thereby effectively expanding the area designated for the exclusive use of the water resource. As previously remarked, this resource is situated in an urbanized environment and thus exhibits increased vulnerability (
Figure 16).
To define the shape of the PZ (Protection Zone) to be delineated in scenarios C and D, reference was made to the most common hydrokinematic condition observed in the unconfined aquifer portion close to the spring area. The strong discharge of groundwater at the surface induces centripetal flow paths within this section of the aquifer. The piezometric surface exhibits a radial pattern, converging downstream, with a sharply parabolic profile near the emergence point. Therefore, a circular sector is identified, typically with a central angle of less than 90°. The most appropriate shape for the PZ is an inverted trapezoid, with its shorter base coinciding with the downstream limit of the zone of absolute protection, a lateral opening of at least 30° relative to the lateral boundaries of the area, and an upstream extension (
Table 4).
Regarding the delineation of the Absolute Protection Zone (ZPA), it includes the entire area affected by the network of drainage galleries and extends 15 m upstream and 3 m downstream, up to the boundary with recently constructed buildings located near the spring area, in accordance with the guidelines provided by Civita (
Table 3, scenario “C”). However, the 15 m extension has also been applied to the lateral boundaries of the water (
Figure 16).
Based on the results obtained using the method based on the halving time of the maximum annual discharge, an estimate of the extent of the Protection Zone has been made, according to the approach proposed by Civita and presented in
Table 4. Specifically, since the Mazzoccolo Spring falls within vulnerability scenario “C”, the upstream extension of the protection zone beyond the Absolute Protection Zone (ZPA) (ZTA) is estimated to be 400 m. A simplified delineation of this area is shown in
Figure 16, in order to assess its extent with respect to the alignment of the tunnel route.
The delineation of the Protection Zone (ZP) is possible only on the basis of a hydrogeological study of the aquifer structure feeding the spring. Referring to the most common hydrogeological settings in Italy, it is generally appropriate to include the entire recharge area of the spring within the Protection Zone. However, in the present study, in order to establish a more restrictive and well-founded limitation, particularly in the case of a large recharge basin such as that of the Mazzoccolo Spring, it was decided to define the protection zone as coinciding with the area of highest infiltration, as determined by the results of the Inverse Hydrogeological Balance Method. In fact, it can be assumed that the highest risk of contamination originates from the areas with the most effective infiltration into the subsurface, as pollutants may reach the aquifer more rapidly, especially through existing karst conduits.
It is precisely in these areas that the greatest risk is concentrated. The halving time method was also applied to the available monthly discharge series (1974–1977 and 2018–2020), yielding halving times exceeding 50 days (
Table 3, Scenario D). This corresponds to ZPA and PZ extensions consistent with those previously discussed. The analyses carried out thus far indicate that the tunnel route does not intersect any of the protection areas identified in this study, nor does it intersect the Protection Zone of the Mazzoccolo Spring group, as delineated according to Regional Resolutions D.G.R. 1691/1993 and D.G.R. 3368/1994, though not yet officially adopted (
Figure 16).


