1. Introduction
Floods are natural disasters that cause significant losses to human life and the economy [
1]. In particular, urban residents, who comprise over half the global population, are at greater risk of flood-induced loss [
2]. Moreover, the rapid development due to the increasing urban population is expected to significantly change the land cover and increase outflow [
3,
4]. This, in turn, is expected to impact the availability of water resources [
5]. Meteorological factors (such as rainfall, temperature, and humidity) and socioeconomic development activities (such as urban expansion, population growth, and development in flood-prone areas) are two major factors that increase flood risk [
6,
7,
8]. However, at the local flood-management level, methods to assess the changing meteorological factors that trigger floods are lacking [
9,
10]. The relationship between socioeconomic factors and flood risk can be examined from two perspectives: (i) development activities decrease the infiltration capacity of the soil, thereby affecting the water flow within the watershed; and (ii) in cities developed around rivers, the economic value of floodplains is at risk in terms of flood exposure. In addition to land cover changes, the way land is occupied significantly impacts the likelihood of flood risk and the degree of vulnerability within a local community [
11,
12]. Linear and continuous urban development along rivers results in a quantitative increase in flood risk and exposure to hazardous factors.
In this context, cities must prioritize establishing land cover plans that consider the risk of inundation to reduce the fundamental causes of urban flooding due to continuing development. Urban areas worldwide are at higher risk of flooding owing to frequent and severe hydro-meteorological changes and global warming-induced sea level rise [
13,
14,
15]. Moreover, inadequate consideration of climate-related causes and the construction and improvement inadequacies of drainage infrastructure can exacerbate flood risk [
16]. Hence, a risk-based approach to land cover planning should be considered a key process in developed countries and in the urban areas of developing countries [
17].
Approximately 233 of the 633 major cities worldwide are at risk of inundation from flooding, affecting approximately 663 million people [
18]. Structural measures such as embankments have long been a key component in flood risk mitigation strategies. However, these structural measures can adversely impact the environment and society. For instance, a higher levee implies that a more devastating flood occurs when the levee collapses. Therefore, an integrated flood risk management strategy incorporating socioeconomic and environmental responses (such as land cover planning) with adequate priorities should be derived from a modern flood risk management framework. Because perfect flood control may be impossible owing to environmental and societal changes, such strategies can help develop a sustainable flood management process.
Urban development influences land cover changes. Urbanization typically induces land cover changes from non-built-up areas to built-up areas to support urban growth. These changes increase the flood risk [
19,
20], and hence, flood hazards can be attributed to the vulnerability of the land cover in a city [
21,
22,
23]. Thus, land cover, flood risk, and development projects are interdependent. Assessing the land cover vulnerability while considering sustainability is critical in urban planning [
24,
25].
The floodplains along the rivers and coastlines in major cities are favored for economic and residential purposes, and the overall economic value and productivity of these floodplains are higher than those of other areas. The high population density in floodplains around major urban rivers affirms these facts. Therefore, decision-makers in urban planning and flood management must explore methods to maximize the utilization of floodplains near rivers and coastlines in large cities while minimizing flood risks [
26].
The flood damage potential refers to the extent of damage that can occur in a given flood-exposed area. Flood-induced damage can take many forms, affecting human life and property (e.g., buildings, crops). Development plans that result in land cover changes or lead to the clustering of multiple hazardous elements in flood-prone areas increase the extent and magnitude of flood damage [
27]. In addition to the direct damage caused by physical contact with water (inundation damage), flooding can lead to indirect economic damages owing to the disruption of activities (e.g., reduced economic activity or transportation disruption). In contrast to direct damages, the effects of indirect damages can last longer (months and years), and hence, quantifying indirect damages is challenging [
28].
Flood risk is defined as the combination of the probability of a flood event and its negative consequences [
29]. Flood risk is increasing globally and regionally because of changes in weather and other factors, such as the expansion of flood-prone urban areas [
30].
The interaction between land cover change and the water cycle significantly affects the balance of surface indicators. For instance, land cover influences the balance factors of water circulation (evaporation, surface temperature, and interception). Meteorological factors, such as rainfall frequency variations, can affect land cover change [
31,
32,
33] which, in turn, directly influences the outflow during specific rainfall events, such as localized heavy rainfalls [
34]. Finally, the land cover of river channels contributes to the accumulation of wooden debris caught in bridge piers under the influence of hydraulic flow conditions [
35]. The most common trend in land cover change is the transition from permeable to impermeable areas. The increasing settlements in flood-prone areas significantly impact land cover [
30], and the land cover changes affect both the probability of flooding and the flood-induced damages.
The flood damage history and recent changes in flood occurrences can serve as a powerful starting point for predicting and analyzing future flood risks. Therefore, flood risk assessment should identify the factors influenced by specific flood scenarios. These factors are typically extracted by cross-analyzing flood data, such as rainfall triggering the floods, buildings and population exposed to floods depending on river water levels, and land cover changes [
28].
This study analyzed the change patterns in water bodies and flood plains in the Ulsan watershed, a major South Korean city, from the 1980s to the 2010s while considering the land cover changes in urban areas (e.g., waterfront, settlement, and agricultural areas). In addition, the flood risk pattern, which changed owing to Typhoon Chaba, the meteorological event that caused the largest flood damage in the study area history, was analyzed. The relationship between urban development, weather changes, and flood risk was evaluated based on the results of two analyses: the impact of temporal changes due to development (such as land cover change in urban areas) and the impact of event-based weather factors (such as concentrated heavy rainfall and typhoons), which were analyzed to evaluate the flood risk. The patterns of changes in the risk and the causes of flood damage in terms of socioeconomic factors were also examined.
2. Materials and Methods
2.1. Overeview
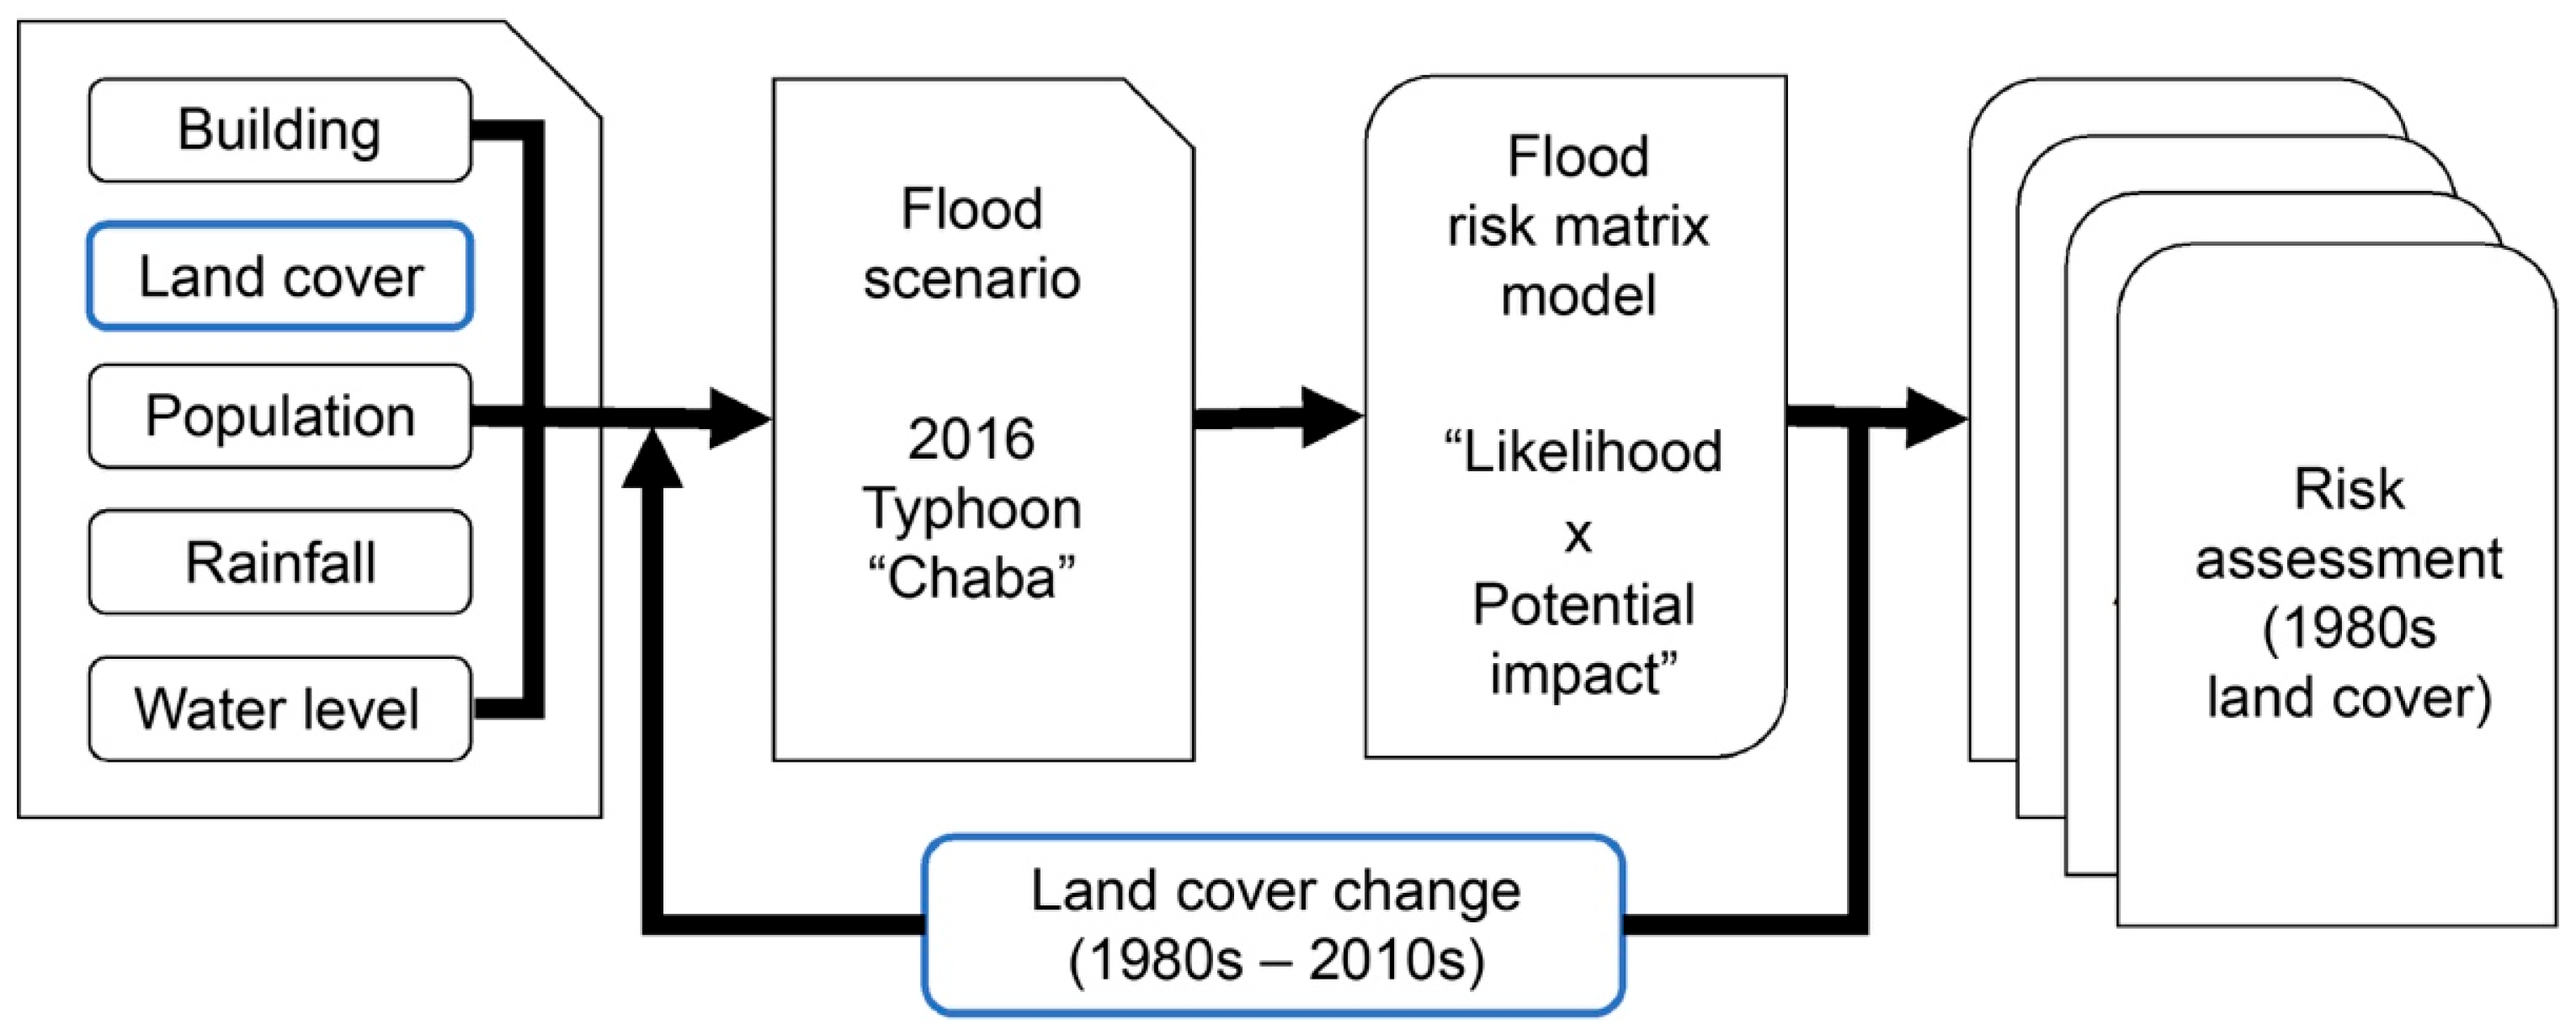
An inventory was constructed to analyze flood risk according to land cover change, and the risk level was assessed via a matrix-based analysis model (
Figure 1). The flood scenario for the flood risk analysis was based on the 2016 Typhoon Chaba, which caused the largest flood damage in the study area. The scenario was established using rainfall and river water level time series data during the damage period and the inundation records. The changes in the flood risk were analyzed by incorporating the temporal variations in rainfall and water levels due to land cover change and typhoon-induced damages.
2.2. Selection of the Study Area
Most natural disaster damages in South Korea are caused by concentrated rainfall (43%) and typhoons (46%). From 2013 to 2022, typhoons and heavy rains caused 122 deaths and disappearances in South Korea, along with damages to buildings, agricultural land, and public facilities valued at USD 236 million. Since 1995, approximately 7.33 billion USD has been allocated to mitigate the damages caused by such natural disasters [
36].
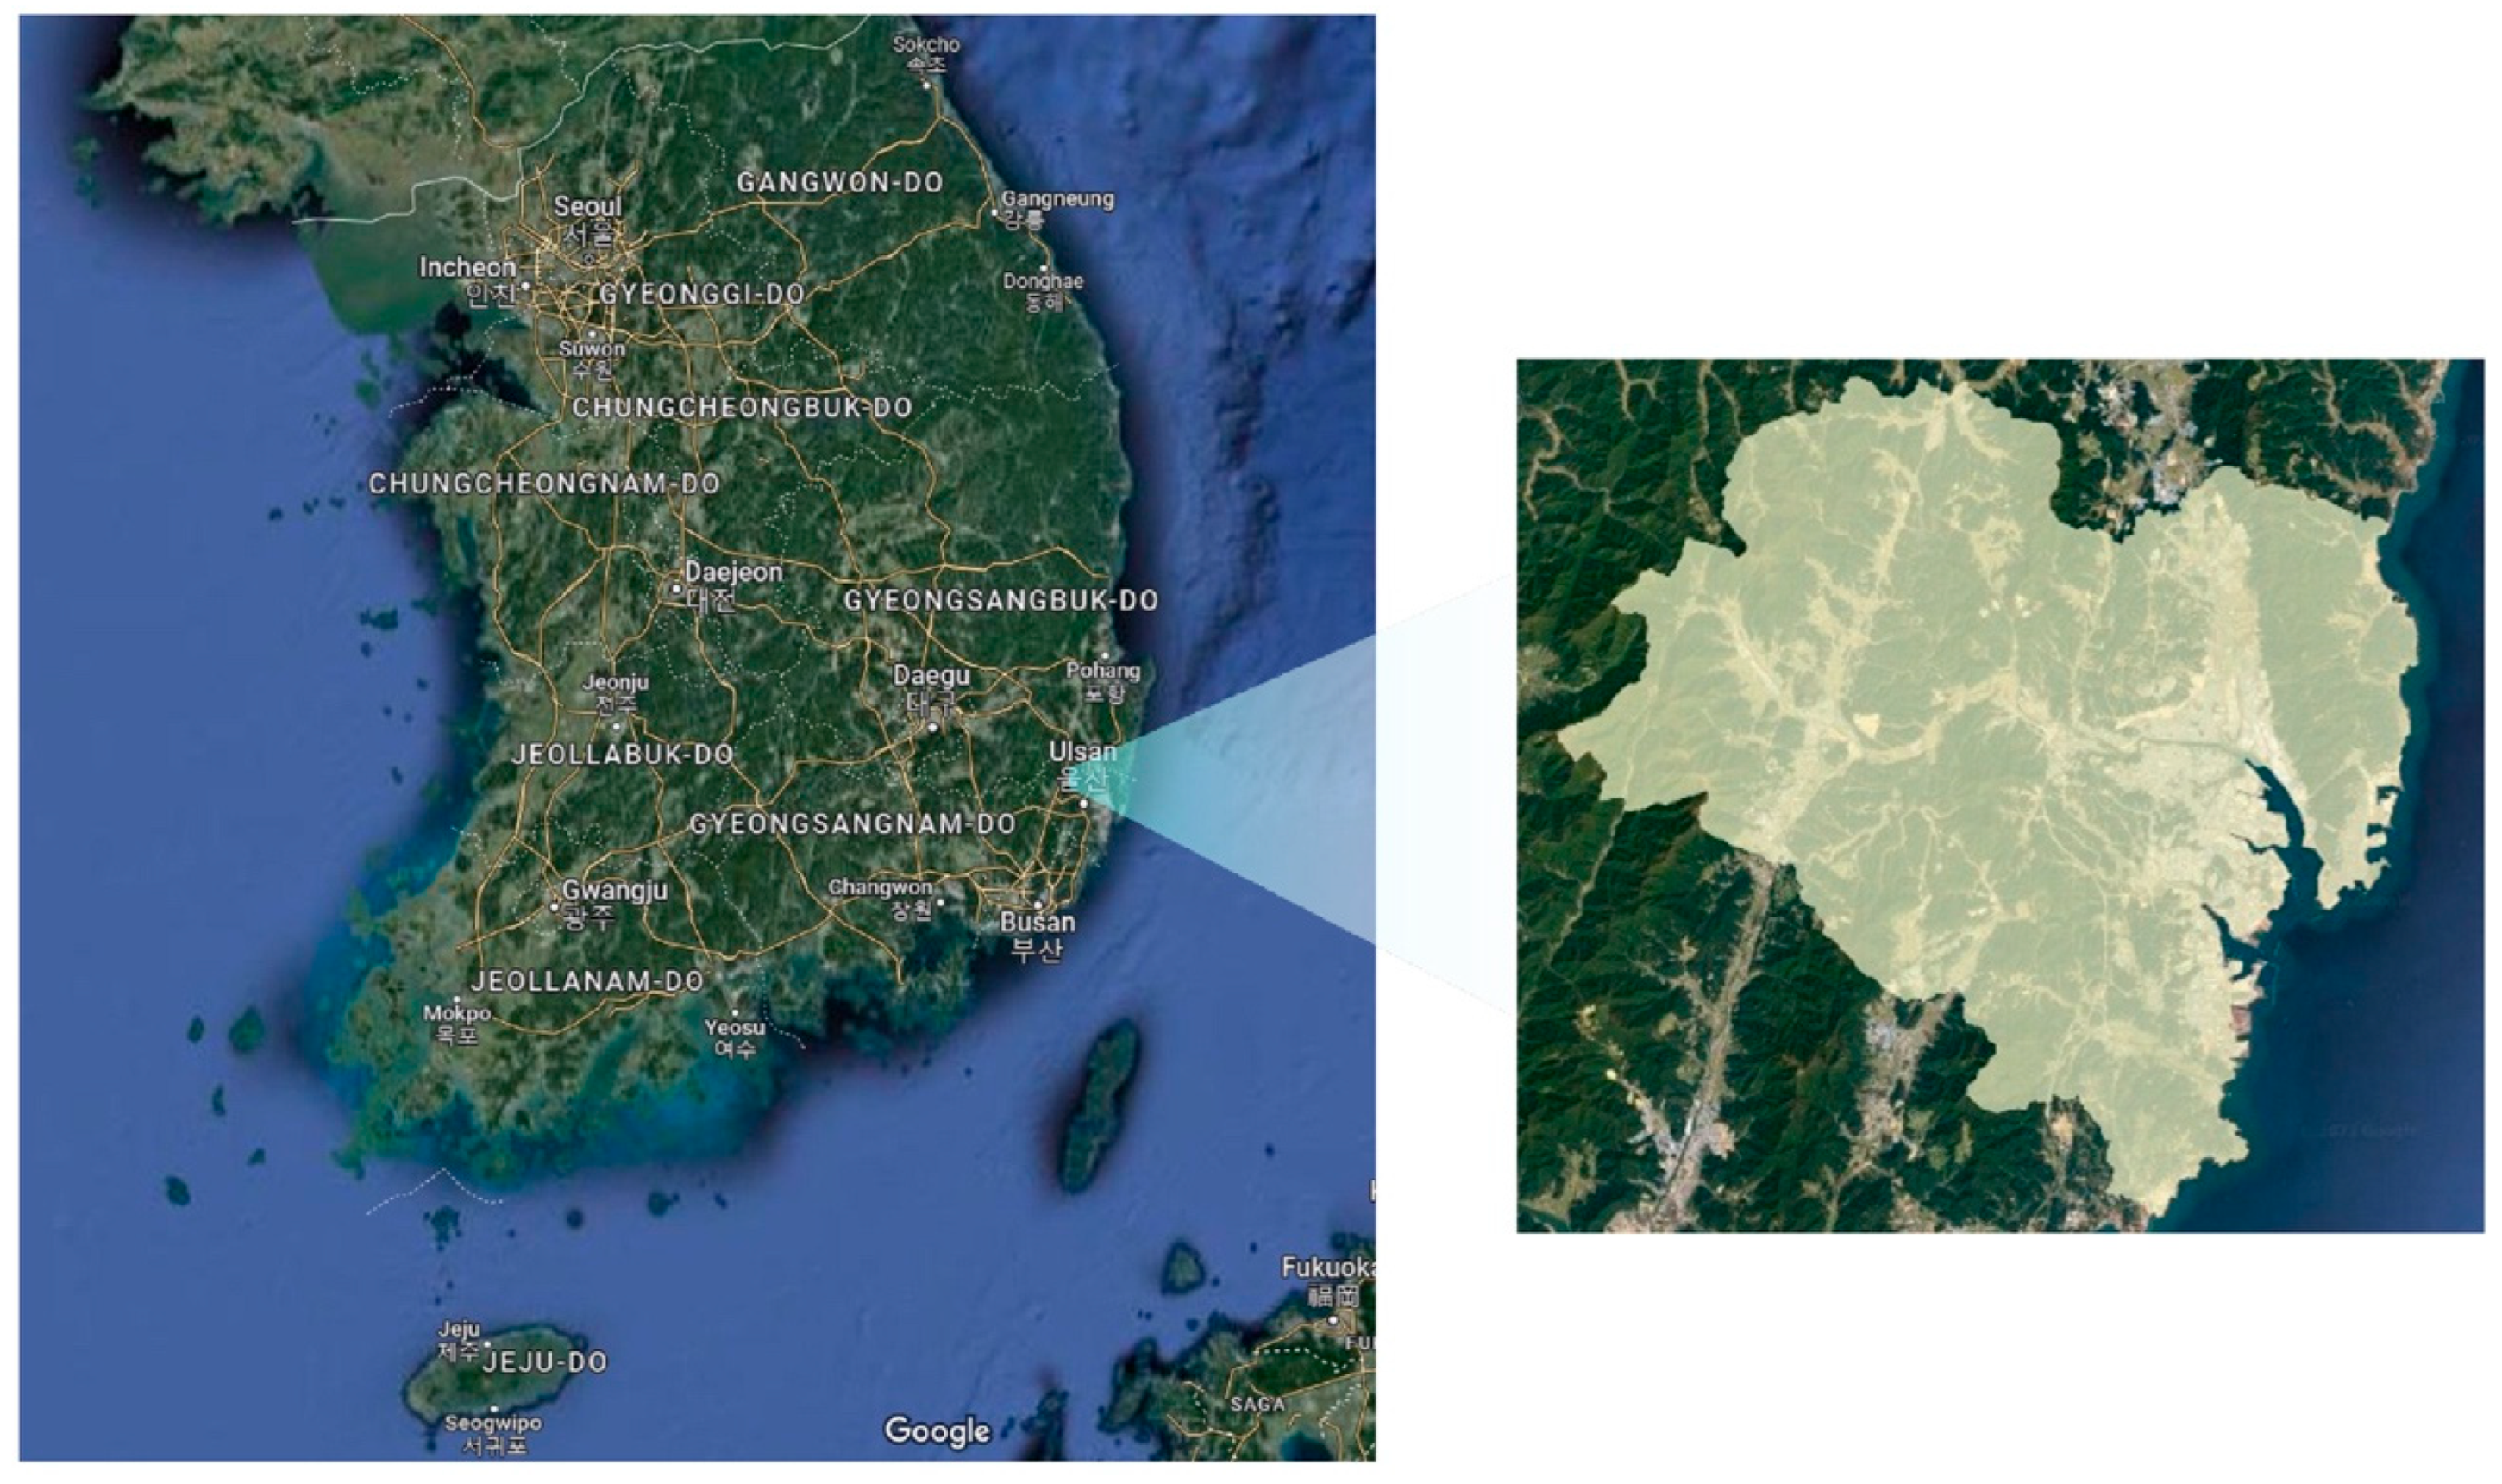
South Korea has six metropolitan cities, including Seoul and Ulsan. The target area of this study is Ulsan Metropolitan City, located in the southeastern part of South Korea (latitude 35.538°, longitude 129.311°) (
Figure 2). According to administrative data, the total population of Ulsan as of January 2024 was approximately 1.13 million, and the administrative area covers 1062 km
2. The western part of the region is characterized by mountainous terrain, whereas the eastern part is close to the East Sea. Ulsan City is traversed by the Taehwa River, a nationally managed waterway with a length of 41.01 km, and 100 local rivers with a combined length of 449.96 km, flowing into the East Sea.
Ulsan is the most prone to typhoon damage among the large South Korean cities. Six out of the seven typhoons in 2019 and two out of the four typhoons in 2021 caused damage in Ulsan. The cost of damages from typhoons and heavy rains in Ulsan Metropolitan City from 2013 to 2022 amounted to approximately 80.18 million USD (converted based on the currency value in 2022), with recovery costs totaling approximately 169 million USD (converted based on the currency value in 2022) [
36]. In particular, Typhoon Chaba in 2016 resulted in a flooding area of approximately 10 km
2 in Ulsan Metropolitan City; the majority of the flooding occurred in flood plains around rivers, as shown in
Figure 3. Despite the flood-prone nature of Ulsan Metropolitan City, the local government continues development activities in accordance with urban planning, focusing on the area shown in
Figure 3. Urbanization has a significant effect on urban flooding, and indiscriminate urban development exacerbates flood risk. Hence, the correlation between urban flooding and land cover change must be carefully examined.
2.3. Collection of Basic Data
2.3.1. Selection of the Grid System
South Korean territory is divided into approximately 1 billion grids, each of which has a size of at least 10 m. As shown in
Figure 4, each grid is assigned a uniform point number referred to as the “state spot number”. The ‘state spot number’ is a number assigned to each spot on the land and adjacent seas that have been uniformly divided into grids in accordance with Article 2, Paragraph 9 of the Road Name Address Act. This grid system is based on a grid with a reference point 300 km west and 700 km south of UTM-K, which is the origin of the single-plane Cartesian coordinate system, and grids with widths and lengths of 10 m, 100 m, 1 km, 10 km, and 100 km, respectively. A standard method for indicating the location of each area in the entire territory can be utilized as a national safety network, enabling prompt disaster response and providing nationwide location guidance services to the public.
2.3.2. Selection of the Flood Scenario
Typhoon Chaba, which struck South Korea in 2016, caused significant damage in the southern regions, including Jeju, Busan, and Ulsan. In particular, approximately 10 casualties, over 3000 submerged vehicles, and property damage amounting to approximately 44.20 million USD were reported in Ulsan. The water level of the Taehwa River exceeded the critical level of 5.5 m and reached a maximum of 5.66 m. Consequently, all the ground floor shops in the Taehwa Market vicinity were flooded, and the maximum inundation depth was 1.6 m. The Maegok Observatory of the Korea Meteorological Administration indicated that the recorded torrential rainfall, which took place over 14 h due to Typhoon Chaba passing through Ulsan Metropolitan City, was 382.5 mm, with a maximum rainfall intensity of 114.6 mm/h. This amount exceeded the 1 h rainfall of 112.3 mm, which corresponds to a 500-year frequency event in Ulsan, making it the highest recorded 1 h rainfall in the history of the study area, as shown in
Figure 5.
2.4. Analysis of the Terrain and Rainfall Variation
2.4.1. Land Cover (Use) Analysis
The land cover information in South Korea is categorized according to standard classifications, such as major, intermediate, and detailed, and is managed by the Ministry of Environment of South Korea via spatial information databases. The land cover map is updated every 10 years with a resolution of 30 m and a scale of 1/50,000. The primary categories comprise seven types of land covers, further divided into urban and dry areas, agricultural areas, forest areas, grassland, wetlands, and water areas. This study classified the land cover in Ulsan from the 1980s to the 2010s into seven major categories and analyzed the change in area over time.
2.4.2. Rainfall Change Analysis
Temporally varying data, such as rainfall, can be probabilistically analyzed by setting temporal ranges such as the maximum time and annual maximum. The precipitation probability is typically estimated using a suitable probability distribution function for a series of annual rainfall maxima. Rainfall data can be analyzed using different probability distribution functions. In this study, the Gumbel distribution was chosen as the probability estimation target, as it is widely used in civil engineering design and is presented as national design standards in the United States, Australia, and South Korea [
37,
38,
39]. The Gumbel distribution parameters are estimated using the method of probability-weighted moments, and the estimated parameters are used to calculate the probability and cumulative density functions.
The Gumbel distribution is a Type-1 extreme value distribution with a shape parameter
in the generalized extreme value distribution. It is commonly used in the frequency analysis of extreme value data, such as peak flood discharge or precipitation data. The probability density function of the Gumbel distribution is given by the following equation:
where
denotes the probability when the maximum annual rainfall is
,
represents the maximum annual rainfall,
is the scaling parameter, and
is the parameter indicating the location at which maximum probability occurs.
The cumulative distribution function can be obtained by integrating Equation (1) as follows:
where
denotes the cumulative probability up to
.
2.5. Flood Risk Assessment
2.5.1. Risk Matrix Modeling
Probabilistic data on flood risk can be useful if the flood risk is analyzed for a limited geographic area. Choi and Yi [
40] analyzed flood risks in the metropolitan areas of Busan and Daegu using a risk matrix comprising potential impact and likelihood. Here, the impact is determined from past flood records and probable rainfall to indicate the extent of flood risk; the likelihood is derived from the probability of the occurrence of a weather event based on ensemble weather prediction data. Jung and Kim [
41] combined the potential risk impact and likelihood of rainfall to derive a risk rating for forecasting the impacts of heavy rainfall in Seoul, South Korea.
The United Nations Office for Disaster Risk Reduction uses indicators such as hazards, vulnerability, and exposure to assess the risk of natural disasters. These indicators can be used to assess the flood risk, as expressed in Equation (3). Furthermore, both the probability of flood occurrence and the intensity of the damage caused by floods must be considered to assess flood risk. Thus, Equation (3) can be modified to account for the probability and intensity, and Equation (4) can be obtained [
42,
43]:
The likelihood of a flood can be determined from Equation (4) using the rainfall probability. A difference in the extent of damage due to rainfall between two different grids can be attributed to the vulnerability and exposure of the grids themselves. Thus, the vulnerability and exposure of individual grids can be considered potential impact factors for flood risk. Moreover, the rainfall probability represents the likelihood of a specific magnitude flood hazard occurring. Hence, the flood risk can be summarized by the following equation:
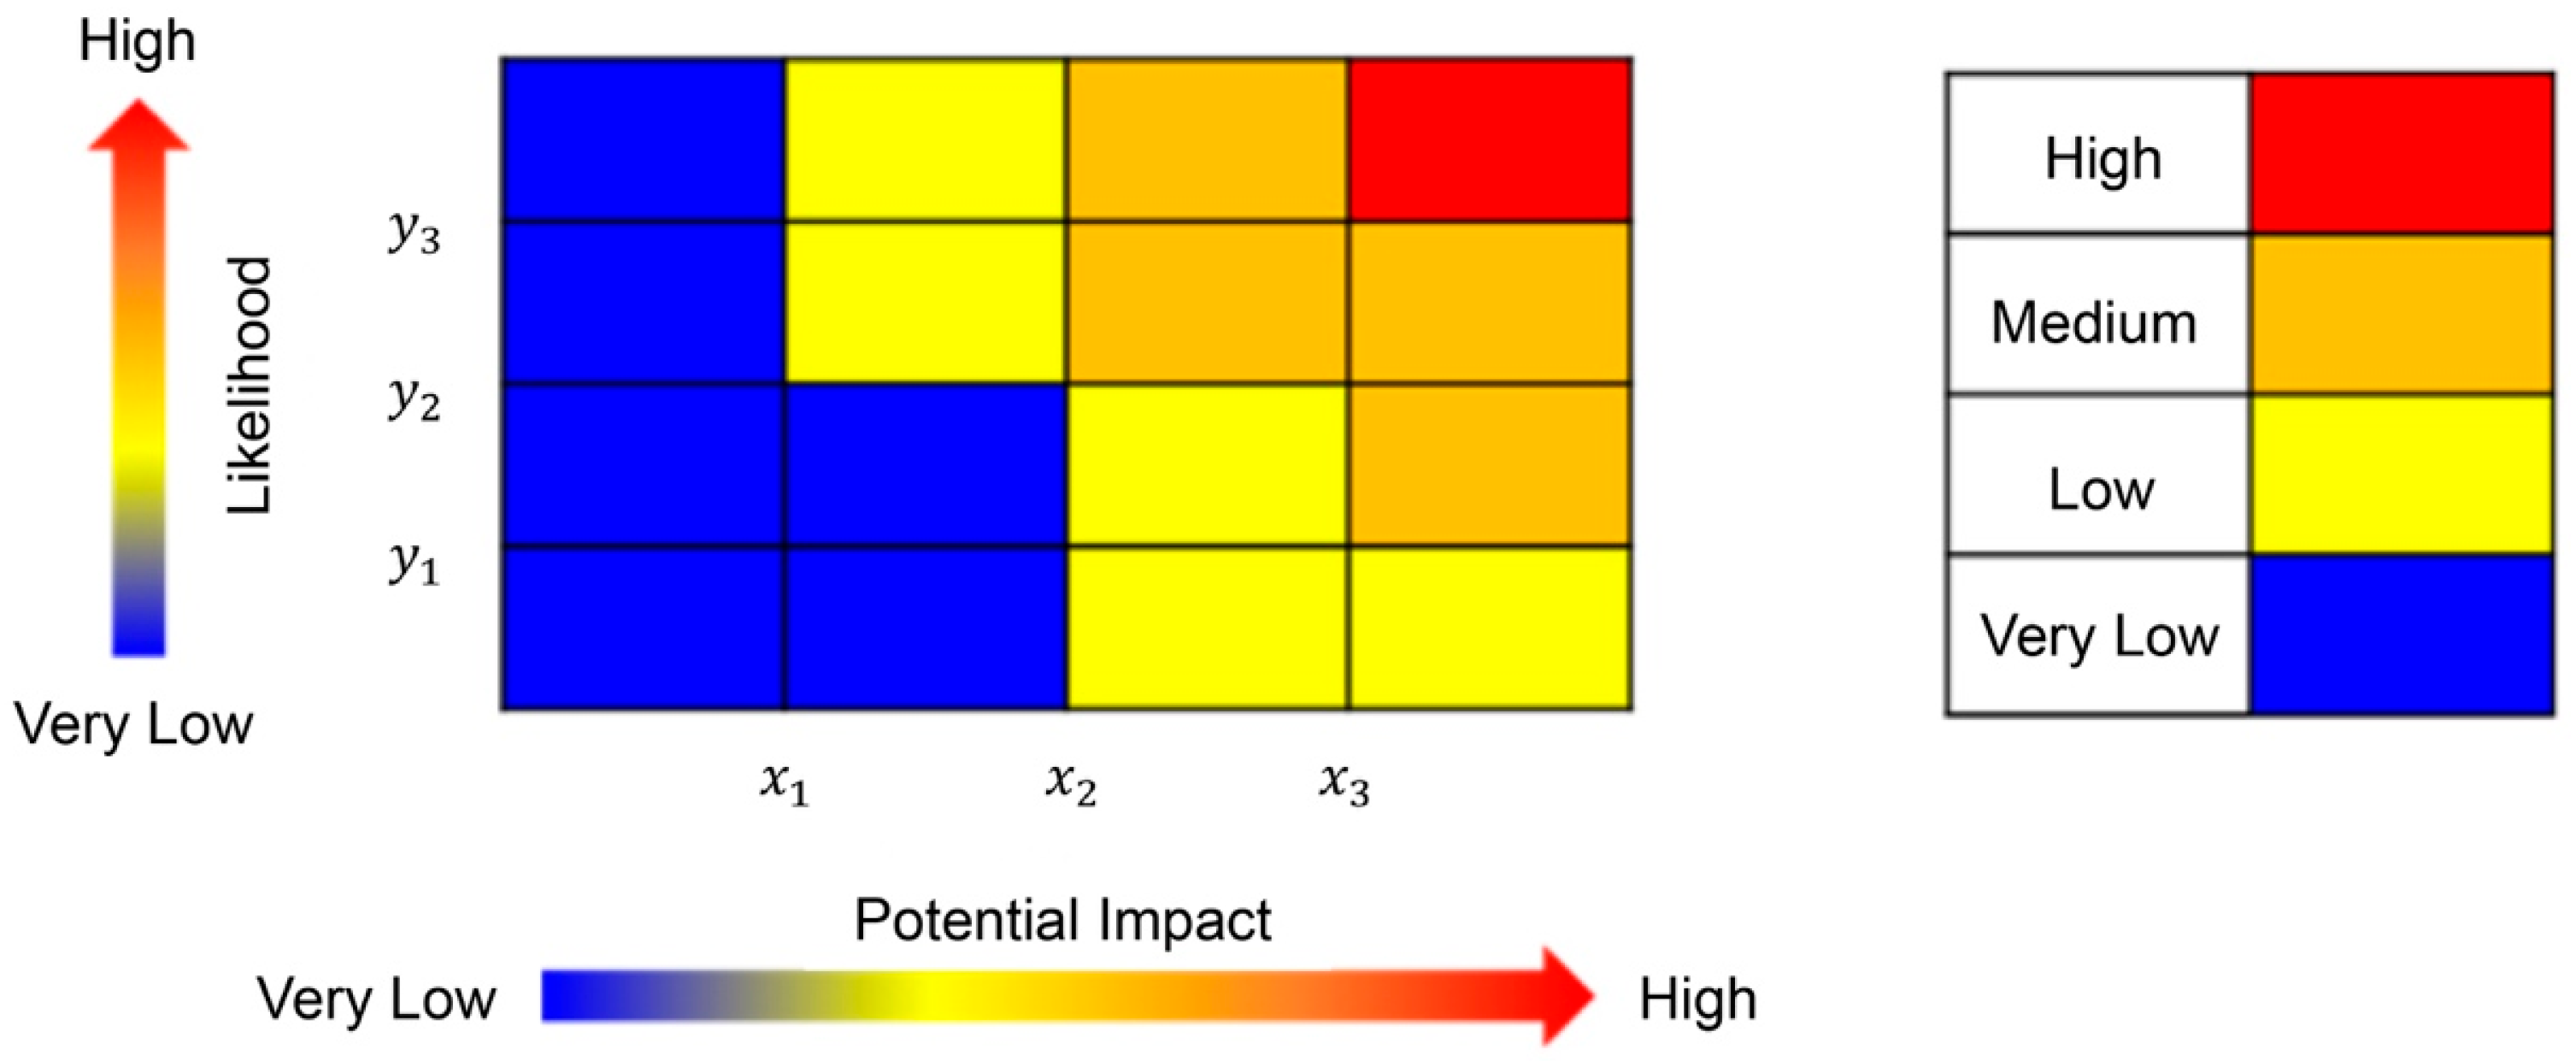
The flood risk analysis model shown in Equation (5) can be represented as a matrix, with likelihood as the
X-axis and impact as the
Y-axis (
Figure 6).
2.5.2. Flood Risk Mapping
The flood risk map was created by mapping the land cover changes over four different periods—the 1980s, 1990s, 2000s, and 2010s, along with the flood scenarios caused by Typhoon Chaba in 2016—under non-rainfall and maximum rainfall conditions. The categorization legend of the flood risk map was based on the natural breaks classification method for flood risk [
44], and the legend was divided into five classes (5–1, with higher numbers indicating higher risk), as shown in
Figure 7.
2.6. Lee–Sallee Shape Index Technique
The Lee–Sallee shape index (LSSI) technique is an analytical method that measures spatial accuracy by calculating the intersection area between the objects of comparison. The accuracies of the spatial position of the reference and comparison data are measured using the value calculated, as shown in Equation (6). The resulting value is expressed as a number between 0 and 1, with a higher value indicating a higher spatial position accuracy [
45].
Here,
denotes the reference value for comparison, and
denotes the value calculated by the model. The
technique is considered efficient because it considers spatial correspondence, as shown in
Table 1 [
46,
47].
3. Results
3.1. Land Cover Change
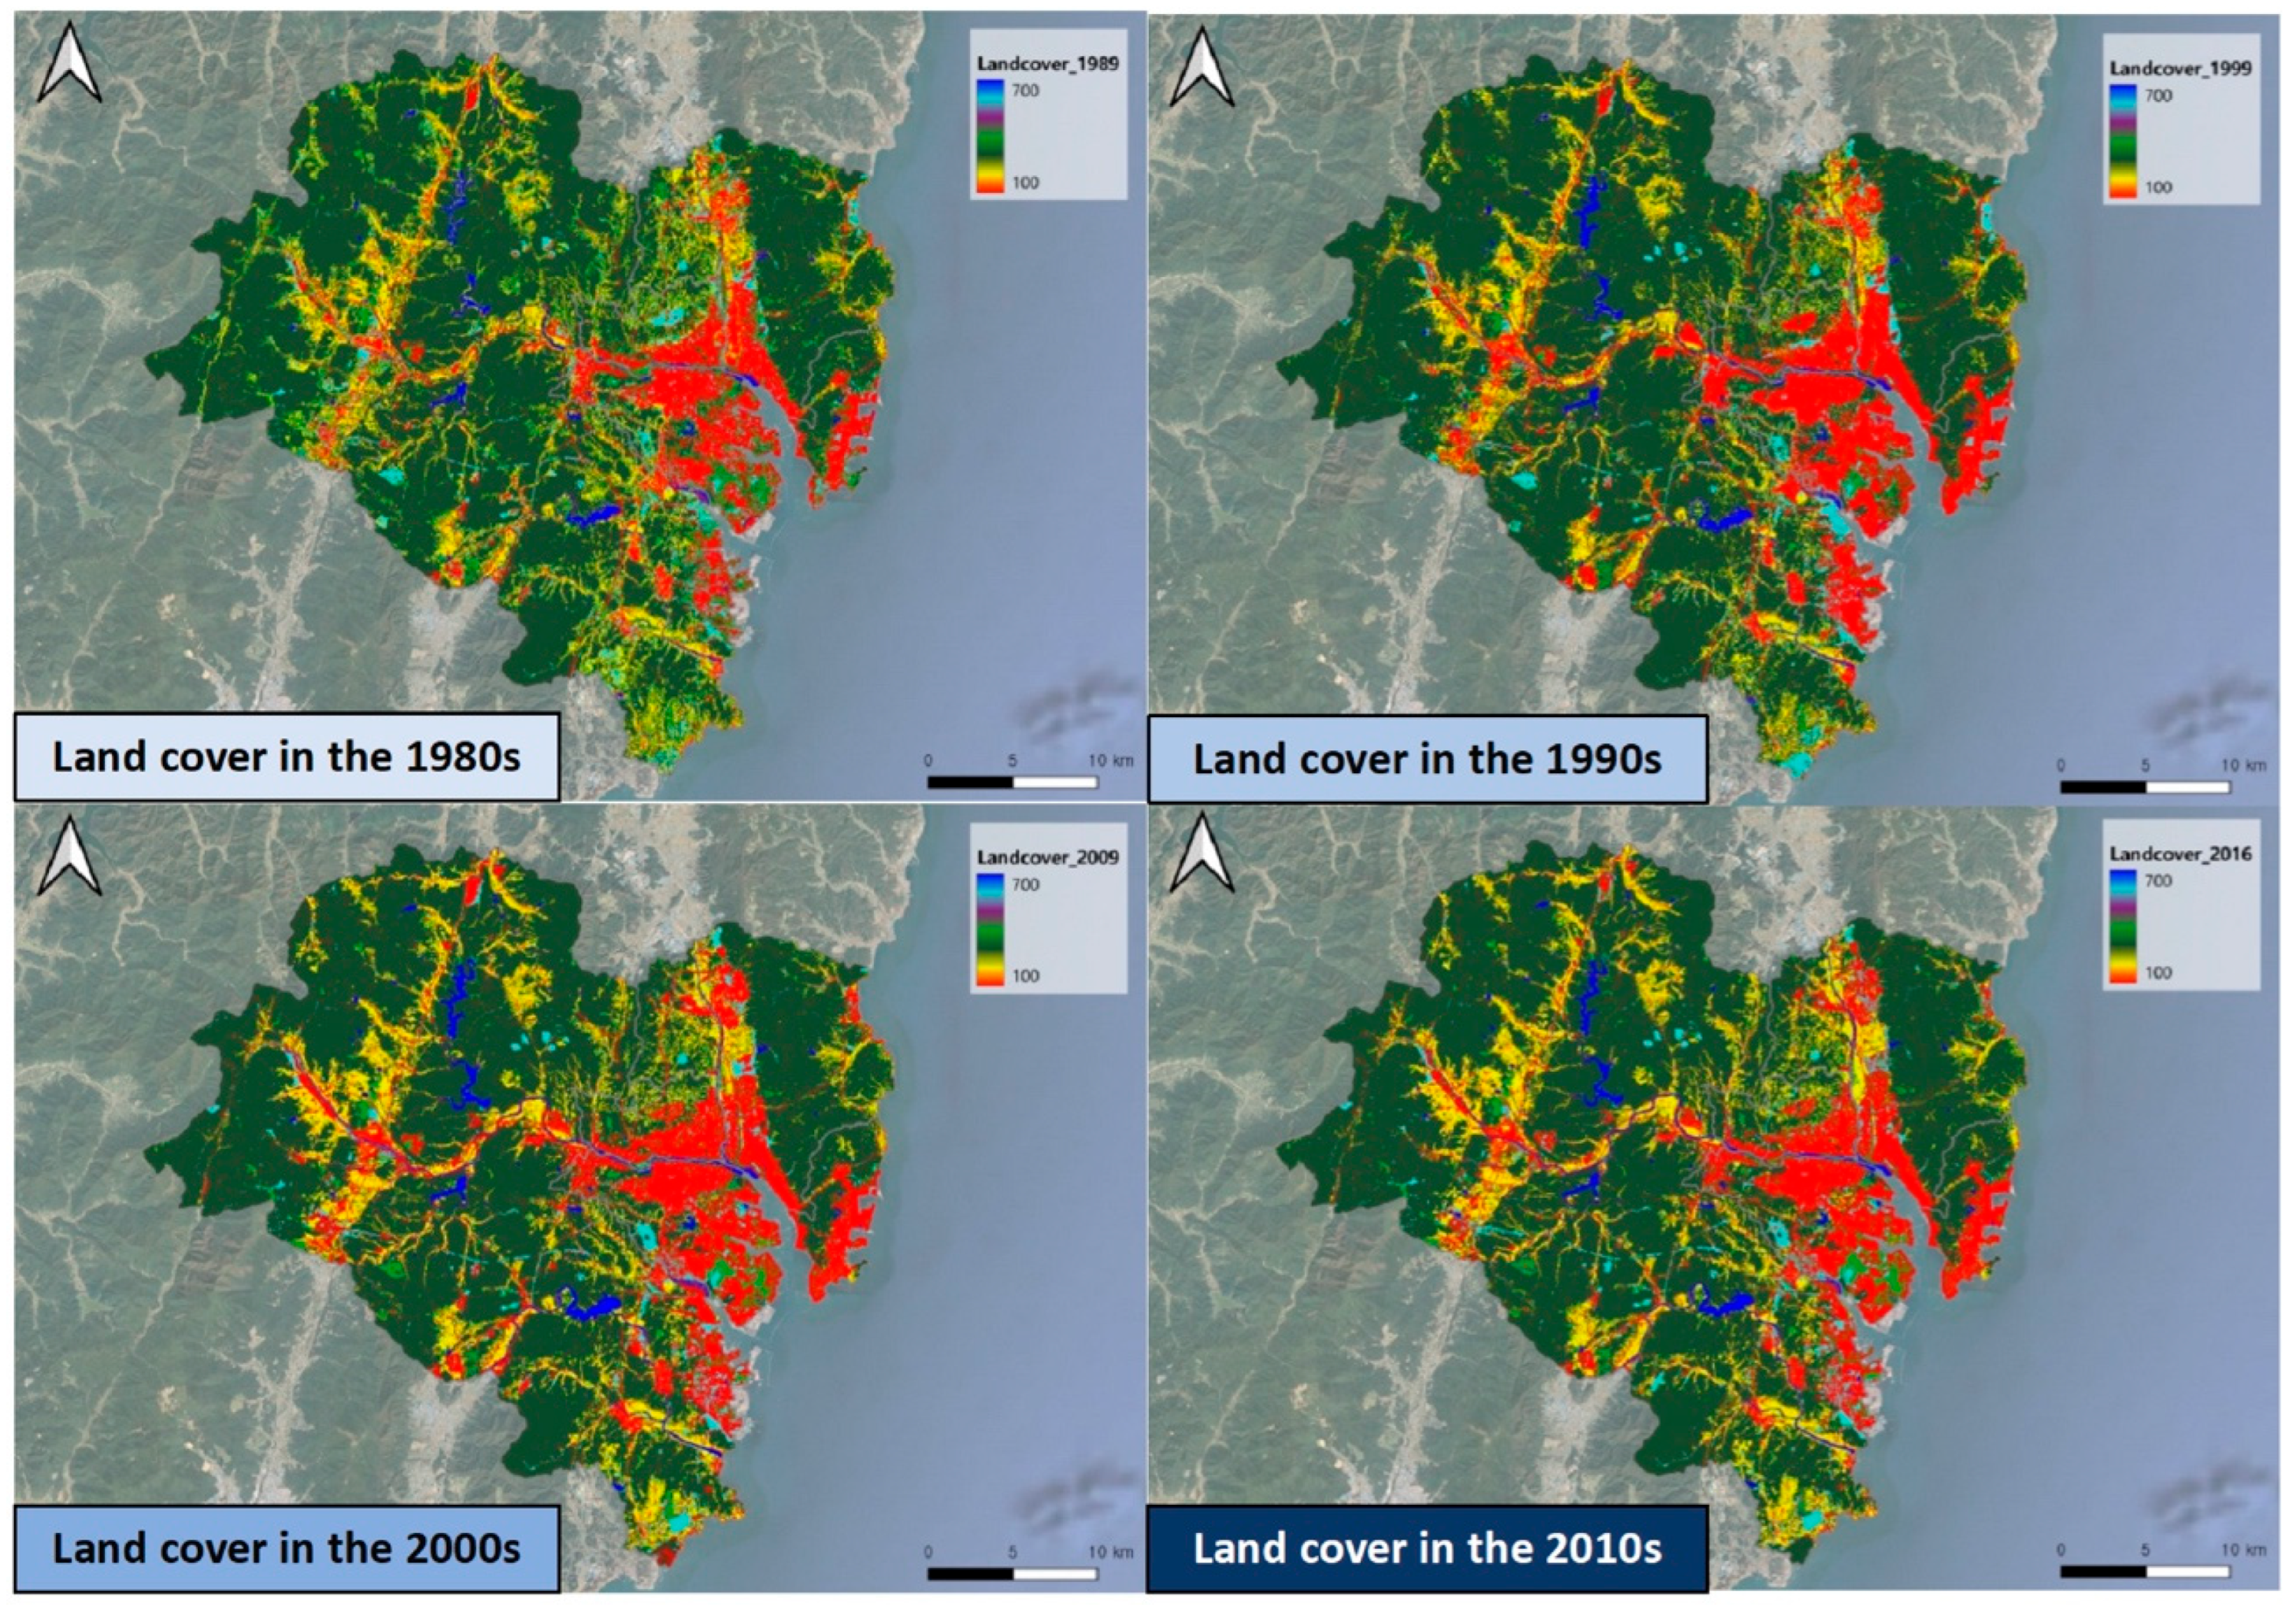
The major category codes were used to analyze the change in land cover from the 1980s to the 2010s (
Figure 8).
The land cover time series of Ulsan Metropolitan City, shown in
Figure 9, indicates that agricultural areas and forests decreased and urban areas and grasslands increased in the 1980s. In the 1990s, agricultural areas and grasslands decreased, and urban areas and forests increased. In the 2000s, agricultural areas and forests decreased, and urban areas increased. Over the past 20 years, agricultural areas have transformed into urban areas. However, the area corresponding to the change accounts for a mere 1% of the total area of Ulsan Metropolitan City. Ulsan Metropolitan City is a large city that has been under continuous development since the 1980s, and the recent land cover changes have been insignificant.
3.2. Interpretation of the Rainfall Probability Frequency
Data collected from the Ulsan Weather Station for the years from 1980 to 2022 indicated that the annual average rainfall exceeded 1500 mm in 10 years (1980, 1985, 1991, 1993, 1998, 1999, 2002, 2003, 2016, and 2020) and exceeded 2000 mm only in 1991 (
Figure 10).
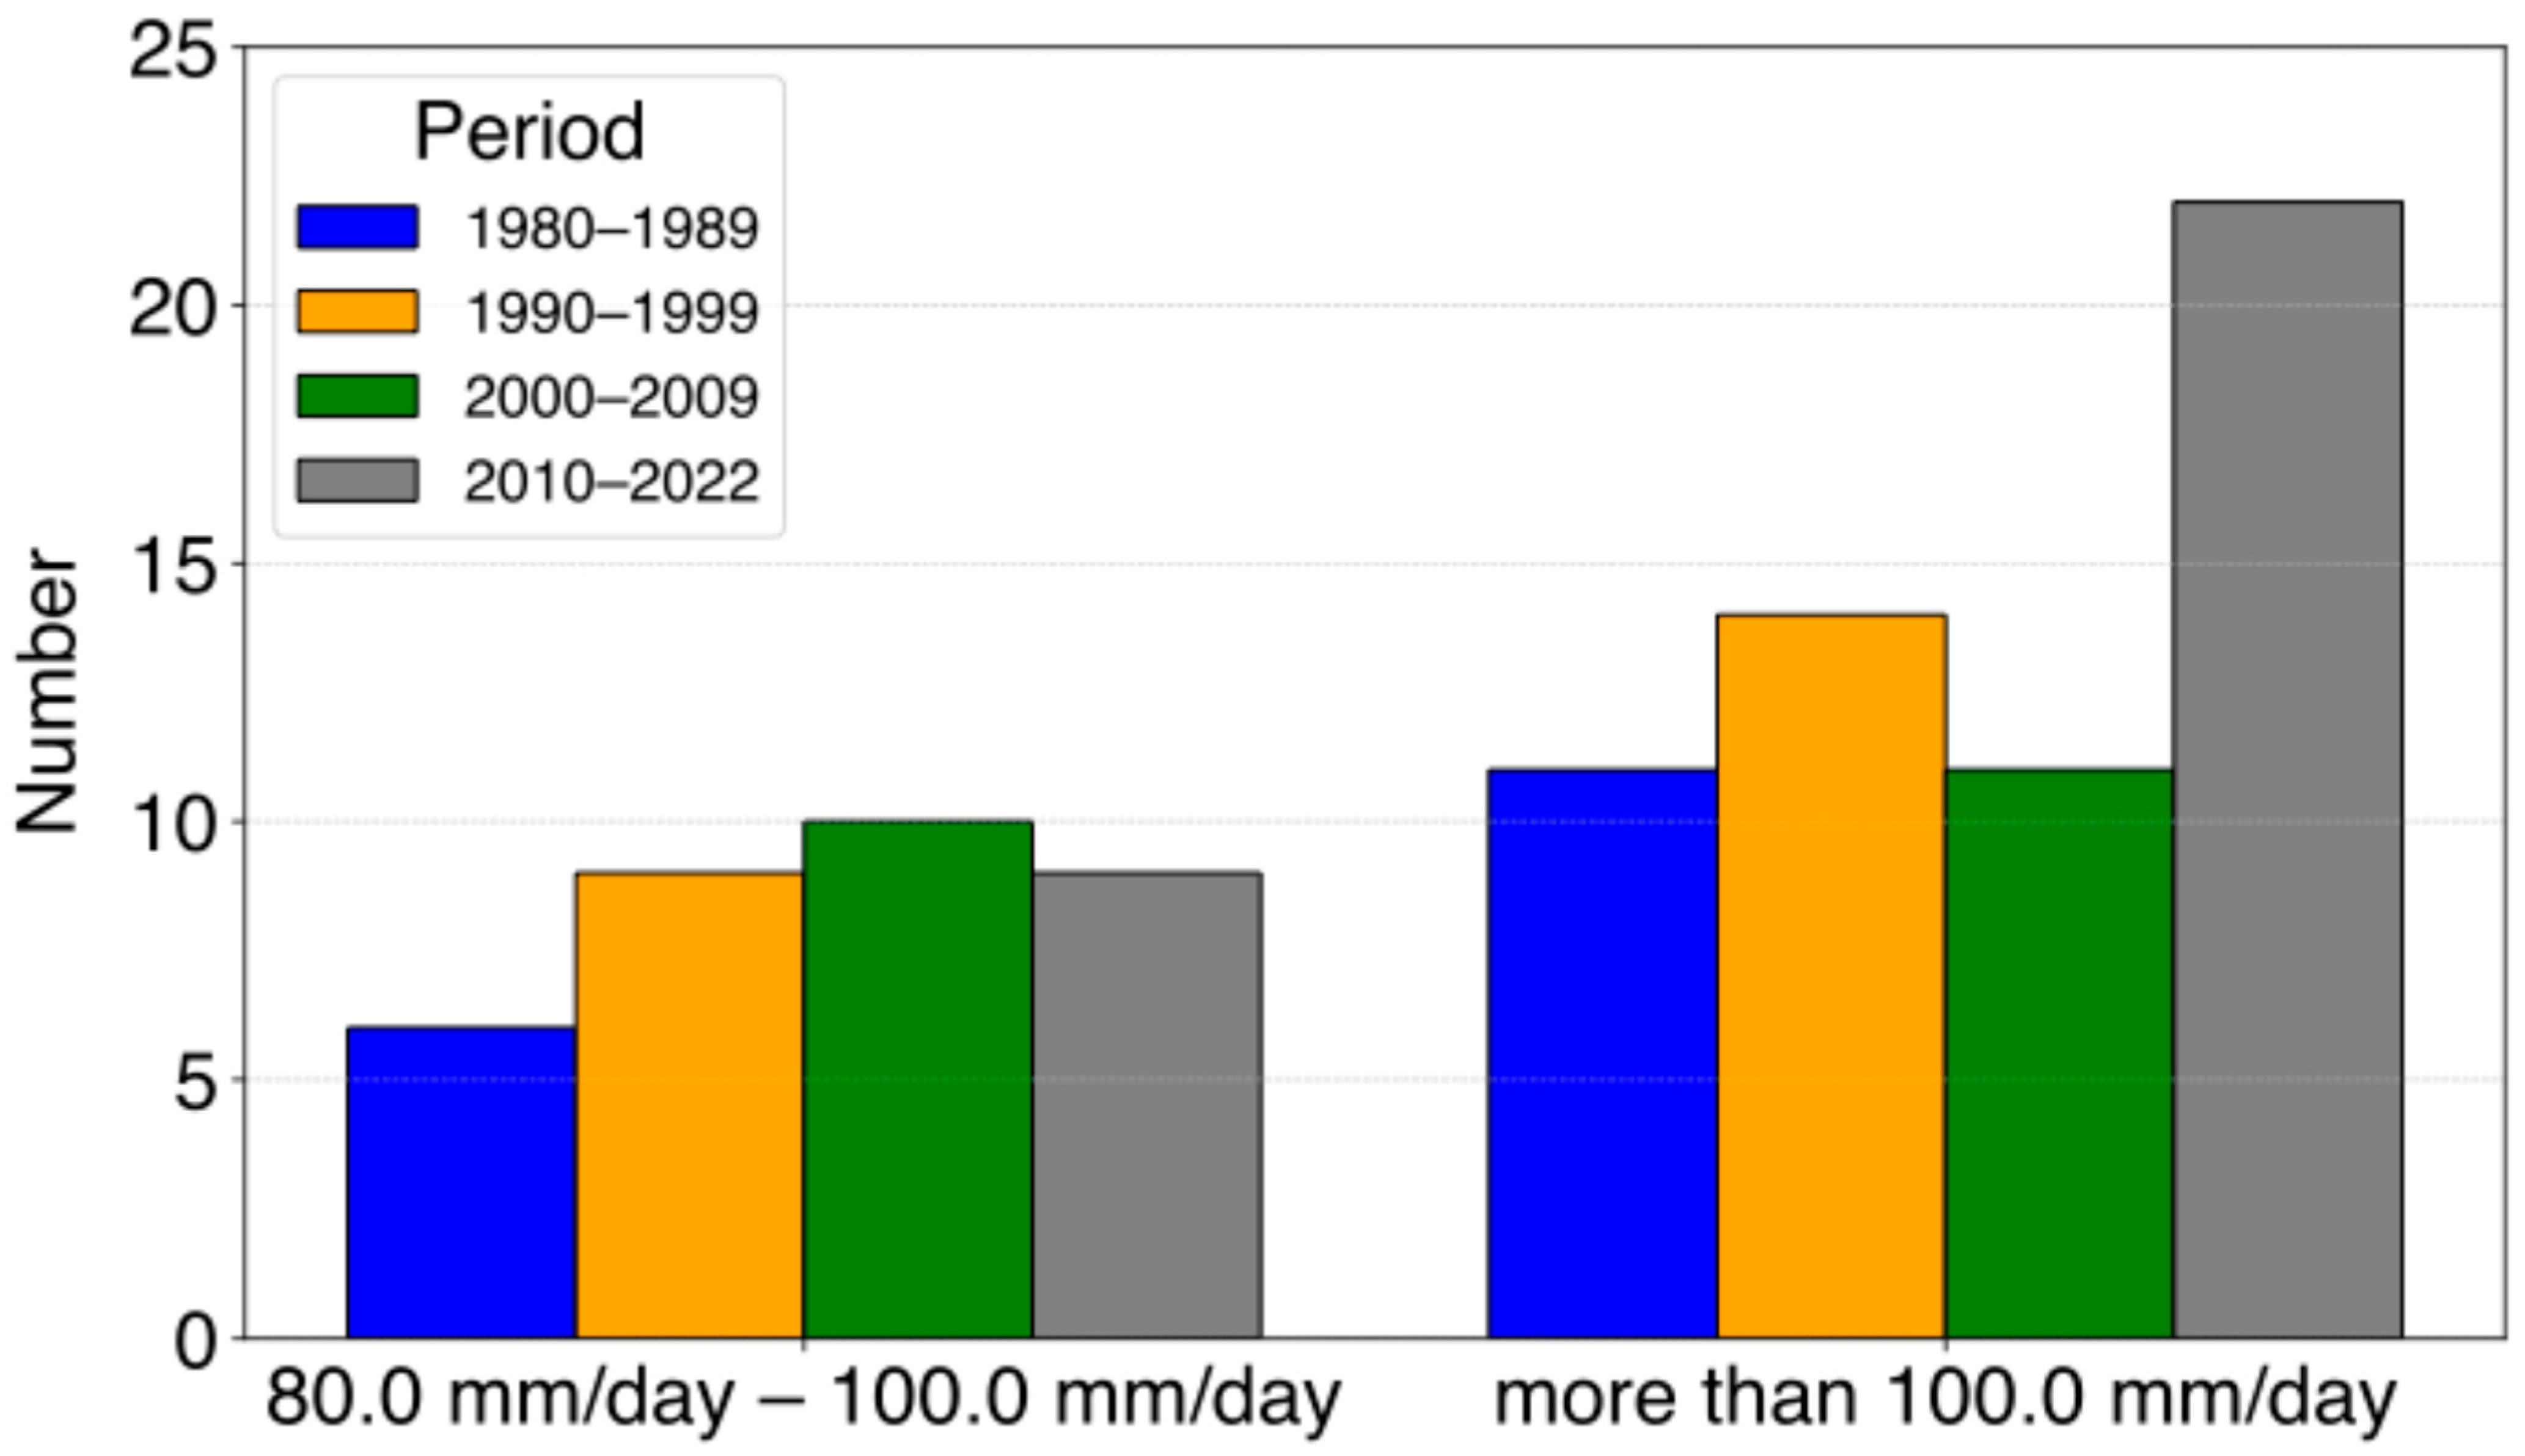
Figure 11 shows the annual daily rainfall for 10-year intervals. The number of days with daily rainfall between 80 and 100 mm since 1990 is largely similar. By contrast, the number of days with daily rainfall exceeding 100 mm was more than twice as high in the period after 2010 compared to other periods.
The annual precipitation data from the 1960s to the 2010s were obtained from the Korean Meteorological Administration.
Figure 12 shows the annual maximum rainfall at the Ulsan Weather Station between arbitrary time intervals for different durations. The Gumbel distribution for the precipitation probability for each duration and interval can be estimated via the probability-weighted moment method (
Table 2). The probable rainfall, shown in
Table 2, can be expressed as a cumulative probability distribution function by converting it into rainfall intensity (
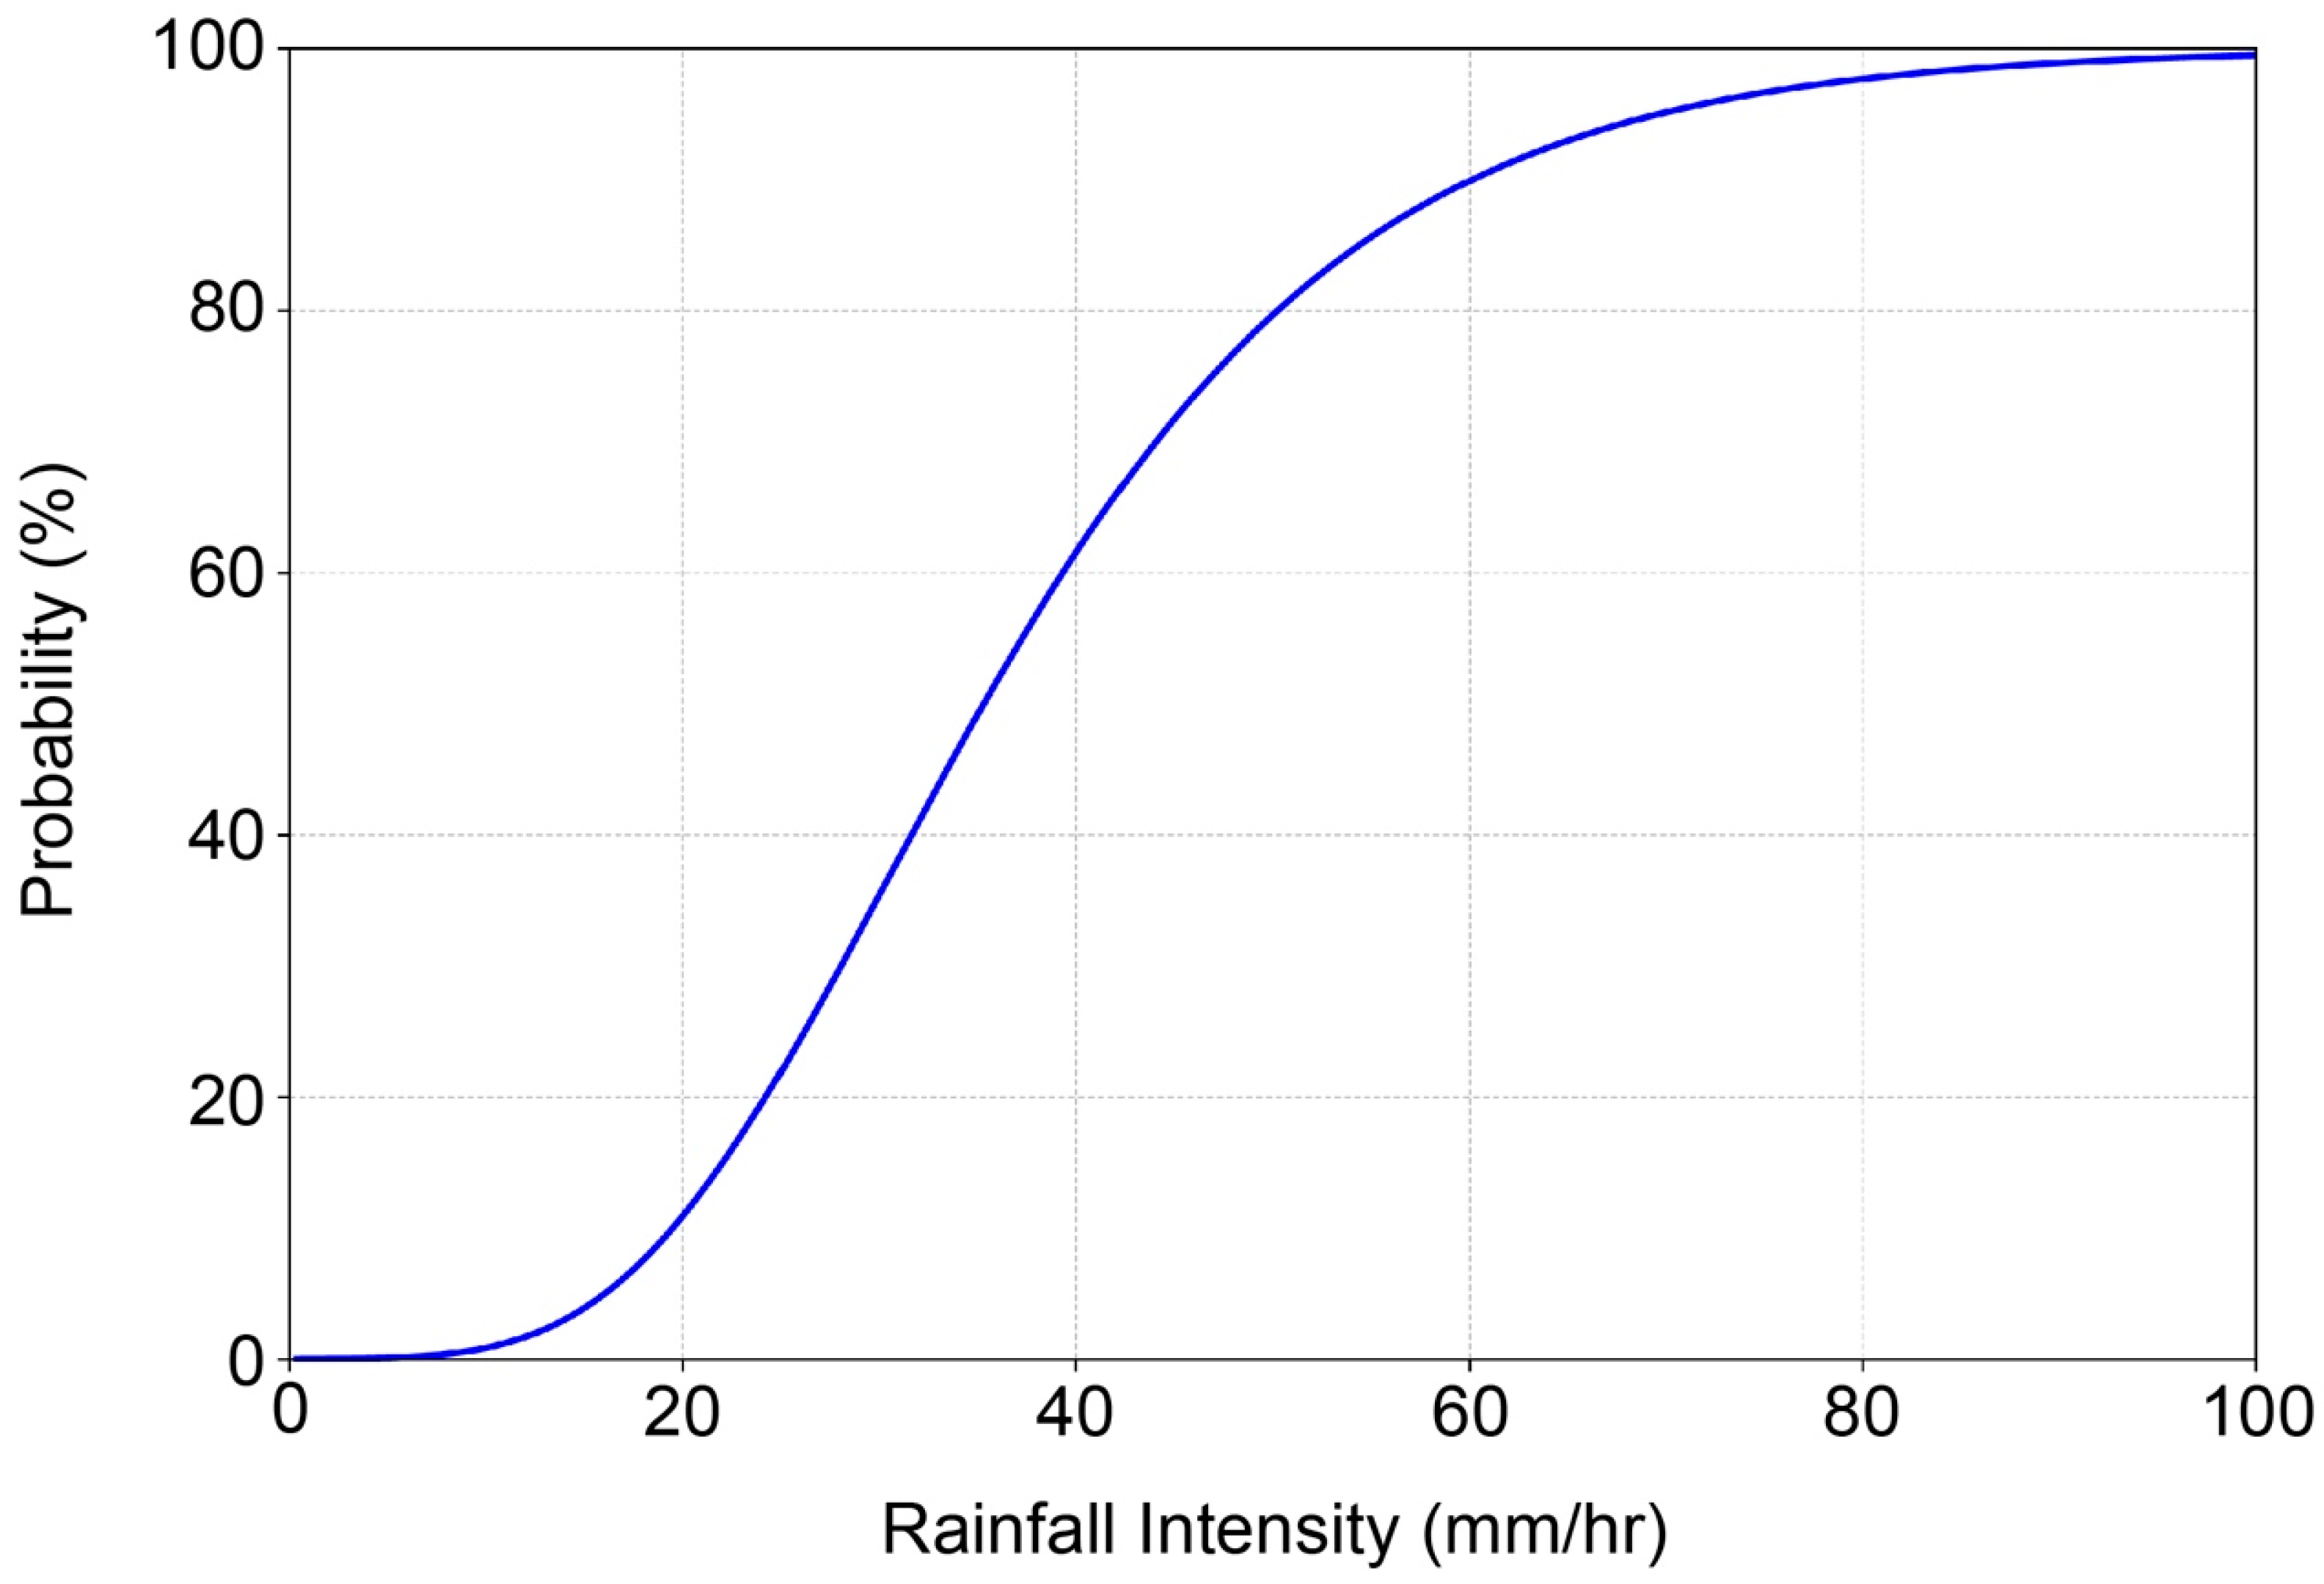
Figure 13). In this context, the cumulative probability can be defined as the likelihood of risk based on rainfall.
The Gumbel cumulative probability distribution (
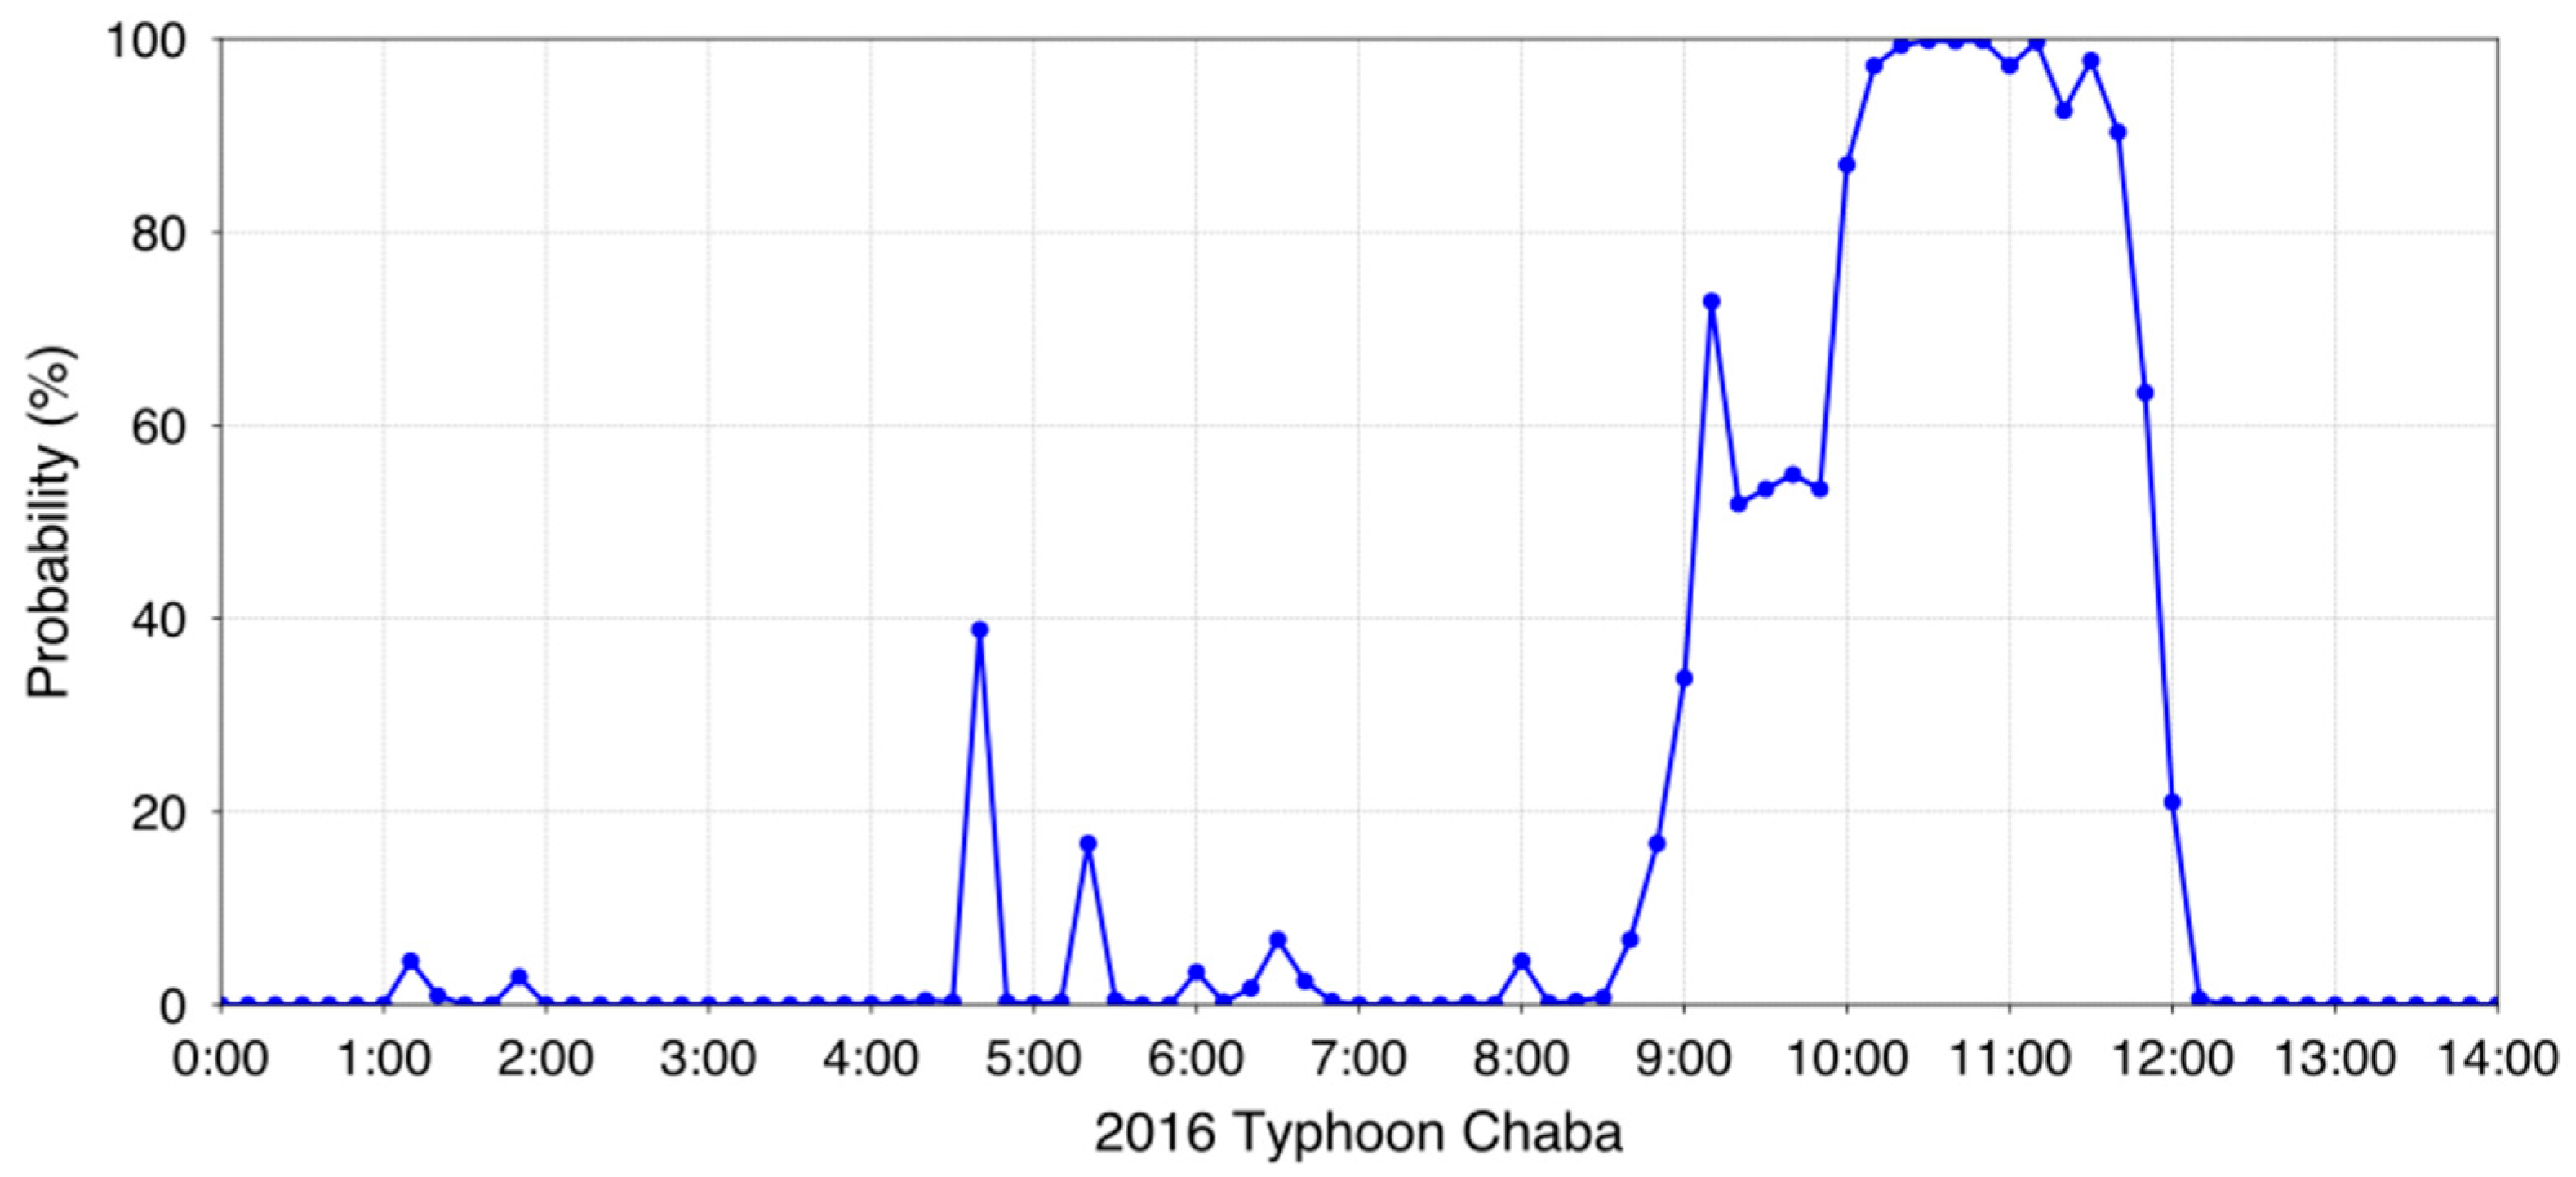
Figure 13) was used to determine the maximum likelihood of rainfall-induced risk occurrence during 2016 Typhoon Chaba (from 00:00 to 14:00 on 5 October).
Figure 14 shows the risk occurrence likelihood according to rainfall intensity. The calculated maximum likelihood of rainfall-induced risk occurrence was 99.83%. Additionally, the period from 10:00 to 11:40, during which the probability exceeds 85%.
3.3. Construction of Flood Susceptibility Maps
Figure 15 shows the flood risk impact calculated using the matrix model as detailed in
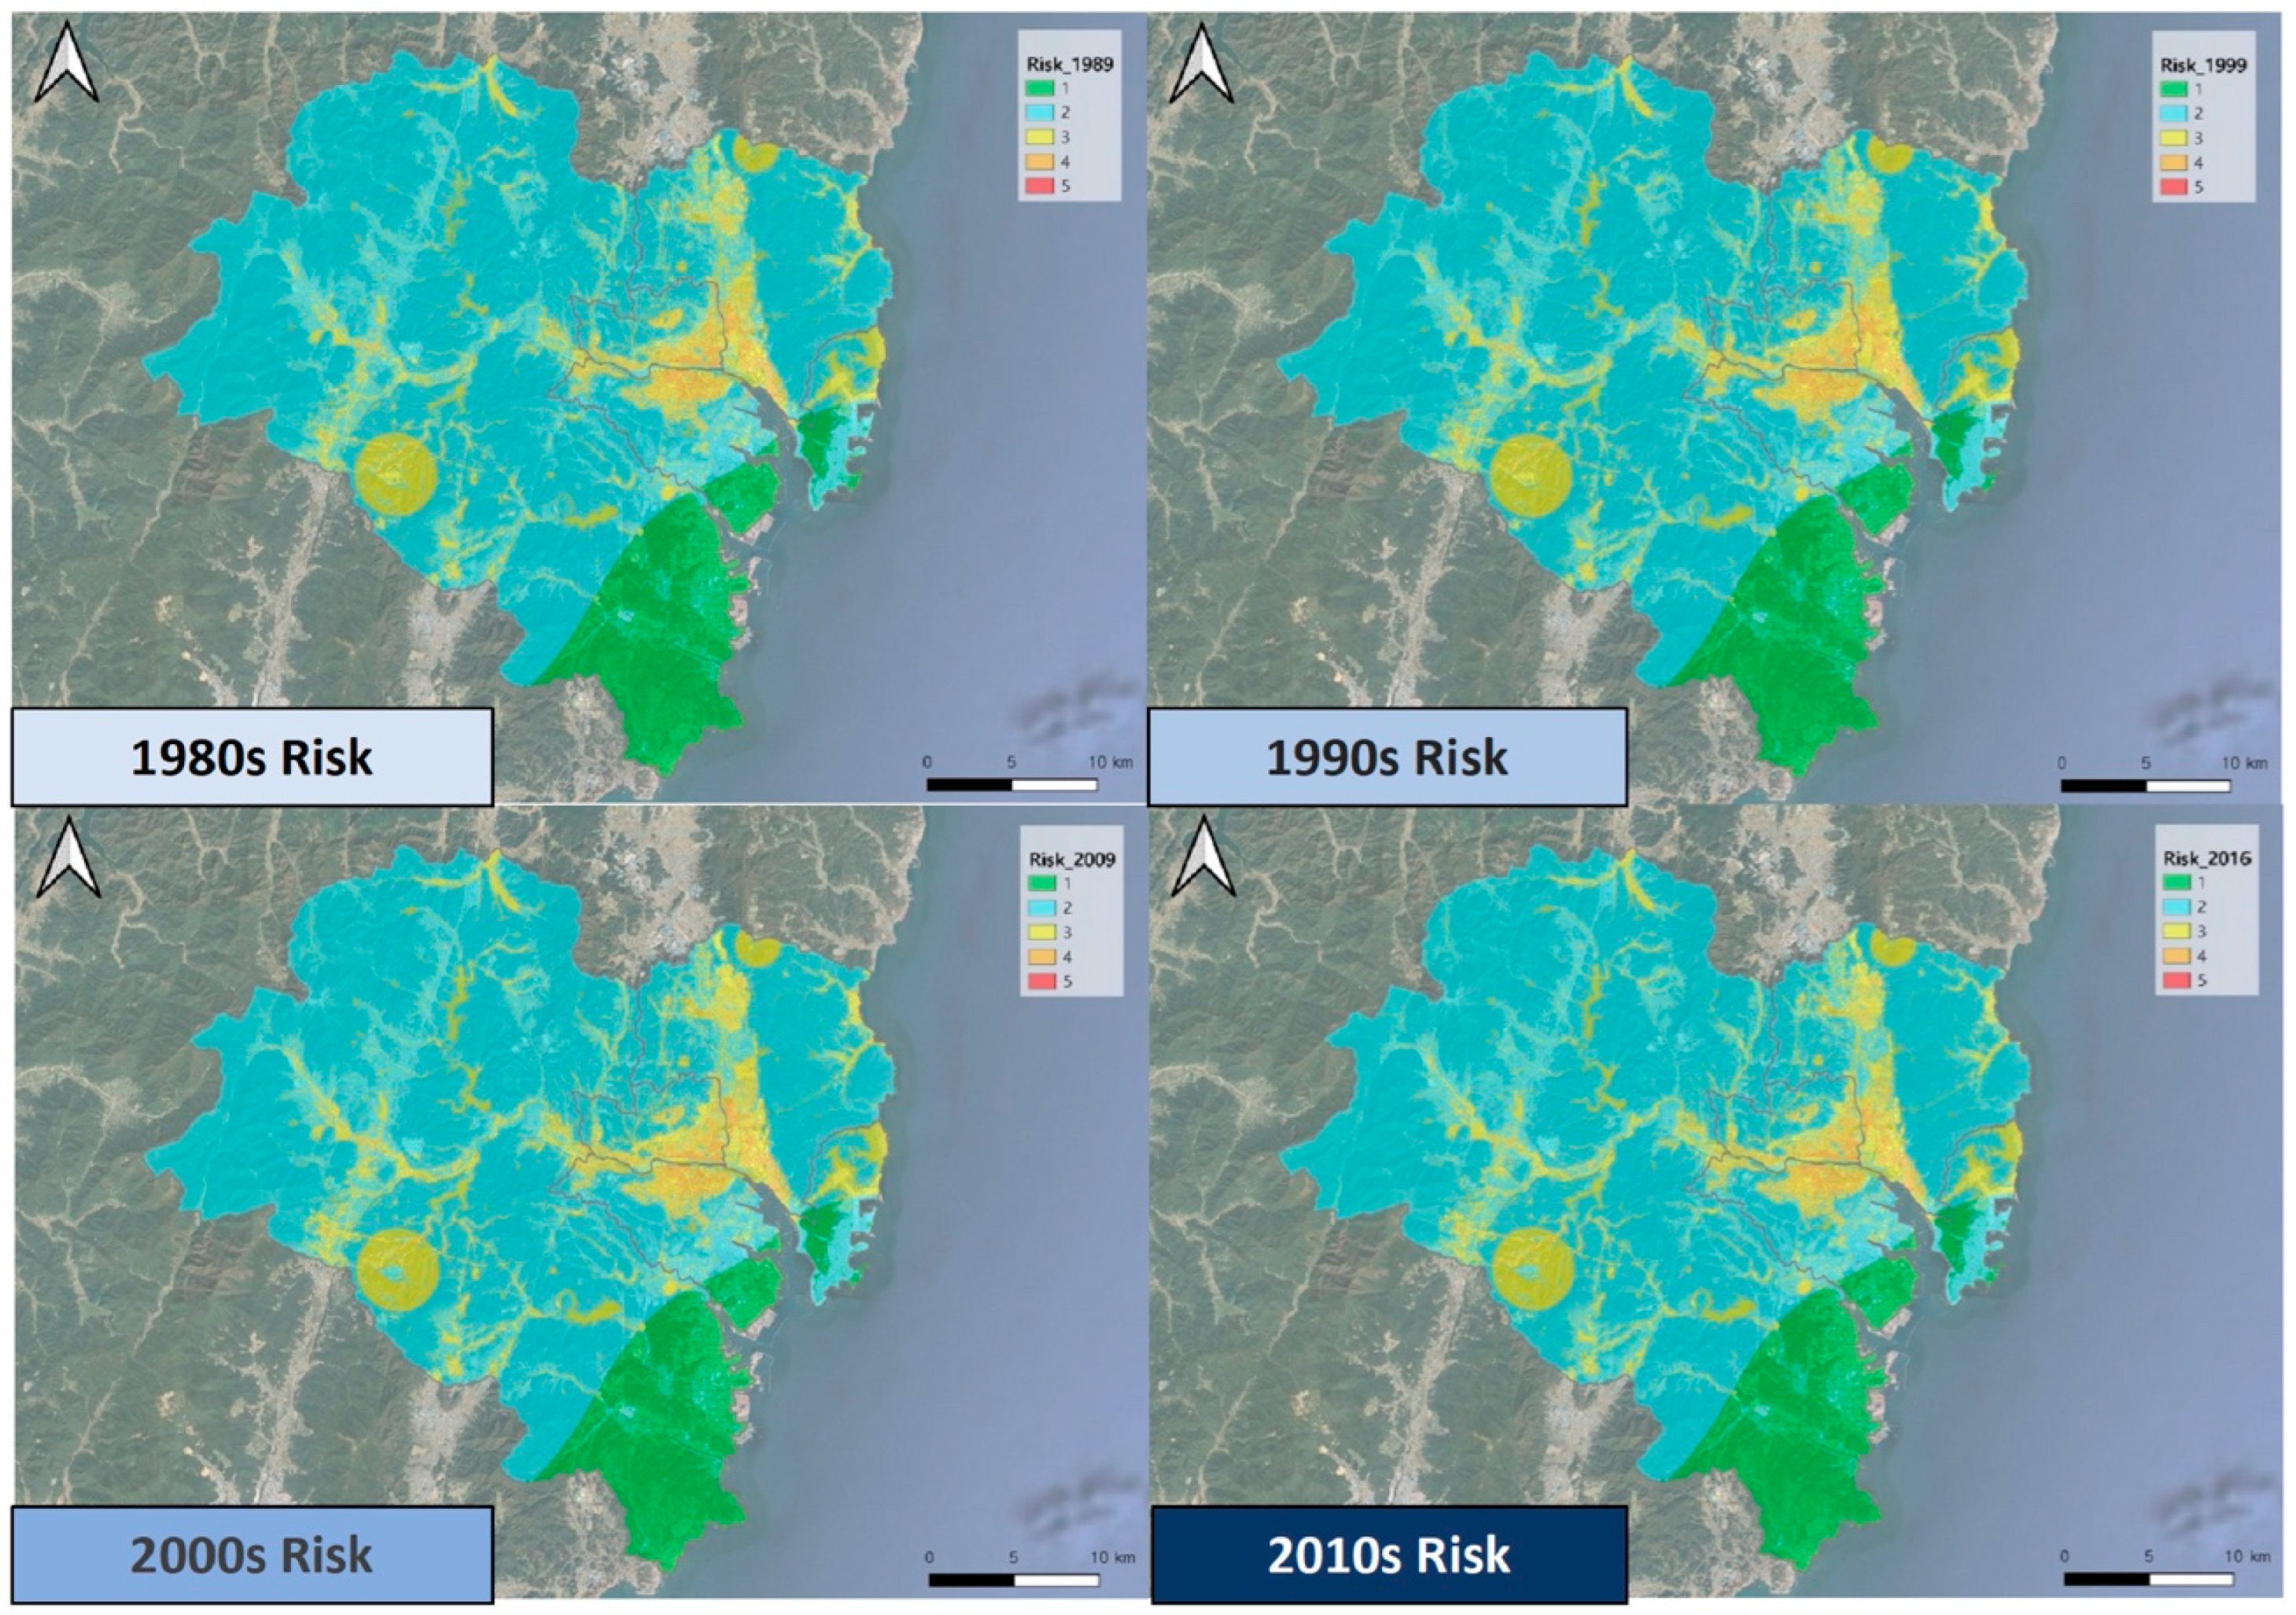
Section 2.5.2. The applied flood scenario was based on Typhoon Chaba. The maximum value of the flood risk impact index was chosen as the reference value, and the variation in the flood risk impact index from the 1980s to the 2010s was analyzed by comparing the maximum value. The maximum values of the flood risk impact index were 69.91, 69.85, 74.66, and 74.66 for the 1980s, 1990s, 2000s, and 2010s, respectively. The maximum value increased monotonically from the 1980s to the 2000s; however, it did not change from the 2000s to the 2010s. The development activities at Ulsan Metropolitan City and other similar major cities were undertaken in accordance with urban planning during a certain period (prior to urbanization in 1980). However, the land cover change has been minimal because of land cover regulations, and consequently, the change in the flood risk level owing to land cover changes is insignificant (
Figure 16).
Typhoon Chaba, which struck Ulsan in 2016, caused significant damage and resulted in a recorded rainfall of 382.5 mm over a period of 14 h, with a maximum rainfall intensity of 114.6 mm/h, surpassing a rainfall frequency of over 500 years. As shown in
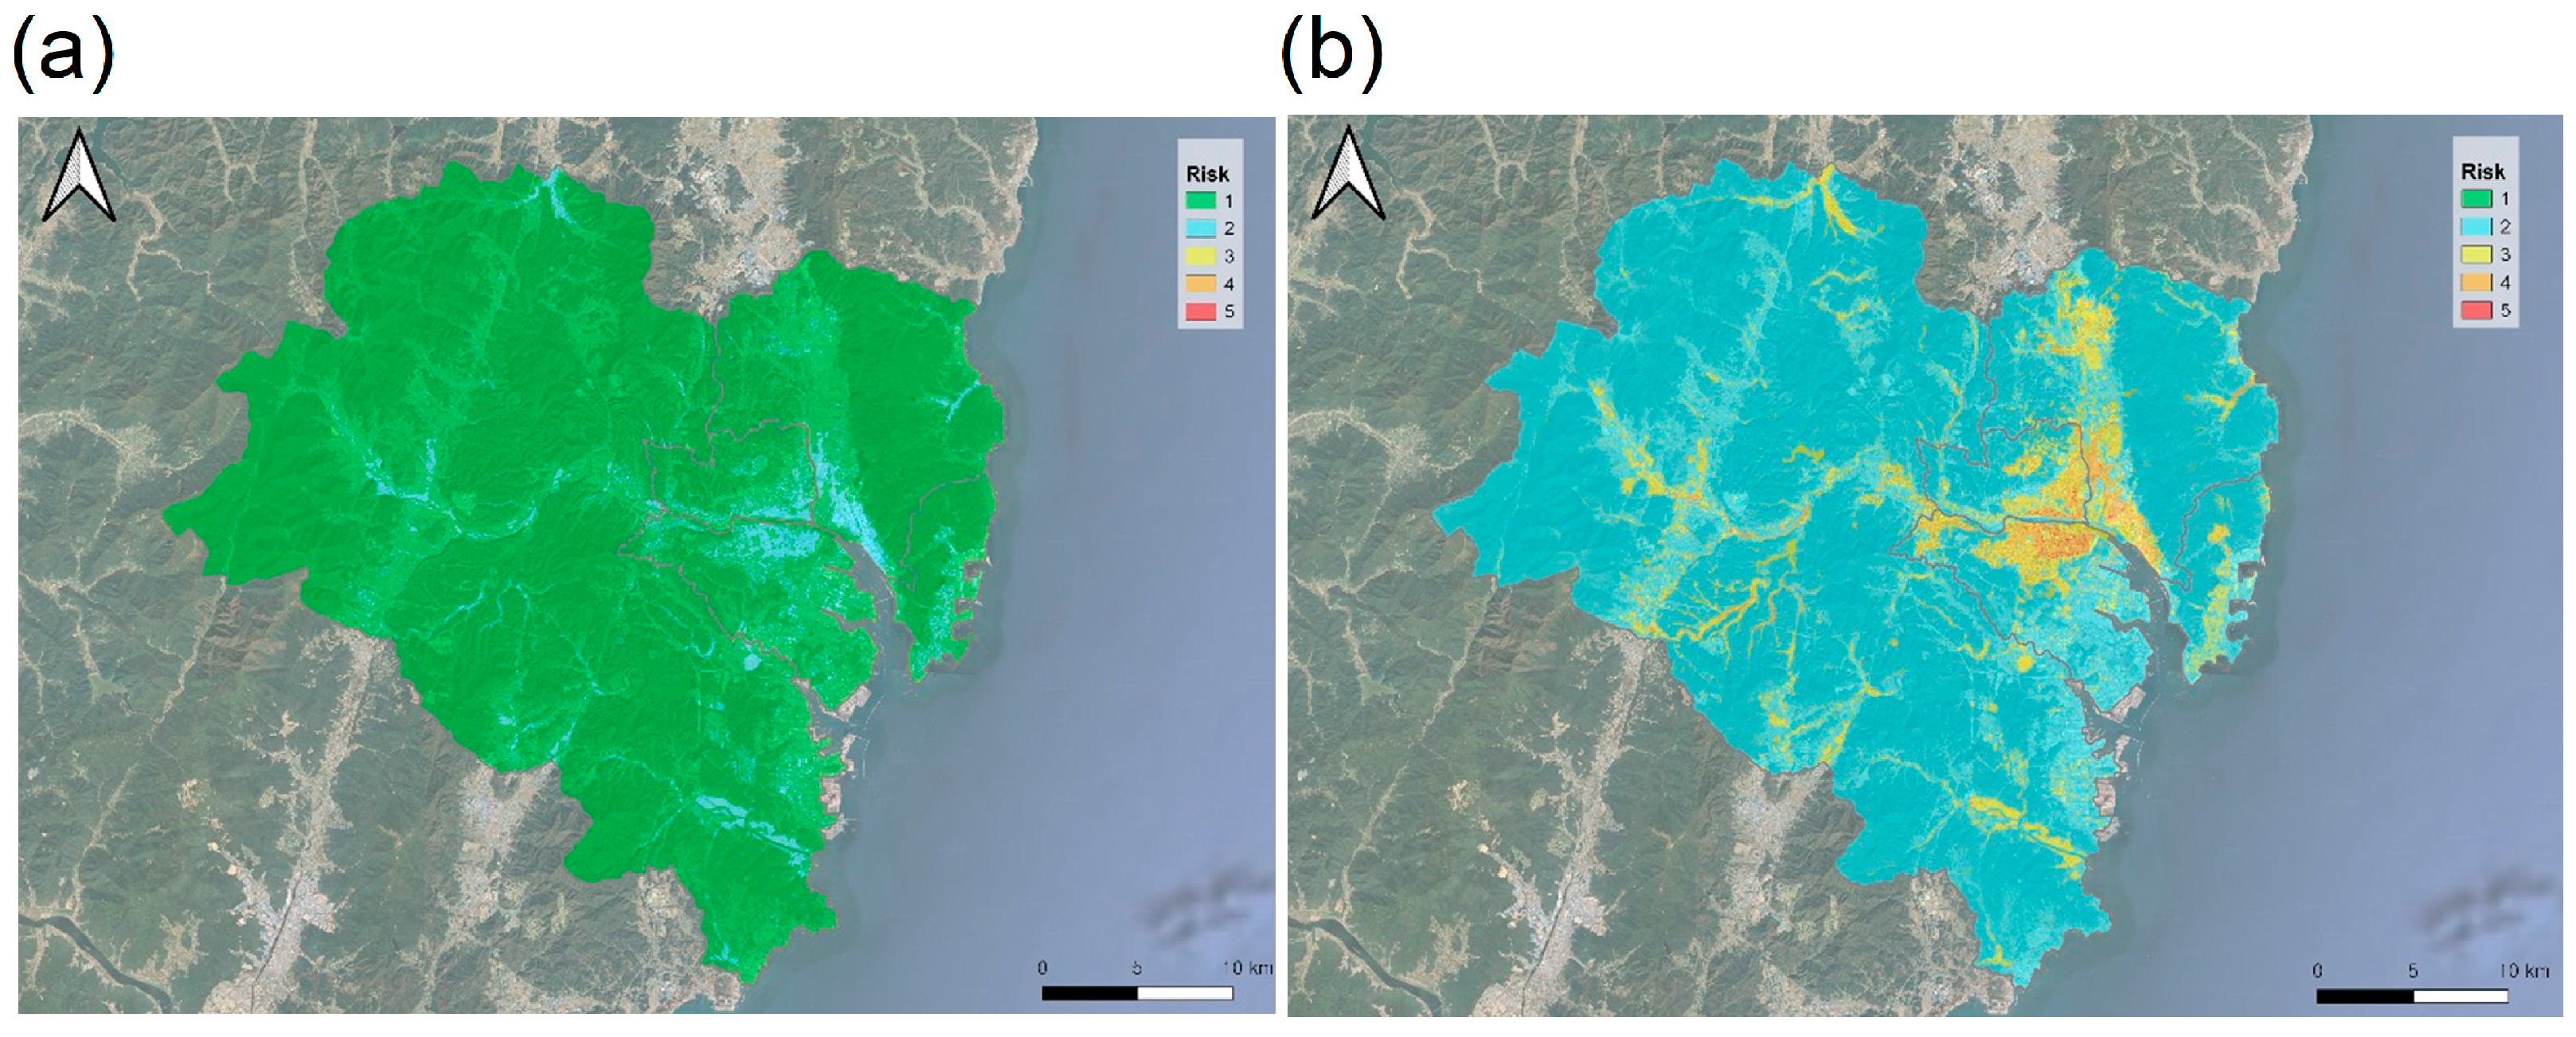
Figure 14, there was no rainfall at 00:00. However, the rainfall intensified between 09:30 and 12:00 and reached its maximum at 10:50. The rapid and intense rainfall over a period of 2 h and 30 min increased the water level of the river. The corresponding flood risk was calculated and is shown in
Figure 17.
Figure 17a shows the flood risk calculated under the no rainfall condition at 0:00, while
Figure 17b shows the flood risk calculated under the maximum rainfall condition at 10:50. The analysis revealed that the risk class of the grids changed from Class 1 to Class 2–5, as shown in
Table 3.
3.4. Validation and Model Performance
Ulsan Metropolitan City comprises 58 local administrative districts, corresponding to the smallest flood management units. In this study, different flood risk conditions were generated and compared to validate the findings. The flood risk map was divided into three areas: the inundation trace area, representing the areas affected by actual flooding; the inland flood area, determined based on the river overflow and urban flooding physical model results; and the coastal flood area, determined based on the results of storm surge physical models. Herein, the risk levels derived from these areas, aggregated at the administrative district level, were compared and validated.
At 10:50, which is the time corresponding to the maximum rainfall during Typhoon Chaba in 2016, the average flood risk class for the 56 administrative districts was 2.478. Among the administrative districts, the average flooding risk class was highest for Sinjeong-5-dong at 3.850 and the lowest for Ilsan-dong at 1.940. The inundation trace area was observed in only 39 of the 56 administrative districts. Jungang-dong had the highest value of 4.161, whereas Nongso-2-dong had the lowest value of 2.123. The inland flood area was observed in 45 districts. The calculated maximum and minimum values were 4.091 and 2.974 for Nammok-1-dong and Seonam-dong, respectively. The coastal flood area, formed around the coastal areas and rivers, was observed only in five administrative districts (i.e., in less than 10% of the districts); Yangjeong-dong had the highest value of 3.390, and Gangdong-dong had the lowest value of 1.145. Comparing the average risk class of each administrative district with the inundation trace area, inland flood area, and coastal flood area, the inundation trace area is observed to be 0.620 higher, the inland flood area is 0.958 higher, and the coastal flood area is 0.228 higher than the administrative district average risk class. Therefore, the results of the flood risk analysis model used in this study are valid.
Accounting for all three areas—inundation trace area, inland flood area, and coastal flood area—is necessary for a quantitative comparison of the risk classes by administrative district. However, coastal flood areas were present in only five administrative districts. Therefore, for a quantitative comparison, we selected 35 administrative districts, including both inundation trace areas and inland flood areas. As shown in
Figure 18, the inundation trace area and inland flood area had higher values for the risk class compared to the reference risk class, except for one class. This shows that inland flooded areas, which are used to assign river class values in the risk analysis model, have a higher risk class due to data correlation. By contrast, the inundation trace area can be considered a validation dataset that maintains independence in both data input and analysis. Hence, the results obtained via the flood risk analysis model in this study are statistically significant.
The area of intersection of the risk class was calculated via the LSSI technique for inundation trace areas and inland flood areas, and the results are shown in
Table 4. For the inundation trace areas, the accuracy for risk class 4 or higher was 25%, indicating fair performance, and the accuracy for risk class 3 or higher was 61%, indicating excellent performance. For the inland flood area, the accuracy for risk class 4 or higher was 32%, indicating good performance, and the accuracy for risk class 3 or higher was 85%, indicating excellent performance. The average risk classes for the inundation trace area and inland flood area were 2.8 and 3.2, respectively. Thus, an average flood risk rating greater than 2.8 indicates a likelihood of inundation, and an average flood risk rating greater than 3.2 indicates the likelihood of an inland flood.
4. Discussion
According to Statistics Korea, the average number of permit applications for land cover changes owing to development activities nationwide from 2012 to 2021 was 276,829 (249,327 cases in 2020 and 305,968 cases in 2016). The areas that restrict development permits vary considerably in size, ranging from 78.3 km2 (in 2017) to 354.8 km2 (in 2019). The land cover change map from the 1980s to the 2010s indicates that the agricultural area decreased by 2,495,000 km2, while the urban area increased by 2,024,000 km2. From the 1980s to the 2010s, the average annual rainfall decreased, but the number of days with total daily rainfall exceeding 100 mm increased. When the outflow of a watershed is simulated, meteorological conditions (such as rainfall and water level) and topographical conditions (such as slope, length, and soil condition) are considered.
The change in outflow with the change in land cover for 80 watersheds in Korea in 2019 was analyzed; these watersheds were located in areas where no division or merger occurred, and their areas ranged from 1000 to 25,000 m
2 (
Figure 19). Comparing the land cover change and outflow change before and after the development activities indicated a proportional relationship between the land cover and outflow changes after development.
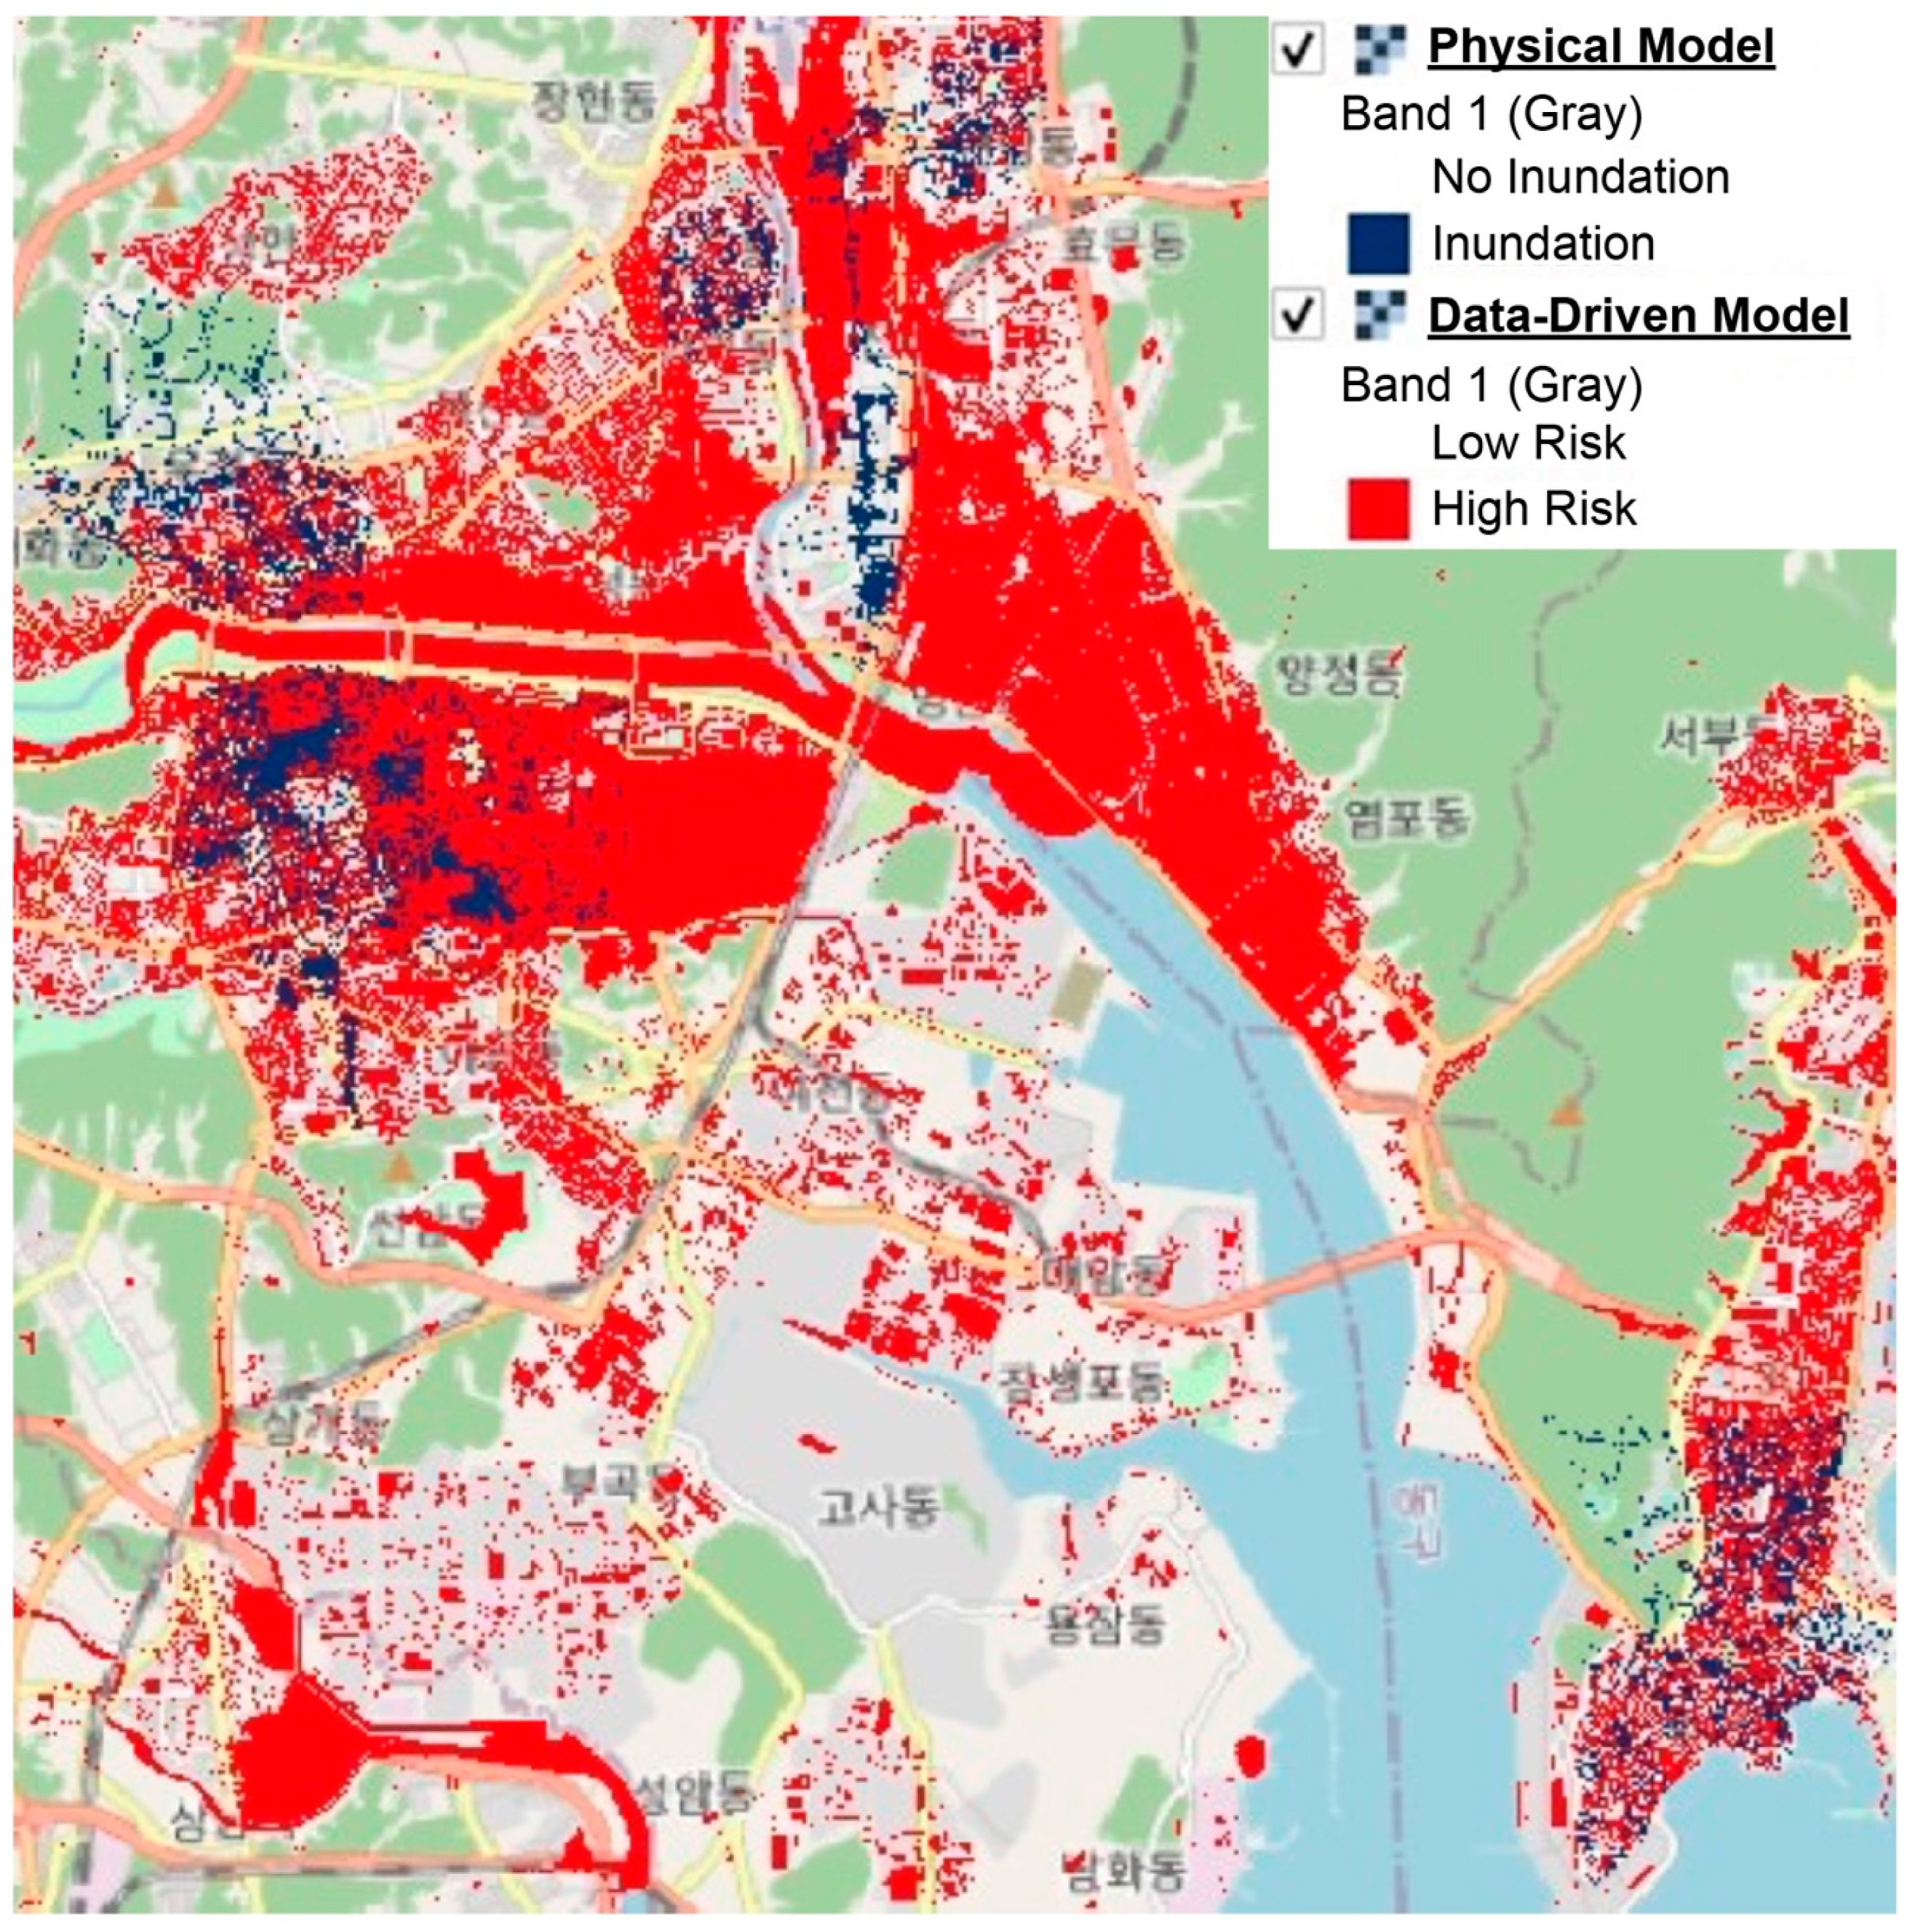
In addition, the results of a physical model were compared and validated with the results obtained in this study: rainfall of 78.5 mm with uniform probability was applied for a duration of 1 h over the eight administrative districts (Bangeo-dong, Bukgucheong, Byeongyeong-dong, Dal-dong, Hwajeong-dong, Hyomun-dong, Sinjeong-dong, and Taehwa-dong) where flood damage occurred in the past 50-year period. The performance was evaluated by creating a confusion matrix that directly compares the analysis values of the physical and proposed models (
Figure 20).
The confusion matrix presented in
Table 5 shows the number of inundation grids (inundation depth ≥ 0 m) and non-inundation grids (inundation depth = 0 m) in 190,807 grids of eight administrative districts. The number of high-risk grids (risk class ≥ 3) and low-risk grids (risk class 2) calculated via the model developed in this study is also shown.
The precision, recall, accuracy, and F1 score were calculated to evaluate the performance of the proposed model. The precision, which measures the extent to which the high-risk grid of the proposed model matches the inundation grid of the physical model, was 25.0%. The recall, which indicates the extent to which the inundation grid of the physical model matches the high-risk grid of the proposed model, was 49.3%. The accuracy, which represents the proportion of agreement between the results of the physical and proposed models, was 55.8%. The F1 score, which combines precision and recall, was 33.2%.
As shown in
Table 6, we have outlined the key differences between the physical model and our data-driven model, particularly in terms of their strengths, limitations, and how their results were applied in the context of the Ulsan flood scenario.
The flood risk can increase owing to land cover changes due to development activities. However, under the current development scenarios in major cities, social factors (such as buildings and population) and meteorological factors (such as typhoons and heavy rainfall) are expected to have a greater impact on flood risk.
The flood risk class analyzed in this study represents the relative risk within the scope of the analysis. However, the analysis has three limitations. First, precise numerical analysis models were not considered, and relevant quantitative hydraulic information, such as inundation depth, water movement speed, and outflow, were excluded. Second, the spatial information of the original data used to construct the spatial data at a resolution of 10 m was limited. Third, the scope of the research pertaining to the demographic information by era was limited.
5. Conclusions
This study analyzed the flood risk in Ulsan Metropolitan City, located in the southeastern part of South Korea, to examine the flood risk areas with respect to the largest typhoon event in history. A data inventory related to flood risk was compiled, and the flood risk was analyzed using scenarios based on the greatest damage in history. The analysis model aimed to derive the risk severity in the form of ratings by converting the concepts of likelihood of risk occurrence and potential impact into the notions of vulnerability, exposure, and risk index.
The analysis results revealed that anthropogenic activities, such as the change in land cover in flood plains, can significantly contribute to flood risk, while changes in land cover driven by development regulations or continuous development policies in urban areas did not have a significant impact on flood risk. Therefore, targeted urban planning and development policies can effectively mitigate some aspects of flood risk, highlighting the importance of regulatory measures in urban flood management. In addition, short-term weather variations can exacerbate the hazardous conditions caused by flooding. Therefore, it is crucial to consider both the direct impact of short-term weather variations (such as extreme precipitation events) and the indirect effects of urban planning and land cover regulations on flood risk.
The model proposed herein has a shorter calculation time and higher accuracy than physical models. Thus, the flood risk analysis model proposed in this study, which can quickly simulate flood risks using easily accessible public data, can serve as a powerful tool for regional disaster prevention and preparedness. In addition, the flood risk model, which uses the risk occurrence probability for rainfall, can dynamically compute results even under real-time weather changes. The model can also be experimentally applied for analyzing risks corresponding to other types of disasters.
However, the models used in this study have limitations which perfectly reflect the complex urban topography and infrastructure (e.g., underground drainage networks, pumping facilities). Even with a fine grid resolution (10 m), it can be difficult to capture all micro-topographical features. Input data used for flood modeling, such as precipitation, land cover, and building information, may contain errors from the measurement and collection processes. The uncertainty in this data can influence the modeling results. Accurately measuring the exact inundation depth and extent during an actual flood event is very difficult. Therefore, the validation of model results is limited, as it must rely on historical inundation trace maps and a small amount of observational data.
The proposed flood risk analysis model provides a practical and innovative approach to flood risk management in urban development scenarios, such as that in Ulsan Metropolitan City. While this study is limited to a specific area like Ulsan, its methodology, which utilizes a 10 m grid resolution and a ‘likelihood-impact’ matrix, can be applied to other urban areas. Therefore, future research plans to apply this methodology to other cities to help solve similar problems in the field. Moreover, the temporal changes in land cover can serve as a guiding factor in formulating policies or decisions aimed at minimizing flood-related damages. The research direction proposed in this study is expected to stimulate further research that can help address similar problems in the field.
Author Contributions
Conceptualization, C.K. and J.K.; Methodology, C.K., J.J. and J.H.; Validation, J.J., J.H. and S.L.; Formal Analysis, J.H. and S.L.; Investigation, C.K.; Resources, J.J.; Data Curation, J.H.; Writing—Original Draft Preparation, C.K.; Writing—Review & Editing, J.J., J.H., J.K. and S.L.; Visualization, J.J., J.H. and S.L.; Supervision, J.K.; Project Administration, C.K.; Funding Acquisition, J.K. All authors have read and agreed to the published version of the manuscript.
Funding
This work was supported by Korea Planning & Evaluation Institute of Industrial Technology funded by the Ministry of the Interior and Safety (MOIS, Korea). [Development and Application of Advanced Technologies for Urban Runoff Storage Capability to Reduce the Urban Flood Damage/RS- 2024-00415937].
Data Availability Statement
The raw data supporting the conclusions of this article will be made available by the authors on request.
Conflicts of Interest
Author Sungho Lee was employed by the company ERI Solution. The remaining authors declare that the research was conducted in the absence of any commercial or financial relationships that could be construed as a potential conflict of interest.
References
- Jha, A.K.; Bloch, R.; Lamond, J. Cities and Flooding: A Guide to Integrated Urban Flood Risk Management for the 21st Century; World Bank Publications: Herndon, VA, USA, 2012. [Google Scholar]
- Mazzoleni, M.; Mondino, E.; Matanó, A.; Van Loon, A.F.; Barendrecht, M.H. Modelling the role of multiple risk attitudes in implementing adaptation measures to reduce drought and flood losses. J. Hydrol. 2024, 636, 131305. [Google Scholar] [CrossRef]
- Hirabayashi, Y.; Mahendran, R.; Koirala, S.; Konoshima, L.; Yamazaki, D.; Watanabe, S.; Kim, H.; Kanae, S. Global flood risk under climate change. Nat. Clim. Change 2013, 3, 816–821. [Google Scholar] [CrossRef]
- Kim, J.S.; Kwak, C.J.; Jo, J.B. Enhanced method for estimation of flow intercepted by drainage grate inlets on roads. J. Environ. Manag. 2021, 279, 111546. [Google Scholar] [CrossRef] [PubMed]
- Jo, J.; Kim, J. Experimental analysis of road surface flow characteristics. J. Hydrol. 2024, 632, 130838. [Google Scholar] [CrossRef]
- Barredo, J.I. Normalised flood losses in Europe: 1970–2006. Nat. Hazards Earth Syst. Sci. 2009, 9, 97–104. [Google Scholar] [CrossRef]
- Löschner, L.; Herrnegger, M.; Apperl, B.; Senoner, T.; Seher, W.; Nachtnebel, H.P. Flood risk, climate change and settlement development: A micro-scale assessment of Austrian municipalities. Reg. Environ. Change 2017, 17, 311–322. [Google Scholar] [CrossRef]
- Nachtnebel, H.P.; Apperl, B. Beurteilung des Hochwasser-Schadenspotenzials unter dynamischen Bedingungen. Österr. Wasser-Und Abfallwirtsch. 2015, 67, 120–130. [Google Scholar] [CrossRef]
- Blöschl, G.; Viglione, A.; Merz, R.; Parajka, J.; Salinas, J.L.; Schöner, W. Auswirkungen des Klimawandels auf Hochwasser und Niederwasser. Österr. Wasser-und Abfallwirtsch. 2011, 63, 21–30. [Google Scholar] [CrossRef]
- Blöschl, G.; Blaschke, A.P.; Haslinger, K.; Hofstätter, M.; Parajka, J.; Salinas, J.; Schöner, W. Auswirkungen der Klimaänderung auf Österreichs Wasserwirtschaft—Ein aktualisierter Statusbericht. Österr. Wasser-Und Abfallwirtsch. 2018, 70, 462–473. [Google Scholar] [CrossRef]
- Hussein, K.; Alkaabi, K.; Ghebreyesus, D.; Liaqat, M.U.; Sharif, H.O. Land use/land cover change along the Eastern Coast of the UAE and its impact on flooding risk. Geom. Nat. Hazards Risk. 2020, 11, 112–130. [Google Scholar] [CrossRef]
- Janizadeh, S.; Chandra Pal, S.C.; Saha, A.; Chowdhuri, I.; Ahmadi, K.; Mirzaei, S.; Mosavi, A.H.; Tiefenbacher, J.P. Mapping the spatial and temporal variability of flood hazard affected by climate and land-use changes in the future. J. Environ. Manag. 2021, 298, 113551. [Google Scholar] [CrossRef]
- Mori, N.; Yasuda, T.; Arikawa, T.; Kataoka, T.; Nakajo, S.; Suzuki, K.; Yamanaka, Y.; Webb, A. 2018 Typhoon Jebi post-event survey of coastal damage in the Kansai region, Japan. Coast. Eng. J. 2019, 61, 278–294. [Google Scholar] [CrossRef]
- Arias, P.; Bellouin, N.; Coppola, E.; Jones, R.; Krinner, G.; Marotzke, J.; Naik, V.; Palmer, M.; Plattner, G.-K.; Rogelj, J. 2021: The physical science basis; Contribution of Working Group I to the Sixth Assessment Report of the Intergovernmental Panel on Climate Change; technical summary. In Climate Change; Cambridge University Press: Cambridge, UK, 2021. [Google Scholar]
- Laino, E.; Iglesias, G. Extreme climate change hazards and impacts on European coastal cities: A review. Renew. Sustain. Energy Rev. 2023, 184, 113587. [Google Scholar] [CrossRef]
- Hasan Tanim, A.H.; Goharian, E. Developing a hybrid modeling and multivariate analysis framework for storm surge and runoff interactions in urban coastal flooding. J. Hydrol. 2021, 595, 125670. [Google Scholar] [CrossRef]
- Hu, C.; Xia, J.; She, D.; Song, Z.; Zhang, Y.; Hong, S. A new urban hydrological model considering various land covers for flood simulation. J. Hydrol. 2021, 603, 126833. [Google Scholar] [CrossRef]
- Heilig, G.K. World Urbanization Prospects, 2011 Revision; United Nations, Department of Economic and Social Affairs (DESA), Population Division, Population Estimates and Projections Section: New York, NY, USA, 2012; Volume 14, p. 555. [Google Scholar]
- Lee, Y.; Brody, S.D. Examining the impact of land use on flood losses in Seoul, Korea. Land Use Policy 2018, 70, 500–509. [Google Scholar] [CrossRef]
- Liu, J.; Shi, Z.-W. Quantifying land-use change impacts on the dynamic evolution of flood vulnerability. Land Use Policy 2017, 65, 198–210. [Google Scholar] [CrossRef]
- Jo, J.; Kwak, C.; Kim, J.; Kim, S. Deriving optimal analysis method for road surface runoff with change in basin geometry and grate inlet installation. Water 2022, 14, 3132. [Google Scholar] [CrossRef]
- Dalu, M.T.; Shackleton, C.M.; Dalu, T. Influence of land cover, proximity to streams and household topographical location on flooding impact in informal settlements in the Eastern Cape, South Africa. Int. J. Disaster Risk Reduct. 2018, 28, 481–490. [Google Scholar] [CrossRef]
- Lee, E.H.; Kim, J.H. Development of a flood-damage-based flood forecasting technique. J. Hydrol. 2018, 563, 181–194. [Google Scholar] [CrossRef]
- Yu, D.; Xie, P.; Dong, X.; Su, B.; Hu, X.; Wang, K.; Xu, S. The development of land use planning scenarios based on land suitability and its influences on eco-hydrological responses in the upstream of the Huaihe River basin. Ecol. Modell. 2018, 373, 53–67. [Google Scholar] [CrossRef]
- Hersperger, A.M.; Oliveira, E.; Pagliarin, S.; Palka, G.; Verburg, P.; Bolliger, J.; Grădinaru, S. Urban land-use change: The role of strategic spatial planning. Glob. Environ. Change 2018, 51, 32–42. [Google Scholar] [CrossRef]
- Jo, J.; Kim, S.; Mori, N.; Mase, H. Combined storm surge and wave overtopping inundation based on fully coupled storm surge-wave-tide model. Coast. Eng. 2024, 189, 104448. [Google Scholar] [CrossRef]
- Associated Programme on Flood Management (APFM). The Role of Land-Use Planning in Flood Management—A Tool for Integrated Flood Management; World Meteorological Organization: Geneva, Switzerland, 2007. [Google Scholar]
- Merz, B.; Kreibich, H.; Schwarze, R.; Thieken, A. Review article “Assessment of economic flood damage”. Nat. Hazards Earth Syst. Sci. 2010, 10, 1697–1724. [Google Scholar] [CrossRef]
- UNISDR. UNISDR Terminology on disaster risk reduction. Int. Strategy Disaster Reduct. 2009, 2009, 1–30. Available online: https://www.unisdr.org/we/inform/publications/7817 (accessed on 15 March 2025).
- Kundzewicz, Z.W.; Lugeri, N.; Dankers, R.; Hirabayashi, Y.; Döll, P.; Pińskwar, I.; Dysarz, T.; Hochrainer, S.; Matczak, P. Assessing river flood risk and adaptation in Europe—Review of projections for the future. Mitig. Adapt. Strateg. Glob. Change 2010, 15, 641–656. [Google Scholar] [CrossRef]
- Cornelissen, T.; Diekkrüger, B.; Giertz, S. A comparison of hydrological models for assessing the impact of land use and climate change on discharge in a tropical catchment. J. Hydrol. 2013, 498, 221–236. [Google Scholar] [CrossRef]
- Boysen, L.R.; Brovkin, V.; Arora, V.K.; Cadule, P.; de Noblet-Ducoudré, N.; Kato, E.; Pongratz, J.; Gayler, V. Global and regional effects of land-use change on climate in 21st century simulations with interactive carbon cycle. Earth Syst. Dynam. 2014, 5, 309–319. [Google Scholar] [CrossRef]
- Mitsova, D. Coupling land use change modeling with climate projections to estimate seasonal variability in runoff from an urbanizing catchment near Cincinnati, Ohio. ISPRS Int. J. Geo-Inf. 2014, 3, 1256–1277. [Google Scholar] [CrossRef]
- Tellman, B.; Saiers, J.E.; Cruz, O.A.R. Quantifying the impacts of land use change on flooding in datapoor watersheds in El Salvador with community-based model calibration. Reg. Environ. Change 2015, 16, 1183–1196. [Google Scholar] [CrossRef]
- Kundzewicz, Z.W.; Stoffel, M.; Niedźwiedź, T.; Wyżga, B. Flood Risk in the Upper Vistula Basin; Springer: Berlin/Heidelberg, Germany, 2016. [Google Scholar] [CrossRef]
- Ministry of the Interior. Safety, Statistical Yearbook of Natural Disaster; Ministry of the Interior: Sejong, Republic of Korea, 2022; pp. 1–501. Available online: http://www.mois.go.kr (accessed on 15 January 2025).
- Ministry of the Environment. Standard Guideline for Design Flood; Ministry of the Environment: Sejong, Republic of Korea, 2019; pp. 1–39. [Google Scholar]
- Perica, S.; Dietz, S.; Heim, S.; Hiner, L.; Maitaria, K.; Martin, D.; Pavlovic, S.; Roy, I.; Trypaluk, C.; Unruh, D.; et al. Precipitation-Frequency Atlas of the United States, 6th ed.; The National Oceanic and Atmospheric Administration (NOAA): San Diego, CA, USA, 2011; pp. 1–241. [Google Scholar]
- Bureau of Meteorology, Australia; Department of the Environment, Sport and Territories, Australia. The Estimation of Probable Maximum Precipitation in Australia: Generalised Short-duration Method; Australian Government Publishing Service: Canberra, Australia, 1994. [Google Scholar]
- Choi, Y.; Yi, J. Research on flood risk forecast method using weather ensemble prediction system in urban region. J. Korea Water Resour. Assoc. 2019, 52, 753–761. [Google Scholar] [CrossRef]
- Jung, S.K.; Kim, B.S. A Study on the development of a heavy rainfall risk impact evaluation matrix. J. Korea Water Resour. Assoc. 2019, 52, 125–132. [Google Scholar] [CrossRef]
- Crichton, D. The Risk Triangle. In Natural Disaster Management: A Presentation to Commemorate the International Decade for Natural Disaster Reduction (IDNDR) 1990–2000; Ingleton, J., Ed.; Tudor Rose: Leicester, UK, 1999. [Google Scholar]
- World Meteorological Organization (WMO). WMO Guidelines on Multi-Hazard Impact-Based Forecast and Warning Services; WMO-No. 1150; World Meteorological Organization: Geneva, Switzerland, 2015. [Google Scholar]
- Dent, B.D. Cartography: Thematic Map Design; WCB/McGraw-Hill: Dubuque, IA, USA, 1999. [Google Scholar]
- Lee, D.R.; Sallee, G.T. A method of measuring shape. Geogr. Rev. 1970, 60, 555–563. [Google Scholar] [CrossRef]
- Clarke, K.C.; Hoppen, S.; Gaydos, L. Methods and techniques for rigorous calibration of a cellular automaton model of urban growth. In Proceedings of the Third International Conference/Workshop on Integrating GIS and Environmental Modeling, Santa Fe, NM, USA, 21–25 January 1996; pp. 21–25. [Google Scholar]
- Wentz, E.A. Shape analysis in GIS. In Proceedings of the Auto-Carto, Seattle, WA, USA, 7–10 April 1997; pp. 7–10. [Google Scholar]
Figure 1.
Flowchart depicting our methodology.
Figure 1.
Flowchart depicting our methodology.
Figure 3.
Inundation trace map for floods in Ulsan Metropolitan City.
Figure 3.
Inundation trace map for floods in Ulsan Metropolitan City.
Figure 4.
Illustration of the selected grid system.
Figure 4.
Illustration of the selected grid system.
Figure 5.
Selected flood scenario.
Figure 5.
Selected flood scenario.
Figure 6.
Flood risk analysis model.
Figure 6.
Flood risk analysis model.
Figure 7.
Flood risk mapping.
Figure 7.
Flood risk mapping.
Figure 8.
Changes in the land cover map of Ulsan by era.
Figure 8.
Changes in the land cover map of Ulsan by era.
Figure 9.
Land cover change classification in Ulsan by era.
Figure 9.
Land cover change classification in Ulsan by era.
Figure 10.
Annual average rainfall as recorded by the Ulsan Weather Station.
Figure 10.
Annual average rainfall as recorded by the Ulsan Weather Station.
Figure 11.
Number of days with 80 mm or more of daily rainfall in Ulsan by era.
Figure 11.
Number of days with 80 mm or more of daily rainfall in Ulsan by era.
Figure 12.
Annual maximum rainfall at the Ulsan Weather Station for different durations (1961–2019).
Figure 12.
Annual maximum rainfall at the Ulsan Weather Station for different durations (1961–2019).
Figure 13.
Gumbel cumulative probability distribution function for rainfall intensity at the Ulsan Weather Station.
Figure 13.
Gumbel cumulative probability distribution function for rainfall intensity at the Ulsan Weather Station.
Figure 14.
Risk occurrence likelihood according to rainfall intensity during Typhoon Chaba in 2016.
Figure 14.
Risk occurrence likelihood according to rainfall intensity during Typhoon Chaba in 2016.
Figure 15.
Flood risk impact according to land cover change by era.
Figure 15.
Flood risk impact according to land cover change by era.
Figure 16.
Flood risk according to land cover change by era.
Figure 16.
Flood risk according to land cover change by era.
Figure 17.
Flood risk according to change in rainfall: (a) no rainfall condition at 0:00; (b) maximum rainfall condition at 10:50.
Figure 17.
Flood risk according to change in rainfall: (a) no rainfall condition at 0:00; (b) maximum rainfall condition at 10:50.
Figure 18.
Relative comparison of the reference and validation risk classes by administrative district.
Figure 18.
Relative comparison of the reference and validation risk classes by administrative district.
Figure 19.
Relationship between land cover and outflow changes.
Figure 19.
Relationship between land cover and outflow changes.
Figure 20.
Performance assessment results.
Figure 20.
Performance assessment results.
Table 1.
Suggested evaluation criteria for the LSSI method.
Table 1.
Suggested evaluation criteria for the LSSI method.
| Range of LSSI | Degree of Accuracy |
|---|
| 0.40 over | Excellent |
| 0.30 over | Good |
| 0.20 over | Fair |
| 0.10 over | Poor |
| 0.05 over | Fail |
Table 2.
Probable rainfall at the Ulsan Weather Station by duration and return period.
Table 2.
Probable rainfall at the Ulsan Weather Station by duration and return period.
| (Unit: mm) |
|---|
| Duration (min) | | 60 | 120 | 180 | 360 | 540 | 720 | 900 | 1080 | 1440 |
|---|
| | Return
Period (Year) |
|---|
| 2 | 35.3 | 51.7 | 63.5 | 90.2 | 107.3 | 117.9 | 126.7 | 134.3 | 144.8 |
| 10 | 60.1 | 88.6 | 108.0 | 150.1 | 179.8 | 200.5 | 217.0 | 231.7 | 248.7 |
| 20 | 69.6 | 102.8 | 125.0 | 172.9 | 207.5 | 232.0 | 251.4 | 268.9 | 288.4 |
| 30 | 75.0 | 110.9 | 134.8 | 186.1 | 223.5 | 250.2 | 271.3 | 290.4 | 311.3 |
| 50 | 81.9 | 121.0 | 147.0 | 202.5 | 243.4 | 272.8 | 296.1 | 317.1 | 339.8 |
| 80 | 88.1 | 130.3 | 158.2 | 217.5 | 261.6 | 293.6 | 318.8 | 341.6 | 366.0 |
| 100 | 91.0 | 134.7 | 163.5 | 224.7 | 270.2 | 303.4 | 329.5 | 353.2 | 378.4 |
| 200 | 100.2 | 148.4 | 180.0 | 246.8 | 297.0 | 333.9 | 362.9 | 389.2 | 416.7 |
| 300 | 105.6 | 156.3 | 189.6 | 259.7 | 312.6 | 351.7 | 382.3 | 410.2 | 439.2 |
| 500 | 112.3 | 166.4 | 201.6 | 275.9 | 332.3 | 374.1 | 406.9 | 436.7 | 467.4 |
Table 3.
Risk class grids by the administrative districts of Ulsan Metropolitan City (no rainfall).
Table 3.
Risk class grids by the administrative districts of Ulsan Metropolitan City (no rainfall).
| (Unit: Grids) |
|---|
| Risk Class | 00:00 (No Rainfall) | 10:50 (Maximum Rainfall) |
|---|
| Class 1 | 10,124,045 | - |
| Class 2 | 440,608 | 9,491,401 |
| Class 3 | - | 843,537 |
| Class 4 | - | 220,884 |
| Class 5 | - | 8831 |
| Total | 10,564,653 | 10,564,653 |
Table 4.
Area of intersection by risk class with inundation trace area and inland flood area.
Table 4.
Area of intersection by risk class with inundation trace area and inland flood area.
| Risk Class | Area of Intersection with Inundation Trace Area (m2) | Area of Intersection with Inland Flood Area (m2) |
|---|
| Class 1 | - | - |
| Class 2 | 54,031,000 (39%) | 67,085,000 (15%) |
| Class 3 | 49,060,000 (36%) | 245,295,000 (54%) |
| Class 4 | 33,014,000 (24%) | 135,876,000 (30%) |
| Class 5 | 873,000 (1%) | 8,831,000 (2%) |
| Total | 136,978,000 (100%) | 457,087,000 (100%) |
| Average risk class | Class 2.8 | Class 3.2 |
Table 5.
Confusion matrix for evaluating the performance of the proposed model in comparison to the physical model.
Table 5.
Confusion matrix for evaluating the performance of the proposed model in comparison to the physical model.
| Category | Inundation Grid of the Physical Model | Non-Inundation Grid of the Physical Model |
|---|
| High-risk grids of the proposed model | 20,951 | 62,769 |
| Low-risk grids of the proposed model | 21,526 | 85,561 |
| Total | 42,477 | 148,330 |
Table 6.
Comparison of Physical Models and Data-Driven Models.
Table 6.
Comparison of Physical Models and Data-Driven Models.
| Feature | Data-Driven Model | Physical Model |
|---|
| Strengths | - Ease of Development: Development is relatively easy and fast as it relies on training the model with past data rather than solving complex physical equations.
- Computational Efficiency: A trained model can produce results for new input data very quickly.
- Pattern Discovery: Effective at finding complex non-linear relationships or patterns within data that are difficult to explain with a physical model. | - Explains Physical Phenomena: Based on actual physical laws (e.g., conservation of mass, conservation of momentum), allowing for a clear explanation of flood mechanisms.
- Applicability: Can predict outcomes for areas with insufficient data or for future scenarios.
- Accuracy: Can achieve high-accuracy simulation results with appropriate parameter settings and high-resolution topographical data. |
| Limitations | - Data Dependency: Model performance is highly dependent on the quality and quantity of the training data.
- Extrapolation Issues: Predictive capability can be low for scenarios that fall outside the range of the training data (e.g., record-breaking rainfall).
- Lack of Explainability: The process by which results are derived can be a “black box”, making it difficult to interpret their physical meaning. | - Data Requirements: Requires a vast amount of input data, such as accurate topographical and hydrological data, for parameterization and validation.
- Computational Cost: Complex calculations demand significant time and computing resources for model construction and simulation.
- Uncertainty: The uncertainty in input data and parameters can directly impact the results. |
| Comparison of Results (Ulsan Case) | The physical model’s simulation results were used for validation by comparing them with an inundation damage trace map. This comparison was crucial for establishing the validity of the model presented in this study. | The study’s use of a 10 m grid resolution and a time-series likelihood-and-impact framework demonstrated its ability to provide useful information for budget allocation, resource mobilization, disaster prevention planning, and decision-making in major cities. |
| Disclaimer/Publisher’s Note: The statements, opinions and data contained in all publications are solely those of the individual author(s) and contributor(s) and not of MDPI and/or the editor(s). MDPI and/or the editor(s) disclaim responsibility for any injury to people or property resulting from any ideas, methods, instructions or products referred to in the content. |
© 2025 by the authors. Licensee MDPI, Basel, Switzerland. This article is an open access article distributed under the terms and conditions of the Creative Commons Attribution (CC BY) license (https://creativecommons.org/licenses/by/4.0/).
