Article

A Study on the Use of Copper Ions for Bacterial Inactivation in Water

1
Environmental Engineering Department, Faculty of Engineering, Bursa Uludağ University, 16285 Bursa, Turkey
2
Project Support Office, Bursa Technical University, Mimar Sinan Street, 117, 16310 Bursa, Turkey
*
Author to whom correspondence should be addressed.
Water 2025, 17(19), 2797; https://doi.org/10.3390/w17192797
Submission received: 18 August 2025 / Revised: 18 September 2025 / Accepted: 20 September 2025 / Published: 23 September 2025
(This article belongs to the Section Water Quality and Contamination)

Abstract

This study comprehensively evaluated the antimicrobial performance of copper ions against three bacterial species relevant to water systems: E. coli (ATCC 25922), P. aeruginosa (ATCC 27853), and S. epidermidis (ATCC 12228). Disinfection kinetics were determined at three copper concentrations (0.5, 1.5, and 3.3 mg/L) using the Gard model. E. coli exhibited the highest susceptibility, with inactivation rate constants of 0.63, 3.27, and 9.83, achieving complete inactivation at 3.3 mg/L. P. aeruginosa was the most resistant, showing values below 1.0 across all concentrations, while S. epidermidis displayed intermediate responses. Selected experiments further examined the influence of growth phase, temperature, and water chemistry. Exponential-phase cells were more sensitive than stationary-phase cultures, and higher temperatures (37 °C vs. 5 °C) significantly enhanced inactivation. Moderate bicarbonate (50 mg/L) improved bacterial removal by stabilizing soluble Cu2+ ions (2.60 lg reduction), whereas elevated calcium and magnesium (Ca2+ 100 mg/L, Mg2+ 50 mg/L) reduced effectiveness (≤2.10 lg reduction) through competitive interactions. In addition to culture-based methods, adenosine triphosphate (ATP) bioluminescence assays and flow cytometry (FCM) provided complementary insights, confirming early metabolic disruption and membrane damage prior to culturability loss in selected experiments.

1. Introduction

Ensuring safe drinking water is essential for public health, industrial safety, and environmental protection. However, microbial contamination remains a persistent problem, particularly in areas lacking advanced treatment infrastructure. Bacteria such as E. coli, P. aeruginosa, and S. epidermidis continue to play an important role in waterborne diseases, highlighting the need for effective and sustainable control strategies [1,2]. The World Health Organization (2022) emphasizes the advancement of safe disinfection methods as a key component of Sustainable Development Goal 6—universal access to clean water [3].
Conventional approaches such as chlorination, ozonation, and ultraviolet (UV) irradiation have long been the foundation of water treatment. While effective, these methods have notable limitations. For example, chlorination can generate disinfection by-products (DBPs) such as trihalomethanes and haloacetic acids, which are associated with potential long-term health risks [4,5]. Moreover, some microorganisms can develop tolerance or enter the viable but non-culturable (VBNC) state, making culture-based monitoring less reliable and complicating microbial risk management [6].
In this context, metal-based disinfection methods, particularly copper ionization, have emerged as promising alternatives. Copper exerts broad-spectrum antimicrobial effects through mechanisms such as disruption of membrane integrity, interference with enzymatic processes, displacement of essential metal cofactors, and induction of oxidative damage [7,8]. Unlike halogen-based disinfectants, copper does not generate halogenated DBPs and has been successfully employed in a variety of applications, including hospital hot water systems and industrial facilities, particularly for controlling Legionella spp. [9].
Although the antimicrobial potential of copper has long been recognized, its disinfection performance can vary considerably depending on microbial physiology and environmental conditions [10,11,12]. In recent years, different aspects of copper-based disinfection have been investigated. Electrochemical disinfection in drinking water networks has been examined, emphasizing the potential of in situ copper generation for decentralized applications [13]. The combination of electroporation with low-energy copper ion release has been shown to achieve rapid inactivation of pathogens and resistance genes [14]. Copper uptake in L. pneumophila has also been quantified at the single-cell level using ICP-MS, providing detailed mechanistic insights [15]. These and similar studies have made important contributions to the literature, but they have often focused on a single species or addressed only certain parameters.
A more comprehensive understanding of disinfection processes can be achieved by combining conventional culture techniques with complementary analytical methods. FCM enables rapid and quantitative assessment of bacterial cells and their physiological states, distinguishing viable cells from viable but non-culturable (VBNC) populations that remain undetectable by means of culture methods [16,17]. ATP bioluminescence, which measures cellular adenosine triphosphate, provides a fast and sensitive indicator of metabolic activity and can reveal cellular impairment earlier than culturability loss [18,19]. Applied alongside culture-based methods, these approaches yield complementary evidence that strengthens the interpretation of disinfection results and facilitates comparison with prior research.
In this study, the disinfection efficiency of copper ions was systematically evaluated against E. coli, P. aeruginosa, and S. epidermidis as representative Gram-negative and Gram-positive bacteria. The influence of growth phase, temperature, and water matrix composition on bacterial susceptibility to copper was examined, and kinetic modeling was applied to describe inactivation dynamics at different concentrations. By integrating culture-based methods with ATP bioluminescence and flow cytometry, the study aimed to obtain complementary insights into the effects of copper ions.

2. Materials and Methods

2.1. Microorganisms and Cultivation

Three bacterial strains were selected as target organisms for disinfection studies. E. coli (ATCC 25922) was chosen as a representative of fecal coliforms and is widely used as an indicator of waterborne contamination. P. aeruginosa (ATCC 27853) was included due to its resistance characteristics and prevalence in water systems, particularly within biofilms. S. epidermidis (ATCC 12228), a Gram-positive bacterium, was used to evaluate the response of a structurally different organism to copper-based disinfection. Strains were maintained at −80 °C in glycerol stocks. Bacterial cultures were revived on nutrient agar or Luria–Bertani (LB) agar (Sigma-Aldrich, St. Louis, MO, USA) plates and incubated aerobically at 37 °C for 18–24 h. Single colonies were inoculated into 30% (v/v) LB broth (Sigma-Aldrich, St. Louis, MO, USA) prepared with ultrapure water and cultured at 37 °C, 200 rpm. Growth was monitored spectrophotometrically at OD546, with exponential-phase cultures harvested at OD ≈ 0.1–0.2 (3–3.5 h) and stationary-phase cultures harvested after 18 h (OD ≈ 1–2) [20,21]. The inclusion of both exponential and stationary phases allowed for evaluation of physiological state-dependent disinfection responses, as exponential-phase cells typically exhibit higher metabolic activity and greater susceptibility to stress, whereas stationary-phase cells develop enhanced stress tolerance through structural and physiological adaptations [22,23]. An appropriate volume of inoculum was added to the beakers to achieve a final concentration of approximately 106 CFU/mL in the experiments.

2.2. Copper Ion Generation

The ionization system operated in batch mode to produce the desired copper ion concentrations. A copper electrode was placed in 1 L of sterilized tap water and energized at 0.1 A and 5 V for specific time intervals determined through preliminary experiments. Operation for 5, 15, and 30 min produced copper concentrations of approximately 0.5, 1.5, and 3.3 mg/L, respectively, as confirmed by means of microwave plasma atomic emission spectroscopy (MP-AES) (Agilent Technologies, Santa Clara, CA, USA) [24]. Each concentration level was tested in five replicates, and mean values were used in subsequent analyses.

2.3. Experimental Design

Five main experimental series were designed to investigate the factors influencing copper-mediated disinfection. The first series examined the effect of bacterial growth phase by comparing the susceptibility of E. coli in exponential and stationary phases. The second series assessed the influence of temperature on copper inactivation kinetics, with experiments conducted at 5 °C and 37 °C. The third series evaluated the role of residual organic matter by comparing washed and unwashed E. coli cultures, thereby determining how background organic material could modulate copper efficacy. The fourth series investigated the effect of water chemistry on copper disinfection. The fifth series examined specific responses by comparing the bactericidal effect of copper ions against E. coli, P. aeruginosa, and S. epidermidis, enabling assessment of how structural and physiological differences influence susceptibility. Disinfection experiments were carried out in 1 L sterilized glass beakers using sterile deionized water. The desired copper concentration was achieved using a copper ionization system, after which the target bacterial culture was added. In experiments evaluating the effects of bacterial growth phase, organic matter, chemical parameters, and temperature, E. coli was chosen as the model organism, and the copper dose was fixed at 0.5 mg/L. The effects of copper ions on different bacterial species were further investigated by performing disinfection assays at three copper concentrations. Across all experimental series, subsamples were collected at 0.5, 1, 5, 10, 15, 30, 45, and 60 min for bacterial enumeration. Initial bacterial concentrations were determined using a control beaker without copper, with an additional sample taken at the 60 min endpoint. To halt further disinfection during analysis, each 1 mL subsample was immediately mixed with a neutralizing solution containing 14.6% sodium thiosulfate (Merck, Darmstadt, Germany) and 10% sodium thioglycolate (Merck, Darmstadt, Germany) [25]. In addition to the experimental setups with copper ion treatment, control experiments without copper exposure were conducted in parallel. In the control groups, only negligible reductions were observed during the experimental timeframe. These minor variations were within the expected natural variability and did not affect the interpretation of copper-mediated inactivation.

2.4. Effect of Growth Stage of Bacteria

The susceptibility of E. coli to copper was compared between the exponential phase (EP) and the stationary phase (SP). Four sterilized 1 L glass beakers were prepared for each culture. Two served as the control (no copper), and the remaining two were ionized to achieve copper concentrations of 0.5 mg/L using a copper ionization system. Following ionization, EP and SP bacterial inocula were introduced into each beaker. Subsamples were collected within the 60 min experimental period for bacterial enumeration. Flow cytometric analyses were performed in parallel to assess membrane damage, providing rapid and sensitive quantification that complements culture-based methods by detecting both viable and metabolically impaired cells.

2.5. Effect of Temperature

The influence of temperature on copper-mediated disinfection was evaluated using Escherichia coli as the test organism. Four sterilized 1 L glass beakers were prepared for each temperature condition (5 °C and 37 °C), two of which served as controls and two were treated with 0.5 mg/L copper. Following ionization, bacterial inocula were added to each beaker. Beakers were maintained at constant temperatures of 5 °C or 37 °C using a thermostatic water bath. Subsamples were collected within the 60 min experimental period for bacterial enumeration.

2.6. Effects of Organic Matter

Two water matrix conditions were prepared to simulate varying levels of background organic matter. In the unwashed culture (UW) condition, bacterial cells were centrifuged at 13,000× g for 10 min and resuspended directly in sterile river water without washing, thereby retaining organic matter from the growth medium (TOC ≈ 370 mg/L). In the washed culture (W) condition, cells were centrifuged twice under the same conditions and resuspended in sterile ultrapure water before final suspension in sterile deionised water, reducing background TOC significantly. Four sterilized 1 L glass beakers were prepared for each condition (washed and unwashed cultures), with two serving as controls and two treated with 0.5 mg/L copper. Following ionization, bacterial inocula were added to each beaker. Subsamples were collected within the 60 min experimental period for bacterial enumeration.

2.7. Effects of pH, Bicarbonate, and Water Hardness

The influence of water chemistry was assessed at pH values of 6.0, 7.0, and 8.5; bicarbonate alkalinity levels of 0, 50, and 150 mg/L as HCO3; and calcium/magnesium hardness levels of 0, 50, and 150 mg/L as Ca2+ or Mg2+ [23,24,25,26,27]. Each 1 L beaker was adjusted to the target condition using 1 M HCl or NaOH, ionized to 0.5 mg/L Cu2+, and inoculated with E. coli. Following ionization, bacterial inocula were added to each beaker. Subsamples were collected within the 60 min experimental period for bacterial enumeration.

2.8. Disinfection of Bacterial Cultures

Each disinfection experiment was conducted using six sterilized 1 L beakers: three served as controls without copper for each culture, while the remaining three were treated to achieve copper concentrations of 0.5, 1.5, and 3.3 mg/L, respectively. Following ionization, bacterial inocula of E. coli, P. aeruginosa, and S. epidermidis were added to each beaker. Beakers were maintained at room temperature. Subsamples were collected within 60 min for bacterial enumeration. ATP measurements were also performed in parallel to assess microbial metabolic activity. Flow cytometry (FCM) (BD Accuri C6 flow cytometer (BD Biosciences, San Jose, CA, USA) analysis was also performed to provide rapid and sensitive quantification of bacterial inactivation, complementing culture-based methods by detecting both viable and metabolically impaired cells.

2.9. Culture-Based Enumeration and Disinfection Kinetics

Bacterial counts were determined using the membrane filtration method, following established microbiological standards [28,29,30,31,32]. Sterile cellulose nitrate membrane filters (0.45 µm pore size) were used to retain bacterial cells, and filters were subsequently placed onto selective agar media. E. coli (ATCC 25922): Filters were incubated on m-FC agar (Merck, Darmstadt, Germany) at 37.5 °C for 48 h. Blue colonies that developed on the membrane surface were enumerated as E. coli [25]. P. aeruginosa (ATCC 27853): Filters were placed on m-PA (Sigma-Aldrich, St. Louis, MO, USA) agar and incubated at 35 °C for 24 h. Transparent colonies with a pink–red background were counted as P. aeruginosa. S. epidermidis (ATCC 12228): Filters were incubated on Mannitol Salt Agar (MSA) (Merck, Darmstadt, Germany) at 35–37 °C for 24 h. White colonies growing on the red medium were enumerated as S. epidermidis. Colony numbers obtained under each condition were adjusted by the corresponding dilution factor and calculated according to the standard formula. Disinfection data closely followed the curve of the Gard model (Equation (1)), and therefore, inactivation constants were calculated according to the integrated Gard model (Equation (2)) [28]:
N/N0 = [1 + a × (Ct)]−k/a
lg (N/N0) = −[(k × Ct)/(1 + a × Ct)]
The coefficients a and k in the equation were calculated using non-linear regression analysis in SPSS statistical software (IBM SPSS Statistics 22). The Ct value for each data point was determined using C (disinfectant concentration) and t (contact time) [27,28].

2.10. ATP Analysis

Total and extracellular ATP were measured using the BacTiter-Glo™ Microbial Cell Viability Assay (Promega, Fitchburg, WI, USA) and quantified with a luminometer. For total ATP, 500 µL of the sample was mixed with 50 µL reagent, incubated at 38 °C, and the luminescence was recorded after 20 s. Free ATP was measured after filtering through a 0.1 µm syringe filter. Intracellular ATP was calculated as total minus free ATP. RLUs were converted to nmol/L using a calibration curve. ATP monitoring provides a rapid assessment of metabolic activity and can detect sub-lethal effects of copper before loss of culturability [17,33,34]

2.11. Flow Cytometry

Flow cytometry was performed with a BD Accuri C6, staining samples with SYBR® Green I and propidium iodide (PI) [21,22]. SYBR Green I labels total nucleic acids, while PI penetrates cells with damaged membranes. Staining was performed in the dark for 15 min at room temperature. Samples were diluted to reduce particle coincidence, and 50,000 events were recorded per sample. Fluorescence was collected at FL1 (533 ± 30 nm) for SYBR Green I and FL3 (>670 nm) for PI. Data were analyzed to distinguish viable (SYBR+/PI) from non-viable (PI+) populations. FCM provides mechanistic insights into copper-induced membrane damage beyond culture-based methods [17,33,34,35].

2.12. Statistical Analysis

Statistical analyses were performed using the SPSS Statistics Program (IBM SPSS Statistics 22). Two-way ANOVA was applied to evaluate differences between experimental conditions, with a significance level set at p < 0.001.

3. Results and Discussion

3.1. Effect of Growth Phase

The physiological state of E. coli markedly influenced its susceptibility to copper ions. At 0.5 mg/L Cu2+, exponential-phase (EP) cells exhibited a sharp decline in viability, decreasing by 96.5 ± 2.4% after 60 min, while stationary-phase (SP) populations were considerably more resistant, showing only a 25.3 ± 1.8% reduction during the same exposure period (Figure 1). ANOVA confirmed that both growth phase and exposure time exerted highly significant effects on inactivation (p < 0.001). Effect size partitioning indicated that the growth phase accounted for the largest proportion of variance (partial η2 = 0.480), followed by exposure time (η2 = 0.321) and their interaction (η2 = 0.194), with residual error being negligible (η2 = 0.006). The steepest decline in EP cells occurred within the first 20 min, after which the killing rate plateaued, suggesting a critical disinfection window. This plateau likely reflects the persistence of stress-adapted survivors, a phenomenon consistent with previous reports on metallic copper surfaces [36]. The slower decline observed in SP cells is in line with known resistance mechanisms. These include modifications of membrane composition that reduce permeability, upregulation of the DNA-binding protein Dps, which protects chromosomal DNA against oxidative damage, and activation of the CusCFBA copper efflux system that limits intracellular copper accumulation [37].
The pronounced difference between exponential-phase (EP) and stationary-phase (SP) E. coli can be mechanistically explained by their contrasting physiological states. EP cells, with higher metabolic activity, maintain energized membranes and active respiration, which enhance copper uptake and accelerate intracellular stress generation. Once Cu2+ penetrates, rapid formation of reactive oxygen species (ROS) and enzyme inactivation cause acute damage to DNA and proteins, leading to accelerated cell death [38,39]. By contrast, SP cells express protective adaptations such as the DNA-binding protein Dps, modifications in membrane lipid composition, and upregulation of copper efflux systems (CusCFBA) that collectively reduce susceptibility [40].
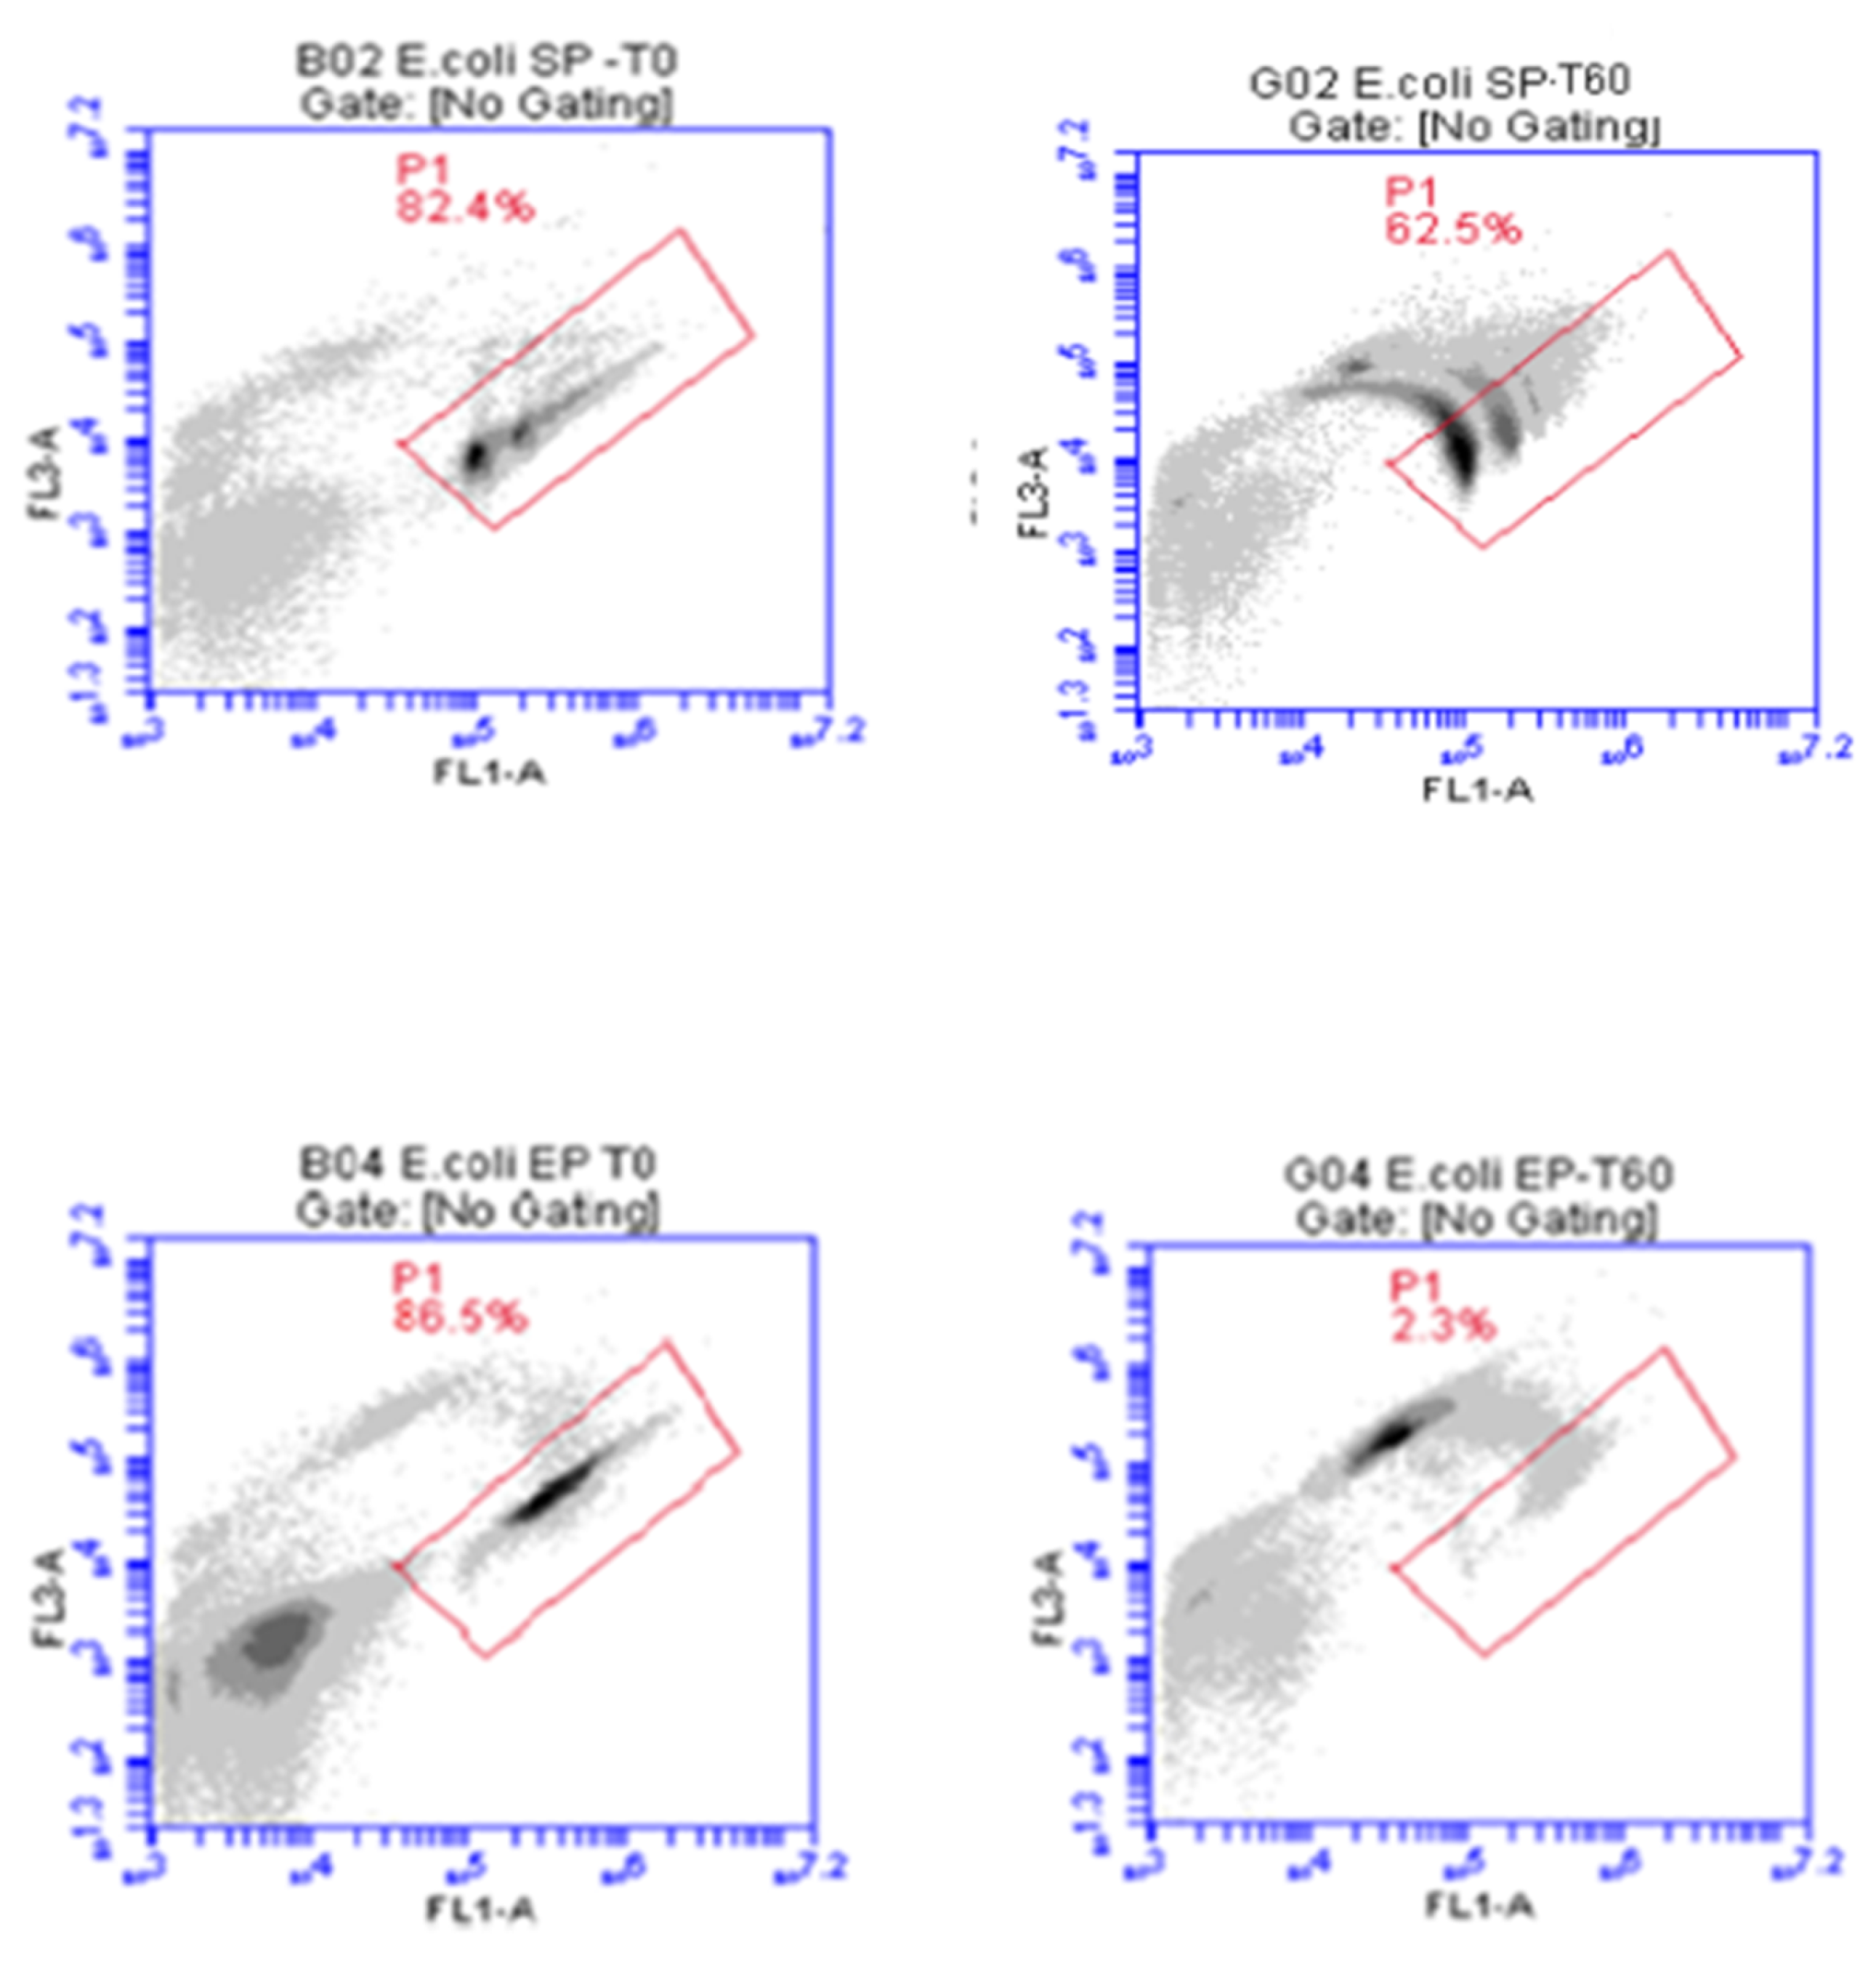
These physiological differences were clearly reflected in the experimental outcomes. Flow cytometry substantiated these mechanistic differences, showing a near-complete loss of intact membranes in EP cells (2.3% intact at 60 min) compared with the markedly higher survival of SP populations (62.5% intact at 60 min) (Figure 2). The progressive loss of membrane integrity and viability reflects copper’s multifaceted toxicity, encompassing disruption of membrane structure, inactivation of proteins, induction of ROS that damage DNA, proteins, and lipids, and competition with essential metal cofactors [36,37,39,41,42]. These results highlight the heightened vulnerability of metabolically active EP cells to oxidative and structural stress, whereas SP populations maintain relative resilience due to stress-response adaptations.
In line with this, flow cytometric plots of SGPI-stained cells exhibited a characteristic leftward curvilinear shift with increasing copper exposure, reflecting compromised membrane integrity and reduced cellular energy status. This pattern—manifested as diminished SYBR Green I fluorescence and increased propidium iodide penetration—produced clustered signal distributions, often described as “cytometric fingerprints,” which directly reflect cellular energy status and stress physiology [36]. Accordingly, the observed leftward displacement represents a distinctive cytometric signature of copper-mediated damage, consistent with the proposed inactivation pathways. Together with the logarithmic decreases in culturability, these results provide a coherent, multi-level picture of copper-induced bacterial inactivation.

3.2. Effect of Organic Matter

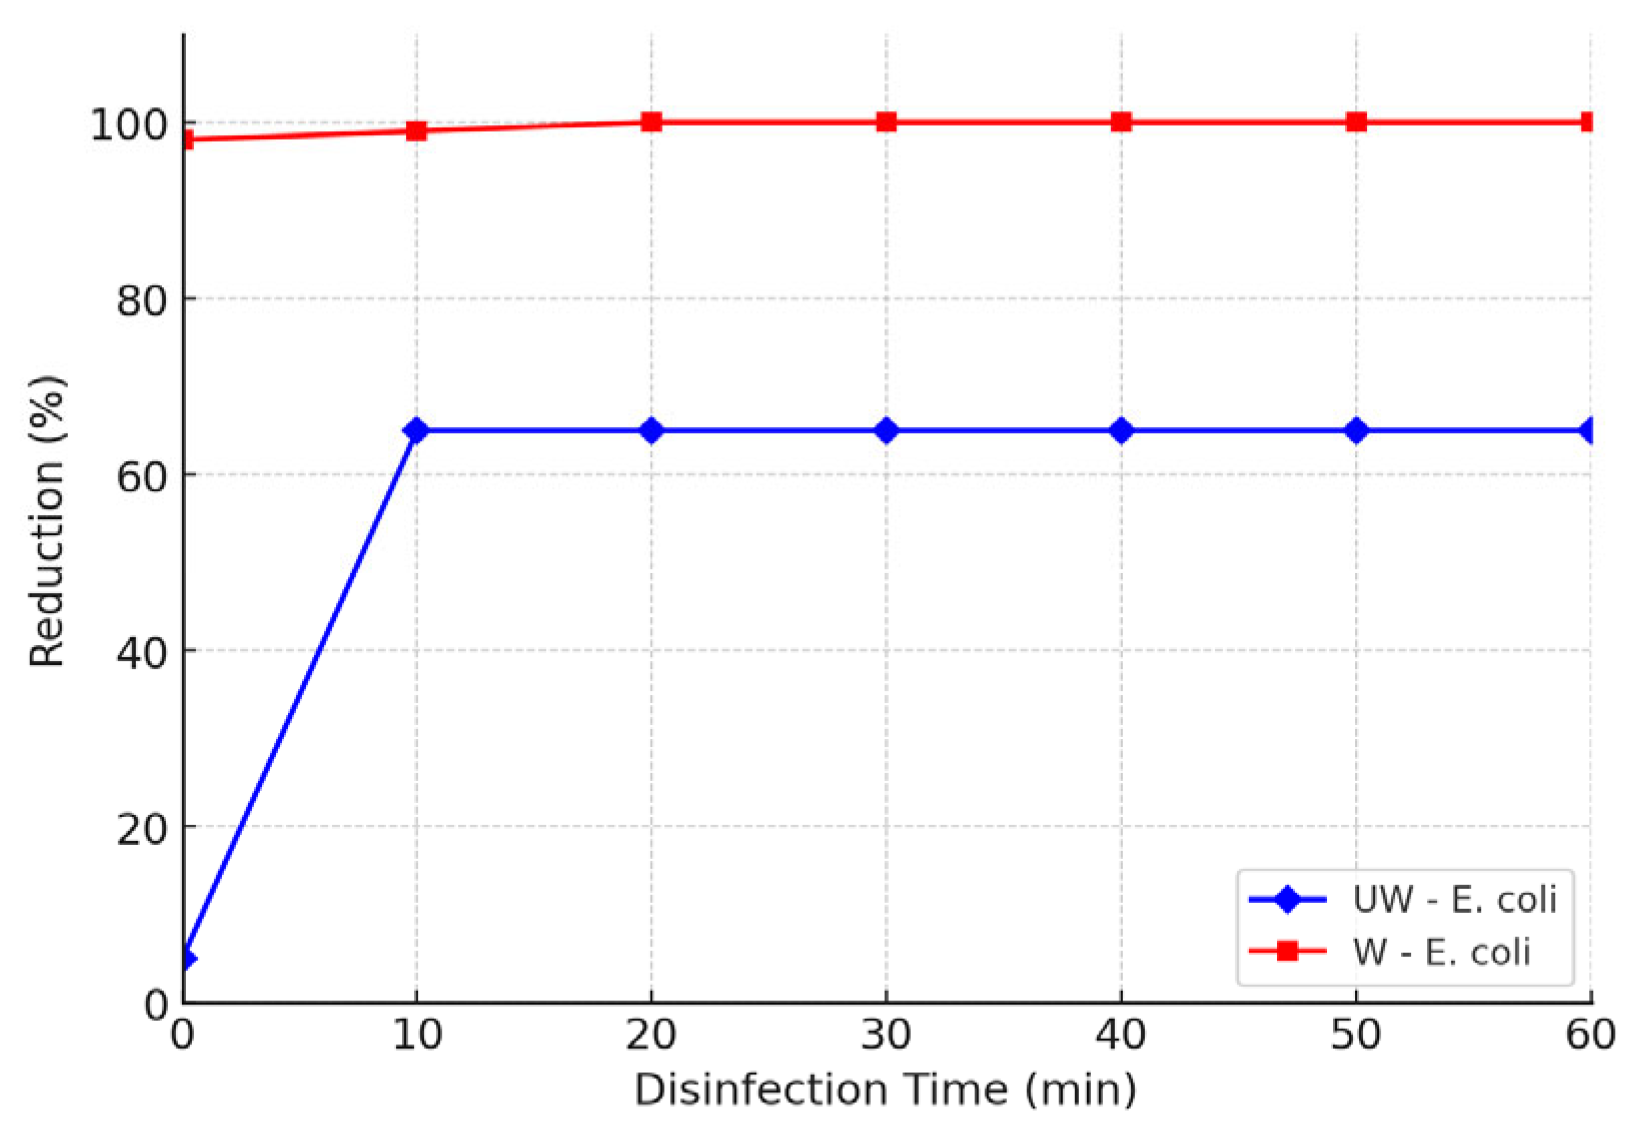
The results presented in Figure 3 compare the percentage reduction in UW and W E. coli cultures as a function of disinfection time. A substantial difference in inactivation kinetics was observed, underscoring the influence of cell surface conditions on disinfectant efficacy. For the W E. coli, disinfection was highly effective within the first few minutes, achieving nearly 100% reduction by 2–4 min and maintaining this level throughout the experiment. This rapid inactivation is attributable to the removal of extracellular polymeric substances (EPSs) and surface-bound organic matter during the washing process, which allows copper ions to directly interact with and damage the bacterial cell membrane. In contrast, the UW culture exhibited significantly slower inactivation, with only ~5–10% reduction in the initial minutes, ~65% by 10 min, and a plateau at ~67–70% by 20 min. This pattern indicates that unwashed cells retain EPSs and organic coatings that act as physical and chemical barriers, limiting disinfectant penetration and delaying cell death.
A two-way ANOVA confirmed that both conditions (UW vs. W) and contact time had highly significant effects on inactivation (p < 0.001). Effect size partitioning showed that condition accounted for the largest proportion of variance (partial η2 = 0.601), followed by time (η2 = 0.268) and their interaction (η2 = 0.131), with residual error being negligible (η2 = 0.0004). These results demonstrate that the water matrix and surface-associated organic matter exert the strongest influence on disinfection performance, while exposure duration and its interaction with matrix chemistry also contribute substantially.
The slower response of UW populations can be mechanistically explained by several processes associated with EPSs and natural organic matter. EPSs and humic/thiol-containing ligands strongly complex Cu(II), reducing the free ionic fraction available to interact with cell surfaces and thereby lowering bioavailability [43,44]. In addition, the negatively charged EPS matrix creates a Donnan potential that limits cation penetration, while Ca2+ bridging and changes in the protein-to-polysaccharide ratio further densify the matrix and increase mass transfer resistance [45]. Disinfectant species can also be consumed through reactions with EPS components, establishing reaction–diffusion gradients that weaken penetration into deeper layers [46]. Finally, EPS functional groups may partially scavenge reactive oxygen species, attenuating copper’s oxidative damage pathways, while intra-biofilm redistribution of copper contributes to tolerance [47]. Our controlled experiments directly demonstrate that the presence of these organic layers delays inactivation kinetics, whereas their removal increases bacterial susceptibility to copper.
These observations indicate that, in practical applications, pretreatment steps targeting EPSs and organic coatings could help enhance copper-based disinfection by shortening contact times, lowering disinfectant demand, and contributing to more cost-effective and efficient microbial control.

3.3. Effect of Temperature

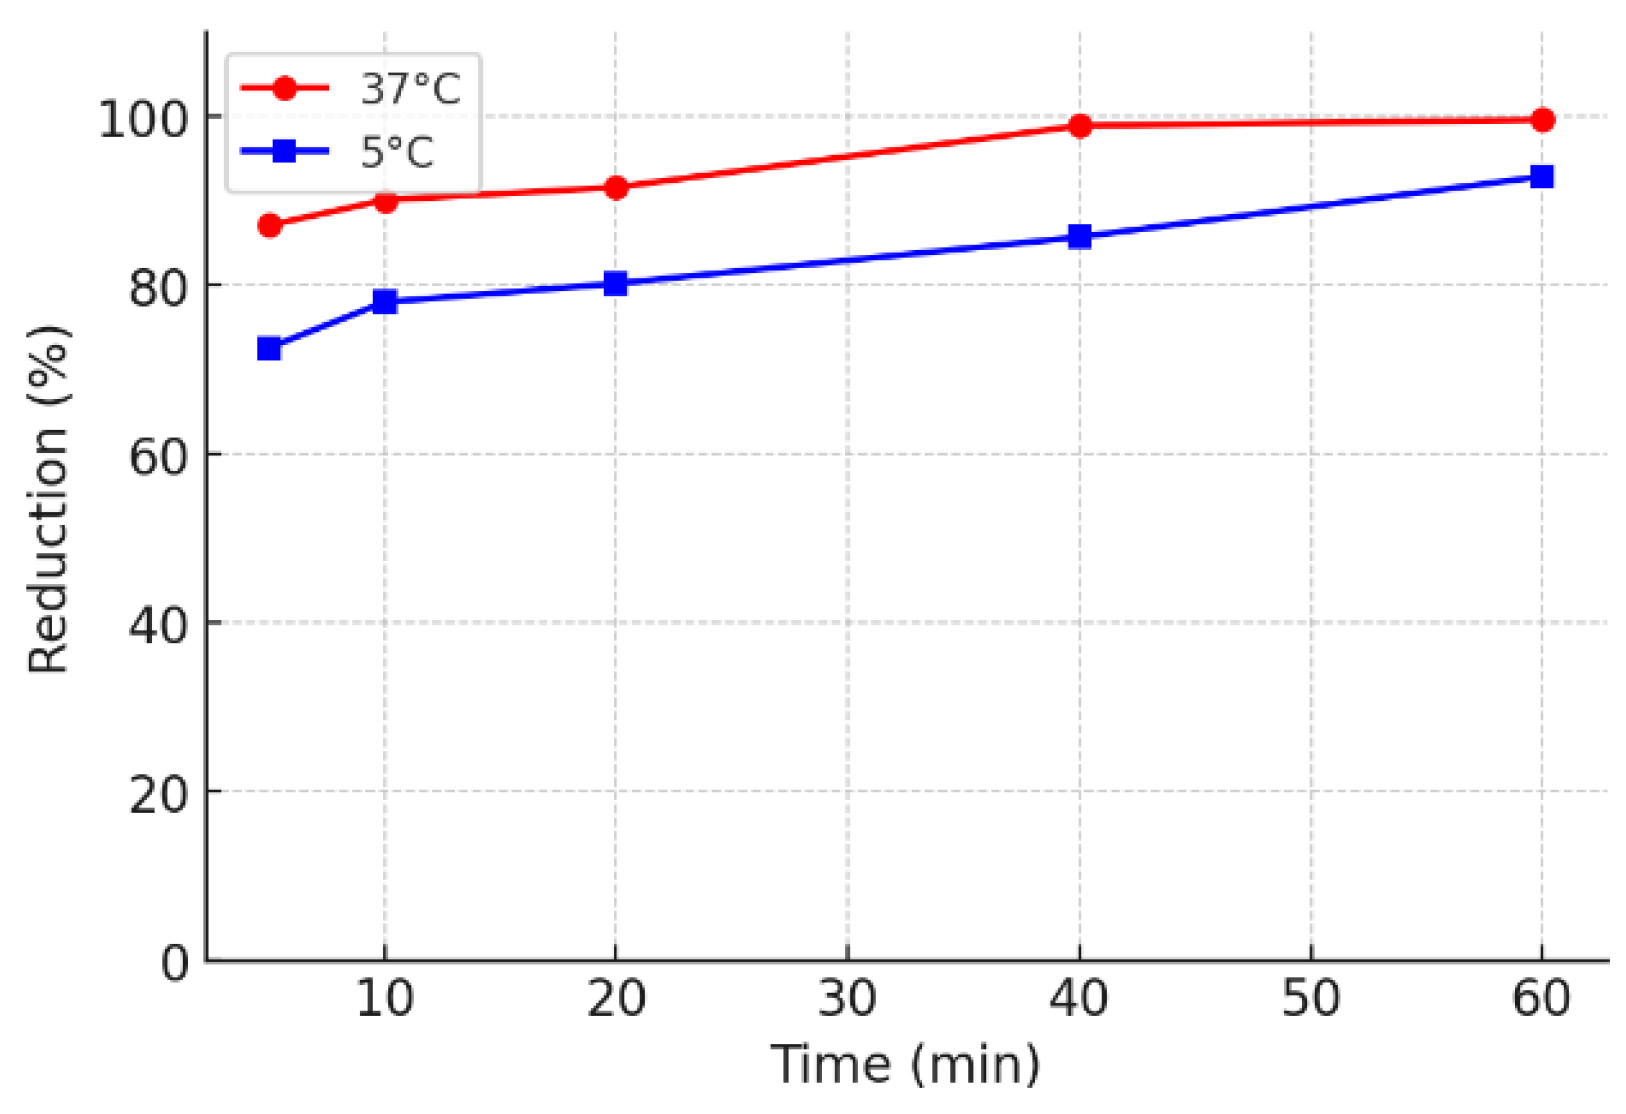
Figure 4 illustrates the percentage removal of E. coli at 37 °C and 5 °C during a 60 min exposure to copper ions. At both temperatures, inactivation efficiency increased progressively with contact time; however, the rate and extent of removal were consistently higher at 37 °C than at 5 °C. At 37 °C, a marked reduction was observed within the first 5 min, with an 87.1% decrease in viable counts, followed by >90% removal by 10 min. Near-complete elimination (98.9%) was achieved within 40 min, and total inactivation (>99.6%) occurred by 60 min. The pronounced bactericidal activity at 37 °C is attributable to enhanced metabolic activity at the optimal growth temperature, which promotes copper ion uptake and accelerates intracellular damage pathways, including membrane disruption, protein denaturation, and oxidative stress [7,47].
Inactivation was substantially retarded at 5 °C, as reflected by removal efficiencies of 72.6% at 5 min and 78.0% at 10 min. Although efficiency continued to rise with prolonged exposure, reaching 85.7% at 40 min and 92.9% at 60 min, the overall kinetics indicated that low temperature significantly slowed copper-mediated disinfection. The lower inactivation efficiency at cold temperature can be explained by reduced bacterial metabolic activity, which may slow copper ion penetration and limit intracellular ROS generation [47]. Nevertheless, extended exposure resulted in substantial bacterial reduction, confirming that copper ionization remains effective even under low-temperature conditions. The difference in removal rates between 37 °C and 5 °C emphasizes the importance of considering operational temperature when designing copper-based water disinfection strategies [48,49].
Statistical analysis supported these experimental observations (Two-way ANOVA revealed highly significant effects of both temperature (F = 930.6, p < 0.001, partial η2 = 0.975) and exposure time (F = 913.8, p < 0.001, partial η2 = 0.995), as well as a significant interaction effect (F = 184.3, p < 0.001, partial η2 = 0.975). These values indicate that nearly all of the variability in log10 reductions can be attributed to temperature, time, and their interaction. The statistical evidence confirms that temperature is a dominant factor governing copper-mediated inactivation, not only accelerating the rate of bacterial removal but also enhancing the overall disinfection efficiency.
The physiological basis for this temperature dependence is well established in microbial systems. At 37 °C, increased membrane fluidity facilitates copper ion penetration and interaction with membrane proteins. Enhanced metabolic activity at this temperature accelerates copper uptake and amplifies intracellular stress responses, including ROS production through the respiratory chain. Proteins and enzymes are also more prone to copper-induced denaturation under these conditions, further contributing to rapid cell death. In contrast, at 5 °C, reduced metabolic activity and decreased membrane fluidity slow copper transport, limit ROS generation, and delay the onset of intracellular damage. These physiological mechanisms align with the observed faster and more complete inactivation at higher temperatures.

3.4. Effects of pH, Bicarbonate, and Water Hardness

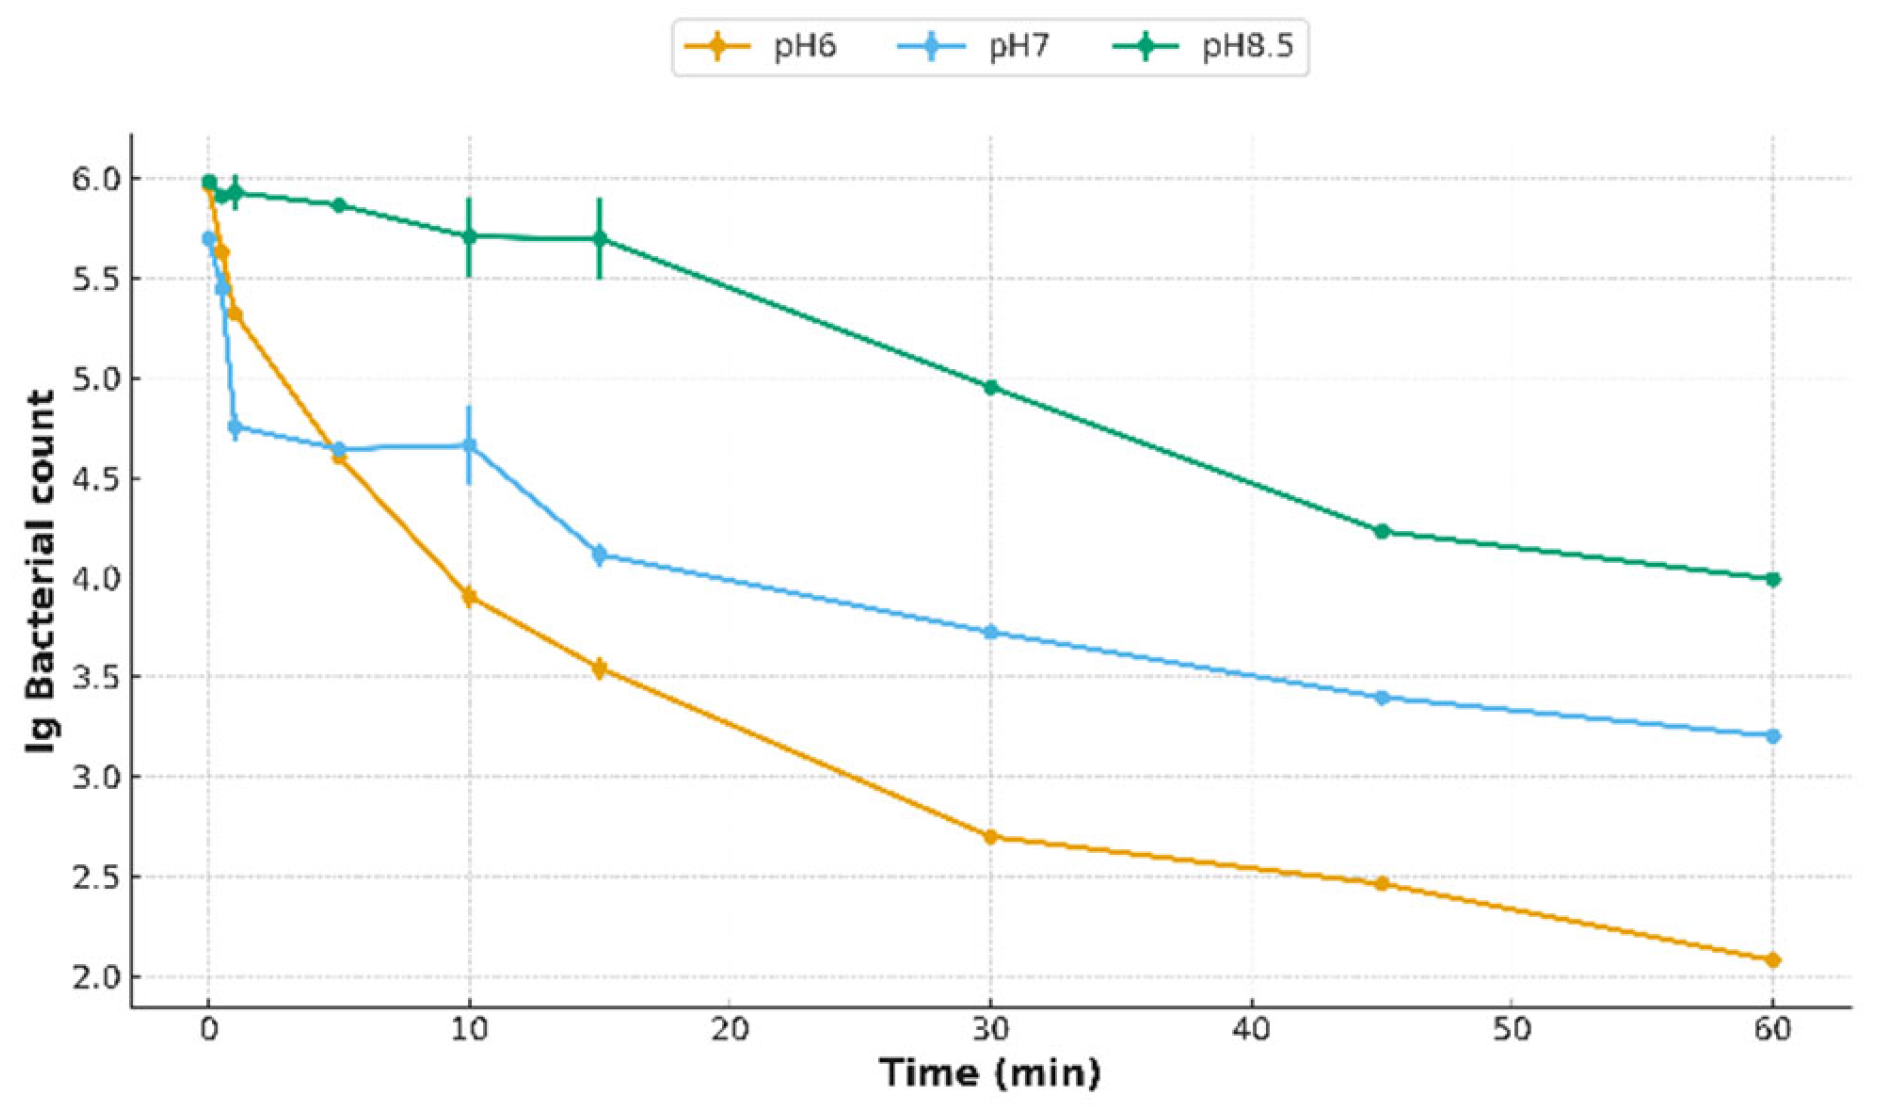
The composition of the aqueous environment strongly influenced the disinfection performance of copper ions. Exposure of E. coli to 0.5 mg/L Cu resulted in distinct inactivation patterns at pH 6.0, 7.0, and 8.5. At pH 6.0, viable counts dropped sharply from approximately 5.97 lg (log base 10) at the start to 2.07 lg after 60 min. At pH 7.0, the reduction was more gradual, from 5.70 to 3.20 lg, whereas at pH 8.5, the decline was least pronounced, from 5.99 to 3.99 lg within the same period. These findings clearly demonstrate that acidic conditions substantially enhance the bactericidal action of copper (Figure 5).
The results indicated that the antimicrobial activity of copper was highly pH-dependent. Increased solubility and bioavailability of Cu2+ ions at acidic conditions promoted more rapid bacterial inactivation [42,50]. For example, at pH 6.0, a rapid decline in bacterial counts was observed, which can be attributed to the higher availability of ionic copper and enhanced membrane permeability under acidic conditions. At neutral pH (7.0), inactivation was moderate, while under alkaline conditions (pH 8.5), antimicrobial performance decreased. This reduction is likely due to the precipitation of copper as hydroxide or carbonate complexes, which lowers the concentration of free Cu2+ ions in solution [51]. From a practical perspective, adjusting pH to slightly acidic levels could improve the efficiency of copper-based disinfection systems.
Figure 6 illustrates the effects of bicarbonate (HCO3), calcium (Ca2+), and magnesium (Mg2+) concentrations on logarithmic bacterial removal. The maximum removal observed for HCO3 was 2.60 log at 50 mg/L, whereas slightly lower values were measured at 0 mg/L (2.54 lg) and 150 mg/L (2.52 lg). Bicarbonate may influence the speciation and distribution of copper ions by stabilizing their soluble forms and by limiting their rapid association with competing anions or cations at moderate concentrations, thereby sustaining antimicrobial activity. This stabilization increases the persistence of bioavailable Cu2+ in the aqueous phase, thereby sustaining antimicrobial activity. In parallel, bicarbonate can alter the ionic strength and electrostatic interactions at the bacterial cell envelope, which may facilitate closer contact between copper ions and the cell surface. These combined effects provide a plausible mechanistic explanation for the observed enhancement of bacterial removal at intermediate bicarbonate levels.
Conversely, the presence of high concentrations of calcium and magnesium ions (150 mg/L) adversely affected disinfection performance. For Ca2+, bacterial removal decreased from 2.62 lg at 0 mg/L to 2.58 lg at 50 mg/L, followed by a slight recovery to 2.61 lg at 150 mg/L. The results for Mg2+ showed a similar pattern, with the highest removal (2.67 lg) at 0 mg/L and a gradual decrease to 2.62 lg at 50 mg/L and 2.61 lg at 150 mg/L. These trends indicate that increasing divalent cation concentrations does not consistently improve bacterial removal under the tested conditions. The reduced efficacy can be explained by the formation of copper–calcium or copper–magnesium complexes, which decrease the concentration of freely available Cu2+ ions able to interact with microbial cells [51]. However, their impact is highly dependent on the type of microorganism, water chemistry, and disinfection method. The calcium bicarbonate crystals exhibited bactericidal activity only under alkaline conditions or in combination with oxidative agents [50]. Similarly, magnesium can disrupt bacterial membranes, but higher concentrations did not proportionally enhance inactivation efficiency, suggesting a threshold effect [52]. The absence of a strong dose–response relationship in this study suggests that while hardness ions may play a supplementary role in bacterial inactivation, their contribution is modest under neutral pH and standard disinfection conditions. The reduced efficacy can be explained by the formation of copper–calcium or copper–magnesium complexes, which lower the concentration of bioavailable free Cu2+ ions capable of interacting with microbial cells. These divalent cations may also compete with copper for negatively charged sites on bacterial surfaces, further inhibiting copper’s antimicrobial effect. This mechanistic interpretation highlights that hardness ions exert a dual role: while they can influence cell envelope properties, their stronger effect in this context is to limit copper bioavailability. Under neutral pH and standard ionization conditions, this dual interaction results in only minor variations in bacterial inactivation, indicating that manipulation of Ca2+ and Mg2+ levels alone is unlikely to optimize disinfection performance without the inclusion of synergistic treatments such as chlorination, copper ionization, or advanced oxidation processes.

3.5. Effects of Copper Ion Concentration on Bacterial Inactivation and Kinetic Modelling

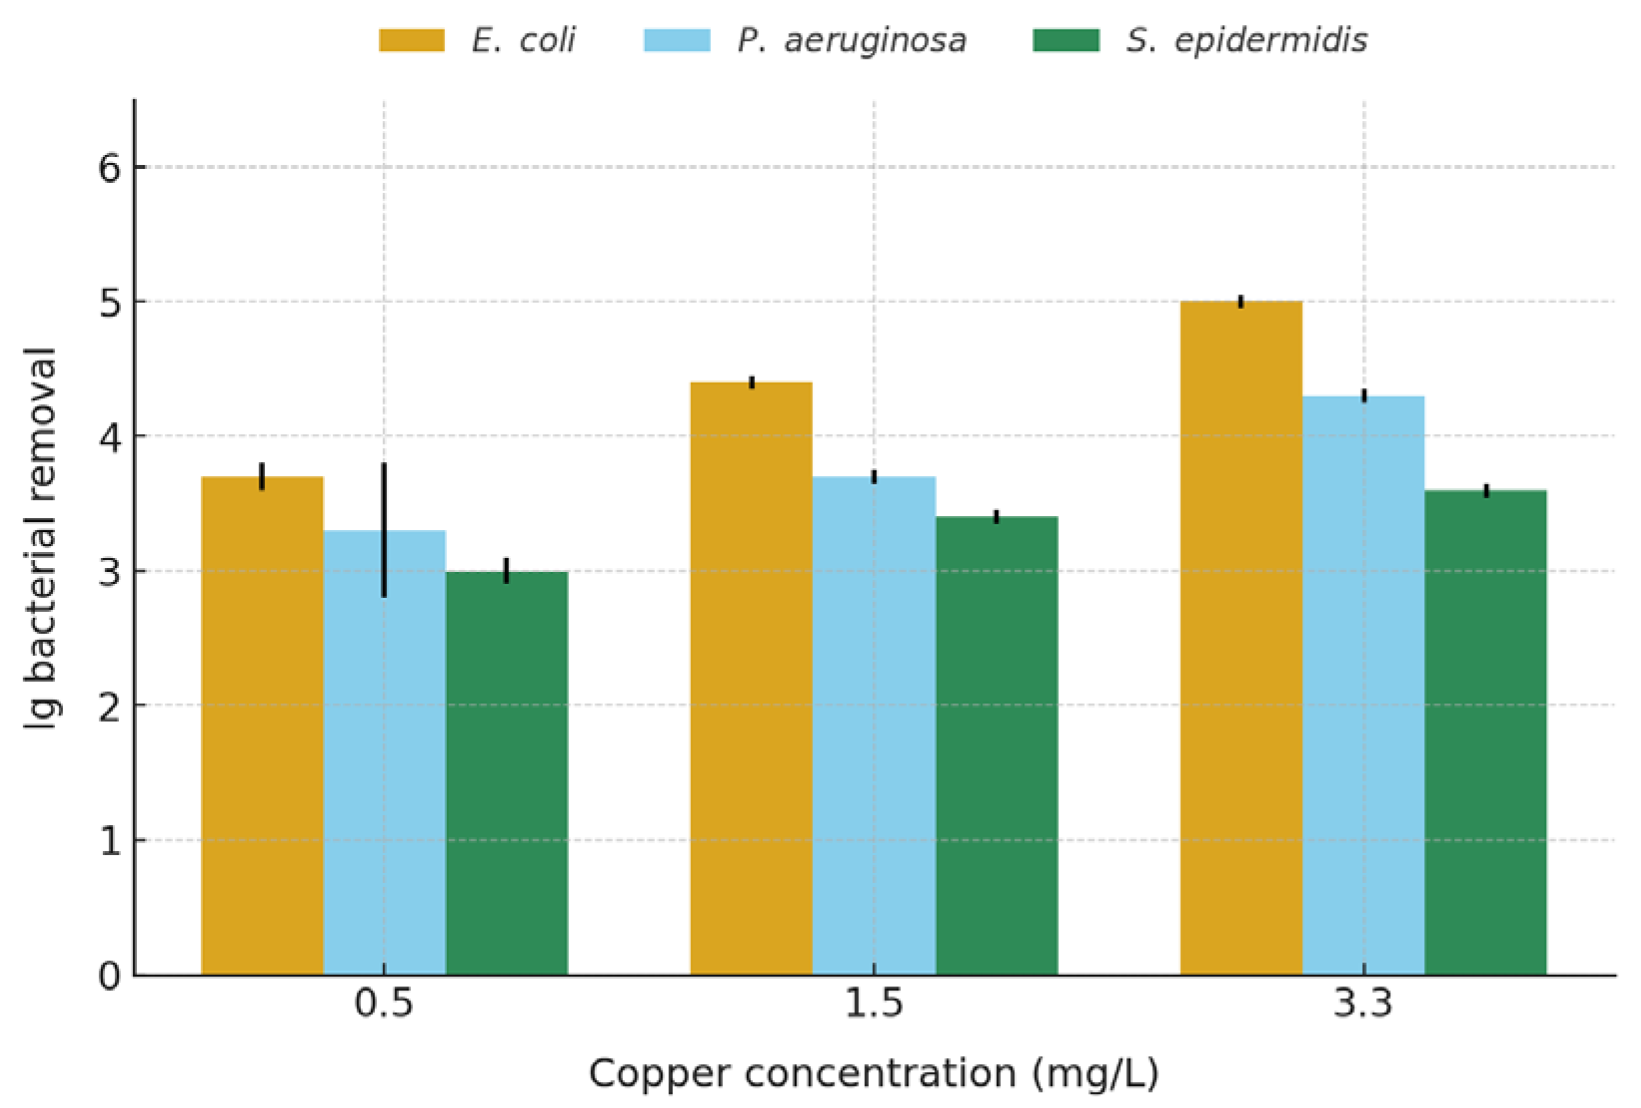
The experimental results demonstrated that increasing copper ion concentrations markedly enhanced bactericidal efficacy across all tested species. Figure 7 presents the logarithmic reductions in E. coli, P. aeruginosa, and S. epidermidis at 0.5, 1.5, and 3.3 mg/L Cu2+ over contact times ranging from 0.5 to 60 min. Both copper dose and exposure duration had a strong influence on inactivation kinetics. At 0.5 mg/L, E. coli exhibited the greatest susceptibility (~3.7 lg reduction), reaching complete inactivation within 10 min, whereas P. aeruginosa (~3.3 lg) and S. epidermidis (~3.0 lg) displayed slower initial reductions and required longer contact times for full elimination. These interspecies differences likely reflect variations in cell envelope structure and copper tolerance mechanisms, such as efflux pumps and metal-binding proteins, which may provide transient protection under sub-lethal copper exposure [49].
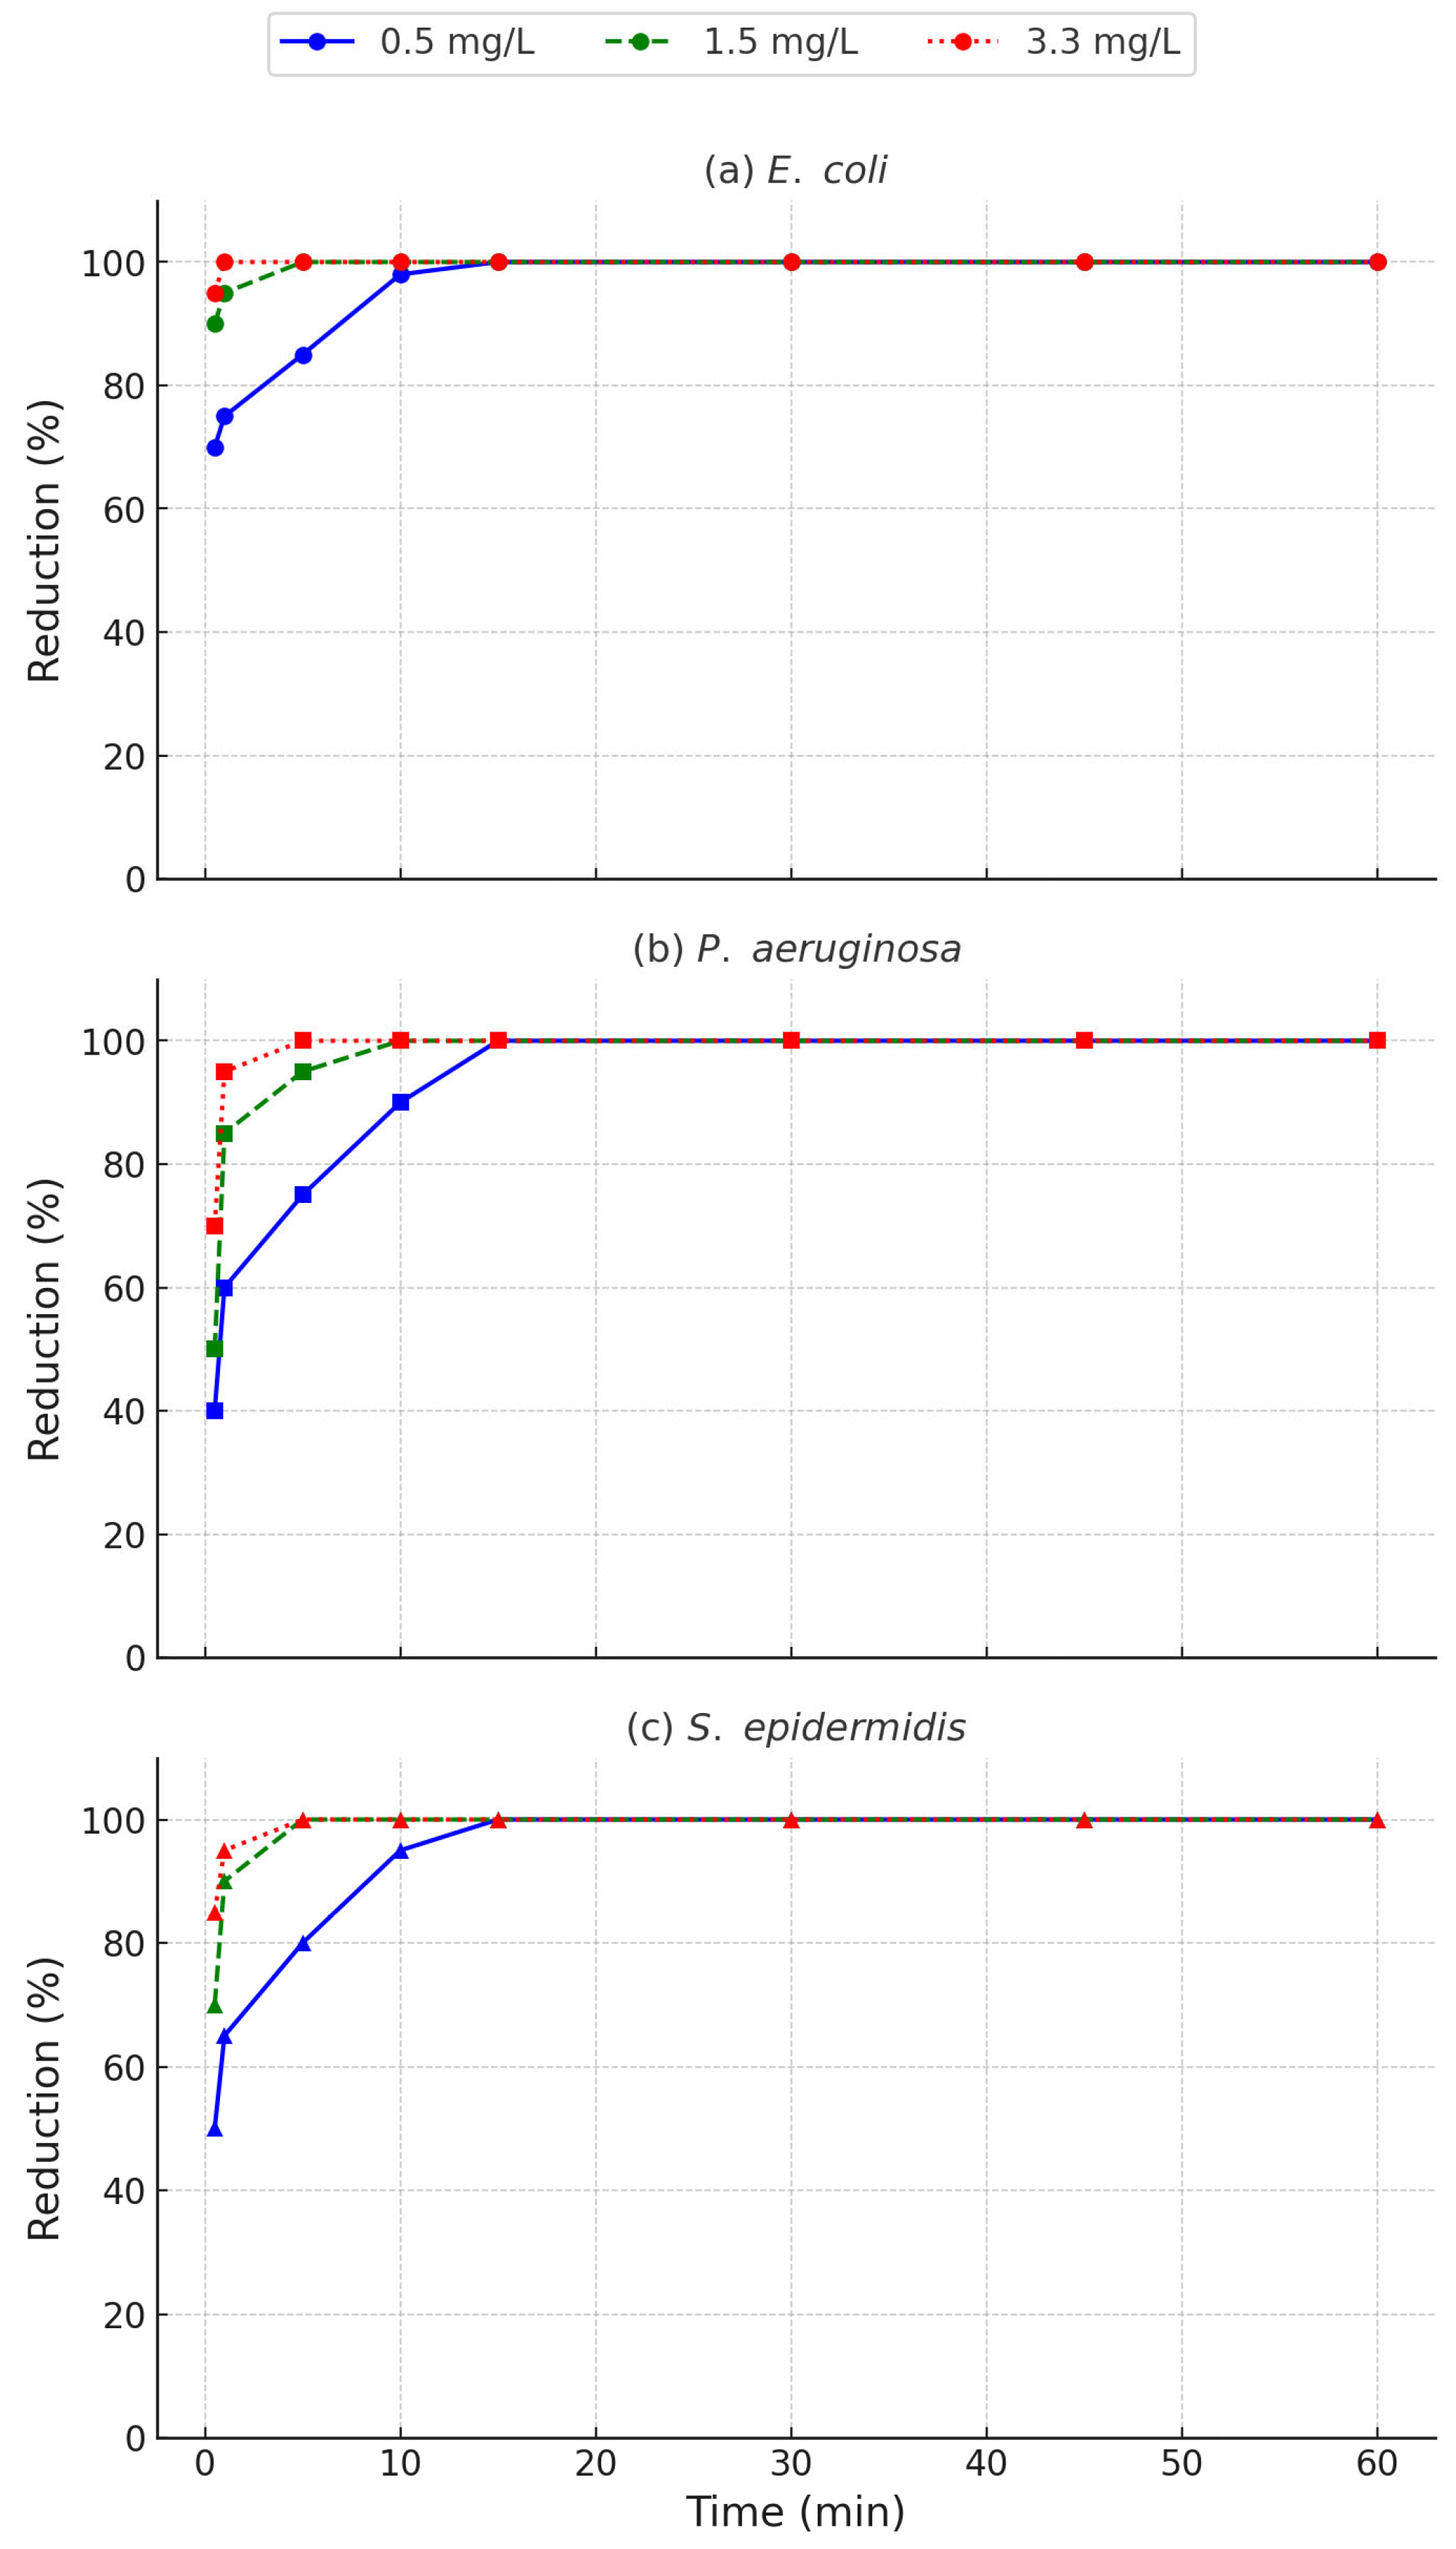
A copper concentration of 1.5 mg/L resulted in a substantial increase in disinfection efficiency across all species. E. coli showed ~4.4 log reduction and complete inactivation within 5 min, whereas P. aeruginosa and S. epidermidis required approximately 5 and 10 min, respectively. This improvement can be attributed to higher availability of bioactive Cu2+ ions, which promote membrane disruption, enzymatic inhibition, and oxidative stress, thereby overcoming initial resistance barriers [49]. At 3.3 mg/L, E. coli, P. aeruginosa, and S. epidermidis exhibited ~4.94, ~4.25, and ~3.75 lg reductions, respectively, corresponding to >99.9% elimination of the initial populations. Complete inactivation occurred within 5 min for all species, with pronounced reductions already evident within the first 30 s. Such rapid action is consistent with previous reports showing that elevated copper levels induce immediate membrane disruption, protein denaturation, and metabolic collapse [53].
A clear concentration-dependent bactericidal effect was also evident in the time-dependent inactivation curves (Figure 8). Exposure to 3.3 mg/L Cu2+ resulted in complete inactivation (≥99% or ≥2 lg reduction) of all species within 5–10 min, with no regrowth detected during the 60 min contact period. At 1.5 mg/L, E. coli and S. epidermidis reached complete inactivation within 10–15 min, whereas P. aeruginosa required up to 30 min. At the lowest concentration (0.5 mg/L), inactivation was markedly slower, particularly for P. aeruginosa, which required nearly 60 min to reach ≥99% reduction. The corresponding T99 values demonstrate the species-specific hierarchy: E. coli showed the shortest times, S. epidermidis displayed intermediate values, and P. aeruginosa consistently required the longest exposure. These differences are attributable to physiological traits: E. coli’s thin Gram-negative envelope permits rapid Cu2+ penetration [54,55], S. epidermidis’s thick peptidoglycan and teichoic acids confer partial protection [47], while P. aeruginosa resists copper through efflux systems and biofilm formation [40].
Two-way ANOVA (Table 1) further clarified the relative contributions of copper concentration, exposure time, and their interaction. Exposure time emerged as the dominant determinant of bacterial inactivation, with partial η2 values approaching 0.99 across all species, indicating that nearly all variance in lg reductions was attributable to contact duration. Copper concentration also exerted a strong effect, particularly for E. coli (F = 448.13, η2 = 0.94) and S. epidermidis (F = 243.19, η2 = 0.90), while the effect was more modest for P. aeruginosa (F = 74.84, η2 = 0.74). Significant interaction terms (p < 0.001 for all species; partial η2 = 0.71–0.81) revealed that the impact of concentration was highly dependent on exposure time. Higher doses produced rapid multi-log reductions during short contact periods, whereas lower doses required extended exposure to achieve comparable outcomes.
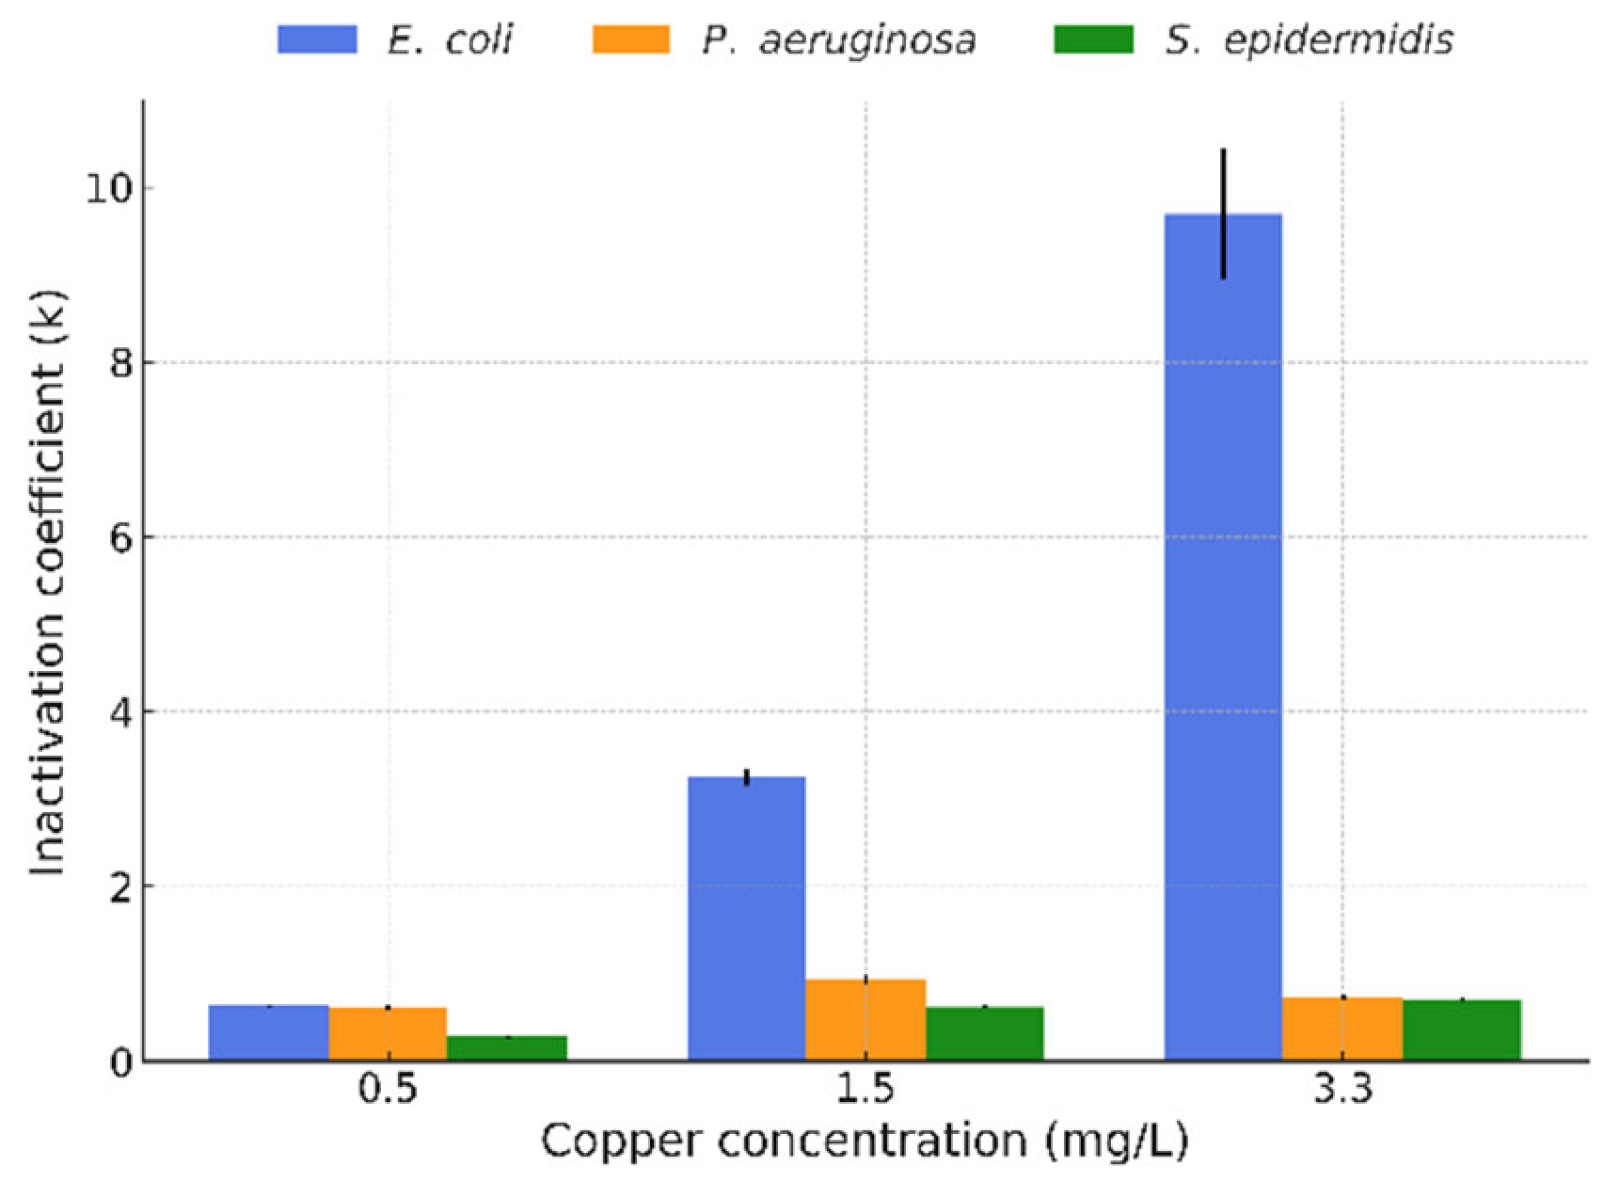
The inactivation kinetics were further analyzed using the Gard model, which estimates both the initial inactivation rate constant (k) and the curvature of the survival curve, thereby capturing both the rapid kill phase and the tailing region (Figure 9). For E. coli, k values increased sharply with copper concentration—0.63 at 0.5 mg/L, 3.27 at 1.5 mg/L, and 9.83 at 3.3 mg/L—indicating a strong dose-dependent effect. These high k values correspond to steep initial declines in viable counts, consistent with previous Gard model studies reporting short lag phases and rapid multi-log reductions at elevated copper doses [39,41]. In contrast, P. aeruginosa and S. epidermidis maintained low k values (≤1.0) across all concentrations, showing no marked acceleration in early inactivation. Literature comparisons confirm that P. aeruginosa often survives longer in copper-treated water due to efflux systems (CopA, CueO, and CusCFBA), periplasmic sequestration, and biofilm formation [39,56,57]. For S. epidermidis, the intermediate susceptibility—faster inactivation than P. aeruginosa but slower than E. coli—is consistent with reports highlighting the role of its thick peptidoglycan wall and teichoic acids in delaying copper penetration [57,58]. The integration of experimental lg reduction data with the Gard model-derived k values thus provides a clear, quantitative demonstration of species-specific differences in copper susceptibility.
In kinetic terms, high-concentration/short-contact conditions (e.g., 3.3 mg/L for ≤10 min) produced low CT (concentration × time) values and rapid multi-log reductions, whereas low-dose/long-contact scenarios (e.g., 0.5 mg/L for ≥30 min) required significantly higher CT values to achieve comparable inactivation [57]. Mechanistically, copper’s antimicrobial activity is attributed to the combined effects of membrane integrity loss, metalloenzyme dysfunction, and oxidative damage to nucleic acids and proteins [53,59,60]. From a practical perspective, the inclusion of 3.3 mg/L Cu2+ was not intended as an operational recommendation but as an experimental condition to probe the upper performance limits of copper ionization. At this concentration, complete inactivation was achieved within 10–15 min across all species, suggesting potential relevance for rapid or emergency disinfection scenarios, such as shock treatment of heavily contaminated systems.
The World Health Organization (WHO) recommends a guideline value of 2 mg/L Cu2+ in drinking water to minimize organoleptic problems such as taste and odor, as well as potential long-term health risks [54]. In continuous water treatment, concentrations at or below this level are also most appropriate due to operational concerns such as corrosion risk and regulatory compliance. Suboptimal dosing—particularly for resistant species such as P. aeruginosa—may allow the survival of persister populations capable of regrowth, posing a public health risk [50]. Copper ionization is generally effective against both Gram-negative and Gram-positive bacteria; however, in practice, ensuring both efficacy and safety requires careful balancing of concentration, contact time, and water chemistry. In this study, the evaluated concentration of 3.3 mg/L was not intended as a recommended operational dose but was instead examined as an experimental condition to explore the upper performance limits of copper ionization. At this supra-guideline level, complete inactivation of all tested bacterial species was achieved within 10–15 min, which highlights its potential importance in highly contaminated distribution systems or emergency water treatment scenarios. Therefore, while routine applications should remain within the WHO guideline to ensure safety and regulatory compliance, higher copper concentrations may be considered as a short-term strategy under exceptional contamination conditions to provide rapid microbial control.
The inactivation kinetics were further analyzed using the Gard model, which estimates both the initial inactivation rate constant (k) and the curvature of the survival curve, thereby capturing both the rapid kill phase and the tailing region (Figure 9). E. coli showed a clear dose–response, with k values of 0.63, 3.27, and 9.83 at 0.5, 1.5, and 3.3 mg/L Cu2+, respectively. These high k values correspond to steep initial declines in viable counts, consistent with previous Gard model studies reporting short lag phases and rapid multi-log reductions at elevated copper doses [31,32,53]. In contrast, P. aeruginosa and S. epidermidis maintained low k values (≤1.0) across all concentrations, showing no marked acceleration in early inactivation. P. aeruginosa consistently survived longer under copper exposure, which can be attributed to its active efflux systems (CopA, CueO, and CusCFBA), periplasmic sequestration, and biofilm formation [39,56]. In contrast, S. epidermidis showed intermediate susceptibility—faster inactivation than P. aeruginosa but slower than E. coli—likely due to the protective role of its thick peptidoglycan wall and teichoic acids in delaying copper penetration [56,57].
The integration of experimental lg reduction data with the Gard model-derived k values clearly demonstrates pronounced, species-specific differences in copper susceptibility. E. coli exhibited the highest k values and the most rapid inactivation rates, S. epidermidis showed intermediate inactivation kinetics, and P. aeruginosa displayed the slowest response. These results are consistent with previous kinetic modeling studies on copper-mediated disinfection of both Gram-negative and Gram-positive bacteria, underscoring the necessity of tailoring copper ionization parameters to the microbial community composition and the desired performance targets in water treatment applications.

3.6. ATP Reduction Patterns

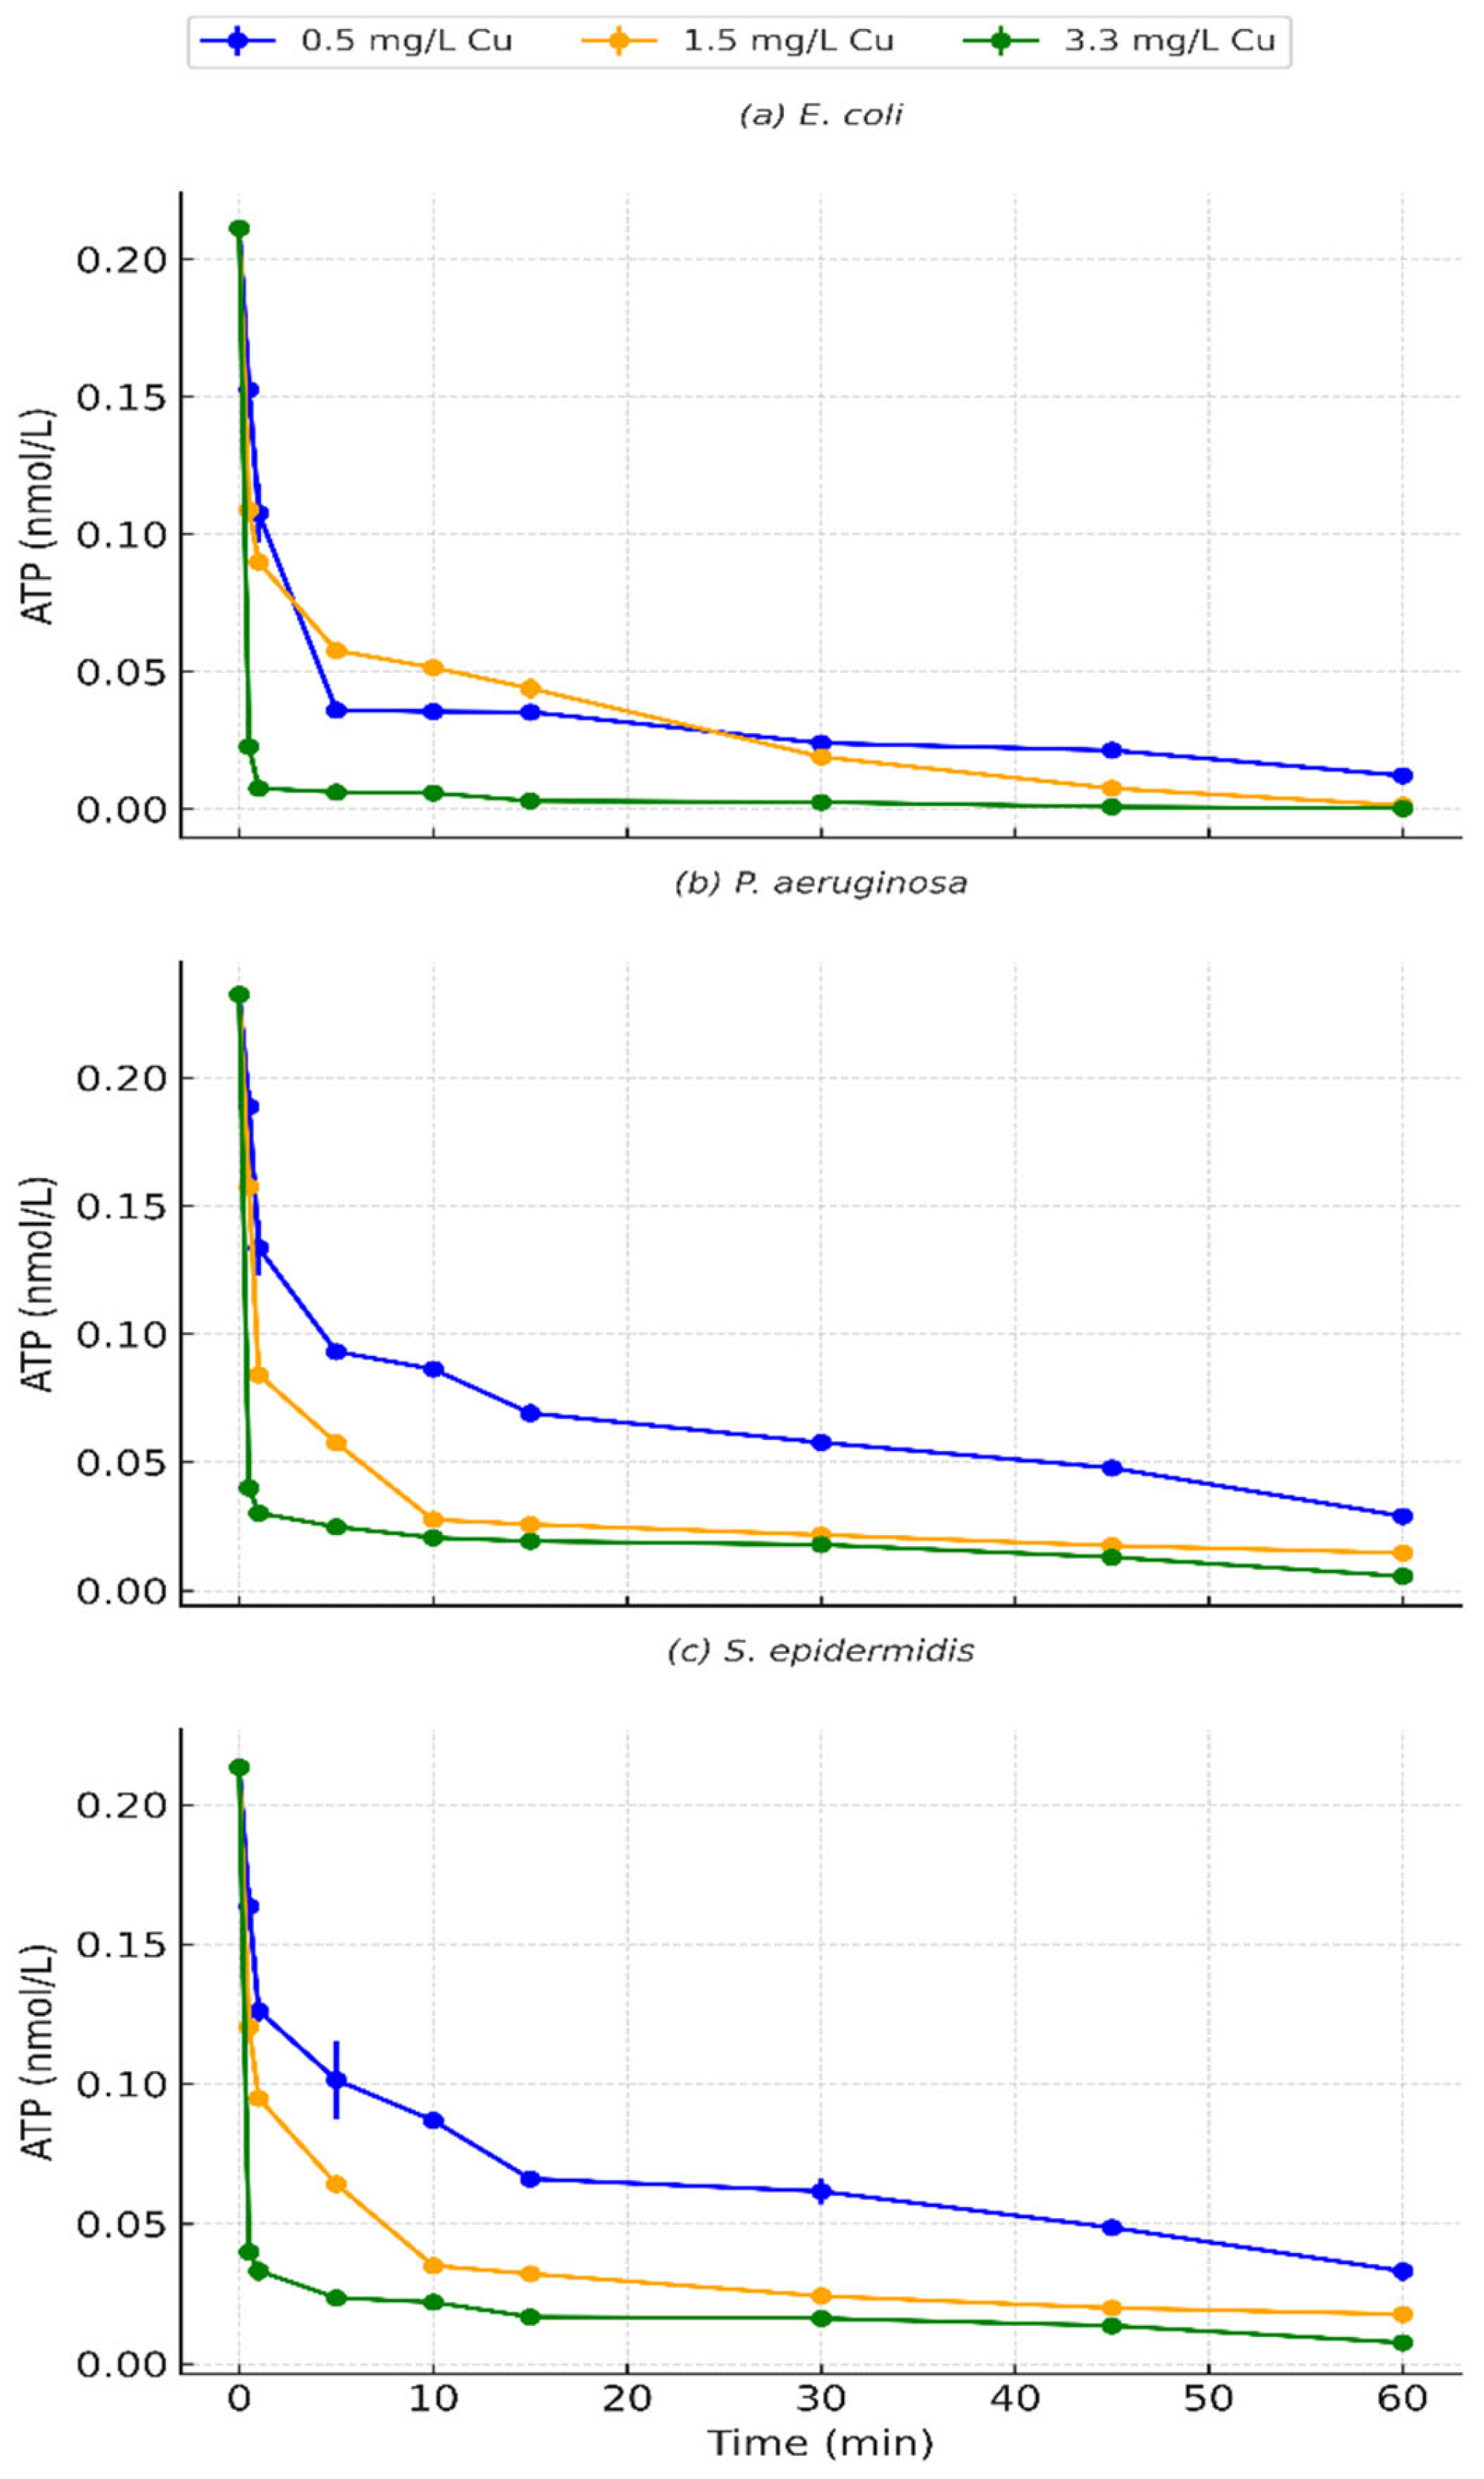
The ATP-based analysis provided critical insights into the early stages of microbial inactivation and metabolic disruption following copper exposure. A dramatic decline in ATP concentrations was observed within the first 5–15 min of treatment, particularly at higher copper concentrations. For instance, at 3.3 mg/L Cu2+, ATP levels in E. coli decreased by more than 90% within the first 5 min, indicating that copper exerts an immediate and profound impact on cellular energy production mechanisms (Figure 10) [8,32,49]. This rapid ATP depletion occurred well before total cell death was confirmed via culture-based methods, suggesting that copper’s initial antimicrobial action involves the disruption of key metabolic pathways [41,53,61]. At lower copper concentrations, the decrease in ATP was slower and less pronounced, reflecting the dose-dependent nature of copper toxicity. Importantly, these results illustrate the added value of ATP assays in disinfection studies, as they enable the detection of real-time cellular stress and metabolic inactivity that may not be immediately evident in conventional CFU assays.
Considered in combination, the culture and ATP assays provide a more comprehensive understanding of bacterial inactivation dynamics. Culture assays confirm the eventual loss of cell viability, whereas ATP measurements reveal the onset and magnitude of early metabolic impairment. This reinforces the conclusion that copper initiates microbial suppression rapidly, even under exposure conditions that delay complete inactivation. The results clearly demonstrate that increasing copper ion concentration leads to a more rapid and pronounced reduction in intracellular ATP across all tested bacterial species, reflecting enhanced biocidal activity [17,34,53]. Among the studied organisms, E. coli exhibited a steep decline at 3.3 mg/L Cu2+, with near-total ATP depletion by 15 min, indicative of acute metabolic collapse. In contrast, P. aeruginosa showed a slower decline, suggesting species-specific resistance likely linked to its outer membrane properties and efflux systems. S. epidermidis, as a Gram-positive bacterium with a thick peptidoglycan layer, demonstrated a more gradual ATP reduction at lower copper levels (0.5 mg/L), yet still reached minimal ATP within 60 min.
The consistent decline in ATP across all species confirms the broad-spectrum antimicrobial potential of copper ions, most likely mediated through multi-target mechanisms including membrane disruption, enzyme inhibition, and oxidative stress induction. Moreover, ATP-based assays represent a particularly valuable tool in disinfection research because they provide near real-time information on cellular viability and metabolic status, in contrast to culture-based methods that require extended incubation. Previous studies have shown that intracellular ATP pools decline within minutes of antimicrobial exposure, making ATP a highly sensitive early biomarker of cellular injury and metabolic collapse [18,34,35]. This rapid response reflects the tight coupling of ATP synthesis with membrane integrity, proton motive force, and enzymatic function; once these systems are compromised, ATP depletion precedes culturability loss. Consequently, the immediate ATP reductions observed in this study confirm its role as a critical early indicator of antimicrobial action and highlight the importance of integrating ATP-based methods with conventional assays to obtain a comprehensive understanding of disinfection kinetics.

4. Conclusions

This study demonstrates that copper ionization has considerable potential for microbial control in drinking water systems while adding new evidence to the existing literature. Concentrations above 1.5 mg/L enabled rapid inactivation of all tested bacteria, although operational constraints—corrosion risk, aesthetic effects, and the WHO guideline of 2 mg/L—must be considered. Efficacy was strongly modulated by bacterial physiology, water chemistry, and environmental conditions, underscoring the need for context-specific optimization. The integration of culture-based methods with ATP bioluminescence and flow cytometry showed that copper causes early metabolic disruption and membrane damage prior to culturability loss, providing valuable mechanistic insight. Overall, the findings support the design of effective, regulation-compliant, and consumer-acceptable disinfection systems and complement earlier studies by offering a broader evaluation of copper ionization under diverse conditions. Future work should prioritize field-scale and long-term assessments, monitoring potential tolerance or resistance, and exploring synergies with other disinfection technologies to ensure safe and sustainable use in water supply systems.

Author Contributions

Conceptualization and experimental analyses (A.T. and M.E.Ö.), data curation (A.T. and M.E.Ö.), statistical/formal analysis (A.T. and M.E.Ö.), and funding acquisition, writing, and editing (A.T.). All authors have read and agreed to the published version of the manuscript.

Funding

This research was funded by the Scientific Research Projects Coordination Unit of Bursa Uludağ University (Project No: OUAP (M) 2013-36).

Data Availability Statement

The original contributions presented in this study are included in the article. Further inquiries can be directed to the corresponding authors.

Acknowledgments

During the preparation of this manuscript, the authors used Microsoft Excel (Microsoft Corporation, Redmond, WA, USA; Office 365 version) and Python with the Matplotlib library (version 3.8.0) for the purposes of preparing some graphs. Arzu Teksoy used ChatGPT, GPT-5 pro version, for the purposes of preparing some graphs. The authors have reviewed and edited the output and take full responsibility for the content of this publication.

Conflicts of Interest

The authors declare no conflicts of interest.

References

  1. WHO. Drinking-Water; World Health Organization: Geneva, Switzerland, 2022. [Google Scholar]
  2. Ashbolt, N.J. Microbial contamination of drinking water and disease outcomes in developing regions. Toxicology 2004, 198, 229–238. [Google Scholar] [CrossRef]
  3. United Nations. Sustainable Development Goal 6: Ensure Availability and Sustainable Management of Water and Sanitation for All; United Nations: New York, NY, USA, 2022. [Google Scholar]
  4. Li, L.; Mendis, N.; Trigui, H.; Oliver, J.D.; Faucher, S.P. The importance of the viable but non-culturable state in human bacterial pathogens. Front. Microbiol. 2014, 5, 258. [Google Scholar] [CrossRef]
  5. Richardson, S.D.; Plewa, M.J.; Wagner, E.D.; Schoeny, R.; DeMarini, D.M. Occurrence, genotoxicity, and carcinogenicity of regulated and emerging disinfection by-products in drinking water: A review and roadmap for research. Mutat. Res. 2007, 636, 178–242. [Google Scholar] [CrossRef] [PubMed]
  6. Oliver, J.D. The viable but non-culturable state in bacteria. J. Microbiol. 2005, 43, 93–100. [Google Scholar] [PubMed]
  7. Vincent, M.; Duval, R.E.; Hartemann, P.; Engels-Deutsch, M. Contact killing and antimicrobial properties of copper. Appl. Microbiol. Biotechnol. 2014, 98, 1001–1007. [Google Scholar] [CrossRef] [PubMed]
  8. Santo, C.E.; Morais, P.V.; Grass, G. Isolation and characterization of bacteria resistant to metallic copper surfaces. Appl. Environ. Microbiol. 2010, 76, 1341–1348. [Google Scholar] [CrossRef]
  9. Liu, R.; Gunawan, C.; Barraud, N.; Rice, S.A.; Harry, E.J.; Amal, R. Understanding, monitoring, and controlling biofilm growth in drinking water distribution systems. Environ. Sci. Technol. 2020, 54, 11953–11972. [Google Scholar] [CrossRef]
  10. Dziewulski, D.M.; Kulakov, L.A.; Wardell, J.; Colbourne, J.S. Use of copper–silver ionization for Legionella control in hospital water systems. J. Hosp. Infect. 2015, 91, 971–976. [Google Scholar] [CrossRef]
  11. Lin, Y.E.; Stout, J.E.; Yu, V.L. Controlling Legionella in hospital drinking water: An evidence-based review of disinfection methods. Infect. Control Hosp. Epidemiol. 2011, 32, 166–173. [Google Scholar] [CrossRef]
  12. Aldsworth, T.G.; Carrington, C.; Flegg, J.; Stewart, G.S.A.B.; Dodd, C.E.R. Bacterial adaptation to environmental stress: The implications for food processing. Leatherhead Food RA Food Ind. J. 1998, 1, 136–144. [Google Scholar]
  13. Ferro, S. Challenges in Designing Electrochemical Disinfection Systems for Reducing Microbial Contamination in Drinking Water Distribution Networks. Water 2025, 17, 754. [Google Scholar] [CrossRef]
  14. Li, R.; Dai, H.; Wang, W.; Peng, R.; Yu, S.; Zhang, X.; Huo, Z.-Y.; Yuan, Q.; Luo, Y. Local Electric Field-Incorporated In-Situ Copper Ions Eliminating Pathogens and Antibiotic Resistance Genes in Drinking Water. Antibiotics 2024, 13, 1161. [Google Scholar] [CrossRef]
  15. Xu, L.; Sigler, A.; Chernatynskaya, A.; Rasmussen, L.; Lu, J.; Sahle-Demessie, E.; Westenberg, D.; Yang, H.; Shi, H. Study of Legionella pneumophila Treatment with Copper in Drinking Water by Single Cell-ICP-MS. Anal. Bioanal. Chem. 2024, 416, 419–430. [Google Scholar] [CrossRef] [PubMed]
  16. Hammes, F.; Egli, T. New method for assimilable organic carbon determination using flow-cytometric enumeration and a natural microbial consortium as inoculum. Environ. Sci. Technol. 2005, 39, 3289–3294. [Google Scholar] [CrossRef] [PubMed]
  17. Prest, E.I.; Hammes, F.; van Loosdrecht, M.C.M.; Vrouwenvelder, J.S. Biological stability of drinking water: Controlling factors, methods, and challenges. Front. Microbiol. 2016, 7, 45. [Google Scholar] [CrossRef] [PubMed]
  18. Van der Wielen, P.W.J.J.; van der Kooij, D. Effect of water composition, distance and season on the adenosine triphosphate concentration in unchlorinated drinking water in the Netherlands. Water Res. 2010, 44, 4860–4867. [Google Scholar] [CrossRef]
  19. Magic-Knezev, A.; van der Kooij, D. Optimisation and significance of ATP analysis for measuring active biomass in granular activated carbon filters used in water treatment. Water Res. 2004, 38, 3971–3979. [Google Scholar] [CrossRef]
  20. APHA. Standard Methods for the Examination of Water and Wastewater, 23rd ed.; APHA: Washington, DC, USA, 2017. [Google Scholar]
  21. Valkonen, M.; Penttinen, R.; Vaara, M.; Kukkonen, J. Effect of temperature on the efficacy of disinfectants against Legionella pneumophila biofilms. J. Appl. Microbiol. 2020, 128, 1219–1229. [Google Scholar]
  22. LeChevallier, M.W.; Cawthon, C.D.; Lee, R.G. Factors promoting survival of bacteria in chlorinated water supplies. Appl. Environ. Microbiol. 1988, 54, 649–654. [Google Scholar] [CrossRef]
  23. Landeen, L.K.; Yahya, M.T.; Gerba, C.P. Efficacy of copper and silver ions and reduced levels of free chlorine in inactivation of Legionella pneumophila. Appl. Environ. Microbiol. 1989, 55, 3045–3050. [Google Scholar] [CrossRef]
  24. Liu, H.; Chen, T.; Wang, J.; Wang, C. Effect of pH on copper corrosion and release in drinking water systems. Corros. Sci. 2012, 65, 536–543. [Google Scholar]
  25. Tipping, E. Humic substances in soil, sediment, and water: Their behavior and impact on the environment. Environ. Sci. Technol. 2002, 36, 248A–249A. [Google Scholar]
  26. Watson, H.E. A note on the variation of the rate of disinfection with change in the concentration of the disinfectant. J. Hyg. 1908, 8, 536–542. [Google Scholar] [CrossRef] [PubMed]
  27. Haas, C.N.; Joffe, J. Disinfection under dynamic conditions: Modification of the Chick–Watson model. Environ. Sci. Technol. 1994, 28, 1367–1370. [Google Scholar] [CrossRef] [PubMed]
  28. Najm, I.N. Modeling Water Treatment Plant Performance; AWWA Research Foundation: Denver, CO, USA, 2006. [Google Scholar]
  29. ISO 9308-1:2014; Water Quality—Enumeration of Escherichia coli and Coliform Bacteria—Part 1: Membrane Filtration Method. International Organization for Standardization: Geneva, Switzerland, 2014.
  30. APHA. Standard Methods for the Examination of Water and Wastewater, 22nd ed.; American Public Health Association: Washington, DC, USA, 2012. [Google Scholar]
  31. ISO 16266:2006; Water Quality—Detection and Enumeration of Pseudomonas aeruginosa—Method by Membrane Filtration. International Organization for Standardization: Geneva, Switzerland, 2006.
  32. CLSI. Performance Standards for Antimicrobial Susceptibility Testing, 31st ed.; CLSI Supplement M100; Clinical and Laboratory Standards Institute: Wayne, PA, USA, 2021. [Google Scholar]
  33. Hammes, F.; Berney, M.; Wang, Y.; Vital, M.; Köster, O.; Egli, T. Flow-cytometric total bacterial cell counts as a descriptive microbiological parameter for drinking water treatment processes. Water Res. 2008, 42, 269–277. [Google Scholar] [CrossRef]
  34. Berney, M.; Hammes, F.; Bosshard, F.; Weilenmann, H.U.; Egli, T. Assessment and interpretation of bacterial viability by using the LIVE/DEAD BacLight kit in combination with flow cytometry. Appl. Environ. Microbiol. 2007, 73, 3283–3290. [Google Scholar] [CrossRef]
  35. Hammes, F.; Egli, T. Cytometric methods for measuring bacteria in water: Advantages, pitfalls and applications. Anal. Bioanal. Chem. 2010, 397, 1083–1095. [Google Scholar] [CrossRef]
  36. Grass, G.; Rensing, C.; Solioz, M. Metallic Copper as an Antimicrobial Surface. Appl. Environ. Microbiol. 2011, 77, 1541–1547. [Google Scholar] [CrossRef]
  37. Choi, S.H.; Lee, J.H.; Kim, S.J.; Park, H.D. The CusCFBA Efflux System Plays a Role in Escherichia coli’s Survival in Toxic Copper Environments. FEMS Microbiol. Lett. 2018, 365, fnx282. [Google Scholar] [CrossRef]
  38. Macomber, L.; Hausinger, R.P. Mechanisms of nickel and copper toxicity in microorganisms. Metallomics 2011, 3, 1153–1162. [Google Scholar] [CrossRef]
  39. Santo, C.E.; Lam, E.W.; Elowsky, C.G.; Quaranta, D.; Domaille, D.W.; Chang, C.J.; Grass, G. Bacterial Killing by Dry Metallic Copper Surfaces. Appl. Environ. Microbiol. 2011, 77, 794–802. [Google Scholar] [CrossRef] [PubMed]
  40. Outten, F.W.; Huffman, D.L.; Hale, J.A.; O’Halloran, T.V. The independent cue and cus systems confer copper tolerance during aerobic and anaerobic growth in Escherichia coli. J. Biol. Chem. 2001, 276, 30670–30677. [Google Scholar] [CrossRef] [PubMed]
  41. Warnes, S.L.; Caves, V.; Keevil, C.W. Mechanism of Copper Surface Toxicity in Escherichia coli O157:H7 and Salmonella Involves Immediate Membrane Depolarization Followed by Slower Rate of DNA Destruction, Which Differs from That Observed for Gram-Positive Bacteria. Environ. Microbiol. 2012, 14, 1730–1743. [Google Scholar] [CrossRef] [PubMed]
  42. Molteni, C.; Abicht, H.K.; Solioz, M. Killing of Bacteria on Copper Surfaces via Respiratory Inhibition Is in the Millisecond Range. Appl. Environ. Microbiol. 2010, 76, 4099–4101. [Google Scholar] [CrossRef]
  43. De Schamphelaere, K.A.C.; Vasconcelos, F.M.; Tack, F.M.G.; Allen, H.E.; Janssen, C.R. Effect of dissolved organic matter source on acute copper toxicity to Daphnia magna. Environ. Toxicol. Chem. 2004, 23, 1248–1255. [Google Scholar] [CrossRef]
  44. Linbo, T.L.; Sadler, R.M.; Hoffman, J.L.; Venables, W.Y.; McIntyre, J.K.; Baldwin, D.H. Effects of water hardness, alkalinity, and dissolved organic carbon on the toxicity of copper to the lateral line of developing fish (Danio rerio). Environ. Toxicol. Chem. 2009, 28, 1455–1461. [Google Scholar] [CrossRef]
  45. Flemming, H.-C.; Wingender, J. The biofilm matrix. Nat. Rev. Microbiol. 2010, 8, 623–633. [Google Scholar] [CrossRef]
  46. Xavier, J.B.; Picioreanu, C.; Abdul Rani, S.; van Loosdrecht, M.C.M.; Stewart, P.S. Biofilm-control strategies based on enzymic disruption of the extracellular polymeric substance matrix—A modelling study. Microbiology 2005, 151, 3817–3832. [Google Scholar] [CrossRef]
  47. Harrison, J.J.; Ceri, H.; Turner, R.J. Multimetal resistance and tolerance in microbial biofilms. Nat. Rev. Microbiol. 2007, 5, 928–938. [Google Scholar] [CrossRef]
  48. Lin, W.; Yu, Z.; Chen, X.; Liu, R.; Zhang, H.; Lin, J.; Gao, W. Bacterial community dynamics in a full-scale drinking water treatment plant. Front. Microbiol. 2016, 7, 246. [Google Scholar] [CrossRef]
  49. Mikolay, A.; Huggett, S.; Tikana, L.; Grass, G.; Braun, J.; Nies, D.H. Survival of bacteria on metallic copper surfaces in a hospital trial. Appl. Microbiol. Biotechnol. 2010, 87, 1875–1879. [Google Scholar] [CrossRef]
  50. Sharan, R.; Chhibber, S.; Reed, R.H. Inactivation and potential mechanisms of Escherichia coli by copper in drinking water. Water Sci. Technol. 2010, 61, 865–871. [Google Scholar] [CrossRef]
  51. Pamp, S.J.; Sternberg, C.; Tolker-Nielsen, T. Insight into the microbial multicellular lifestyle via flow-cell technology and confocal microscopy. Cytom. A 2008, 75, 90–103. [Google Scholar] [CrossRef]
  52. Tiwari, N.; Santhiya, D.; Sharma, J.G. Significance of landfill microbial communities in biodegradation of polyethylene and nylon 6,6 microplastics. J. Hazard. Mater. 2024, 462, 132786. [Google Scholar] [CrossRef]
  53. Mathews, S.; Hans, M.; Mücklich, F.; Solioz, M. Contact killing of bacteria on copper is suppressed if bacterial-metal contact is prevented and is induced on iron by copper ions. Appl. Environ. Microbiol. 2015, 81, 1085–1091. [Google Scholar] [CrossRef] [PubMed]
  54. Haas, C.N.; Karra, S.B. Kinetics of microbial inactivation by chlorine—I. Review of results in demand-free systems. Water Res. 1984, 18, 1443–1449. [Google Scholar] [CrossRef]
  55. Rosenblatt, A.A.; Margalit, E.; Nejidat, A.; Ronen, Z. Monitoring biofilm bacterial communities in a pilot drinking water distribution system using flow cytometry and high-throughput sequencing. Water 2018, 10, 166. [Google Scholar] [CrossRef]
  56. Teitzel, G.M.; Parsek, M.R. Heavy metal resistance of biofilm and planktonic Pseudomonas aeruginosa. Appl. Environ. Microbiol. 2003, 69, 2313–2320. [Google Scholar] [CrossRef]
  57. Harrison, J.J.; Turner, R.J.; Ceri, H. High-throughput metal susceptibility testing of microbial biofilms. BMC Microbiol. 2005, 5, 53. [Google Scholar] [CrossRef]
  58. Merchel Piovesan Pereira, B.; Tagkopoulos, I. Benzalkonium chlorides: Uses, regulatory status, and microbial resistance. Appl. Environ. Microbiol. 2019, 85, e00377-19. [Google Scholar] [CrossRef]
  59. Lemire, J.A.; Harrison, J.J.; Turner, R.J. Antimicrobial activity of metals: Mechanisms, molecular targets and applications. Nat. Rev. Microbiol. 2013, 11, 371–384. [Google Scholar] [CrossRef]
  60. Dupont, C.L.; Grass, G.; Rensing, C. Copper toxicity and the origin of bacterial resistance—New insights and applications. Metallomics 2011, 3, 1109–1118. [Google Scholar] [CrossRef]
  61. Ji, G.; Beavis, R.; Novick, R.P. Bacterial interference caused by autoinducing peptide variants. Science 1997, 276, 2027–2030. [Google Scholar] [CrossRef]
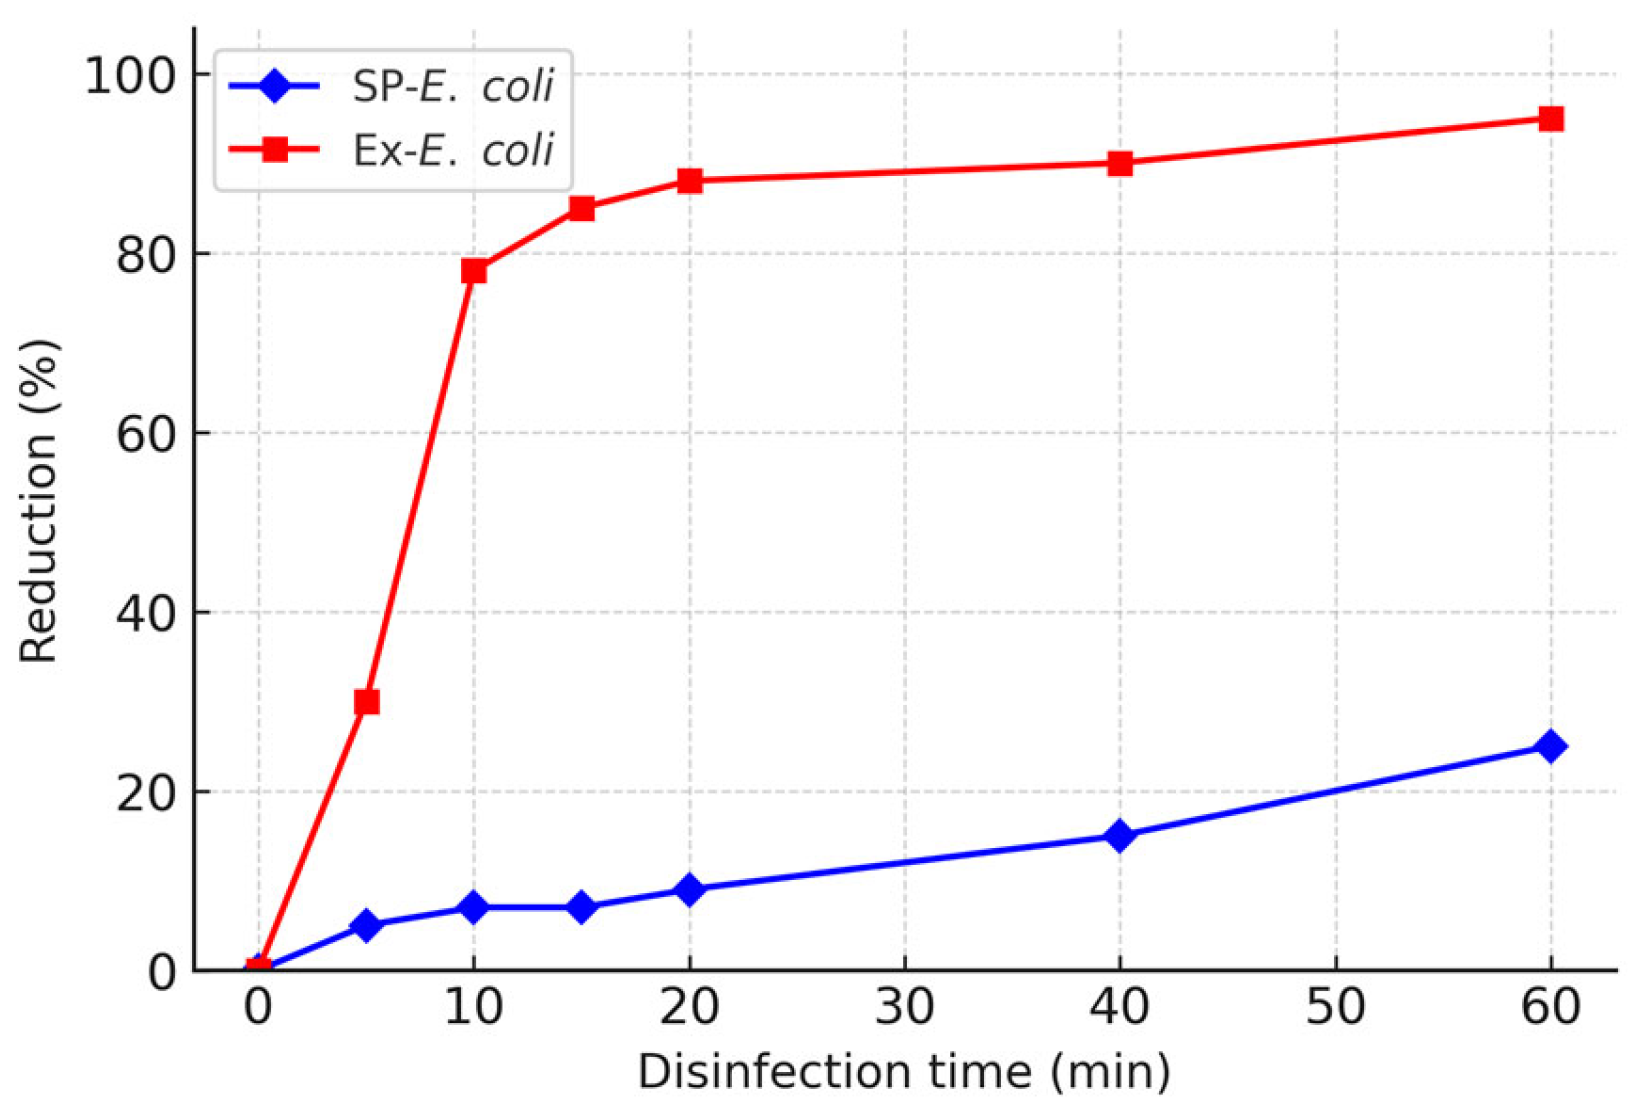
Figure 1. Percentage reduction in intact E. coli EP and SP growth states during copper ion disinfection over a 60 min exposure period.
Water 17 02797 g001
Figure 2. Flow cytometric view of the effect of bacterial growth phases on disinfection.
Water 17 02797 g002
Figure 3. Reduction in E. coli counts over disinfection time in untreated water (UW) and treated water (W).
Water 17 02797 g003
Figure 4. Time-dependent removal efficiency of E.coli exposed to copper ionization at 37 °C and 5 °C.
Water 17 02797 g004
Figure 5. Effect of pH on the inactivation of E. coli (0.5 mg/L Cu) over a 60 min contact time.
Water 17 02797 g005
Figure 6. Comparison of logarithmic bacterial removal as a function of bicarbonate, calcium, and magnesium concentrations.
Water 17 02797 g006
Figure 7. Logarithmic reduction in E. coli, P. aeruginosa, and S. epidermidis at different copper ion concentrations (0.5, 1.5, and 3.3 mg/L).
Water 17 02797 g007
Figure 8. Time-dependent reduction in bacterial counts for E. coli (a), P. aeruginosa (b), and S. epidermidis (c) exposed to copper ion concentrations of 0.5 mg/L, 1.5 mg/L, and 3.3 mg/L.
Water 17 02797 g008
Figure 9. Inactivation coefficients (k) of E. coli, P. aeruginosa, and S. epidermidis at copper ion concentration.
Water 17 02797 g009
Figure 10. ATP concentration changes in E. coli (a), P. aeruginosa (b), and S. epidermidis (c) during 60 min exposure to copper ion concentrations of 0.5, 1.5, and 3.3 mg/L.
Water 17 02797 g010
Table 1. Two-way ANOVA summary for the effects of copper concentration, exposure time, and their interaction on bacterial inactivation (log10 CFU/mL).
SourceStatisticE. coliP. aeruginosaS. epidermidis
Cu concentrationF448.1374.84243.19
p-value<0.001<0.001<0.001
Partial η20.940.740.90
TimeF504.16637.441045.0
p-value<0.001<0.001<0.001
Partial η20.990.990.99
Interaction (Conc × Time)F11.678.2313.92
p-value<0.001<0.001<0.001
Partial η20.780.710.81
Disclaimer/Publisher’s Note: The statements, opinions and data contained in all publications are solely those of the individual author(s) and contributor(s) and not of MDPI and/or the editor(s). MDPI and/or the editor(s) disclaim responsibility for any injury to people or property resulting from any ideas, methods, instructions or products referred to in the content.