Abstract
Soil moisture content is an important determinant of crop productivity, especially in agricultural systems that are dependent on rainfall. Climate variability has introduced water management challenges for smallholder farmers in Southern Africa. The emergence of unmanned aerial vehicle (UAV)-borne remote sensing offers modern solutions for monitoring soil moisture, plant health and overall crop productivity in real-time. This study evaluated the utility of UAV-acquired data in conjunction with random forest regression in predicting soil moisture content and chlorophyll across different growth stages of taro. The estimation models achieved R2 values up to 0.90 with rRMSE as low as 1.25%, demonstrating the robust performance of random forest in concert with different spectral datasets in estimating soil moisture and chlorophyll. Correlation analysis confirmed the association between these two variables, with the strongest correlation observed during the vegetative stage (r = 0.81, p < 0.05) and the weakest during the late vegetative stage (r = 0.78, p < 0.05). The results showed that UAV bands were crucial in predicting soil moisture and chlorophyll across all stages. These results demonstrate the utility of remote sensing, particularly UAV-borne sensors, in monitoring crop productivity in smallholder farms. By employing UAV-borne sensors, farmers can improve on-farm water management and make better and more informed decisions.
1. Introduction
Food insecurity has been intensifying, and it remains a global concern. Agriculture is the backbone of food security; however, as the population continues to grow, so does the demand for food. Climate change poses a threat to the existing agricultural systems in place. Erratic weather events, such as droughts and flooding, lead to a reduction in crop yield, further exacerbating food insecurity issues [1]. Erratic weather conditions affect soil moisture content, which plays an important role in influencing crop health and overall productivity. Literature shows that soil moisture content is one of the most important parameters affecting crop yield and overall productivity [2,3,4]. This poses a challenge to regions such as Southern Africa, impacted by high climate variability, which induces extensive variations in the amounts and patterns of precipitation and soil moisture [5]. This affects 70% of the smallholder croplands in Africa, which conduct rain-fed crop farming, making them prone to the impacts of climate change [6]. Maintaining optimal moisture levels is important for crop yield and ensuring food security, especially in smallholder croplands where water and resources are limited. However, there are very limited spatially explicit methods of accurately assessing the linkages between soil moisture and crop productivity at near-real time.
Soil moisture stress occurs when there is little water available in the soil to support the photosynthetic process, affecting optimal plant growth [7]. The morphology and physiological functions of plants change under soil moisture stress [8]. This includes stunted plant growth, a reduction in photosynthetic activities, wilting of plants, lower crop yields and an increased susceptibility to pests [9,10]. According to Vennam et al. [8], plants can adapt to soil moisture stress, depending on the duration, growth stage and severity of the water stress. For instance, during the vegetative and tasseling stages, moisture stress results in reduced plant height and affects the leaf development and reproduction [11]. To combat the impact of climate variability and soil moisture stress, smallholder farmers are adopting neglected and underutilised crop species such as taro, which has the capability of thriving productively in drought conditions associated with high soil moisture stress. One of the most effective yet indirect ways of assessing soil moisture is through chlorophyll content in crops such as taro [12,13]. Chlorophyll is the green pigment of plants responsible for photosynthesis, and it is quite sensitive to the availability of soil moisture. [14]. Low soil moisture results in plants experiencing water stress, leading to less chlorophyll content [14,15]. Therefore, monitoring chlorophyll levels in “climate-smart” crops such as taro may reveal more about the field’s moisture conditions. For example, crops that reflect lower chlorophyll levels in a field could indicate that there is less soil moisture; therefore, a decision can be made to irrigate the field and enhance overall growth.
Soil moisture stress and its interaction with productivity elements of taro, particularly chlorophyll content, is traditionally and non-invasively measured using instruments which include the Konica Minolta SPAD 502 Plus (Konica Minolta, Inc., Marunouchi, Chiyoda, Tokyo, Japan) and the soil moisture probe (Delta-T Devices Ltd, Burwell, Cambridge, UK). Although these instruments are highly accurate, they tend to be point-based, time-consuming and monotonous [16]. Furthermore, these methods are often unable to capture the spatial variability of soil moisture across the fields, as they are limited in scope [17]. There is therefore a need for spatially explicit and accurate assessment of linkages between soil moisture and crop productivity in near-real time.
Literature demonstrates that remote sensing technologies can be effectively used to accurately assess soil moisture content and its linkage to the chlorophyll content of crop health [18]. For instance, Ma, Li and McCabe [18] utilised a combination of Sentinel-1 SAR and Sentinel-2 multispectral imagery to estimate soil moisture with root mean square errors (RMSEs) ranging from 0.039 to 0.078 m3/m3 and R2 ranging from 0.47 to 0.67. However, these sensors are limited in terms of their relatively coarse spatial and temporal resolutions [19]. They cannot capture the finest details and have a much longer revisit time, therefore, making them less suitable for monitoring crops in smallholder croplands, which are small, heterogeneous and highly fragmented [20]. Therefore, there is a need for remote sensing technologies that can provide high spatial and temporal resolution data suitable for accurately monitoring variations in soil moisture content and the chlorophyll content of crops such as taro in smallholder croplands across their different phenological stages.
The recent advances in remote sensing technology, particularly using UAVs, widely known as drones, have demonstrated promising potential for spatially quantifying precision agricultural aspects such as soil moisture stress and its linkage to crop productivity elements such as chlorophyll content [21]. These technologies are suitable for high-throughput remote sensing-based phenotyping in smallholder cropland because they fly at lower altitudes, capturing ultra-high spatial resolution data suitable for soil and crop productivity assessment [22]. Furthermore, UAVs can capture near-real-time remotely sensed data at user-defined spatial and temporal resolutions at a field scale. They are relatively more affordable and time-efficient, which makes them a suitable technology for settings such as smallholder croplands where resources are limited and the fields are small and fragmented. For example, Ge et al. [23] demonstrated that UAV-acquired hyperspectral data could estimate agricultural soil moisture content at optimal accuracies (R2 of 0.921 and RMSE of 1.943). Despite their capabilities, UAV-borne sensors have not been utilised to their fullest potential in mapping soil moisture content in relation to productivity elements such as the chlorophyll content of smallholder neglected and underutilised crops, such as taro. Therefore, there is a need to further explore their potential in assessing soil moisture content and the chlorophyll content of taro in smallholder croplands.
Therefore, this study aimed to (i) evaluate the potential of UAV-derived spectral bands and vegetation indices in estimating soil moisture content and chlorophyll levels in taro, (ii) assess the accuracy of random forest regression models across different growth stages, and (iii) determine the phenological stages at which UAV data provide the most reliable estimates. These objectives will contribute towards improving water management and crop productivity in smallholder farming systems. Remote sensing of soil moisture content and chlorophyll content of taro contributes towards optimising agricultural productivity in smallholder croplands. Indirectly, this work contributes towards addressing the grand global challenges of poverty, food, and nutrition insecurity, particularly in sub-Saharan Africa, where food shortages are a looming concern. This aligns with the objectives of [24].
2. Methods and Materials
2.1. Study Area
This study was conducted in Swayimane (29°52′ S, 30°66′ E), a rural area in UMshwathi Local Municipality in KwaZulu-Natal, South Africa (Figure 1). The region is characterised by smallholder farming systems and agricultural landscapes. Swayimane experiences warm summers and mild winters. The area receives annual rainfall ranging between 700 and 1000 mm. Rainfall is relatively evenly distributed throughout the year, with a slightly wetter period during the summer months. Swayimane is dominated by sandy and clay loams, which are generally good for retaining moisture [25]. The agriculture in the region is mostly rain-fed, with crops such as taro, sweet potato, maize, beans and spinach being the main crops for subsistence and local markets [26]. Since the region is dependent on small-scale farming and is primarily rain-fed, it is important that soil moisture is managed properly.
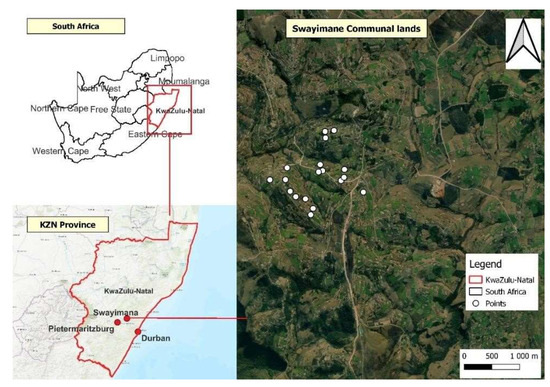
Figure 1.
Smallholder croplands in Swayimane communal lands, KwaZulu-Natal province, South Africa.
2.2. Image Acquisition and Processing
The Micasense Altum multispectral sensor on board the DJI Matrice 300 drone ((Da-Jiang Innovations/SZ DJI Technology Co., Ltd., Shenzhen, Guangdong Province, China) was used to capture images of the field and taro crops at different phenological stages. Before acquiring the field data, the experimental field was digitized using Google Earth Pro 7.1 8 and imported into ArcGIS Pro 3.0 to sample points at random. A flight plan was then generated according to the digitized polygon to plan a flight mission that covers the fields. The DJI Matrice 300 platform supports a variety of payloads such as LiDAR sensors, multispectral and thermal imaging cameras, which makes it more suitable for projects in agriculture and surveying. The DJI Matrice 300 platform has a flight control system that is equipped with sensors that detect and avoid obstacles on all sides, which allows for safe and accurate navigation. It has a dual battery system that provides up to 55 min of flight time and a maximum speed of 23 m/s. Furthermore, the DJI Matrice 300 has a smart controller and can easily be controlled by the user on the ground. The platform can operate under harsh weather conditions due to its Ingress Protection (IP) 45 rating. The Micasense Altum sensor, on the other hand, is equipped with five unique high-resolution bands; it can record data in the Red (668 nm), Green (560 nm), Blue (475 nm), near-infrared (840 nm) and red edge (717 nm).
The UAV was flown at an altitude of 100 m above ground level, which provided a ground sampling distance of 7 cm. Its radiometric camera, which has a resolution of 160 × 120 pixels, makes it unique. The UAV image was downloaded for radiometric and atmospheric corrections and stitched using the Pix4d mapper software version 4.8.3. Upon preprocessing the data, it was imported into QGIS Pro 3.0 for co-referencing to ensure accurate alignment with the study area. Soil moisture content and chlorophyll data from each sampling location were stored as a point map.
2.3. Field Data Collection
The study area was divided into multiple sampling plots to ensure accurate data collection and for soil moisture variation purposes. Soil moisture content and chlorophyll were monitored throughout the different phenological stages. The field data were collected during four phenological stages of taro: early establishment (16 December 2022), establishment(8 January 2023), vegetative (11 April 2023), and late vegetative (2 June 2023). Points were sampled at random within the experimental field, and a Trimble handheld GPS (Trimble Inc., Westminster, CO, USA) was used to record the location of these points. Soil moisture measurements were taken using the Handheld (HH) Moisture Meter 2 (HH2) (Delta-T Devices Ltd, Burwell, Cambridge, UK) with the ThetaProbe ML3. The HH2 Moisture probe is equipped with frequency domain reflectometry (FDR) technology to measure soil moisture content accurately and rapidly [27]. The HH2 probe was inserted into the soil across the different sampling plots to ensure representative sampling. The probe transmits electromagnetic pulses into the soil, and the time it takes for the pulses to return is proportional to the amount of moisture present [27,28]. Chlorophyll content was measured using the Soil and Plant Analyzer Development (SPAD) 502 Plus chlorophyll Meter (Konica Minolta, Inc., Marunouchi, Chiyoda, Tokyo, Japan). The meter is put directly onto the leaf, and the light reflected is used to determine chlorophyll as unitless values [29,30]. The unitless values measured by the meter are then converted to chlorophyll content, as in Ying et al. [30], based on the model by Markwell et al. [31]. The readings were conducted on a single leaf of each to avoid any external light [32]. The sampled data for both soil moisture and chlorophyll content were captured in a Microsoft Excel spreadsheet against the coordinates of each sampling point and converted into point maps. The point maps were overlaid with the preprocessed drone-acquired image and its derivatives.
2.4. Spectral Variables Used for the Prediction of Soil Moisture Content and Chlorophyll Content of Taro Crops
To accurately predict soil moisture and chlorophyll content, a combination of UAV-derived spectral bands and vegetation indices (Vis) was used. Spectral signatures of soil moisture content and chlorophyll content were extracted from the reflectance values. Vis were calculated using spectral bands (Table 1). The spectral data were overlaid with the field-collected point data on soil moisture and chlorophyll content to develop the predictive models.

Table 1.
List of vegetation indices used in modelling soil moisture and chlorophyll content.
2.5. Statistical Analysis
Exploratory assessments were conducted to assess the magnitude of association between the soil moisture and chlorophyll content using the Pearson correlation analysis. Random forest (RF) algorithm was then used to predict soil moisture and chlorophyll content of crops across different phenological stages. RF was chosen and used in this study because it handles high-dimensional and continuous datasets efficiently, making it suitable for predicting soil moisture and chlorophyll content [44,45]. Additionally, RF reduces variance through bootstrap aggregation, which improves robustness and predictive accuracy [45]. While decision tree-based models can be prone to overfitting, RF mitigates this by averaging results across many trees, thus improving generalisation [46]. In this study, the main input features were spectral bands, vegetation indices (Vis) and combined datasets. The analysis was conducted in three stages. The first stage utilised the preprocessed UAV-derived bands, particularly Blue, Green, Red, Rededge, NIR and thermal bands. The second stage utilised Vis, chosen based on their performance in the literature [47]. The third stage integrated the spectral bands combined with derived Vis to estimate soil moisture and chlorophyll content.
For bagging, the ensemble created decision trees and then trained each one using exclusive data samples from field measurements (soil moisture and chlorophyll content). Sampling for each tree was conducted with replacements from the main pool. The efficiency of RF lies in optimising the regression trees (ntree) by combining a large set of decision trees, while mtry regulates the variable randomisation during splitting. In R, the doBest function was used to optimise the ntree and mtry to 200 and 5, respectively, after testing the ntree values in increments of 100 up to 2500 and mtry values from 1 to 5.
The generated models were then comparatively assessed to determine the best-performing dataset combination for estimating soil moisture and chlorophyll content. The RF models were implemented in RStudio version R i386 4.1.3. The dataset was divided into 70% training and 30% testing sets.
2.6. Accuracy Assessment
The accuracy assessment of soil moisture and chlorophyll content prediction models was assessed based on root mean square error (RMSE), relative root mean square error (rRMSE) and coefficient of determination (R2) based on the training and testing data. RSME is commonly used as a quantitative measure of the differences between observed and predicted values. R2 is commonly used to assess the goodness of fit in a model [48]. The rRMSE is commonly used to assess the performance of predictive models. Interpreting statistical metrics involves evaluating how well the model predictions match the observed data. Lower RMSE and rRMSE values indicate better model performance, and an R2 value closer to 1 indicates a strong relationship between predicted and observed values [49]. The accuracies of the models derived from different datasets and growth stages were then compared using the analysis of variance test.
3. Results
3.1. Descriptive Statistics
Table 2 shows the variation in moisture and chlorophyll content across the four phenological stages. At the early establishment stage (16 December 2022), soil moisture content had a mean of 13.64% and a standard deviation of 2.46%, while chlorophyll had a mean of 48.48 µmol/m2 and a standard deviation of 11.65 µmol/m2. The mean of soil moisture then increased to 20.40% and the standard deviation of 6.16, while chlorophyll content exhibited a mean of 45.43 and standard deviation of 14.72 µmol/m2 during the establishment stage on 8 January 2023. Then the mean of soil moisture content decreased during the vegetative stage on 11 April 2023, to 12.04% and a consistent standard deviation of 2.96 %. Meanwhile, chlorophyll had the highest variability in this stage, with a standard deviation of 17.56 µmol/m2 and a mean of 47.03 µmol/m2. The mean of soil moisture content then increased to 18.8% with a standard deviation of 5.47 %, while chlorophyll content exhibited a mean of 62.28 µmol/m2 with a standard deviation of 12.05 µmol/m2 during the late vegetative stage on the 2 June 2023.

Table 2.
Descriptive statistics of soil moisture content and chlorophyll across different phenological stages.
Correlation analysis (Pearson’s correlation) was first performed as an exploratory step to assess the magnitude of the relationship between soil moisture and chlorophyll content (Figure 2). The results showed a statistically significant correlation (p < 0.05) across all phenological stages. During the early establishment stage (week 5), the association between soil moisture content and chlorophyll was significant (r = 0.80, p < 0.05) (Figure 2a). The establishment stage (week 8) also showed a significant association between soil moisture content and chlorophyll content of taro crops (r = 0.82, p < 0.05). The vegetative stage exhibited an r of 0.81 and a p < 0.05 (Figure 2c). Similarly, a significant association between soil moisture content and soil moisture content was noted during the vegetative stage (r = 0.78, p < 0.05) (Figure 2). Additionally, soil moisture content and chlorophyll were estimated separately using RF models.
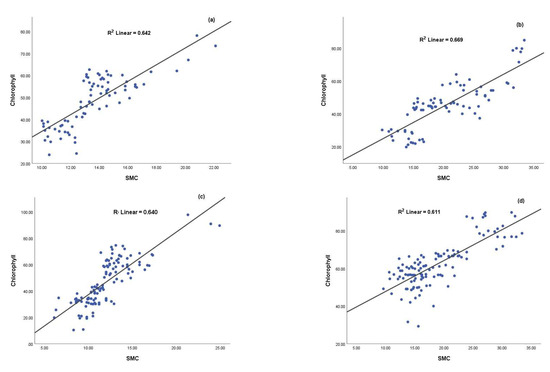
Figure 2.
Correlation between soil moisture content (SMC) and chlorophyll for (a) early establishment, (b) late establishment s, (c) early vegetative, and (d) late vegetative stage.
3.2. Comparing the Performance of the Estimation of Soil Moisture and Chlorophyll Content at Different Growth Stages
Although both soil moisture content and chlorophyll content estimations yield high R2s (> 0.05), there were significant differences in the estimation of these variables at different phenological stages (Figure 3a). Soil moisture content estimation exhibited optimal accuracies during the Early establishment stage of taro (average RMSE = 1.39% and rRMSE = 9.95%), followed by the early vegetative stage (average RMSE = 1.62% & rRMSE = 12.83%) (Figure 3b,c). The late establishment stage exhibited relatively the poorest estimation across all growth stages (average RMSE = 3.2% & rRMSE = 16%) (Figure 3b,c). Similarly, the early establishment stage exhibited the most optimal accuracy in estimating chlorophyll content (average RMSE = 8.95 µmol/m2 & rRMSE = 17.7%). However, the late establishment and early vegetative stages again exhibited the poorest chlorophyll content estimation accuracies. Specifically, the late establishment stage yielded a mean RMSE of 12.77 µmol/m2 and a rRMSE of 29.2% while the early vegetative stage had an RMSE of 13.7 µmol/m2 and a rRMSE of 29.6% (Figure 3e,f). The most optimal prediction spectral features were from the Red edge, NIR and Red regions.
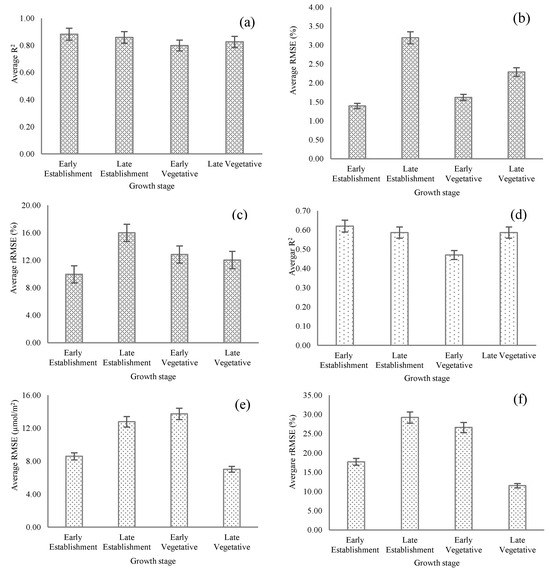
Figure 3.
Comparison of average R2s, RMSEs and rRMSEs derived in estimating soil moisture and chlorophyll content at different growth stages. Panels show (a) R2, (b) RMSE, and (c) rRMSE for soil moisture, and (d) R2, (e) RMSE, and (f) rRMSE for chlorophyll content.
3.3. Comparing the Performance of Bands, Vegetation Indices and Combined Data in Estimating Soil Moisture and Chlorophyll Content
UAV acquired spectral bands outperformed Vis in predicting the chlorophyll content of taro across the growing season (Figure 4a). For example, UAV bands exhibited an average RMSE of 2.0% and R2 of 0.66 compared to RMSE of 2.4% and R2 of 0.51 for Vis in estimating soil moisture content (Figure 4a,c). Similarly, spectral bands exhibited an average RMSE of 9.60 µmol/m2, while Vis recorded 11.10 µmol/m2 for chlorophyll estimation (Figure 4b). The combined datasets performed similarly to the spectral bands in estimating both soil moisture and chlorophyll content. As shown in Figure 4d, the average rRMSE for both predicted variables was 22%, indicating no significant differences in performance across the growing season. Interestingly, all datasets exhibited a similar average rRMSE when estimating soil moisture content.
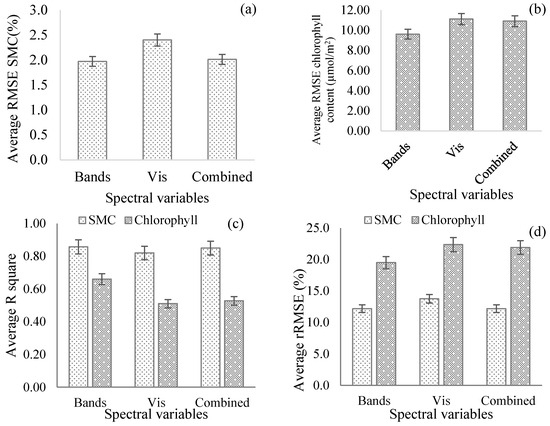
Figure 4.
Comparison of mean R2s, RMSE and rRMSE derived in SMC and Chlorophyll using different datasets. Panels show: (a) mean RMSE for SMC, (b) mean RMSE for chlorophyll content, (c) mean R2, and (d) mean rRMSE. ‘Vis’ denotes vegetation indices.
3.4. Estimating Soil Moisture and Chlorophyll Content at Different Phenological Stages
Figure 5 and Figure 6 display the accuracies obtained in estimating both soil moisture content and chlorophyll based on UAV bands, and Vis, as well as a combination of both. UAV bands provided better prediction accuracies for chlorophyll content. The first establishment stage had an R2 of 0.88, RMSE of 1.67 µmol/m2 and rRMSE of 11.94% based on Thermal, Red, Green, NIR, Red-Edge and Blue spectral variables, in order of importance. Chlorophyll content was optimally estimated based on combined data only during the second vegetative stage, to an R2 value of 0.8, RMSE of 13.69 µmol/m2 and rRMSE of 26.57 % based on SR, CCCI, NDVI, TVI, SAVI, EVI, PRI, Red, NIR, NDWI, Blue, MCARI, NDRE, Red-Edge, Thermal, Green, CVI, GNDVI, Clred-edge, and Clgreen as optimal spectral variables, in order of importance (Figure 5d). Meanwhile, the soil moisture content (SMC) was optimally estimated using combined data across all phenological stages except for the second vegetative stage. The stage which exhibited the optimal soil moisture content estimation was during the establishment stage (R2 = 0.88, RMSE = 1.25% and rRMSE = 8.91%) based on TVI, Green, Red edge, NDVI, CCCI, MCARI, Clred-edge, GNDVI, NDWI, and Blue in order of importance (Figure 4a). Meanwhile, chlorophyll content was optimally estimated during the vegetative growth stage of taro to an R2 of 043, RMSE of 8.39 µmol/m2 and rRMSE of 13.87% based on Clred-edge, Red-Edge, SR, TVI, MCARI, NIR, PRI, SAVI, Red, EVI, NDVI, NDRE, CCCI, Blue, Thermal, GNDVI, NDWI, CVI, Clgreen and Green as optimal spectral variables in order of importance (Figure 6c).
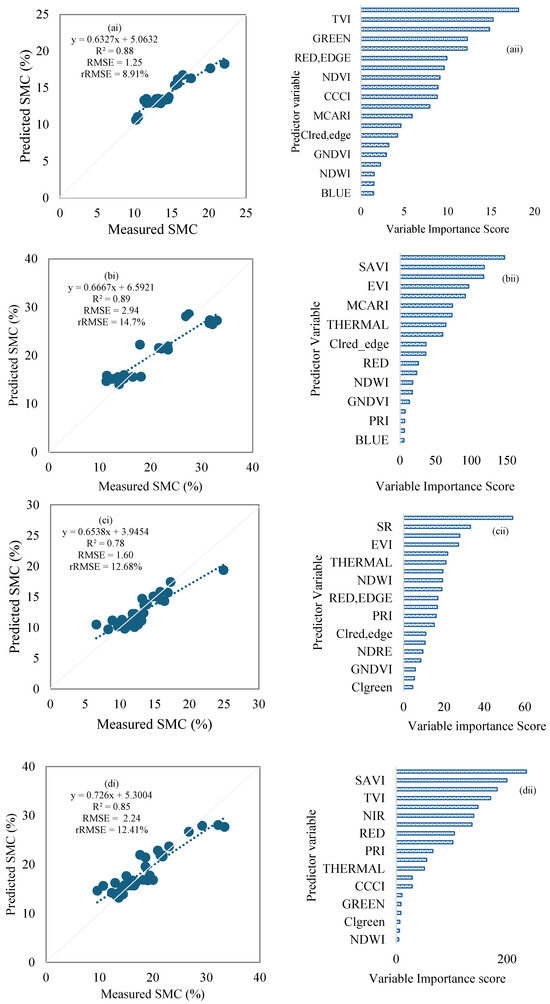
Figure 5.
Soil moisture content predictions at different growth stages: (ai) early establishment, (bi) late establishment, (ci) early vegetative, (di) late vegetative, and (ii) the corresponding variable importance scores.
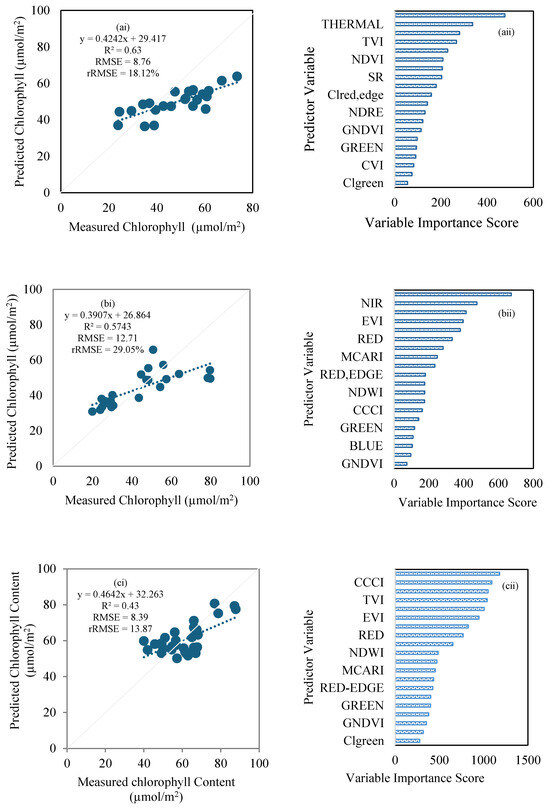
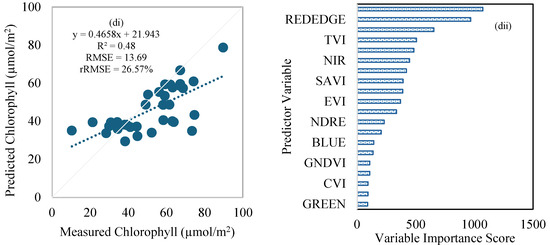
Figure 6.
Chlorophyll content predictions at different growth stages: (ai) early establishment, (bi) late establishment, (ci) early vegetative, (di) late vegetative, and (ii) their associated variable importance scores.
3.5. Spatial Variation in Soil Moisture Content and Chlorophyll Content at Different Growth Stages
Figure 7 and Figure 8 illustrate the spatial distribution of soil moisture content and chlorophyll content across four phenological stages of taro. It can be observed that SMC was higher in both establishment stages and lower in the vegetative stages. In contrast, chlorophyll was higher in the late vegetative stage and lower in the establishment stages.
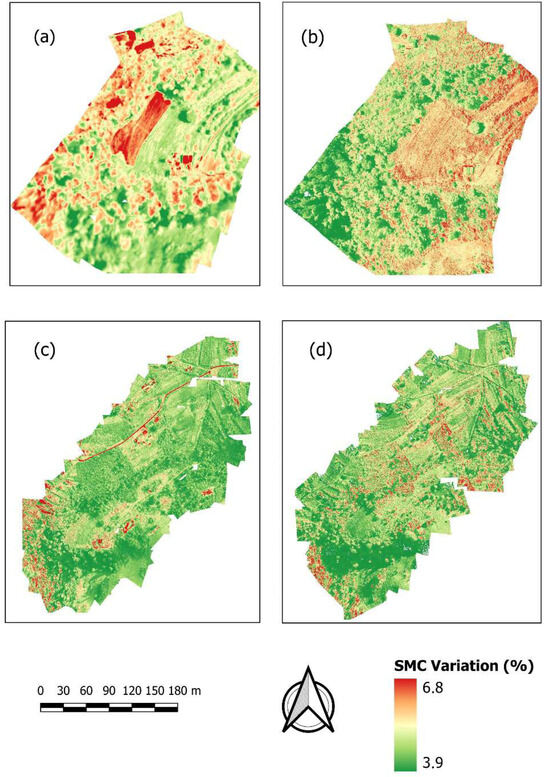
Figure 7.
Spatial variation in soil moisture content at different growth stages: (a) early establishment, (b) late establishment, (c) early vegetative, and (d) late vegetative.
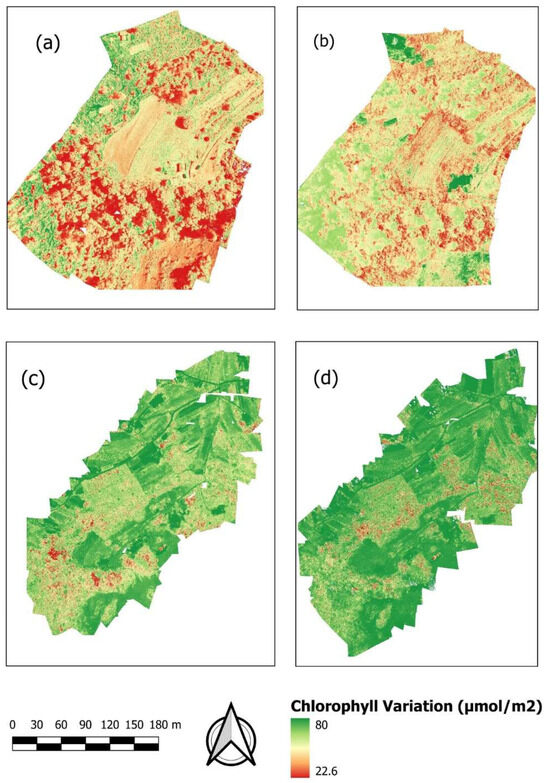
Figure 8.
Spatial variation in chlorophyll content at different growth stages: (a) early establishment, (b) late establishment, (c) early vegetative, and (d) late vegetative.
4. Discussion
The objective of this work was to test the utility of UAV-acquired data in predicting SMC and chlorophyll content across taro smallholder croplands at different phenological stages.
4.1. Association Between Soil Moisture Content and Chlorophyll
A strong, significant (p < 0.05) association between SMC and chlorophyll content of taro across the different phenological stages was observed in this study (Figure 2). This suggests that low soil moisture is associated with less chlorophyll content. Soil moisture is critical for photosynthetic processes and the health of a plant [50]. When there is limited moisture in the soil, plants fail to take up the water and nutrients required for photosynthesis. Generally, this is often associated with chlorosis and reduced photosynthesis as the leaves turn yellow [51]. This implies that chlorophyll content could be used as a surrogate measure to infer SMC. A few studies have demonstrated the linkage between SMC and chlorophyll content. For example, the study by Gholamin and Khayatnezhad [51] demonstrated the effects of SMC on chlorophyll, and the results showed a decline in maize yield in instances where there was low soil moisture. Sun et al. [52] focused on how spinach responds to different moisture contents in soil under irrigation; the results indicated high chlorophyll levels where there was adequate soil moisture. The least optimal estimation of SMC was observed in both vegetative stages with SR, SAVI, EVI, TVI, Clred-edge, NIR, NDVI, Red, Red-edge, PI, PRI, MCARI, Thermal, NDRE, CCCI, CVI, Green, GNDVI, Blue, and NDWI as optimal spectral variables in order of importance (Figure 4c,d). For chlorophyll, the least optimal estimations were observed in the early establishment, with Red-Edge, Thermal, Red, TVI, MCARI, NDVI, SAVI, SR, CCCI, Clrededge, EVI, NDRE, NIR, GNDVI, NDWI, Green, Blue, CVI, PRI, and Clgreen as optimal spectral variables in order of importance (Figure 5).
4.2. Optimal Estimation of Soil Moisture and Chlorophyll Content of Taro at Different Growth Stages
The results of this study showed that the optimal estimation of SMC was during the early establishment stage (16 December 2022) based on Thermal, TVI, SR, Green, EVI, Red-Edge, SAVI, NDVI, Red, CCCI, PRI, MCARI, Clred-edge, NDRE, NIR, GNDVI, NDWI, BLUE, CVI, and Clgreen as optimal spectral variables, in order of importance (Figure 5a). This could be explained by the fact that at the establishment stage, crops are still young and highly responsive to soil moisture content variations [2,23]. Additionally, variables such as Red-edge, Red, Thermal, NDVI and SAVI are very sensitive to moisture and may reflect high [53]. Red-edge and NIR bands can detect variations in chlorophyll levels and even changes in plant structures, which are indicators of moisture content [33]. Furthermore, the findings showed that both soil moisture and chlorophyll content can be optimally estimated during the early vegetative and the late vegetative growth stages of taro. This can be explained by the moderate fractional cover characteristic of these growth stages of taro. In the early establishment growth stage, taro leaves do not fully cover the ground, allowing spectral signals to capture soil moisture content variations more effectively. In the late vegetative stage, much of the moisture and nutrients are redirected towards the development of the tubers, resulting in reduced foliage cover and improved detection of soil moisture variability.
Regarding chlorophyll content, the early establishment growth stage of taro is associated with high soil moisture availability, which facilitates the chlorophyll production that is particularly sensitive to the red edge and NIR regions of the electromagnetic spectrum, as demonstrated in this study. Additionally, during the growth stages of reduced foliage cover, spectral saturation is minimised, further improving the accuracy of chlorophyll content estimations. However, during the late establishment and early vegetative growth stages, taro leaves completely cover the ground. This could have caused spectral saturation and poor performance of RF models during these growth stages. In contrast to the findings of this study, Ndlovu et al. [54] reported that stomatal conductance and leaf temperature were optimally estimated during the vegetative growth stages of taro compared to the other stages. Chlorophyll content was optimally estimated during the late vegetative stage of taro based on Clred-edge, Red-Edge, SR, TVI, MCARI, NIR, PRI, SAVI, Red, EVI, NDVI, NDRE, CCCI, Blue, Thermal, GNDVI, NDWI, CVI, Clgreen and Green as optimal prediction variables, in order of importance (Figure 6d). This could be attributed to the fact that taro crops are well-developed in this stage and therefore exhibit high chlorophyll levels [32]. The aforementioned variables can detect chlorophyll and differentiate chlorophyll levels based on how dense the plants are. Chlorophyll content in the vegetative stage is quite consistent, making it easy for these spectral bands and indices to detect any variations [12,14,47,55].
4.3. Comparative Performance of Bands, Vegetation Indices and Combined Data Sets in Estimating Soil Moisture and Chlorophyll Across the Phenological Stages
The findings of this study showed that when estimating soil moisture and chlorophyll content, there were no significant (p > 0.05) differences between the performance of all variables combined and bands. This could be explained by the fact that incident energy from the sun interacts directly with the soil and crop foliage before the sensor captures it as reflectance. This explains why bands are more robust when compared to vegetation indices. Despite the renowned performance of vegetation indices in mapping other fields and crop attributes, in this study, they did not optimally estimate soil moisture content and chlorophyll content. This could be explained by the fact that vegetation indices could be generating redundant information, resulting in lower accuracies due to their failure to estimate soil moisture content.
4.4. Implications of the Study
Although UAV-borne sensors currently involve costs that may be prohibitive for some smallholder farmers, advancements in technology are reducing these barriers. In the long term, the affordability and accessibility of UAV-based monitoring are expected to improve, making them increasingly feasible in smallholder contexts. UAV-borne sensors are becoming important tools for precision agriculture. They provide opportunities for smallholder farmers to improve crop health and develop water management strategies. By mapping soil moisture and chlorophyll content variations across different phenological stages, farmers can make timely and data-driven decisions to enhance crop productivity and food and nutrition security. Farmers can use the results of this study to develop and promote climate adaptation.
5. Conclusions
The objective of this study was to predict soil moisture content and chlorophyll content across different phenological stages of taro crops in smallholder croplands. Grounded on the findings of this study, it can be concluded that:
- Soil moisture content could be optimally estimated to an R2 of 0.88, RMSE of 1.25% and rRMSE = 8.9% during the early establishment stage based on Red-Edge, Thermal, Red, TVI, and MCARI, as optimal spectral variables, in order of importance.
- Chlorophyll content may be optimally estimated to an R2 of 0.43, RMSE of 8.39 µmol/m2 and rRMSE of 13.9% during the late vegetative stage based on Clred-edge, Red-Edge, SR, TVI, MCARI, and NIR as optimal spectral variables, in order of importance.
- There was a significant positive correlation between soil moisture and chlorophyll content across all growth stages of taro. This suggests that chlorophyll content may be utilised as a proxy for assessing soil moisture content.
The findings of this study imply that UAV-acquired multispectral data, when combined with RF regression, can provide an accurate estimation of soil moisture and chlorophyll content across all phenological stages of the taro crop. While significant associations between soil moisture and chlorophyll confirm their physiological linkage, the primary contribution lies in identifying spectral bands and vegetation indices that optimise predictive performance. Additionally, these findings pave the way towards the operationalisation of UAVs’ for remote sensing-based high-throughput phenotyping of crops in smallholder croplands. In the long run, this technology could be effectively used to optimise agricultural production. Increasing agricultural production will assist in achieving the objectives of the Sustainable Development Goals numbers 1 and 2, advocating for reducing hunger, food and nutrition insecurity and ending poverty, especially in the majority world, including sub-Saharan Africa.
Author Contributions
Conceptualization, R.M. and M.S.; methodology, R.M. and M.S.; software, R.M. and M.S.; formal analysis, R.M.; investigation, R.M., M.S., O.M., R.K., V.G.P.C. and T.M.; resources, M.S. and T.M.; data curation, R.M. and M.S.; writing—original draft, R.M.; writing—review and editing, M.S., O.M., V.G.P.C., R.K. and T.M.; visualization, R.M.; funding acquisition, M.S., O.M., R.K., V.G.P.C. and T.M. All authors have read and agreed to the published version of the manuscript.
Funding
South African Water Research Commission Project No C2022-2023-00930. O.M. and T.M. are supported by the Sustainable and Healthy Food Systems—Southern Africa (SHEFS-SA) Project, supported by the Wellcome Trust (Grant No 227749/Z/23/Z).
Data Availability Statement
This research project is still ongoing. Data that have been generated to date are available from the corresponding author upon reasonable request at msibanda@uwc.ac.za.
Acknowledgments
We want to acknowledge Trylee N Matongera, Shaeden Gokool, Helen S Ndlovu, Siphiwokuhle Buthelezi, Vivek Naiken and the Administrators from the Centre for Transformative Agricultural and Food Systems at the University of Kwa-Zulu Natal for their assistance with image acquisition and data collection.
Conflicts of Interest
This work forms part of research conducted by Reitumetse Masemola in fulfilment of the requirements for an Honours degree at the University of the Western Cape. The project is funded by the Water Research Commission of South Africa, and the findings will be reported to the Commission upon completion of the study.
Abbreviations
The following abbreviations are used in this manuscript:
| CCCI | Canopy Chlorophyll Content Index |
| Clgreen | Chlorophyll Green |
| Clred-edge | Chlorophyll Red-Edge |
| CVI | Chlorophyll Vegetation Index |
| EVI | Enhanced Vegetation Index |
| GNDVI | Green Normalized Vegetation Index |
| MCARI | Modified Chlorophyll Absorption in Reflectance |
| NDRE | Normalized Difference Red-Edge |
| NDVI | Normalized Difference Vegetation Index |
| NDWI | Normalized Difference Water Index |
| NIR | Near Infrared |
| PRI | Photochemical Reflectance Index |
| R2 | Coefficient of Determination |
| RF | Random Forest |
| RMSE | Root Mean Square Error |
| rRMSE | Relative Root Mean Square Error |
| SAVI | Soil Adjustes Vegetation Index |
| SMC | Soil Moisture Content |
| SR | Simple Ratio |
| TVI | Transformed Vegetation Index |
| Vis | Vegetation indices |
References
- Ngcamu, B.S.; Chari, F. Drought influences on food insecurity in Africa: A systematic literature review. Int. J. Environ. Res. Public Health 2020, 17, 5897. [Google Scholar] [CrossRef]
- Zhao, H.; Di, L.; Sun, Z.; Hao, P.; Yu, E.; Zhang, C.; Lin, L. Impacts of Soil Moisture on Crop Health: A Remote Sensing Perspective. In Proceedings of the 2021 9th International Conference on Agro-Geoinformatics (Agro-Geoinformatics), Shenzhen, China, 26–29 July 2021; pp. 1–4. [Google Scholar]
- Furtak, K.; Wolińska, A. The impact of extreme weather events as a consequence of climate change on the soil moisture and on the quality of the soil environment and agriculture—A review. Catena 2023, 231, 107378. [Google Scholar] [CrossRef]
- Kumar, N.; Sow, S.; Rana, L.; Kumar, V.; Kumar, J.; Pramanick, B.; Singh, A.; Alkeridis, L.A.; Sayed, S.; Gaber, A. Productivity, water use efficiency and soil properties of sugarcane as influenced by trash mulching and irrigation regimes under different planting systems in sandy loam soils. Front. Sustain. Food Syst. 2024, 8, 1340551. [Google Scholar] [CrossRef]
- Fahad, S.; Bajwa, A.A.; Nazir, U.; Anjum, S.A.; Farooq, A.; Zohaib, A.; Sadia, S.; Nasim, W.; Adkins, S.; Saud, S.; et al. Crop Production under Drought and Heat Stress: Plant Responses and Management Options. Front. Plant Sci. 2017, 8, 1147. [Google Scholar] [CrossRef]
- Nyoni, R.S.; Bruelle, G.; Chikowo, R.; Andrieu, N. Targeting smallholder farmers for climate information services adoption in Africa: A systematic literature review. Clim. Serv. 2024, 34, 100450. [Google Scholar] [CrossRef]
- Fu, Z.; Ciais, P.; Feldman, A.F.; Gentine, P.; Makowski, D.; Prentice, I.C.; Stoy, P.C.; Bastos, A.; Wigneron, J.-P. Critical soil moisture thresholds of plant water stress in terrestrial ecosystems. Sci. Adv. 2022, 8, eabq7827. [Google Scholar] [CrossRef]
- Vennam, R.R.; Ramamoorthy, P.; Poudel, S.; Reddy, K.R.; Henry, W.B.; Bheemanahalli, R. Developing Functional Relationships between Soil Moisture Content and Corn Early-Season Physiology, Growth, and Development. Plants 2023, 12, 2471. [Google Scholar] [CrossRef]
- Ahluwalia, O.; Singh, P.C.; Bhatia, R. A review on drought stress in plants: Implications, mitigation and the role of plant growth promoting rhizobacteria. Resour. Environ. Sustain. 2021, 5, 100032. [Google Scholar] [CrossRef]
- Muhammad, M.; Waheed, A.; Wahab, A.; Majeed, M.; Nazim, M.; Liu, Y.-H.; Li, L.; Li, W.-J. Soil salinity and drought tolerance: An evaluation of plant growth, productivity, microbial diversity, and amelioration strategies. Plant Stress 2024, 11, 100319. [Google Scholar] [CrossRef]
- Çakir, R. Effect of water stress at different development stages on vegetative and reproductive growth of corn. Field Crops Res. 2004, 89, 1–16. [Google Scholar] [CrossRef]
- Li, J.; Wijewardane, N.K.; Ge, Y.; Shi, Y. Improved chlorophyll and water content estimations at leaf level with a hybrid radiative transfer and machine learning model. Comput. Electron. Agric. 2023, 206, 107669. [Google Scholar] [CrossRef]
- Li, Y.; He, N.; Hou, J.; Xu, L.; Liu, C.; Zhang, J.; Wang, Q.; Zhang, X.; Wu, X. Factors Influencing Leaf Chlorophyll Content in Natural Forests at the Biome Scale. Front. Ecol. Evol. 2018, 6, 64. [Google Scholar] [CrossRef]
- Kancheva, R.; Borisova, D.; Georgiev, G. Chlorophyll assessment and stress detection from vegetation optical properties. Ecol. Eng. Environ. Prot. 2014, 1, 34–43. [Google Scholar]
- Parkash, V.; Singh, S. A Review on Potential Plant-Based Water Stress Indicators for Vegetable Crops. Sustainability 2020, 12, 3945. [Google Scholar] [CrossRef]
- Nduwamungu, C.; Ziadi, N.; Parent, L.-É.; Tremblay, G.F.; Thuriès, L. Opportunities for, and limitations of, near infrared reflectance spectroscopy applications in soil analysis: A review. Can. J. Soil Sci. 2009, 89, 531–541. [Google Scholar] [CrossRef]
- Rasheed, M.W.; Tang, J.; Sarwar, A.; Shah, S.; Saddique, N.; Khan, M.U.; Imran Khan, M.; Nawaz, S.; Shamshiri, R.R.; Aziz, M. Soil moisture measuring techniques and factors affecting the moisture dynamics: A comprehensive review. Sustainability 2022, 14, 11538. [Google Scholar] [CrossRef]
- Ma, C.; Li, X.; McCabe, M.F. Retrieval of High-Resolution Soil Moisture through Combination of Sentinel-1 and Sentinel-2 Data. Remote Sens. 2020, 12, 2303. [Google Scholar] [CrossRef]
- Bukowiecki, J.; Rose, T.; Kage, H. Sentinel-2 data for precision agriculture?—A UAV-based assessment. Sensors 2021, 21, 2861. [Google Scholar] [CrossRef] [PubMed]
- Feng, Z.; Cheng, Z.; Ren, L.; Liu, B.; Zhang, C.; Zhao, D.; Sun, H.; Feng, H.; Long, H.; Xu, B. Real-time monitoring of maize phenology with the VI-RGS composite index using time-series UAV remote sensing images and meteorological data. Comput. Electron. Agric. 2024, 224, 109212. [Google Scholar] [CrossRef]
- Brewer, K.; Clulow, A.; Sibanda, M.; Gokool, S.; Naiken, V.; Mabhaudhi, T. Predicting the Chlorophyll Content of Maize over Phenotyping as a Proxy for Crop Health in Smallholder Farming Systems. Remote Sens. 2022, 14, 518. [Google Scholar] [CrossRef]
- Zhang, H.; Wang, L.; Tian, T.; Yin, J. A review of unmanned aerial vehicle low-altitude remote sensing (UAV-LARS) use in agricultural monitoring in China. Remote Sens. 2021, 13, 1221. [Google Scholar] [CrossRef]
- Ge, X.; Ding, J.; Jin, X.; Wang, J.; Chen, X.; Li, X.; Liu, J.; Xie, B. Estimating Agricultural Soil Moisture Content through UAV-Based Hyperspectral Images in the Arid Region. Remote Sens. 2021, 13, 1562. [Google Scholar] [CrossRef]
- Ofori, S.A.; Cobbina, S.J.; Obiri, S. Climate change, land, water, and food security: Perspectives From Sub-Saharan Africa. Front. Sustain. Food Syst. 2021, 5, 680924. [Google Scholar] [CrossRef]
- Reddy, K.T.C. Estimation of Water use Efficiency of Soybean (Glycine max) for Biodiesel Production in KwaZulu-Natal. Ph.D. Thesis, University of KwaZulu-Natal, Pietermaritzburg, South Africa, 2020. [Google Scholar]
- Ndlovu, P.N.; Thamaga-Chitja, J.M.; Ojo, T.O. Factors influencing the level of vegetable value chain participation and implications on smallholder farmers in Swayimane KwaZulu-Natal. Land Use Policy 2021, 109, 105611. [Google Scholar] [CrossRef]
- Lärm, L.; Bauer, F.M.; Hermes, N.; van der Kruk, J.; Vereecken, H.; Vanderborght, J.; Nguyen, T.H.; Lopez, G.; Seidel, S.J.; Ewert, F.; et al. Multi-year belowground data of minirhizotron facilities in Selhausen. Sci. Data 2023, 10, 672. [Google Scholar] [CrossRef] [PubMed]
- Allende-Prieto, C.; Roces-García, J.; Recondo, C.; Sañudo-Fontaneda, L.A.; González-Moradas, M.R. An exploratory methodology based on high resolution remote sensing techniques for soil moisture determination with prospective applications in vegetative SuDS. Urban Water J. 2023, 20, 1006–1020. [Google Scholar] [CrossRef]
- Shibaeva, T.G.; Mamaev, A.V.; Sherudilo, E.G. Evaluation of a SPAD-502 Plus Chlorophyll Meter to Estimate Chlorophyll Content in Leaves with Interveinal Chlorosis. Russ. J. Plant Physiol. 2020, 67, 690–696. [Google Scholar] [CrossRef]
- Yin, Q.; Zhang, Y.; Li, W.; Wang, J.; Wang, W.; Ahmad, I.; Zhou, G.; Huo, Z. Estimation of Winter Wheat SPAD Values Based on UAV Multispectral Remote Sensing. Remote Sens. 2023, 15, 3595. [Google Scholar] [CrossRef]
- Markwell, J.; Osterman, J.C.; Mitchell, J.L. Calibration of the Minolta SPAD-502 leaf chlorophyll meter. Photosynth. Res. 1995, 46, 467–472. [Google Scholar] [CrossRef] [PubMed]
- Melash, A.A.; Bytyqi, B.; Nyandi, M.S.; Vad, A.M.; Ábrahám, É.B. Chlorophyll Meter: A Precision Agricultural Decision-Making Tool for Nutrient Supply in Durum Wheat (Triticum turgidum L.) Cultivation under Drought Conditions. Life 2023, 13, 824. [Google Scholar] [CrossRef]
- Giovos, R.; Tassopoulos, D.; Kalivas, D.; Lougkos, N.; Priovolou, A. Remote Sensing Vegetation Indices in Viticulture: A Critical Review. Agriculture 2021, 11, 457. [Google Scholar] [CrossRef]
- Ji, Z.; Pan, Y.; Zhu, X.; Wang, J.; Li, Q. Prediction of crop yield using phenological information extracted from remote sensing vegetation index. Sensors 2021, 21, 1406. [Google Scholar] [CrossRef]
- Zhen, Z.; Chen, S.; Yin, T.; Chavanon, E.; Lauret, N.; Guilleux, J.; Henke, M.; Qin, W.; Cao, L.; Li, J. Using the negative soil adjustment factor of soil adjusted vegetation index (SAVI) to resist saturation effects and estimate leaf area index (LAI) in dense vegetation areas. Sensors 2021, 21, 2115. [Google Scholar] [CrossRef]
- Pizarro Carcausto, S.E.; Pricope, N.G.; Figueroa Venegas, D.A.; Carbajal Llosa, C.M.; Quispe Huincho, M.R.; Vera Vilchez, J.E.; Alejandro Méndez, L.R.; Achallma Mendoza, L.; González Tovar, I.E.; Salazar Coronel, W. Implementing cloud computing for the digital mapping of agricultural soil properties from high resolution UAV multispectral imagery. Remote Sens. 2023, 15, 3203. [Google Scholar] [CrossRef]
- Patil, P.P.; Jagtap, M.P.; Khatri, N.; Madan, H.; Vadduri, A.A.; Patodia, T. Exploration and advancement of NDDI leveraging NDVI and NDWI in Indian semi-arid regions: A remote sensing-based study. Case Stud. Chem. Environ. Eng. 2024, 9, 100573. [Google Scholar] [CrossRef]
- Voitik, A.; Kravchenko, V.; Pushka, O.; Kutkovetska, T.; Shchur, T.; Kocira, S. Comparison of NDVI, NDRE, MSAVI and NDSI indices for early diagnosis of crop problems. Agric. Eng. 2023, 27, 47–57. [Google Scholar] [CrossRef]
- Kurbanov, R.K.; Zakharova, N.I. Application of vegetation indexes to assess the condition of crops. Agric. Mach. Technol. 2020, 14, 4–11. [Google Scholar] [CrossRef]
- Gao, S.; Yan, K.; Liu, J.; Pu, J.; Zou, D.; Qi, J.; Mu, X.; Yan, G. Assessment of remote-sensed vegetation indices for estimating forest chlorophyll concentration. Ecol. Indic. 2024, 162, 112001. [Google Scholar] [CrossRef]
- Zeng, Y.; Hao, D.; Huete, A.; Dechant, B.; Berry, J.; Chen, J.M.; Joiner, J.; Frankenberg, C.; Bond-Lamberty, B.; Ryu, Y. Optical vegetation indices for monitoring terrestrial ecosystems globally. Nat. Rev. Earth Environ. 2022, 3, 477–493. [Google Scholar] [CrossRef]
- Marques, P.; Pádua, L.; Sousa, J.J.; Fernandes-Silva, A. Assessing the Water Status and Leaf Pigment Content of Olive Trees: Evaluating the Potential and Feasibility of Unmanned Aerial Vehicle Multispectral and Thermal Data for Estimation Purposes. Remote Sens. 2023, 15, 4777. [Google Scholar] [CrossRef]
- Aslan, M.F.; Sabanci, K.; Aslan, B. Artificial Intelligence Techniques in Crop Yield Estimation Based on Sentinel-2 Data: A Comprehensive Survey. Sustainability 2024, 16, 8277. [Google Scholar] [CrossRef]
- Belgiu, M.; Drăguţ, L. Random forest in remote sensing: A review of applications and future directions. ISPRS J. Photogramm. Remote Sens. 2016, 114, 24–31. [Google Scholar] [CrossRef]
- Sheykhmousa, M.; Mahdianpari, M.; Ghanbari, H.; Mohammadimanesh, F.; Ghamisi, P.; Homayouni, S. Support Vector Machine Versus Random Forest for Remote Sensing Image Classification: A Meta-Analysis and Systematic Review. IEEE J. Sel. Top. Appl. Earth Obs. Remote Sens. 2020, 13, 6308–6325. [Google Scholar] [CrossRef]
- Manafifard, M. A new hyperparameter to random forest: Application of remote sensing in yield prediction. Earth Sci. Inform. 2024, 17, 63–73. [Google Scholar] [CrossRef]
- Abrahams, M.; Sibanda, M.; Dube, T.; Chimonyo, V.G.; Mabhaudhi, T. A systematic review of UAV applications for mapping neglected and underutilised crop species’ spatial distribution and health. Remote Sens. 2023, 15, 4672. [Google Scholar] [CrossRef]
- Wu, Q.; Zhang, Y.; Zhao, Z.; Xie, M.; Hou, D. Estimation of Relative Chlorophyll Content in Spring Wheat Based on Multi-Temporal UAV Remote Sensing. Agronomy 2023, 13, 211. [Google Scholar] [CrossRef]
- Chicco, D.; Warrens, M.J.; Jurman, G. The coefficient of determination R-squared is more informative than SMAPE, MAE, MAPE, MSE and RMSE in regression analysis evaluation. PeerJ Comput. Sci. 2021, 7, e623. [Google Scholar] [CrossRef]
- Gavrilescu, M. Water, soil, and plants interactions in a threatened environment. Water 2021, 13, 2746. [Google Scholar] [CrossRef]
- Gholamin, R.; Khayatnezhad, M. Assessment of the correlation between chlorophyll content and drought resistance in corn cultivars (Zea mays). Helix Sci. Explor. Peer Rev. Bimon. Int. J. 2020, 10, 93–97. [Google Scholar] [CrossRef]
- Sun, Y.; Wang, J.; Wang, Q.; Wang, C. Responses of the Growth Characteristics of Spinach to Different Moisture Contents in Soil under Irrigation with Magnetoelectric Water. Agronomy 2023, 13, 657. [Google Scholar] [CrossRef]
- Liu, Y.; Qian, J.; Yue, H. Comprehensive evaluation of Sentinel-2 red edge and shortwave-infrared bands to estimate soil moisture. IEEE J. Sel. Top. Appl. Earth Obs. Remote Sens. 2021, 14, 7448–7465. [Google Scholar] [CrossRef]
- Ndlovu, H.S.; Odindi, J.; Sibanda, M.; Mutanga, O. Multi-Temporal Analysis of Taro Crop Water Stress Using High-Resolution Thermal and Multispectral Proximal Sensing for Improved Resilience of Smallholder Farming Systems. Smart Agric. Technol. 2025, 12, 101337. [Google Scholar] [CrossRef]
- Lao, Z.; Fu, B.; Wei, Y.; Deng, T.; He, W.; Yang, Y.; He, H.; Gao, E. Retrieval of chlorophyll content for vegetation communities under different inundation frequencies using UAV images and field measurements. Ecol. Indic. 2024, 158, 111329. [Google Scholar] [CrossRef]
Disclaimer/Publisher’s Note: The statements, opinions and data contained in all publications are solely those of the individual author(s) and contributor(s) and not of MDPI and/or the editor(s). MDPI and/or the editor(s) disclaim responsibility for any injury to people or property resulting from any ideas, methods, instructions or products referred to in the content. |
© 2025 by the authors. Licensee MDPI, Basel, Switzerland. This article is an open access article distributed under the terms and conditions of the Creative Commons Attribution (CC BY) license (https://creativecommons.org/licenses/by/4.0/).