Article

Photoelectrocatalysis as an Effective Treatment for Removing Perfluoroalkyl Substances from Contaminated Groundwaters: The Real Case of the Veneto Region (Italy)

by
Alessandro Pietro Tucci
1,
Sapia Murgolo
2,
Cristina De Ceglie
2,
Giuseppe Mascolo
2,
Massimo Carmagnani
3,
Andrea Lucchini Huspek
1,
Massimiliano Bestetti
1,4 and
Silvia Franz
1,*
1
Department of Chemistry, Materials and Chemical Engineering “Giulio Natta”, Politecnico of Milano, 20133 Milano, Italy
2
Consiglio Nazionale delle Ricerche—Istituto di Ricerca Sulle Acque, 70132 Bari, Italy
3
Acque Veronesi S.c.a.r.l., Lungadige Galtarossa 8, 37133 Verona, Italy
4
The Weinberg Research Center, Tomsk Polytechnic University, 30 Lenin Ave, 634050 Tomsk, Russia
*
Author to whom correspondence should be addressed.
Water 2025, 17(18), 2790; https://doi.org/10.3390/w17182790
Submission received: 23 June 2025 / Revised: 28 August 2025 / Accepted: 12 September 2025 / Published: 22 September 2025

Abstract

Per-polyfluoroalkyl substances (PFASs) are a class of persistent organic pollutants that have been detected in several environmental matrices. Photoelectrocatalysis (PEC) was employed to remove PFASs contained in natural groundwater collected in the Veneto region (Italy), where a massive PFAS contamination was present. Nine PFASs were detected and monitored throughout the process. By varying the magnitude of the applied cell voltage (no bias and 4, 6, and 8 V) the optimal condition was assessed to be 4 V, resulting in a total PFAS removal of about 87%. The presence of H2O2 was ineffective on the reaction kinetic, while NaCl inhibited the oxidation of PFASs. The EEO (Electrical Energy per Order of Magnitude) analysis revealed that PEC is more energy-efficient than both traditional photolysis and most advanced oxidation techniques discussed in published research.

Graphical Abstract

1. Introduction

Per- and polyfluoroalkyl substances (PFASs) are a wide group of environmentally persistent organic compounds of anthropogenic origin (>14,000), characterized by the presence of at least one carbon atom covalently bonded to one or more fluorine atoms [1]. PFASs are generally composed of a fluorinated alkyl chain and a polar head functional group (e.g., a carboxylate, a sulfonate, a phosphate), which makes PFASs amphiphilic substances. Moreover, the presence of the C-F bond (binding energy of about 500 kJ/mol [2]) provides PFASs great chemical and thermal stability [3]. Due to their unique physicochemical properties, PFASs have been employed since the 1940s in various industrial and household products such as non-stick coating in pans, cosmetics, textiles, and fire extinguishing foam [4]. However, the same physico-chemical properties that have made PFASs highly desirable at an industrial level also represent a critical issue for the environment. In fact, the majority of PFASs are not biodegradable under environmental conditions, tend to bio-accumulate in humans, animals, and plants, and show high mobility in the environment, making them almost ubiquitous. Additionally, an increasing number of epidemiological and toxicity studies assessed that PFAS exposure may cause several acute and chronic diseases such as obesity, immune suppression, liver and testicular cancer, and kidney damage [5].
One of the most severe and widespread PFAS contamination events globally has been identified in the Veneto region of Northern Italy, where the primary aquifer has been impacted over an area greater than 200 km2, affecting approximately 300,000 residents across 30 municipalities [6]. The residents of the area, after a decade-long exposure to drinking water contaminated by PFASs, show blood serum concentrations of perfluorooctanoic acid (PFOA) 70 times greater than the average values (a few nanograms per milliliter) measured in the populations of other European countries, Australia, and the US [7,8].
Conventional water treatment strategies (i.e., biological, chemical, and physico-chemical processes) have been employed to remediate PFASs, ultimately being quite ineffective due to the recalcitrant nature of PFASs, the high energy input required, or the production of harmful by-products [9]. Currently, the most widely adopted full-scale technology for PFAS removal is filtration through granular activated carbon (GAC) [10]. Nonetheless, its practical implementation shows several drawbacks, such as rapid saturation, poor retention of short-chain PFASs, the need for elevated temperatures during regeneration, and substantial operational costs. These limitations have driven interest towards alternative treatment methods [11]. Additionally, the environmental impact of carbon filters regeneration is still questionable [12]. Against this background, Advanced Oxidation Processes (AOPs) have been explored for the defluorination and degradation of highly stable PFAS compounds. AOPs are non-selective processes that rely on the production of strong oxidant species, primarily hydroxyl radicals •OH and related reactive oxygen species (ROS), to oxidize PFASs, potentially leading to complete mineralization to CO2, H2O, and inorganic salts. Various methods have been explored for PFAS degradation, including photocatalysis, ultrasonic treatment, electrooxidation, ozonation, thermal degradation, and plasma technologies [13,14,15].
Recently, photoelectrocatalysis (PEC) has emerged as an effective water treatment method [16,17,18]. PEC combines the mechanisms of heterogeneous photocatalysis and electrochemical reactions in a synergistic manner, relying on a porous photocatalyst grown onto an electrically conductive surface. This configuration helps to minimize the recombination of photogenerated holes and electrons by applying an electrical bias during the operation, which effectively separates the charge carriers. Moreover, no post-process catalyst recovering is needed, excluding any loss of the catalytic particles in the environment. To the best of the authors’ knowledge, the application of PEC for PFAS removal has scarcely been examined, and existing research has primarily focused on treating synthetic PFOA solutions at relatively high concentrations (mg/L scale) [19,20,21,22,23,24]. This experimental set-up does not represent real environmental conditions, usually characterized by a mixture of PFASs in the ng/L to μg/L range. Recently, our research group conducted a study on the photoelectrocatalytic degradation of a mixture of PFASs present in groundwater in the ng/L range. PEC was effective in the degradation of both long- and short-chain PFASs, with an overall PFAS removal of 72% obtained within 10 h. The degradation of long-chain PFASs proceeded at a higher rate than that of short-chain compounds, probably due to the PEC mechanism involving initial decarboxylation followed by gradual cleavage of CF2 groups, producing transient shorter-chain byproducts. PEC showed enhanced performance compared to photolysis in terms of treatment efficiency [25]. However, several issues still need to be explored. For example, the correlation between the magnitude of the applied electrical bias and the efficiency of PEC in PFAS degradation remains unclear, since different trends have been reported in the literature. For example, according to Zhou et al., the application of electrical bias up to 5 V leads to general improvement in the PFOA reaction kinetic by a factor of 4, with the kinetic constant passing from 0.5 × 10⁻³ (1 V) to 2 × 10⁻³ min−1 (5 V) [20]. A different trend was instead observed in the work of Li et al., where operating voltages above 2 V inhibited PFOA degradation [19]. Another issue regards the effect of chemicals such as H2O2 or NaCl. In photolysis and photocatalysis, H2O2 or NaCl act as photochemical mediators able to induce indirect reaction pathways; PFASs (or their by-products) do not react directly with the photons nor on the catalyst surface but rather with reactive oxygen and chlorine radicals [26]. Under UV irradiation and/or by interaction with a photocatalyst, H2O2 undergoes oxidation reactions leading to hydroxyl (OH) and hydroperoxyl radicals (OOH) [27]. Similarly, in PEC processes, the presence of H2O2 can accelerate the degradation of contaminants. Indeed, the literature reports how hydrogen peroxide-assisted PEC showed promoted decolorization and increased biodegradability of real pharmaceutical wastewater with respect to conventional PEC [18]. In another study, the presence of H2O2 resulted in a 75% degradation of mitoxantrone, while only 15% was achieved in its absence [28]. NaCl is known to be a source of free chlorine and reactive chlorine species (RCSs), namely Cl, Cl2−•, and OCl under photo(cata)lytic activation [29]. Although RCSs have lower redox potential than OH radicals (i.e., 2.80 V, 2.47 V, 2.0 V, and 1.5 V vs. SHE, for OH, Cl, Cl2•− and ClO•−, respectively), they have a higher lifetime, greater reactivity towards electron-rich compounds, and a higher selectivity than OH [30]. According to Zainal et al., the photoelectrochemical degradation of methyl orange in the presence of NaCl increased up to 58% with respect to the standard solution [31]. Yang et al. reported a possible additional reaction pathway involving chlorides during the photoelectrochemical degradation of PFOA [32]. However, to the authors’ knowledge, the literature is lacking as concerns the effect of H2O2 and NaCl in the photoelectrocatalytic oxidation of PFASs.
The present study investigates the application of PEC treatment on PFAS-contaminated groundwater collected from the Veneto Region, Italy, following the same methodology as our previous research, while further focusing on specific operation parameters. In particular, this study examined the effects of different cell voltages (no bias and 4, 6, and 8 V) as well as the influence of additives such as hydrogen peroxide (H2O2) and sodium chloride (NaCl). Nine different PFAS species were monitored, namely perfluorooctanoic acid (PFOA), perfluoroheptanoic acid (PFHpA), perfluorohexanoic acid (PFHxA), perfluoropentanoic acid (PFPeA), perfluorobutanoic acid (PFBA), perfluorooctanesulfonic acid (PFOS), perfluoroheptanesulfonic acid (PFHpS), perfluorohexanesulfonic acid (PFHxS), and perfluorobutanesulfonic acid (PFBS), with initial concentrations in the ng/L range. The degradation of PFOA was additionally performed in a controlled matrix to elucidate the reaction mechanisms and better understand the behavior of the PFAS mixture identified in the groundwater samples. Photolysis (PL) and H2O2-assisted photolysis (PL + H2O2) tests were carried out for comparison purposes. Finally, energy consumption was calculated, and the investigated technologies were comparatively evaluated considering available literature data.

2. Materials and Methods

2.1. Experimental Set-Up

The TiO2 photoanode was synthesized by Plasma Electrolytic Oxidation, according to Franz et al. [33]. The TiO2 mesh was placed in a laboratory-scale tubular reactor described elsewhere [17]. This system was employed to perform four different tests, namely, photoelectrocatalysis (PEC), H2O2-assisted photoelectrocatalysis (PEC + H2O2), NaCl-assisted photoelectrocatalysis (PEC + NaCl), and photocatalysis (PC). During PEC tests, an electrical bias (4-6-8 V) was applied to the electrochemical reactor by means of a power supply (EA-PSI 8360-15 T, EA Elektro-Automatik GmbH & Co., Viersen, Germany), with the TiO2 mesh working as (photo)anode and the reactor body as cathode. The concentration of H2O2 and NaCl was 100 ppm. After removing the TiO2 mesh, the same reactor was employed to perform photolysis (PL) and H2O2-assisted photolysis (PL + H2O2) tests. Degradation tests lasted up to 600 min (contact time) and were repeated twice. This long contact time was chosen according to previous research [25]. Water samples were periodically collected and stored at +2/+4 °C before chemical analysis.

2.2. Test Monitoring and Analytical Methods

Groundwater samples were collected from a contaminated well in the Veneto region, Italy, managed by Acque Veronesi S.r.l. Sampling occurred twice during the study period, in September 2021 and March 2022. Due to slight variations in PFAS concentrations between the two sampling events, the samples were treated as distinct and designated as well 1* and well 1, respectively. The main physico-chemical properties of the water are reported in Table S1. A total of 9 PFASs (Table S2) were analyzed, namely perfluorobutanoic acid (PFBA), perfluoropentanoic acid (PFPeA), perfluorohexanoic acid (PFHxA), perfluoroheptanoic acid (PFHpA), perfluorooctanoic acid (PFOA), perfluorobutanesulfonic acid (PFBS), perfluorohexanesulfonic acid (PFHxS), perfluoroheptanesulfonic acid (PFHpS), and perfluorooctanesulfonic acid (PFOS). The individual concentration values were in the range 7–1175 ng/L, and the overall PFAS concentration was 2428 ng/L (well 1) and 2593 ng/L (well 1*). PFAS concentrations were quantified using high-performance liquid chromatography coupled with high-resolution tandem mass spectrometry (HPLC-MS/MS). Specifically, an Ultimate 3000 chromatographic system (Thermo Fisher Scientific, Waltham, MA, USA) was interfaced with a TripleTOF 5600+ mass spectrometer (AB Sciex, Framingham, MA, USA). All analyses were conducted in negative electrospray ionization (ESI) mode. The detection limit was 1 ng/L.
Prior to degradation tests, groundwater was filtered using a polypropylene membrane filter (PALL, Life Science, GH Polypro, Ø 47 mm, porosity 0.45 mm, PALL Corporation, Port Washington, NY, USA). Degradation tests were also carried out on a model solution of 1 mM PFOA and 2.5 mM K2SO4 as supporting electrolyte. The PFOA concentration was selected to closely reflect real environmental levels while remaining sufficiently high to enable the detection of oxidation by-products.

2.3. Data Processing

The contact time, defined as the instantaneous residence time within the reactor, was determined using the following equation (Equation (1)):
C o n t a c t   t i m e   =   t p r o c · V r e a c t o r V i n s t
where tproc is the instantaneous processing time, Vreactor is the total volume of the reactor (1 L), and Vinst is the instantaneous volume of water recirculating in the PEC system (reactor chamber plus hydraulic circuit).
Given the low initial concentration, the PFAS concentration profiles as a function of contact time were modeled using the Langmuir–Hinshelwood (L.H.) kinetic framework simplified to a pseudo-first-order approximation. The following equation was applied (Equation (2)):
ln C t C 0 = k · t
where C0 and Ct are the concentration a t = 0 and after a contact time t, respectively, and k’ is the pseudo first-order kinetic constant. Using the concentration profiles obtained from each experiment, the kinetic rate constants for each PFAS compound were determined.
Energy consumption was assessed using the Electrical Energy per Order of Magnitude (EEO), defined as the amount of electrical energy (kWh·m−3·order−1) needed to reduce the concentration of a target contaminant by one order of magnitude (i.e., 90%) in a unit volume of contaminated water. This parameter was calculated for each contaminant and experimental test using the following equation (Equation (3)):
E E O = P · t · 10 3 V · l o g 10 C i C 90 · 100
where P [kW] is the nominal power consumption of the system, namely of the UV lamp, the recirculating pump and the bias supplier, V [dm3] is the volume of contaminated water, t [min] is the contact time needed to achieve 90% abatement of the contaminant, Ci is the initial concentration, and C90 is the concentration value corresponding to 90% abatement.

3. Results and Discussion

3.1. Degradation of PFOA

The reaction pathway of PFAS degradation by PEC is scarcely addressed in the literature [23,24], and no evidence of the proposed mechanisms is given using undoped TiO2 photoanodes. This section addresses the issue by examining the photoelectrocatalytic and photolytic degradation of a model PFOA solution (1 mg/L) containing 2.5 mM K2SO4 as the supporting electrolyte.
Figure 1a,b display the concentration profile of PFOA and TPs, respectively, as a function of the contact time during PL and PEC tests.
PEC effectively oxidized PFOA, and a removal of 98% was achieved at the end of the test. The rate constant was 0.00633 (R2 = 0.9935) min−1. As shown in Figure 1b, transformation products (TPs), consisting of short-chain PFASs, namely PFHpA, PFHxA, PFPeA, and PFBA, appeared over time. The TPs followed this appearance order: PFHpA > PFHxA > PFPeA > PFBA. The formation of these TPs is consistent with the following reaction, which was proposed for the photoelectrocatalytic degradation of PFOA and, more in general, of perfluoroalkyl acids (Equation (4)):
CnF2n+1COOH + TiO2 (h+, e) + 2OH→ Cn−1F2n−1COOH + TiO2 (h+, e) + CO2 + 2HF
According to the literature [23,24,25,32], this happens though the chain reaction pathway described by Equations (5)–(11) and consists of decarboxylation followed by a stepwise loss of CF2 units, forming shorter-chain intermediates.
CnF2n+1COOH → CnF2n+1COO + H+
CnF2n+1COO + h+ → CnF2n+1COO
CnF2n+1COO→ CnF2n+1 + CO2
CnF2n+1 + OH→ CnF2n+1OH
CnF2n+1OH → Cn−1F2n−1COF + H+ + F
Cn−1F2n−1COF + OH → Cn−1F2n−1C(OH)(F)O
Cn−1F2n−1C(OH)(F)O → Cn−1F2n−1COO + H+ + F
Thus, the reactions explaining the formation of the TPs are
C 7 F 15 COOH   +   2 OH   k 1   C 6 F 13 COOH   +   CO 2   +   2 HF
C 6 F 13 COOH   +   2 OH   k 2   C 5 F 11 COOH   +   CO 2   +   2 HF
C 5 F 11 COOH   +   2 OH   k 3   C 4 F 9 COOH   +   CO 2   +   2 HF
C 4 F 9 COOH   +   2 OH   k 4   C 3 F 7 COOH   +   CO 2   +   2 HF
C 3 F 7 COOH   +   2 OH   k 5   C 2 F 5 COOH   +   CO 2   +   2 HF
From a mass balance standpoint, it was observed that the reduction in PFOA concentration (from approximately 800 ng/L to 400 ng/L within 150 min) was accompanied by a relatively negligible formation of transformation products. This implies that the main degradation pathways of PFOA may not be adequately captured by the detected TPs. Recently, a similar conclusion was reported by Yang et al. who suggested additional degradation routes. Specifically, the authors studied the photoelectrocatalytic (PEC) degradation of PFOA using graphene oxide/TiO2 electrodes and suggested four possible degradation mechanisms based on decarboxylation followed by oxidation, defluorination, hydroxylation, and chlorine atom substitution [32], where the dominant pathway depends on operational parameters such as anode material, applied potential, or the presence of competing oxidants. In principle, total organic fluorine (TOF) analysis could provide a more comprehensive understanding of the fate of fluorinated intermediates. However, in the present case, such an approach is not viable, as the concentration values involved are below the detection limit of the currently available analytical methods.
To further investigate the degradation pathways of PFOA, the oxidation reactions described in Equations (12)–(16) were modeled according to a first-order direct model, based on the assumption of a batch reactor operating at constant volume. Although the actual reactor works in semi-batch mode, in the given conditions it can be reasonably approximated to a closed mixing system. In the model, A, B, C D, and E are PFOA, PFHpA, PFHxA, PFPeA, and PFBA, respectively. At t = 0, A(0) = A0 = 1 mg/L; B(0) = B0 = 0; C(0) = C0 = 0; D(0) = D0 = 0; and E(0) = E0 = 0. The kinetic equations are
d A d t = k 1 A
d B d t = k 2 B k 1 A
d C d t = k 3 C k 2 B
d D d t = k 4 D k 3 C
d E d t = k 5 E k 4 D
By integration, the following solutions are found:
A t = A 0 e k 1 t
B t = q e k 1 t + w e k 2 t
C t = α e k 3 t + β e k 2 t + γ e k 1 t
D t = ρ e k 4 t + σ e k 3 t + τ e k 2 t + φ e k 1 t
E t = a 1 e k 5 t + a 2 e k 4 t + a 3 e k 3 t + a 4 e k 2 t + a 5 e k 1 t
where the constant terms q, w, α, β, γ, r, σ, τ, φ, a1, a2, a3, a4, a5 are presented in the Supporting Information (Table S3). The corresponding curves are represented in Figure 1c,d. Based on the satisfactory fit of Equation (22) to the experimental PFOA degradation data during PEC tests, the corresponding concentration profiles of the transformation products (TPs) were simulated. As illustrated in Figure 1c,d, the modeled TP curves qualitatively reflect the general trends observed during PEC tests. Nonetheless, the model predicts an earlier onset and peak of TP formation, occurring shortly after the beginning of the experiment and reaching a maximum at around 100 min, whereas the experimental data show a delayed appearance, with peak concentrations occurring around 450 min. This discrepancy further supports the hypothesis that the primary degradation pathways may not be adequately captured by the targeted analytical approach usually employed, highlighting the need for a more comprehensive investigation into PFAS degradation mechanisms.
Figure 1a,b also show the outcome of PL tests. PFOA degradation was achieved also in case of photolysis (Figure 1a), and shorter-chain PFASs were observed to gradually form over time (Figure 1b), whose concentration profiles are simulated in Figure 1e,f (dotted lines). The transformation products were formed following this order: PFHpA > PFHxA > PFPeA > PFBA. These trends are in agreement with the literature, where it is reported that the photodegradation of PFOA under UV light can be successfully obtained [34,35]. Nevertheless, PL was markedly inferior to PEC in performance. The PFOA removal efficiency declined from 98% to 79%, and the reaction rate constant for PL (0.00279 min−1) was 56% lower than PEC (0.00633). Moreover, the concentration of short-chain PFASs in the PL system exhibited a slower degradation rate compared to PEC. The better efficiency of PEC with respect to PL may be explained considering that (i) in PEC, the most oxidizing species are the photogenerated holes, whose potential is higher than the oxidizing power of the commercial UV lamp employed in the present study, and (ii) PFCAs are dissociated at a neutral pH; thus, under electrical polarization, PFCAs migrate to the photoanode, favoring interfacial reactions.
Additional considerations can be made on the role of PL during PEC tests. According to previous studies [17], during PEC tests, 50% of the radiance density is retained by the catalytic mesh, with the remaining portion being reasonably available for photolytic reactions and contributing to the degradation of PFOA. In photolysis, the reaction rate linearly depends on radiance flux density. Assuming that, in the given operation conditions, the photolytic reactions play an additive role during photoelectrocatalysis, the rate constant for photolytic reactions during PEC tests can be evaluated (0.00159 min−1) and compared to the overall PEC reaction rate (0.00633 min−1). Based on the obtained values, it can be inferred that PL contribution during PEC tests should account for no more than 24% of the overall reaction rate. Given the slower kinetics of PL phenomena with respect to PEC (Figure 1a,b), this might bring a proportional reduction in the overall reaction rate in PEC tests, partially accounting for the discrepancy between the simulated and the experimental concentration profiles.

3.2. Effect of Electric Bias

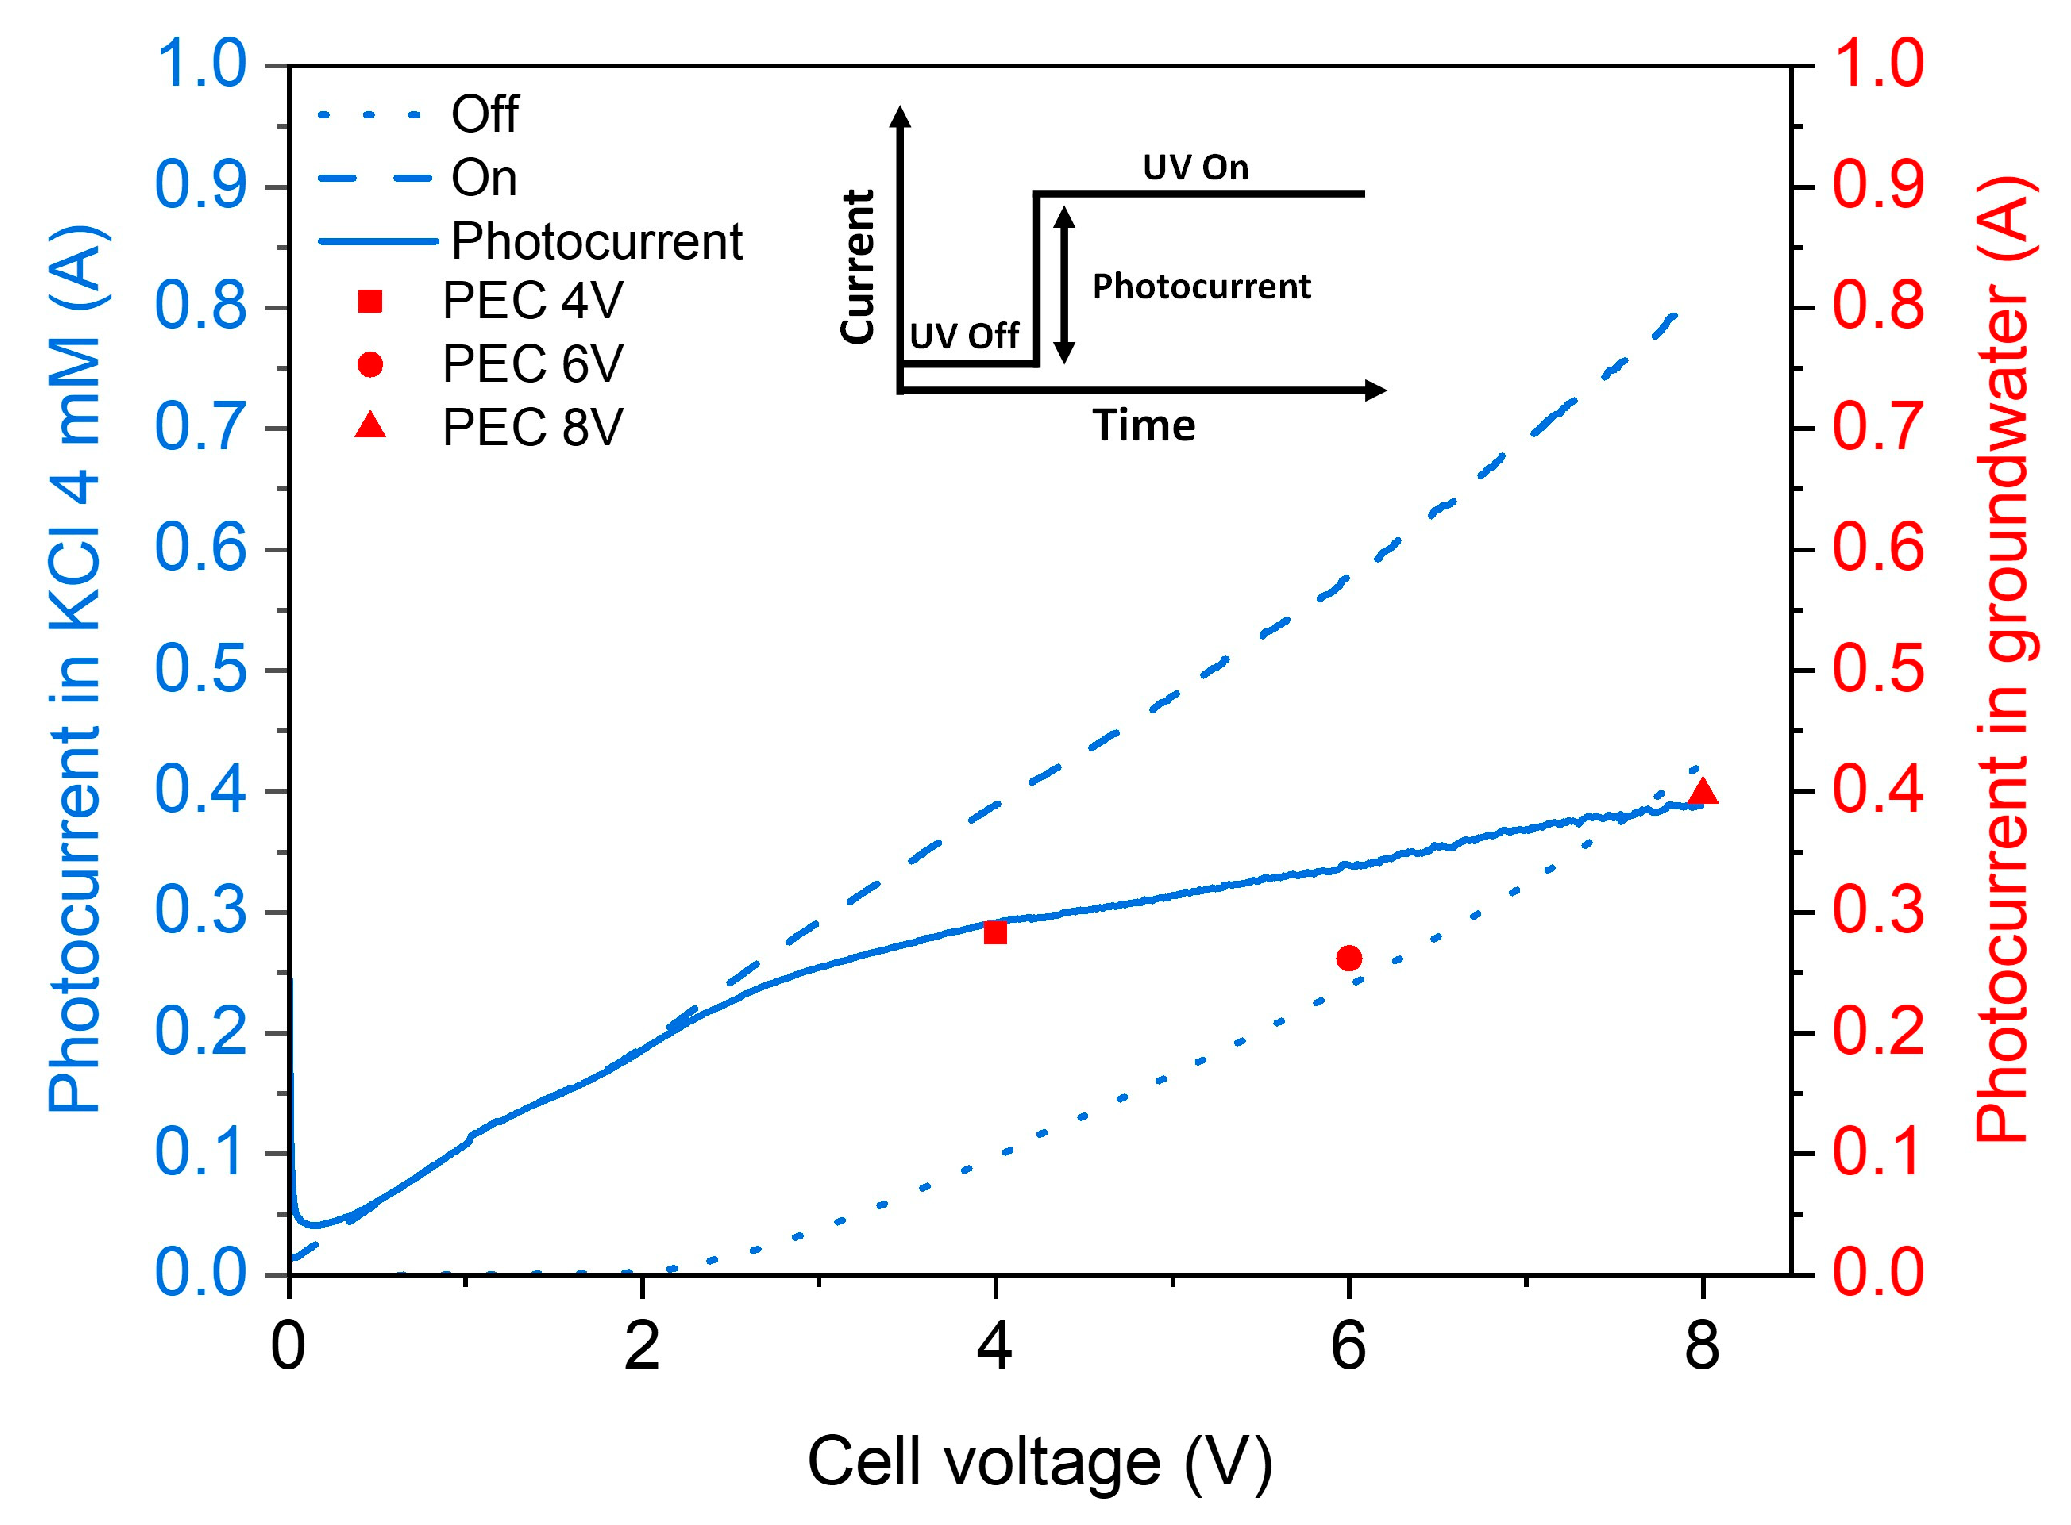
Photoelectrocatalytic reactions fundamentally depend on the stabilization of photogenerated holes through the migration of photogenerated electrons under an externally applied electrical bias. Consequently, the magnitude of this applied voltage may play a critical role in dictating the reaction kinetics, as it directly affects charge carrier separation, mobility, and interfacial charge transfer dynamics. To systematically investigate the influence of the applied electrical bias on the PEC degradation efficiency, experiments were performed under both open-circuit conditions (photocatalysis, PC) and controlled cell voltages of 4 V, 6 V, and 8 V. These voltage values were selected based on the photoelectrochemical polarization curve of the TiO2 photoanode under UV irradiation (Figure 2), which exhibited a trend in photocurrent density (full line) correlating with the applied cell potential, indicative of improved charge separation and transport processes. Moreover, the current measured under irradiation appeared to increase as a function of cell voltage (Figure 2, dashed line).
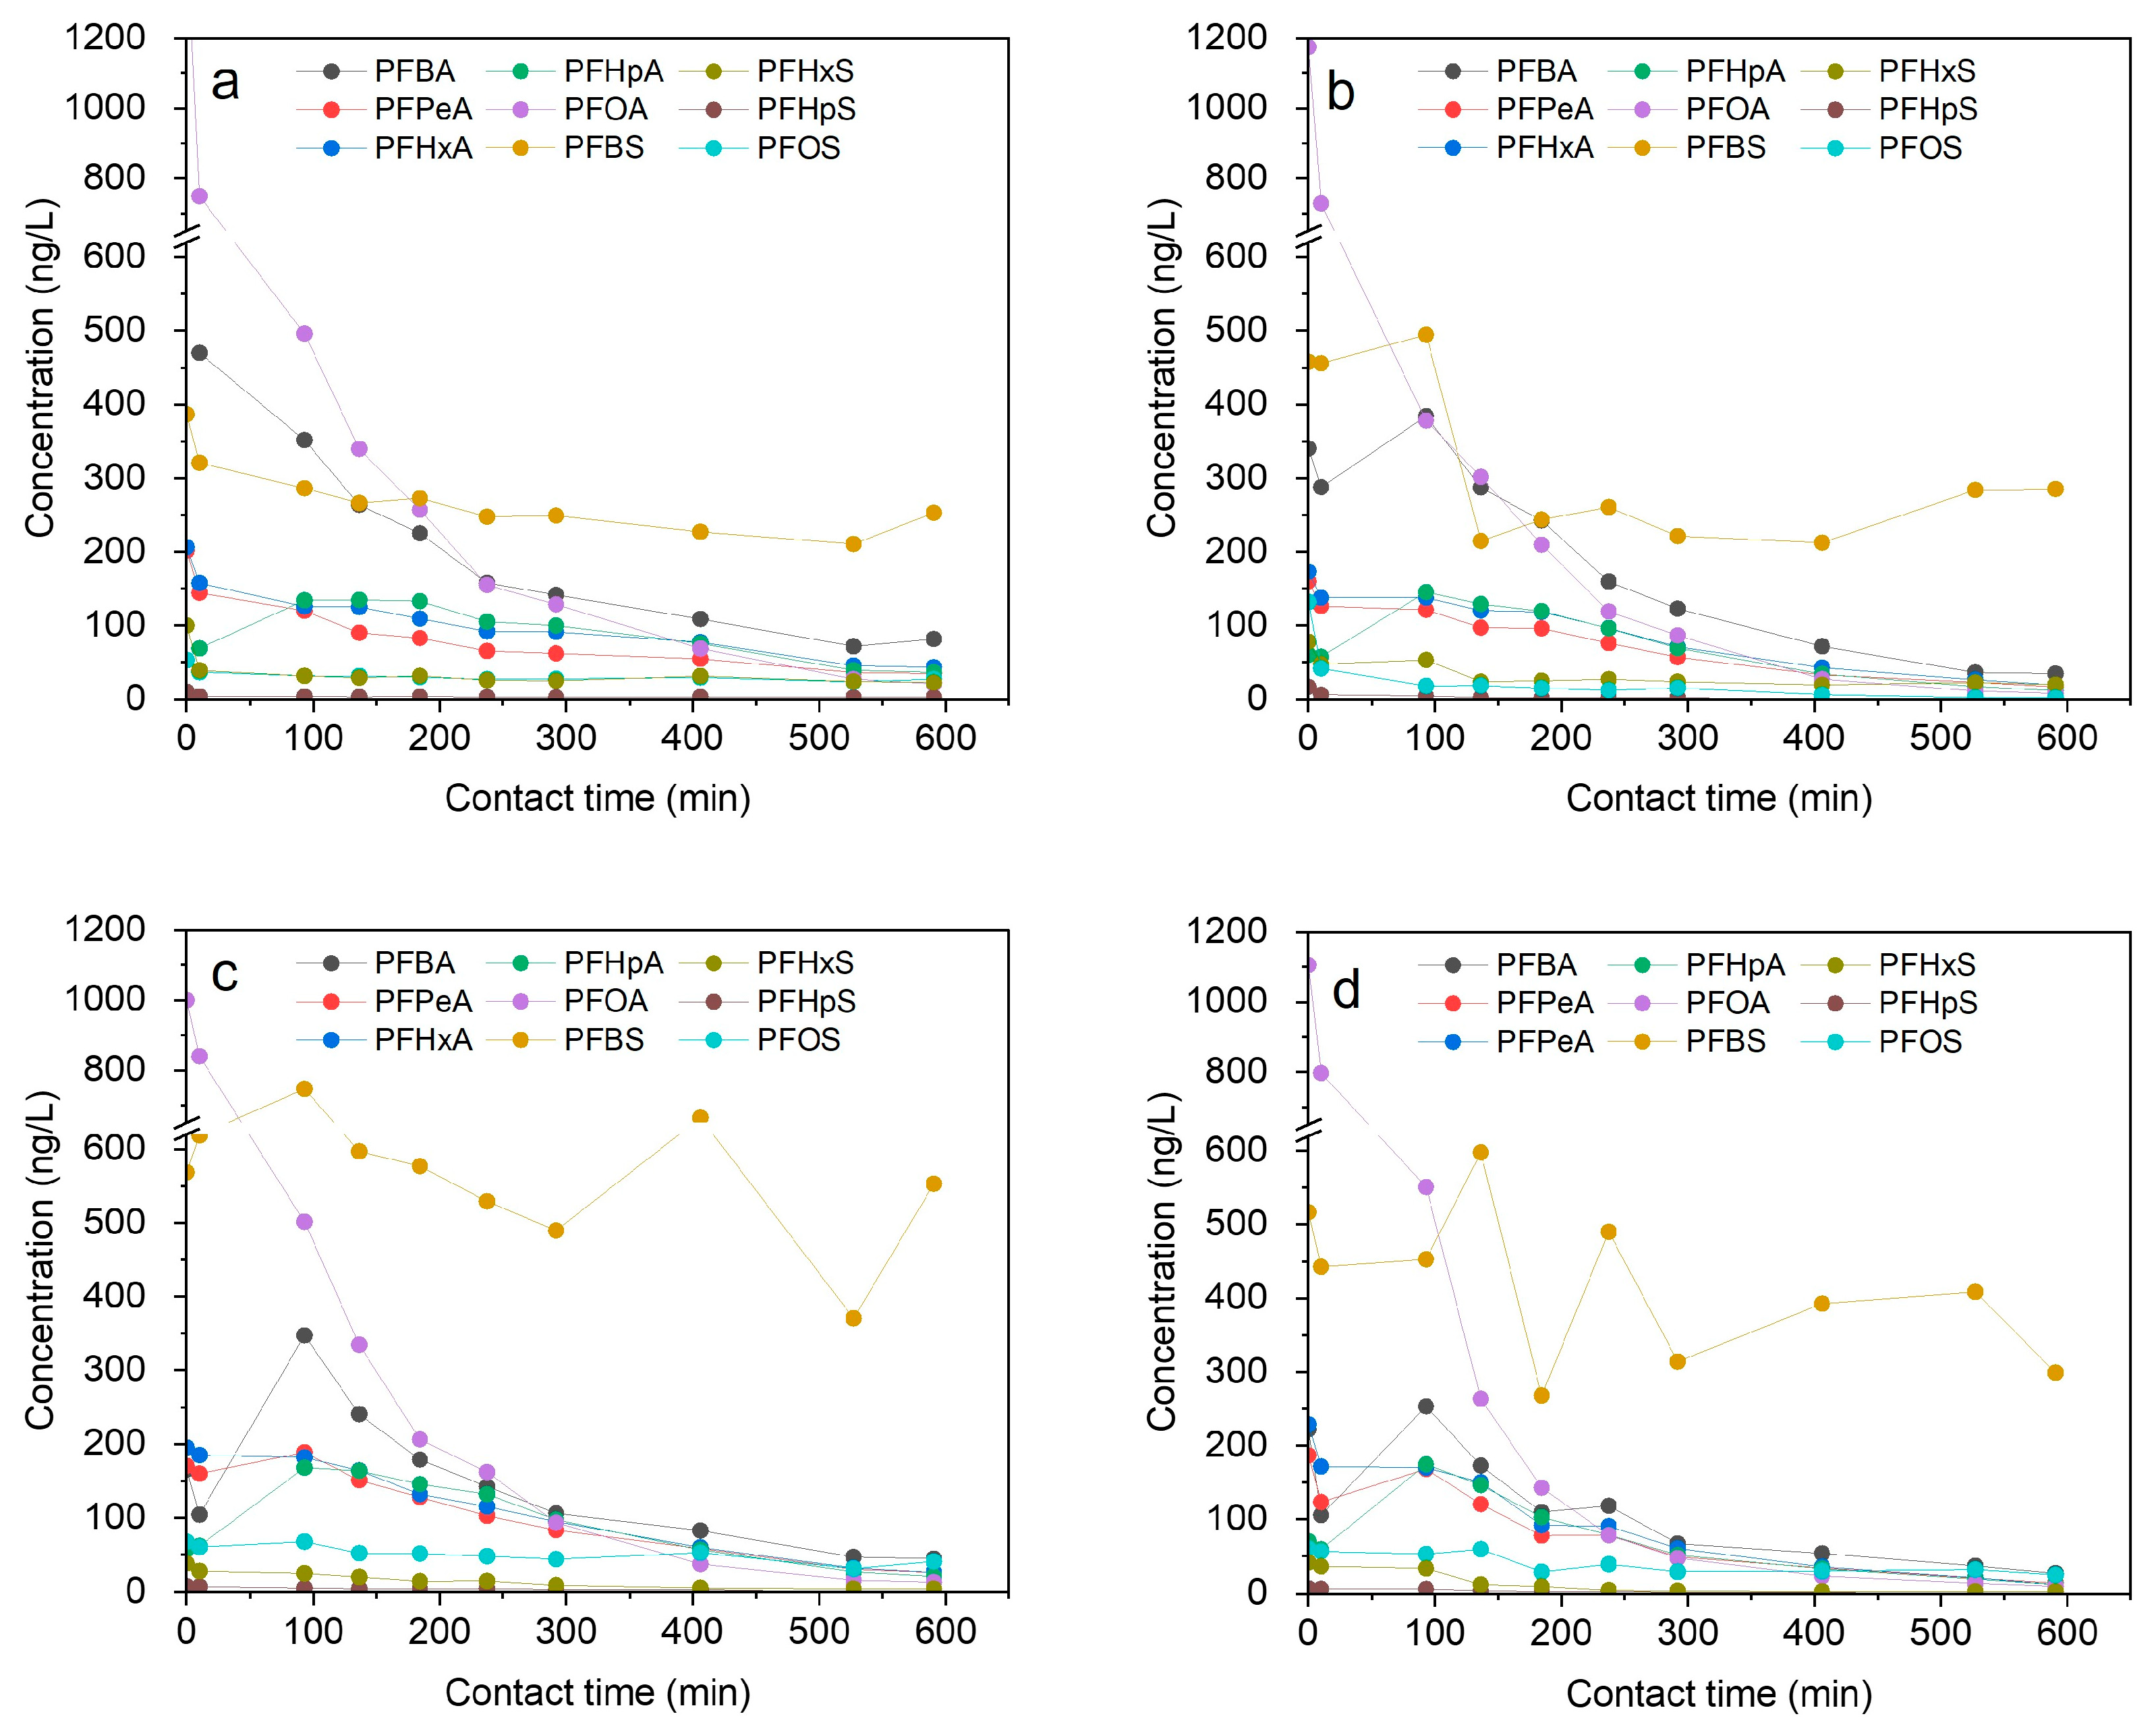
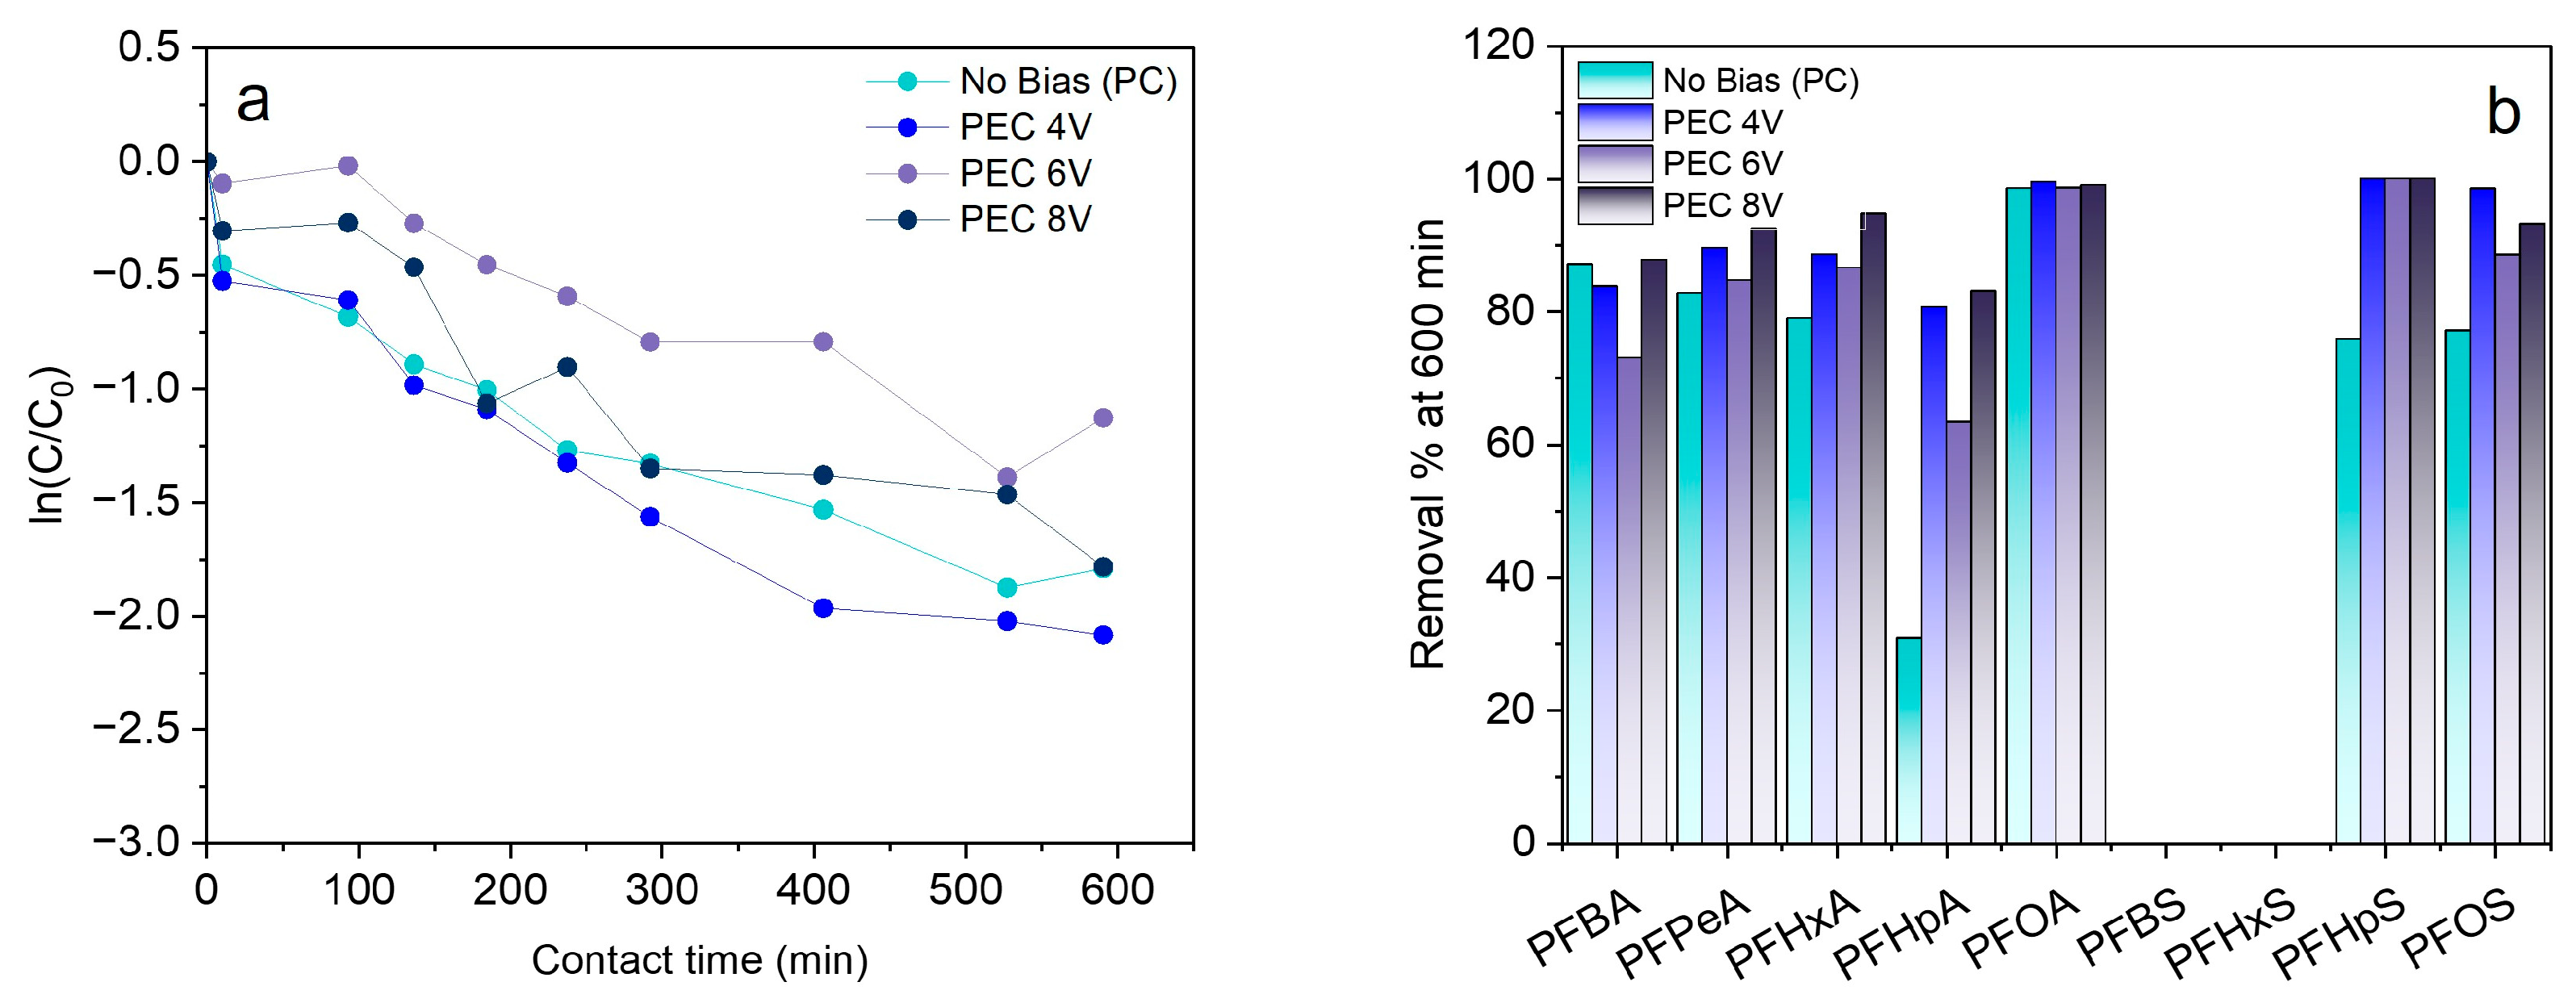
Figure 3, Figures S1 and S2 show the concentration profiles of PFASs contained in groundwaters of well 1*, namely PFOA, PFHpA, PFHxA, PFPeA, PFBA, PFOS, PFHpS, PFHxS, and PFBS, as a function of process time during PEC tests at different cell voltages. In agreement with the findings reported in the literature [25], all tests revealed three distinct degradation patterns: (i) PFASs that exhibited a steadily decreasing trend over time, such as PFOA, PFHxA, PFPeA, PFBA, PFOS, and PFHpS; (ii) PFASs that displayed a bell-shaped concentration trend, exemplified by PFHpA; and (iii) PFASs whose concentrations remained relatively stable throughout the testing period, including PFBS and PFHxS. The corresponding kinetic constants are reported in Table S4. The kinetic constant for PFHpA was derived only from data of the monotonic decay phase. The average degradation rates of the PFAS compounds followed this order: PFOA exhibited the fastest reaction, followed by PFHpA, with PFHxA and PFPeA showing similar rates, and then PFBA; similarly, PFOS degraded more rapidly than PFHpS. In experiments conducted without any applied external electrical bias (Figure 3a), the removal percentages after 600 min of treatment (see Figure 4b) were 99% for PFOA, 73% for PFHpA, 79% for PFHxA, 82% for PFPeA, 87% for PFBA, 77% for PFOS, and 75% for PFHpS. After 600 min of contact time, in the absence of electric bias, the overall PFAS concentration decreased by 83%, i.e., from 3130 ng/L to 523 ng/L.
The application of an electrical bias of 4 V (Figure 3b) led to a general improvement in the reaction kinetics (Table S4). This is reflected in the removal rates shown in Figure 4b, which increased up to 99% for PFOA, 81% for PFHpA, 89% for PFHxA, 90% for PFPeA, 84% for PFBA, 99% for PFOS, and 100% for PFHpS. Correspondingly, the overall PFAS degradation passed from 83% to 87%. This outcome was not surprising since it is clearly stated in the literature that the application of an electrical bias increases the degradation rate of PFOA with respect to photocatalysis [24,36]. This can be ascribed to the direct contribution of anodic current to the electrochemical oxidation of PFOA, to the lower electron–hole recombination, and to the accumulation/stabilization of holes on the photoanode surface.
The application of an electrical bias higher than 4 V (i.e., 6–8 V) affected the reaction rate to a different extent, depending on the carbon chain length (Table S4 and Figure 4a). Based on the C/C0 trends (Figures S1 and S2), the degradation rate followed this order: 4 V > 6 V ≈ 8 V for PFOA, PFOS, PFHpS and PFHxS; 4 V ≈ 8 V > 6 V for PFHpA, PFPeA, PFBA; and 8 V > 6 V ≈ 4 V for PFHxA. For PFHxA, PFPeA, and PFBA, their concentrations remained stable for the initial 100 to 150 min of contact time before beginning to decline. In the cases of PFHxS and PFBS, no significant removal was observed regardless of the voltage applied. These findings can be partially attributed to the chain reaction mechanism underlying the photoelectrocatalytic degradation of PFASs (Equations (5)–(11)), where the concentration changes in shorter-chain compounds are influenced by the reactivity of longer-chain species. Nevertheless, the complexity of the matrix, potentially containing unknown or undetected PFASs involved in the reaction pathways, makes it hard to isolate the specific impact of operational parameters on individual compounds. Based on the sum of the monitored PFASs as a function of the contact time (Figure 4a), the overall removal decreased from 87% to 68% and 83% at 6 V and 8 V, respectively. This might be attributed to the more intense oxygen evolution reflected by the polarization curve in Figure 2, either quenching direct PFAS oxidation on the photoanode or fostering reaction pathways, including TPs different from the monitored ones.

3.3. Effect of H2O2

PFAS degradation experiments were conducted in the presence of H2O2 to assess the impact of additional hydroxyl radicals (OH) and reactive oxygen species (ROS) on the process. H2O2 is well known for generating ROS and OH radicals through photolysis or reactions with photogenerated holes on the anode surface [37]. The introduction of extra ROS is expected to enhance the reaction kinetics of the degradation process. The effect of H2O2 was examined under both photolytic and photoelectrocatalytic conditions. All tests were repeated twice, and good reproducibility was observed.

3.3.1. Photolysis

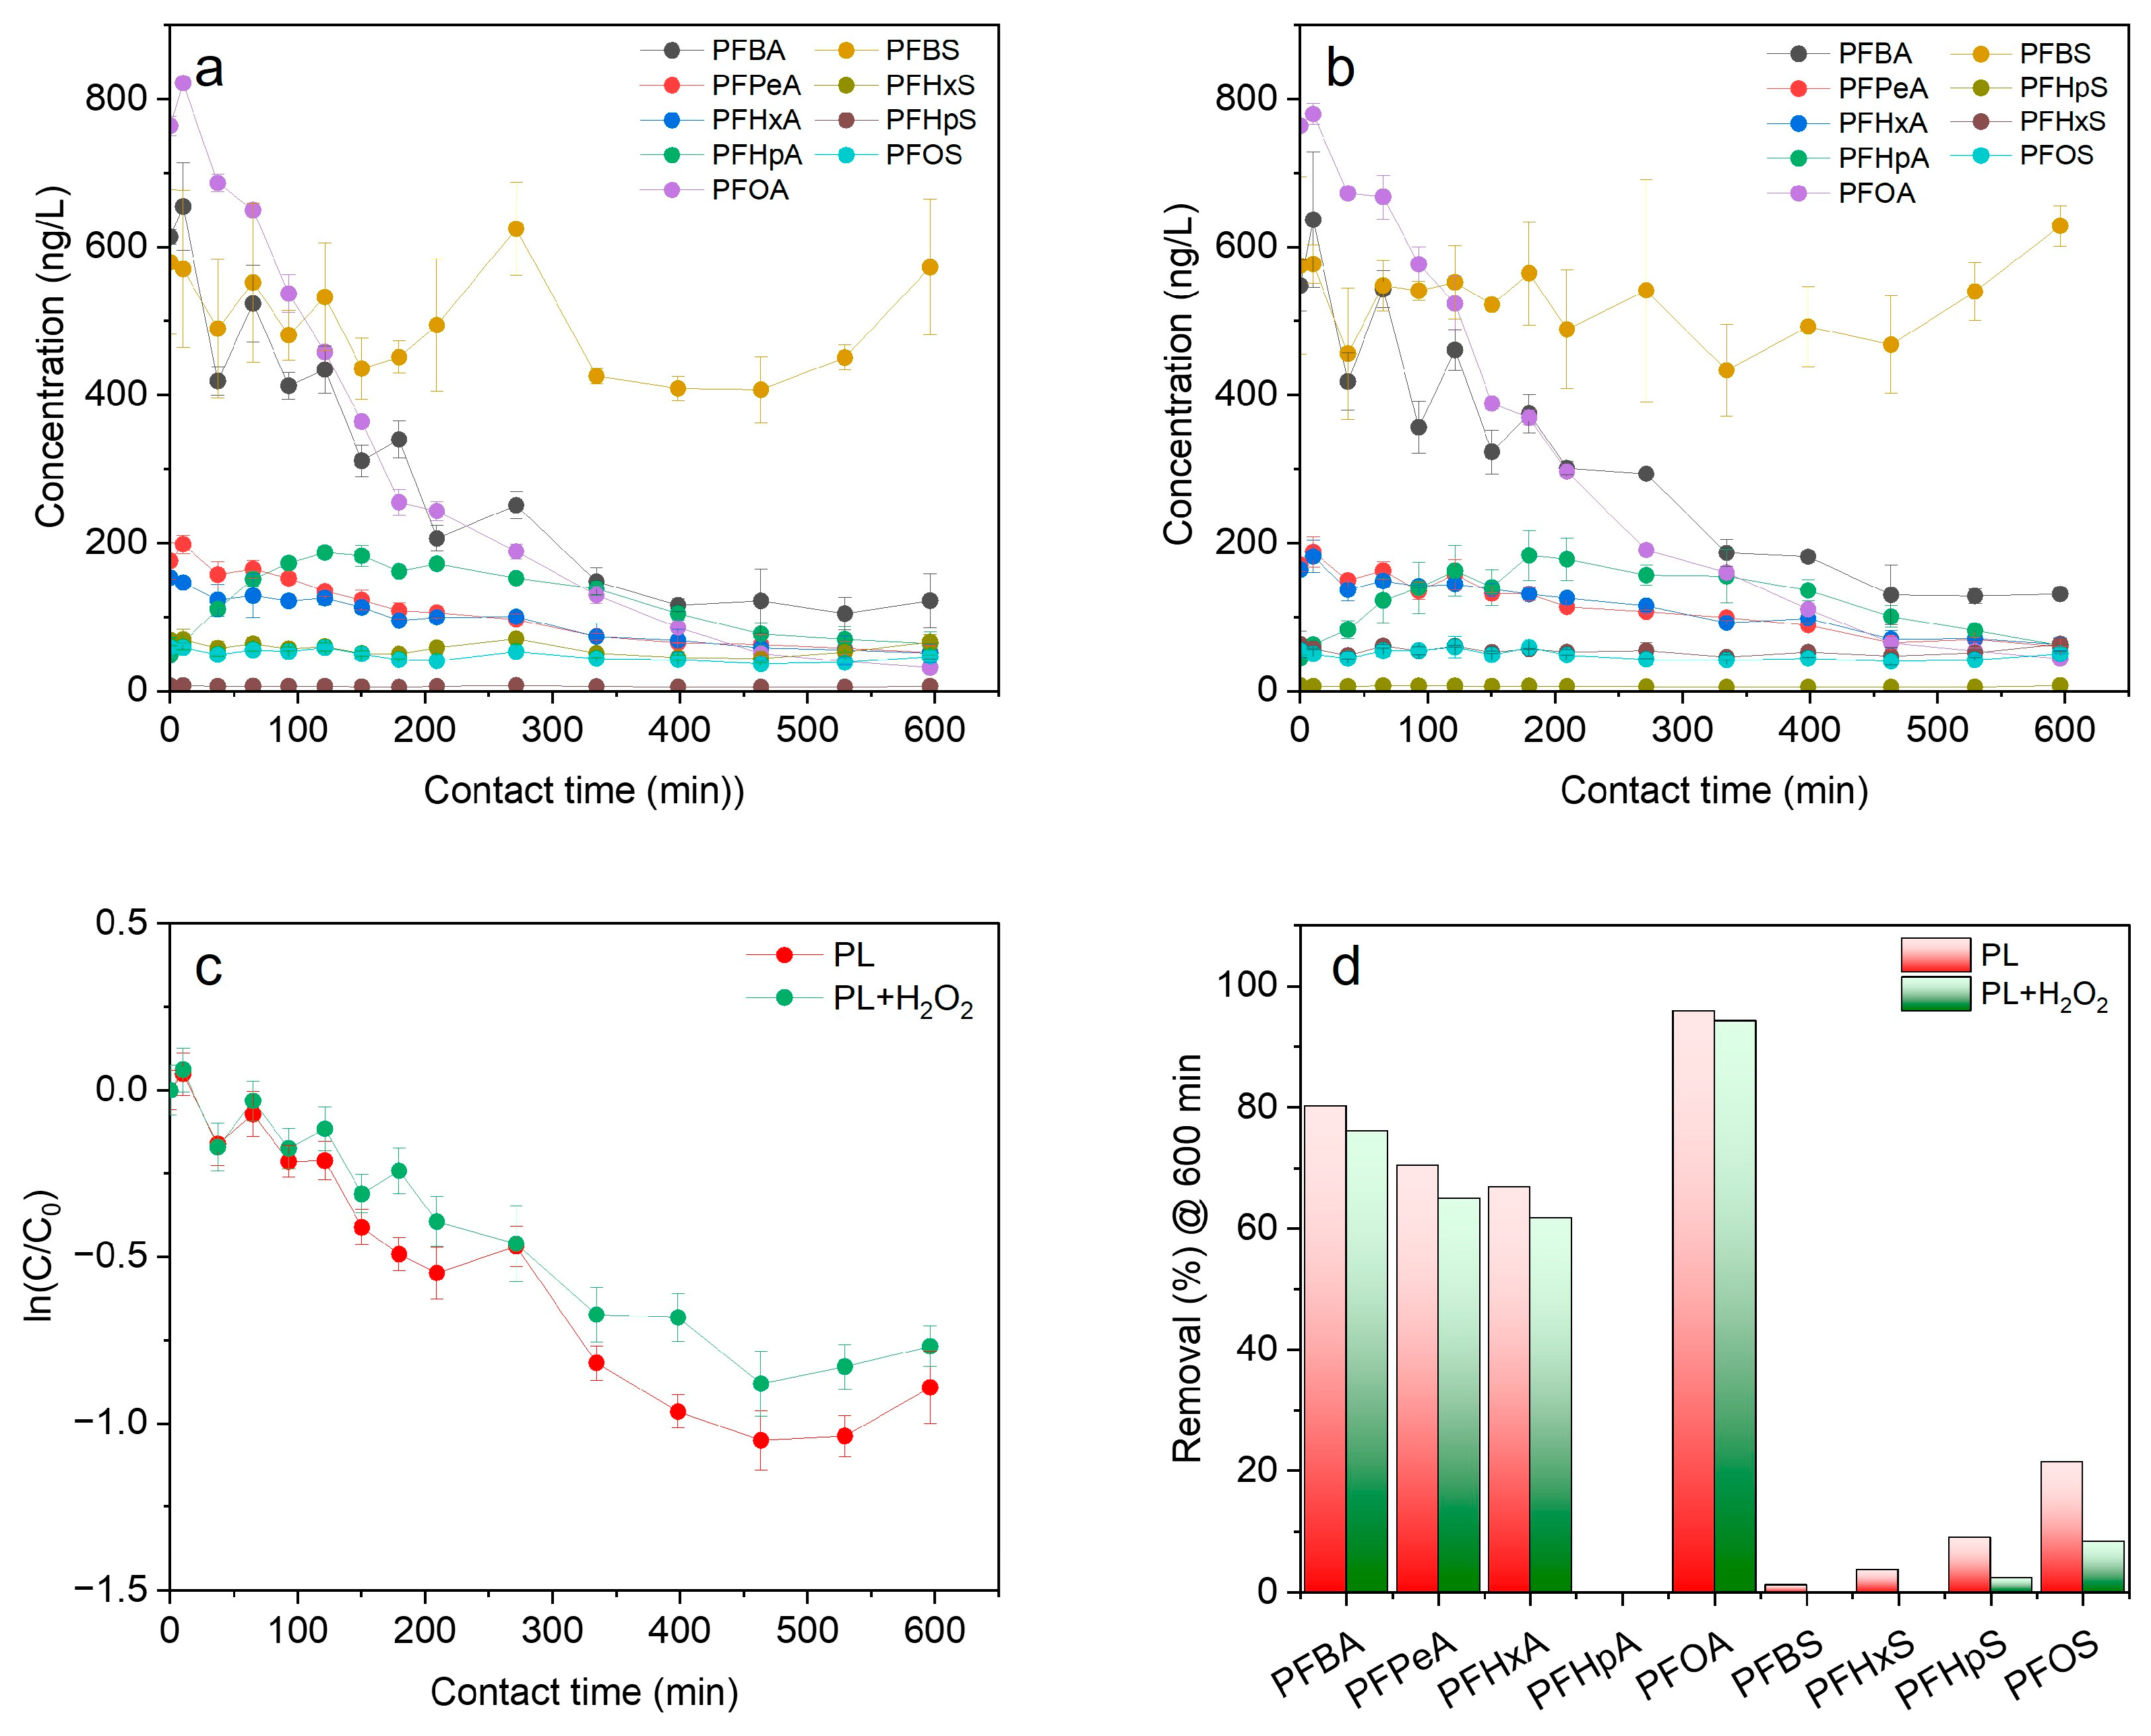
H2O2-assisted photolysis (PL + H2O2) was performed by adding 100 ppm of H2O2 into the contaminated groundwater (Well 1). PFAS concentration trends in groundwater samples during PL and PL + H2O2 treatments are presented in Figure 5a,b (absolute concentration), Figures S3 and S4 (C/C0), respectively. The analysis of the kinetic constants presented in Table S5 indicates that the degradation rates followed the sequence PFOA > PFBA > PFHpA > PFHxA ≈ PFPeA, with PFOS exhibiting a higher reaction rate compared to PFHpS.
The addition of H2O2 slowed down the reaction rate for all the monitored PFASs. At the end of the process, lower removals were observed for PFOA (from 96% to 94%), PFHxA (from 67% to 62%), PFPeA (from 70% to 64%), PFBA (from 80% to 76%), and PFOS (from 21% to 8%). Moreover, the PL + H2O2 process was unsuccessful in removing PFHpA, PFBS, PFHxS, and PFHpS, whose concentration remained constant over the whole reaction timeframe. Given that PFOA, PFBA, and PFBS were the most concentrated species in the treated groundwater, after 600 min of contact time the overall PFAS removal was only slightly affected by the addition of H2O2, passing from 59% in PL to 54% in PL + H2O2. From a fundamental point of view, the effect of H2O2 can be explained by considering that free OH radicals cannot initiate the oxidation of the monitored PFASs. Indeed, OH radicals can add to C═C bonds or abstract H from C─H bonds but cannot break the C─F bond because of the lower dissociation energy. Since the monitored PFASs showed fully fluorinated alkyl chains, they were recalcitrant toward •OH attack, and no acceleration of the degradation process was possible. Additionally, the presence of H2O2 consumed UV irradiation, hampering PFAS oxidation [38].

3.3.2. Photoelectrocatalysis

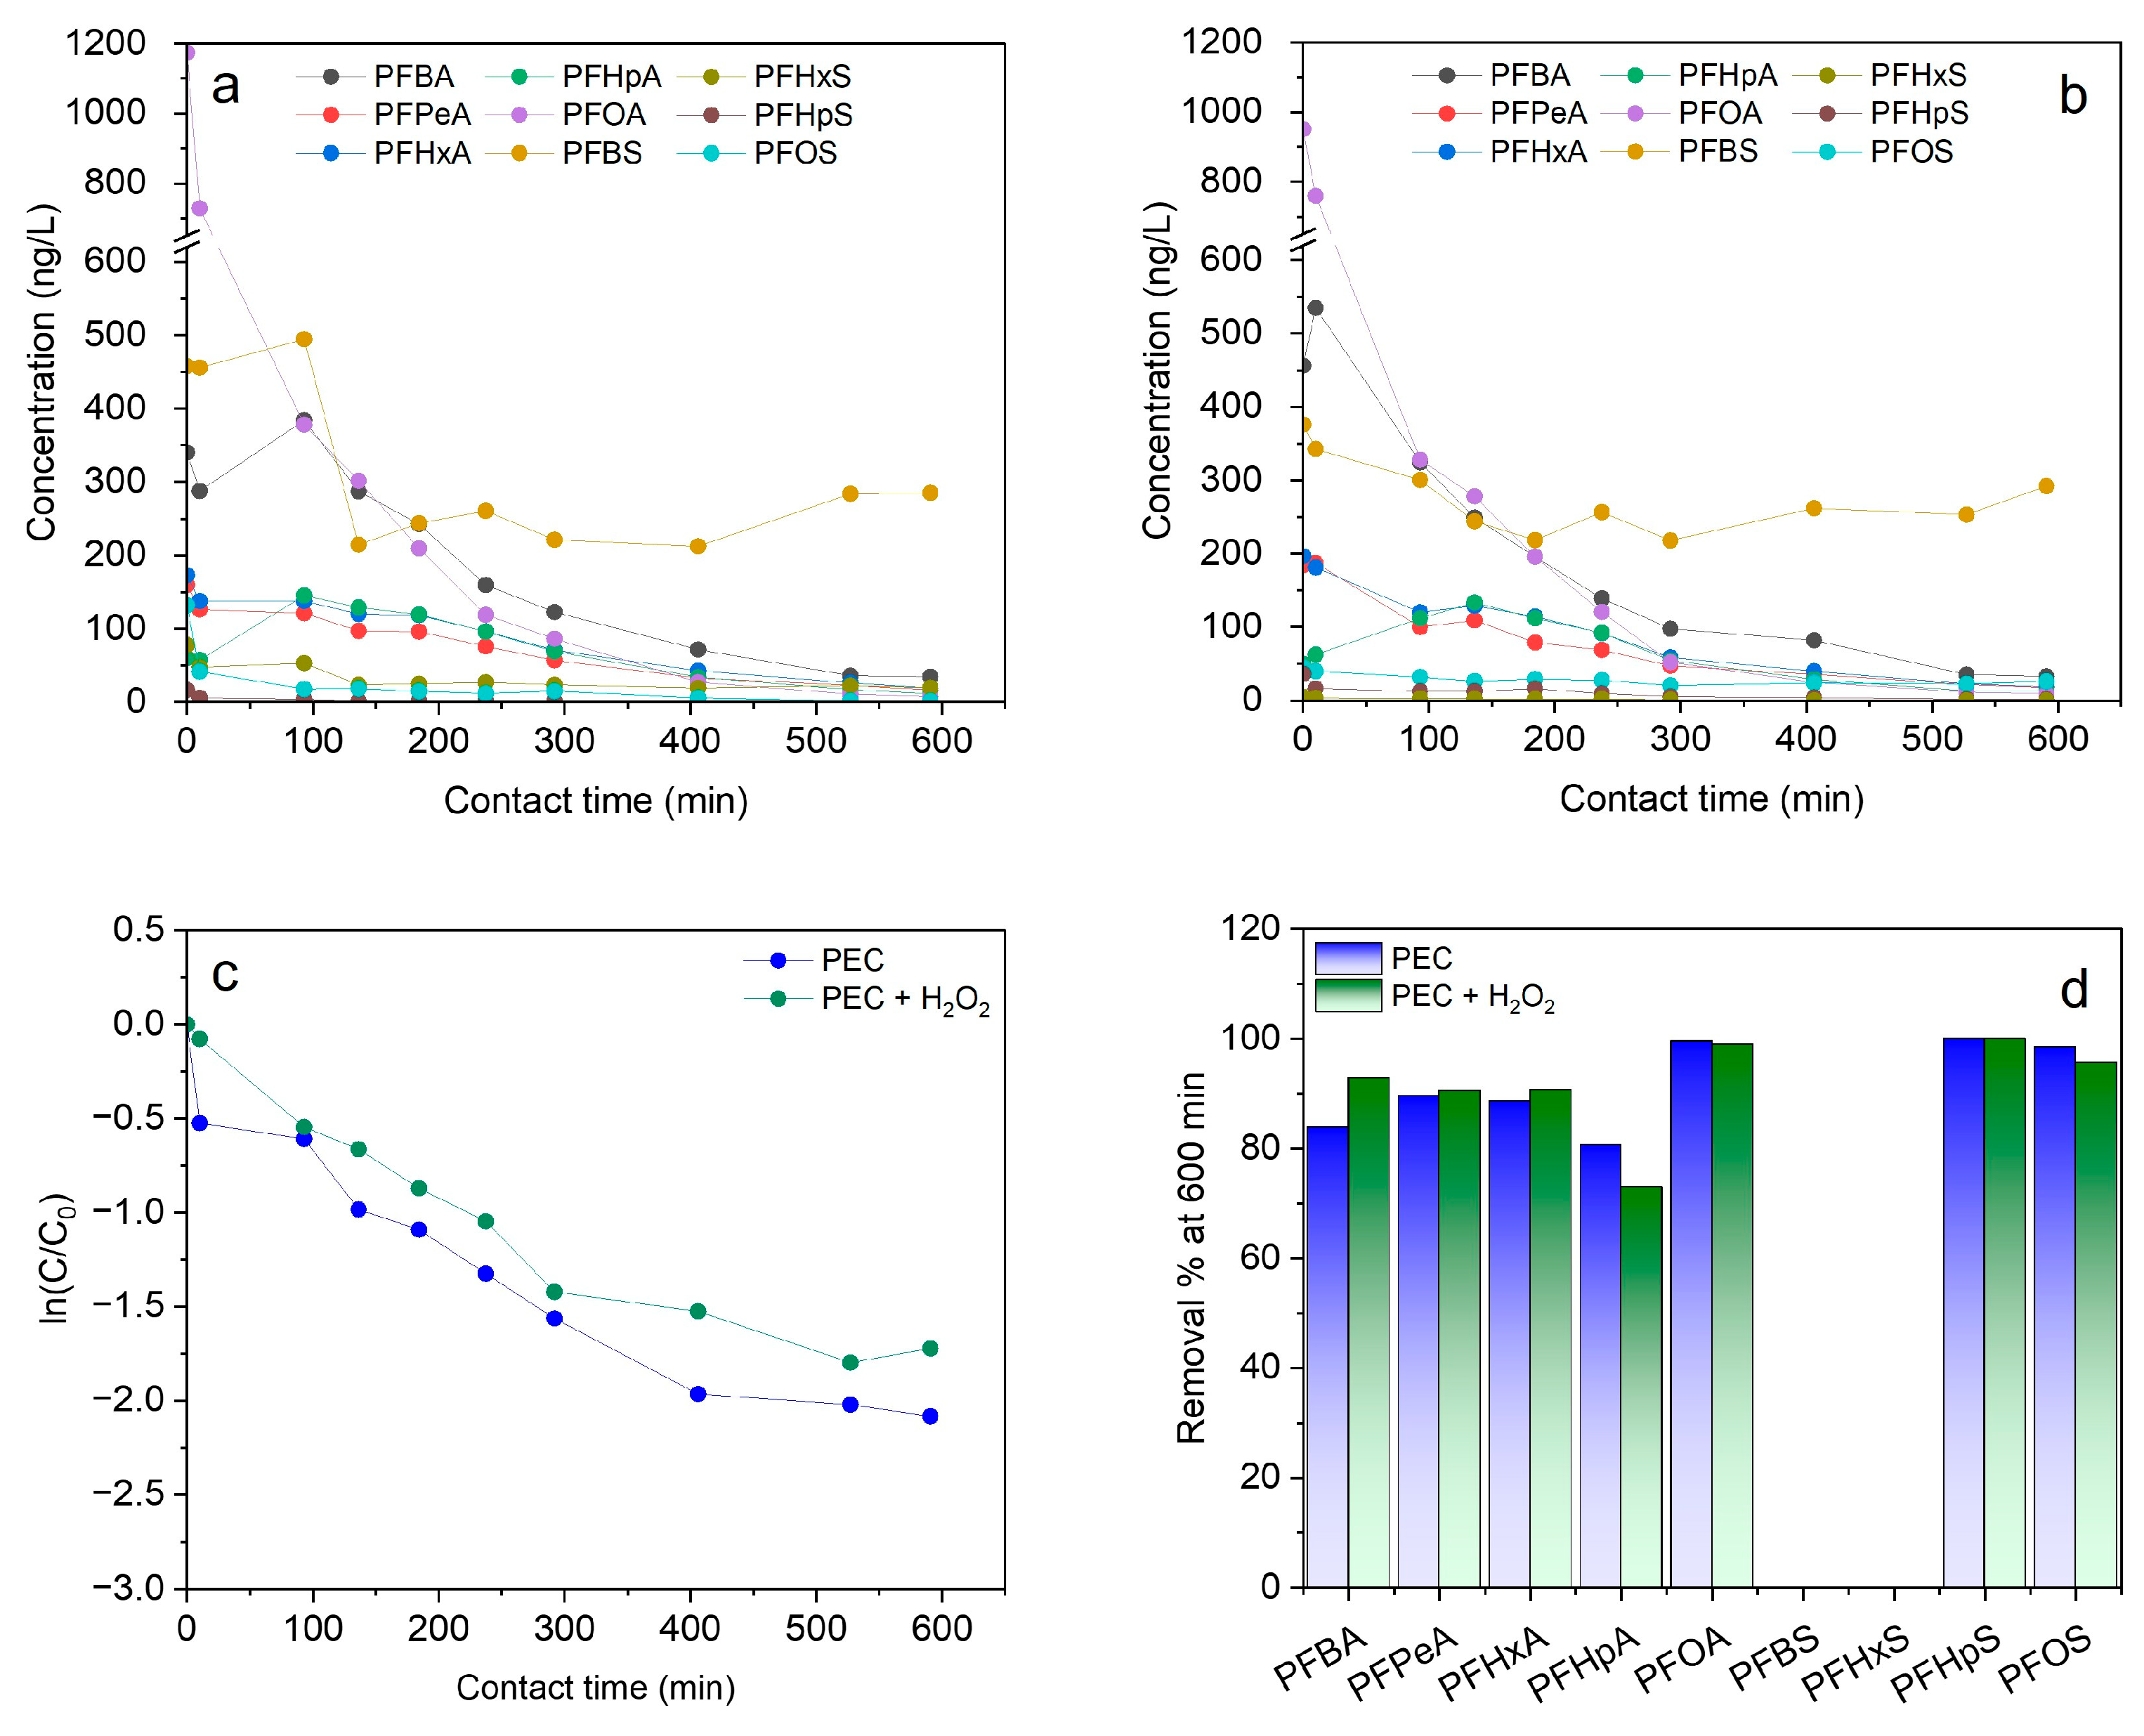
H2O2-assisted PEC (PEC + H2O2) experiments were carried out at a cell voltage of 4 V by adding 100 ppm of H2O2. Groundwater was collected from well 1*. The concentration profiles of each species as a function of contact time for the PEC and PEC + H2O2 processes are shown in Figure 6a,b (absolute concentration), respectively, and also in Figures S5 and S6 (actual concentration relative to the initial value, C/C0). The presence of H2O2 affected the reaction rate (Table S6) to a different extent, depending on the carbon chain length. Based on the C/C0 trends (Figures S5 and S6), the reaction rate of H2O2-assisted PEC was slightly better than PEC for PFHxA, PFPeA, and PFBA, it was basically comparable for PFOA and PFHpA and slightly lower for PFOS and PFHpS. The observed trend is also reflected in the removal percentages calculated after 600 min of contact time shown in Figure 6d. Indeed, by adding H2O2, the removal rates remained 99% and 100% for PFOA and PFHpS, respectively, while they changed from 81 to 73% for PFHpA, from 89 to 91% for PPHxA, from 90 to 91% for PFPeA, from 84 to 93% for PFBA, and from 99 to 96% for PFOS. Based on the sum of the detected PFASs as a function of the contact time (Figure 6c), the effect of H2O2 can be considered minimal, with the overall PFAS degradation rate decreasing from 87% to 82%. Electrochemical advanced oxidation processes can rely on two reaction mechanisms, namely direct or indirect pathways. The former occurs by direct electron transfer on the anode surface without the involvement of other species. The latter instead relies on the production at the anode surface of mediators such as OH radicals. In photoelectrocatalysis, OH radicals can be produced both by UV irradiation in the bulk and by photogenerated holes on the anode surface. In the second case, given their very short lifetime (2–4 μs), OH radicals exist only on the surface of the photoanode. As described in Section 3.1, in PEC tests photolytic and electrochemical phenomena occur simultaneously, with the former accounting for about 24% of the overall degradation rate. It is reasonable to assume that the effect of H2O2 on the photolytic contribution was to hinder PFAS oxidation, as described in Section 3.3.1. As for the (photo)electrochemical phenomena, it is recognized that the oxidation of perfluoroalkyl substances is initiated by the direct electron transfer on the anodic surface (Equation (6)) [39]. On the other hand, the role of hydroxyl radicals remains controversial. Although they cannot initiate the oxidation mechanism, OH species might have an essential role in sustaining the following steps (Equations (7)–(11)) [40].

3.4. Effect of NaCl

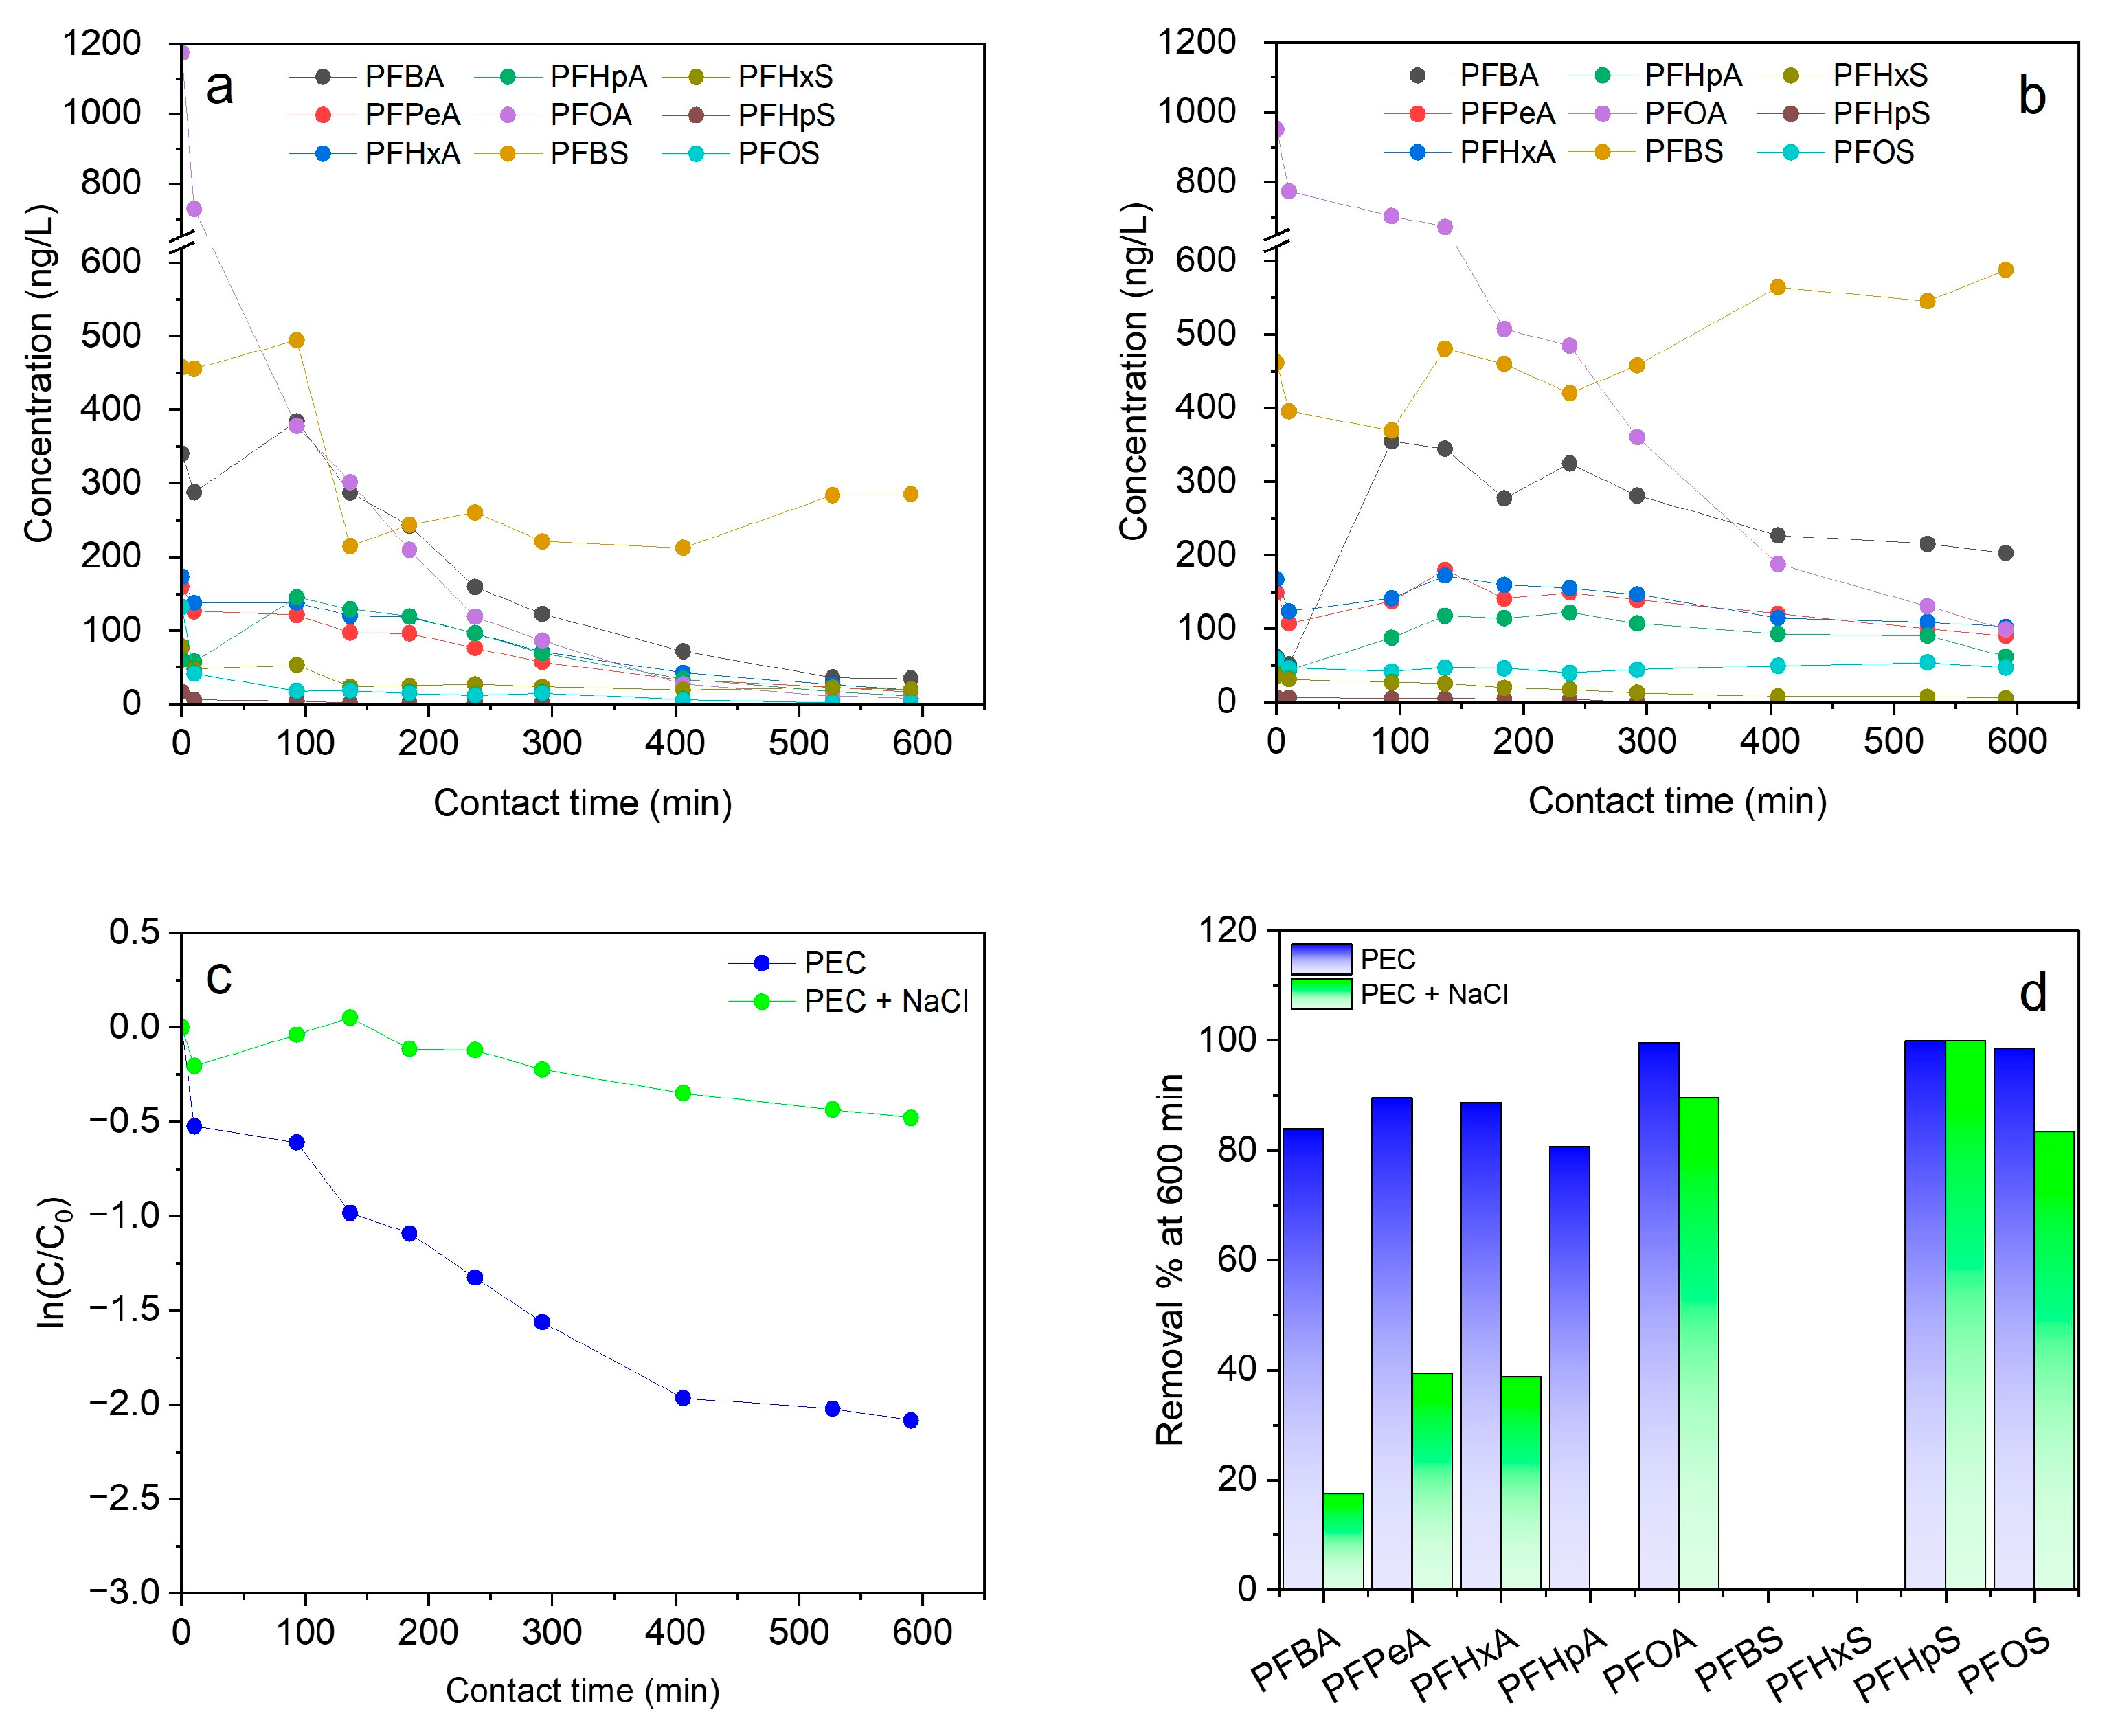
The PEC process was further studied by performing tests in the presence of 100 ppm NaCl to assess the potential synergy between hydroxyl radicals (OH) and reactive chlorine species (RCSs), such as Cl, Cl2−•, and OCl, in the degradation of PFASs. NaCl-assisted PEC (PEC + NaCl) experiments were carried out in groundwater collected from well 1*. The concentration profiles of individual PFASs over time are shown in Figure 7a,b, Figures S5 and S6. The addition of NaCl significantly slowed the reaction kinetics (see the kinetic constants reported in Table S6) for all monitored PFASs, especially for the short-chain compounds. Specifically, the concentration of PFHxA, PFPeA, and PFBA only began to decrease after 250 min of contact time. After 600 min, the removal rate was 90% for PFOA, 83% for PFOS, and 100% for PFHpS, while dropping below 40% for PFHpA, PFHxA, PFPeA, and PFBA (Figure 7d). No removal was achieved for PFHxS and PFBS. As a result, the overall PFAS degradation rate significantly dropped from 87% in PEC to 38% in PEC + NaCl tests (Figure 7c). These observations can be rationalized by the generation of chlorine radicals (Cl) via the oxidation of chloride ions by photogenerated holes (h+). Given that the standard redox potential of chlorine radicals is lower than that of hydroxyl radicals (OH), the reactive chlorine species (RCS) lack sufficient oxidative power to effectively contribute to PFAS degradation. Moreover, the formation of RCS competes with PFAS oxidation by acting as hole scavengers, thereby reducing the availability of photogenerated holes and consequently inhibiting the direct reaction of PFASs onto the catalytic surface. Similar results were observed by Wang et al., who found that the presence of chlorides inhibited the electrochemical oxidation of PFOS onto Ti4O7 anodes [41]. Finally, as suggested by recent research [32], the possible occurrence of additional reaction pathways, delaying or inhibiting the formation of the monitored by-products, must also be considered.

3.5. Energy Consumption

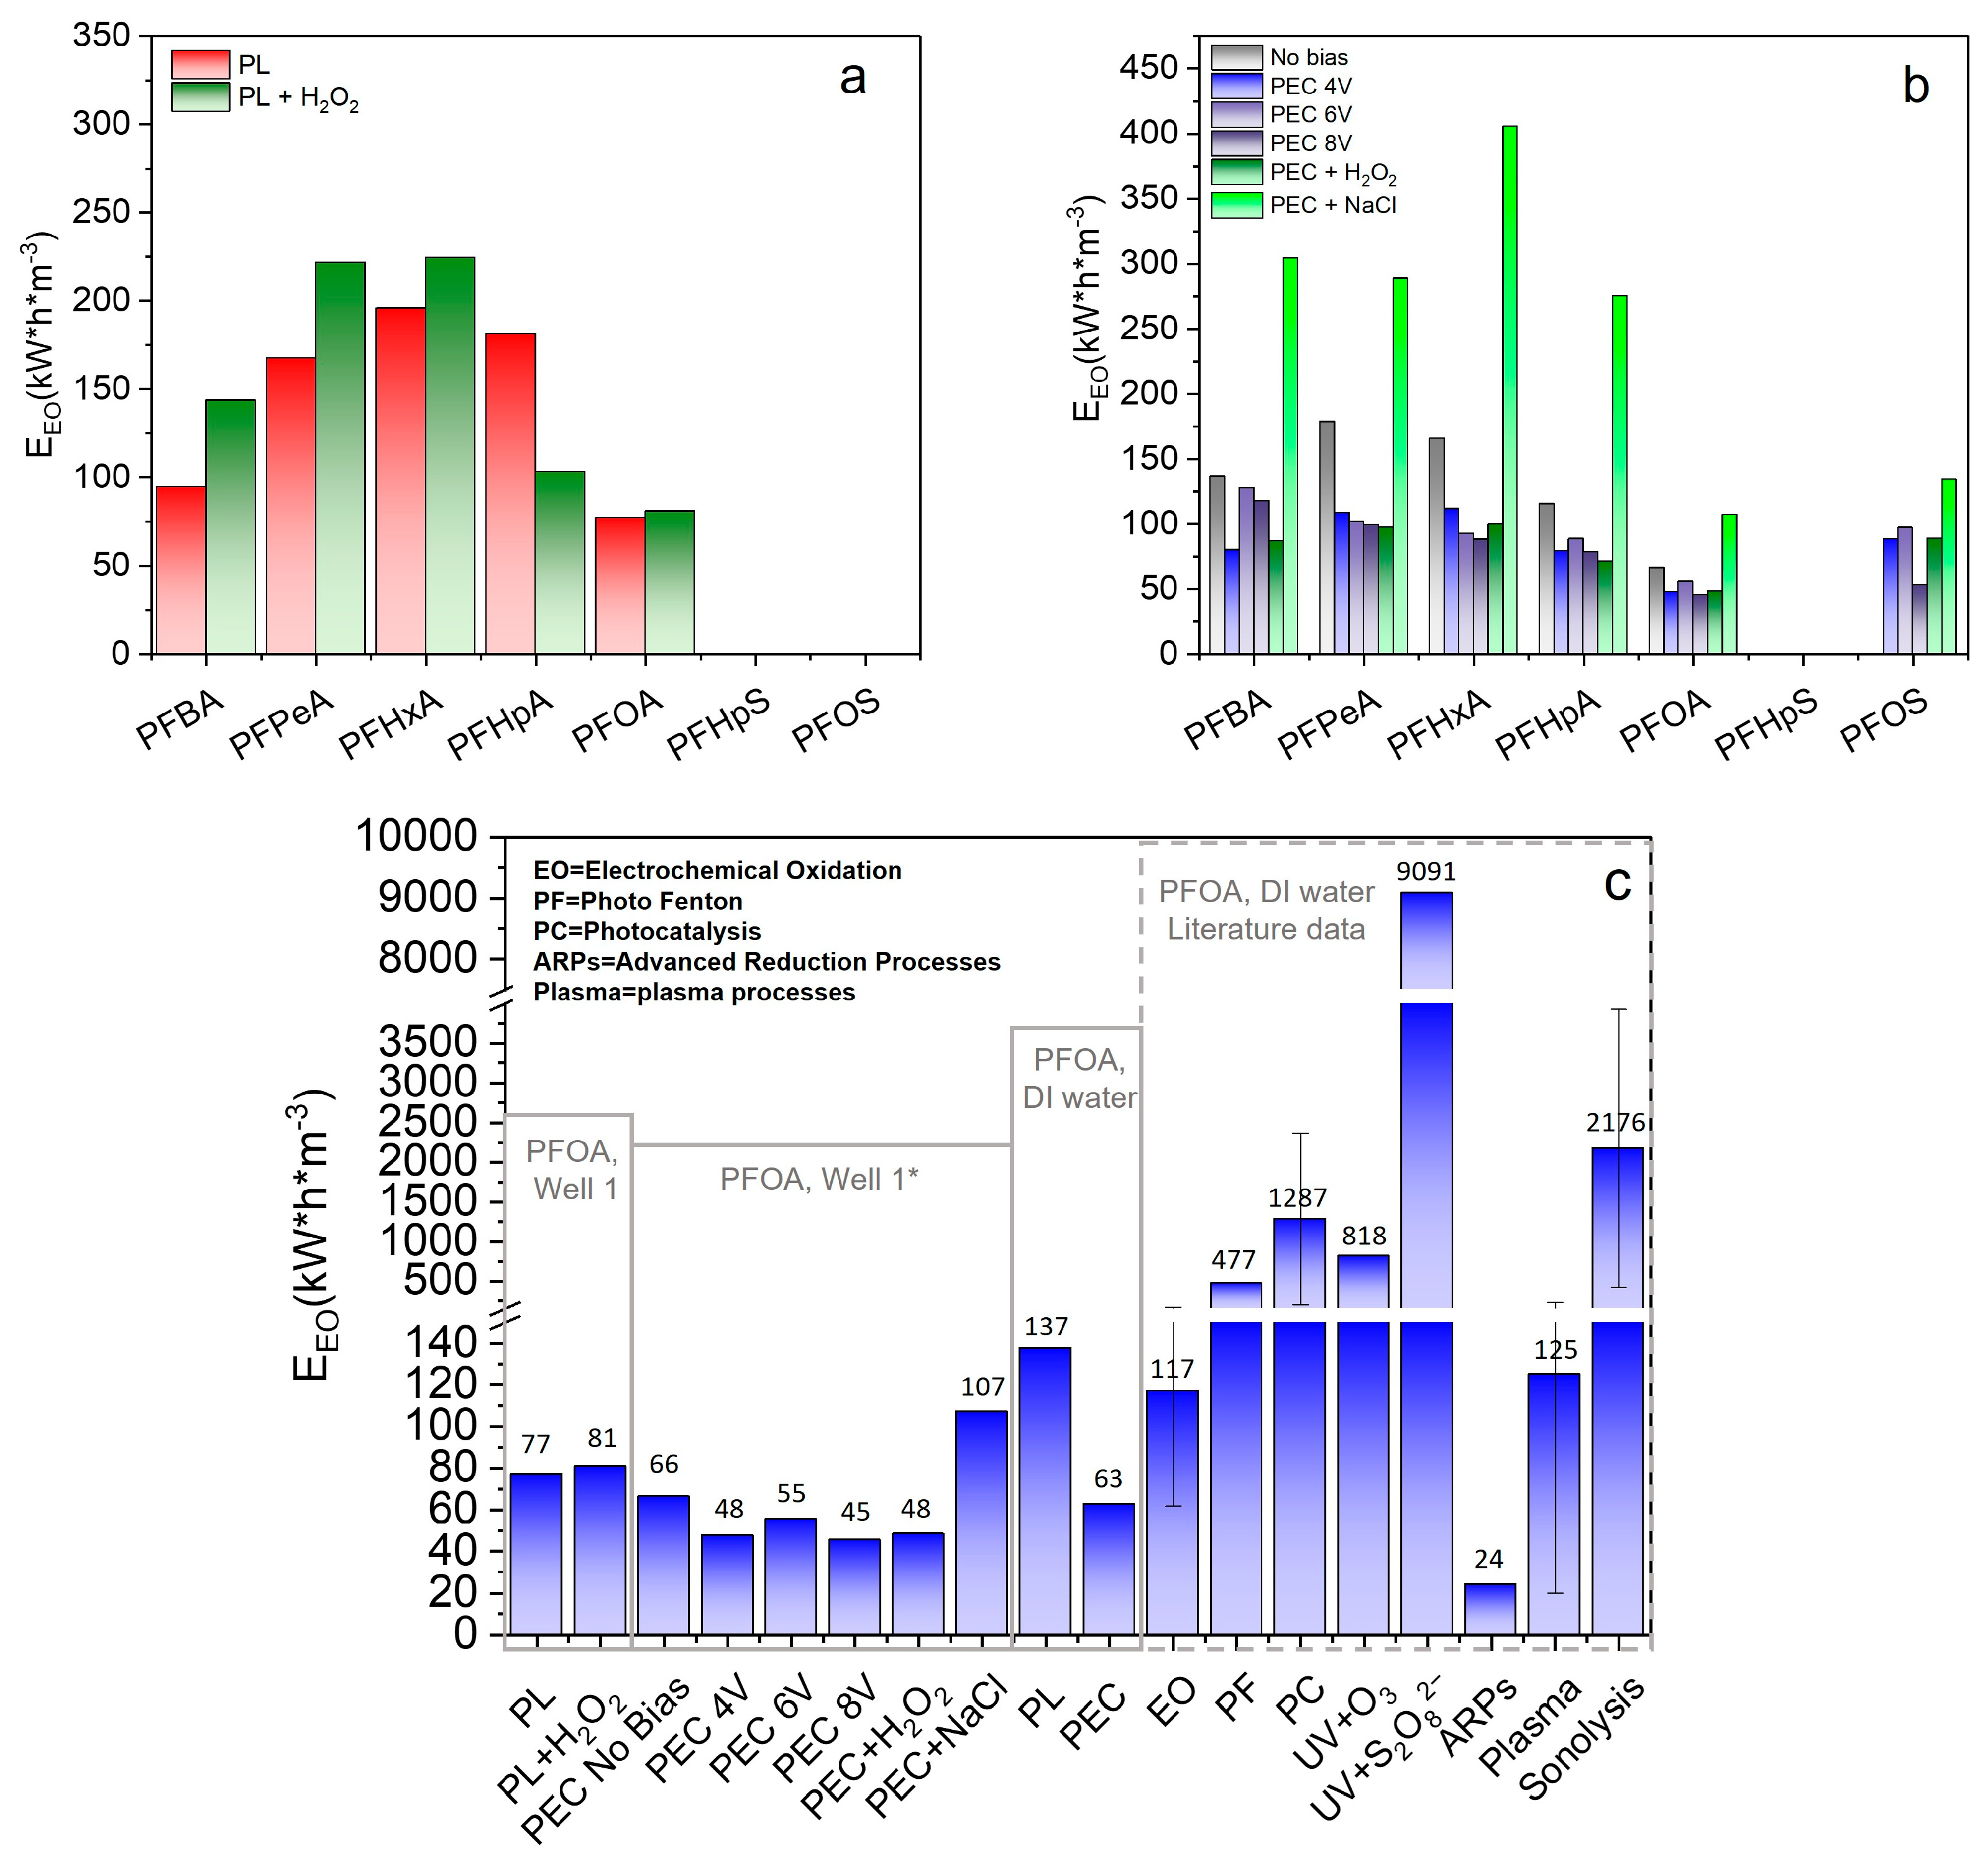
A figure of merit often used for the preliminary evaluation of the energy consumption of a new water treatment process is the Electric Energy for Order of Magnitude (EEO). In Figure 8a,b, the EEO values calculated for PFOA, PFHpA, PFHxA, PFPeA, PFBA, and PFOS for PL, PL + H2O2, and PEC tests are reported. The values of PFHpS, PFHxS, and PFBS were not included as the kinetic constant could not be determined. For the same reason, in the case of PFOS, only data concerning PEC and H2O2- or NaCl-assisted PEC were reported. As expected, the application of an electrical bias led to a reduction in energy consumption compared to the photocatalytic process. Indeed, the electrical energy consumption decreased from the range 66–816 kWh m−3 under PC conditions to the range 48–112 kWh m−3 under PEC conditions (4 V). Further increasing the applied voltage did not result in substantial changes to energy demand; EEO values were within 55–127 kWh m−3 and 45–117 kWh m−3 for PEC at 6 V and 8 V, respectively. In contrast, PL exhibited higher energy requirements than PEC, with the EEO ranging from 77 to 196 kWh m−3. The addition of H2O2 did not reduce the energy consumption in either PL or PEC systems, with EEO values of 81–224 kWh m−3 and 48–99 kWh m−3, respectively, for PL + H2O2 and PEC + H2O2. Notably, a marked increase in energy consumption was observed for NaCl-assisted PEC, with EEO ranging from 107 to 405 kWh m−3.
In Figure 8c, the EEO values calculated for PFOA degradation in ultrapure water are presented alongside reference values reported in the literature for the same matrix. The EEO,PFOA obtained under PEC conditions was 63 kWh m−3, being 2.17 times lower than that observed in the PL test (137 kWh m−3). With respect to the literature, the EEO,PFOA value in the PEC process (i) is one to two orders of magnitude lower than those associated with UV + S2O82− (9091 kWh·m−3), UV + O3 (818 kWh·m−3), sonolysis (2176 kWh·m−3), photo Fenton (477 kWh·m−3), and photocatalysis (1287 kWh·m−3) and (ii) falls within a comparable range to some of the most energy-efficient advanced oxidation technologies documented in the literature, such as plasma treatment, which requires approximately 125 kWh·m−3, advanced reduction processes, with an energy consumption near 24 kWh·m−3, and electrochemical oxidation (117 kWh·m−3) [42,43,44]. The EEO,PFOA in groundwater and in ultrapure water showed similar values (48 kWh m−3). The application of a different cell voltage did not significantly affect EEO,PFOA (48 and 45 kWh m−3 for PEC 6V and PEC 8V, respectively). In contrast, the absence of an external electrical bias resulted in an increase in the energy cost of the process (EEO,PFOA 66 kWh m−3). The EEO,PFOA for H2O2-assisted PEC remained constant at 48 kWh m−3, whereas it increased to 107 kWh m−3 for NaCl-assisted PEC. Similarly, the EEO,PFOA for H2O2-assisted photolysis exhibited no significant variation, remaining at 81 kWh m−3. It should be noted, however, that the overall energy consumption of a degradation process, as well as the energy demand of the components of the system, also depends on the optimization of the reactor design and hydraulic configuration. Further improvements in PEC treatment should focus on system design and optimization to enhance energy efficiency.

4. Conclusions

Photoelectrocatalysis was investigated for the degradation of PFASs in natural groundwater collected from the Veneto Region (Italy), where a well-known wide PFAS contamination is present. A total of nine PFAS compounds, encompassing both long- and short-chain species, were monitored during the process. The overall PFAS removal by PEC was 87%. On average, the degradation kinetics exhibited the following trend: PFOA > PFHpA > PFHxA ≈ PFPeA > PFBA. Among sulfonates, PFOS degraded more rapidly than PFHpS. The concentration profiles over time were explained on the basis of a chain reaction pathway consisting of decarboxylation followed by a stepwise loss of CF2 units, forming shorter-chain intermediates. Degradation of PFOA in ultrapure water demonstrated the formation of shorter-chain species as reaction intermediates, although mass balance suggested that the main degradation pathways may not be adequately captured by the detected TPs. This hypothesis was further supported by the proposed first-order direct model, which predicts an earlier onset and peak of TP formation both for PEC and PL tests.
The influence of the electrical bias in PEC treatment was investigated. As expected, when no external voltage was applied, the cumulative PFAS removal decreased to 83%. Similarly, the application of cell voltages higher than 4 V (6 and 8 V) did not lead to any significant improvement of the reaction kinetic, with the overall PFAS removal being 68% and 83%, respectively. H2O2-assisted PEC and PL tests were also performed to clarify the role of OH radicals. In both cases, the presence of H2O2 did not foster the degradation rate. Instead, the addition of NaCl to groundwater led to a strong inhibition of the PEC process, with the PFAS removal rate dropping to 38%.
From a cost efficiency perspective, PEC demonstrated superior performance compared to PL, with EEO values of 48 kWh·m−3 and 77 kWh·m−3, respectively. Applying electrical bias that was different than 4 V or adding H2O2 or NaCl did not lead to a significant reduction in the energy costs of the PEC and PL processes. Tests performed on an ideal PFOA solution showed that photoelectrocatalysis (EEO = 63 kWh·m−3) is more effective than most advanced oxidation methods documented in previous studies and is comparable to the plasma process (EEO = 125 kWh m−3), electrochemical oxidation (117 kWh m−3), and advanced reduction processes (EEO = 24 kWh m−3). The authors highlight the importance of conducting additional studies employing non-targeted analysis to more comprehensively characterize the initial PFAS content, elucidate reaction mechanisms, and detect possible by-products, especially within complex, real PFAS mixtures. Furthermore, they suggest focusing on reactor design to enhance energy efficiency.

Supplementary Materials

The following supporting information can be downloaded at https://www.mdpi.com/article/10.3390/w17182790/s1, Figure S1: Degradation of PFCAs—including PFOA (a), PFHpA (b), PFHxA (c), PFPeA (d), and PFBA (e)—by PEC treatment, both without applied electrical bias and under external voltages of 4 V, 6 V, and 8 V. Groundwater collected from well 1*; Figure S2: Degradation of PFSAs species, namely PFOS (a), PFHpS (b), PFHxS (c) and PFBS (d) by PEC in absence of electrical bias and applying an external voltage of 4 V, 6 V and 8 V. Groundwater collected from well 1*; Figure S3: Degradation of PFCAs, namely PFOA (a), PFHpA (b), PFHxA (c), PFPeA (d), and PFBA (e) by PL and H2O2-assisted PL. Groundwater collected from well 1; Figure S4: Degradation of PFSAs species, namely PFOS (a), PFHpS (b), PFHxS (c) and PFBS (d) by PL and H2O2 assisted PL. Groundwater collected from well 1; Figure S5: Degradation of PFCAs, namely PFOA (a), PFHpA (b), PFHxA (c), PFPeA (d) and PFBA (e) by PEC, H2O2 assisted PEC and NaCl assisted PEC. Groundwater collected from well 1*; Figure S6: Degradation of PFSAs species, namely PFOS (a), PFHpS (b), PFHxS (c) and PFBS (d) by PEC, H2O2 assisted PEC and NaCl assisted PEC. Groundwater collected from well 1*; Table S1: Main physico-chemical properties of the raw water collected from well 1 (selected parameters); Table S2: List of PFAS compounds found in groundwater samples from two wells in the Veneto region; Table S3: List of the constant terms used in the analytical solutions of the kinetic equations describing the degradation pathway of PFOA and its transformation products. Table S4: First-order kinetic constants in PEC degradation of PFASs in absence of cell voltage and at 4V, 6V and 8V. In some cases, the degradation curve could not be fitted by means of the L.-H. model (/); Table S5: First-order kinetic constants for PFAS degradation via PL and H2O2-assisted PL. In some cases, the degradation curve could not be fitted by means of the L.-H. model (/); Table S6: First-order kinetic constants for PFAS degradation via PEC, H2O2-assisted PEC, and NaCl-assisted PEC. In some cases, the degradation curve could not be fitted by means of the L.-H. model (/).

Author Contributions

Conceptualization, G.M. and S.F.; methodology, G.M. and S.F.; software, A.P.T.; validation, A.P.T., S.M., C.D.C. and A.L.H.; formal analysis, A.P.T. and M.B.; investigation, G.M. and S.F.; resources, S.F., G.M. and M.C.; data curation, A.P.T.; writing—original draft preparation, A.P.T.; writing—review and editing, S.F., G.M. and M.B.; visualization, A.P.T.; supervision, S.F., G.M. and M.B.; project administration, S.F.; funding acquisition, S.F. and G.M. All authors have read and agreed to the published version of the manuscript.

Funding

This research received no external funding.

Data Availability Statement

The original contributions presented in this study are included in the article/Supplementary Materials. Further inquiries can be directed to the corresponding author.

Conflicts of Interest

Author M. Carmagnani was employed by the company Acque Veronesi S.c.a.r.l. The remaining authors declare that the research was conducted in the absence of any commercial or financial relationships that could be construed as a potential conflict of interest.

References

  1. Schymanski, E.L.; Zhang, J.; Thiessen, P.A.; Chirsir, P.; Kondic, T.; Bolton, E.E. Per- and Polyfluoroalkyl Substances (PFAS) in PubChem: 7 Million and Growing. Environ. Sci. Technol. 2023, 57, 16918–16928. [Google Scholar] [CrossRef]
  2. Bentel, M.J.; Yu, Y.; Xu, L.; Li, Z.; Wong, B.M.; Men, Y.; Liu, J. Defluorination of Per- and Polyfluoroalkyl Substances (PFASs) with Hydrated Electrons: Structural Dependence and Implications to PFAS Remediation and Management. Environ. Sci. Technol. 2019, 53, 3718–3728. [Google Scholar] [CrossRef]
  3. Xiao, F.; Sasi, P.C.; Yao, B.; Kubátová, A.; Golovko, S.A.; Golovko, M.Y.; Soli, D. Thermal Stability and Decomposition of Perfluoroalkyl Substances on Spent Granular Activated Carbon. Environ. Sci. Technol. Lett 2020, 7, 343–350. [Google Scholar] [CrossRef]
  4. Gaines, L.G.T. Historical and Current Usage of Per- and Polyfluoroalkyl Substances (PFAS): A Literature Review. Am. J. Ind. Med. 2022, 66, 353–378. [Google Scholar] [CrossRef]
  5. Brunn, H.; Arnold, G.; Körner, W.; Rippen, G.; Steinhäuser, K.G.; Valentin, I. PFAS: Forever Chemicals—Persistent, Bioaccumulative and Mobile. Reviewing the Status and the Need for Their Phase out and Remediation of Contaminated Sites. Environ. Sci. Eur. 2023, 35, 20. [Google Scholar] [CrossRef]
  6. World Health Organization; Regional Office for Europe. Keeping Our Water Clean: The Case of Water Contamination in the Veneto Region, Italy; WHO: Geneva, Switzerland, 2017. [Google Scholar]
  7. Agency for Toxic Substances and Disease Registry (ATSDR). Toxicological Profile for Perfluoroalkyls; Federal Register: Washington, DC, USA, 2021. [Google Scholar]
  8. Post, G.B.; Cohn, P.D.; Cooper, K.R. Perfluorooctanoic Acid (PFOA), an Emerging Drinking Water Contaminant: A Critical Review of Recent Literature. Environ. Res. 2012, 116, 93–117. [Google Scholar] [CrossRef] [PubMed]
  9. Reducing PFAS in Drinking Water with Treatment Technologies|US EPA. Available online: https://www.epa.gov/sciencematters/reducing-pfas-drinking-water-treatment-technologies (accessed on 17 May 2023).
  10. Rahman, M.F.; Peldszus, S.; Anderson, W.B. Behaviour and Fate of Perfluoroalkyl and Polyfluoroalkyl Substances (PFASs) in Drinking Water Treatment: A Review. Water Res. 2014, 50, 318–340. [Google Scholar] [CrossRef] [PubMed]
  11. Gagliano, E.; Falciglia, P.P.; Zaker, Y.; Birben, N.C.; Karanfil, T.; Roccaro, P. State of the Research on Regeneration and Reactivation Techniques for Per- and Polyfluoroalkyl Substances (PFAS)-Laden Granular Activated Carbons (GACs). Curr. Opin. Chem. Eng. 2023, 42, 100955. [Google Scholar] [CrossRef]
  12. Vakili, M.; Cagnetta, G.; Deng, S.; Wang, W.; Gholami, Z.; Gholami, F.; Dastyar, W.; Mojiri, A.; Blaney, L. Regeneration of Exhausted Adsorbents after PFAS Adsorption: A Critical Review. J. Hazard. Mater. 2024, 471, 134429. [Google Scholar] [CrossRef] [PubMed]
  13. Deng, Y.; Zhao, R. Advanced Oxidation Processes (AOPs) in Wastewater Treatment. Curr. Pollut. Rep. 2015, 1, 167–176. [Google Scholar] [CrossRef]
  14. Gar Alalm, M.; Boffito, D.C. Mechanisms and Pathways of PFAS Degradation by Advanced Oxidation and Reduction Processes: A Critical Review. Chem. Eng. J. 2022, 450, 138352. [Google Scholar] [CrossRef]
  15. James Wood, R.; Sidnell, T.; Ross, I.; McDonough, J.; Lee, J.; Bussemaker, M.J. Ultrasonic Degradation of Perfluorooctane Sulfonic Acid (PFOS) Correlated with Sonochemical and Sonoluminescence Characterisation. Ultrason. Sonochem. 2020, 68, 105196. [Google Scholar] [CrossRef]
  16. Garcia-Segura, S.; Arotiba, O.A.; Brillas, E. The Pathway towards Photoelectrocatalytic Water Disinfection: Review and Prospects of a Powerful Sustainable Tool. Catalysts 2021, 11, 921. [Google Scholar] [CrossRef]
  17. Murgolo, S.; Franz, S.; Arab, H.; Bestetti, M.; Falletta, E.; Mascolo, G. Degradation of Emerging Organic Pollutants in Wastewater Effluents by Electrochemical Photocatalysis on Nanostructured TiO2 Meshes. Water Res. 2019, 164, 114920. [Google Scholar] [CrossRef] [PubMed]
  18. Collivignarelli, M.C.; Abbà, A.; Carnevale Miino, M.; Arab, H.; Bestetti, M.; Franz, S. Decolorization and Biodegradability of a Real Pharmaceutical Wastewater Treated by H2O2-Assisted Photoelectrocatalysis on TiO2 Meshes. J. Hazard. Mater. 2020, 387, 121668. [Google Scholar] [CrossRef] [PubMed]
  19. Li, Z.; Li, S.; Tang, Y.; Li, X.; Wang, J.; Li, L. Highly Efficient Degradation of Perfluorooctanoic Acid: An Integrated Photo-Electrocatalytic Ozonation and Mechanism Study. Chem. Eng. J. 2020, 391, 123533. [Google Scholar] [CrossRef]
  20. Zhou, Y.; Lee, Y.; Ren, Y.; Cui, M.; Khim, J. Quantification of Perfluorooctanoic Acid Decomposition Mechanism Applying Negative Voltage to Anode during Photoelectrochemical Process. Chemosphere 2021, 284, 131311. [Google Scholar] [CrossRef]
  21. Zhang, D.; Zhang, W.; Zhang, J.; Dong, L.; Chen, X.; Guan, Y.; Wang, Z.; Li, Y. Flower-like CN Layer-Doped WO3/W Photoanode as an Efficient Sun-Light Photoelectrocatalyst for PFOA Degradation and Electricity Generation. Chem. Eng. J. 2024, 480, 147910. [Google Scholar] [CrossRef]
  22. Thind, S.S.; Ryane, B.A.; Hayden, J.B.; Chagunda, I.; Paul, M.; Hayden, J.A.; Scott McIndoe, J. Bias Enhanced Electro-Photocatalysis on TiO2 Nanoporous Materials for Decomposition of Forever Chemicals in Saltwater. Environ. Sci. Adv. 2024, 4, 1024–1034. [Google Scholar] [CrossRef]
  23. Zhang, D.; Li, Y.; Chen, X.; Li, C.; Dong, L.; Wang, Z. Wide Spectra-Responsive Polypyrrole-Ag3PO4/BiPO4 Co-Coupled TiO2 Nanotube Arrays for Intensified Photoelectrocatalysis Degradation of PFOA. Sep. Purif. Technol. 2022, 287, 120521. [Google Scholar] [CrossRef]
  24. Peng, Y.P.; Chen, H.; Huang, C.P. The Synergistic Effect of Photoelectrochemical (PEC) Reactions Exemplified by Concurrent Perfluorooctanoic Acid (PFOA) Degradation and Hydrogen Generation over Carbon and Nitrogen Codoped TiO2 Nanotube Arrays (C-N-TNTAs) Photoelectrode. Appl. Catal. B 2017, 209, 437–446. [Google Scholar] [CrossRef]
  25. Tucci, A.P.; Murgolo, S.; De Ceglie, C.; Mascolo, G.; Carmagnani, M.; Ronco, P.; Bestetti, M.; Franz, S. Photoelectrocatalytic Advanced Oxidation of Perfluoroalkyl Substances in Groundwaters of the Veneto Region, Italy. Catal. Today 2025, 450, 115205. [Google Scholar] [CrossRef]
  26. Verma, S.; Mezgebe, B.; Hejase, C.A.; Sahle-Demessie, E.; Nadagouda, M.N. Photodegradation and Photocatalysis of Per- and Polyfluoroalkyl Substances (PFAS): A Review of Recent Progress. Next Mater. 2024, 2, 100077. [Google Scholar] [CrossRef] [PubMed]
  27. Baxendale, J.H.; Wilson, J.A. The Photolysis of Hydrogen Peroxide at High Light Intensities. Trans. Faraday Soc. 1957, 53, 344–356. [Google Scholar] [CrossRef]
  28. da Rosa, A.P.P.; Cavalcante, R.P.; da Silva, D.A.; da Silva, L.d.M.; da Silva, T.F.; Gozzi, F.; McGlynn, E.; Brady-Boyd, A.; Casagrande, G.A.; Wender, H.; et al. H2O2-Assisted Photoelectrocatalytic Degradation of Mitoxantrone Using CuO Nanostructured Films: Identification of by-Products and Toxicity. Sci. Total Environ. 2019, 651, 2845–2856. [Google Scholar] [CrossRef]
  29. Chen, G. Electrochemical Technologies in Wastewater Treatment. Sep. Purif. Technol. 2004, 38, 11–41. [Google Scholar] [CrossRef]
  30. Yin, H.; Zhang, Q.; Su, Y.; Tang, Y.; Zhou, M. A Novel UV Based Advanced Oxidation Process with Electrochemical Co-Generation of Chlorine and H2O2 for Carbamazepine Abatement: Better Performance, Lower Energy Consumption and Less DBPs Formation. Chem. Eng. J. 2021, 425, 131857. [Google Scholar] [CrossRef]
  31. Zainal, Z.; Lee, C.Y.; Hussein, M.Z.; Kassim, A.; Yusof, N.A. Effect of Supporting Electrolytes in Electrochemically-Assisted Photodegradation of an Azo Dye. J. Photochem. Photobiol. A Chem. 2005, 172, 316–321. [Google Scholar] [CrossRef]
  32. Yang, J.S.; Lai, W.W.P.; Panchangam, S.C.; Lin, A.Y.C. Photoelectrochemical Degradation of Perfluorooctanoic Acid (PFOA) with GOP25/FTO Anodes: Intermediates and Reaction Pathways. J. Hazard. Mater. 2020, 391, 122247. [Google Scholar] [CrossRef]
  33. Franz, S.; Arab, H.; Lucotti, A.; Castiglioni, C.; Vicenzo, A.; Morini, F.; Bestetti, M. Exploiting Direct Current Plasma Electrolytic Oxidation to Boost Photoelectrocatalysis. Catalysts 2020, 10, 325. [Google Scholar] [CrossRef]
  34. Jing, C.; Zhang, P.-Y.; Liu, J. Photodegradation of Perfluorooctanoic Acid by 185 Nm Vacuum Ultraviolet Light. J. Environ. Sci. 2007, 19, 387–390. [Google Scholar] [CrossRef]
  35. Giri, R.R.; Ozaki, H.; Okada, T.; Taniguchi, S.; Takanami, R. Factors Influencing UV Photodecomposition of Perfluorooctanoic Acid in Water. Chem. Eng. J. 2012, 180, 197–203. [Google Scholar] [CrossRef]
  36. Park, K.; Ali, I.; Kim, J.O. Photodegradation of Perfluorooctanoic Acid by Graphene Oxide-Deposited TiO2 Nanotube Arrays in Aqueous Phase. J Environ. Manag. 2018, 218, 333–339. [Google Scholar] [CrossRef]
  37. Liang, R.; Li, S.; Zhang, X.; Hu, Z.; Wu, H.; Sun, J.; Song, G.; Liu, J.; Chai, Y.; Sirés, I.; et al. Highly Efficient Singlet Oxygen Production in a Cascade Photoelectrocatalytic System for Water Decontamination. Angew. Chem. Int. Ed. 2025, 2025, e202508548. [Google Scholar] [CrossRef]
  38. Javed, H.; Lyu, C.; Sun, R.; Zhang, D.; Alvarez, P.J.J. Discerning the Inefficacy of Hydroxyl Radicals during Perfluorooctanoic Acid Degradation. Chemosphere 2020, 247, 125883. [Google Scholar] [CrossRef] [PubMed]
  39. Xu, X.; Li, Y.; Vo, P.H.N.; Shukla, P.; Ge, L.; Zhao, C.X. Electrochemical Advanced Oxidation of Per- and Polyfluoroalkyl Substances (PFASs): Development, Challenges and Perspectives. Chem. Eng. J. 2024, 500, 157222. [Google Scholar] [CrossRef]
  40. Shi, H.; Wang, Y.; Li, C.; Pierce, R.; Gao, S.; Huang, Q. Degraation of Perfluorooctanesulfonate by Reactive Electrochemical Membrane Compose of Magnéli Phase Titanium Suboxie. Environ. Sci. Technol. 2019, 53, 14528–14537. [Google Scholar] [CrossRef] [PubMed]
  41. Wang, L.; Lu, J.; Li, L.; Wang, Y.; Huang, Q. Effects of Chloride on Electrochemical Degradation of Perfluorooctanesulfonate by Magnéli Phase Ti4O7 and Boron Doped Diamond Anodes. Water Res. 2020, 170, 115254. [Google Scholar] [CrossRef]
  42. Nzeribe, B.N.; Crimi, M.; Mededovic Thagard, S.; Holsen, T.M. Physico-Chemical Processes for the Treatment of Per- And Polyfluoroalkyl Substances (PFAS): A Review. Crit. Rev. Environ. Sci. Technol. 2019, 49, 866–915. [Google Scholar] [CrossRef]
  43. Papalexopoulou, K.; Huang, X.; Ronen, A.; Aggelopoulos, C.A. Reactive Species and Mechanisms of Perfluorooctanoic Acid (PFOA) Degradation in Water by Cold Plasma: The Role of HV Waveform, Reactor Design, Water Matrix and Plasma Gas. Sep. Purif. Technol. 2024, 342, 126955. [Google Scholar] [CrossRef]
  44. Lou, Z.; Wang, J.; Wang, S.; Xu, Y.; Wang, J.; Liu, B.; Yu, C.; Yu, J. Strong Hydrophobic Affinity and Enhanced •OH Generation Boost Energy-Efficient Electrochemical Destruction of Perfluorooctanoic Acid on Robust Ceramic/PbO2-PTFE Anode. Sep. Purif. Technol. 2022, 280, 119919. [Google Scholar] [CrossRef]
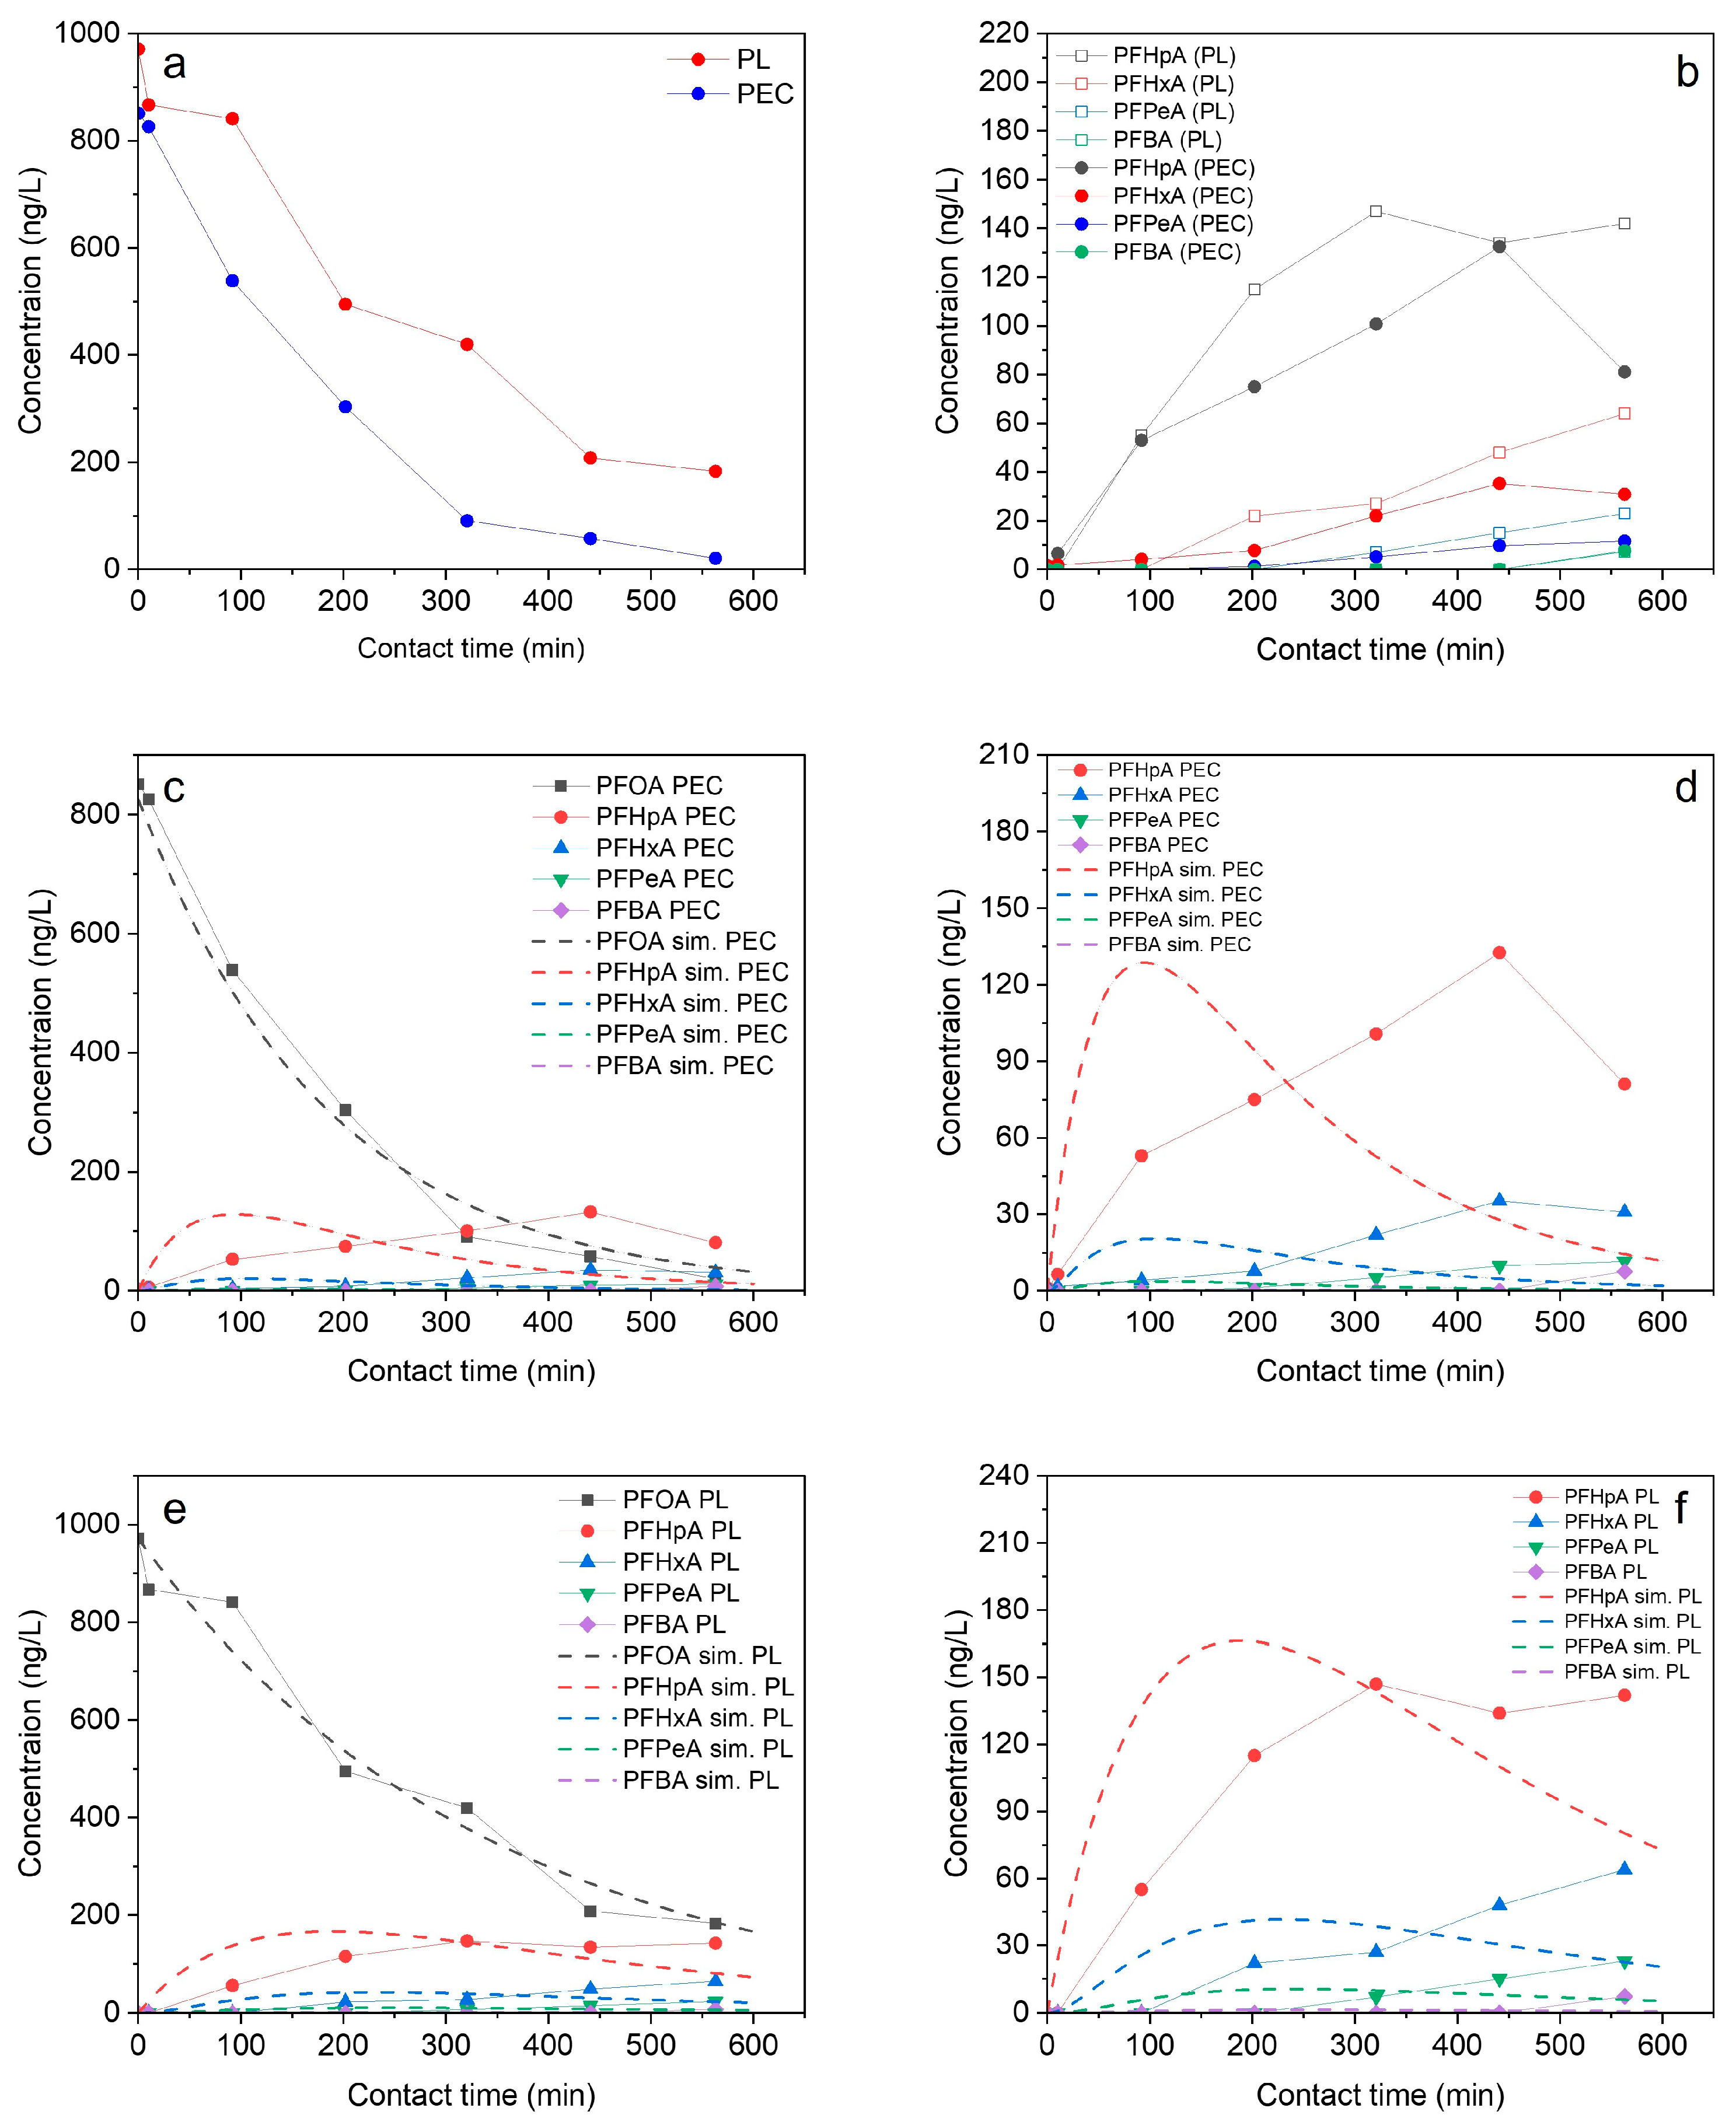
Figure 1. PFOA concentration over time (a) and concentration profile of oxidation by-products, namely PFHpA, PFHxA, PFPeA, and PFBA (b), during PEC and PL tests in ultrapure water. Experimental and modeled concentrations profiles for PFOA and TPs during PEC (c) and PL (e) processes. An enlarged view of the TP concentration profiles is also reported for PEC (d) and PL (f) tests, respectively.
Water 17 02790 g001
Figure 2. Linear scan polarization of the TiO2 mesh at a scan rate of 10 mV/s in 4 mM KCl (light on: dashed line; light off: dotted line; photocurrent: continuous line). Photocurrent values during PEC treatment of groundwater at 4, 6, and 8 V cell voltage (red full symbols). A scheme representing the current behavior depending on irradiation condition is also reported in the inset.
Water 17 02790 g002
Figure 3. Degradation of PFASs in groundwater of well 1* by PEC in the absence of electrical bias (a) and after applying an external voltage of 4 V (b), 6 V (c), and 8 V (d).
Water 17 02790 g003
Figure 4. Total concentration of PFASs plotted against contact time (a); percentage of PFASs removed after 600 min of contact during PEC experiments conducted without an electrical bias (no bias) and under applied voltages of 4 V (PEC 4V), 6 V (PEC 6V), and 8 V (PEC 8V) (b). Groundwater collected from well 1*.
Water 17 02790 g004
Figure 5. Degradation of PFASs in groundwater under PL (a) and PL + H2O2 (b); total PFAS concentrations over time for both treatments (c) and the respective removal percentages achieved at the end of the process (d). Groundwater collected from well 1.
Water 17 02790 g005
Figure 6. Degradation of PFASs in groundwater under PEC (a) and PEC + H2O2 (b); total PFAS concentrations over time for both treatments (c) and the respective removal percentages achieved at the end of the process (d). Groundwater collected from well 1*.
Water 17 02790 g006
Figure 7. Degradation of PFASs in groundwater under PEC (a) and NaCl-assisted PEC (b); total PFAS concentrations over time for both treatments (c) and the respective removal percentages achieved at the end of the process (d). Groundwater collected from well 1*.
Water 17 02790 g007
Figure 8. EEO values for individual PFAS compounds in photolysis (PL) and photoelectrocatalysis (PEC) tests using groundwater samples from well 1 (a) and well 1* (b). EEO values for PFOA in PL and PEC tests conducted in this study (wells 1, 1*, and deionized water) compared with those reported for other advanced oxidation processes in the literature (c).
Water 17 02790 g008
Disclaimer/Publisher’s Note: The statements, opinions and data contained in all publications are solely those of the individual author(s) and contributor(s) and not of MDPI and/or the editor(s). MDPI and/or the editor(s) disclaim responsibility for any injury to people or property resulting from any ideas, methods, instructions or products referred to in the content.