Article

Integrating Microbial Source Tracking to Unravel Impacts of Wastewater Discharge on Spatial Distribution of Riverine Microbial Community

1
School of Life Sciences and Engineering, Henan University of Urban Construction, Pingdingshan 467036, China
2
Henan Key Laboratory of Water Pollution Control and Rehabilitation Technology, Henan International Joint Laboratory of Green Low Carbon Water Treatment Technology and Water Resources Utilization, School of Municipal and Environmental Engineering, Henan University of Urban Construction, Pingdingshan 467036, China
*
Author to whom correspondence should be addressed.
Water 2025, 17(18), 2753; https://doi.org/10.3390/w17182753
Submission received: 12 July 2025 / Revised: 10 September 2025 / Accepted: 15 September 2025 / Published: 17 September 2025
(This article belongs to the Special Issue Freshwater Ecosystems—Biodiversity and Protection: 2nd Edition)

Abstract

Microbial communities play a pivotal role in material cycling, energy flow, and pollutant degradation within river ecosystems. Thus, gaining a clear understanding of how wastewater discharge affects microbial community structure and function is essential for the protection and management of the surface water environment. In this study, a total of 9 samples were collected from the Sha River in March 2024. Subsequently, 16S rRNA sequencing technology combined with investigation of physicochemical properties of water was used to investigate the compositional diversity, spatial distribution, and explore the environmental effects of wastewater discharged on microorganisms. The sequencing results of species at the phylum level revealed that the dominant microbial phyla in the Sha River were primarily Proteobacteria (55.4%), Actinobacteriota (24.0%), Bacteroidota (14.3%), and Verrucomicrobiota (2.6%). The most dominant phylum, Proteobacteria, exhibited varying abundances across different sampling sites in the Sha River basin, with the highest abundances observed at Sites S2, S4, S5, and S6. This is mainly due to the fact that the upstream areas of Sites S2, S4, S5, and S6 are characterized by high concentrations of COD and NH3-N, which are caused by wastewater discharge. Quantitative analysis was also conducted using the Source Tracker model; the results showed that S2 (36.7%) and S4 (31.3%) in the upper reaches of the Sha River are the primary contributors to the microbial community in the downstream catchment area (S6). The study found that the impact of wastewater discharge on the microbial community in the downstream water body exhibits a “longitudinal persistence of microbial signatures” even though the physicochemical pollution indicators of the water body have decreased. These findings of this study represent the application in microbial source tracking in the upstream and downstream sections of rivers, providing strong support for formulating more effective environmental protection strategies in the Sha River basin.

1. Introduction

With the acceleration of urbanization and the rapid population growth, the daily treatment capacity and load of wastewater treatment plants have gradually increased [1,2]. This has led to the direct discharge of effluents from wastewater treatment plants into the aquatic environment, thereby increasing the load on the environmental capacity of river water systems [3]. Although wastewater treatment plants discharge effluents that meet the standard after certain treatments, the discharge of wastewater from these plants still exerts an impact on the structure and function of the receiving aquatic ecosystems [4,5,6].
Microbial communities play a crucial role in material cycling, energy flow, and pollutant degradation within river ecosystems. To adapt to different living environments, microorganisms typically form specific community structures to cope with environmental disturbances. Different reaches of urban rivers are located in watersheds with distinct land use patterns, leading to variations in the composition of microorganisms entering the water from terrestrial sources [7]. Meanwhile, untreated or incompletely treated domestic sewage, industrial wastewater, and farmland drainage from human activities introduce substantial nutrients and pollutants into urban rivers [4,8,9]. Differences in the types and concentrations of these nutrients and pollutants result in variations in the physicochemical properties of water across different rivers, thereby affecting the quantity and community structure of microorganisms in rivers [5,10], which may further impact the microbial ecological functions [11,12]. Therefore, the microbial biomass and community structure in river are important indicators of environmental changes and succession in urban river ecosystems, and their spatial distribution characteristics are of great significance for assessing the ecological functions and health status of urban river ecosystems [13].
Microorganisms are groups in the ecological environment that are highly sensitive to water quality [14]. Thus, microbial communities are widely used as indicators of water environment quality [15]. With the advent of the big data era, microbial sequencing technology and computer technology have developed rapidly, and more and more studies have chosen to use microbial community structure to identify the impact of pollution sources. Over the years, a number of microbial source tracking (MST) methods have been developed with the aim of determining the source–sink relationships of microorganic contaminants in environmental settings [16,17,18]. Among them, the methods mainly include the Bayesian Source Tracker model and the expectation-maximization-based FEAST model [19,20]. Source Tracker model exhibits good applicability to a small number of pollution sources, whereas the FEAST model is suitable for estimating the contribution ratios of up to thousands of potential pollution sources to a single sample [21,22].
The Sha River, one of the largest tributaries of the Huai River, originates from Yaoshan Mountain in Lushan County, Henan Province, flows through the Beiwudu area of Luohe City, and finally merges into the Sha-Ying River in Zhoukou City. The Sha River has a major tributary, the Beiru River, which originates from Songxian County, Henan Province. As the most important tributary in the upper reaches of the Huaihe River, the Sha River’s pollution load has a significant impact on the water quality of the Huaihe River. Meanwhile, the Sha River serves as a crucial water source for Pingdingshan, Luohe, and Zhoukou cities, making the water quality, safety, and ecological health of the river extremely important. Currently, research conducted in the Sha River basin mainly focuses on risk assessments of heavy metals in water and sediments [23], pollution assessments of organic pollutants in water [24], and vulnerability assessments of nitrate in groundwater within the basin [25]. However, there is little research on the impact of urban wastewater treatment plant discharges on the river, particularly the influence of sewage discharge on microorganisms in the river. In addition, most of those studies were on a certain section; there are limited studies at the basin scale, and the distribution characteristics and mechanism of microorganisms in Sha River Basin are still unclear.
In this study, 16S rRNA sequencing technology, coupled with the determination of water physicochemical properties, was employed to investigate the compositional diversity and spatial distribution of microorganisms in the Sha River, as well as to explore the environmental effects of wastewater discharge on these microorganisms. Additionally, quantitative analysis was performed using the Source Tracker model to clarify the contribution of upstream wastewater discharge to microbial communities in downstream water. The purpose of this study is therefore to (1) Investigate the compositional diversity, spatial distribution, and functional potential of microbial communities in the Sha River; (2) Comprehensively explore the environmental effects of wastewater discharged from wastewater treatment plants on river microorganisms by integrating microbial community data, physicochemical properties of river water, and environmental factors; (3) Further quantitatively clarify the contribution of upstream wastewater discharge to microbial communities in downstream water. This study aims to provide a scientific basis and data support for the systematic evaluation of the effects of wastewater treatment plants on the aquatic ecosystems of receiving rivers.

2. Materials and Methods

2.1. Collection of Samples

Field investigations and sampling were conducted in Sha River basin in March 2024 (Figure 1). The study area, situated at 33°77′ N~33°63′ N, 112°28′ E~114°61′ E, is in southwestern Henan Province, upstream of the Huai River Basin. The mean annual discharge of the Sha River is 770 million cubic meters. The area falls within the temperate continental monsoon climate zone, characterized by distinct dry and wet seasons. The average annual temperature is 14.9 °C, ranging from a minimum of 1.2 °C in January to a maximum of 27.6 °C in August. Annual rainfall varies between 373.9 and 1361.9 mm, with 70–80% occurring between June and September (data from http://www.weather.com.cn/, accessed on 2 July 2025). The predominant soil types are deep-layered alluvial soils, primarily silty loam in texture.
In the study area, currently, the tailwater of wastewater treatment plants from four cities is directly discharged into the Sha River or its tributaries. There are Lushan County Wastewater Treatment Plants (the treatment technology used Orbal oxidation ditch combined with advanced treatment, and with a treatment scale of 30,000 cubic meters per day), Baofeng County Wastewater Treatment Plants (the treatment technology used A2O, with a treatment scale of 50,000 cubic meters per day), Pingdingshan city Wastewater Treatment Plants (the treatment technology used Orbal and Carrousel oxidation ditch combined with advanced treatment, three Wastewater Treatment Plants with a total treatment scale of 420,000 cubic meters per day), and Ye County Wastewater Treatment Plants (the treatment technology used Orbal and Carrousel oxidation ditch combined with advanced treatment, two Wastewater Treatment Plants with a treatment scale of 80,000 cubic meters per day) (Figure 1). The effluent water quality of these four wastewater treatment plants all meets the Grade A standard of the “Discharge Standard of Pollutants for Municipal Wastewater Treatment Plants (GB18918-2002)” [26].
In this study, 9 sampling sites were selected in the Sha River for water sampling by comprehensively considering factors such as wastewater treatment plants and their outfalls, large-scale farms, river confluences, and densely populated urban areas (Figure 1). S1 is located upstream of the wastewater outlet in Lushan County, within the water source protection area; S2 is situated at the river entry wastewater outlet in Baofeng County, with large-scale farms upstream; S3, where there are no large-scale wastewater outlets, is in the transition zone; S4 is the wastewater treatment and discharge section in Pingdingshan City; S5 is the confluence of the Sha River and the Beiru River; S6 is downstream of the confluence; S7 is near the urban area of Luohe City; S8 is between Luohe City and Zhoukou City; and S9 is close to the urban area of Zhoukou City.
The surface water samples were collected from the flowing water body near the midstream line of the river, approximately 0.5 m below the water surface. Then they were brought back to the laboratory in two 1000 mL polyethylene bottles for each sample and stored at 4 °C away from light for subsequent laboratory analysis and Physicochemical analysis.

2.2. Laboratory Analyses

Physicochemical analysis was conducted for all water samples in triplicate. Total dissolved solids (TDS), Electrical Conductivity (EC), pH, water temperature (T) and redox potential (ORP) of water were measured in situ using a portable meter (Kedida CT6021A, Shenzhen, China) and (Hanna HI98130, Padua, Italy). Physicochemical parameters, including total nitrogen (TN), Dissolved Oxygen (DO, only for water), ammonium-nitrogen (NH3-N), total phosphorus (TP), Chemical Oxygen Demand (COD), were analyzed for each water sample. Details of the measurement methods were according to standard methods recommended by the Ministry of Ecology and Environment of China [27]. The relative deviation of duplicate test results of ammonium-nitrogen (NH3-N), total phosphorus (TP), Chemical Oxygen Demand (COD) was within ±10%. The detection limits of total nitrogen (TN), ammonia nitrogen (NH3-N), total phosphorus (TP), and chemical oxygen demand (COD) were 0.05 mg/L, 0.02 mg/L, 0.01 mg/L, and 5.0 mg/L, respectively. The certified reference materials used for total nitrogen (TN), ammonia nitrogen (NH3-N), total phosphorus (TP), and chemical oxygen demand (COD) testing were glycine standard working solution and nitrate nitrogen standard working solution, ammonia nitrogen standard working solution, phosphorus standard stock solution (potassium dihydrogen phosphate) and COD standard stock solution, respectively.
Microbial genomic DNA was extracted from 1 L of water samples through a 0.22 μm millipore filter. Total genomic DNA from samples was extracted using CTAB method. DNA concentration and purity were monitored on 1% agarose gels. According to the concentration, DNA was diluted to 1 ng/µL using sterile water. 16S rRNA genes of distinct regions (16S V3–V4) were amplified using specific primers with the barcode. All PCR reactions were carried out with 15 µL of Phusion® High-Fidelity PCR Master Mix (New England Biolabs, Ipswich, MA, USA); 2 µM of forward and reverse primers, and about 10 ng template DNA. Thermal cycling consisted of initial denaturation at 98 °C for 1 min, followed by 30 cycles of denaturation at 98 °C for 10 s, annealing at 50 °C for 30 s, and elongation at 72 °C for 30 s. Finally, 72 °C for 5 min. Mix same volume of 1XTAE buffer with PCR products and operate electrophoresis on 2% agarose gel for detection. PCR products were mixed in equidensity ratios. Then, mixture of PCR products was purified with Universal DNA (TianGen, Beijing, China). Sequencing libraries were generated using NEB Next® Ultra DNA Library Prep Kit (Illumina, San Diego, CA, USA) following manufacturer’s recommendations, and index codes were added. The library quality was assessed on the Agilent 5400 (Agilent Technologies Co., Ltd., Santa Clara, CA, USA). At last, the library was sequenced on an Illumina platform, and 250 bp paired-end reads were generated.
The analysis was conducted by following the “Atacama soil microbiome tutorial” of Qiime2docs along with customized program scripts (https://docs.qiime2.org/2019.1/, accessed on 2 July 2025). Briefly, raw data FASTQ files were imported into a format that could be operated by QIIME2 system using qiime tools import program. Demultiplexed sequences from each sample were quality filtered and trimmed, de-noised, merged, and then the chimeric sequences were identified and removed using the QIIME2 dada2 plugin to obtain the feature table of amplicon sequence variant (ASV) [28]. The QIIME2 feature-classifier plugin was then used to align ASV sequences to a pre-trained SILVA database to generate the taxonomy table [29]. Any contaminating mitochondrial and chloroplast sequences were filtered using the QIIME2 feature-table plugin.
The methods include ANOVA, Kruskal–Wallis, LEfSe, which were employed to identify the microorganism with different abundance among samples and groups [30,31]. Diversity metrics were calculated using the core-diversity plugin within QIIME2. Feature-level alpha diversity indices, such as observed OTUs, Chao richness estimator, Shannon diversity index, Simpson diversity index and Pielou evenness metrics were calculated to estimate the microbial diversity within an individual sample. Specifically, the Observed OTUs can directly quantify the number of operational taxonomic units (OTUs) actually detected in a sample, and serve as a fundamental indicator for measuring OTU richness. The Shannon diversity index, on the other hand, comprehensively considers both the total number of OTUs in the sample and the relative abundance of each OTU. It also integrates the sensitivity of the Simpson diversity index to changes in the abundance of dominant species and the evaluation of species distribution equity by the Pielou Evenness Metrics, ultimately reflecting the richness and evenness of the microbial community in a comprehensive manner. Meanwhile, the Chao Richness estimator infers the total species richness of microorganisms in the sample based on the abundance data of rare OTUs in the sample [32]. Beta diversity distance measurements (Bray–Curtis) were performed to investigate the structural variation in microbial communities across samples and then visualized via nonmetric multidimensional scaling (NMDS) [32]. Redundancy analysis (RDA) was performed to reveal the association of microbial communities in relation to environmental factors based on relative abundances of microbial species at different taxonomic levels using the R package “vegan” (Version 2.2-1) [33,34]. The data that support the findings of this study have been deposited into CNGBdb-CNSA with accession number CNP0007927.

2.3. Source Tracker Model

For microbial traceability, Source Tracker model (version 1.0) was employed to estimate the contribution of sources in our study. This software was developed through a collaboration between Professor Scott at the University of San Diego and the Rob Knight team [35]. In this software framework, the target sample is defined as the sink, while microbial contamination sources or donor samples are designated as sources. Leveraging Bayesian algorithms enables the analysis of microbial contamination sources (sources) within the target sample (sink). By integrating community structure distributions from both source and sink samples, the software predicts the proportional contributions of each source to the sink sample composition.
Source Tracker considers each sink sample x as a set of n sequences mapped to taxa, in which each sequence can be assigned to any one of the source environments v ∈ 1…V}, including an unknown source. These assignments are treated as hidden variables, denoted zi=1n ∈ 1…V}. To perform Gibbs sampling, we initialized z with random source environment assignments and then iteratively reassigned each sequence based on the conditional distribution:
P z i = v z ¬ i , x P x i v × P v x ¬ i = m x i v + α m v + α m v × n v ¬ i + β n 1 + β V
in which mxv is the number of training sequences from taxon x in environment v, nv is the number of test sequences currently assigned to environment v, and ¬i excludes the ith sequence. The first fraction gives the posterior distribution over taxa in the source environment; the second gives the posterior distribution over source environments in the test sample. Both are Dirichlet distributions, and Gibbs sampling allows us to integrate over their uncertainty. The Dirichlet parameters, α and β, act as imaginary prior counts that smooth the distributions for low-coverage source and sink samples, respectively. They also allow unknown source assignments to accumulate when part of a sink sample is unlike any of the known sources. The relative contributions of potential sources to the sink community in this study were quantified using Source Tracker implemented on the Wekemo Bioincloud platform (https://www.bioincloud.tech, accessed on 6 July 2025) [36]. A total of 1000 Gibbs sampling iterations were performed with all other parameters maintained at their default values.

3. Results and Discussion

3.1. Physicochemical Properties

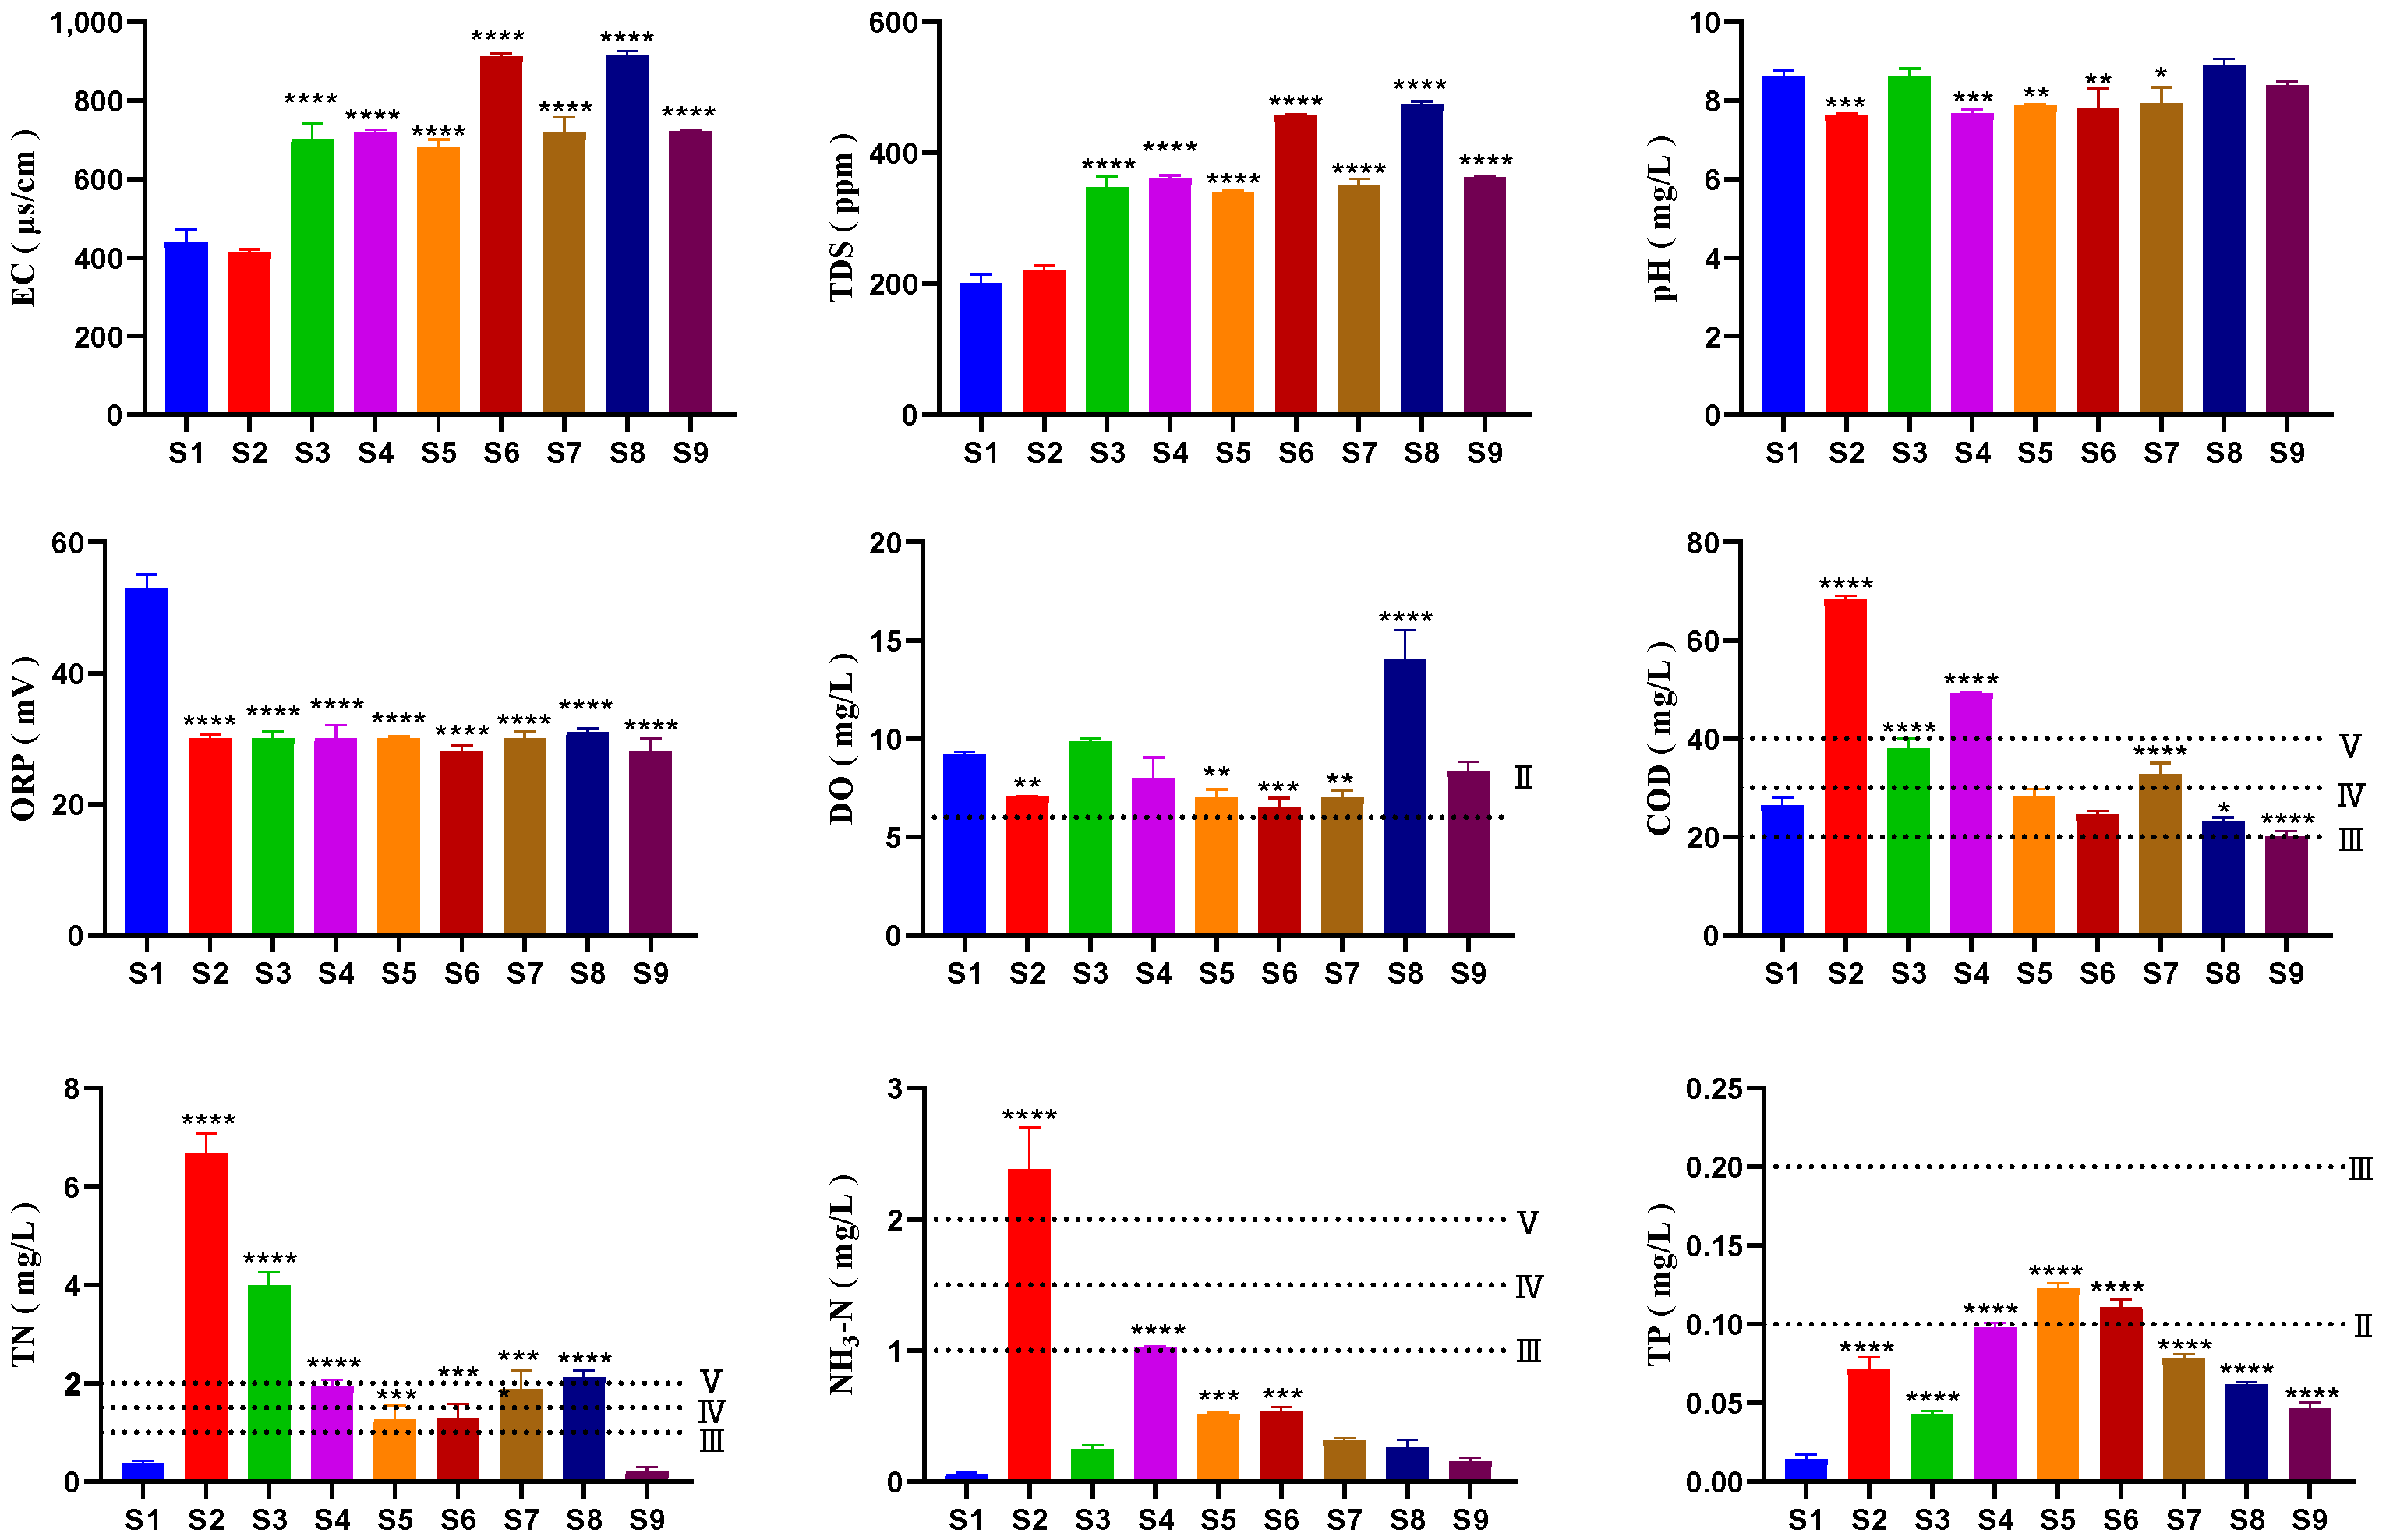
The spatial distribution of in situ physicochemical parameters of the water samples, including Electrical Conductivity (EC), Total Dissolved Solids (TDS), pH, Dissolved Oxygen (DO), and Oxidation–Reduction Potential (ORP), is shown in Table 1 and Figure 2. The EC ranges from 414 μS/cm to 913 μS/cm, with the highest value at site S8 and the lowest at site S2. The variation pattern of TDS is basically consistent with that of EC, with a range of 201.0–474.0 mg/L. The pH value ranges from 7.63 to 8.90, indicating that the overall water quality is weakly alkaline, with the highest value observed at site S8 and the lowest at site S2. the DO ranges from 6.49 mg/L to 14.04 mg/L, with the highest value at site S8 and the lowest at site S6, which may be attributed to the presence of numerous fish, shrimp, and shellfish carcasses at site S6, where the decomposition of organic matter consumes a large amount of oxygen. The DO content in the study area meets the Class II standard (≥6 mg/L) for the Chinese water quality standards “Environmental quality standards for surface water (GB3838-2002) [37]. The ORP ranges from 28.0 mV to 53.0 mV, indicating that the overall water quality is weakly reductive.
The concentration trends of Ammonia Nitrogen (NH3-N), Chemical Oxygen Demand (COD), and Total Nitrogen (TN) are highly consistent and exhibit good correlations (NH3-N vs. TN: 0.862; COD vs. NH3-N: 0.839; COD vs. TN: 0.657). This consistency may be attributed to the fact that all three indices are associated with organic pollution sources [38]. Analysis of Figure 2 reveals that the concentrations of NH3-N, COD, and TN in the surface water of the Sha River all reach their maximum at Site S2, with values of 2.39 mg/L, 68.34 mg/L, and 6.80 mg/L, respectively. The concentration of total phosphorus (TP) is the highest at Site S5 at 0.12 mg/L. Wastewater generated from human activities often contains large amounts of organic matter, and direct discharge of such wastewater into water bodies without treatment or with substandard treatment can lead to increased COD and TN values. Chemical substances such as fertilizers and pesticides used in agricultural activities may be washed into surface water bodies by rainwater, increasing the concentrations of COD, TN, and NH3-N in the water [39].
Field investigations reveal that site S2 is near the outfall of Baofeng County Wastewater Treatment Plants, and there are some large farms in the vicinity as well. However, site S5 is located at the confluence of the upper Sha River and the Beiru River, where the water flow velocity decreases. These factors may result in the higher pollution levels observed at Sites S2 and S5 compared to other sampling locations.
Among all sampling sites, Site S1 exhibits the best water quality, with the lowest concentrations of NH3-N, TN, and TP. Based on the Chinese water quality standards “Environmental quality standards for surface water (GB3838-2002)”, Sites S2, S3, S4, and S7 have COD concentrations exceeding 30 mg/L, classifying them as inferior Class-V water. Site S2 has an NH3-N concentration exceeding 2.0 mg/L, falling into the category of inferior Class-V water. While Site S4 has an NH3-N concentration exceeding 1.0 mg/L, it belongs to Class-IV water. Sites S2, S3, S4, S7, and S8 have TN concentrations exceeding 1.5 mg/L, being classified as inferior Class-V water. Sites S5 and S6 have TN concentrations exceeding 1.0 mg/L, belonging to Class-IV water. Sites S5 and S6 have TP concentrations exceeding 0.1 mg/L, classified as Class-III water.
Overall, the main pollutants in the surface water of the Sha River are COD, TN, and NH3-N, and the concentrations of physicochemical factors in the upper reaches are significantly higher than those in the lower reaches. This may be attributed to the presence of multiple wastewater treatment plants near the upstream sampling sites, including Lushan County Wastewater Treatment Plant, Baofeng County Wastewater Treatment Plants, Pingdingshan City Wastewater Treatment Plants, resulting in a high proportion of wastewater discharge into the Sha River or its tributaries. However, since the wastewater from Luohe City’s wastewater treatment plants is discharged into the Ying River downstream, there are no large-scale wastewater treatment plants’ effluents in other sections of the Sha River downstream (S7, S8, S9).

3.2. Microbial Community

Table 2 presents the alpha diversity indices for the Sha River water samples. The Chao richness index ranged from 593.68 to 1834.80, indicating substantial variation in microbial richness across sampling sites. The Shannon diversity index values ranged from 6.45 to 8.09, the Simpson index values all exceeded 0.97, and Pielou evenness metrics ranged from 0.66 to 0.75, indicating a high level of microbial diversity. Additionally, all samples exhibited sequencing coverage exceeding 97%, confirming that the detected sequences adequately represented the true microbial community structure in the samples and validating the reliability of subsequent data analyses.
As shown in Figure 3, the explanatory powers of the principal components PC1 and PC2 for species differences were 31% and 16%, respectively. Sites S3 and S8, and Sites S7 and S9, exhibited the shortest distances, indicating that the microbial species composition structures at these pairs of sites were the most similar. Sites S2, S5, and S6 were relatively close to each other, suggesting a relatively similar species composition structure. In contrast, Sites S1 and S4 were each far away from other sites, indicating that their species composition structures had low similarity to those of other sampling sites. The spatial distribution pattern of microbial communities reveals that the structure of microbial communities can be associated with environmental heterogeneity [40].
In this study, high-throughput sequencing technology was employed to analyze the composition of microbial communities in the Sha River. For the bar chart of microbial community composition at the phylum level (Figure 4), only the top 20 dominant communities were selected for visualization.
The sequencing results of species at the phylum level revealed that the dominant microbial phyla in the Sha River were primarily Proteobacteria (55.4%), Actinobacteriota (24.0%), Bacteroidota (14.3%), and Verrucomicrobiota (2.6%).
Among these, the most dominant phylum, Proteobacteria, exhibited varying abundances across different sampling sites in the Sha River basin, with the highest abundances observed at Sites S2, S4, S5, and S6. This is attributed to the association between the abundance of Proteobacteria and high nutrient levels [41]. As indicated by the results of water physicochemical factors in the Sha River basin, as discussed previously, the upstream areas of Sites S2, S4, S5, and S6 are characterized by high concentrations of COD and NH3-N, which is inferred to be closely related to the high abundance of Proteobacteria at these sites. It can be seen from this that the discharge of wastewater from wastewater treatment plants has a significant impact on the distribution of microorganisms in rivers [4].
Bacteroidota, an important microbial group in the human intestinal tract that can also act as pathogenic bacteria [41], showed relatively high abundance in the Sha River surface water. This may be linked to the discharge of incompletely treated fecal wastewater into the river within the basin, reflecting the impact of human activities, such as direct discharge of rural sewage and unregulated discharge of livestock wastewater [39]. Cyanobacteria, a group of prokaryotes with simple cellular structures and unique photosynthetic modes, play a crucial role in aquatic ecosystems due to their strong nitrogen-fixing capacity, which is vital for riverine nutrient cycling [12]. High abundances of Cyanobacteria were detected at Sites S5, S8, and S9. Actinobacteriota are widespread in water bodies, including both freshwater and seawater. They play an important role in water material cycling, such as decomposing organic matter and fixing ammonia [42].
The sequencing results at the genus level in Figure 5 revealed that the dominant bacterial genera of the Sha River are primarily Limnohabitans (20.4%), Planktophila (11.8%), and Nanopelagicus (4.3%). The most dominant genus, Limnohabitans-A, belonging to the class Betaproteobacteria, is a common bacterial group in freshwater environments [14]. It is closely associated with water eutrophication and capable of degrading phenolic compounds [43]. Its highest abundances were observed at Sites S2, S5, and S6, which is consistent with the results of the phylum-level analysis.
Both Planktophila and Nanopelagicus are Actinobacteriota genera widely distributed in freshwater environments, belonging to the phylum Actinobacteriota. These two bacterial genera play important roles in nutrient cycling [44]. Their relatively high abundances at Sites S1, S3, S7, S8, and S9 are consistent with the findings at the phylum level.

3.3. Factors Influencing Microbial Distribution

Water quality is a crucial factor influencing microbial diversity. Meanwhile, the metabolic activities of microorganisms can also exert a certain impact on water quality [4,5]. The two jointly maintain the balance of the ecological environment [7,10]. In this study, Spearman correlation analysis was employed to examine the correlations between dominant microbial phyla and environmental factors in the surface water of the Sha River.
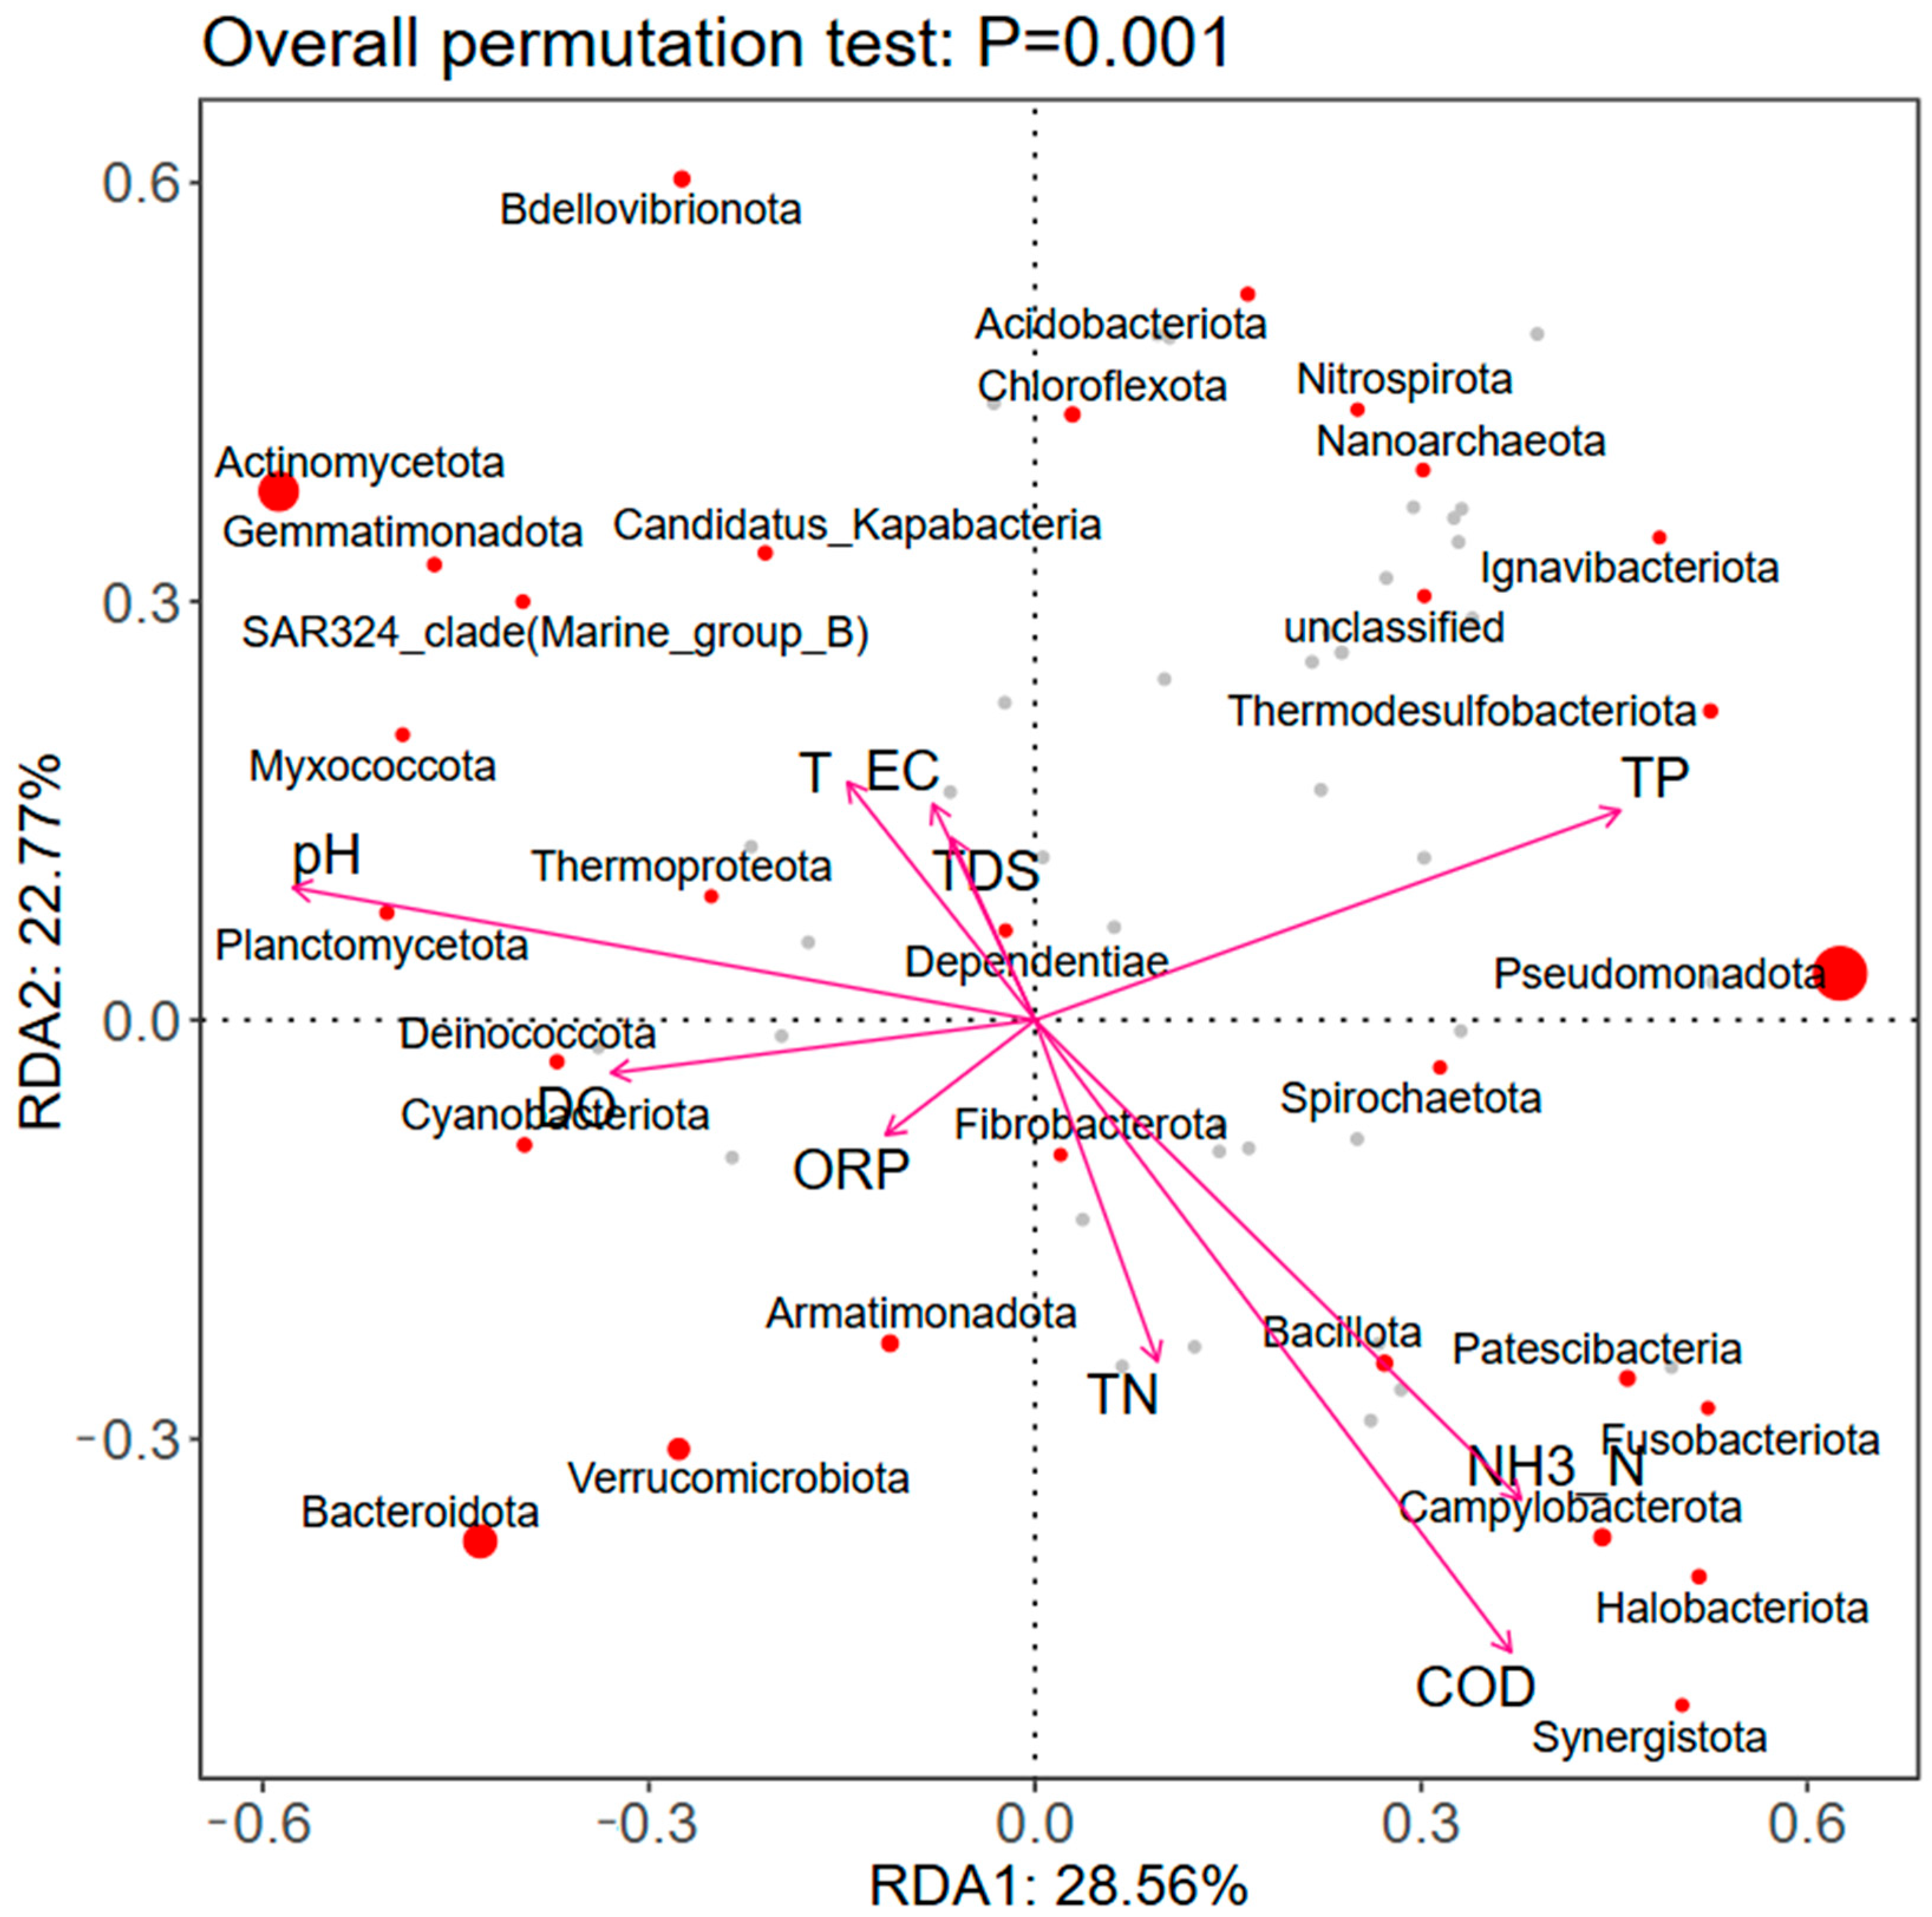
The RDA of Microorganisms and Environmental Factors in Sha River is shown in Figure 6. As shown in Figure 6, two RDA axes collectively explain approximately 51.33% of the variation, indicating that these can well reflect the main relationships between microbial communities and environmental factors. Pseudomonadota exhibited an extremely significant positive correlation with TP and NH3-N, while showing a statistically significant negative correlation with ORP and DO. Bacteroidota displayed an extremely significant positive correlation with ORP and DO, and an extremely significant negative correlation with TP. Actinobacteriota showed an extremely significant positive correlation with pH, and an extremely significant negative correlation with NH3-N.
Cyanobacteriota exhibited an extremely significant positive correlation with DO and pH, and an extremely significant negative correlation with TP. Overall, it was found that most dominant microbial phyla in the Sha River surface water were correlated with NH3-N, TP, and DO, which may be attributed to eutrophication in the Sha River basin.
Ammonia nitrogen (NH3-N) is one of the key nutrients in water bodies, directly affecting aquatic ecological balance [2,38,41]. Excessively high concentrations of NH3-N can lead to eutrophication, triggering algal blooms and water quality deterioration [45]. Under such eutrophic conditions, certain microorganisms, such as Cyanobacteria, can rapidly propagate at high NH3-N concentrations, thus becoming dominant phyla in the water body [12]. As another critical nutrient in water, TP concentration directly influences the degree of eutrophication [46]. High TP concentrations can promote the growth and reproduction of algae and other microorganisms, thereby affecting the structure and function of aquatic microbial communities. In eutrophic environments, specific microbial communities can utilize high concentrations of TP for growth and reproduction [46]. Therefore, although wastewater treatment plants discharge effluents that meet the first-class A standard into the Sha River, the concentrations of ammonia nitrogen, COD, and TP in the water body remain high, exerting significant impacts on aquatic microorganisms and eutrophication.
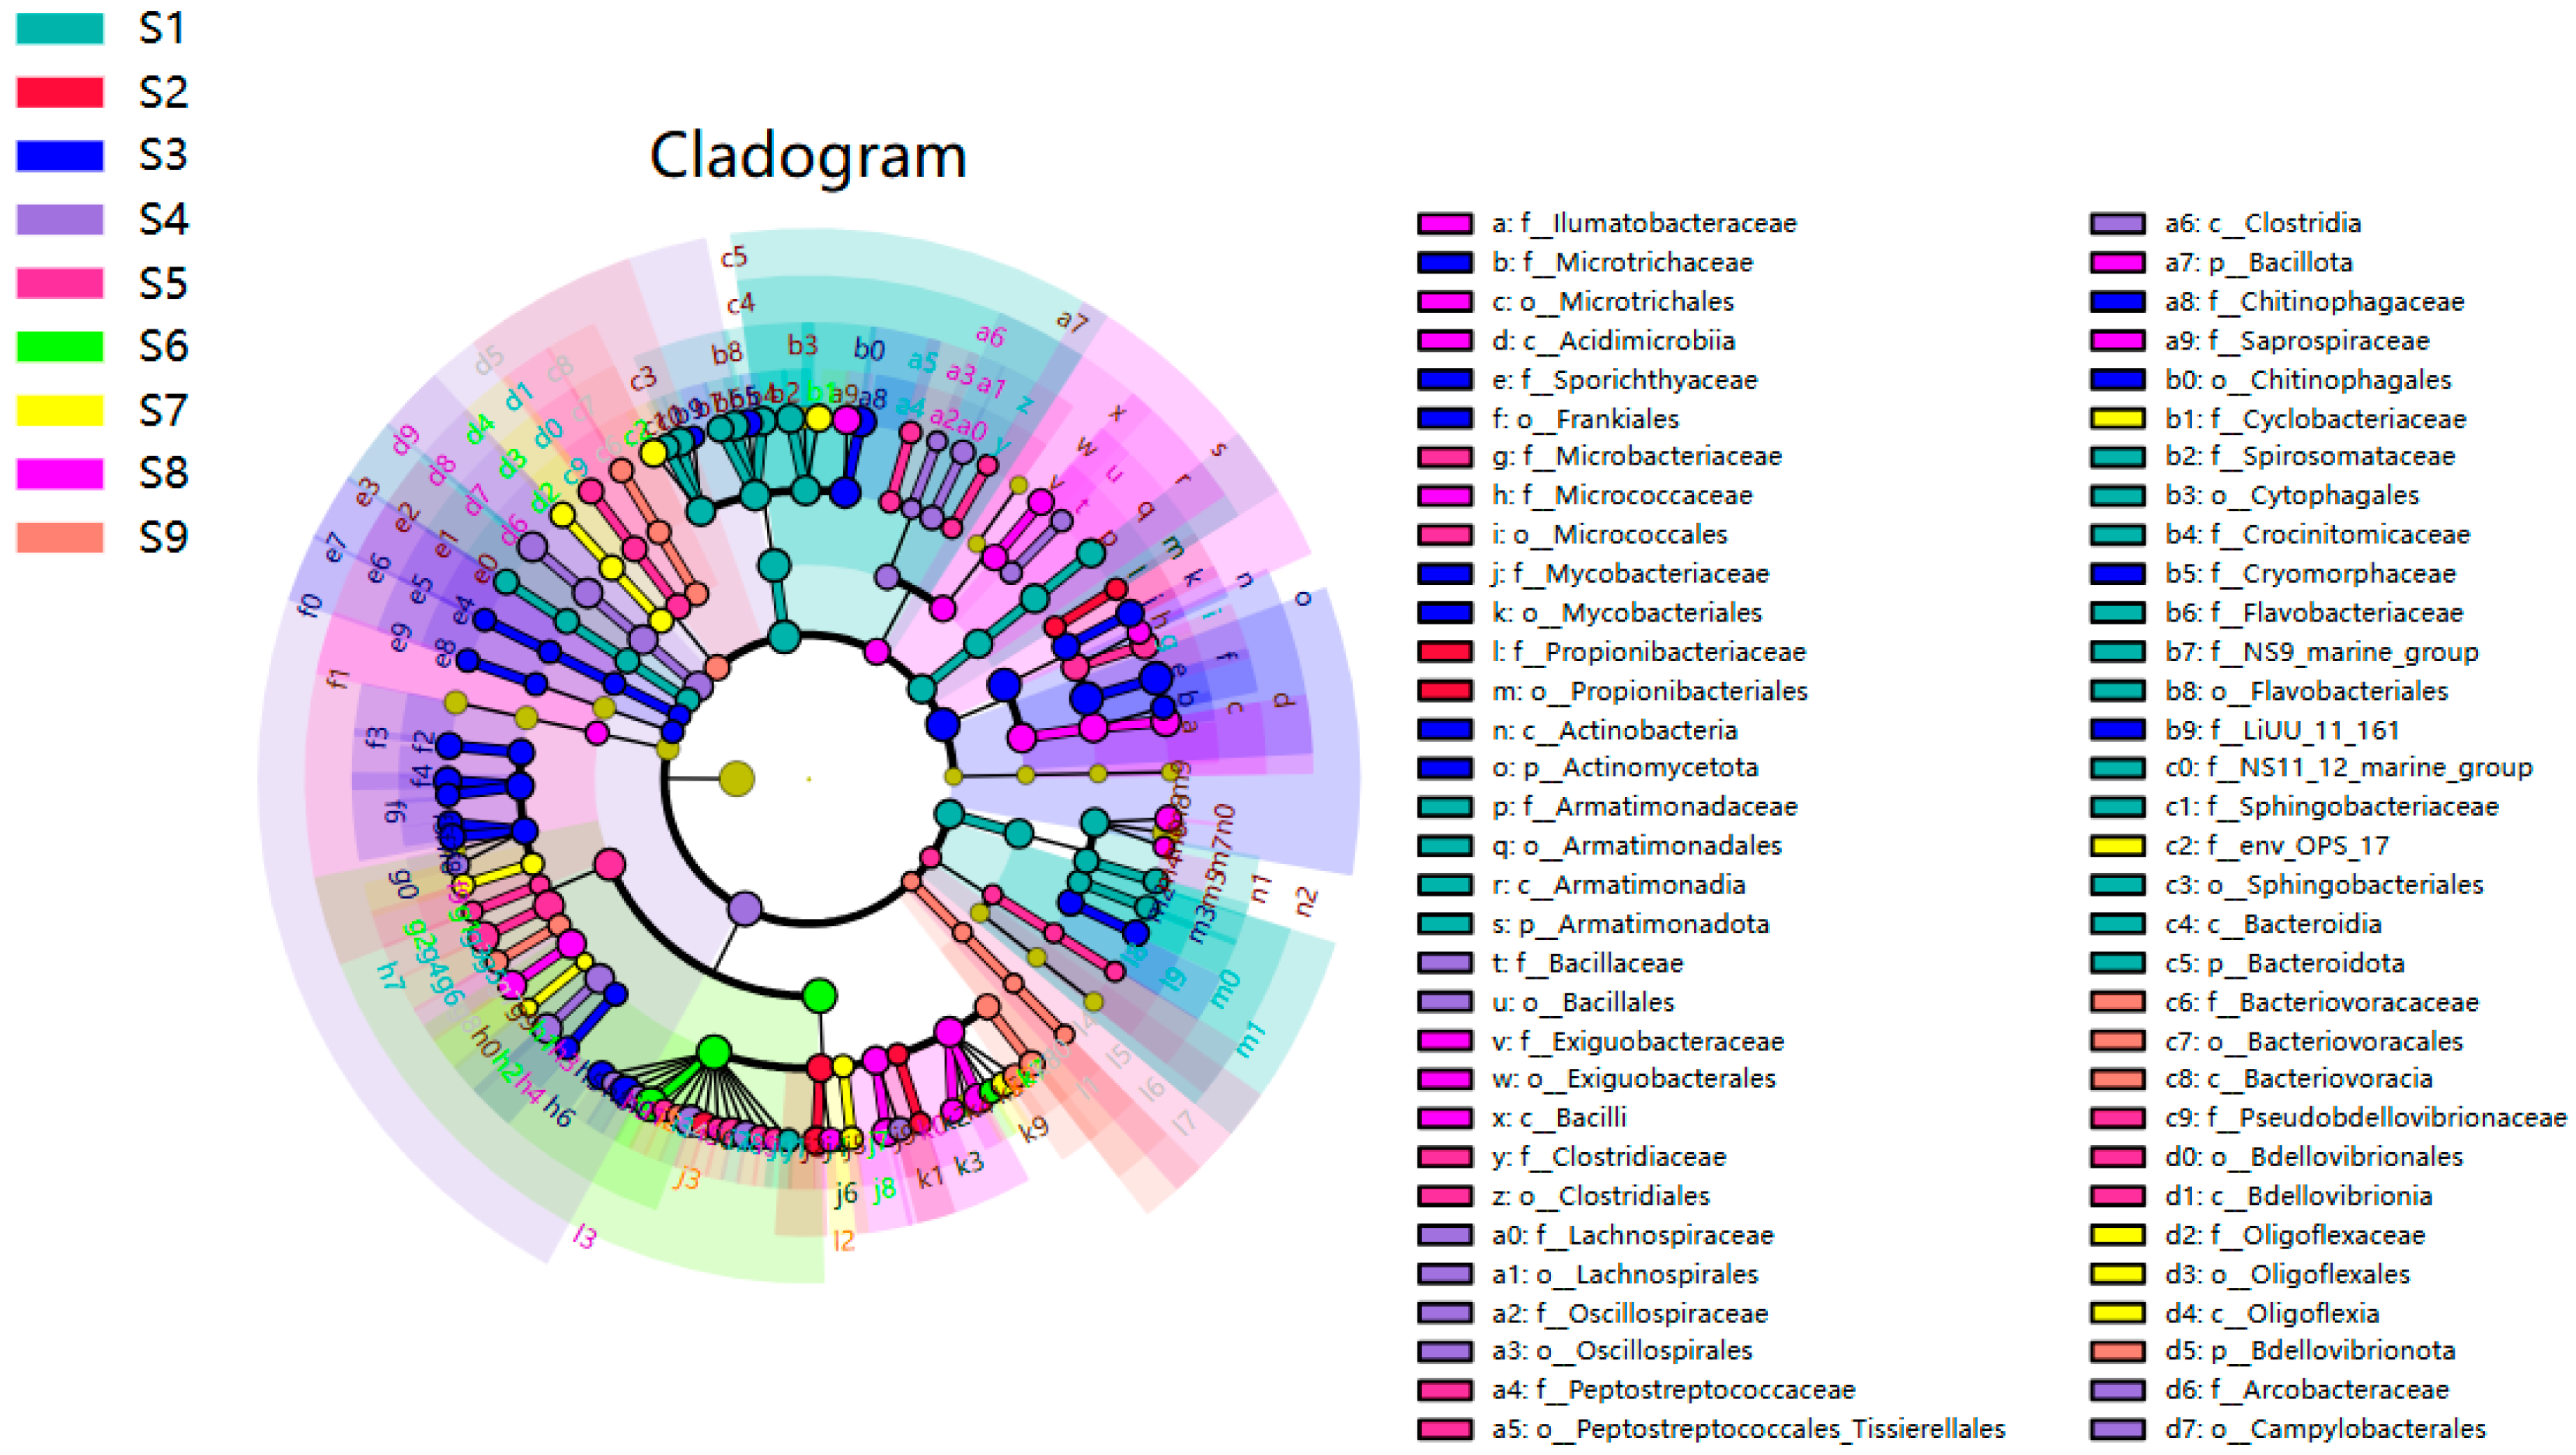
From the Spearman analysis between the microbial communities and environmental factors in the Sha River surface water, it can be concluded that certain environmental factors have significant impacts on microbial communities, thus enabling the use of bacterial communities to indicate water pollution [14,15]. In this study, LEfSe analysis was employed to identify the abundance characteristics of each sample group, and these characteristic microorganisms serve as indicators of water pollution. Furthermore, since the phylum and class levels are relatively high in the taxonomic hierarchy, and the genus level contains unclassified or unnamed species, selecting species at these levels may lead to inaccurate identification results. Therefore, in this study, species at the family level were chosen as indicator microorganisms for assessing water pollution.
As shown in Figure 7, the indicator microorganisms at each sampling site are as follows: Site S1 is dominated by Bacteroidota; Site S2 includes Enterobacterales and Aeromonadaceae (belonging to Proteobacteria); Site S3 is characterized by Actinobacteriota; Site S4 is dominated by Proteobacteria; Site S5 is dominated by Alphaproteobacteria (belonging to Proteobacteria); Site S6 is dominated by Burkholderiales (belonging to Proteobacteria); Site S7 is dominated by Cyclobacteriaceae (belonging to Bacteroidota); Site S8 is dominated by Pseudomonadales and Moraxellaceae (belonging to Proteobacteria); and Site S9 is dominated by Leptospiraceae (Spirochaetota).
Proteobacteria play a crucial role in the decomposition and cycling of organic matter, with particularly high abundances of Alphaproteobacteria in eutrophic water bodies [41]. These bacteria can utilize organic matter, fix nitrogen, and remove pollutants [41]. They are highly abundant in eutrophic rivers, and their abundance is positively correlated with the concentrations of TN, TP, and NH3-N, which may be driven by high nutrient sources in domestic wastewater [46]. Proteobacteria also play an important role in the recycling of phosphorus within particles, as the metabolism of organic phosphorus is primarily mediated by Proteobacteria [46]. In the nitrogen cycle, Proteobacteria participate mainly through nitrogen fixation and dissimilatory nitrate reduction processes, while in the phosphorus cycle, they significantly enhance their functionality through organic phosphorus mineralization genes (such as phnD, phnA, and phnP) [47]. This explains why the abundances of Proteobacteria are the highest at Sites S2, S4, S5, and S6, where the concentrations of TN, TP, and NH3-N are also high.

3.4. Source Apportionment of Downstream of the River Using the Source Tracker Model

To further explore the impact of wastewater discharge on the distribution patterns of microorganisms in the Sha River water environment and quantitatively clarify the contribution of upstream wastewater discharge to microbial communities in downstream water bodies, this study employed the microbial source tracking model (Source Tracker model) for simulation. To effectively distinguish the representativeness of microbial communities under different environmental conditions, four upstream sites were selected as “sources” and one site as the “sink”. S1 (the uppermost reach of the river with no wastewater discharge), S2 (affected by both wastewater discharge and untreated aquaculture wastewater), S3 (a transition zone without wastewater discharge), and S4 (receiving a large volume of domestic wastewater discharge) served as sources, while S6 (a fully mixed area after the confluence of upstream tributaries) was designated as the sink. Microbial sequencing data from each sampling site (with three sets of sequencing data per site) were used for the simulation. The schematic diagram and results of the simulation are shown in Figure 8.
As indicated in Figure 8, the microbial contribution ratio of S4 (36.7% ± 2.3%) was significantly higher than that of other sources, suggesting that S4 had the greatest potential contribution to the sink (S6) and was likely the primary “input source” of the microbial community in the sink. The second-highest contribution was from S2, with a ratio of 31.3% ± 1.3%. The contributions of S1 and S3 were relatively lower, accounting for 9.9% ± 0.6% and 13.5% ± 1.8%, respectively. These results were consistent with the previous findings on water chemistry and microbial distribution: the upstream areas of Sites S2, S4, and S6 were characterized by high concentrations of COD, NH3-N, and high abundances of homologous microbial communities. Therefore, despite the reduction in physicochemical pollution indices of wastewater from wastewater treatment plants through dilution and degradation, they still exert a significant impact on the distribution of microbial communities in the downstream water bodies of the river.
Analysis of intra-group data revealed that the three sets of data (A, B, and C) in Groups S1 and S2 were highly consistent, indicating that the microbial community characteristics of S1 and S2 were stable, with good “fingerprint consistency” as sources, thus verifying the reliability of the simulation results. Although there were differences in Groups S3 and S4, the overall trend was consistent, suggesting that the representativeness of these sources was basically reliable.
The simulation results showed an unknown contribution of 8%, which was relatively small, further confirming the reliability of the simulation results. This portion of unknown contribution might be attributed to the environmental heterogeneity of the sink itself [21,48]. In general, environmental features that were not considered during source tracking, such as the influence of river sediment resuspension and the hydraulic condition of river, were assigned as “unknown” [20]. Sediment particles at the bottom of water bodies are resuspended into the overlying water from the Sediment-Water Interface under the action of external forces. This process alters the original physicochemical properties of the water body and the structure of its biological communities, thereby exerting an impact on the simulation results of the model [10,12].
Furthermore, to verify the sensitivity of the model and the accuracy of the simulation results, we conducted a sensitivity test on the Source Tracker model under different rarefaction depths (set to 1000, 5000, 10,000, and 20,000 reads, respectively). The test results showed that under the aforementioned different rarefaction depth conditions, the simulation results of the model remained stable overall, and the fluctuation range of key indicators, such as the contribution percentage of each source, was small (Table 3). This further confirms the reliability of the Source Tracker-based microbial source tracking (MST) results in this study.
Based on the findings that upstream wastewater discharge significantly shapes downstream microbial communities in the Sha River, with Site S4 (domestic wastewater) contributing 36.7%, Site S2 (domestic and untreated aquaculture wastewater) contributing 31.3%, and the transition zone Site S3 (no discharge) contributing 13.5% to the downstream confluence area (S6). The targeted management strategies are proposed to mitigate these impacts. For Site S4, upgrading wastewater treatment plants beyond the current first-class A standard (GB18918-2002) by integrating advanced processes such as filtration, advanced oxidation, Biological Activated Carbon (BAC) and constructed wetlands is critical, as these can specifically reduce nitrogen, phosphorus, and refractory organic matter [49]. From the perspective of cost–benefit and feasibility analyses, both the high-efficiency sedimentation tank plus deep-bed filter process and the O3-BAC (ozonation-biological activated carbon) process have been widely applied. These processes can efficiently degrade organic matter in wastewater, and the environmental benefits brought by pollutant reduction are significant [50]. At Site S2, regulating aquaculture through zoning and promoting ecological models will minimize direct discharge of aquaculture wastewater, addressing its substantial microbial contribution. For transition zones like Site S3, enhancing their “buffering effect” via riparian vegetation buffers can leverage plant-microbe synergies to intercept upstream pollutants, further reducing impacts on confluence areas. Additionally, integrating microbial source tracking (MST) into river management will enable precise pollution source localization and ensure stable compliance of discharged water quality [21]. Regular analysis of microbial community structures across river sections to identify pollution-associated “biomarkers” will further support evidence-based decision-making, collectively enhancing ecosystem resilience to anthropogenic disturbances [22]. In particular, MST results provide targeted evidence to underpin policy decisions within China’s “River Chief” system.

4. Conclusions

In this study, 16S rRNA sequencing technology, coupled with the determination of water physicochemical properties, was employed to investigate the compositional diversity and spatial distribution of microorganisms in the Sha River, as well as to explore the environmental effects of wastewater discharge on these microorganisms. Additionally, quantitative analysis was performed using the Source Tracker model to clarify the contribution of upstream wastewater discharge to microbial communities in downstream water. The conclusions of this study are as follows:
(1)
The sequencing results of species at the phylum level revealed that the dominant microbial phyla in the Sha River were primarily Proteobacteria (55.4%), Actinobacteriota (24.0%), Bacteroidota (14.3%), and Verrucomicrobiota (2.6%). The most dominant phylum, Proteobacteria, exhibited varying abundances across different sampling sites in the Sha River basin, with the highest abundances observed at Sites S2, S4, S5 and S6. It can be seen from this that the discharge of wastewater from wastewater treatment plants has a significant impact on the distribution of microorganisms in rivers.
(2)
Correlation analysis of microbial communities and environmental factors in the Sha River shows that despite wastewater treatment plants discharging effluent meeting the Class 1 Grade A standard into the river, the water body still has relatively high concentrations of ammonia nitrogen, chemical oxygen demand, and total phosphorus. This not only significantly affects the structure of aquatic microbial communities, but also worsens water eutrophication.
(3)
The results of quantitative analysis showed that S2 (36.7%) and S4 (31.3%) in the upper reaches of the Sha River are the primary contributors to the microbial community in the downstream catchment area (S6). The study found that the impact of wastewater discharge on the microbial community in the downstream water body exhibits a “longitudinal persistence of microbial signatures”—even though the physicochemical pollution indicators of the water body have decreased. Unfortunately, a limitation of this study is that its hydrological data were derived solely from a single field sampling campaign. This sampling only captured the low-flow hydrological state of the study area, which did not fully account for how extreme hydrological events, such as monsoons or droughts, might alter the source–sink dynamics of microbial community.
(4)
These findings of this study represent the application in microbial source tracking in the upstream and downstream sections of rivers, providing strong support for formulating more effective environmental protection strategies in the Sha River basin. Given that Site S2 (domestic wastewater with untreated aquaculture wastewater) and Site S4 (domestic wastewater discharge) contribute the highest proportion of microorganisms to the downstream confluence area (S6), it is necessary to strengthen the upgrading and transformation of wastewater treatment plants and reduce the direct discharge of aquaculture wastewater.

Author Contributions

H.G. and Y.F. designed and performed research. Y.F., Y.L. (Yuran Lv) and H.G. wrote the paper. Y.L. (Yizhe Li), W.Y., K.Y. and Q.L. assisted with the experiment. Z.J., X.Z., X.G. and J.W. provided comments. All authors have read and agreed to the published version of the manuscript.

Funding

This research was Funded by the National College Students’ Innovation and Entrepreneurship Training Program (No. 202511765009, No. 202511765013), Science and Technology Project of Henan Province (No. 252102320067, No. 242102320082, No. 242102310358, No. 242102321078), Project of Young Core Instructor of Henan University of Urban Construction (No. YCJQNGGJS202103, No. YCJQNGGJS202402), Project of Academic and Technical leader of Henan University of Urban Construction (No. YCJXSJSDTR202402, No. YCJXSJSDTR202507).

Data Availability Statement

The data that support the findings of this study are available from the authors upon reasonable request.

Acknowledgments

Comments from the anonymous reviewers are appreciated.

Conflicts of Interest

The authors declare no conflicts of interest.

References

  1. Drury, B.; Rosi-Marshall, E.; Kelly, J.J. Wastewater Treatment Effluent Reduces the Abundance and Diversity of Benthic Bacterial Communities in Urban and Suburban Rivers. Appl. Environ. Microbiol. 2013, 79, 1897–1905. [Google Scholar] [CrossRef]
  2. Luo, Y.; Guo, W.; Ngo, H.H.; Nghiem, L.D.; Hai, F.I.; Zhang, J.; Liang, S.; Wang, X.C. A Review on the Occurrence of Micropollutants in the Aquatic Environment and Their Fate and Removal during Wastewater Treatment. Sci. Total Environ. 2014, 473–474, 619–641. [Google Scholar] [CrossRef]
  3. Lacaze, É.; Gendron, A.D.; Miller, J.L.; Colson, T.L.L.; Sherry, J.P.; Giraudo, M.; Marcogliese, D.J.; Houde, M. Cumulative Effects of Municipal Effluent and Parasite Infection in Yellow Perch: A Field Study Using High-Throughput RNA-Sequencing. Sci. Total Environ. 2019, 665, 797–809. [Google Scholar] [CrossRef]
  4. Wang, J.W.; Chen, Y.; Cai, P.G.; Gao, Q. Impacts of Municipal Wastewater Treatment Plant Discharge on Microbial Community Structure and Function of the Receiving River in Northwest Tibetan Plateau. J. Hazard. Mater. 2022, 423, 127170. [Google Scholar] [CrossRef]
  5. Pascual-Benito, M.; Ballesté, E.; Monleón-Getino, T.; Urmeneta, J.; Blanch, A.R.; García-Aljaro, C.; Lucena, F. Impact of Treated Sewage Effluent on the Bacterial Community Composition in an Intermittent Mediterranean Stream. Environ. Pollut. 2020, 266, 115254. [Google Scholar] [CrossRef]
  6. Olano, H.; Martigani, F.; Somma, A.; Aubriot, L. Wastewater Discharge with Phytoplankton May Favor Cyanobacterial Development in the Main Drinking Water Supply River in Uruguay. Environ. Monit. Assess. 2019, 191, 146. [Google Scholar] [CrossRef]
  7. Ruiz-González, C.; Niño-García, J.P.; Del Giorgio, P.A. Terrestrial Origin of Bacterial Communities in Complex Boreal Freshwater Networks. Ecol. Lett. 2015, 18, 1198–1206. [Google Scholar] [CrossRef]
  8. Begmatov, S.; Dorofeev, A.G.; Kadnikov, V.V.; Beletsky, A.V.; Pimenov, N.V.; Ravin, N.V.; Mardanov, A.V. The Structure of Microbial Communities of Activated Sludge of Large-Scale Wastewater Treatment Plants in the City of Moscow. Sci. Rep. 2022, 12, 3458. [Google Scholar] [CrossRef] [PubMed]
  9. Chu, B.T.T.; Petrovich, M.L.; Chaudhary, A.; Wright, D.; Murphy, B.; Wells, G.; Poretsky, R. Metagenomics Reveals the Impact of Wastewater Treatment Plants on the Dispersal of Microorganisms and Genes in Aquatic Sediments. Appl. Environ. Microbiol. 2018, 84, e02168-17. [Google Scholar] [CrossRef] [PubMed]
  10. Abia, A.L.K.; Alisoltani, A.; Keshri, J.; Ubomba-Jaswa, E. Metagenomic Analysis of the Bacterial Communities and Their Functional Profiles in Water and Sediments of the Apies River, South Africa, as a Function of Land Use. Sci. Total Environ. 2018, 616–617, 326–334. [Google Scholar] [CrossRef] [PubMed]
  11. Bahram, M.; Hildebrand, F.; Forslund, S.K.; Anderson, J.L.; Soudzilovskaia, N.A.; Bodegom, P.M.; Bengtsson-Palme, J. Structure and Function of the Global Topsoil Microbiome. Nature 2018, 560, 233–237. [Google Scholar] [CrossRef] [PubMed]
  12. Liu, J.; Chen, X.; Shu, H.Y.; Lin, X.R.; Zhou, Q.X.; Bramryd, T.; Shu, W.S.; Huang, L.N. Microbial Community Structure and Function in Sediments from E-Waste Contaminated Rivers at Guiyu Area of China. Environ. Pollut. 2018, 235, 171–179. [Google Scholar] [CrossRef]
  13. Azli, B.; Razak, M.N.; Omar, A.R.; Mohd Zain, N.A.; Abdul Razak, F.; Nurulfiza, I. Metagenomics Insights into the Microbial Diversity and Microbiome Network Analysis on the Heterogeneity of Influent to Effluent Water. Front. Microbiol. 2022, 13, 779196. [Google Scholar] [CrossRef] [PubMed]
  14. Madsen, E.L. Microorganisms and Their Roles in Fundamental Biogeochemical Cycles. Curr. Opin. Biotechnol. 2011, 22, 456–464. [Google Scholar] [CrossRef]
  15. Wang, J.; Li, Y.; Wang, P.F.; Zhang, H.; Lin, C. Response of Bacterial Community Compositions to Different Sources of Pollutants in Sediments of a Tributary of Taihu Lake, China. Environ. Sci. Pollut. Res. 2016, 23, 13886–13894. [Google Scholar] [CrossRef]
  16. McLellan, S.L.; Eren, A.M. Discovering New Indicators of Fecal Pollution. Trends Microbiol. 2014, 22, 697–706. [Google Scholar] [CrossRef] [PubMed]
  17. Li, L.G.; Huang, Q.; Yin, X.; Zhang, T. Source Tracking of Antibiotic Resistance Genes in the Environment—Challenges, Progress, and Prospects. Water Res. 2020, 185, 116127. [Google Scholar] [CrossRef]
  18. Schiaffino, F.; Pisanic, N.; Colston, J.M.; Rengifo, D.; Paredes Olortegui, M.; Shapiama, V.; Peñataro Yori, P.; Heaney, C.D.; Davis, M.F.; Kosek, M.N. Validation of Microbial Source Tracking Markers for the Attribution of Fecal Contamination in Indoor-Household Environments of the Peruvian Amazon. Sci. Total Environ. 2020, 743, 140531. [Google Scholar] [CrossRef]
  19. Duarte, A.S.R.; Röder, T.; Van Gompel, L.; Petersen, T.N.; Hansen, R.B.; Hansen, I.M.; Bossers, A.; Aarestrup, F.M.; Wagenaar, J.A.; Hald, T. Metagenomics-Based Approach to Source-Attribution of Antimicrobial Resistance Determinants–Identification of Reservoir Resistome Signatures. Front. Microbiol. 2021, 12, 3447. [Google Scholar] [CrossRef]
  20. Chen, J.; Chen, H.; Liu, C.; Huan, H.; Teng, Y. Evaluation of FEAST for Metagenomics-Based Source Tracking of Antibiotic Resistance Genes. J. Hazard. Mater. 2023, 442, 130116. [Google Scholar] [CrossRef]
  21. Peng, Y.; Liu, L.; Wang, X.; Li, L.; Wang, Z.; Lin, K. Source Apportionment Based on EEM-PARAFAC Combined with Microbial Tracing Model and Its Implication in Complex Pollution Area, Wujin District, China. Environ. Pollut. 2024, 346, 123596. [Google Scholar] [CrossRef] [PubMed]
  22. Shenhav, L.; Thompson, M.; Joseph, T.A.; Briscoe, L.; Furman, O.; Bogumil, D.; Mizrahi, I.; Pe Er, I.; Halperin, E. FEAST: Fast expectation-maximization for microbial source tracking. Nat. Methods 2019, 16, 627–632. [Google Scholar] [CrossRef]
  23. Hao, M.; Zuo, Q.; Li, J.; Shi, S.; Li, B.; Zhao, X. A Comprehensive Exploration on Distribution, Risk Assessment, and Source Quantification of Heavy Metals in the Multi-Media Environment from Shaying River Basin, China. Ecotoxicol. Environ. Saf. 2022, 231, 113190. [Google Scholar] [CrossRef] [PubMed]
  24. Bai, Y.; Yuan, X.; van der Hoek, J.P. Residues of Organochlorine Pesticides (OCPs) in Aquatic Environment and Risk Assessment along Shaying River, China. Environ. Geochem. Health 2018, 40, 2525–2538. [Google Scholar] [CrossRef] [PubMed]
  25. He, B.; He, J.; Wang, L.; Zhang, X.; Bi, E. Effect of Hydrogeological Conditions and Surface Loads on Shallow Groundwater Nitrate Pollution in the Shaying River Basin: Based on Least Squares Surface Fitting Model. Water Res. 2019, 163, 114880. [Google Scholar] [CrossRef]
  26. GB18918-2002; Discharge Standard of Pollutants for Municipal Wastewater Treatment Plants. Ministry of Ecology and Environment of the People’s Republic of China: Beijing, China, 2003.
  27. Wang, J.; Liu, T.; Sun, W.; Chen, Q. Bioavailable Metal(loid)s and Physicochemical Features Co-Meditating Microbial Communities at Combined Metal(loid) Pollution Sites. Chemosphere 2020, 260, 127619. [Google Scholar] [CrossRef]
  28. Callahan, B.J.; McMurdie, P.J.; Rosen, M.J.; Han, A.W.; Johnson, A.J.A.; Holmes, S.P. DADA2: High-Resolution Sample Inference from Illumina Amplicon Data. Nat. Methods 2016, 13, 581–583. [Google Scholar] [CrossRef]
  29. Bokulich, N.A.; Kaehler, B.D.; Ram, R.J.; Matthew, D.; Evan, B.; Rob, K. Optimizing Taxonomic Classification of Marker-Gene Amplicon Sequences with QIIME 2’s q2-Feature-Classifier Plugin. Microbiome 2018, 6, 90. [Google Scholar] [CrossRef]
  30. Love, M.I.; Huber, W.; Anders, S. Moderated Estimation of Fold Change and Dispersion for RNA-Seq Data with DESeq2. Genome Biol. 2014, 15, 550. [Google Scholar] [CrossRef]
  31. Mandal, S.; Van Treuren, W.; White, R.A.; Eggesbø, M.; Knight, R.; Peddada, S.D. Analysis of Composition of Microbiomes: A Novel Method for Studying Microbial Composition. Microb. Ecol. Health Dis. 2015, 26, 27663. [Google Scholar] [CrossRef]
  32. Segata, N.; Abubucker, S.; Goll, J.; Schubert, A.M.; Izard, J.; Cantarel, B.L.; Rodriguez-Mueller, B.; Waldron, L.; Zucker, J.; Henrissat, B.; et al. Metagenomic Biomarker Discovery and Explanation. Genome Biol. 2011, 12, R60. [Google Scholar] [CrossRef]
  33. Oksanen, J.; Blanchet, F.G.; Kindt, R.; Legendre, P. vegan: Community Ecology Package; R Package Version 2.2-1; CRAN: Vienna, Austria, 2015. [Google Scholar]
  34. Yoshiki, V.; Pirrung, M.; Gonzalez, A.; Knight, R. Emperor: A tool for visualizing high-throughput microbial community data. Giga Sci. 2013, 2, 16. [Google Scholar]
  35. Knights, D.; Kuczynski, J.; Charlson, E.S.; Zaneveld, J.; Mozer, M.C.; Collman, R.G.; Bushman, F.D.; Knight, R.; Kelley, S.T. Bayesian Community-Wide Culture-Independent Microbial Source Tracking. Nat. Methods 2011, 8, 761–763. [Google Scholar] [CrossRef]
  36. Gao, Y.; Zhang, G.; Jiang, S.; Liu, Y.X. Wekemo Bioincloud: A User-Friendly Platform for Meta-Omics Data Analyses. iMeta 2024, 3, e175. [Google Scholar] [CrossRef]
  37. GB3838-2002; Environmental Quality Standards for Surface Water of China. Ministry of Environmental Protection of China: Beijing, China, 2002.
  38. Wardi, M.; Slimani, N.; Ait Alla, A.; Dahchour, A.; El Mourabit, F.; Zekhnini, A.; Aziz, F. First Study of the Effect of Wastewater Treatment on Microbial Biodiversity at Three Wastewater Treatment Plants in Agadir, Morocco, Using 16S rRNA Sequencing. Environ. Pollut. 2023, 337, 122528. [Google Scholar] [CrossRef]
  39. Yang, Y.Z.; Gao, Y.C.; Huang, X.N.; Li, J.; Lin, X.G. Adaptive Shifts of Bacterioplankton Communities in Response to Nitrogen Enrichment in a Highly Polluted River. Environ. Pollut. 2019, 245, 290–299. [Google Scholar] [CrossRef] [PubMed]
  40. Pei, Y.; Yu, Z.; Ji, J. Microbial community structure and function indicate the severity of chromium contamination of the Yellow River. Front. Microbiol. 2018, 9, 38. [Google Scholar] [CrossRef]
  41. Chen, X.; Ji, J.; Li, P.; Peng, X.; Wang, J.; Fu, C.; Zong, Y. Characterization of microbial communities in the upstream water body of Linzhi City section of Yarlung Tsangpo River and changes in nitrogen cycle-related microbiota. J. Ecol. Rural Environ. 2025, 1, 1–24. (In Chinese) [Google Scholar]
  42. Chou, J.H.; Cho, N.T.; Arun, A.B. Nocardioides fonticola sp. nov, a novel actinomycete isolated from spring water. Int. J Syst. Evol. Microbiol. 2008, 58, 18641868. [Google Scholar] [CrossRef]
  43. Dang, H.; Li, J.; Chen, R.; Wang, L.; Guo, L.; Zhang, Z.; Klotz, M.G. Diversity, abundance, and spatial distribution of sediment ammonia oxidizing Betaproteobacteria in response to environmental gradients and coastal eutrophication in Jiaozhou Bay, China. Appl. Environ. Microbiol. 2010, 76, 4691–4702. [Google Scholar] [CrossRef] [PubMed]
  44. Liu, G.; Li, B.; Li, J.; Gu, Z.; Liu, X. Wildfire Impacts Pinus tabulaeformis Forests on Soil Properties, Actinobacteriota, and Enzyme Activity in Northern China: Direct Effects or Mutual Interactions? Forests 2025, 16, 344. [Google Scholar] [CrossRef]
  45. Qin, B.Q.; Zhou, J.; Elser, J.J.; Gardner, W.S.; Deng, J.M.; Brookes, J.D. Water Depth Underpins the Relative Roles and Fates of Nitrogen and Phosphorus in Lakes. Environ. Sci. Technol. 2020, 54, 3191–3198. [Google Scholar] [CrossRef]
  46. Zhu, Z.; Ma, Y.; Huang, L.; Zhang, W. Homogeneous selection is not always important in bacterial community in the eutrophic enclosed bay. Ecol. Process. 2022, 11, 27. [Google Scholar] [CrossRef]
  47. Francis, C.; Beman, M.; Kuypers, M. New processes and players in the nitrogen cycle: The microbial ecology of anaerobic and archaeal ammonia oxidation. ISME J. 2007, 1, 19–27. [Google Scholar] [CrossRef] [PubMed]
  48. Wang, X.; Zhang, M.; Liu, L.; Wang, Z.; Lin, K. Using EEM-PARAFAC to Identify and Trace the Pollution Sources of Surface Water with Receptor Models in Taihu Lake Basin, China. J. Environ. Manag. 2022, 321, 115925. [Google Scholar] [CrossRef] [PubMed]
  49. Hou, C.Y.; Chen, L.; Dong, Y.W. Unraveling dissolved organic matter in drinking water through integrated ozonation/ceramic membrane and biological activated carbon process using FT-ICR MS. Water Res. 2022, 222, 118881. [Google Scholar] [CrossRef]
  50. Kong, Z.; Li, L.; Feng, C.; Dong, S.; Chen, N. Comparative investigation on integrated vertical-flow biofilters applying sulfur-based and pyrite-based autotrophic denitrification for domestic wastewater treatment. Bioresour. Technol. 2016, 211, 125–135. [Google Scholar] [CrossRef]
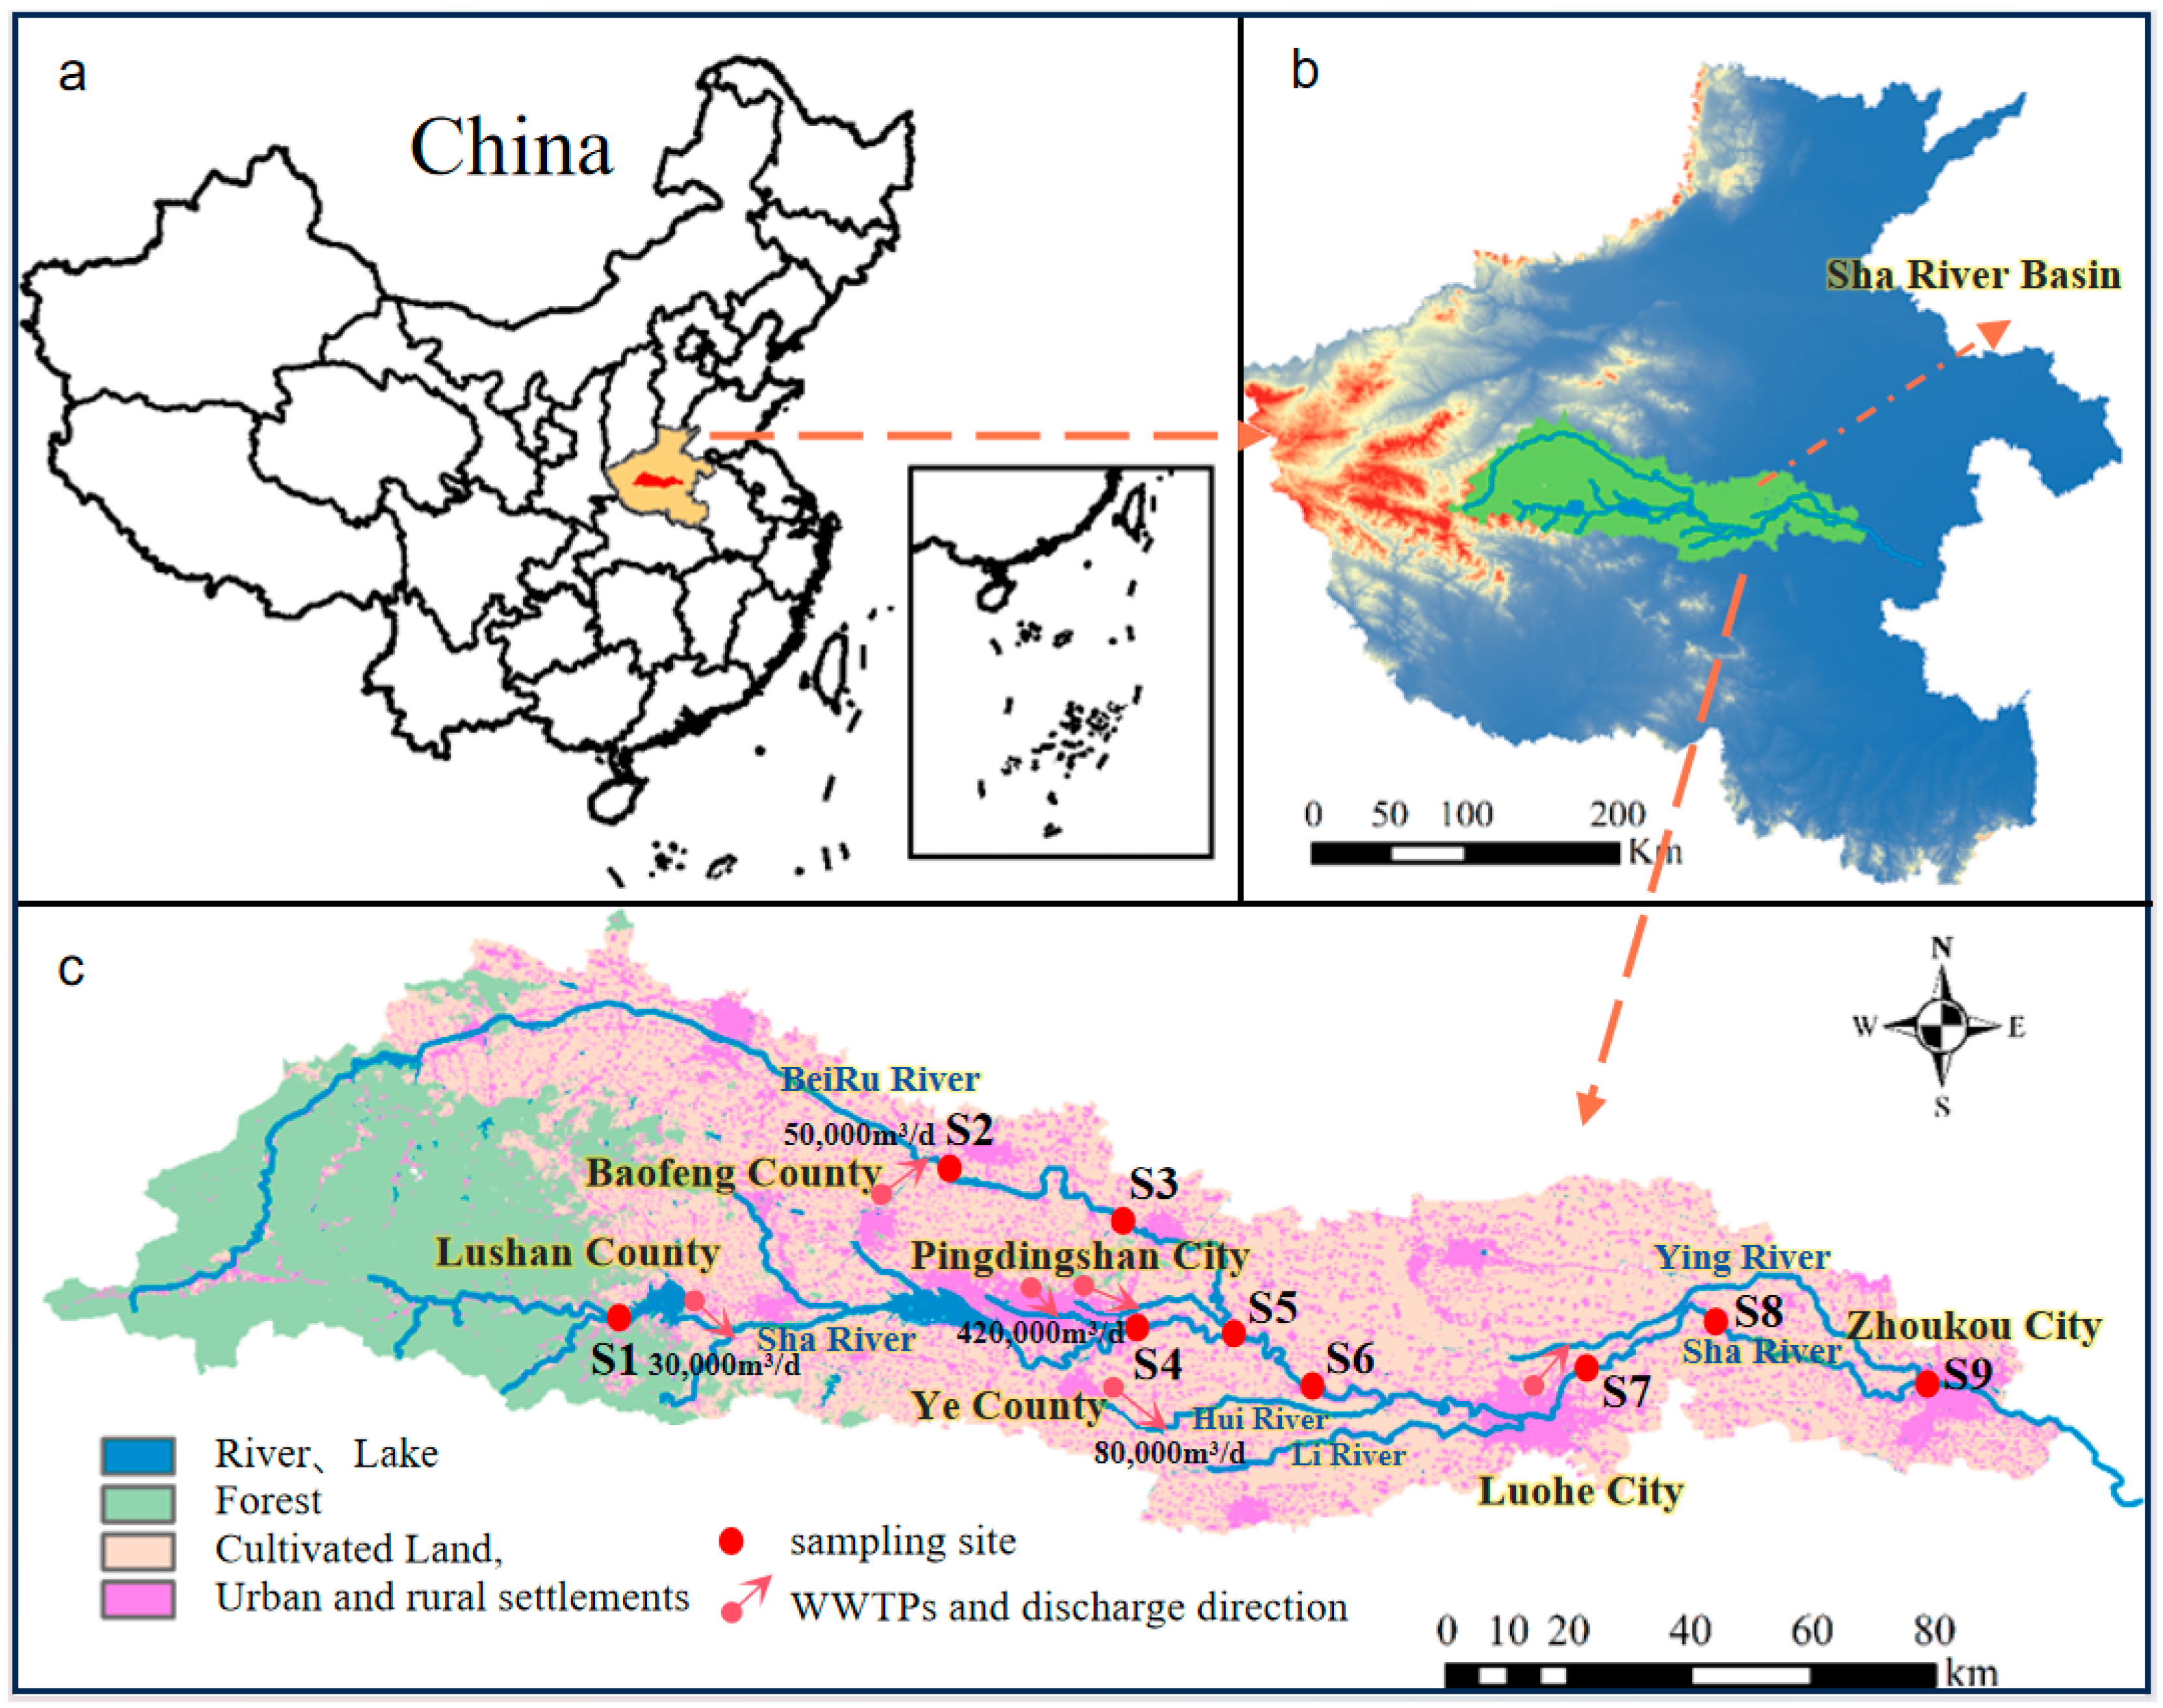
Figure 1. Location maps depicting China (a) and the study area (b), along with a land use map, indicating the locations and sampling sites within the study area (c). The study area is located between 33°77′ N and 33°63′ N, 112°28′ E and 114°61′ E.
Water 17 02753 g001
Figure 2. The physicochemical properties of water samples: the different dashed lines represent the threshold values corresponding to the five categories of the Chinese water quality standards “Environmental quality standards for surface water (GB3838-2002)”. EC stands for Electrical Conductivity, TDS stands for Total Dissolved Solids, ORP stands for Oxidation–Reduction Potential, DO stands for Dissolved Oxygen, COD stands for Chemical Oxygen Demand, TN stands for Total Nitrogen, NH3-N stands for Ammonia Nitrogen, and TP stands for total phosphorus. I, II, III, IV, V refer to the respective water quality standards. The asterisks in the figures indicate significant difference between this group and the control group. The bar chart without asterisk indicates no statistical significance, “*” for p-value < 0.05, “**” for p-value < 0.01, “***” for p-value < 0.001, and “****” for p-value < 0.0001.
Water 17 02753 g002
Figure 3. Beta Diversity Analysis of Microbial Communities in the Sha River Using Bray–Curtis Distance and Nonmetric Multidimensional Scaling (NMDS).
Water 17 02753 g003
Figure 4. The microbial community composition of water samples at the phylum level.
Water 17 02753 g004
Figure 5. The microbial community composition of water samples at the genus level.
Water 17 02753 g005
Figure 6. RDA of Microorganisms and Environmental Factors in Sha River.
Water 17 02753 g006
Figure 7. The LEfSe cladogram of species at the family level.
Water 17 02753 g007
Figure 8. The schematic diagram and results of the simulation using the Source Tracker model. The Circles with different colors represent different sources, while blue solid circles, red triangles, small yellow circles and green dots inside the circles stand for the microbial community compositions of these respective sources (S1, S2, S3, S4). The circle at Site S6 represents the mixed sink, which contains microorganisms from various upstream sources.
Water 17 02753 g008
Table 1. Descriptive Statistical Summary of Water Physicochemical Parameters. T stands for temperature of water, EC stands for Electrical Conductivity, TDS stands for Total Dissolved Solids, ORP stands for Oxidation–Reduction Potential, DO stands for Dissolved Oxygen, COD stands for Chemical Oxygen Demand, TN stands for Total Nitrogen, NH3-N stands for Ammonia Nitrogen, and TP stands for total phosphorus.
ParameterMeanMinMaxSDCV
T (°C)21.59 19.20 23.20 1.28 0.06
EC (µS/cm)690.78 414.00 913.00 163.38 0.24
TDS (mg/L)345.56 201.00 474.00 85.73 0.25
pH8.16 7.63 8.90 0.45 0.05
ORP (mV)32.33 28.00 53.00 7.38 0.23
DO (mg/L)8.60 6.49 14.04 2.18 0.25
COD (mg/L)34.63 20.08 68.34 14.56 0.42
TN (mg/L)2.22 0.21 6.80 1.94 0.87
NH3-N (mg/L)0.61 0.06 2.39 0.68 1.12
TP (mg/L)0.07 0.01 0.12 0.03 0.46
Table 2. Statistics of Alpha Diversity of Microbial Communities in Sha River.
SamplesInputFilteredChaoShannonSimpsonPielou
Evenness
Coverage (%)
S118,217164,7601389.747.370.990.720.98
S2186,090169,9451472.937.320.980.700.98
S3187,824172,317593.686.450.970.750.97
S4185,918169,1791834.808.090.990.750.99
S5182,571165,7171451.917.160.980.690.98
S6185,307169,7061082.826.720.970.660.97
S7185,215168,4941307.157.090.980.680.98
S8183,904165,0521641.757.950.990.730.99
S9186,525169,6871162.367.060.980.680.98
Table 3. Reveal sensitivity tests for the Source Tracker model with varying rarefaction depths.
Rarefaction DepthS1S2S3S4
10009.88% ± 0.69%31.28% ± 1.25%13.55% ± 1.84%36.75% ± 2.37%
50008.25% ± 0.62%31.73% ± 0.78%14.72% ± 1.15%41.27% ± 0.94%
10,0008.61% ± 0.69%31.22% ± 0.22%15.23% ± 1.41%41.20% ± 1.36%
20,0009.33% ± 1.39%30.45% ± 0.69%13.69% ± 1.13%43.47% ± 0.91%
Disclaimer/Publisher’s Note: The statements, opinions and data contained in all publications are solely those of the individual author(s) and contributor(s) and not of MDPI and/or the editor(s). MDPI and/or the editor(s) disclaim responsibility for any injury to people or property resulting from any ideas, methods, instructions or products referred to in the content.