Article

Sodium p-Perfluorous Nonenoxybenzene Sulfonate (OBS) Induces Developmental Toxicity Through Apoptosis in Developing Zebrafish Embryos: A Comparison with Perfluorooctane Sulfonate

School of Civil and Architecture Engineering, Jiangxi University of Water Resources and Electric Power, Nanchang 330099, China
*
Author to whom correspondence should be addressed.
Water 2025, 17(16), 2450; https://doi.org/10.3390/w17162450
Submission received: 7 July 2025 / Revised: 30 July 2025 / Accepted: 14 August 2025 / Published: 19 August 2025
(This article belongs to the Section Biodiversity and Functionality of Aquatic Ecosystems)

Abstract

Perfluorooctane sulfonate (PFOS) is a representative persistent organic pollutant that exerts toxic effects on aquatic organisms. As an alternative to PFOS, sodium p-perfluorous nonenoxybenzene sulfonate (OBS) has been frequently detected in aquatic environments and human tissues in recent years. However, its toxic effects on aquatic organisms and potential health risks to humans remain unclear. Zebrafish embryos are transparent and amenable to in vivo manipulation and observation. Therefore, in the present study, we investigated its developmental toxicity in zebrafish embryos, with PFOS as the positive control. We exposed zebrafish embryos to different concentrations of OBS (15, 20, and 25 mg/L) and PFOS (15 mg/L) for 2–168 h post fertilization (hpf) and then examined physiological and gene expression changes. At 24 hpf, spontaneous twitches in the 25 mg/L OBS group decreased to (5 ± 0.34)/min. By 48 hpf, the 20 mg/L OBS group’s hatching rate was (47.78 ± 2.22)%, significantly lower than the control. At 72 hpf, heart rates in both the PFOS and OBS groups were elevated, at 82 ± 0.6, 84.5 ± 0.5, 89.4 ± 0.3, and 93.7 ± 0.4, respectively. Similarly to PFOS, OBS induced developmental toxicity in zebrafish embryos. In addition, both OBS and PFOS exposure downregulated the expression level of anti-apoptotic Bcl-2 in zebrafish embryos, with a notable 0.53-fold decrease observed in the 25 mg/L OBS group. Conversely, they upregulated the expression levels of pro-apoptotic Bax, Caspase-3, and Caspase-9, with Caspase-3 expression increasing 1.14-, 1.5-, and 1.7-fold in the 15 mg/L PFOS, 20 mg/L OBS, and 25 mg/L OBS groups, respectively. These OBS- and PFOS-induced changes in gene expression increased apoptosis, suggesting that OBS can induce developmental toxicity in zebrafish embryos, and that its effect is comparable to that of PFOS. Therefore, considering its aquatic toxicity, measures aimed at limiting or remediating OBS pollution in the environment are necessary.

1. Introduction

Per- and polyfluoroalkyl substances (PFASs) are a class of compounds in which all the hydrogen atoms bonded to carbon atoms have been replaced by fluorine atoms. These compounds exhibit exceptional thermal stability, chemical stability, and surface activity, as well as hydrophobic and oleophobic properties [1]. They are also widely used in both industrial and daily applications, and have been extensively detected in environmental matrices, biological tissues, and human blood [2,3,4]. Perfluorooctane sulfonate (PFOS) is the most frequently encountered PFAS in the environment, and owing to its environmental persistence, long-range transport, bioaccumulation potential, and potential biotoxicity, it was listed in Annex B of the Stockholm Convention in 2009 to the end of restricting its production and use [5]. Therefore, to address the wide range of PFOS application in the industry, sodium p-perfluorous nonenoxybenzene sulfonate (OBS) has been introduced as a substitute for PFOS.
OBS is widely used in various industries in China, including fire-fighting, oil extraction, and photosensitive material production, and its annual production is estimated at 3500 tons [6]. In recent years, OBS has been detected in surface waters around the Daqing Oilfield, with its concentration reaching 3.2 μg/L [7]. Further, Shi et al. reported a significantly high OBS concentration in the blood of a wild crucian carp, with the average concentration reaching 144 μg/L [8]. Even though the distribution patterns of OBS in fish tissues are similar to those of PFOS, its bioaccumulation potential is lower. Notably, recent detections of OBS in maternal and umbilical cord serum, with concentrations of 0.711 and 0.604 μg/L, respectively [9], have indicated that the widespread presence and high residual levels of OBS may pose developmental risks to wildlife and humans.
OBS exhibits toxicity levels comparable to that of PFOS, with its 96 h LC50 values in adult zebrafish and tadpoles at 25.5 and 28.4 mg/L, respectively [6]. It has also been shown that exposure to 300 μg/L OBS for 21 d in zebrafish results in significant shifts in gut microbiota composition and alterations in the levels of 706 hepatic metabolites. In addition, low-dose OBS exposure in mice impairs intestinal barrier function and disrupts hepatic metabolism [10]. Recent findings have also indicated that exposure to OBS at concentrations between 0.04 and 4 mg/L can adversely affect energy intake and expenditure in developing zebrafish and also reduce survival rates and yolk sac area in this species [11]. However, the molecular mechanisms underlying OBS-induced developmental toxicity largely remain unclear.
Fish, particularly small freshwater species, such as zebrafish (Danio rerio), medaka (Oryzias latipes), and fathead minnows (Pimephales promelas), are frequently used in acute and chronic assays to assess chemical toxicity as well as regulatory ecotoxicology [12,13,14]. Zebrafish embryos are characterized by ease of manipulation, optical transparency, and a high sensitivity to toxicant exposure. Therefore, zebrafish have emerged as a particularly valuable model organism for studying the developmental toxicity of early-life chemical exposure based on endpoints, such as survival, development, and gene expression [15,16]. Fish embryo assays, regarded as non-suffering in vivo tests, are accepted alternatives to other animal model experiments [17,18]. However, acute toxicity endpoints, including morphological changes, inhibited hatching rates, and mortality are insufficient for elucidating toxicity mechanisms. Therefore, changes in gene expression patterns are often used for more in-depth mechanistic understanding [19,20,21]. Examining toxicity effects at the molecular level can also yield highly accurate mechanistic and potentially predictive biomarkers.
Because of the current understanding regarding the developmental toxicity of OBS in zebrafish, this study was conducted to investigate the effects of OBS on zebrafish embryonic development. Various toxicological endpoints, including changes in hatching rate, body length, heart rate, spontaneous movement, and yolk sac area, as well as malformation and mortality, were examined. In addition, quantitative reverse transcription–polymerase chain reaction (qRT-PCR) was used to detect changes in the expression patterns of specific development-related genes, including apoptosis-related genes, Bcl-2, Bax, Caspase-3, and Caspase-9. OBS exposure was further compared with PFOS exposure as a positive control, aiming to preliminarily clarify the toxic effects of OBS. This study aimed to conduct a comprehensive analysis of the potential risks associated with OBS exposure in zebrafish embryos and to enhance understanding of its underlying mechanisms.

2. Materials and Methods

2.1. Chemicals and Reagents

OBS (≥98% purity) was purchased from Ningbo Yongshen Trading Co., Ltd. (Ningbo, China) and PFOS (≥98% purity) was obtained from Shanghai Aladdin Biochemical Technology Co., Ltd. (Shanghai, China). Both OBS and PFOS were prepared as 2 g/L stock solutions using chromatography-grade dimethyl sulfoxide (DMSO). Then to prepare a series of working solutions before the experiments, the stock solutions were diluted with E3 medium. The ultrapure RNA extraction kit used in this study was purchased from Kangwei Century Biotechnology Co., Ltd. (Taizhou, China). Further, anhydrous ethanol (≥99.7% purity) was obtained from Sinopharm Chemical Reagent Co., Ltd. (Shanghai, China). All the chemicals and solvents used in this study were chromatography- or analytical-grade.

2.2. Zebrafish Maintenance and Embryo Collection

Four-month-old wild-type AB strain zebrafish, sourced from Nanjing Ezerinka Biotechnology Co., Ltd. (Nanjing, China), were housed in the fully automated Zebtec-Active Blue zebrafish breeding system (Tecniplast, Varese, Italy), which comprises an aeration pump, a temperature control unit, UV sterilization unit, system filters, salinity and pH adjustment unit, and light cycle controls. The breeding system maintains continuous water circulation, and during operation, it keeps water temperature, dissolved oxygen concentration, pH, conductivity, COD, ammonia nitrogen concentration, and nitrite concentration at 26–28 °C, 5–8 mg/L, 7.2–7.8, 480–520 µS, 10–20 mg/L, 0.04–0.1 mg/L, and 0.01–0.02 mg/L, respectively, with a 14 h/10 h light/dark cycle. The zebrafish were fed pellet feed three times daily at 8:30, 12:00, and 17:00, with the water valve closed during feeding. After approximately 10 min, once the fish had finished eating, water circulation was resumed. Daily inspections of system operation were conducted, and dead fish were promptly removed, whereas sick ones were isolated. Furthermore, the tanks were regularly cleaned and disinfected to prevent bacterial growth and maintain zebrafish health.
The zebrafish embryos used in this study were obtained through mating under laboratory-controlled settings. To optimize egg production, the broodstock zebrafish were adequately pre-fed at least 1 week prior to mating. Because zebrafish may consume their eggs to replenish internal protein reserves, we used mating boxes (Tecniplast) with a central spawning bed divider to separate the fish from their eggs. On the mating day evening, four 1.7 L mating boxes were prepared. Sixteen healthy females and sixteen healthy males showing good reproductive condition were selected from the breeding system. Four females and four males (1:1 ratio) were placed in each box, separated by the provided partition. These mating boxes were then placed in a breeding environment (28 °C) in the fish facility, following the standard zebrafish diurnal cycle, and maintained overnight in the dark. The next morning, as the lights were turned on, the divider was removed to allow natural mating and egg production under light as a stimulus; disturbances were minimized during this period. Once spawning was complete, eggs were collected, transferred to culture dishes, rinsed with system water, and inspected under a stereomicroscope. Abnormal embryos were removed.

2.3. Embryo Developmental Toxicity Assays

Following OECD guidelines for the testing of chemicals No. 236 [22], at 2 h post fertilization (hpf), normal embryos, which exhibited plumpness, viscosity, and transparency, were selected under a stereomicroscope (SZ61, Olympus, Beijing, China) for developmental toxicity assays. A six-well plate was used for the OBS exposure treatments, with OBS concentrations at 0 (solvent control), 15, 20, and 25 mg/L in E3 medium prepared from the 2 g/L stock solution. The concentration range was selected based on pre-experiments and previously reported 96 h LC50 values of OBS in zebrafish, which indicated a level sufficient to induce clear phenotypic effects within a short exposure period, as supported by information from the prior literature [7,23]. A 15 mg/L PFOS solution was used as the positive control. Each well contained 5 mL of exposure solution and 30 embryos, with three replicates for each concentration group (treatment, positive control, and control group). All the treatment solutions had a final DMSO concentration of 0.01% (v/v). The plates were incubated at 28 ± 0.5 °C in a biochemical incubator with a 14 h/10 h light-dark cycle for 7 days. The exposure solutions were replaced with fresh samples daily, and membranes, dead eggs, and debris were removed daily. Developmental toxicity endpoints were observed and recorded at specified time points using an inverted BDM320 microscope (Optec, Shenzhen, China), following the toxicity criteria established by Nagel [24]: spontaneous movement at 24 hpf, hatching rate and heart beat rate at 48, 56, and 72 hpf; body length at 72, 96, and 120 hpf, and mortality at 8, 24, 32, 48, 56, 72, 96, 120, 144, and 168 hpf. At 120 hpf, fish larvae were rinsed three times with water from the rearing system to eliminate surface residues, and thereafter, 10 well-developed fish larvae were aspirated from each group using a Pasteur pipette and placed in 1.5 mL RNase-free centrifuge tubes and stored in a freezer at −80 °C for subsequent analysis.

2.4. Total RNA Extraction and Concentration Measurement

After zebrafish embryos were cultured for 120 hpf, 10 larvae were placed in a sterilized tube with steel beads and 300 μL of pre-cooled TRIzon reagent (Cwbio, Taizhou, China). This step was followed by two 30 s homogenization steps at 60 Hz, with a 20 s resting period between them. An additional 600 μL of TRIzon Reagent was added to the homogenized sample, which was then pipetted to ensure thorough cell lysis. The mixture was then left to stand at 25 °C for 5 min to allow nucleic acids to separate from proteins. Thereafter, 180 μL of pre-cooled chloroform was added, and the tube was sealed, vortexed for 15 s, and left to stand again at 25 °C for 2 min. This step was followed by centrifugation at 12,000 rpm and 4 °C for 10 min, and the resulting upper aqueous phase (410 μL) was transferred into a new 1.5 mL RNase-free centrifuge tube. Freshly prepared RNase-free 70% ethanol (410 μL) was then added followed by mixing through inversion and transfer to a centrifuge tube with a filter column. The addition of RNase-free 70% ethanol was repeated multiple times if necessary. After centrifugation at 12,000 rpm for 20 s, the filtrate was discarded, and the column was placed back in the tube and 700 μL of Buffer RW1 reagent (Cwbio) was added without touching the filter with the pipette tip. Centrifugation was again performed at 12,000 rpm for 20 s. The resulting filtrate was discarded and the column was reinserted into the tube. Next, 500 μL of Buffer RW2 reagent (Cwbio) containing anhydrous ethanol was added to the adsorption column using a pipette, and after centrifugation at 12,000 rpm for 20 s, the liquid phase was discarded. The adsorption column was gently placed back into the centrifuge tube and centrifugation was again performed at 12,000 rpm for 2 min to remove residual liquid. The cap was opened, and the column was air-dried at room temperature for a 3 min. Once dry, the column was transferred into a new RNase-free tube, and 50 μL of RNase-free water was added to elute RNA. After leaving to stand at room temperature for 1 min, centrifugation was performed at 12,000 rpm for 1 min, and the RNA was collected was stored at −80 °C to prevent degradation. Subsequently, a 5 μL sample of the RNA was diluted 5-fold with RNase-free water, and total RNA concentration was measured using a NanoDrop 2000 spectrophotometer (ThremoFisher Scientific, Waltham, MA, USA).

2.5. cDNA Synthesis and Real-Time qRT-PCR

To prevent genomic DNA reactions, a mixed solution was prepared on ice, and 1 μL of total RNA sample was added to this solution followed by incubation in a water bath at 42 °C for 2 min. After thorough mixing, 10 μL of mix was further incubated in a water bath at 37 °C for 15 min and at 85 °C for 15 s, and thereafter immediately placed on ice. The product (cDNA) was diluted with 80 μL of RNase-free water to a final volume of 100 μL, and qPCR was performed. The primers used were synthesized and purified by Sangon Biotech (Shanghai, China). Details regarding these primers as well as β-actin, which served as the reference gene, are listed in Table 1. The qPCR reaction mixture was prepared on ice in a 1.5 mL RNase-free centrifuge tube and added to a fluorescence quantitative 96-well plate (PCR-96M2-HS-C, Axygen Scientific, Union City, CA, USA). Then, to add the cDNA solution, an automatic pipette was used. Four parallel experiments were performed for each treatment group. After sample addition, the plate was sealed with a transparent sealing film and briefly centrifuged to ensure that the reaction mixture settled at the bottom of each well, and fluorescence quantification was performed. In brief, the centrifuged 96-well plate was placed in a qPCR instrument (QuantStudio® 7 Flex, Applied Biosystems, Foster City, CA, USA), and PCR amplification and fluorescence quantification were performed following a four-step method: pre-denaturation at 95 °C for 15 min, denaturation at 95 °C for 5 s, annealing at 60 °C for 34 s, and extension at 72 °C for 30 s, for a total of 40 cycles. Fold changes in the expression levels of target genes were analyzed using the 2−ΔΔCt method [25].

2.6. Statistical Analysis

All statistical analyses were performed using GraphPad Prism software version 7.0 (GraphPad Inc., San Diego, CA, USA) and all data were presented as mean ± standard error of the mean (SEM). The normality of the data was assessed using the Kolmogorov–Smirnov test and the homogeneity of variance was verified using Levene’s test. Furthermore, differences between treatment and control groups were evaluated using one-way analysis of variance (ANOVA), followed by Dunnett’s post hoc test. Statistical significance was set at p < 0.05.

3. Results

3.1. Effects of OBS on Zebrafish Embryo Developmental Morphology

Morphological changes were observed and photographed under an inverted microscope at a 40× magnification. Throughout the observation period, the embryos in the normal control group developed normally, with the embryos and larvae showing almost no morphological changes (Figure 1A,D). Furthermore, the embryos in the positive control (PFOS) and OBS-exposed groups did not show any obvious deformities within 48 hpf. However, beyond 48 hpf, the embryos exhibited varying degrees and forms of morphological changes, including yolk sac edema, pericardial edema, and spinal curvature. Notably, embryos in the 15 mg/L PFOS treatment group showed obvious yolk sac edema (Figure 1B) and pericardial edema (Figure 1C) at 48 hpf, whereas those in the OBS exposure group gradually began to show developmental toxicity symptoms at 56 hpf (Figure 1E,F). Moreover, in the positive control group, the deformity rate significantly increased with increasing exposure time, and at 120 hpf, most of the larvae in this group sank to the bottom of the container, exhibited severe spinal curvature, and lost their swimming ability, showing a deformity rate of nearly 100% (Figure 1G,H). The results of the statistical analysis of the morphological changes in zebrafish embryo and larvae in the different treatment groups at 120 hpf are presented in Table 2.

3.2. Effects of OBS on Spontaneous Movements in Zebrafish Embryos

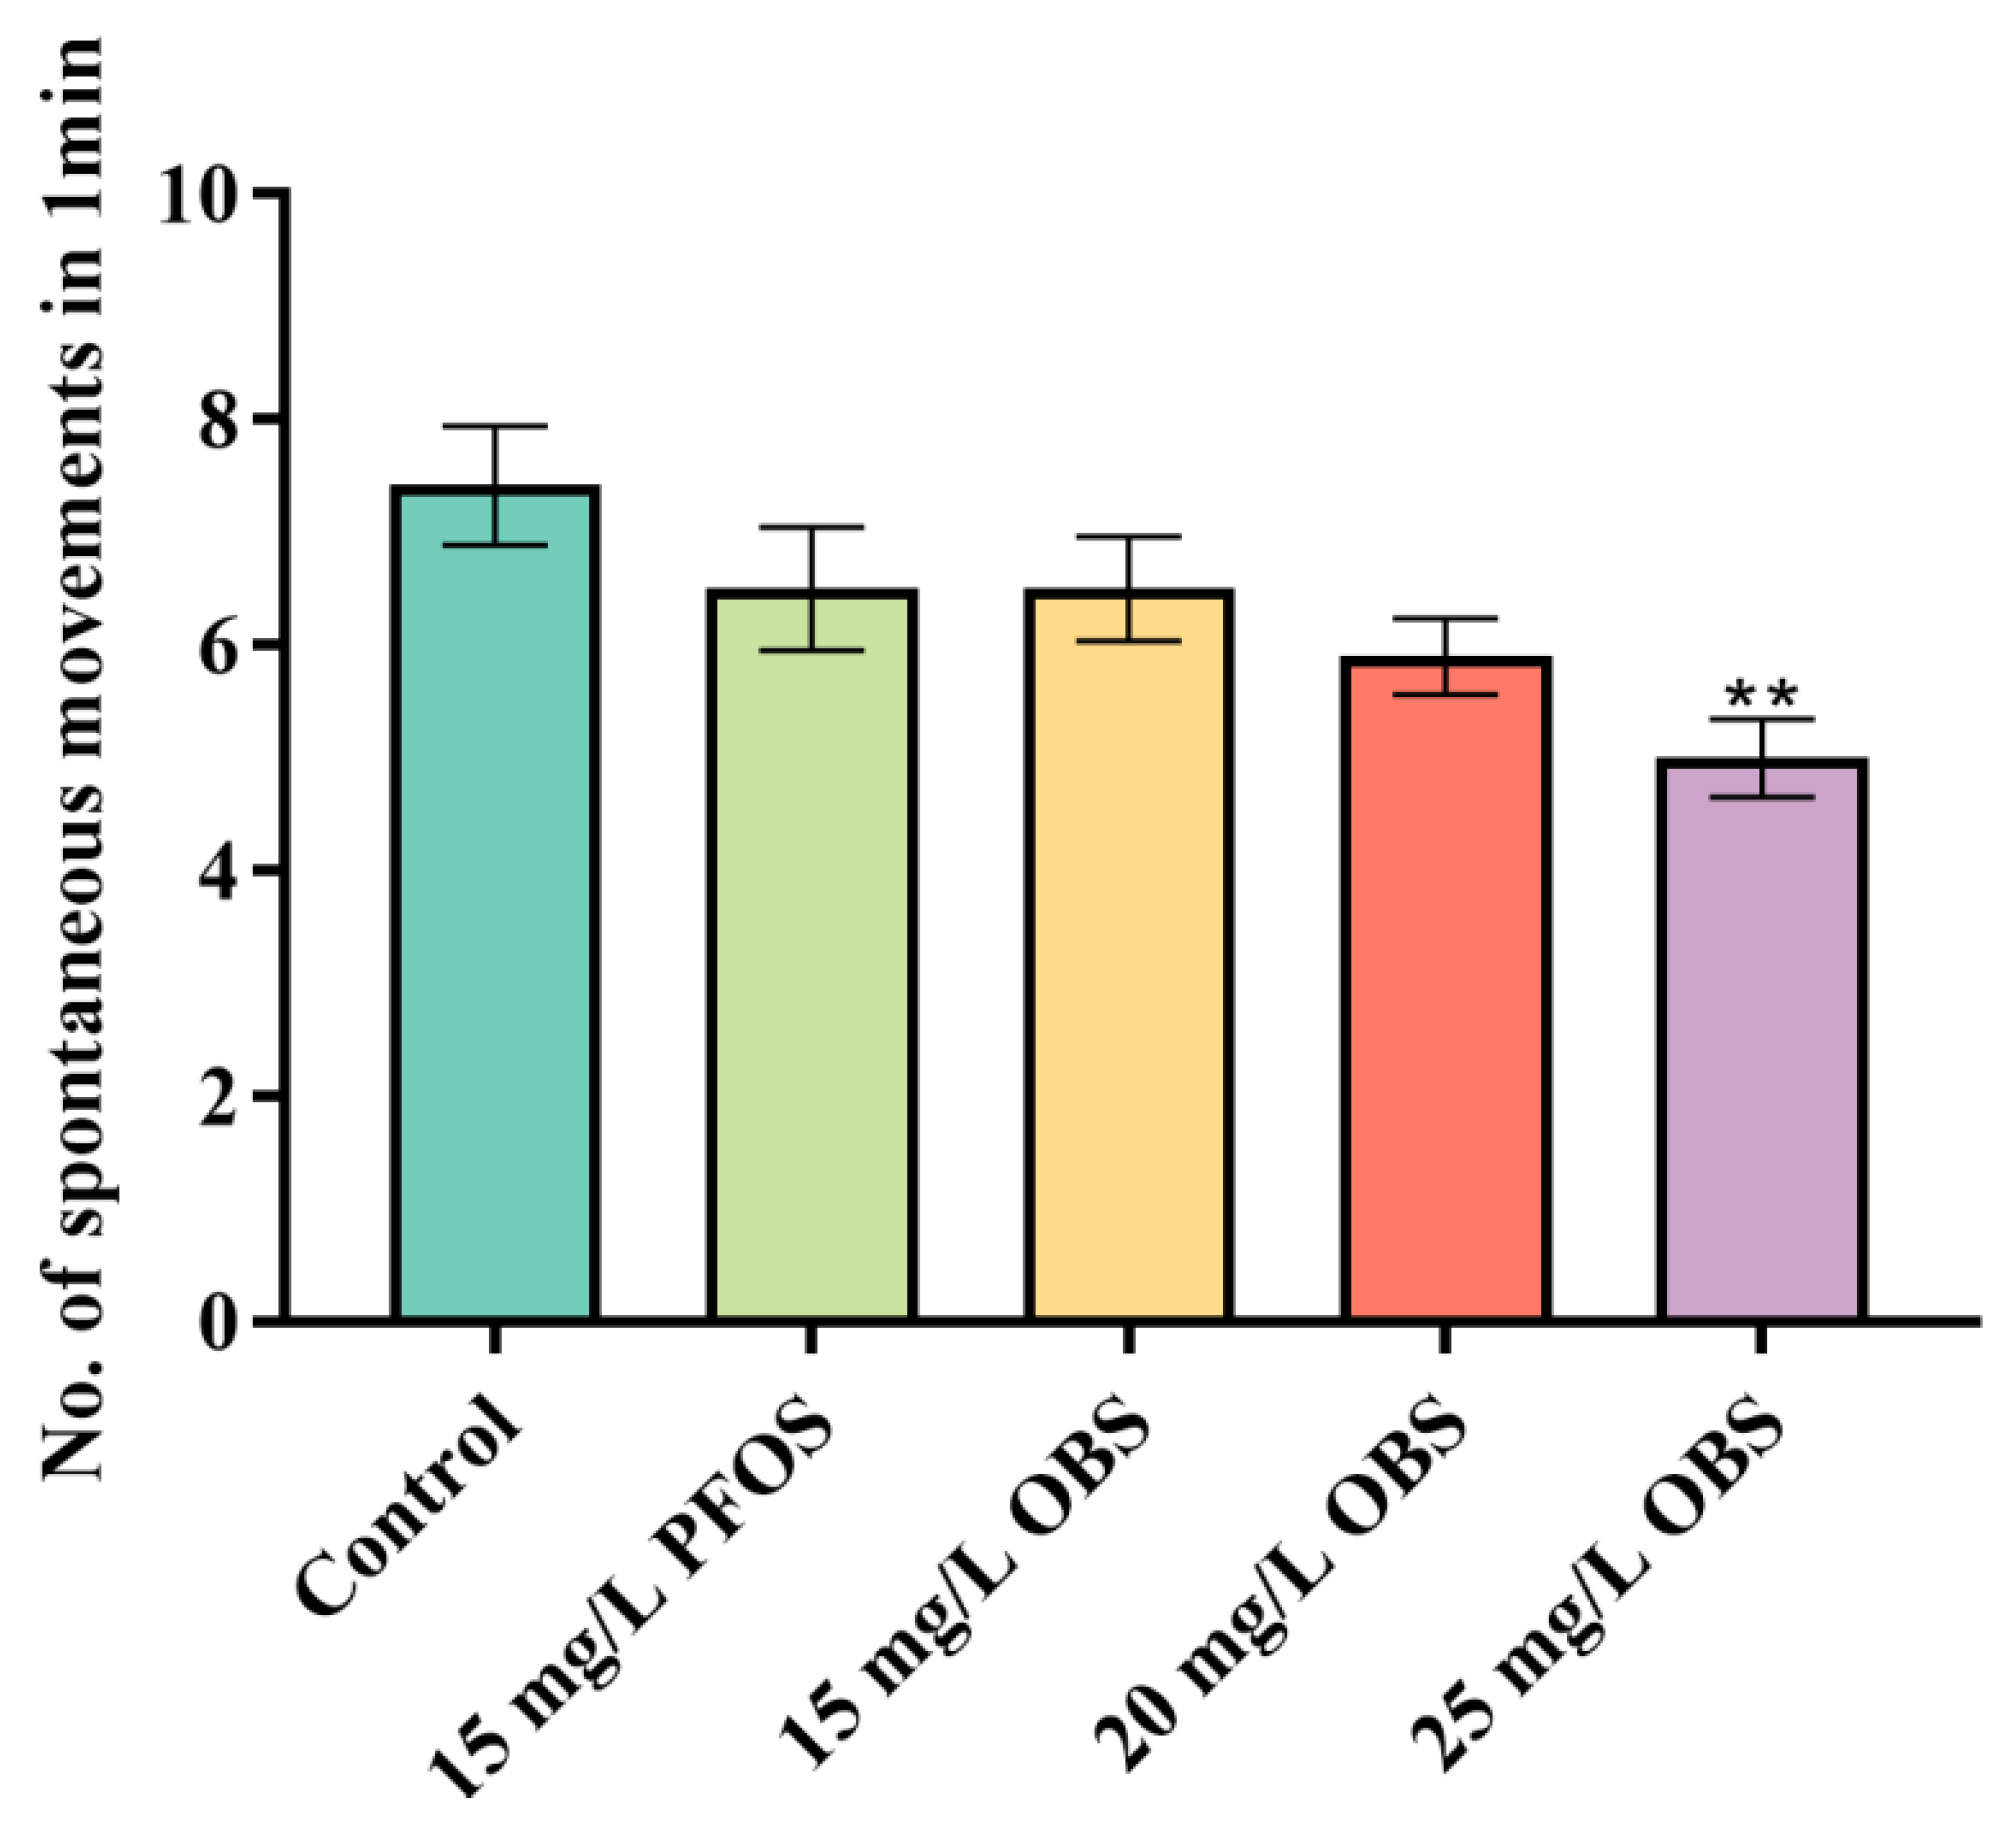
At 24 hpf, zebrafish embryos exhibited regular autonomous twitching at the tail level. As shown in Figure 2, the average number of autonomous twitches for embryos in the normal control group was 7.42 ± 0.53/min. However, for embryos in the 15 mg/L PFOS group, it was 6.5 ± 0.55/min 24 hpf, implying no significant effect difference relative to the control. In addition, the average number of autonomous twitches for embryos in the 15-, 20-, and 25 mg/L OBS exposure groups decreased with increasing OBS concentration, revealing a dose-dependent effect. Embryos in the 25 mg/L OBS group showed a significant decrease in the number of twitches to (5 ± 0.34)/min 24 hpf.

3.3. Effects of OBS on Zebrafish Embryo Hatching Rate

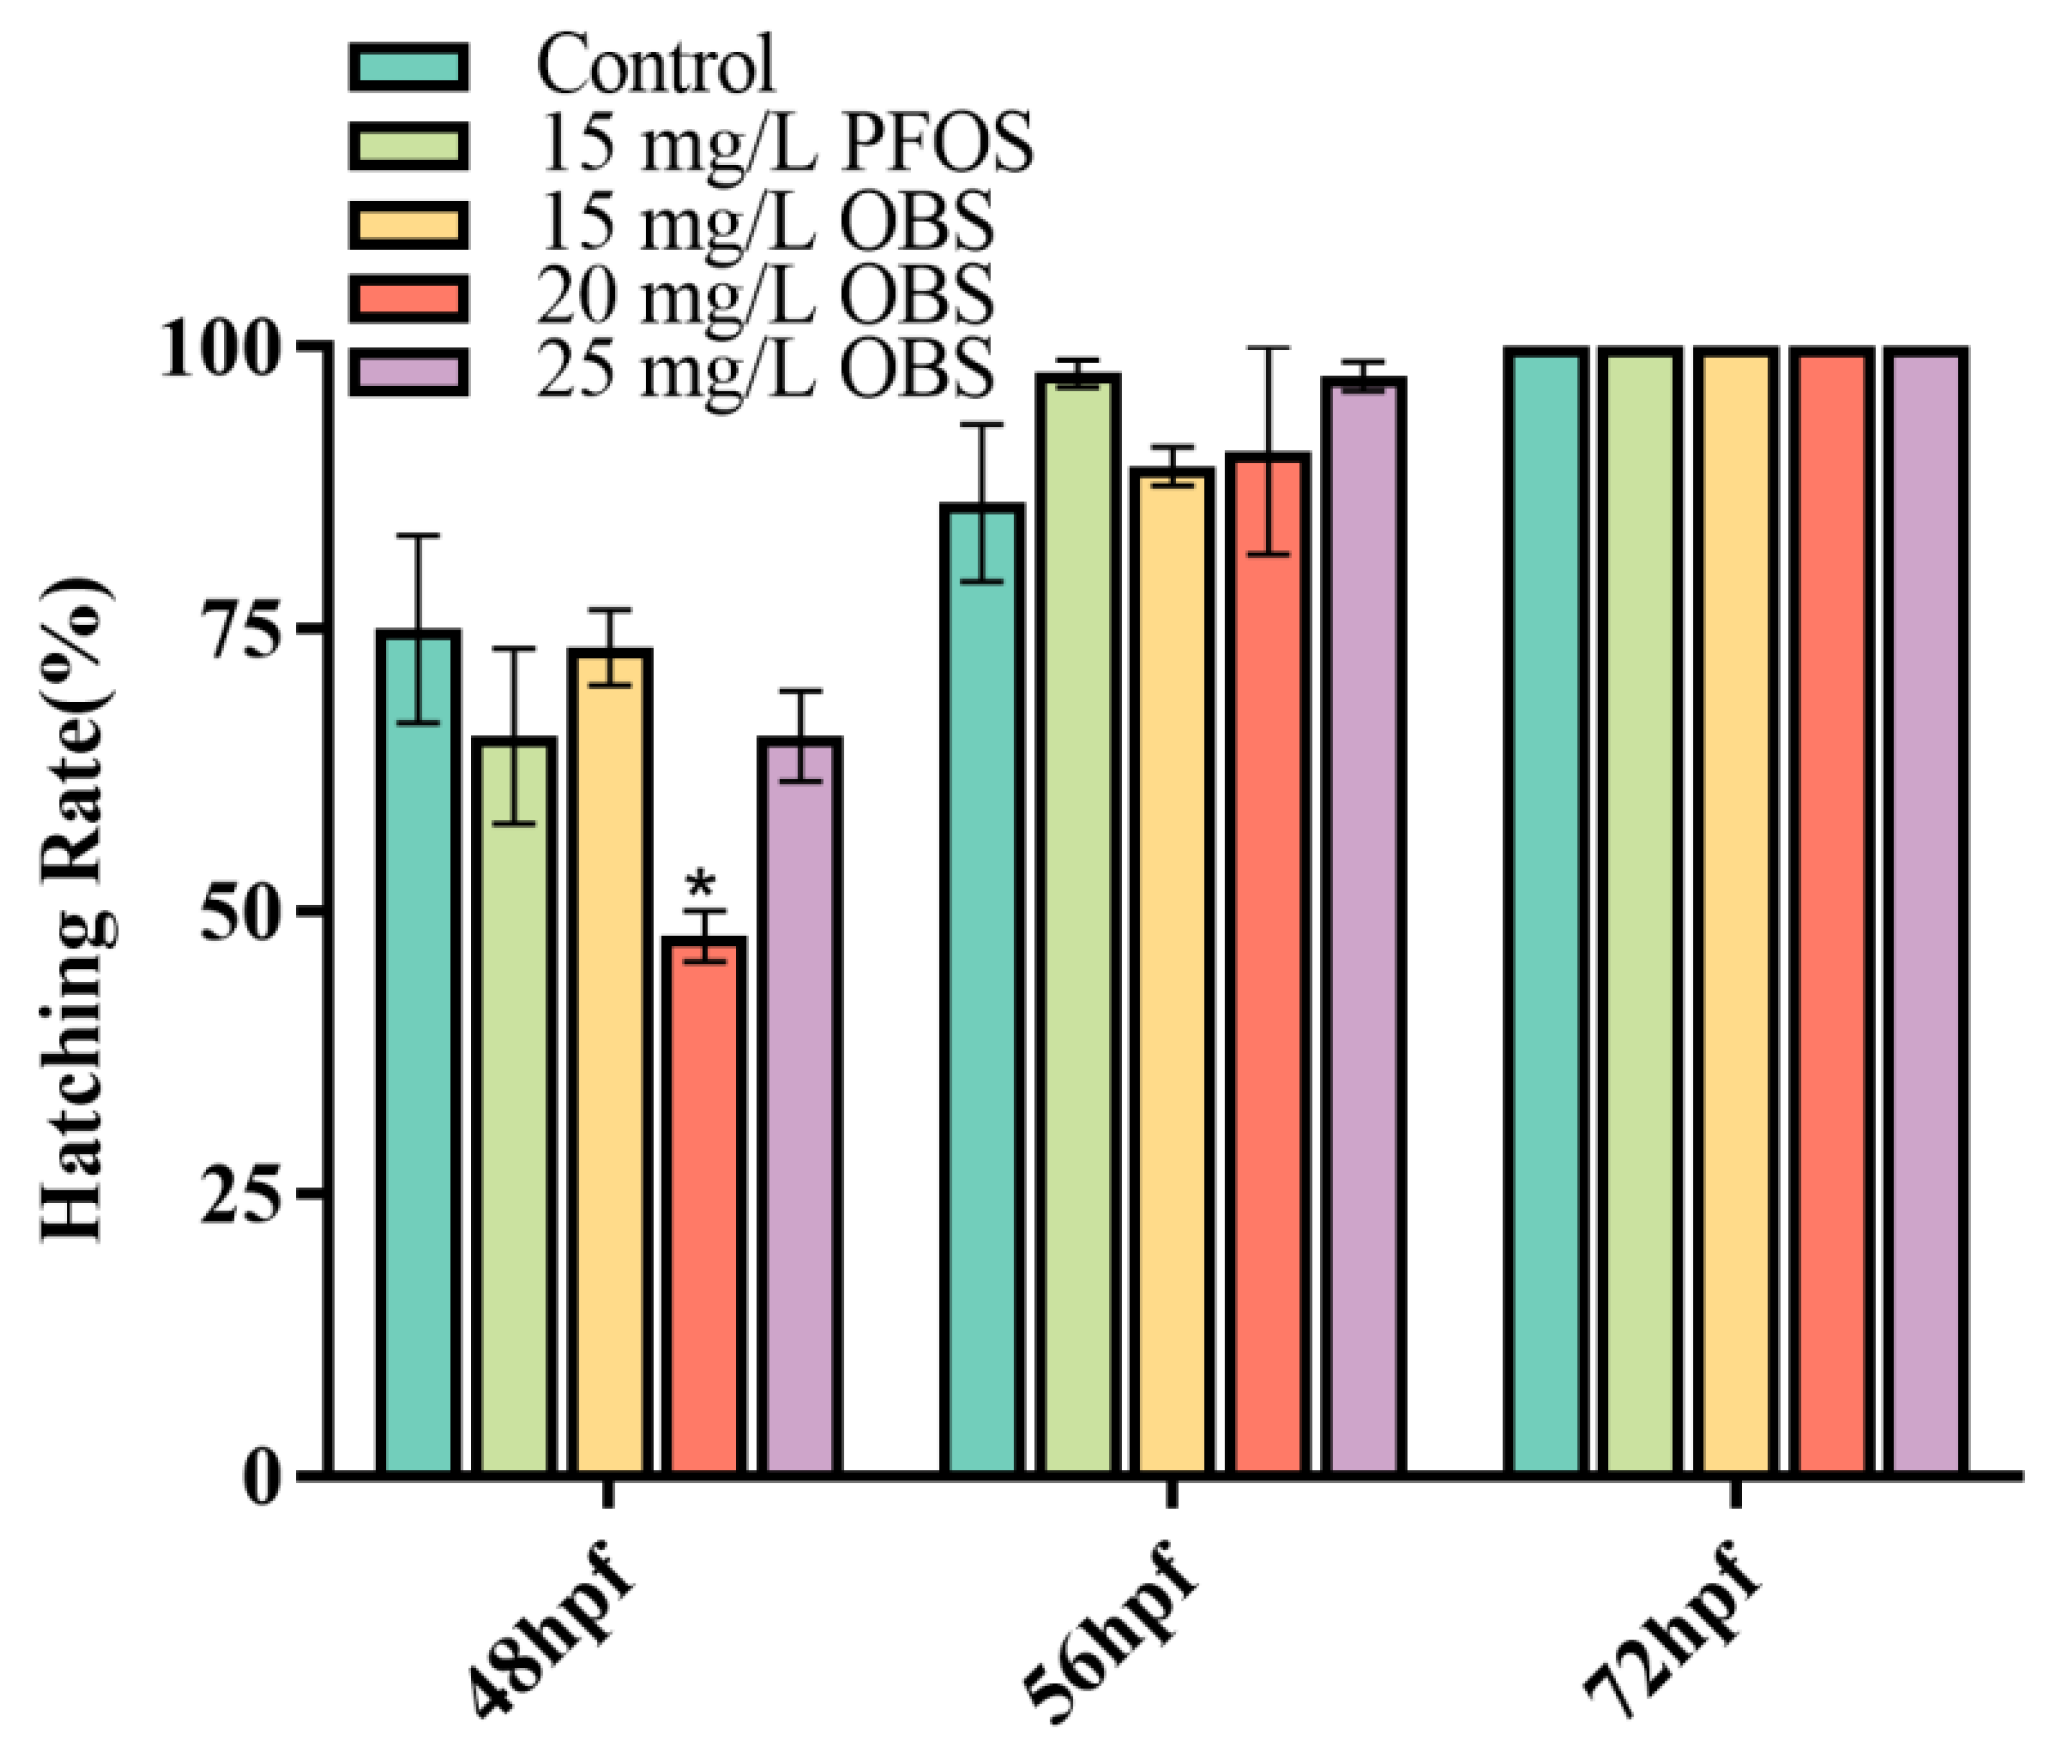
The hatching rates of embryos at 48, 56, and 72 hpf are shown in Figure 3. It is evident that embryo hatching commenced in all treatment groups at 48 hpf, with the normal control group showing a hatching rate of 75 ± 8.33%. As expected, the positive control PFOS and OBS exposure treatments inhibited hatching to varying degrees. In particular, the hatching rate for embryos in the 20 mg/L OBS exposure group was significantly lower than that observed for the control group (p < 0.05; 47.78 ± 2.22%). After 48 hpf, hatching rates gradually increased in all the treatment groups. However, by 56 hpf, the hatching rates for embryos in the positive control PFOS and OBS exposure groups were higher than those for embryos in the control group, with the hatching rate for embryos in the 15 mg/L PFOS at 97.67 ± 1.16%. For the OBS exposure group, a clear dose-dependent effect was observed, with the hatching rates for embryos in the 15, 20, and 25 mg/L OBS exposure groups at 89.45 ± 1.71%, 90.8 ± 9.2%, and 97.4 ± 1.3%, respectively. These findings indicated that both OBS and PFOS accelerate zebrafish embryo hatching. In addition, at 72 hpf, all the exposure groups showed hatching rates of 100%, implying that all surviving embryos hatched.

3.4. Effects of OBS Exposure on Zebrafish Embryo Mortality

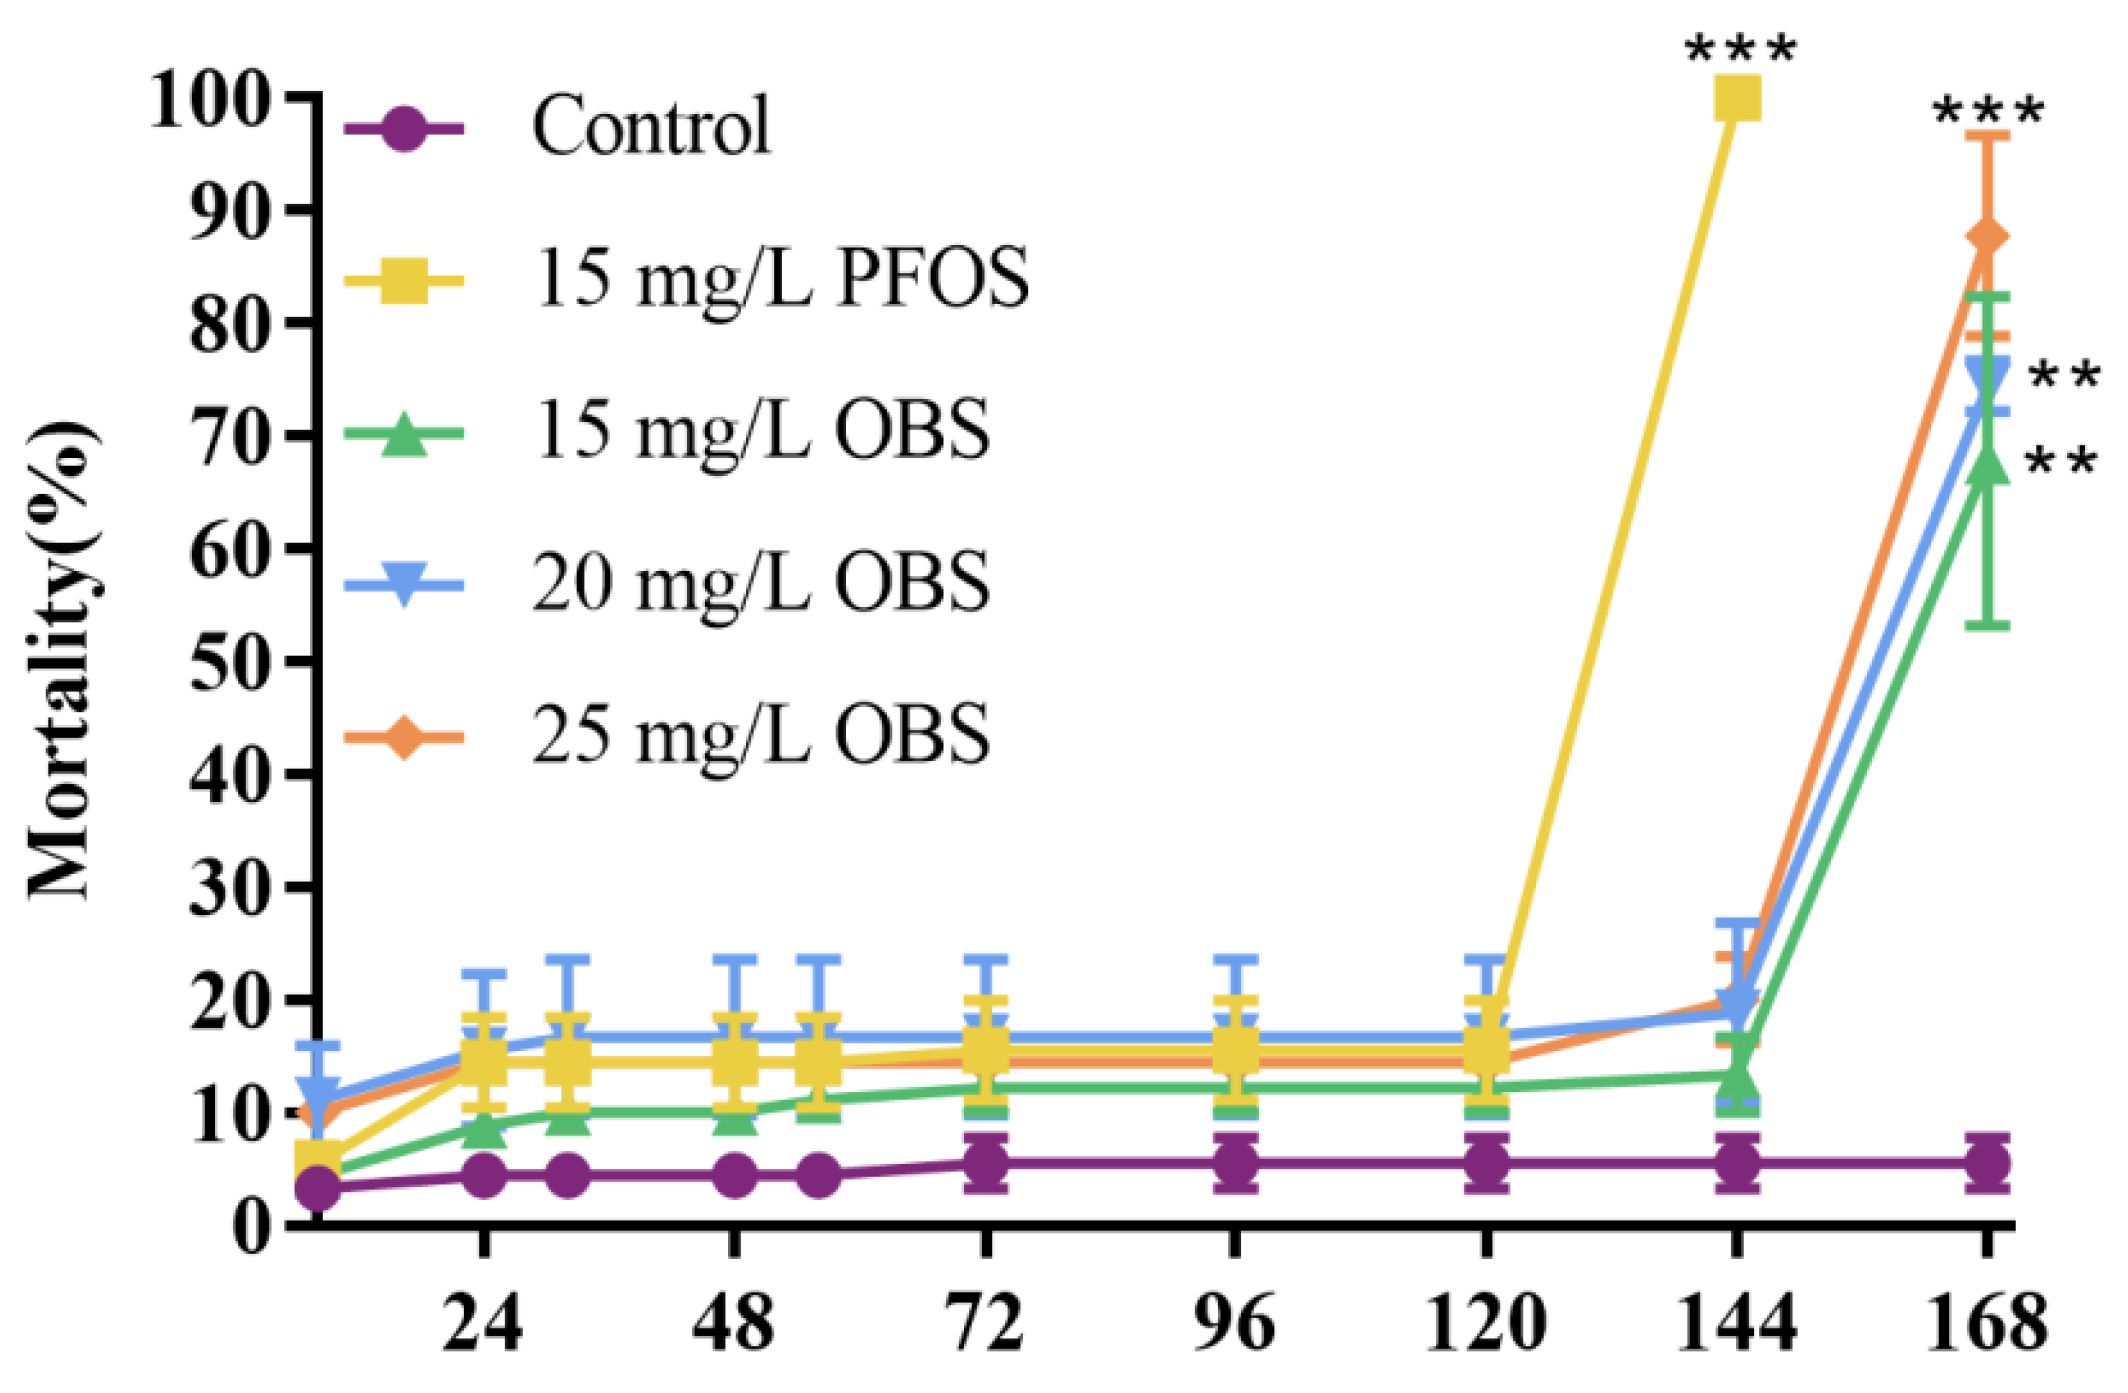
During the development of zebrafish embryos from 8 to 120 hpf, as shown in Figure 4, the PFOS and OBS exposure groups showed mortality rates higher than that observed for the normal control group; however, the differences were not statistically significant (p > 0.05). Once the embryos hatched into larvae, they could feed autonomously, and their growth and development remained relatively stable. Notably, by 72 hpf, all the embryos had completed hatching, and the mortality rates in both the normal control and exposure groups remained stable until 120 hpf, with the average mortality rate in the normal control group remaining below 10%. For the 15 mg/L PFOS group, a significant mortality event (100% mortality) was observed at 144 hpf, highlighting the significant toxicity of PFOS. In the OBS exposure groups, the mortality rate increased significantly in a time- and dose-dependent manner from 120 to 168 hpf. At 168 hpf, the 15, 20, and 25 mg/L OBS exposure groups showed mortality rates of 67.78 ± 14.57%, 74.44 ± 2.22%, and 87.78 ± 8.89%, respectively.

3.5. Effects of OBS Exposure on Zebrafish Embryo Heart Beat Rate

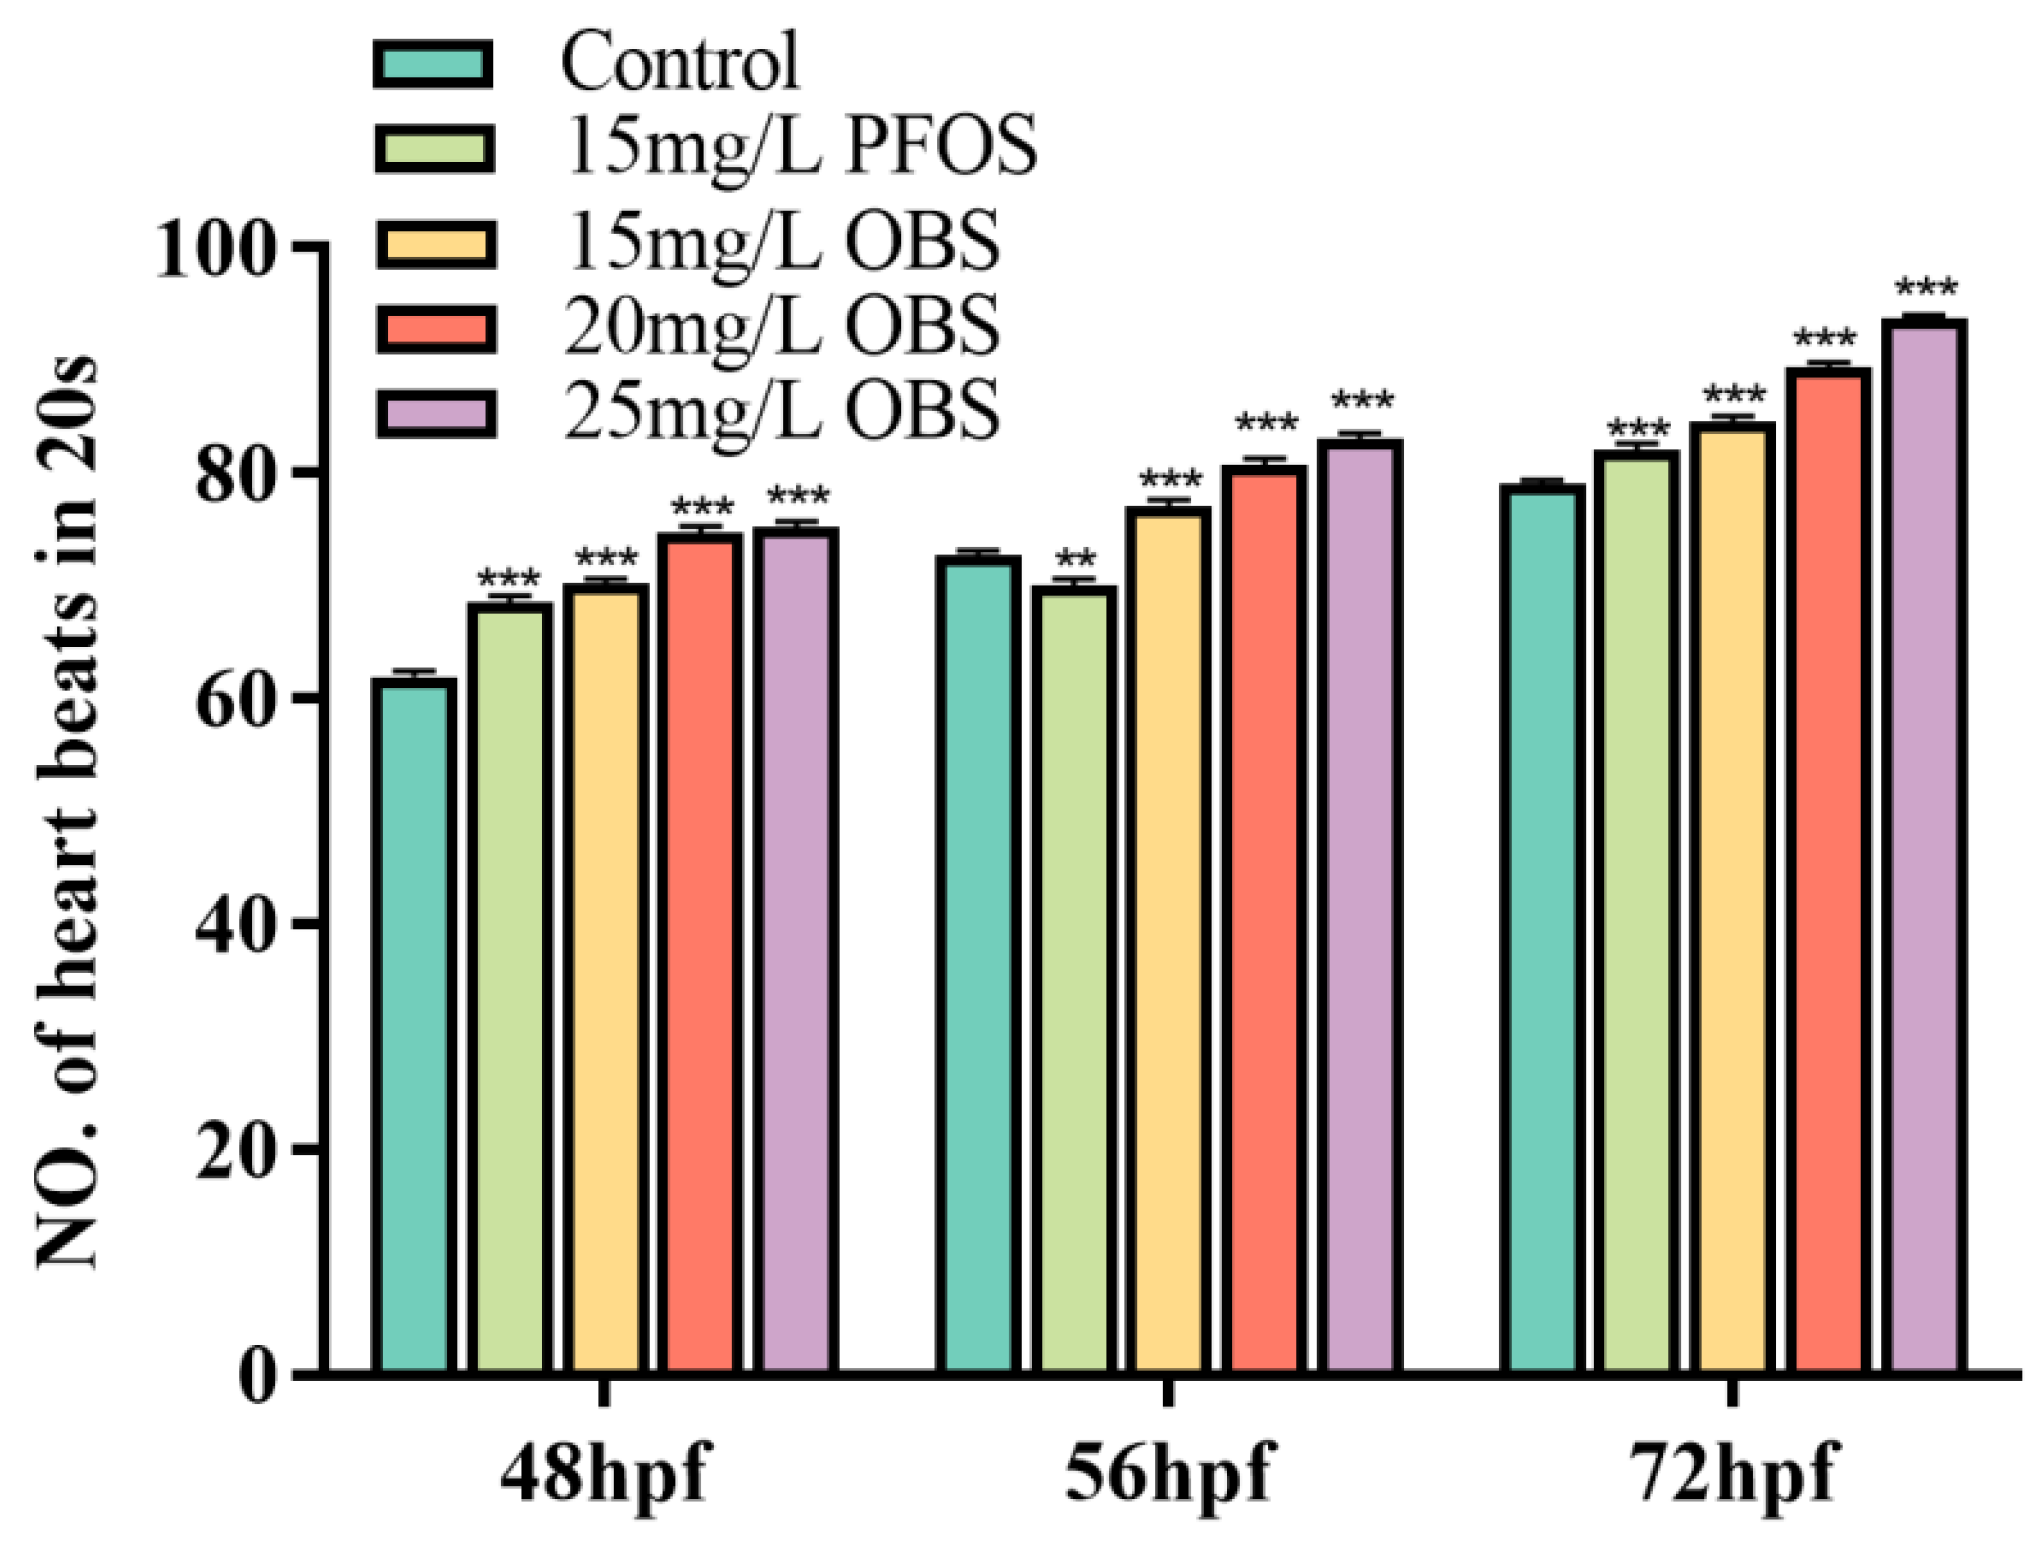
Heart beat is a crucial sub-lethal toxicological endpoint in zebrafish embryo toxicity testing. As shown in Figure 5, embryos in both PFOS and OBS exposure groups exhibited significant differences in heart beat rate relative to those in the normal control group. At 48 hpf, the mean heart beat rate (number of beats in 20 s) for embryos in the normal control group embryos was 61.9 ± 0.5, whereas for embryos in the 15 mg/L PFOS group, it was 68.6 ± 0.5, and for embryos in the 15, 20, and 25 mg/L OBS exposure groups, the values were 70.2 ± 0.4, 74.7 ± 0.6, and 75.2 ± 0.5, respectively. In addition, at 56 hpf, the heart beat rate for embryos in the PFOS was significantly inhibited, reducing to 70.1 ± 0.5 relative to 72 ± 0.5 obtained for normal control group embryos. Notably, by 72 hpf, the heart beat rates of embryos in the PFOS and OBS exposure groups significantly increased, measuring 82 ± 0.6, 84.5 ± 0.5, 89.4 ± 0.3, and 93.7 ± 0.4 for the 15 mg/L PFOS, 15, 20, and 25 mg/L OBS groups, respectively, whereas that recorded for the normal control group at this time point was only 79 ± 0.4.

3.6. Effects of OBS Exposure on Zebrafish Larvae Body Length

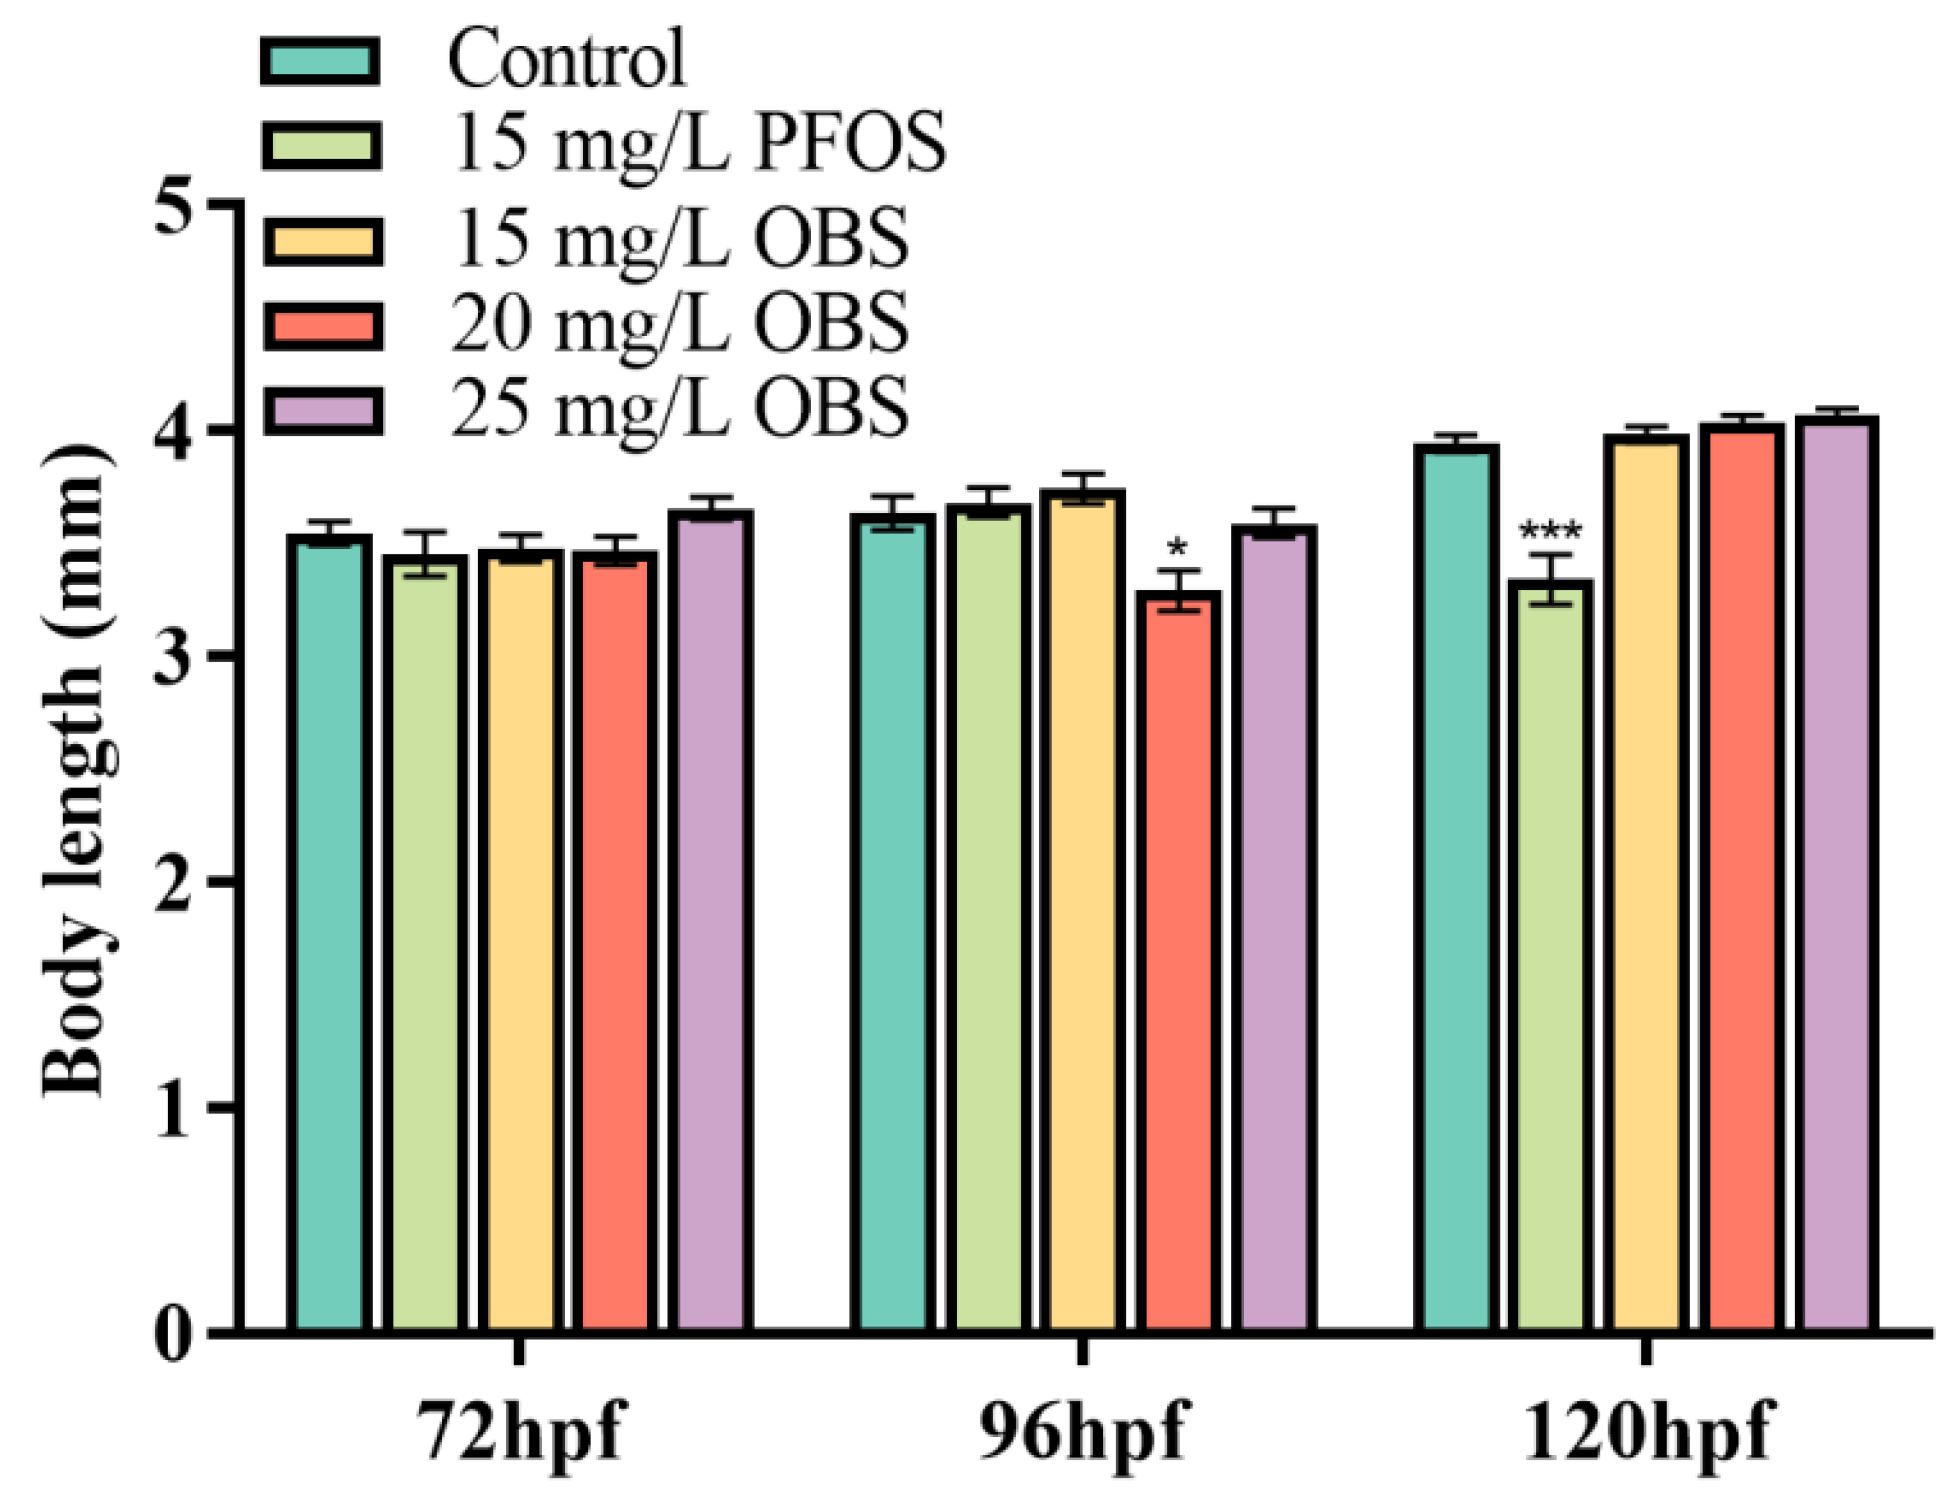
Figure 6 shows body length measurements at 72, 96, and 120 hpf. Specifically, at 72 hpf, there were no significant differences in body lengths between larvae from the treatment groups. However, at 96 hpf, larvae in the 20 mg/L OBS group showed a significant inhibition of body length, and at 120 hpf, larvae in the 15 mg/L PFOS group exhibited a high incidence of deformities as well as significantly inhibited larval growth and development (3.34 ± 0.11 mm relative to 3.94 ± 0.038 mm for the control larvae).

3.7. Effects of OBS Exposure on the Expression Levels of Key Genes in Zebrafish Embryos

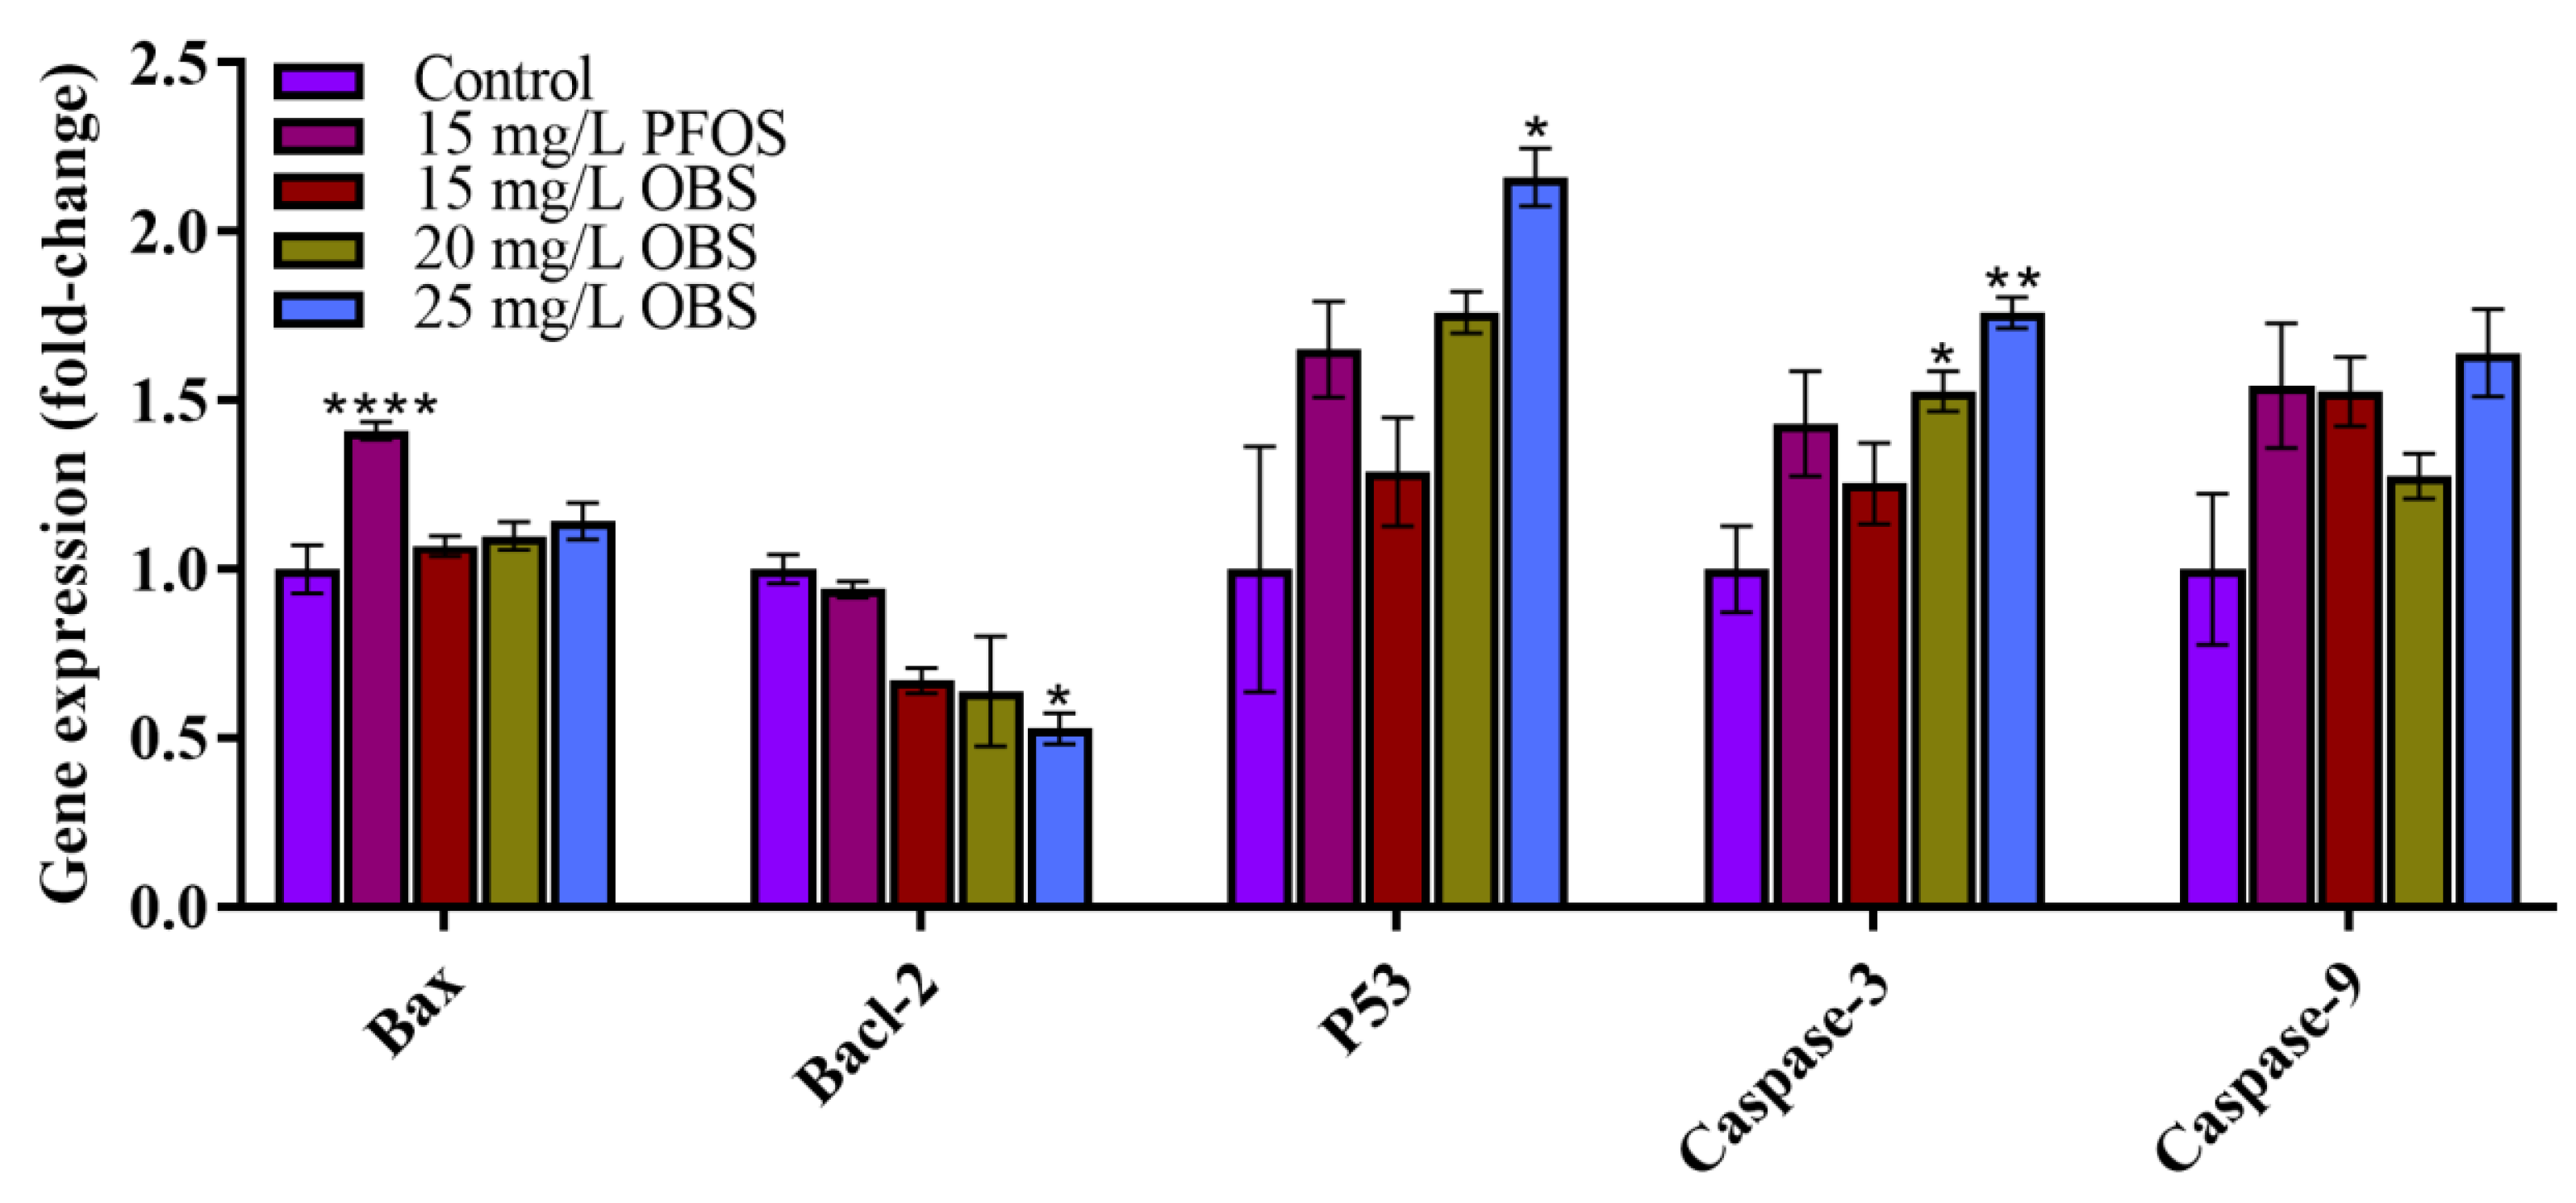
As shown in Figure 7, Bax gene expression increased significantly (1.41-fold) following exposure to 15 mg/L PFOS. Similarly, exposure to 15, 20, and 25 mg/L OBS upregulated Bax expression 1.07-, 1.10-, and 1.14-fold, respectively, implying a dose-dependent effect. Furthermore, Bacl-2 gene expression was significantly inhibited in embryos exposed to the 25 mg/L OBS solution, whereas Caspase-3 gene expression was significantly upregulated 1.5- and 1.7-fold in embryos exposed to the 20 and 25 mg/L OBS solutions, respectively. Even though no significant differences in Caspase-9 gene expression level were observed across the treatment groups relative to the control group, it showed varying degrees of upregulation. Our results also indicated downregulated Bacl-2 expression and upregulated Bax, Caspase-3, and Caspase-9 expression in zebrafish larvae to varying degrees under both OBS and PFOS exposure, resulting in increased inhibition of anti-apoptotic factors and increased apoptosis, as well as increased cell apoptosis.

4. Discussion

Zebrafish embryos are highly sensitive to changes in their environment and are often considered as ideal animal models for monitoring water quality, particularly with respect to teratogens and toxic substances in water [26,27,28]. In this study, even though the exposure concentrations of OBS and PFOS were higher than typical environmental levels for acute exposure experiments, contaminant doses higher than actual environmental levels are often required to effectively evaluate the toxic effects of the contaminants and elucidate the mechanisms underlying their toxicity. The results obtained in this study indicated that acute exposure to both OBS and PFOS (positive control) significantly affected the growth and development of zebrafish embryos, inducing abnormal spontaneous movements, suppressed hatching, increased mortality, accelerated heart beat rates, and morphological changes. Spontaneous movement is an important physiological indicator that often serves as a critical sub-lethal toxicological endpoint for studying the effects of environmental toxins on embryo development. At 24 hpf, hatching had not yet started for the zebrafish embryos. Thus, the chorion surrounding the yolk sac acted as a barrier to large molecules, while remaining sufficiently permeable to oxygen and nutrients to support embryo development [29]. Even though OBS has a higher molecular weight than PFOS, which makes it more difficult for it to penetrate the chorion, it may have a higher affinity for transmembrane transport proteins, allowing it to interact with N-linked glycoproteins on the chorion [30]. This possibly explains the lower number of spontaneous movements observed in the medium- to high-concentration OBS exposure groups at 24 hpf relative to the PFOS group. Notably, a significant decrease in spontaneous movements was observed in the 25 mg/L OBS exposure group relative to the normal control group (p < 0.01). Consistent with these findings, studies have shown that 2.5 and 3.0 mg/L difenoconazole can significantly inhibit the spontaneous movements of zebrafish embryos at 24 hpf [31].
The hatching process is based on continuous cell division, and reportedly, zebrafish embryos begin their first cell cleavage approximately 40 min after fertilization, undergoing a cell division cycle roughly every 15 min, and requiring approximately 10 cell cycles to achieve the mid-blastula transition [32]. Further, hatching is also influenced by a combination of physical forces and biochemical factors, and the associated biochemical reactions primarily involve the expansion and softening of the egg membrane by zebrafish hatching enzymes (zinc-containing metalloproteases) [33]. Owing to the activity of these hatching enzymes, the tail movements of the embryo help rupture the chorion, completing the hatching process [34]. The results of this study showed that exposure to OBS and PFOS inhibited zebrafish embryo hatching at 48 hpf to some extent, possibly owing to a decline in the activity of hatching enzymes because of OBS and PFOS exposure as well as weakened spontaneous movement, which delayed the rupture of the chorion. Similarly, Yang et al. observed that OBS exposure at 10 mg/L could inhibit the hatching rate of zebrafish embryos, and has also been observed with exposure to 4 mg/L PFOS in zebrafish embryos [35,36]. At 56 hpf, there were no significant differences in hatching rates between all the exposure treatment groups and the normal control group, and by 72 hpf, all the embryos in the treatment groups had successfully hatched, achieving a hatching rate of 100%. This observation is consistent with the findings of Huang et al. [36]. However, Shi et al. reported a significant decline in the hatching rate (p < 0.05) under PFOS treatment at 1, 3, and 5 mg/L relative to the control group at 72 hpf [37]. The discrepancies between these studies may be related to differences in exposure start times, exposure concentrations, and exposure containers. OBS and PFOS have similar structures, with both containing the sulfonic acid functional group. In addition, the mechanism underlying the differences in their toxicity may be because of differences in toxicokinetics. Hagenaars et al. reported that the effects of PFOS on zebrafish embryo depend on the exposure duration [38]. It has also been shown that as exposure time increases, a certain cumulative concentration is crucial for harmful effects to be observed, indicating that PFOS has a stronger bioaccumulation capability than OBS. However, further experimental validation is required.
The cardiovascular system in zebrafish embryos begins to form at approximately 20 hpf, with the heart able to relax but not yet connected to the developing blood circulation system. By 30 hpf, the heart is differentiated into the ventricle and atrium, and by 36 hpf, regular heart beat begins [39]. In addition, during normal development, the major organ systems of zebrafish are completely developed by 48 hpf, which also marks an important turning point as the heart system becomes relatively mature [40]. Prior to 48 hpf, embryos remain protected by the chorion, which prevents severe heart failure owing to OBS or PFOS exposure. In this study, accelerated heart rates, relative to the control, were observed in all the treatment groups, possibly owing to efforts by the embryos to increase blood supply and meet oxygen and nutrient needs. By 56 hpf, embryos in the 15 mg/L PFOS group showed a marked decrease in heart rate, possibly owing to partial heart failure owing to pericardial edema. By 72 hpf, heart rate acceleration was again noted across the different treatment groups, consistent with the findings of Shi et al., 2008 [37], who reported an increased heart rate in zebrafish embryos exposed to 5 mg/L PFOS by 48 and 84 hpf.
Apoptosis is an evolutionarily conserved and genetically regulated process of cell death owing to physiological and pathological environmental stimuli [41,42]. Caspase family genes (Caspases) initiate and execute apoptosis, with Caspase-3 being the most critical downstream apoptotic factor in the caspase cascade [43]. Bacl-2 can inhibit apoptosis by suppressing the activation of caspase genes by inhibiting cytochrome C release [44]. In addition, Bax is an essential component of ion channels on the mitochondrial membrane and it allows cytochrome C to permeate the mitochondrial membrane, activating Caspase-9, an initiator of apoptosis that further stimulates Caspase-3 expression and ultimately leads to cell apoptosis [45]. Bax and Bcl-2, which are two important members of the Bcl-2 gene family, regulate cell state by controlling mitochondrial membrane permeability and thus the release of apoptotic activators, such as cytochrome C, playing a key role in apoptosis [46]. Further, Bax and Bcl-2 exert antagonistic effects, with Bax promoting apoptosis, whereas Bcl-2 inhibits it by counteracting the effects of Bax [47]. In addition, Bax, primarily localized in the cytoplasm as monomers, with a small proportion in organelles such as the endoplasmic reticulum, is essential for mitochondrial stress-induced apoptosis, even though Bax monomers only cannot induce cytochrome C release, as oligomers, they can migrate to the mitochondrial membrane, forming heterodimers with Bcl-2 to promote mitochondrial membrane permeability, resulting in the release of cytochrome C, and subsequent Ca2+ release, in coordination with Bax factors. Thus, caspase-9 is activated, triggering downstream caspase enzyme cascades and ultimately inducing apoptosis. The tumor suppressor gene p53 also regulates Bax expression, with upregulated p53 inducing cell cycle arrest and apoptosis [48]. Typically, p53 activation by xenobiotic stimuli induces Bax expression, increasing mitochondrial membrane permeability and cytochrome C release. This results in the downstream activation of Caspase-9 and Caspase-3 and accelerated apoptosis [49,50]. Studies have also shown that the relative Bax and Bcl-2 levels directly impact apoptosis, with higher Bcl-2 expression levels inhibiting apoptosis, whereas elevated Bax expression induces the opposite effect. The Bcl-2/Bax ratio has also been shown to influence apoptosis post-stimulation, with a lower ratio indicative of increased apoptosis, whereas a higher ratio reveals a stronger anti-apoptotic capacity [51,52]. The Bcl-2/Bax ratios for the control, 15 mg/L PFOS, and 15, 20, and 25 mg/L OBS exposure groups were 1, 0.63, 0.67, 0.58, and 0.46, respectively, indicating that OBS and PFOS exposure induced zebrafish larval apoptosis, with higher OBS concentrations leading to increased apoptosis. The apoptosis mechanisms induced by OBS and PFOS exposure may involve Bcl-2 downregulation and the upregulation of Bax, Caspase-3, and Caspase-9, associated with a decrease in the Bcl-2/Bax ratio. Our results demonstrated that OBS exhibited toxicity comparable to that of PFOS and was capable of inducing similar developmental effects in zebrafish embryos. Exposure to OBS led to developmental toxicity, characterized by delayed hatching, an increased incidence of malformations, and increased mortality rates. However, whether OBS exposure affects the expression levels of other apoptosis-related genes in zebrafish embryos remains to be investigated. The associated mechanisms require clarification through more comprehensive studies.

5. Conclusions

In this study, we investigated the developmental toxicity of OBS in zebrafish embryos, using PFOS as the positive control. The results demonstrated that both PFOS and OBS induced developmental toxicity in zebrafish embryos. Furthermore, analysis of gene expression following exposure to PFOS and OBS revealed that both compounds significantly downregulated the anti-apoptotic gene Bcl-2 and upregulated the pro-apoptotic genes Bax, Caspase-3, and Caspase-9. Consequently, OBS exposure was associated with increased apoptosis in zebrafish embryos. Therefore, considering the effects of OBS on zebrafish embryos, its suitability as an alternative to PFOS remains questionable and warrants further evaluation.

Author Contributions

Y.Z.: Conceptualization, data curation, investigation, methodology, software, visualization, writing—original draft, writing—review and editing. X.H.: Conceptualization, methodology, supervision, validation, project administration. X.W.: Data curation, supervision, writing—review and editing. M.X.: Conceptualization, formal analysis, validation. Y.S.: Investigation. All authors have read and agreed to the published version of the manuscript.

Funding

This work was supported by the Natural Science Foundation of Jiangxi (grant numbers 20232BAB215011, 20232BCJ22047, and 20242BAB25200) and the Science and Technology Project of the Jiangxi Provincial Department of Education (grant number GJJ211905).

Data Availability Statement

Data will be made available upon reasonable request.

Conflicts of Interest

The authors declare that they have no known competing financial interests or personal relationships that could appear to influence the work reported in this paper.

References

  1. Lindstrom, A.B.; Strynar, M.J.; Libelo, E.L. Polyfluorinated compounds: Past, present, and future. Environ. Sci. Technol. 2011, 45, 7954–7961. [Google Scholar] [CrossRef]
  2. Sunderland, E.M.; Hu, X.C.; Dassuncao, C.; Tokranov, A.K.; Wagner, C.C.; Allen, J.G. A review of the pathways of human exposure to poly- and perfluoroalkyl substances (PFASs) and present understanding of health effects. J. Expo. Sci. Environ. Epid. 2019, 29, 131–147. [Google Scholar] [CrossRef]
  3. Fischer, F.C.; Ludtke, S.; Thackray, C.; Pickard, H.M.; Haque, F.; Dassuncao, C.; Endo, S.; Schaider, L.; Sunderland, E.M. Binding of Per- and Polyfluoroalkyl Substances (PFAS) to Serum Proteins: Implications for Toxicokinetics in Humans. Environ. Sci. Technol. 2024, 58, 1055–1063. [Google Scholar] [CrossRef] [PubMed]
  4. Bonato, T.; Pal, T.; Benna, C.; Di Maria, F. Contamination of the terrestrial food chain by per- and polyfluoroalkyl substances (PFAS) and related human health risks: A systematic review. Sci. Total Environ. 2025, 961, 178337. [Google Scholar] [CrossRef]
  5. Li, X.; Zhang, Q.; Wang, A.; Shan, S.; Wang, X.; Wang, Y.; Wan, J.; Ning, P.; Hong, C.; Tian, H.; et al. Hepatotoxicity induced in rats by chronic exposure to F-53B, an emerging replacement of perfluorooctane sulfonate (PFOS). Environ. Pollut. 2024, 346, 123544. [Google Scholar] [CrossRef] [PubMed]
  6. Bao, Y.; Qu, Y.; Huang, J.; Cagnetta, G.; Yu, G.; Weber, R. First assessment on degradability of sodium p-perfluorous nonenoxybenzene sulfonate (OBS), a high volume alternative to perfluorooctane sulfonate in fire-fighting foams and oil production agents in China. RSC Adv. 2017, 7, 46948–46957. [Google Scholar] [CrossRef]
  7. Xu, L.; Shi, Y.; Li, C.; Song, X.; Qin, Z.; Cao, D.; Cai, Y. Discovery of a Novel Polyfluoroalkyl Benzenesulfonic Acid around Oilfields in Northern China. Environ. Sci. Technol. 2017, 51, 14173–14181. [Google Scholar] [CrossRef] [PubMed]
  8. Shi, Y.; Song, X.; Jin, Q.; Li, W.; He, S.; Cai, Y. Tissue distribution and bioaccumulation of a novel polyfluoroalkyl benzenesulfonate in crucian carp. Environ. Int. 2020, 135, 105418. [Google Scholar] [CrossRef]
  9. Li, Y.; Yu, N.; Du, L.; Shi, W.; Yu, H.; Song, M.; Wei, S. Transplacental transfer of per-and polyfluoroalkyl substances identified in paired maternal and cord sera using suspect and nontarget screening. Environ. Sci. Technol. 2020, 54, 3407–3416. [Google Scholar] [CrossRef]
  10. Wang, C.; Zhang, Y.; Deng, M.; Wang, X.; Tu, W.; Fu, Z.; Jin, Y. Bioaccumulation in the gut and liver causes gut barrier dysfunction and hepatic metabolism disorder in mice after exposure to low doses of OBS. Environ. Int. 2019, 129, 279–290. [Google Scholar] [CrossRef]
  11. Tu, W.; Martínez, R.; Navarro-Martin, L.; Kostyniuk, D.J.; Hum, C.; Huang, J.; Deng, M.; Jin, Y.; Chan, H.M.; Mennigen, J.A. Bioconcentration and Metabolic Effects of Emerging PFOS Alternatives in Developing Zebrafish. Environ. Sci. Technol. 2019, 53, 13427–13439. [Google Scholar] [CrossRef] [PubMed]
  12. Bucci, K.; Bayoumi, M.; Stevack, K.; Watson-Leung, T.; Rochman, C.M. Microplastics may induce food dilution and endocrine disrupting effects in fathead minnows (Pimephales promelas), and decrease offspring quality. Environ. Pollut. 2024, 345, 123551. [Google Scholar] [CrossRef]
  13. Chen, H.; Chernick, M.; Dong, W.; Xie, L.; Hinton, D.E. The role of chorion integrity on the bioaccumulation and toxicity of selenium nanoparticles in Japanese medaka (Oryzias latipes). Aquat. Toxicol. 2025, 278, 107170. [Google Scholar] [CrossRef]
  14. Zhang, J.; Zhang, S.; Lu, C.; Wang, X.; Du, Z.; Wang, J.; Li, B.; Wang, J.; Zhu, L. Comparison of the combined toxicity of PFOA and emerging alternatives: A comprehensive evaluation of oxidative damage, apoptosis and immunotoxicity in embryonic and adult zebrafish. Water Res. 2025, 273, 123028. [Google Scholar] [CrossRef]
  15. Liu, H.; Chen, Y.; Hu, W.; Luo, Y.; Zhu, P.; You, S.; Li, Y.; Jiang, Z.; Wu, X.; Li, X. Impacts of PFOAC8, GenXC6, and their mixtures on zebrafish developmental toxicity and gene expression provide insight about tumor-related disease. Sci. Total Environ. 2023, 858, 160085. [Google Scholar] [CrossRef]
  16. Wu, Y.; Wang, Y.; Tong, Z.; Xie, W.; Wang, A.; Song, C.; Yao, W.; Wang, J. Pyraclostrobin induces developmental toxicity and cardiotoxicity through oxidative stress and inflammation in zebrafish embryos. Environ. Pollut. 2024, 358, 124490. [Google Scholar] [CrossRef] [PubMed]
  17. He, J.-H.; Gao, J.-M.; Huang, C.-J.; Li, C.-Q. Zebrafish models for assessing developmental and reproductive toxicity. Neurotoxicol. Teratol. 2014, 42, 35–42. [Google Scholar] [CrossRef]
  18. Zhang, S.-Y.; Gan, X.; Shen, B.; Jiang, J.; Shen, H.; Lei, Y.; Liang, Q.; Bai, C.; Huang, C.; Wu, W.; et al. 6PPD and its metabolite 6PPDQ induce different developmental toxicities and phenotypes in embryonic zebrafish. J. Hazard. Mater. 2023, 455, 131601. [Google Scholar] [CrossRef] [PubMed]
  19. Chen, H.; Wang, Y.; Liang, H. The combined neurotoxicity of DBP and nano-TiO2 in embryonic zebrafish (Danio rerio) revealed by oxidative activity, neuro-development genes expression and metabolomics changes. Aquat. Toxicol. 2024, 269, 106881. [Google Scholar] [CrossRef] [PubMed]
  20. Kamila, S.; Dey, K.K.; Islam, S.; Chattopadhyay, A. Mixture of arsenic and chromium alters antioxidant, DNA repair and tumor suppressor gene expressions in zebrafish brain at environmental concentrations. J. Environ. Sci. 2025, 155, 60–72. [Google Scholar] [CrossRef]
  21. Wang, W.; Wang, B.; Liu, Z.; Xia, X. Developmental toxicity and alteration of gene expression in zebrafish embryo exposed to 6-benzylaminopurine. Chemosphere 2019, 233, 336–346. [Google Scholar] [CrossRef]
  22. OECD. Guideline for the Testing of Chemicals Test No. 236: Fish Embryo Acute Toxicity (FET) Test; OECD Publishing: Paris, France, 2013; p. 22. [Google Scholar]
  23. Huang, J.; Sun, L.; Mennigen, J.A.; Liu, Y.; Liu, S.; Zhang, M.; Wang, Q.; Tu, W. Developmental toxicity of the novel PFOS alternative OBS in developing zebrafish: An emphasis on cilia disruption. J. Hazard. Mater. 2021, 409, 124491. [Google Scholar] [CrossRef]
  24. Nagel, R. DarT: The embryo test with the Zebrafish Danio rerio—A general model in ecotoxicology and toxicology. ALTEX 2002, 19, 38–48. [Google Scholar]
  25. Livak, K.J.; Schmittgen, T.D. Analysis of Relative Gene Expression Data Using Real-Time Quantitative PCR and the 2−ΔΔCT Method. Methods 2001, 25, 402–408. [Google Scholar] [CrossRef] [PubMed]
  26. Shen, Q.; Hu, W.; Liu, F.; Dong, S.; Peng, X.; Zhong, Y.; Chen, C.; Zuo, Y.; Ge, C.; Li, W.; et al. Dipropyl phthalate induces craniofacial chondrogenic defects in zebrafish embryos. Ecotoxicol. Environ. Saf. 2025, 290, 117603. [Google Scholar] [CrossRef]
  27. Huang, W.; Mo, J.; Li, J.; Wu, K. Exploring developmental toxicity of microplastics and nanoplastics (MNPS): Insights from investigations using zebrafish embryos. Sci. Total Environ. 2024, 933, 173012. [Google Scholar] [CrossRef] [PubMed]
  28. Haridevamuthu, B.; Murugan, R.; Seenivasan, B.; Meenatchi, R.; Pachaiappan, R.; Almutairi, B.O.; Arokiyaraj, S.; Arockiaraj, J. Synthetic azo-dye, Tartrazine induces neurodevelopmental toxicity via mitochondria-mediated apoptosis in zebrafish embryos. J. Hazard. Mater. 2024, 461, 132524. [Google Scholar] [CrossRef]
  29. Hu, F.; Zhao, H.; Ding, J.; Jing, C.; Zhang, W.; Chen, X. Uptake and toxicity of micro-/nanoplastics derived from naturally weathered disposable face masks in developing zebrafish: Impact of COVID-19 pandemic on aquatic life. Environ. Pollut. 2024, 343, 123129. [Google Scholar] [CrossRef]
  30. Guarin, M.; Ny, A.; De Croze, N.; Maes, J.; Léonard, M.; Annaert, P.; de Witte, P.A.M. Pharmacokinetics in Zebrafish Embryos (ZFE) Following Immersion and Intrayolk Administration: A Fluorescence-Based Analysis. Pharmaceuticals 2021, 14, 576. [Google Scholar] [CrossRef] [PubMed]
  31. Mu, X.; Pang, S.; Sun, X.; Gao, J.; Chen, J.; Chen, X.; Li, X.; Wang, C. Evaluation of acute and developmental effects of difenoconazole via multiple stage zebrafish assays. Environ. Pollut. 2013, 175, 147–157. [Google Scholar] [CrossRef]
  32. Hadzhiev, Y.; Wheatley, L.; Cooper, L.; Ansaloni, F.; Whalley, C.; Chen, Z.; Finaurini, S.; Gustincich, S.; Sanges, R.; Burgess, S.; et al. The miR-430 locus with extreme promoter density forms a transcription body during the minor wave of zygotic genome activation. Dev. Cell 2023, 58, 155–170. [Google Scholar] [CrossRef]
  33. Girigoswami, A.; Meenakshi, S.; Deepika, B.; Harini, K.; Gowtham, P.; Pallavi, P.; Girigoswami, K.J.A. Beneficial effects of bioinspired silver nanoparticles on zebrafish embryos including a gene expression study. DMPK 2024, 12, 177–192. [Google Scholar]
  34. Wu, Q.; Li, G.; Huo, T.; Du, X.; Yang, Q.; Hung, T.-C.; Yan, W. Mechanisms of parental co-exposure to polystyrene nanoplastics and microcystin-LR aggravated hatching inhibition of zebrafish offspring. Sci. Total Environ. 2021, 774, 145766. [Google Scholar] [CrossRef]
  35. Yang, D.; Li, X.; Dong, S.; Zhao, X.; Li, X.; Zhang, M.; Shi, Y.; Ding, G. Developmental Toxicity and Cardiotoxicity Induced by PFOS and its Novel Alternative OBS in Early Life Stage of Zebrafish (Danio rerio). Water Air Soil Pollut. 2023, 234, 481. [Google Scholar] [CrossRef]
  36. Huang, H.; Huang, C.; Wang, L.; Ye, X.; Bai, C.; Simonich, M.T.; Tanguay, R.L.; Dong, Q. Toxicity, uptake kinetics and behavior assessment in zebrafish embryos following exposure to perfluorooctanesulphonicacid (PFOS). Aquat. Toxicol. 2010, 98, 139–147. [Google Scholar] [CrossRef]
  37. Shi, X.; Du, Y.; Lam, P.K.S.; Wu, R.S.S.; Zhou, B. Developmental toxicity and alteration of gene expression in zebrafish embryos exposed to PFOS. Toxicol. Appl. Pharmacol. 2008, 230, 23–32. [Google Scholar] [CrossRef]
  38. Hagenaars, A.; Stinckens, E.; Vergauwen, L.; Bervoets, L.; Knapen, D. PFOS affects posterior swim bladder chamber inflation and swimming performance of zebrafish larvae. Aquat. Toxicol. 2014, 157, 225–235. [Google Scholar] [CrossRef] [PubMed]
  39. Barrionuevo, W.; Burggren, W.J. O2 consumption and heart rate in developing zebrafish (Danio rerio): Influence of temperature and ambient O2. Am. J. Physiol. Regul. Integr. Comp. Physiol. 1999, 276, R505–R513. [Google Scholar] [CrossRef] [PubMed]
  40. Vasamsetti, B.M.; Chon, K.; Kim, J.; Oh, J.-A.; Yoon, C.-Y.; Park, H.-H. Developmental Toxic Effects of Thiram on Developing Zebrafish (Danio rerio) Embryos. Toxics 2022, 10, 369. [Google Scholar] [CrossRef]
  41. Rezaei, A.; Mahmoodi, M.; Mohammadizadeh, F.; Mohamadi, M.; Hajizadeh, M.R.; Mirzaei, M.R.; Khanamani Falahati-pour, S.J. A novel copper (II) complex activated both extrinsic and intrinsic apoptotic pathways in liver cancerous cells. J. Cell. Biochem. 2019, 120, 12280–12289. [Google Scholar] [CrossRef] [PubMed]
  42. Jiang, Y.; Zhang, M.; Li, J.; Hu, K.; Chen, T. AHR/cyp1b1 signaling-mediated extrinsic apoptosis contributes to 6PPDQ-induced cardiac dysfunction in zebrafish embryos. Environ. Pollut. 2024, 345, 123467. [Google Scholar] [CrossRef]
  43. Mustafa, M.; Ahmad, R.; Tantry, I.Q.; Ahmad, W.; Siddiqui, S.; Alam, M.; Abbas, K.; Moinuddin; Hassan, M.I.; Habib, S.; et al. Apoptosis: A Comprehensive Overview of Signaling Pathways, Morphological Changes, and Physiological Significance and Therapeutic Implications. Cells 2024, 13, 1838. [Google Scholar] [CrossRef] [PubMed]
  44. Ijaz, S.; Iqbal, J.; Abbasi, B.A.; Tufail, A.; Yaseen, T.; Uddin, S.; Usman, K.; Ullah, R.; Bibi, H.; Inam, P.; et al. Current stage of preclinical and clinical development of guggulsterone in cancers: Challenges and promises. Cell Biol. Int. 2024, 48, 128–142. [Google Scholar] [CrossRef]
  45. Yu, W.; Zhu, H.; Huang, R.; Yan, B.; Xu, B.; Shi, Y.; Mao, J.; Liu, Z.; Wang, J. Roles of Cyt-c/Caspase-9/Caspase-3/Bax/Bcl-2 pathway in Cd-induced testicular injury in rats and the protective effect of quercetin. Toxicon 2024, 237, 107561. [Google Scholar] [CrossRef]
  46. Czabotar, P.E.; Garcia-Saez, A.J. Mechanisms of BCL-2 family proteins in mitochondrial apoptosis. Nat. Rev. Mol. Cell Biol. 2023, 24, 732–748. [Google Scholar] [CrossRef]
  47. Zhang, J.; Hu, G.; Guo, H.; Yang, W.; Li, X.; Ni, Y.; He, M.; Ding, P.; Yu, Y. Amino modifications exacerbate the developmental abnormalities of polystyrene microplastics via mitochondria-mediated apoptosis pathway in zebrafish larvae. Sci. Total Environ. 2025, 958, 178031. [Google Scholar] [CrossRef]
  48. Umamaheswari, S.; Priyadarshinee, S.; Kadirvelu, K.; Ramesh, M. Polystyrene microplastics induce apoptosis via ROS-mediated p53 signaling pathway in zebrafish. Chem. Biol. Interact. 2021, 345, 109550. [Google Scholar] [CrossRef]
  49. Xie, Z.; Lu, G.; Zhou, R.; Ma, Y. Thiacloprid-induced hepatotoxicity in zebrafish: Activation of the extrinsic and intrinsic apoptosis pathways regulated by p53 signaling pathway. Aquat. Toxicol. 2022, 246, 106147. [Google Scholar] [CrossRef] [PubMed]
  50. Félix, L.M.; Vidal, A.M.; Serafim, C.; Valentim, A.M.; Antunes, L.M.; Monteiro, S.M.; Matos, M.; Coimbra, A.M. Ketamine induction of p53-dependent apoptosis and oxidative stress in zebrafish (Danio rerio) embryos. Chemosphere 2018, 201, 730–739. [Google Scholar] [CrossRef]
  51. Zhao, W.-J.; Li, X.; Xu, Z.-Q.; Fang, K.-M.; Hong, H.-C.; Sun, H.-J.; Guan, D.-X.; Yu, X.-W. Environmentally relevant concentrations of arsenic induces apoptosis in the early life stage of zebrafish. Ecotoxicol. Environ. Saf. 2021, 227, 112883. [Google Scholar] [CrossRef] [PubMed]
  52. Wang, Q.; Yao, X.; Jiang, N.; Zhang, J.; Liu, G.; Li, X.; Wang, C.; Yang, Z.; Wang, J.; Zhu, L.; et al. Environmentally relevant concentrations of butyl benzyl phthalate triggered oxidative stress and apoptosis in adult zebrafish (Danio rerio) liver: Combined analysis at physiological and molecular levels. Sci. Total Environ. 2023, 858, 160109. [Google Scholar] [CrossRef] [PubMed]
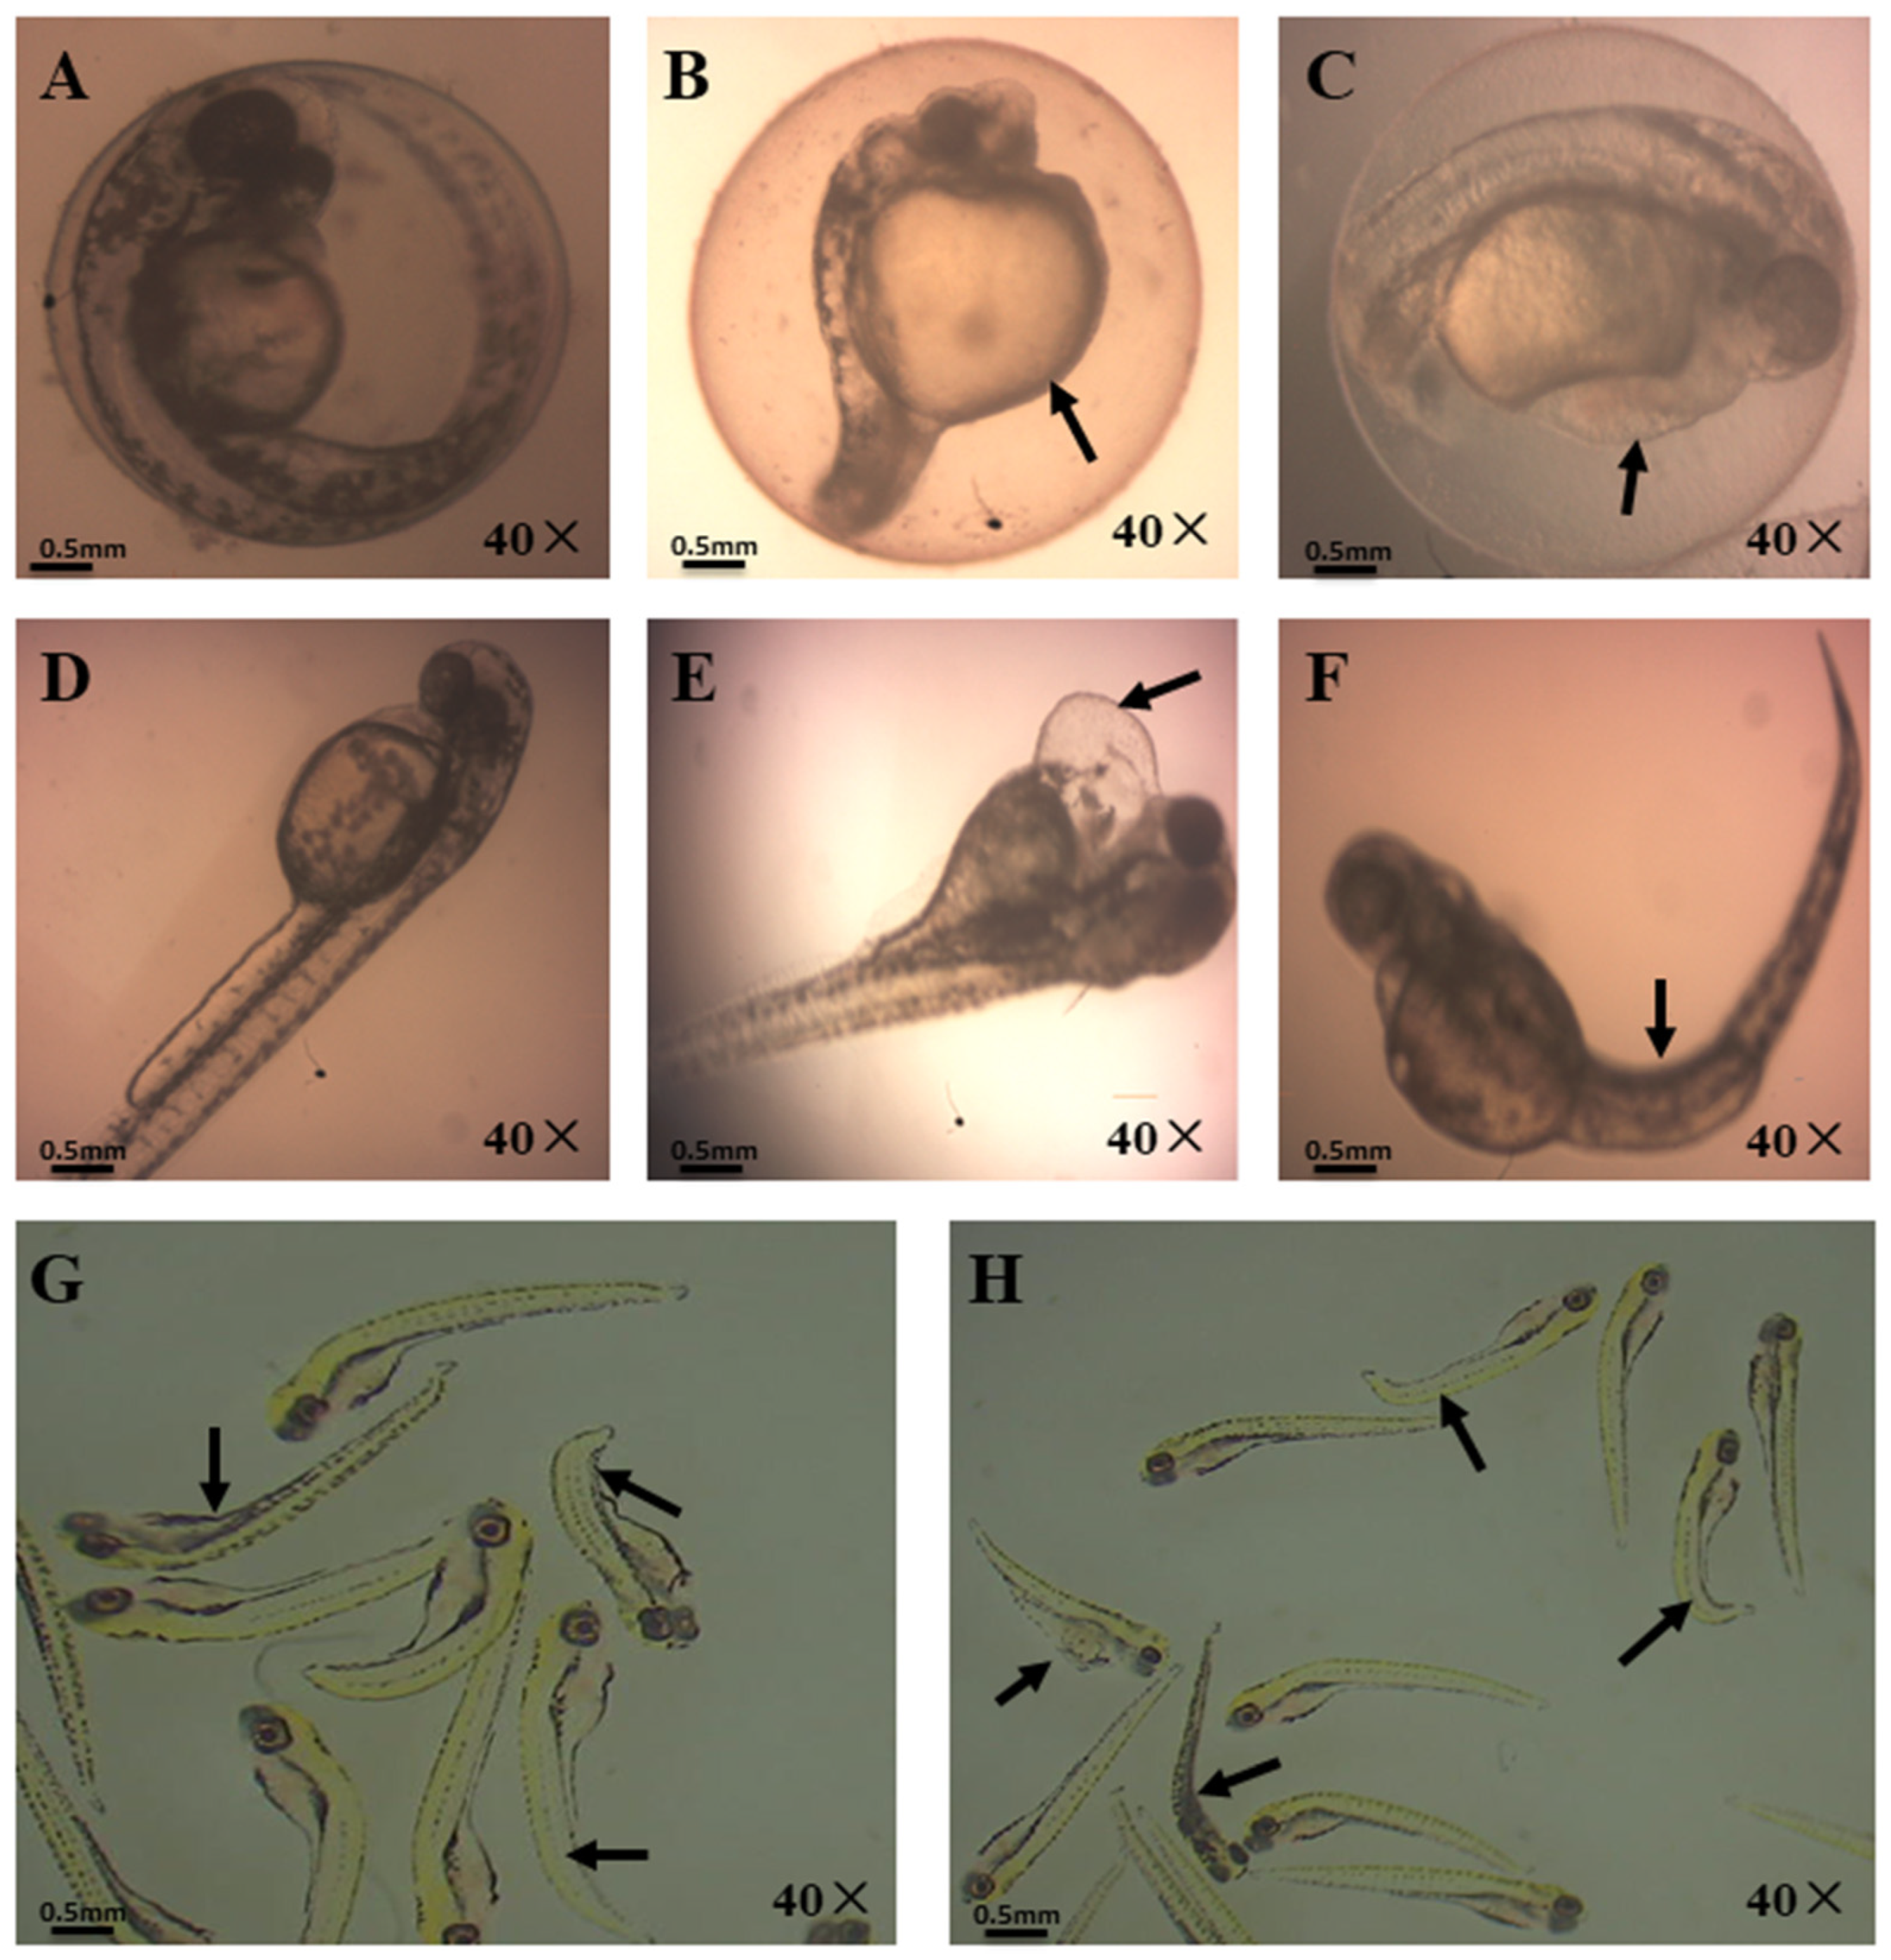
Figure 1. Teratogenic effects of OBS and PFOS on zebrafish embryos. (A) Normal embryo, (B) yolk sac edema, (C) pericardial edema, (D) normal larvae, (E) pericardial edema, (F) spinal curvature, (G,H) deformities in the 15 mg/L PFOS exposure group at 120 hpf. OBS, sodium p-perfluorous nonenoxybenzene sulfonate; PFOS, perfluorooctane sulfonate; hpf, hours post fertilization.
Water 17 02450 g001
Figure 2. Number of spontaneous movements at 24 hpf. Asterisks indicate significant differences relative to control embryos determined using one-way ANOVA followed by Duncan’s test (**, p < 0.01). All data are presented as mean ± SEM. hpf, hours post fertilization; SEM, standard error of the mean.
Water 17 02450 g002
Figure 3. Hatching rates of zebrafish embryos exposed to 15 mg/L PFOS positive control and 15, 20, and 25 mg/L OBS treatments at 48, 56, and 72 hpf, respectively. The asterisks indicate significant differences relative to the control embryos determined using one-way ANOVA followed by Duncan’s test (*, p < 0.05). All data are presented as mean ± SEM. hpf, hours post fertilization; OBS, sodium p-perfluorous nonenoxybenzene sulfonate; PFOS, perfluorooctane sulfonate; SEM, standard error of the mean.
Water 17 02450 g003
Figure 4. Mortality of zebrafish embryos exposed to 15 mg/L PFOS positive control and 15, 20, and 25 mg/L OBS treatments at 8, 24, 32, 48, 56, 72, 96, 120, 144, and 168 hpf. Asterisks indicate significant differences relative to the control embryos determined using one-way ANOVA followed by Duncan’s test (**, p < 0.01; ***, p < 0.001). All data are presented as mean ± SEM. hpf, hours post fertilization; OBS, sodium p-perfluorous nonenoxybenzene sulfonate; PFOS, perfluorooctane sulfonate; SEM, standard error of the mean.
Water 17 02450 g004
Figure 5. Number of heart beats in 20 s for zebrafish embryos exposed to 15 mg/L PFOS positive control and 15, 20, and 25 mg/L OBS treatments at 48, 56, and 72 hpf. Asterisks indicate significant differences relative to the control embryos determined using one-way ANOVA followed by Duncan’s test (**, p < 0.01; ***, p < 0.001). All data are presented as mean ± SEM. hpf, hours post fertilization; OBS, sodium p-perfluorous nonenoxybenzene sulfonate; PFOS, perfluorooctane sulfonate; SEM, standard error of the mean; ANOVA, analysis of variance.
Water 17 02450 g005
Figure 6. Body length of zebrafish larvae exposed to 15 mg/L PFOS positive control and 15, 20, and 25 mg/L OBS treatments at 72, 96, and 120 hpf. Asterisks indicate significant differences relative to the control embryos determined using one-way ANOVA followed by Duncan’s test (*, p < 0.05; ***, p < 0.001). All data are presented as mean ± SEM. hpf, hours post fertilization; OBS, sodium p-perfluorous nonenoxybenzene sulfonate; PFOS, perfluorooctane sulfonate; SEM, standard error of the mean; ANOVA, analysis of variance.
Water 17 02450 g006
Figure 7. Expression levels of apoptosis-related genes in zebrafish embryos exposed to 15 mg/L PFOS positive control and 15, 20, and 25 mg/L OBS treatments at 120 hpf. Asterisks indicate significant differences relative to the control embryos determined using one-way ANOVA followed by Duncan’s test (*, p < 0.05; **, p < 0.01; ****, p < 0.0001). All data are presented as mean ± SEM. hpf, hours post fertilization; OBS, sodium p-perfluorous nonenoxybenzene sulfonate; PFOS, perfluorooctane sulfonate; SEM, standard error of the mean; ANOVA, analysis of variance.
Water 17 02450 g007
Table 1. Real-time fluorescence qPCR primer information for investigated genes.
Gene NameForward Primer (5′–3′)Reverse Primer (5′–3′)
β-actinCGAGCAGGAGATGGGAACCCAACGGAAACGCTCATTGC
BaxGGCTATTTCAACCAGGGTTCCTGCGAATCACCAATGCTGT
p53GGGCAATCAGCGAGCAAAACTGACCTTCCTGAGTCTCCA
Caspase-3CCGCTGCCCATCACTAATCCTTTCACGACCATCT
Caspase-9AAATACATAGCAAGGCACCCACAGGGAATCAAGAAAGG
Bcl-2TCACTCGTTCAGACCCTCATACGCTTTCCACGCACAT
Table 2. Statistical analyses showing malformation percentages for zebrafish larvae at 120 hpf under different treatments.
Malformation PercentageControl15 mg/L PFOSOBS
15 mg/L20 mg/L25 mg/L
Yolk sac edema1.1 ± 1.112.2 ± 1.11.1 ± 1.11.1 ± 1.13.3 ± 1.9
Pericardial edema06.7 ± 1.902.2 ± 1.11.1 ± 1.1
Spinal curvature070 ± 1.93.3 ± 1.94.4 ± 1.16.7 ± 3.8
Total1.1 ± 1.188.9 ± 2.24.4 ± 1.17.8 ± 1.111.1 ± 2.2
Note: All data are provided as mean ± standard error of the mean.
Disclaimer/Publisher’s Note: The statements, opinions and data contained in all publications are solely those of the individual author(s) and contributor(s) and not of MDPI and/or the editor(s). MDPI and/or the editor(s) disclaim responsibility for any injury to people or property resulting from any ideas, methods, instructions or products referred to in the content.