Abstract
Species translocation is an increasingly used method in active plant conservation, but its high costs and risk of failure highlight the need for prior research to support its effectiveness. Salix lapponum plantlets obtained through micropropagation were subjected to two biological experiments under laboratory conditions. The plants were watered with aqueous solutions of NaCl (Experiment 1) and N-NO3 (Experiment 2) for a period of four weeks. The experiments were designed to simulate processes occurring in the natural habitats of the species- increased substrate salinity and eutrophication. To determine the plant response to the presence of NaCl and N-NO3 in the soil substrate, various morpho-physiological traits were examined, including selected growth parameters, relative water content (RWC), photosynthetic pigment content, selected chlorophyll fluorescence parameters, reactive oxygen species (ROS) accumulation, antioxidant enzyme activity, and anthocyanin content. The results showed that both tested factors acted as abiotic stressors. Exposure to NaCl solutions of various concentrations led to a significant deterioration in morpho-physiological parameters, whereas low concentrations of nitrate nitrogen stimulated the growth of S. lapponum. In response to stress, the plants activated defense mechanisms such as increased anthocyanin synthesis, elevated antioxidant enzyme activity, and maintenance of a high relative water content.
1. Introduction
The condition of the flora of natural wetlands is affected by a multitude of stress factors. Of particular importance is the process of eutrophication, which is caused by the excessive influx of biogenic elements that primarily originate from surface runoff from intensively fertilized agricultural areas, municipal wastewater, and industrial waste, especially detergents containing phosphates [1,2]. The phenomenon of eutrophication is a multifactorial process, the course of which is influenced by temperature or groundwater levels, among other factors, and can result in habitat disturbances of varying severity and nature [3,4].
Peatlands play a pivotal role in the environment by mitigating the repercussions of excessive nutrient inputs. Operating as biological filters, peatlands effectively retain and accumulate substantial quantities of nitrogen and phosphorus [5]. This phenomenon can be attributed to the presence of humic compounds formed during the decomposition of organic matter, which form permanent complexes with nitrogen and phosphorus compounds, thereby limiting their availability to plants [6,7]. Peatlands are among the most threatened habitats on a global scale today [8]. The degradation of their ecosystems is the result of a number of factors, including, among others, intentional anthropogenic transformations as well as progressive climate change, which has the strongest impact on the hydrological conditions of these ecosystems [9]. Degradation of peatlands through drainage has the potential to exacerbate the process of eutrophication by releasing bound nutrients [10].
Swindles et al. [11] reported that over the past 300 years, about 70% of the studied European peatlands have shifted towards drainage. Restoration efforts, including re-wetting, have not fully returned them to their original state, leaving them less self-regulating and more vulnerable to extreme weather. Rewetted peatlands also show altered species composition, with reduced biodiversity, helophytization, and dominance of tall grasses that outcompete low-growing species [12].
Peatland drying can also have other negative consequences. The ongoing desiccation of peatland decreases hydrostatic pressure, thereby enabling saline groundwater (secondary salinity resulting from crop irrigation, industrial activities, mining, and de-icing salts) to infiltrate the drying ground. This process precipitates accelerated salinization, which can have deleterious effects on the peatland’s capacity to retain water and accumulate organic matter [13]. The presence of salts in soil water can impede the capacity of plants to absorb water, thereby resulting in diminished growth rates. Salinity can also induce impairment to the cells of the photosynthetic apparatus. Salinity exerts two primary effects on plants: osmotic stress and ionic toxicity. These effects impact the vital processes of germination, growth, photosynthesis, osmotic balance, and yield [14,15]. There are numerous reports in the literature on the effects of salinity on plants. However, the majority of these studies focus on economically significant crops [16,17,18,19,20] or plants typical for saline habitats [21,22]. However, there is little information regarding the effects of salinity on plant functioning in natural ecosystems.
Given the degradation of wetlands caused by climate change and human activity, the survival and adaptation of plant species with specific requirements for new, different habitat conditions are in question. Another interesting issue is the rate and effectiveness with which these plants will be able to acclimatize to changes in trophic status or non-natural levels of soil salinity. A more profound comprehension of the manner in which plants react to environmental factors that impede their growth and diminish their physiological state may prove to be of considerable benefit in the development of effective conservation methods for particularly vulnerable and endangered species. Consequently, this enhanced understanding may result in improved outcomes [23,24].
In the context of the flora of European wetlands, there is a need to incorporate relics in various forms of active conservation. These species frequently exhibit limited distribution patterns, often occupying small, isolated populations that fall outside the typical range of their dense occurrence. The presence of plant glacial relicts, defined as remnants of glaciation periods, has been observed at elevated geographic altitudes and within wetland environments. These locations are particularly vulnerable to the progressive climate change and increased habitat fragmentation, which substantially elevate the risk of their extinction [25,26].
A notable example of a glacial relic in eastern Poland that needs prompt conservation efforts is Salix lapponum. The plant is a small shrub that typically reaches a height of approximately one meter. It occurs mainly in wetland habitats, including low and transitional bogs. The optimal growth conditions for this species include acidic soil (pH 4–6), abundant organic matter, and sufficient sunlight or partial shade. S. lapponum is characterized by elliptical, gray-green leaves, densely covered with tomentum [27,28]. Downy willow is a subarctic-boreal species with a continuous distribution range extending across northeastern Europe and Siberia. In Poland, as in the British Isles, the Sudetes, the Pyrenees, or the mountains of Bulgaria, it occurs in isolated sites that are relics from glacial periods [29]. The majority of the over 60 populations that were previously documented in Poland have become extinct, primarily as a result of alterations in habitat conditions, particularly the drying of wetlands [30]. Presently, S. lapponum is classified as a threatened or critically endangered plant in Poland, Ukraine, the Czech Republic, and Lithuania [29].
In order to ensure the viability of S. lapponum populations at the periphery of the species’ geographic distribution, research has been conducted for many years to elucidate the biological [31,32,33,34] and ecological [35,36,37,38,39] mechanisms that govern their proper functioning. Active protection measures consisting of reintroduction and re-stocking of small populations of S. lapponum in eastern Poland are also being undertaken [40,41,42]. The accelerating changes in habitat conditions that are observed in the natural and replacement sites of the species in relation to the high cost of conducting species translocations generate questions about the rationale for undertaking such actions. It is imperative to determine whether the introduced individuals possess the capacity to acclimatize and, in the long term, adapt and survive in the transformed and even degraded habitat.
In order to assess the effectiveness of active conservation methods for Salix lapponum based on translocation, a series of experiments was conducted under controlled laboratory conditions. This study simulated changes in habitat conditions observed in the wild that may arise from anthropogenic pressure and climate change, such as progressive eutrophication and soil salinization. The aim was to determine the extent to which these factors could limit the growth and condition of S. lapponum individuals.
2. Materials and Methods
2.1. Plant Material
The plant material used for the experimental procedures was Salix lapponum plants obtained from the tissue culture laboratory through the micropropagation methods. The initial material comprised shoot fragments from individuals functioning in natural populations of the species in eastern Poland. Previously developed and optimized protocols [32] were the basis for obtaining 120 plants that were subjected to a biological experiment.
The plants were transferred from in vitro conditions into 1 dm3 containers filled with a mixture of peat (pH 3.5–4.5, Aura, Agaris Poland Sp. z o.o., Pasłęk, Poland), deacidified peat (pH 5.5–6.5, Aura, Agaris Poland Sp. z o.o., Pasłęk, Poland), washed river sand (local supplier), and perlite (Agro–Perlit 2–6 mm, Global Perlita, Warsaw, Poland) (1:1:1:1 v/v). There were 10 plants per container. The containers were placed in glass tanks and covered with plastic foil to keep the high humidity. After two weeks, the hardening process began with the gradual removal of the plastic foil. Four weeks later, plants were individually transferred into P9 pots (9 × 9 × 9 cm) filled with the same substrate mixture. During the whole cultivation and experimental period, plants were kept in a growing room, under controlled conditions, at a temperature of 22 °C during the day and 20 °C during the night, and a light intensity of 35 µmol·m−2·s−1 with the 16/8 h light/dark cycle. The source of light was white daylight fluorescent lamps (Philips, Colorado Springs, CO, USA). After a 3-month growth period in the phytotron, the plants were divided into two groups of 60 individuals each.
2.2. Experimental Design
Two independent experiments were conducted to determine the effects of aqueous sodium chloride solution at different concentrations (Experiment 1) and varying doses of nitrate nitrogen (Experiment 2) on selected morpho-physiological parameters of Salix lapponum specimens. The two experiments involved the indirect application of NaCl and N-NO3 solutions at three-day intervals for a period of four weeks. The solutions were prepared in advance and replenished in trays that contained pots with plants (15 plants per treatment in each experiment) (Table 1; Figure 1).

Table 1.
Experimental variants with applied concentrations and electrical conductivity (EC) values for NaCl treatments.
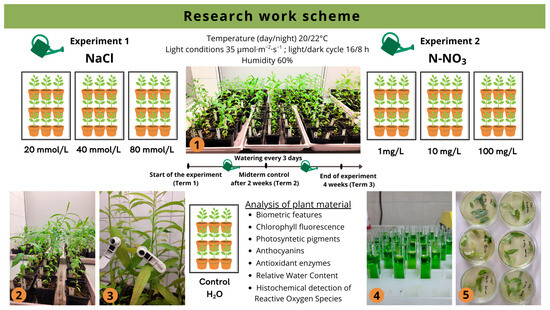
Figure 1.
Study scheme, including timing, conditions of experiments, and analysis of plant material. 1,2—Salix lapponum specimens in the experimental setup; 3—measurement of chlorophyll fluorescence; 4—determination of assimilation pigment content; 5—histochemical detection of reactive oxygen species.
Diagnostic assessments were conducted three times during the course of the experiment: on the first day (Term 1), after two weeks (Term 2), and after four weeks (Term 3), to determine selected morphophysiological traits of the plants exposed to the treatment solutions.
2.3. Analysis of Plant Material
2.3.1. Selected Biometric Features and Plant Growth
During the course of the experiment, selected biometric traits of the plants were measured, including the length of the main shoot (cm), the number of leaves, and the number of lateral shoots of each individual. The length of the main shoot was measured with a ruler with an accuracy of 1 mm, from the base of the stem to the apex. The mean daily growth rate of the primary shoot was calculated based on the data obtained. Biometric measurements were repeated on the same individuals within each variant of both experiments, at all experimental terms.
2.3.2. Relative Water Content
The relative water content (RWC) of leaf tissue was examined according to the method described by González and González-Vilar [43]. Plant material in the form of whole leaf blades was collected, their fresh weight (FW) was determined, and they were then immersed in distilled water for 24 h to reach maximum turgor. After that time, the leaves were subjected to a second weighing, during which their full turgor weight (TW) was determined. The final step was to place the leaves in a drying oven (SML 32/250, Zalmed, Warsaw, Poland) at 60 °C for 24 h. To determine dry weight (DW), the leaves were weighed prior to and following the drying process. The relative water content was calculated according to the following formula:
RWC = (FW − DW)/(TW − DW) × 100%
2.3.3. Photosynthetic Pigments Content
The content of photosynthetic pigments (chlorophyll a, chlorophyll b, and carotenoids) was measured in the fresh weight of leaves collected from the middle parts of the plant shoot. To extract the pigments, the leaves were homogenized in a 96% ethanol solution. Then, the samples were transferred to a 70 °C water bath for 5 min, followed by centrifugation (10,000 rpm, 10 min) to separate the solid phase from the liquid one. The degree of absorption of the extracts was measured using a spectrophotometer (SPECORD 40, Analytik Jena, GmbH, Jena, Germany) at wavelengths of 470, 649, and 665 nm. The calculation of dye concentration was executed by means of a modified Lichtenthaler and Welburn [44] method, as follows:
Chl a = (13.95 × A665) − (6.88 × A649)
Chl b = (24.96 × A649) − (8.12 × A665)
Carotenoids = ((1000 × A470) − (2.05 × Chl a) − (114.8 × Chl b))/245
2.3.4. Selected Chlorophyll a Fluorescence Parameters
Chlorophyll a fluorescence parameters, such as minimum fluorescence (F0), maximum fluorescence (Fm), and maximum quantum yield of PS II (Fv/Fm), were measured on leaves located in the middle part of the shoot. The measurements were taken from 10 individuals who were randomly selected for this study. The measurement of chlorophyll fluorescence was conducted using a fluorimeter (OS5p+, Opti-Sciences, Hudson, NH, USA). Prior to measurement, the leaves were subjected to dark adaptation by blocking light access for 15 min. Measurements of selected chlorophyll fluorescence parameters were repeated on the same individuals within each variant of both experiments, across all experimental terms.
2.3.5. Anthocyanin Content
The anthocyanin content of the plant material was determined using the method described by Martinez and Favret [45]. To extract anthocyanins, 100 mg of cut leaf blade fragments were used (mixed sample), which were placed in tubes containing methanol and HCl (in a ratio of 99:1). The samples were placed in a refrigerator at 4 °C for 24 h. After that time, the samples were centrifuged (10,000 rpm, 10 min), and the resulting supernatant was subjected to spectrophotometric analyses. The absorbance of the samples was measured at wavelengths of 527 and 652 nm.
2.3.6. Guaiacol Peroxidase Activity
Leaf samples were obtained from the middle segment of the shoots. For the analysis of guaiacol peroxidase (GPOX, EC 1.11.1.7) activity, 100 mg of leaves (mixed sample) were used, which were homogenized in 1 mL of 0.05 M phosphate buffer, pH 7.0. Subsequently, the resulting homogenates were centrifuged for 10 min (10,000 rpm) at 4 °C.
Enzyme activity was determined spectrophotometrically using a SPECORD 40 spectrophotometer (Analytik Jena GmbH, Jena, Germany). The procedure for determining GPOX activity was carried out according to the method described by Małolepsza and Urbanek [46]. Absorbance was measured at 480 nm for 4 min at 1-min intervals.
2.3.7. Histochemical Detection of Reactive Oxygen Species (ROS)
The accumulation of hydrogen peroxide (H2O2) and superoxide anion (O2−) in leaf tissues was assessed using a qualitative method described by Kumar et al. [47] after 2 and 4 weeks of the experiment. Leaves for analysis were collected from the middle part of the shoots.
The detection of hydrogen peroxide (H2O2) was carried out using 3,3′-diaminobenzidine (DAB). The leaves were immersed in a DAB solution (1 mg/mL) for 12 h and then incubated in the dark at room temperature. Following the incubation period, the leaves were briefly treated with hot water, then treated with hot 96% ethanol to remove chlorophyll and to facilitate the visualization of the brown polymerization product of DAB, formed in the presence of H2O2.
Nitro blue tetrazolium chloride (NBT) was used to visualize the superoxide anion (O2−). The oxidized (yellow) form of NBT is reduced in the presence of endogenous O2−, forming a blue-purple diformazan. The leaves were incubated in a 0.2% solution of NBT in 50 mM phosphate buffer (pH 7.5) for 12 h in the dark. The tissues were then decolorized with hot 96% ethanol until a clear visible blue-purple NBT reduction product was observed.
2.4. Statistical Analyses
Statistical analyses were conducted using non-parametric tests. The Kruskal–Wallis test was employed to compare the effects of NaCl and N-NO3 solutions at varying concentrations on guaiacol peroxidase (GPOX) activity, relative water content (RWC), anthocyanin content (ACNs), and photosynthetic pigment content in S. lapponum tissues. Following the identification of significant differences, a post-hoc analysis was conducted employing the Dunn test with Bonferroni correction for multiple comparisons. In order to make a comparison between the chlorophyll fluorescence parameters (F0, Fm, Fv/Fm), an analysis of variance (ANOVA) of aligned rank-transformed data was used, including post-hoc pairwise comparisons. The model employed for the analysis was the one with repeated measures. This method was also used for the analysis of selected morphological traits. The R computing environment (R version 4.3.1) was used to perform the analyses and visualizations.
3. Results
3.1. Experiment 1. Effect of Substrate Salinity
3.1.1. Plant Growth
In the first half of the experiment (Term 1–Term 2), the plants of the control sample exhibited a significantly higher average daily growth rate (approximately 0.47 cm) in comparison to the plants treated with NaCl solutions (ranging from 0.30 to 0.37 cm). In the second half of the experiment (Term 2–Term 3), the lowest growth rate was observed in plants exposed to the NaCl80 treatment (approximately 0.37 cm per day). The results of the experiment demonstrated that the growth rate of plants treated with NaCl solutions of 20 mM and 40 mM, as well as those watered with distilled water, was found to be statistically significantly higher during the second stage of the experiment (Term 2–Term 3) in comparison to the first stage (Term 1–Term 2) (Figure 2a).
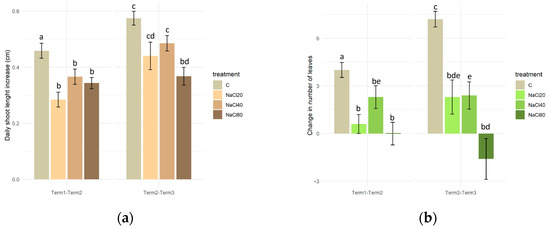
Figure 2.
Daily growth rate of the main shoot (a) and change in the number of leaves (b) of Salix lapponum under different conditions of substrate salinity (n = 10; ±standard deviation). Statistically significant differences (p < 0.05) are indicated by different letters. Comparisons were made (1) between variants within the same experimental phase, and (2) between corresponding variants across the two phases.
From the beginning of the experiment to the end of the second week (Term 1–Term 2), plants watered with water devoid of NaCl addition exhibited a significantly greater increase in the number of leaves (4 on average) in comparison to all variants treated with NaCl solutions (0 and 2 leaves on average). During the second stage of the experiment (Term 2–Term 3), the trend persisted, with plants of the control variant producing a greater number of leaves compared to those growing in the saline substrate. Despite minor variations in the number of leaves of plants exposed to differing levels of salinity, it was observed that only those plants that were watered with 80 mM NaCl solution exhibited a negative value for that particular parameter (Figure 2b).
3.1.2. Relative Water Content
At the beginning of the experiment, the plants were distinguished by a significantly elevated relative water content in their tissues (approximately 97%). After 2 weeks of experimentation in Term 2, the RWC in all cases exhibited a consistent oscillation around 88%. The results of tests conducted after a four-week exposure period (Term 3) indicated a further decrease in RWC values. The lowest values of that parameter were recorded in plants watered with NaCl solutions of 20 mM (66%) and 80 mM (69%). Statistical analysis revealed a substantial decline in RWC values of plant tissues across all salinity variants at Term 3, in comparison to the initial value of this parameter (Term 1; Figure 3).
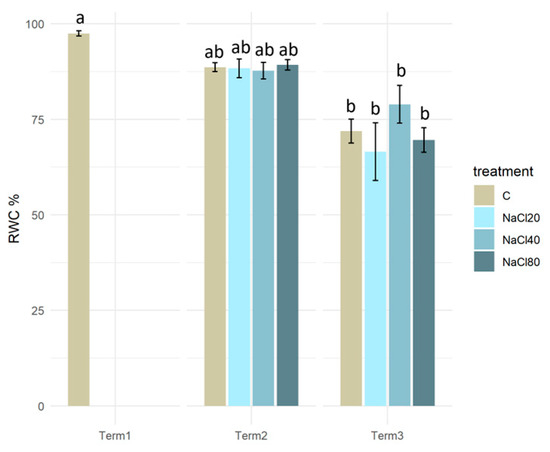
Figure 3.
Relative water content (RWC) in the tissues of Salix lapponum exposed to different substrate salinity conditions (n = 5; ±standard deviation). Statistically significant differences (p < 0.05) are indicated by different letters. Comparisons were made (1) between variants at each measurement term; (2) between corresponding variants at different terms. The control group from Term 1 was additionally used as a reference for comparison with each variant in subsequent terms.
3.1.3. Photosynthetic Pigments Content
The content of chlorophyll a in plant tissues exhibited no significant variation among individuals treated with solutions of varying NaCl concentrations (20, 40, and 80 mM) at both Term 2 and Term 3. Irrespective of the concentration of NaCl solution used for watering, a significant decrease in chlorophyll a content was evident in all plant groups at the final experimental date in comparison to the initial value (Term 1; Figure 4a).

Figure 4.
Concentrations of photosynthetic pigments. Chlorophyll a (a), chlorophyll b (b), and carotenoids (c) in Salix lapponum leaves exposed to different substrate salinity conditions (n = 5; ±standard deviation). Statistically significant differences (p < 0.05) are indicated by different letters. Comparisons were made (1) between variants at each measurement term; (2) between corresponding variants at different terms. The control group from Term 1 was additionally used as a reference for comparison with each variant in subsequent terms.
In the case of chlorophyll b content in the S. lapponum tissues, no significant differences were observed between the test specimens from the different salinity variants at Term 2. After 4 weeks of the experiment, it was evident that the application of a 40 mM NaCl solution to the plants had a substantial impact on the chlorophyll b content in tissues. A significant decline in chlorophyll b was observed when compared to the control. There was a significant decrease in the content of chlorophyll b in the tissues of plants treated with a 40 mM NaCl solution compared to the control sample at that time, as well as to the initial values recorded during Term 1 (Figure 4b).
After two weeks of the experiment, no statistically significant differences were observed in the carotenoid content of the tested plants’ tissues across all the experimental variants. A significant decrease in carotenoid levels was observed in plants of all salinity variants, relative to the initial level recorded in Term 1, only after four weeks (Figure 4c).
3.1.4. Selected Chlorophyll Fluorescence Parameters
After two weeks of the experiment, no significant differences were observed in F0 and Fm values between plants treated with different solutions of varying NaCl concentrations. Significant reductions in both F0 and Fm were recorded in S. lapponum individuals after four weeks of exposure to 40 mM and 80 mM NaCl solutions, compared to the control group. In the case of F0, following a two-week exposure to varying concentrations of NaCl, a decline in the parameter value was observed in all the plant groups that were analyzed. Following a further two-week period (Term 3), a substantial increase in F0 values was observed in each salinity variant tested. The exposure of plants to varying levels of substrate salinity resulted in a gradual decline in Fm values. The exceptions were found in plants watered with a 20 mM NaCl solution. In these cases, an increase in the Fm parameter was observed in Term 2, and in Term 3, the value was found to be close to the result obtained at the beginning of the experiment (Table 2).

Table 2.
Selected parameters of chlorophyll a fluorescence. Minimum fluorescence (F0), maximum fluorescence (Fm) value, and maximum quantum yield of PSII photochemistry (Fv/Fm) in Salix lapponum leaves under different conditions of substrate salinity (n = 10; ±standard deviation).
In the case of the Fv/Fm parameter, which is related to the maximum efficiency of PSII, its value at the start of the experiment ranged between 0.733 and 0.770. Following a fortnight of exposure to NaCl solutions of varying concentrations, a significant increase in the values of the indicator was observed in all experimental variants, ranging from 0.785 to 0.800. No statistically significant differences were observed among the plants treated with different NaCl concentrations at that stage. After four weeks, a decline in the Fv/Fm value was observed in all variants of the experiment. Furthermore, significant differences were noted in the value of Fv/Fm among plants from different experimental variants. Plants exposed to NaCl solutions with concentrations of 40 mM and 80 mM NaCl were subjected to statistical analysis, which revealed that the lowest Fv/Fm values recorded throughout the experiment were approximately 0.670 (Table 2).
3.1.5. Anthocyanin Content
The plant material of the tested S. lapponum specimens exhibited a low anthocyanin content of approximately 0.04 mg/g FW prior to the application of NaCl solutions. A statistically significant increase in anthocyanin content was observed in plants treated with NaCl solutions at concentrations of 20 and 80 mM during Term 2. In Term 3, the level of anthocyanin in plant tissues remained consistent and was only significantly higher only in the NaCl20 and NaCl40 salinity variants (Figure 5).
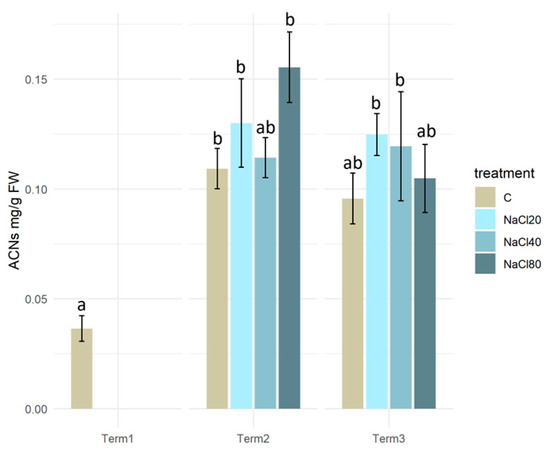
Figure 5.
Anthocyanin content in tissues of Salix lapponum exposed to different substrate salinity conditions (n = 5; ±standard deviation). Statistically significant differences (p < 0.05) are indicated by different letters. Comparisons were made (1) between variants at each measurement term; (2) between corresponding variants at different terms. The control group from Term 1 was additionally used as a reference for comparison with each variant in subsequent terms.
3.1.6. Antioxidant Enzyme Activity
Analysis of changes in guaiacol peroxidase activity in S. lapponum tissues revealed no statistically significant differences between groups of plants from different variants of the experiment at both Term 2 and Term 3. Following a two-week exposure to NaCl solutions, guaiacol peroxidase activity in S. lapponum tissues was relatively low. After 4 weeks of exposure of plants to NaCl solutions, there was an increase in GPOX activity in the tissues, with the highest levels being observed in the NaCl20 and NaCl80 mM salinity variants. As a consequence of exposure to NaCl solution at a concentration of 20 mM, a statistically significant increase in GPOX levels was observed in plants at Term 3 in comparison with those at Term 2. Conversely, the group of plants that were watered with NaCl 80 mM solution exhibited a statistically significant increase in GPOX activity at Term 3 in comparison with Term 1 (Figure 6).
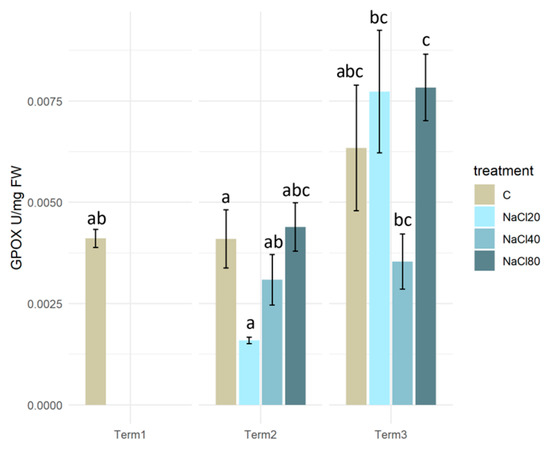
Figure 6.
Guaiacol peroxidase activity (GPOX) in the tissues of Salix lapponum exposed to different substrate salinity conditions (n = 5; ±standard deviation). Statistically significant differences (p < 0.05) are indicated by different letters. Comparisons were made (1) between variants at each measurement term; (2) between corresponding variants at different terms. The control group from Term 1 was additionally used as a reference for comparison with each variant in subsequent terms.
3.1.7. Histochemical Detection of Reactive Oxygen Species (ROS)
Histochemical analysis employing NBT and DAB staining revealed the level of reactive oxygen species (ROS) in the leaf tissues of NaCl-treated S. lapponum specimens.
In the case of superoxide anion (O2−), detected with NBT, the intensity of staining exhibited a marked enhancement after a period of two weeks (Term 2), while after four weeks (Term 3), a decline in the intensity of the blue reaction product was discernible, thereby suggesting a reduction in O2− content. At concentrations of 20 and 40 mM NaCl, ROS accumulated was predominantly observed in the petioles and as a spot in the leaf blade. However, at a concentration of 80 mM, there was additionally intense staining within the leaf nerves (Figure 7).
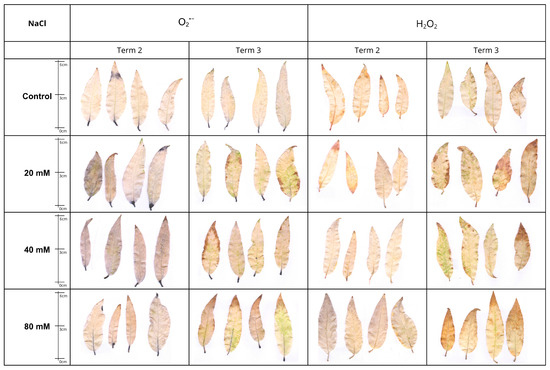
Figure 7.
Visualization of histochemical detection of superoxide anion (O2•−·, NBT staining) and hydrogen peroxide (H2O2, DAB staining) in Salix lapponum leaves exposed to 0, 20, 40, and 80 mM NaCl at two sampling times (Term 2, Term 3). Dark blue indicates O2•−·accumulation; brown indicates H2O2 accumulation. Scale in cm.
A divergent trend was observed in the detection of hydrogen peroxide (H2O2) with DAB. After four weeks, the staining was found to be more intense in comparison to the result obtained after two weeks, indicating the accumulation of H2O2 in plant tissues during the experiment. The highest ROS content was recorded in S. lapponum leaves in the NaCl80 variant after four weeks, where the dark brown staining product covered almost the entire leaf blade. In the presence of reduced concentrations of NaCl (20 and 40 mM), the ROS were predominantly localized at the periphery of the leaf blade (Figure 7).
3.2. Experiment 2. The Effect of Nitrate Nitrogen
3.2.1. Plant Growth
During the initial period of the experiment (Term 1–Term 2), a significant difference in the mean daily rate of shoot growth was observed, exclusively between the control plants (0.47 cm) and those treated with the solution with the highest N-NO3 concentration (0.38 cm). In the second half of the experiment (Term 2–Term 3), plants watered with solutions of 1 mg/L and 10 mg/L N-NO3 concentrations exhibited significantly higher growth (0.72–0.8 cm per day) in comparison to the control plants and those treated with the 100 mg/L N-NO3 solution (approximately 0.6 cm per day on average). A comparison of the mean daily growth rate of the plants across both experimental terms revealed that the plants in all of the experimental variants intensified their growth rate in the second half of the experiment (Figure 8a).
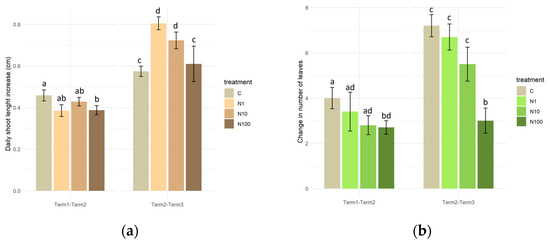
Figure 8.
Daily growth rate of the main shoot (a) and change in the number of leaves (b) of Salix lapponum under the influence of different concentrations of nitrate nitrogen (n = 10; ±standard deviation). Statistically significant differences (p < 0.05) are indicated by different letters. Comparisons were made (1) between variants within the same experimental phase, and (2) between corresponding variants across the two phases.
An analysis of the change in the number of leaves in S. lapponum specimens revealed that after 4 weeks of the experiment (Term 2–Term 3), plants that were watered with distilled water and solutions containing N-NO3 at concentrations of 1 and 10 mg/L exhibited a significant intensification in leaf production compared to the initial measurement period. Despite the absence of statistically significant differences in the number of newly formed leaves between the control plants and those from the N1 and N10 variants, a trend was observed in both measurement periods, indicating that as the concentration of N-NO3 increased, the production of leaves was slower (Figure 8b).
3.2.2. Relative Water Content
Initially, S. lapponum individuals were characterized by very high values of relative water content (RWC) (approximately 97%), which decreased during the course of the experiment. At Term 2, the RWC value in each treatment was approximately 89%. Following a period of four weeks, it was observed that the RWC values exhibited variation in the plants, depending on the N-NO3 concentration, with a range from 72% to 84%. In Term 3, a significant decline in RWC was evident in all experimental variants in comparison to Term 1 (Figure 9).
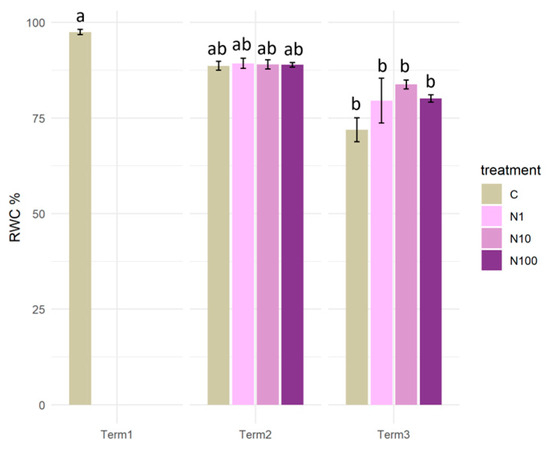
Figure 9.
Relative water content (RWC) in the tissues of Salix lapponum under the influence of different concentrations of nitrate nitrogen (n = 5; ±standard deviation). Statistically significant differences (p < 0.05) are indicated by different letters. Comparisons were made (1) between variants at each measurement term; (2) between corresponding variants at different terms. The control group from Term 1 was additionally used as a reference for comparison with each variant in subsequent terms.
3.2.3. Photosynthetic Pigments Content
An analysis was conducted of the photosynthetic pigments present in plants exposed to varying concentrations of nitrate nitrogen, which revealed no significant differences in the content of chlorophyll a, chlorophyll b, and carotenoids between plants at each measurement date.
After 4 weeks of the experiment, it was evident that the application of N-NO3 solution to the plants resulted in a substantial decline in the levels of chlorophyll a and carotenoids in the tissues, as compared to the initial values recorded at the beginning of the experiment. With regard to the content of chlorophyll b in the tissues of S. lapponum, the results obtained did not differ significantly between the experimental terms (Figure 10a–c).

Figure 10.
Concentrations of photosynthetic pigments. Chlorophyll a (a), chlorophyll b (b), and carotenoids (c) in Salix lapponum leaves under the influence of different concentrations of nitrate nitrogen (n = 5; ±standard deviation). Statistically significant differences (p < 0.05) are indicated by different letters. Comparisons were made (1) between variants at each measurement term; (2) between corresponding variants at different terms. The control group from Term 1 was additionally used as a reference for comparison with each variant in subsequent terms.
3.2.4. Selected Chlorophyll Fluorescence Parameters
An analysis of chlorophyll fluorescence parameters in plants treated with solutions containing different concentrations of nitrate nitrogen revealed no statistically significant differences in F0 and Fm values either between groups of plants within each measurement term or between terms. The values of F0 exhibited a consistent tendency to approximate 180 throughout the experiment, while the value of Fm remained at around 830. The values of the maximum efficiency of photosystem II (Fv/Fm) in each of the three terms of measurement oscillated around 0.8. Nevertheless, the findings of the statistical analyses demonstrated a significant increase in the values of this parameter after 2 weeks of conducting the experimental variants that were examined (Table 3).

Table 3.
Selected parameters of chlorophyll a fluorescence. Minimum fluorescence (F0), maximum fluorescence (Fm) value, and maximum quantum yield of PSII photochemistry (Fv/Fm) in Salix lapponum leaves under the influence of different concentrations of nitrate nitrogen (n = 10; ±standard deviation).
3.2.5. Anthocyanin Content
The results of the analysis demonstrated that the initial levels of anthocyanins in the plant tissues were minimal. However, after 2 weeks of exposure to N-NO3 solutions, a significant increase in the content of these compounds was observed in plants in all variants of the experiment. A decline in the anthocyanin content of plant tissues was observed at Term 3. Statistical analysis revealed that there were no significant differences in anthocyanin content either between plants exposed to N-NO3 at Term 2 and Term 3 of the analyses, nor between the two terms (Figure 11).
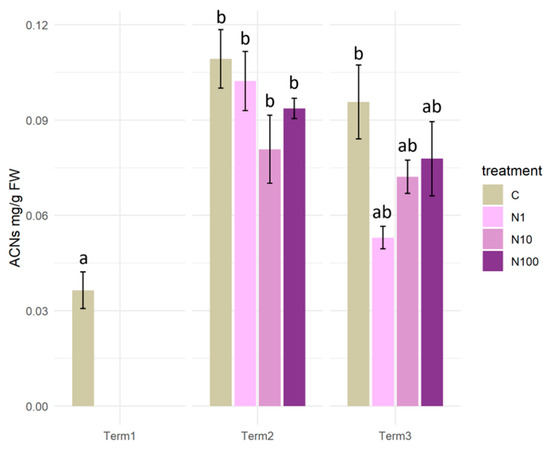
Figure 11.
Anthocyanin content in tissues of Salix lapponum under the influence of different concentrations of nitrate nitrogen (n = 5; ±standard deviation). Statistically significant differences (p < 0.05) are indicated by different letters. Comparisons were made (1) between variants at each measurement term; (2) between corresponding variants at different terms. The control group from Term 1 was additionally used as a reference for comparison with each variant in subsequent terms.
3.2.6. Antioxidant Enzyme Activity
After two weeks of the experiment, a statistically significant decrease in GPOX activity was observed in plants of the N1 and N100 variants in comparison to the control and N10 plants. The situation changed after four weeks, when an increase in GPOX activity was observed in all variants of the experiment. In the case of plants that were watered with solutions of 1 and 100 mg/L of N-NO3, there was a statistically significant increase in comparison to the results obtained in Term 2 (Figure 12).
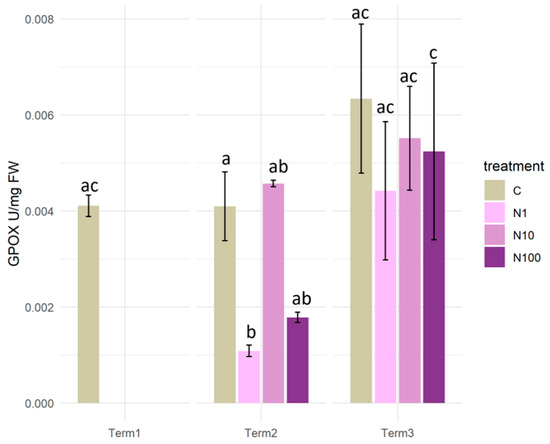
Figure 12.
Guaiacol peroxidase activity (GPOX) in the tissues of Salix lapponum under the influence of different concentrations of nitrate nitrogen (n = 5; ±standard deviation). Statistically significant differences (p < 0.05) are indicated by different letters. Comparisons were made (1) between variants at each measurement term; (2) between corresponding variants at different terms. The control group from Term 1 was additionally used as a reference for comparison with each variant in subsequent terms.
3.2.7. Histochemical Detection of Reactive Oxygen Species (ROS)
Plants treated with aqueous solutions of N-NO3 demonstrated differential accumulation of ROS in response to this stress factor. Following a period of 2 weeks, a slight accumulation of superoxide anion was observed in the N1 and N10 variants. The staining product accumulated primarily within the petioles and at the base of the leaf blade. In the N100 variant, the staining was more intense. The control sample exhibited minimal staining. In Term 3, the intensity of NBT staining was lower than in Term 2.
It was established that hydrogen peroxide was detected in response to the action of N-NO3 solutions. ROS accumulation was observed at the margins of leaf blades after 2 weeks. As the concentration of the solution increased, the staining became more intense. After 4 weeks of experimentation, it was determined that there were no statistically significant differences in DAB staining (Figure 13).
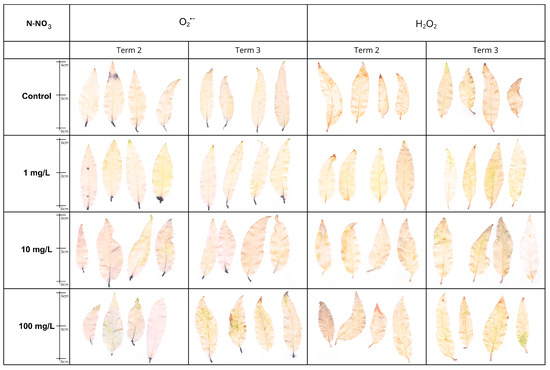
Figure 13.
Visualization of histochemical detection of superoxide anion (O2•−·, NBT staining) and hydrogen peroxide (H2O2, DAB staining) in Salix lapponum leaves exposed to 0, 1, 10, and 100 mg/L N-NO3 solutions at two sampling times (Term 2, Term 3). Dark blue indicates O2−· accumulation; brown indicates H2O2 accumulation. Scale in cm.
4. Discussion
In the era of ongoing climate change, the conservation of biodiversity is confronted with numerous new challenges. The efficacy of conventional in situ methods employed for the protection of plant species may be inadequate [48]. As Twardek et al. [49] note, there is an increasing tendency to consider actions based on the so-called assisted migrations and translocations to new, relatively stable, and climate-resilient areas [49]. The effectiveness of these measures depends on their adaptation to the specific species concerned. The findings of physiological studies provide many answers to questions about the range of ecological tolerance and stress responses, while empirical data provide insight into the mechanisms that influence the efficiency of plant acclimatization to fluctuating environmental conditions. This, in turn, has resulted in the development of dedicated methods for the protection of species, thereby increasing their chances for long-term survival in substitute habitats [50].
Although stress factors rarely occur in isolation and usually act synergistically or antagonistically, with different intensities in time and space, conducting laboratory experiments using single stressors remains a fundamental tool for understanding the mechanisms of plant physiological response [51,52,53]. In the context of protected and endangered species, such studies assume particular significance, as they provide the knowledge necessary to formulate effective active conservation measures. At the same time, these species impose considerable demands, primarily due to the restricted availability of plant material resulting from low population size and the legal and ethical requirements [54].
Studies conducted in order to gain a more detailed understanding of the response of Salix lapponum specimens to different concentrations of NaCl and N-NO3 in the soil solution demonstrated that both factors act as abiotic stressors. The effect of these substances on plants is dependent on various morpho-physiological parameters, which are determined through analysis. The parameters vary depending on the dose and time of exposure.
The rate of shoot growth, as well as the development of new leaves, reflects the cumulative effect of environmental factors on plant metabolism. These phenomena are also the first phenotypically apparent signs of abiotic stress [55]. It is evident that the alterations in biometric parameters, as observed at the morphological level, are the consequence of disturbances at the physiological level. Consequently, further analysis of parameters such as the content of photosynthetic pigments and anthocyanins, the efficiency of the photosynthetic apparatus, the relative water content, and the activity of antioxidant enzymes enables a more profound comprehension of intracellular adaptations to stress conditions [56,57].
In the experiments conducted, salt stress had a more profound effect on S. lapponum specimens than the effect of aqueous solutions containing N-NO3. Irrespective of the concentration of the solution and the duration of exposure, the salinity of the substrate in each case led to a decline in the growth rate and negatively affected the foliage condition of plants, resulting in leaf necrosis. Conversely, nitrate nitrogen solution administered at low doses (1 and 10 mg/L) with prolonged exposure had a stimulatory effect on the growth of S. lapponum specimens. Bayat et al. [58] conducted a series of experiments on Salvia lavandulifolia, irrigating the plants with solutions of varying salinity levels. The findings indicated that as the concentration of the solutions increased, there was a substantial decline in the growth rate of the plants. Additionally, the number, size, and shape of leaves were smaller in comparison to plants cultivated in an unsalted medium. This study also documented a reduction in the length of the roots. Furthermore, elevated nitrogen levels in the soil solution can also inhibit growth rates, as evidenced by studies undertaken by Chen et al. [59] on three species of leafy vegetables.
The findings of the experiments conducted on S. lapponum specimens demonstrated that osmotic stress induced by aqueous solutions of NaCl and N-NO3 significantly affects the relative water content (RWC) of plant tissues. Following a 14-day experimental period, the RWC in the examined plants remained high (about 88%) irrespective of the salinity variant. However, only prolonged exposure (4 weeks) to substrate salinity resulted in a significant decrease in RWC values (up to 66% in the NaCl20 variant), indicating an impaired ability of plants to maintain water homeostasis under long-term salt stress. A comparable, though less severe, decline in RWC was observed in plants exposed to nitrate-nitrogen-containing solutions, with RWC values decreasing to 89% after 2 weeks, and reaching values of 72 to 84% after 4 weeks. Despite its relatively mild course, this stress factor also led to disturbances in plant water management. The results of the present study demonstrate that S. lapponum is capable of counteracting short-term osmotic stress; however, its long-term effect results in the disruption of plant water management. A comparable phenomenon was described by Yazici et al. [60] in a study conducted on Portulaca oleracea L., where, after 18 days of exposure to salinity (70 and 140 mM NaCl), the relative water content of the leaves was about 80%. After 30 days of exposure, a decline in the RWC was observed, with oscillations reaching approximately 65%. The authors suggest that the high RWC value in short-term exposure to stress factors results from osmoregulatory mechanisms, including the synthesis of osmoprotective proline. Nevertheless, longer exposure to both salinity and nitrogen compounds may lead to ionic imbalance, which, in turn, may result in a decline in RWC values [60,61,62].
Conducted experiment revealed that elevated levels of salinity and nitrate nitrogen in the substrate led to a decrease in the content of photosynthetic pigments present in the tissues of the plants studied, even at low concentrations of the solutions used for watering. Salt stress has been shown to result in numerous ion imbalances and toxic effects of Na+ and Cl- ions, which directly disrupt chlorophyll synthesis [63]. Reductions in chlorophyll a and b content were also observed in studies on Salvia lavandulifolia, in which an increase in salinity levels correlated with a decrease in photosynthetic pigments [58]. As Bertamini et al. [64] demonstrate, measurements of chlorophyll fluorescence and, in particular, the parameter of maximum photosystem II efficiency (Fv/Fm) allow for the early detection of plant responses to environmental stresses. The results on Salix lapponum are consistent with those reported by Ran et al. [65] for Salix alba, where salt stress significantly impaired photosynthetic efficiency through both stomatal and extra-stomatal mechanisms, and induced oxidative stress at the PSII level, leading to more frequent inactivation of the PSII reaction center. In the study conducted by Yousefi and Karamian [66], Satureia mutica was treated with salt solutions at concentrations ranging from 0 to 150 mM. Their study revealed a significant decline in chlorophyll fluorescence parameters in the absence of salinity. The value of the Fv/Fm parameter was recorded as 0.81, while at 150 mM NaCl, it decreased to 0.66.
A conducted study indicates that in salt stress situations, S. lapponum plants accumulate significantly higher amounts of reactive oxygen species than when nitrate nitrogen availability in soil is increased. When exposed to N-NO3, the staining products of DAB and NBT solutions were less pronounced than in plants exposed to salt stress. Ashraf [67] indicates that salt stress disrupts gas exchange in plants by limiting CO2 uptake, which in turn contributes to the production of ROS such as hydrogen peroxide, singlet oxygen, and superoxide anion. Studies previously conducted on S. lapponum and Salix myrtilloides specimens acclimated to ex vitro conditions demonstrated that, in circumstances of a drastic change in environmental conditions (i.e., transfer of plants from the phytotron to field acclimation), there is a significant accumulation of ROS in the plants’ tissues, in comparison to the exposure of plants to single stress factors [42,68]. The histochemical detection of ROS has confirmed the intensification of oxidative stress in response to NaCl solutions, as observed in Sphaerophysa kotschyana. After 14 days of exposure to salt stress, strong staining of reaction products with NBT and DAB was observed. The most significant accumulation of ROS was observed at a concentration of 300 mM NaCl, resulting in the complete coverage of the entire leaf blade. In contrast, at lower concentrations (150 mM), the staining was mainly limited to the areas of the conductive bundles [69].
It has been proven that plants, through specialized enzymatic mechanisms, are capable of eliminating ROS from the body and mitigating the effects of oxidative stress. The findings of the two experiments presented in this paper demonstrated an increase in GPOX activity in S. lapponum tissues following prolonged exposure to stress factors. However, this value was statistically significant only when the highest concentration of NaCl was applied. Short-term application of NaCl solutions and N-NO3 to the substrate resulted in a decline in guaiacol peroxidase activity in the plants studied. This phenomenon was previously observed in the study of Yildiztugay et al. [69] on Sphaerophysa kotschyana, where a decline in peroxidase activity (POX) was documented in plant tissues in response to salt stress. The authors suggest that reduced POX activity may impede the lignification process, thereby facilitating sustained water uptake and diminished water loss. This phenomenon is hypothesized to be an adaptive mechanism to maintain elevated levels of RWC.
Non-enzymatic defense systems, in which anthocyanins play a pivotal role, have also been identified as a means of protecting plants from the negative effects of environmental stress [70]. A study conducted on S. lapponum revealed that elevated levels of anthocyanins were particularly evident at the initial stage of the occurrence of salt stress. An increase in anthocyanin content in response to salt stress is also described by Eryılmaz [71] in studies conducted on tomatoes and red cabbage. The author observed elevated anthocyanin concentrations after a single week of exposure of plants to 50 and 100 mM NaCl solutions. In the course of research conducted on a range of tomato varieties, Napar et al. [72] demonstrated that a tomato genotype exhibiting increased levels of anthocyanins showed enhanced tolerance to drought and salinity in comparison to genotypes characterized by lower levels of these compounds. Consequently, the concentration of anthocyanins in plants may serve as a sensitive indicator expressing plant tolerance to salinity stress.
It is well known that appropriate doses of nitrogen have a stimulatory effect on plant growth, whereas its excess, in both nitrate (NO3−) and ammonium (NH4+) forms, can result in stunted plant growth [73,74]. Research undertaken in the natural habitats of S. lapponum in eastern Poland has demonstrated that the concentrations of nitrogen compounds in plant-accessible groundwater are minimal [27]. The findings of these studies indicate that the downy willow is capable of functioning properly in nitrogen-poor habitats. However, the upper limit of the species’ ecological tolerance to this factor remains to be determined. The results of the experiment presented in this study showed that S. lapponum specimens do not react with a strong stress to increased nitrogen doses or to the salinity of the substrate. Given that nitrogen is one of several biogenic elements that cause eutrophication, and that in the present study only the nitrate form was taken into account, there is a need for further research, especially taking into account other forms of nitrogen. The results of studies conducted on Aldrovanda vesiculosa demonstrate that the form in which nitrogen is present in the water is more important for optimal plant growth and development than its content in solution alone. Ammonium ions (NH4+) had a detrimental effect on turion development and inhibited the growth of A. vesiculosa plants. Conversely, nitrate ions (NO3−), which were present in the solution in which the plants were kept, had a stimulatory effect on their growth [75].
5. Conclusions
The experimental results have expanded the current understanding of the response of Salix lapponum individuals to short-term abiotic stress associated with changes in the chemical composition of the soil.
S. lapponum individuals activate defense mechanisms in the form of antioxidant enzymes, anthocyanin synthesis, and maintain high RWC values when exposed to environmental stress factors such as increased soil salinity.
The presence of low concentrations of nitrate nitrogen in the soil solution stimulates plant growth, but the use of solutions with high concentrations of this form of nitrogen causes a deterioration of the studied morphophysiological parameters of S. lapponum.
Further research is necessary to determine both the impact of long-term exposure of plants to the studied factors and the impact of other nutrients on the growth and condition of the studied species. This will allow to determine the feasibility of conservation measures through reintroduction into habitats potentially vulnerable to eutrophication or salinity.
Author Contributions
Conceptualization, M.A. and M.P. (Magdalena Pogorzelec); methodology, M.A., M.P. (Magdalena Pogorzelec), and M.P. (Marzena Parzymies); validation, M.A. and U.B.-M.; formal analysis, M.A. and U.B.-M.; investigation, M.A. and M.P. (Magdalena Pogorzelec); resources, M.A.; data curation, M.A.; writing—original draft preparation, M.A.; writing—reviewing and editing, M.P. (Magdalena Pogorzelec), U.B.-M., and M.P. (Marzena Parzymies); visualization, M.A. and U.B.-M.; supervision, M.P. (Magdalena Pogorzelec) and M.P. (Marzena Parzymies); project administration, M.A.; funding acquisition, M.A. All authors have read and agreed to the published version of the manuscript.
Funding
This research was supported by project [no. SD.WLH.24.074] provided by the University of Life Sciences in Lublin, Poland.
Data Availability Statement
The raw data supporting the conclusions of this article will be made available by the authors on request.
Conflicts of Interest
The authors declare no conflicts of interest.
Abbreviations
The following abbreviations are used in this manuscript:
| ROS | Reactive Oxygen Species |
| RWC | Relative Water Content |
References
- Beusen, A.H.; Bouwman, A.F.; Van Beek, L.P.; Mogollón, J.M.; Middelburg, J.J. Global riverine N and P transport to ocean increased during the 20th century despite increased retention along the aquatic continuum. Biogeosciences 2016, 13, 2441–2451. [Google Scholar] [CrossRef]
- Zarkami, R.; Abedini, A.; Sadeghi Pasvisheh, R. Analysis of the eutrophication in a wetland using a data-driven model. Environ. Monit. Assess. 2022, 194, 882. [Google Scholar] [CrossRef]
- Khan, F.A.; Ansari, A.A. Eutrophication: An ecological vision. Bot. Rev. 2005, 71, 449–482. [Google Scholar] [CrossRef]
- Khan, M.N.; Mohammad, F. Eutrophication: Challenges and solutions. In Eutrophication: Causes, Consequences and Control; Ansari, A., Gill, S., Eds.; Springer: Dordrecht, The Netherlands, 2014; Volume 2, pp. 1–15. [Google Scholar] [CrossRef]
- Borgström, A.; Hansson, L.A.; Klante, C.; Sjöstedt, J. Wetlands as a potential multifunctioning tool to mitigate eutrophication and brownification. Ecol. Appl. 2024, 34, e2945. [Google Scholar] [CrossRef]
- de Oliveira, D.A.V.; Botero, W.G.; Santos, J.C.C.; da Silva, R.M.; Pitombo, L.M.; do Carmo, J.B.; Rosa, L.M.T.; de Oliveira, L.C. Interaction study between humin and phosphate: Possible environmental remediation for domestic wastewater. Water Air Soil Pollut. 2017, 228, 265. [Google Scholar] [CrossRef]
- Liu, D.; Huang, Z.; Men, S.; Huang, Z.; Wang, C. Nitrogen and phosphorus adsorption in aqueous solutions by humic acids from weathered coal: Isotherm, kinetics and thermodynamic analysis. Water Sci. Technol. 2019, 79, 2175–2184. [Google Scholar] [CrossRef]
- Seniczak, A.; Seniczak, S.; Maraun, M.; Graczyk, R.; Mistrzak, M. Oribatid mite species numbers increase, densities decline and parthenogenetic species suffer during bog degradation. Exp. Appl. Acarol. 2016, 68, 409–428. [Google Scholar] [CrossRef]
- Salimi, S.; Almuktar, S.A.; Scholz, M. Impact of climate change on wetland ecosystems: A critical review of experimental wetlands. J. Environ. Manag. 2021, 286, 112160. [Google Scholar] [CrossRef] [PubMed]
- Venterink, H.O.; Davidsson, T.E.; Kiehl, K.; Leonardson, L. Impact of drying and re-wetting on N, P and K dynamics in a wetland soil. Plant Soil 2002, 243, 119–130. [Google Scholar] [CrossRef]
- Swindles, G.T.; Morris, J.P.; Mullan, D.J.; Payne, R.J.; Roland, T.P.; Amesbury, M.J.; Lamentowicz, M.; Turner, E.T.; Gallego-Sala, A.; Sim, T.; et al. Widespread drying of European peatlands in recent centuries. Nat. Geosci. 2019, 12, 922–928. [Google Scholar] [CrossRef]
- Kreyling, J.; Tanneberger, F.; Jansen, F.; Van Der Linden, S.; Aggenbach, C.; Blüml, V.; Couwenberg, J.; Emsens, W.J.; Joosten, H.; Klimkowska, A.; et al. Rewetting does not return drained fen peatlands to their old selves. Nat. Commun. 2021, 12, 5693. [Google Scholar] [CrossRef]
- Herbert, E.R.; Boon, P.; Burgin, A.J.; Neubauer, S.C.; Franklin, R.B.; Ardón, M.; Hopfensperger, K.N.; Lamers, L.P.M.; Gell, P. A global perspective on wetland salinization: Ecological consequences of a growing threat to freshwater wetlands. Ecosphere 2015, 6, 1–43. [Google Scholar] [CrossRef]
- Parihar, P.; Singh, S.; Singh, R.; Singh, V.P.; Prasad, S.M. Effect of salinity stress on plants and its tolerance strategies: A review. Environ. Sci. Pollut. Res. 2015, 22, 4056–4075. [Google Scholar] [CrossRef] [PubMed]
- Safdar, H.; Amin, A.; Shafiq, Y.; Ali, A.; Yasin, R.; Shoukat, A.; Hussan, M.U.; Sarwar, M.I. A review: Impact of salinity on plant growth. Nat. Sci. 2019, 17, 34–40. [Google Scholar] [CrossRef]
- Hawrylak-Nowak, B. Beneficial effects of exogenous selenium in cucumber seedlings subjected to salt stress. Biol. Trace Elem. Res. 2009, 132, 259–269. [Google Scholar] [CrossRef]
- Almansouri, M.; Kinet, J.M.; Lutts, S. Effect of salt and osmotic stresses on germination in durum wheat (Triticum durum Desf.). Plant Soil 2001, 231, 243–254. [Google Scholar] [CrossRef]
- Munns, R.; James, R.A.; Läuchli, A. Approaches to increasing the salt tolerance of wheat and other cereals. J. Exp. Bot. 2006, 57, 1025–1043. [Google Scholar] [CrossRef]
- Hoang, T.M.L.; Tran, T.N.; Nguyen, T.K.T.; Williams, B.; Wurm, P.; Bellairs, S.; Mundree, S. Improvement of salinity stress tolerance in rice: Challenges and opportunities. Agronomy 2016, 6, 54. [Google Scholar] [CrossRef]
- Hawrylak-Nowak, B.; Dresler, S.; Stasińska-Jakubas, M.; Wójciak, M.; Sowa, I.; Matraszek-Gawron, R. NaCl-induced elicitation alters physiology and increases accumulation of phenolic compounds in Melissa officinalis L. Int. J. Mol. Sci. 2021, 22, 6844. [Google Scholar] [CrossRef]
- Polle, A.; Chen, S. On the salty side of life: Molecular, physiological and anatomical adaptation and acclimation of trees to extreme habitats. Plant Cell Environ. 2015, 38, 1794–1816. [Google Scholar] [CrossRef]
- Flowers, T.J.; Colmer, T.D. Salinity tolerance in halophytes. New Phytol. 2008, 179, 945–963. [Google Scholar] [CrossRef] [PubMed]
- Heywood, V.H.; Iriondo, J.M. Plant conservation: Old problems, new perspectives. Biol. Conserv. 2003, 113, 321–335. [Google Scholar] [CrossRef]
- Cardona, C.; Cortés-Fernández, I.; Cerrato, M.D.; Gil, L. Salinity tolerance of two critically endangered endemic species and its implications for distribution and conservation of model microinsular Mediterranean species. Plant Ecol. 2024, 225, 139–151. [Google Scholar] [CrossRef]
- Jiménez-Alfaro, B.; García-Calvo, L.; García, P.; Acebes, J.L. Anticipating extinctions of glacial relict populations in mountain refugia. Biol. Conserv. 2016, 201, 243–251. [Google Scholar] [CrossRef]
- Boxriker, M.; Ferenc, V.; Liancourt, P.; Thiv, M. Almost nothing left to lose: Suitable habitat for glacial relicts strongly declines under future climate and land use scenarios. Glob. Ecol. Conserv. 2025, 59, e03541. [Google Scholar] [CrossRef]
- Serafin, A.; Pogorzelec, M.; Banach, B.; Szczurowska, A.; Mielniczuk, J. Physico-chemical groundwater conditions at Salix lapponum stands in Eastern Poland. Dendrobiology 2015, 73, 65–74. [Google Scholar] [CrossRef]
- Kłosowski, S.; Kłosowski, G. Flora Polski Rośliny Wodne i Bagienne; Multico: Warszawa, Poland, 2006; pp. 1–333. [Google Scholar]
- Kruszelnicki, J. Salix lapponum L. Wierzba lapońska. In Polska Czerwona Księga Roślin. Paprotniki i Rośliny Kwiatowe, 3rd ed.; Kaźmierczakowa, R., Zarzycki, K., Mirek, Z., Eds.; Instytut Ochrony Przyrody PAN: Kraków, Poland, 2014; pp. 86–88. [Google Scholar]
- Pogorzelec, M.; Banach-Albinska, B.; Serafin, A.; Szczurowska, A. Population resources of an endangered species Salix lapponum L. in Polesie Lubelskie Region (eastern Poland). Acta Agrobot. 2014, 67, 4. [Google Scholar] [CrossRef]
- Finger, A.; Rao, S.; Cowie, N.; MacDonell, T.; Beck, A.; Denny, B. Conservation genetics of montane willow populations in Scotland—Limited natural recovery despite long-distance gene flow and high genetic diversity. Environ. Res. Ecol. 2023, 2, 015001. [Google Scholar] [CrossRef]
- Parzymies, M.; Pogorzelec, M.; Głębocka, K.; Śliwińska, E. Genetic stability of the endangered species Salix lapponum L. regenerated in vitro during the reintroduction process. Biology 2020, 9, 378. [Google Scholar] [CrossRef] [PubMed]
- Stamati, K.; Hollingsworth, P.M.; Russell, J.J.P.S. Patterns of clonal diversity in three species of sub-arctic willow (Salix lanata, Salix lapponum and Salix herbacea). Plant Syst. Evol. 2007, 269, 75–88. [Google Scholar] [CrossRef]
- Arciszewski, M.; Pogorzelec, M.; Parzymies, M.; Bronowicka-Mielniczuk, U.; Mieczan, T. Do Endangered Glacial Relicts Have a Chance for Effective Conservation in the Age of Global Warming? A Case Study: Salix lapponum in Eastern Poland. Biology 2024, 14, 19. [Google Scholar] [CrossRef] [PubMed]
- Hroneš, M.; Hrachová, S.; Dančák, M.; Vašut, R.J. Vrba laponská (Salix lapponum L.) v Krkonoších. Opera Corcon. 2011, 48, 69–78. [Google Scholar]
- Hroneš, M.; Hrachová Macurová, S.; Hradílek, Z.; Hekera, P.; Duchoslav, M. Habitat conditions, stage structure and vegetation associations of geographically isolated subalpine populations of Salix lapponum L. (Salicaceae) in the Krkonoše Mts (Czech Republic). Biologia 2018, 73, 319–332. [Google Scholar] [CrossRef]
- Hroneš, M.; Hrachová Macurová, S.; Hradílek, Z.; Hekera, P.; Duchoslav, M. Female-biased sex ratio despite the absence of spatial and niche segregation between sexes in alpine populations of dioecious Salix lapponum (Salicaceae). Alp. Bot. 2019, 129, 1–9. [Google Scholar] [CrossRef]
- Pogorzelec, M. Influence of chosen environmental abiotic factors on Salix lapponum L. populations in Polesie Lubelskie Region. Pol. J. Environ. Stud. 2008, 17, 581–586. [Google Scholar]
- Pogorzelec, M. Salix lapponum L. (downy willow) in stands under anthropopressure in the Łęczna-Włodawa Lakeland. Acta Agrobot. 2010, 63, 1. [Google Scholar] [CrossRef][Green Version]
- Arciszewski, M.; Pogorzelec, M.; Bronowicka-Mielniczuk, U.; Niedźwiecki, M.; Parzymies, M.; Serafin, A. The Search for Suitable Habitats for Endangered Species at Their Historical Sites—Conditions for the Success of Salix lapponum and Salix myrtilloides Reintroduction. Int. J. Environ. Res. Public Health 2023, 20, 1133. [Google Scholar] [CrossRef]
- Pogorzelec, M.; Parzymies, M.; Banach-Albińska, B.; Serafin, A.; Klemedtsson, L. Experimental reintroduction of the boreal species Salix lapponum L. to refuges at the southern limit of its range—Short-term results. Boreal Environ. Res. 2020, 25, 161–169. [Google Scholar][Green Version]
- Pogorzelec, M.; Hawrylak-Nowak, B.; Banach-Albińska, B.; Szczurowska, A.; Parzymies, M.; Spólna, K. From ex situ cultivation to stands in natural habitats: Critical periods for plants during the reintroduction of Salix lapponum L. in Eastern Poland. J. Nat. Conserv. 2022, 67, 126172. [Google Scholar] [CrossRef]
- González, L.; González-Vilar, M. Determination of relative water content. In Handbook of Plant Ecophysiology Techniques; Springer: Dordrecht, The Netherlands, 2001; pp. 207–212. [Google Scholar] [CrossRef]
- Lichtenthaler, H.K.; Wellburn, A.R. Determinations of total carotenoids and chlorophylls a and b of leaf extracts in different solvents. Biochem. Soc. Trans. 1983, 11, 591–592. [Google Scholar] [CrossRef]
- Martínez, A.E.; Favret, E.A. Anthocyanin synthesis and lengthening in the first leaf of barley isogenic lines. Plant Sci. 1990, 71, 35–43. [Google Scholar] [CrossRef]
- Malolepsza, U.; Urbanek, H. Changes in peroxidase activity in bean suspension cultures after B. cinerea and elicitor treatment. J. Phytopathol. 1994, 141, 314–322. [Google Scholar] [CrossRef]
- Kumar, D.; Yusuf, M.A.; Singh, P.; Sardar, M.; Sarin, N.B. Histochemical detection of superoxide and H2O2; accumulation in Brassica juncea seedlings. Bio-Protocol 2014, 4, e1108. [Google Scholar] [CrossRef]
- Wang, Z.; Wang, T.; Zhang, X.; Wang, J.; Yang, Y.; Sun, Y.; Guo, X.; Wu, Q.; Nepovimova, E.; Watson, A.E.; et al. Biodiversity conservation in the context of climate change: Facing challenges and management strategies. Sci. Total Environ. 2024, 937, 173377. [Google Scholar] [CrossRef]
- Twardek, W.M.; Taylor, J.J.; Rytwinski, T.; Aitken, S.N.; MacDonald, A.L.; Van Bogaert, R.; Cooke, S.J. The application of assisted migration as a climate change adaptation tactic: An evidence map and synthesis. Biol. Conserv. 2023, 280, 109932. [Google Scholar] [CrossRef]
- Dalrymple, S.E.; Winder, R.; Campbell, E.M. Exploring the potential for plant translocations to adapt to a warming world. J. Ecol. 2021, 109, 2264–2270. [Google Scholar] [CrossRef]
- Mittler, R. Abiotic stress, the field environment and stress combination. Trends Plant Sci. 2006, 11, 15–19. [Google Scholar] [CrossRef] [PubMed]
- Suzuki, N.; Rivero, R.M.; Shulaev, V.; Blumwald, E.; Mittler, R. Abiotic and biotic stress combinations. New Phytol. 2014, 203, 32–43. [Google Scholar] [CrossRef]
- Zandalinas, S.I.; Sengupta, S.; Fritschi, F.B.; Azad, R.K.; Nechushtai, R.; Mittler, R. The impact of multifactorial stress combination on plant growth and survival. New Phytol. 2021, 230, 1034–1048. [Google Scholar] [CrossRef]
- Heywood, V.H. Plant conservation in the Anthropocene—Challenges and future prospects. Plant Divers. 2017, 39, 314–330. [Google Scholar] [CrossRef]
- Munns, R.; Tester, M. Mechanisms of salinity tolerance. Annu. Rev. Plant Biol. 2008, 59, 651–681. [Google Scholar] [CrossRef]
- Hernández, J.A.; Ferrer, M.A.; Jiménez, A.; Barceló, A.R.; Sevilla, F. Antioxidant systems and O2−/H2O2 production in the apoplast of pea leaves. Its relation with salt-induced necrotic lesions in minor veins. Plant Physiol. 2001, 127, 817–831. [Google Scholar] [CrossRef]
- Zhu, J.K. Plant salt tolerance. Trends Plant Sci. 2001, 6, 66–71. [Google Scholar] [CrossRef]
- Bayat, H.; Shafie, F.; Shahraki, B. Salinity effects on growth, chlorophyll content, total phenols, and antioxidant activity in Salvia lavandulifolia Vahl. Adv. Hortic. Sci. 2022, 36, 145–153. [Google Scholar] [CrossRef]
- Chen, B.M.; Wang, Z.H.; Li, S.X.; Wang, G.X.; Song, H.X.; Wang, X.N. Effects of nitrate supply on plant growth, nitrate accumulation, metabolic nitrate concentration and nitrate reductase activity in three leafy vegetables. Plant Sci. 2004, 167, 635–643. [Google Scholar] [CrossRef]
- Yazici, I.; Türkan, I.; Sekmen, A.H.; Demiral, T. Salinity tolerance of purslane (Portulaca oleracea L.) is achieved by enhanced antioxidative system, lower level of lipid peroxidation and proline accumulation. Environ. Exp. Bot. 2007, 61, 49–57. [Google Scholar] [CrossRef]
- Fernandes, C.S.; Sá, F.D.S.; Ferreira Neto, M.; Dias, N.D.S.; Reges, L.B.; Gheyi, H.R.; Paiva, E.P.; Silva, A.A.; Melo, A.D. Ionic homeostasis, biochemical components and yield of Italian zucchini under nitrogen forms and salt stress. Braz. J. Biol. 2021, 82, e233567. [Google Scholar] [CrossRef] [PubMed]
- Hniličková, H.; Hnilička, F.; Martinkova, J.; Kraus, K. Effects of salt stress on water status, photosynthesis and chlorophyll fluorescence of rocket. Plant Soil Environ. 2017, 63, 362–367. [Google Scholar] [CrossRef]
- Ashraf, M.; Harris, P.J.C. Photosynthesis under stressful environments: An overview. Photosynthetica 2013, 51, 163–190. [Google Scholar] [CrossRef]
- Bertamini, M.; Grando, M.; Zocca, P.; Pedrotti, M.; Lorenzi, S.; Cappellin, L. Linking monoterpenes and abiotic stress resistance in grapevines. BIO Web Conf. 2019, 13, 01003. [Google Scholar] [CrossRef]
- Ran, X.; Wang, X.; Gao, X.; Liang, H.; Liu, B.; Huang, X. Effects of salt stress on the photosynthetic physiology and mineral ion absorption and distribution in white willow (Salix alba L.). PLoS ONE 2021, 16, e0260086. [Google Scholar] [CrossRef]
- Yousefi, B.; Karamian, R. Effect of Salinity Stress and Salicylic Acid on Morpho-physiological and Growth Characteristics Satureja mutica Fisch. & C.A. Mey. J. Rangel. Sci. 2025, 15, 1–9. [Google Scholar] [CrossRef]
- Ashraf, M. Biotechnological approach of improving plant salt tolerance using antioxidants as markers. Biotechnol. Adv. 2009, 27, 84–93. [Google Scholar] [CrossRef]
- Arciszewski, M.; Pogorzelec, M.; Hawrylak-Nowak, B.; Parzymies, M.; Piejak, M. Towards successful reintroduction of Salix myrtilloides: The importance of monitoring plant physiological indicators during acclimatization. Dendrobiology 2024, 92, 100–111. [Google Scholar] [CrossRef]
- Yildiztugay, E.; Ozfidan-Konakci, C.; Kucukoduk, M. Sphaerophysa kotschyana, an endemic species from Central Anatolia: Antioxidant system responses under salt stress. J. Plant Res. 2013, 126, 729–742. [Google Scholar] [CrossRef]
- Dabravolski, S.A.; Isayenkov, S.V. The Role of Anthocyanins in Plant Tolerance to Drought and Salt Stresses. Plants 2023, 12, 2558. [Google Scholar] [CrossRef]
- Eryılmaz, F. The relationships between salt stress and anthocyanin content in higher plants. Biotechnol. Biotechnol. Equip. 2006, 20, 47–52. [Google Scholar] [CrossRef]
- Napar, W.P.F.; Kaleri, A.R.; Ahmed, A.; Nabi, F.; Sajid, S.; Ćosić, T.; Yao, Y.; Liu, J.; Raspor, M.; Gao, Y. The anthocyanin-rich tomato genotype LA-1996 displays superior efficiency of mechanisms of tolerance to salinity and drought. J. Plant Physiol. 2022, 271, 153662. [Google Scholar] [CrossRef] [PubMed]
- Ahmed, M.; Rauf, M.; Akhtar, M.; Mukhtar, Z.; Saeed, N.A. Hazards of nitrogen fertilizers and ways to reduce nitrate accumulation in crop plants. Environ. Sci. Pollut. Res. 2020, 27, 17661–17670. [Google Scholar] [CrossRef]
- Andrews, M.; Raven, J.A.; Lea, P.J. Do plants need nitrate? The mechanisms by which nitrogen form affects plants. Ann. Appl. Biol. 2013, 163, 174–199. [Google Scholar] [CrossRef]
- Pogorzelec, M.; Parzymies, M.; Pawlik-Skowrońska, B.; Arciszewski, M.; Mielniczuk, J. Searching for optimal substitute habitats for plants by biological experiments—A case study of the endangered species Aldrovanda vesiculosa L. (Droseraceae). Int. J. Environ. Res. Public Health 2022, 19, 10743. [Google Scholar] [CrossRef] [PubMed]
Disclaimer/Publisher’s Note: The statements, opinions and data contained in all publications are solely those of the individual author(s) and contributor(s) and not of MDPI and/or the editor(s). MDPI and/or the editor(s) disclaim responsibility for any injury to people or property resulting from any ideas, methods, instructions or products referred to in the content. |
© 2025 by the authors. Licensee MDPI, Basel, Switzerland. This article is an open access article distributed under the terms and conditions of the Creative Commons Attribution (CC BY) license (https://creativecommons.org/licenses/by/4.0/).