Abstract
This study assesses and maps the physical flood vulnerability within the Xerias, Krafsidonas, and Anavros ungauged catchments in Volos, Thessaly, Greece, using a Geographical Information Systems (GIS)-based Multi-Criteria Decision Analysis (MCDA) integrated with the Analytic Hierarchy Process (AHP). Six factors influencing flood dynamics were selected including slope, flow accumulation, geology, land use/cover, flood history and burned areas. The factors were weighted using the AHP based on their relative influence in flood occurrence. Physical flood vulnerability was assessed utilizing the Weighted Linear Combination (WLC) method and visualized through thematic flood-vulnerability maps. The analysis indicates that the southwestern and central-southern parts of the study area, which are highly urbanized and industrialized, exhibit the highest physical flood-vulnerability. Specifically, 32.76% of the Xerias catchment, 41.16% of the Krafsidonas catchment, and 34.71% of the Anavros catchment exhibit high to very high flood vulnerability. On the other hand, mountainous areas with steep slopes, permeable lithology, and dense forests exhibit low to very low physical flood vulnerability. The method’s accuracy was verified through sensitivity analysis and comparison with national flood-risk data for the study area. The results emphasize the physical vulnerability of Volos to flooding and the necessity for targeted flood mitigation measures, demonstrating the value of GIS in flood risk management.
1. Introduction
Floods are considered among the most frequent and devastating natural disasters at a global level, affecting millions of people annually and causing severe socio-economic and environmental impacts [1,2]. They are natural phenomena that impact a significant proportion of the human population, and they are responsible for approximately one third of the total estimated damages caused by natural disasters, leading to loss of life, disruption of infrastructure, displacement of communities and stressing local economies [3,4]. In recent decades, a significant rise in the frequency and severity of flood events has been observed globally, mainly under the effect of climate change and the intensification of urbanization [5,6].
Floods as a natural disaster are extremely challenging in terms of modelling and prediction [7] as they are influenced by the highly complex interactions between natural and human-induced factors [8,9]. Regarding natural factors, the most important ones include high or extreme precipitation events, rapid snow and glacier melt, and the geological and geomorphological characteristics of an area [10,11].
As for human-induced factors, the activities that augment flood vulnerability are often the intensification of urbanization, deforestation, alterations in river flow and land use and inadequate infrastructure for water drainage [12,13]. Urbanization characterized by uncontrolled building construction and alteration of water flow is counted as a key factor, limiting the ground’s ability to absorb water and increasing surface runoff [14]. Similarly, deforestation and wildfires lead to loss of vegetation cover, diminishing water absorption and soil stability [15,16]. Climate change also plays a crucial role in flood occurrence globally by altering the patterns of precipitation and increasing the frequency and severity of extreme weather events [17].
This increase in flood frequency and severity globally, as well as the complex interactions between natural and anthropogenic factors, highlight the critical need for flood prediction methodologies for flood vulnerability assessment, especially in urban and peri-urban areas [18]. Flood vulnerability mapping is a powerful approach, essential for visualizing the spatial distribution of flood-prone regions [19,20]. By identifying the most prone areas, the authorities and policymakers can plan and implement effective flood management strategies, contributing to the resilience of communities against future flood events and mitigation of their impacts [21].
Multicriteria Decision Analysis (MCDA) is an excellent method for flooded area mapping. It is considered a powerful tool for providing solutions in complex-decision problems, especially when numerous and diverse factors need simultaneous analysis and prioritization [22,23]. Another advantage of this method is that it does not need recorded instrumental data measurements [24]. In comparison to other methodological approaches like hydraulic or hydrological methods, the MCDA-AHP method offers a flexible and less demanding methodology in terms of data. These methods often require recorded instrumental data measurements and complex, high-computation modeling, making them not always applicable in data-scarce environments such as ungauged catchments. Instead, it relies on the analysis of physical parameters, existing human activities, and available hydrological data, always taking into account the unique characteristics of the study area [25]. This makes it highly suitable for identifying and assessing flood-prone areas [26,27].
A widely applied and popular form of multi-criteria analysis is its combination with the Analytical Hierarchy Process (AHP) method in a Geographic Information System (GIS) environment [28,29,30]. The first step in the AHP method is the modeling of the problem at hand, followed by the ranking of the researchers’ choice of criteria. The weights for each parameter are calculated through pairwise comparisons, allowing for the assessment of each factor’s relative importance. Moreover, the Consistency Index is examined to ensure the reliability of the model [31].
GIS is widely used in flood assessment methodologies for the collection, processing and visualization of spatial data and the creation of maps, as well as in MCDA to identify flood-prone areas [12,15,32,33]. GIS also serves as the foundation for integrating and developing geomorphological, hydrological and hydraulic models for flood hazard assessment [34,35]. Through GIS, data processing and analysis are conducted on rainfall characteristics, surface runoff and geomorphological features to create hazard maps and simulate flood scenarios [36,37]. In MCDA while assessing flood susceptibility, GIS plays a critical role in improving decision-making effectiveness by providing a basis for weighting and overlaying selected criteria based on their influence when it comes to flood occurrence. Additionally, GIS enables the visual representation of MCDA results, by creating thematic maps and depicting flood vulnerability [38,39]. The integration of GIS in MCDA enables the effective identification of high flood vulnerability areas, aiding policymakers in decision making and contributing to proactive flood management and preparedness strategies [40,41].
Flood vulnerability evaluation and mapping in ungauged catchments present significant challenges, mainly due to the scarcity or even absence of direct hydrometric data, which are essential for integrating and validating hydrological models. This lack of data makes the use of GIS-based MCDA methods an effective alternative for identifying flood-prone areas, enabling decision-making for flood risk management and mitigation in data-scarce catchments. Addressing this gap in flood vulnerability evaluation in ungauged catchments is of great importance, especially for urban areas with numerous past flood events [42,43,44].
The present study focuses specifically on assessing physical flood vulnerability, rather than a flood risk assessment or socio-economic vulnerability analysis. The evaluation is based on static physical criteria that reflect the physical predisposition of the landscape to flooding. The study does not assess flood hazard in terms of intensity or probability, nor integrates socio-economic indicators. This methodological approach is commonly adopted in the literature for assessing physical flood vulnerability [45,46,47,48].
Thus, the aim of this study is to identify and map the physically flood vulnerability of the Volos region, focusing on the ungauged catchment areas of the Xerias, Krafsidonas and Anavros streams, by employing a GIS-based MCDA integrated with the AHP method. This methodological approach is particularly suitable for the area as systematic hydrological data are unavailable making it an effective and reliable option for flood vulnerability assessment. These three streams discharge near the city of Volos, flowing through its urban and peri-urban areas. In historical times, they have been responsible for numerous and severe flood events with significant socio-economic and environmental consequences in the area affecting the local community [49,50].
2. Study Area
The Xerias, Krafsidonas and Anavros ungauged catchments comprising the study area, are located in southeastern Thessaly, Greece (Figure 1). The city of Volos serves as the administrative center of the Magnesia Regional Unit and is positioned along the Pagasetic Gulf to the south and at the foothills of Mount Pelion to the east. It has an approximate population of 138,865 residents, rendering it as the sixth most populous city of Greece. In addition, it serves as one of the most important ports in the country. The area is characterized by dense urbanization in the central and western regions, transitioning to more sparsely urbanized areas towards the north and east, while the surrounding areas are covered by agricultural landscapes, predominantly orchards and olive groves. Also, an industrial zone with various economic activities is situated to the west of Volos [42,51].
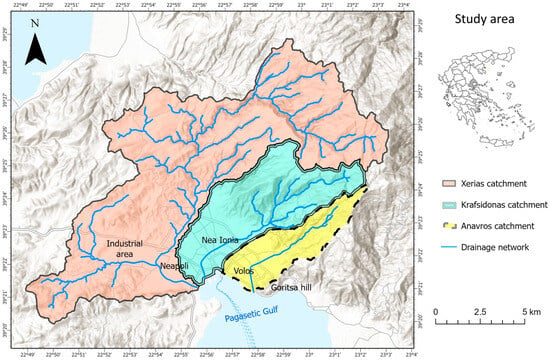
Figure 1.
Map of the Xerias, Anavros and Krafsidonas catchments and their drainage network. Inset map shows the location of the Magnesia Regional Unit in Greece which encompasses the study area.
Geomorphologically, Volos is characterized as a low-lying area, with elevations ranging from sea level to 73 m, and gentle slopes, while districts like that of Neapoli feature slopes less than 2%. The terrain gradually steepens towards the north and east where the Goritsa Hill and the foothills of Mount Pelion are situated [52].
Volos is characterized by the typical Mediterranean climate. The annual temperature range usually exceeds 30 °C, with hot and dry summers (up to 40 °C) and mostly mild winters. Meteorological data from 2007 to 2017 from the Meteorological Station of Volos (National Observatory of Athens network) report an average annual temperature of 17.8 °C, with monthly means ranging from 8.4 °C to 28.4 °C. Annual precipitation varies between 400 and 770 mm, mainly occurring during autumn, winter, and spring months [50].
Xerias is the largest of the three catchments, with an area covering approximately 116 km2, extending across the western, northern, and northeastern parts of the Volos region. The stream originates on Mount Pelion, where altitudes reach up to 1600 m. The catchment gradually transitions from forested areas to agricultural and urban landscapes, flowing through Volos’ western residential and industrial parts. Krafsidonas’ catchment covers approximately 36 km2 to the northeast of Xerias, with its sources at elevations of 1350 m on Mount Pelion. The stream flows through both sparsely and densely urbanized landscapes before discharging into the Pagasetic Gulf. Anavros has the smallest catchment area of 16 km2, with its sources on Mount Pelion and the Goritsa Hill flowing through the eastern urban area of Volos.
Historically, these three streams have been responsible for numerous flood events after intense rainfall with disastrous impacts in the area (e.g., 2003, 2006, 2009, 2012), mainly because of the dense urbanization and nearly flat morphology that makes Volos highly prone to flooding [50,51,53]. Two of the most severe flood events in the area took place in 2023, as a result of the extreme weather events “Daniel” and “Elias”. During the “Daniel” event, a total amount of rainfall of up to 393 mm was recorded in a 24-h period, leading to extensive flooding and 15 casualties across the Thessaly region with 7 recorded in the Magnesia Regional Unit. The “Elias” event took place only a few weeks later, leading to additional flooding and damage, hindering the city’s recovery efforts [54]. The recurring flood events in the area underscore the need for efficient flood management strategies in the region.
The selection of the Xerias, Krafsidonas, and Anavros catchments as the study area is driven by their ungauged status as catchments, which is characterized by the scarcity of systematic hydrometric data. This causes major challenges in hydrological modeling and flood vulnerability mapping in the area [42,50]. Taking also into consideration the numerous flooding events the area has faced, and especially the catastrophic extreme weather events “Daniel” and “Elias” in 2023, the integration of alternative methodologies like the one suggested in the present study, is crucial for effective flood vulnerability mapping and management for heavily urbanized areas.
3. Datasets and Methodology
3.1. Flood-Vulnerability Criteria
For the evaluation and mapping of flood vulnerability, a GIS-based MCDA approach was employed utilizing the AHP method (Figure 2). Six criteria were selected, based on their influence on flood vulnerability as identified in the literature, and their relevance to the specific characteristics of the study area. The selected criteria include slope, flow accumulation, the hydro-lithological characteristics of the geological formations, land cover, historical flood data and burned areas. These factors significantly influence the occurrence and severity of flood events and have been utilized extensively in flood vulnerability assessment [55,56].
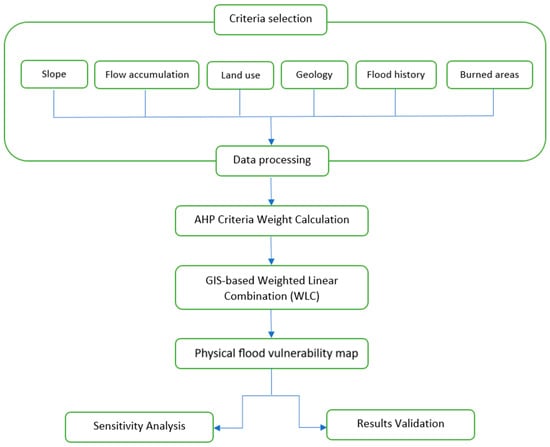
Figure 2.
Flow diagram of the methodology adopted in the present study for the assessment of the (physical) flood vulnerability.
For the evaluation of the flood vulnerability in the area, each factor was at first classified into five classes based on a combination of statistical methods, hydrological criteria, prior literature and expert judgement. After that, the data of each selected factor needed to be standardized so that they could be compared and combined on a unified scale. The standardization in this study utilized a five-class scale and was achieved through the Reclassify tool in ArcGIS Pro 3.0 software (Esri Inc., Redlands, CA, USA). Integer numbers from 1–5 were used and assigned to each class where 1 was assigned to very low, 2 to low, 3 to moderate, 4 to high and 5 to very high flood vulnerability. To enhance the interpretability of the results, a color scale was applied, i.e., from dark green for very low vulnerability to red for very high vulnerability. This standardization method is aligned with similar previous flood vulnerability assessment studies [28,30,33].
3.1.1. Slope
Slope is a factor with a key role in the occurrence of flooding events, significantly influencing flow accumulation as well as the direction, volume and velocity of surface runoff. In general, areas that exhibit steeper slopes are less vulnerable to flooding as water drains faster, preventing local flow accumulation. On the contrary, areas with gentler slopes exhibit low runoff velocities and greater water accumulation, leading to higher susceptibility to flood events [30,57]. The slope factor was calculated based on the Digital Elevation Model (DEM) of the study area, which was obtained from the Alaska Satellite Facility (https://asf.alaska.edu/2024) (accessed on 20 March 2024). The DEMs that the Alaska Satellite Facility (ASF) offer have a resolution of 12.5 m and are freely available. The DEM was imported into the ArcGIS Pro 3.0 software by ESRI®, to compute the slope. The result values of the slope calculations were classified into five classes using the Natural Breaks method and refined through trial-and-error, taking into consideration the geomorphologic characteristics and flood history of the area to ensure hydrological consistency. Broader slope intervals were used to encompass more adverse flood scenarios, including flash floods and rapid runoff events which are observed in the area reflecting its high flood vulnerability, even in areas with steeper slopes.
3.1.2. Flow Accumulation
Flow accumulation is also an important factor that influences flooding, as it identifies areas where volumes of surface runoff converge (represented as raster cells). In general, higher flow accumulation values indicate greater flooding vulnerability in an area. First, the flow direction was computed in ArcPro 3.0 as it represents the steepest downslope path a drop of water would follow under gravity, utilizing the Digital Elevation Model. Based on the resulting flow direction calculation, the flow accumulation raster was created where each cell’s value represents the total upstream flow contributing to it [33,58]. The thresholds of the classes were calculated separately to adapt to the hydrological context of each catchment and due to major size differences. Thus, the Natural Breaks method was used for the Xerias and Krafsidonas catchments, while a manual threshold was applied for the Anavros catchment after trial and error to better represent its hydrographic network. This was deemed necessary as smaller catchments produce lower absolute accumulation values and a single unified classification across all basins would have masked these hydrological features.
3.1.3. Land Use/Land Cover
Land use is also considered an important parameter when evaluating flood vulnerability, providing valuable information about the surface characteristics (human activities, agricultural lands, forests etc.) of an area. These surface characteristics significantly influence features like water infiltration, erosion and runoff, affecting the occurrence of flooding in an area [41,59]. A vector file containing land use data for the study area was obtained from the CORINE Land Cover platform (https://land.copernicus.eu/en) (accessed on 21 March 2024) of the Copernicus Land Monitoring Service (CLC 2018) and imported into the ArcPro 3.0 environment. The file was converted into raster format to enable further processing. The various land cover categories were classified into 5 classes based on their infiltration capacity. Urbanized areas with man-made structures exhibit lesser infiltration rates and thus high flooding susceptibility whereas forests exhibit greater infiltration rates making an area less prone to flooding.
3.1.4. Geology
The hydrolithological characteristics of geological formations significantly influence surface runoff, affecting the possibility of flooding. Geological formations with low permeability lead to increased surface runoff and flow accumulation. On the contrary, formations with high permeability promote water infiltration reducing surface runoff [30,60]. For this factor, the geological map of the Volos area from the Institute of Geology and Mineral Exploration at a 1:50,000 scale was utilized, containing the three catchments [61]. After identifying the geological formations of the study area, they were classified into five classes based on their permeability.
3.1.5. Flood History
The analysis of flood history is an important indicator for the evaluation and mapping of flood vulnerability in an area. It is also a valuable tool for assessing potential future risks, and gaining knowledge on the spatial, temporal, and seasonal distribution of flooding events [21,62]. The calculation of the factor was based on the study of Diakakis et al. [53]. The research aimed at conducting a statistical analysis and spatial representation of the recorded flood events in Greece during the period from 1880 to 2010. During that period 545 flood events were identified and organized into a database that contained detailed information for each one, such as location, date and time, human casualties, and source of information. Afterwards, a statistical and quantitative analysis was conducted and the results were integrated into a GIS environment, where the spatial density of events was calculated. The results were classified into 5 classes based on the spatial density and were utilized to calculate the flood history factor in this study.
3.1.6. Burned Areas
The last factor selected was the presence of burned areas in the study area. Areas with dense vegetation exhibit reduced surface runoff and are thus less prone to flooding. On the contrary, burned areas, as well as urban areas that lack vegetation, face a high risk of flooding [15,55]. To identify burned areas in the study area, data from the European Forest Fire Information System (EFFIS), available at https://forest-fire.emergency.copernicus.eu/ (accessed on 25 March 2025) were utilized. Based on the data, no burned areas were identified in the catchments of Krafsidonas and Anavros. Regarding the Xerias catchment, two burned areas were identified from forest fires that took place in 2018 and 2023 respectively. The first fire incident led to a 0.36 km2 burned area while the one in 2023 to approximately 10.09 km2. The classification of this factor was based on the existence of burned areas in the study area, and on how recent and widespread the forest fires responsible for the burned areas were, while also considering the potential regeneration of vegetation. More recent and extensive burned areas do not exhibit high regeneration of vegetation and therefore face higher flood vulnerability.
3.2. Verification of Flood-Vulnerability’s Map Accuracy
To verify the accuracy of the produced flood vulnerability map as part of the validation of the result, data from the Areas of Potential Significant Flood Risk (APSFR) as defined by the General Directorate of Water Resources of the Ministry of Environment and Energy in 2019 (https://gis.floods.ypeka.gr/) (accessed on 10 July 2024) were utilized.
3.3. Classification and Rating of the Criteria
As described, the data of each selected factor was standardized into five classes with each class assigned an integer number from 1 to 5. For better interpretation of the results, a color scale was applied, ranging from dark green representing very low flood vulnerability to red for very high flood vulnerability. The classification and rating results for all selected factors are presented in the table below (Table 1). For the flow accumulation factor, the letters X, K, and A correspond to the Xerias, Krafsidonas, and Anavros catchments, respectively.

Table 1.
The results of classification and rating for each factor.
3.4. Analytical Hierarchy Process (AHP)
3.4.1. Calculation of Criteria Weight
The weights for each factor were derived through a series of mathematical computations involving a reciprocal square matrix of pairwise comparisons between the criteria based on the AHP process as proposed by Saaty [63,64,65]. These pairwise comparisons determine the relative significance of each factor to the others, according to their importance and influence on a subject. The pairwise comparisons representing the relative importance between two factors were conducted according to Saaty’s numerical scale (Table 2).

Table 2.
Saaty’s numerical scale used in pairwise comparison [66].
The comparisons are based on literature and the researcher’s scientific knowledge on the field.
For scenarios involving multiple criteria or parameters, the weights are normalized so that their sum equals 1 using the following equation:
After the weights for each criterion were calculated, the Consistency Ratio (CR) was computed to check the consistency of the procedure, which according to Saaty should be ≤0.1 to be acceptable. The CR is calculated as follows:
where RI is the Random Index, a constant that depends on the number of criteria as shown below in Table 3 [67].

Table 3.
RI values for each number of criteria.
And CI represents the Consistency Index calculated by the equation:
where n is the number of criteria and λmax the maximum value of the eigenvalue of the comparison matrix.
3.4.2. Calculation of Flood Susceptibility Index (FSI)
After the weight for each factor was defined, the Flood Susceptibility Index (FSI) was calculated and expressed by the following formula, utilizing the weighted linear combination (WLC) method [28,30] in the ArcPro 3.0 environment:
where n is the number of the criteria, the weight of each criterion, and the rating of each factor.
The results of the FSI were classified in five classes utilizing the Natural Breaks method, and a flood-vulnerability thematic map was created presenting the various grades of flood vulnerability in the study area. Based on the above classification, the first class includes the lowest FSI values, corresponding to areas that exhibit very low flood vulnerability and lastly the fifth class containing the highest FSI values, corresponds to areas most prone to flooding.
3.4.3. Validation of Results
The last step of the AHP method is validation of the results for the credibility of the FSI to be examined. Sensitivity analysis is performed by introducing small changes (to avoid distortion of the index) to the weights of the factors, examining how sensitive (or robust) the index is to minor alterations and can be repeated as many times as deemed necessary by the researcher [68,69]. In this study alterations were applied only to the most and second most important criteria included in the index. The weight of the most significant factor was adjusted, while the opposite adjustment was simultaneously applied to the weight of the second most significant factor, while all the other weights of the factors remained unchanged, and their sum remained equal to 1. The results from this process were compared with the initial ones to examine any differentiations assessing the robustness of the index [70]. The verification of the index’s resulting flood-vulnerability map is also of great significance verifying its reliability and accuracy. One method to evaluate the accuracy of the results is to compare them with data of past recorded floods, real-time field surveys, remote sensing data, and datasets from public authorities [32,58]. As mentioned above, the flood vulnerability map resulting from the calculation of the FSI was compared with the Areas of Potential Significant Flood Risk (APSFR) of the General Directorate of Water Resources of the Ministry of Environment and Energy in 2019.
4. Results
4.1. Calculation of Each Flood Vulnerability Factor
4.1.1. Slope
Regarding the slope factor, the analysis based on the thematic map (Figure 3) and the table below (Table 4) indicates a similar pattern for the three catchments as most of the area exhibits high to very high flood vulnerability. The areas within the catchments that exhibit high flood vulnerability correspond to the urban fabric of Volos, its suburbs, and the industrial zone. On the other hand, low and very low vulnerability levels cover less area and are mainly located in the semi-mountainous and mountainous regions of the catchments.
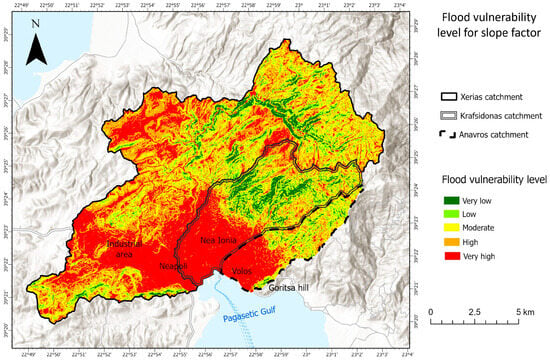
Figure 3.
Thematic map showing flood vulnerability levels for the factor of slope.

Table 4.
Coverage (km2 and %) of each flood vulnerability level in each catchment for the slope factor.
Regarding the Xerias catchment, 65% of the total area exhibits high to very high flood vulnerability, while low and very low flood vulnerability cover approximately 13% of the catchment. Similarly, the Krafsidonas catchment generally exhibits high to very high flood vulnerability collectively covering over 55% of its total area, while low and very low flood vulnerability levels cover 23.23% of the total area. As for the Anavros catchment, very high and high flood vulnerability levels correspond to approximately 60% of the total area of the catchment. Low and very low vulnerability levels cover only a small portion of the total area of the catchment (14.6%).
4.1.2. Flow Accumulation
As mentioned, flow accumulation identifies areas where volumes of surface runoff converge representing the hydrographic network in a catchment. As shown in the map below, the vast majority of the catchment areas exhibit very low vulnerability (Figure 4). More than 97% of the area of all three catchments exhibit very low flood vulnerability (Table 5). However, it is important to mention that very high vulnerability is observed near the stream outlets, which are located within the urban fabric of Volos.
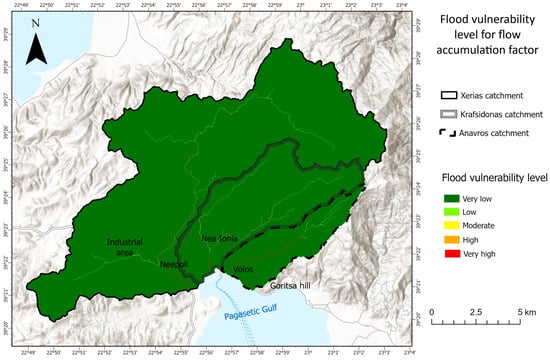
Figure 4.
Thematic map showing flood vulnerability levels for the factor of flow accumulation.

Table 5.
Coverage (km2 and %) of each flood vulnerability level in each catchment for the flow accumulation factor.
4.1.3. Land Use/Cover
As shown in the graph below (Figure 5) in both the Xerias and Krafsidonas catchments, forest and semi-natural areas cover most of the catchments, while agricultural areas and artificial surfaces cover significantly less area. Especially in Xerias, artificial surfaces cover less than 7% of the total area while wetlands cover an almost insignificant portion (0.02%). On the contrary, artificial surfaces cover most of the Anavros catchment, followed by agricultural areas and forested and semi-natural areas.
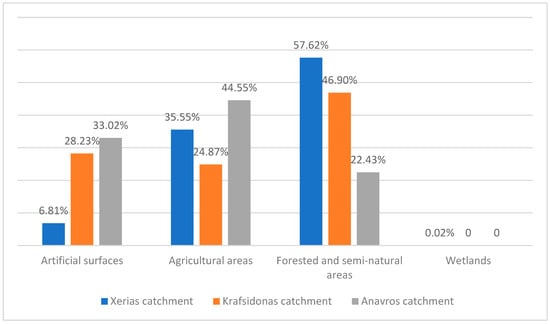
Figure 5.
Distribution of land cover/use.
Utilizing the 5 classes classification method based on the surface’s infiltration rate, a thematic map (Figure 6) and the accompanying table (Table 6) were generated showing the vulnerability level of the study area regarding land cover.
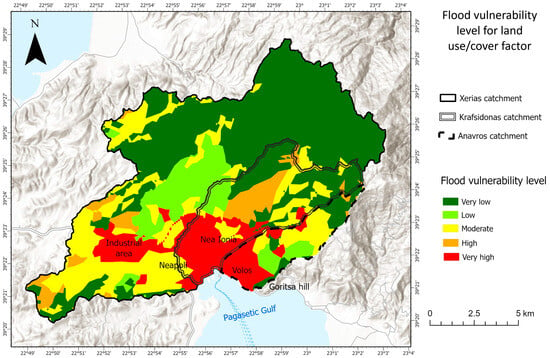
Figure 6.
Thematic map showing flood vulnerability levels for the factor of land use/cover.

Table 6.
Coverage (km2 and %) of each flood vulnerability level in each catchment for the land cover/use factor.
The Xerias catchment primarily exhibits very low vulnerability (53.54%), corresponding mostly to the extensive forest coverage and mount Pelion in the northeastern part of the area. Along with parts that exhibit low vulnerability (11.30%), these regions comprise almost 65% of the total area. Moderate vulnerability also covers a significant part of the total area (24.25%) and is linked to agricultural land. High and very high vulnerability cover only a small part of the total area (approximately 11%) due to the industrial zone of Volos in the southwestern part of the catchment.
In the Krafsidonas catchment almost 42% of the area falls under high (14.67%) and very high (27.47%) vulnerability, concentrated mainly in the southwestern and central parts, where Volos’s dense urban fabric resides. Moderate vulnerability covers 18.94%, while low and very low vulnerability levels total approximately 39% and are distributed in the central and mainly in the northwestern mountainous parts of the catchment.
The Anavros catchment indicates a similar geographical distribution of flood vulnerability. High and very high flood vulnerability is mostly located in the southwestern parts of the catchment comprising the eastern urban parts and suburbs of Volos, totaling approximately 34% of its total area, while moderate vulnerability levels total 27.69%. In this case, the low and very low flood vulnerability levels are the most predominant, covering almost 38% of the catchment area.
4.1.4. Geology
After considering the geological formations comprising the study area and the 5-class classification method based on their permeability, a thematic map was generated (Figure 7), followed by the calculation of the area for each flood vulnerability level (Table 7).
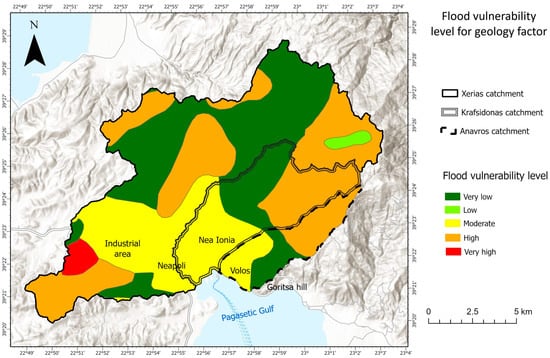
Figure 7.
Thematic map showing flood vulnerability levels for the factor of geology.

Table 7.
Coverage (km2 and %) of each flood vulnerability level in each catchment for the geology factor.
Regarding the Xerias catchment, very low flood vulnerability (38.16%) is the most predominant due to the extensive presence of limestones (very high to high permeability) in the northern and central parts of the catchment. High flood vulnerability level also exhibits a high percentage (36.93%) mainly because of the formations of schists, gneiss, and cherts (low permeability) in the eastern, central and southwestern parts. The parts of the catchment where the industrial zone and western parts of Volos are located exhibit moderate vulnerability (20.97%) due to marine and terrestrial formations (moderate permeability).
In Krafsidonas, moderate vulnerability is the most predominant (36.62%) mainly in urban areas of Volos due to moderate-permeability formations, while high vulnerability (34.05%) appears in the eastern parts. Lastly, the central parts of the catchment where limestone formations are present, exhibit very low flood vulnerability (29.33%).
As for the Anavros catchment, high vulnerability (42.36%) is concentrated in eastern areas, moderate vulnerability (29.64%) in southwestern urban zones, and very low vulnerability (28%) in central parts of the catchment.
4.1.5. Flood History
Based on the statistical analysis and spatial representation of the recorded flood events per 100 km2 in Greece during the period from 1880 to 2010 of Diakakis et al. [53] the Magnesia Regional Unit exhibits high flood vulnerability with 0.8–1 events (Table 8). Therefore, all three catchments of the study area are characterized by high flood vulnerability level and value 4 is assigned in their total area.

Table 8.
Classification of number of flood events per 100 km2 in Greece based on the study of Diakakis et al. [53].
4.1.6. Burned Areas
Regarding the burned areas factor, based on the data from the European Forest Fire Information System (EFFIS) only two forest fires have been recorded in the catchment of Xerias (Figure 8). As for the classification, the burned area caused by the 2018 forest fire was assigned the value 3 representing moderate vulnerability level (0.31% of the total area) while the one caused by the 2023 forest fire the value 5 representing very high vulnerability level (8.71% of the total area) (Table 9). This classification was based on how recent and widespread the forest fires were, while also considering the potential regeneration of vegetation in the burned area. Lastly all the rest non-burned areas were assigned the value 1 representing very low flood vulnerability.
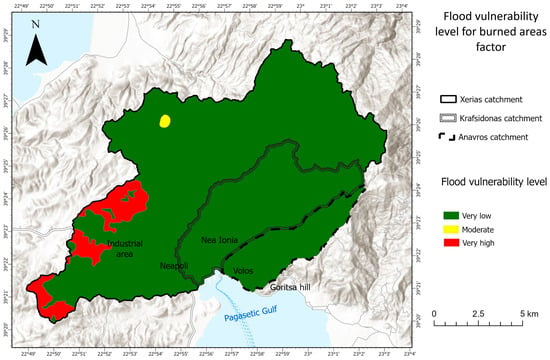
Figure 8.
Thematic map showing flood vulnerability levels for the factor of burned areas.

Table 9.
Coverage (km2 and %) of each flood vulnerability level in each catchment for the burned areas factor.
4.2. Calculation of Weighting Coefficients and Consistency Ratio Index
Following the Analytic Hierarchy Process proposed by Saaty [63], the weights of the six factors are derived through the pairwise comparison method representing the relative importance of each pair of criteria in regards to flood occurrence. The comparison of factors was conducted based on the researcher’s judgement and relevant literature, while also considering the specific characteristics of the study area (Table 10). The sum of the weights was calculated according to Formula (1). Subsequently, the Consistency Index (CI) and the Consistency Ratio (CR) were calculated according to Formula (2) and (3) to determine any errors in the process of calculating the weighting coefficients (Table 11).

Table 10.
Values of the pairwise comparisons between the factors based on the Saaty [63] AHP method.

Table 11.
Calculation of Weighting Coefficients and Consistency Ratio (CR).
The calculated value for the CR is 0.024325, and in accordance with the requirement of being less than 0.10, ensuring the validity of the weighting coefficients and the reliability of the process. The weighting coefficients for each criterion rounded to two decimal places are as follows: (1) slope = 0.37, (2) flow accumulation = 0.25, (3) geology = 0.16, (4) land use/cover = 0.11, (5) flood history = 0.07 and (6) burned areas = 0.04.
4.3. Flood Susceptibility Index (FSI)
After the calculation of the weighting coefficients, the FSI was calculated according to Formula (4), utilizing the Weighted Linear Combination (WLC) method and. The results of this process were then reclassified in 5 classes (from very low to very high level of flood vulnerability) based on the Natural Breaks method, and a final flood-vulnerability thematic map (Figure 9) was generated presenting the various levels of flood-vulnerability in the study area and their area coverage (Table 12).
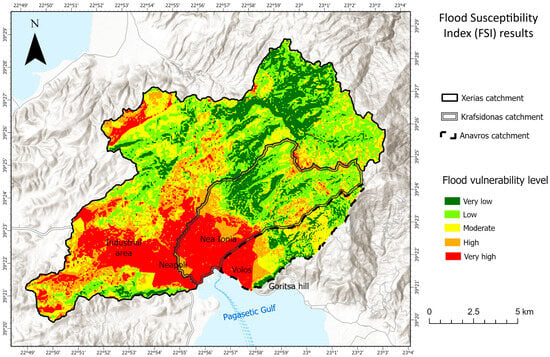
Figure 9.
Flood-vulnerability thematic map showing the results of the calculation of the FSI.

Table 12.
Coverage (km2 and %) of each flood vulnerability level in each catchment after the calculation of the FSI.
Based on the results of the FSI, the catchments of Xerias, Krafsidonas and Anavros exhibit significant flood vulnerability levels, mainly concentrated in the urban, peri-urban and industrial areas of Volos. In the Xerias catchment, areas that exhibit high (15.01%) and very high (17.75%) vulnerability levels are located mainly in the southwestern and central-southern parts, covering almost 33% of the catchment. Regarding Krafsidonas, an even greater proportion is observed, where high (15.47%) and very high (25.69%) flood vulnerability, comprise approximately 41% of the total catchment area. The Anavros catchment follows a similar pattern where high (13.22%) and very high (21.49%) flood vulnerability, cover the 34.71% of the total area mainly in the eastern urban zone of Volos. The areas that exhibit these high flood vulnerability levels are characterized by dense urbanization, low slopes, high water accumulation and geological formations with low permeability.
On the other hand, low and very low flood vulnerability levels are predominant in the more mountainous regions, covering 45% of Xerias, 43% of Krafsidonas, and 35% of Anavros catchments. These areas are covered by dense vegetation and forests, permeable geological formations and exhibit higher slopes, thus facing a lower flood vulnerability. Moderate flood vulnerability is scattered in the three catchments, with the Anavros catchment exhibiting the highest proportion (30.2%).
Projecting the results to the entire study area, 43% of the total area is characterized by low (27.11%) and very low (16.13%) flood vulnerability mainly in central, eastern, and northeastern parts, where mountainous sections of Pelion are located. In contrast, the southern and southwestern parts, encompassing the entire urban fabric of Volos, its suburbs and industrial zone, exhibit high (14.94%) and very high (19.82%) flood vulnerability (almost 35% of the total area). Moderate vulnerability (22%) is distributed throughout the whole study area, mainly in lowland regions and agricultural lands.
4.4. Results Verification
4.4.1. Sensitivity Analysis
The sensitivity analysis of the model was based on the method proposed by Chalkias [70]. Sensitivity analysis in the AHP enhances the robustness and reliability of the decision-making process, making it less prone to bias and therefore a crucial MCDA component.
In this study the chosen alteration involved increasing the weight coefficient of slope (being the most important factor) by 0.02 while simultaneously decreasing the weight coefficient of the second most significant factor, which is flow accumulation, by 0.02. The sensitivity analysis was applied to the catchment of the Xerias stream, being the largest of the three catchments, as the results of the analysis would remain consistent considering that the same process was applied to all three catchments.
The following table (Table 13) presents the initial weight coefficients of the factors alongside the new weight coefficients after the applied modification. The deviations between the original model and the modified model (as presented by the percentage difference), following the adjustments in the weight coefficients, are relatively small. Therefore, the method can be safely characterized as stable due to the small deviations observed during the sensitivity analysis.

Table 13.
Results of the sensitivity analysis for the Xerias catchment.
4.4.2. Flood-Vulnerability Map Verification
The verification of the flood-vulnerability map’s accuracy was based on the comparison analysis with the Areas of Potential Significant Flood Risk (APSFR) as defined in 2019 by the General Directorate of Water Resources of the Ministry of Environment and Energy. As illustrated in the map below (Figure 10), there is a significant spatial overlap between the APSFR, and the high and very high vulnerability zones identified through the FSI. In both cases, the areas identified as most vulnerable to flooding are located mainly in the southern and southwestern parts of the study area. These correspond to areas that are covered by the dense urban fabric of Volos, its suburbs, and the industrial zone. The spatial correlation between the FSI results and the APSFR indicates a high degree of consistency between the study’s results and the official flood risk data in the area.
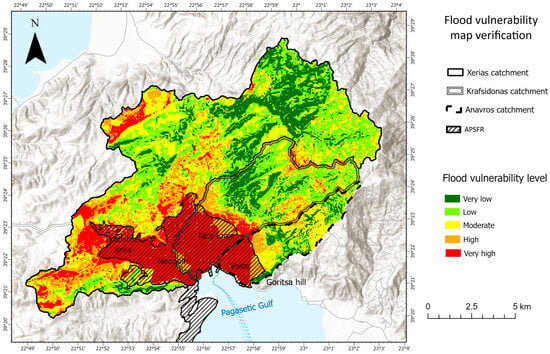
Figure 10.
Thematic map showing the overlay of the FSI and APSFR for the purpose of the results verification.
4.5. Discussion
The present study provides significant insights regarding the flood vulnerability of the Volos region, as it addresses the difficulties of flood mapping in ungauged catchments, characterized by the absence of systematic hydrological data that makes traditional assessment methods impractical to implement. The integration of MCDA with the AHP method proved to be effective in identifying and mapping the flood-prone zones in the Xerias, Krafsidonas and Anavros catchments, which are responsible for numerous past flood events in the Volos area.
Based on the results, approximately 43% of the total study area exhibits low to very low flood vulnerability, mainly in the mountainous northeastern and central parts of the catchments. However, the urban and industrial areas of the city of Volos located in the southern and southwestern parts show high to very high flood vulnerability. Notably, almost 35% of the study area, including almost the entire urban fabric of Volos and its industrial zone, exhibit high to very high flood vulnerability. This high vulnerability is attributed to the presence of gentle slopes, impervious surfaces, and limited infiltration capacity. It should also be noted that 22% of the study area is classified as moderately vulnerable, covering mainly lowland and agricultural areas.
A key observation is that while mountainous regions in the northeast show low and very low flood vulnerability due to steep slopes, permeable geology and dense vegetation, the densely built areas in the south and southwest, including Volos and its industrial zone, exhibit high to very high flood vulnerability. The resultant map comes into alignment with existing knowledge regarding flood history of the area and the results of the APSFR of the General Directorate of Water Resources of the Ministry of Environment and Energy as well as the results of the flood vulnerability assessment of the Xerias catchment by similar studies [52].
The findings are also in line with similar studies that use the same methodological approach and highlight the heightened flood vulnerability in urbanized and industrial areas. Studies in coastal regions of Greece have similarly identified low flood vulnerability in mountainous terrain while flood vulnerability in lowland and urbanized zones is substantially higher. The high vulnerability in Volos’ urban and industrial areas is consistent with findings in comparable regions where rapid urbanization and land-use changes exacerbate flood vulnerability [28,30,71].
The approach of this study is also characterized by transferability. The integration of MCDA with the AHP method offers flexibility as the factors included in the flood-vulnerability assessment are selected each time by the researcher adapting to the unique characteristics of the study area and the availability of data. Therefore, the methodology can be utilized in other regions with different hydrological and geomorphological conditions. The methodology also demonstrates computational efficiency by requiring few computational calculations and thus being less complex in comparison with more advanced methods that utilize highly complex hydraulic or hydrological models.
However, even though the method of this study was found to be robust and its results were verified, certain limitations do exist as the study considers mainly geomorphological parameters without taking into consideration real-time meteorological or remote sensing data. Future research should also incorporate and take into consideration socio-economic factors such as population density, infrastructure resilience and economic status. Evaluating the socioeconomic flood vulnerability in densely urbanized areas is crucial for the effective implementation of flood management strategies, providing a holistic approach to the evaluation of flood—vulnerability of a community [72].
Additionally, validating the method with historical flood records and remote sensing data would further improve its reliability. Studying past flood—events in an area provides important information regarding flood frequency and intensity [21]. Therefore, comparing the flood-vulnerability map with historical flood records provides a significant additional validation step of the methodology. Also, integrating remote sensing data, such as satellite imagery, can provide insights into land use and water level alterations over time, thereby improving the accuracy and reliability of the method [73].
Overall, the results of this study emphasize the need for flood mitigation strategies and policies, particularly in the urbanized and industrialized areas. Taking into consideration the increasing frequency and intensity of extreme weather events, proactive planning and infrastructure adaptation are crucial to minimizing flood impacts.
5. Conclusions
This study aimed at identifying and mapping flood-prone areas of the Xerias, Krafsidonas, and Anavros catchments in Volos, Thessaly, Greece, utilizing a GIS-based Multi-Criteria Decision Analysis (MCDA) approach combined with the Analytical Hierarchy Process (AHP) method. The methodology provides an effective and adaptable alternative method for flood—vulnerability assessment in ungauged catchments and data—scarce environments that are characterized by absence of systematic hydrological data making the integration of traditional hydraulic/hydrological methods impractical. For that purpose, six factors that influence flood occurrence were selected: slope, flow accumulation, geology, land use/cover, flood history and burned areas, based on similar studies and the unique characteristics of the area.
The findings of the analysis showed that the southwestern and central-southern parts of the study area exhibit the highest flood vulnerability, including mainly urbanized and industrial zones. Specifically, 32.76% of the Xerias catchment, 41.16% of the Krafsidonas catchment, and 34.71% of the Anavros catchment exhibit high to very high vulnerability levels. On the other hand, approximately 43% of the total study area, consisting mainly of the mountainous parts of the catchments, showed low to very low levels of flood vulnerability due to steep slopes, permeable geological formations, and dense forest cover.
Nonetheless, despite the validation of the results of the applied methodology, the study presents certain limitations, mainly due to not incorporating real-time meteorological and socio-economic data. Future research could additionally integrate historical flood records, remote sensing, and indicators of social vulnerability to achieve a more holistic approach.
Nevertheless, the results of this study indicate that Volos is an area highly susceptible to flood events. As one of Greece’s major urban centers, targeted flood mitigation measures are necessary to reduce flood vulnerability in the region. The need for such measures is further reinforced by the region’s flood history as well as the effects of climate change, which dramatically increase the frequency and intensity of extreme weather events.
Author Contributions
Conceptualization, C.R. and N.E.; methodology, C.R., G.S. and N.E.; formal analysis, C.R. and G.S.; writing—original draft preparation, C.R.; writing—review and editing, C.R., G.S. and N.E.; visualization, C.R.; supervision, G.S. and N.E. All authors have read and agreed to the published version of the manuscript.
Funding
This research received no external funding.
Data Availability Statement
The data used in this study is available by the author(s) upon request.
Conflicts of Interest
The authors declare no conflicts of interest.
References
- Tellman, B.; Sullivan, J.A.; Kuhn, C.; Kettner, A.J.; Doyle, C.S.; Brakenridge, G.R.; Erickson, T.A.; Slayback, D.A. Satellite imaging reveals increased proportion of population exposed to floods. Nature 2021, 5967870, 80–86. [Google Scholar] [CrossRef]
- Cao, W.; Zhou, Y.; Güneralp, B.; Li, X.; Zhao, K.; Zhang, H. Increasing global urban exposure to flooding: An analysis of long-term annual dynamics. Sci. Total Environ. 2022, 817, 153012. [Google Scholar] [CrossRef]
- Adeel, Z.; Alarcón, A.M.; Bakkensen, L.; Franco, E.; Garfin, G.M.; McPherson, R.A.; Méndez, K.; Roudaut, M.B.; Saffari, H.; Wen, X. Developing a comprehensive methodology for evaluating economic impacts of floods in Canada, Mexico and the United States. Int. J. Disaster Risk Reduct. 2020, 50, 101861. [Google Scholar] [CrossRef]
- Rentschler, J.; Salhab, M.; Jafino, B.A. Flood exposure and poverty in 188 countries. Nat. Commun. 2022, 13, 3527. [Google Scholar] [CrossRef]
- Piacentini, T.; Carabella, C.; Boccabella, F.; Ferrante, S.; Gregori, C.; Mancinelli, V.; Pacione, A.; Pagliani, T.; Miccadei, E. Geomorphology-based analysis of flood critical areas in small hilly catchments for civil protection purposes and early warning systems: The case of the Feltrino Stream and the Lanciano urban area (Abruzzo, central Italy). Water 2020, 12, 2228. [Google Scholar] [CrossRef]
- Rentschler, J.; Avner, P.; Marconcini, M.; Su, R.; Strano, E.; Vousdoukas, M.; Hallegatte, S. Global evidence of rapid urban growth in flood zones since 1985. Nature 2023, 6227981, 87–92. [Google Scholar] [CrossRef]
- Brunner, M.I.; Slater, L.; Tallaksen, L.M.; Clark, M. Challenges in modeling and predicting floods and droughts: A review. Wiley Interdiscip. Rev. Water 2021, 8, e1520. [Google Scholar] [CrossRef]
- Mazzoleni, M.; Dottori, F.; Cloke, H.L.; Di Baldassarre, G. Deciphering human influence on annual maximum flood extent at the global level. Commun. Earth Environ. 2022, 3, 262. [Google Scholar] [CrossRef]
- Hoang, D.; Liou, Y. Assessing the influence of human activities on flash flood susceptibility in mountainous regions of Vietnam. Ecol. Indic. 2023, 158, 111417. [Google Scholar] [CrossRef]
- Stavropoulos, S.; Zaimes, G.N.; Filippidis, E.; Diaconu, D.C.; Emmanouloudis, D. Mitigating flash floods with the use of new technologies: A multi-criteria decision analysis to map flood susceptibility for Zakynthos Island, Greece. J. Urban Reg. Anal. 2020, 12, 233–248. [Google Scholar] [CrossRef]
- Goodarzi, M.R.; Poorattar, M.J.; Vazirian, M.; Talebi, A. Evaluation of a weather forecasting model and HEC-HMS for flood forecasting: Case study of Talesh catchment. Appl. Water Sci. 2024, 14, 34. [Google Scholar] [CrossRef]
- Karkani, A.; Evelpidou, N.; Tzouxanioti, M.; Petropoulos, A.; Santangelo, N.; Maroukian, H.; Spyrou, E.; Lakidi, L. Flash flood susceptibility evaluation in human-affected areas using geomorphological methods—The case of 9 August 2020, Euboea, Greece. A GIS-based approach. GeoHazards 2021, 2, 366–382. [Google Scholar] [CrossRef]
- Shekar, P.R.; Mathew, A. Morphometric analysis of watersheds: A comprehensive review of data sources, quality, and geospatial techniques. Watershed Ecol. Environ. 2023, 6, 13–25. [Google Scholar] [CrossRef]
- Rahman, M.; Ningsheng, C.; Mahmud, G.I.; Islam, M.; Pourghasemi, H.R.; Ahmad, H.; Habumugisha, J.M.; Washakh, R.M.A.; Alam, M.; Liu, E.; et al. Flooding and its relationship with land cover change, population growth, and road density. Geosci. Front. 2021, 12, 101224. [Google Scholar] [CrossRef]
- Evelpidou, N.; Tzouxanioti, M.; Spyrou, E.; Petropoulos, A.; Karkani, A.; Saitis, G.; Margaritis, M. GIS-based assessment of fire effects on flash flood hazard: The case of the Summer 2021 forest fires in Greece. GeoHazards 2022, 4, 1–22. [Google Scholar] [CrossRef]
- Toosi, G. Influence of vegetation in the flood drainage ditch. J. Civ. Eng. Res. 2023, 5, 16–21. [Google Scholar] [CrossRef]
- Agonafir, C.; Lakhankar, T.; Khanbilvardi, R.; Krakauer, N.; Radell, D.; Devineni, N. A review of recent advances in Urban Flood Research. Water Secur. 2023, 19, 100141. [Google Scholar] [CrossRef]
- Kumar, V.; Sharma, K.V.; Caloiero, T.; Mehta, D.J.; Singh, K. Comprehensive overview of flood modeling approaches: A review of recent advances. Hydrology 2023, 10, 141. [Google Scholar] [CrossRef]
- Antzoulatos, G.; Kouloglou, I.-O.; Bakratsas, M.; Moumtzidou, A.; Gialampoukidis, I.; Karakostas, A.; Lombardo, F.; Fiorin, R.; Norbiato, D.; Ferri, M.; et al. Flood hazard and risk mapping by applying an explainable machine learning framework using satellite imagery and GIS data. Sustainability 2022, 14, 3251. [Google Scholar] [CrossRef]
- Xafoulis, N.; Farsirotou, E.; Kotsopoulos, S.; Alamanis, N. Flood hazard assessment in a mountainous river basin in Thessaly, Greece, based on 1D/2D numerical simulation. Energy Nexus 2022, 8, 100142. [Google Scholar] [CrossRef]
- Evelpidou, N.; Cartalis, C.; Karkani, A.; Saitis, G.; Philippopoulos, K.; Spyrou, E. A GIS-based assessment of flood hazard through track records over the 1886–2022 period in Greece. Climate 2023, 11, 226. [Google Scholar] [CrossRef]
- Cinelli, M.; Kadziński, M.; Gonzalez, M.; Słowiński, R. How to support the application of multiple criteria decision analysis? Let us start with a comprehensive taxonomy. Omega 2020, 96, 102261. [Google Scholar] [CrossRef] [PubMed]
- Taherdoost, H.; Madanchian, M. Multi-criteria decision making (MCDM) methods and concepts. Encyclopedia 2023, 3, 77–87. [Google Scholar] [CrossRef]
- Akhter, S.; Rahman, M.M.; Monir, M.M. Flood susceptibility analysis to sustainable development using MCDA and support vector machine models by GIS in the selected area of the Teesta River floodplain, Bangladesh. HydroResearch 2025, 8, 127–138. [Google Scholar] [CrossRef]
- Abdullah, M.F.; Siraj, S.; Hodgett, R.E. An overview of multi-criteria decision analysis (MCDA) application in managing water-related disaster events: Analyzing 20 years of literature for flood and drought events. Water 2021, 13, 1358. [Google Scholar] [CrossRef]
- Sun, R.; Gong, Z.; Gao, G.; Shah, A. Comparative analysis of multi-criteria decision-making methods for flood disaster risk in the Yangtze River Delta. Int. J. Disaster Risk Reduct. 2020, 51, 101768. [Google Scholar] [CrossRef]
- Gul, M.; Yucesan, M.; Erdogan, M. Multi-Criteria Decision Analysis: Case Studies in Disaster Management; CRC Press: Boca Raton, FA, USA, 2022. [Google Scholar] [CrossRef]
- Feloni, E.; Mousadis, I.; Baltas, E. Flood vulnerability assessment using a GIS-based multi-criteria approach—The case of Attica region. J. Flood Risk Manag. 2019, 13 (Suppl. S1), e12563. [Google Scholar] [CrossRef]
- Vojtek, M.; Vojteková, J. Flood susceptibility mapping on a national scale in Slovakia using the Analytical hierarchy process. Water 2019, 11, 364. [Google Scholar] [CrossRef]
- Karymbalis, E.; Andreou, M.; Batzakis, D.-V.; Tsanakas, K.; Karalis, S. Integration of GIS-based multicriteria decision analysis and analytic hierarchy process for flood-hazard assessment in the Megalo Rema River Catchment (East Attica, Greece). Sustainability 2021, 13, 10232. [Google Scholar] [CrossRef]
- Allafta, H.; Opp, C.; Patra, S. Identification of groundwater potential zones using remote sensing and GIS techniques: A case study of the shatt al-arab basin. Remote Sens. 2020, 13, 112. [Google Scholar] [CrossRef]
- Rincón, D.; Khan, U.; Armenakis, C. Flood risk mapping using GIS and multi-criteria analysis: A Greater Toronto area case study. Geosciences 2018, 8, 275. [Google Scholar] [CrossRef]
- Ahmed, I.; Pan, N.D.; Debnath, J.; Bhowmik, M.; Bhattacharjee, S. Flood hazard zonation using GIS-based multi-parametric Analytical Hierarchy process. Geosyst. Geoenviron. 2024, 3, 100250. [Google Scholar] [CrossRef]
- Peker, İ.B.; Gülbaz, S.; Demir, V.; Orhan, O.; Beden, N. Integration of HEC-RAS and HEC-HMS with GIS in flood modeling and flood hazard mapping. Sustainability 2024, 16, 1226. [Google Scholar] [CrossRef]
- Saini, D.S.; Barik, D.K. Simulation of the hydraulic model HEC-RAS coupled with GIS and remote sensing to study the effect of river cross-section width in detecting flood-prone areas. J. Geol. Soc. India 2024, 100, 367–376. [Google Scholar] [CrossRef]
- Cai, T.; Li, X.; Ding, X.; Wang, J.; Zhan, J. Flood risk assessment based on hydrodynamic model and fuzzy comprehensive evaluation with GIS technique. Int. J. Disaster Risk Reduct. 2019, 35, 101077. [Google Scholar] [CrossRef]
- Kim, V.; Tantanee, S.; Suparta, W. GIS-based flood hazard mapping using HEC-RAS model: A case study of Lower Mekong River, Cambodia. Geogr. Tech. 2020, 15, 16–26. [Google Scholar] [CrossRef]
- Doorga, J.R.; Magerl, L.; Bunwaree, P.; Zhao, J.; Watkins, S.; Staub, C.G.; Rughooputh, S.D.; Cunden, T.S.; Lollchund, R.; Boojhawon, R. GIS-based multi-criteria modelling of flood risk susceptibility in Port Louis, Mauritius: Towards resilient flood management. Int. J. Disaster Risk Reduct. 2022, 67, 102683. [Google Scholar] [CrossRef]
- Giurea, A.; Comănescu, L.; Dobre, R.; Nedelea, A.; Mirea, I. Flood risk assessment using multi-criteria spatial analysis case study: Gilort River between Bălcești and Bolbocești. Water 2024, 16, 1760. [Google Scholar] [CrossRef]
- Membele, G.M.; Naidu, M.; Mutanga, O. Examining flood vulnerability mapping approaches in developing countries: A Scoping review. Int. J. Disaster Risk Reduct. 2021, 69, 102766. [Google Scholar] [CrossRef]
- Efraimidou, E.; Spiliotis, M. A GIS-based flood risk assessment using the Decision-Making Trial and Evaluation Laboratory approach at a regional scale. Environ. Process. 2024, 11, 9. [Google Scholar] [CrossRef]
- Papaioannou, G.; Loukas, A.; Vasiliades, L.; Aronica, G.T. Sensitivity analysis of a probabilistic flood inundation mapping framework for ungauged catchments. Eur. Water 2017, 60, 9–16. [Google Scholar]
- Belvederesi, C.; Zaghloul, M.S.; Achari, G.; Gupta, A.; Hassan, Q.K. Modelling river flow in cold and ungauged regions: A review of the purposes, methods, and challenges. Environ. Rev. 2022, 30, 159–173. [Google Scholar] [CrossRef]
- Sahraei, R.; Kanani-Sadat, Y.; Homayouni, S.; Safari, A.; Oubennaceur, K.; Chokmani, K. A novel hybrid GIS-based multi-criteria decision-making approach for flood susceptibility analysis in large ungauged watersheds. J. Flood Risk Manag. 2022, 16, e12879. [Google Scholar] [CrossRef]
- Cutter, S.L.; Boruff, B.J.; Shirley, W.L. Social vulnerability to environmental hazards. Soc. Sci. Q. 2003, 84, 242–261. [Google Scholar] [CrossRef]
- Turner, B.L.; Kasperson, R.E.; Matson, P.A.; McCarthy, J.J.; Corell, R.W.; Christensen, L.; Eckley, N.; Kasperson, J.X.; Luers, A.; Martello, M.L.; et al. A framework for vulnerability analysis in sustainability science. Proc. Natl. Acad. Sci. USA 2003, 100, 8074–8079. [Google Scholar] [CrossRef]
- Papathoma-Köhle, M.; Neuhold, C.; Glade, T. A GIS-based vulnerability assessment for fluvial floods in Austria. Nat. Hazards Earth Syst. Sci. 2011, 11, 443–455. [Google Scholar]
- Chen, W.; Blong, R.; Jacobson, C. Assessing physical vulnerability to flood in urban areas of developing countries. Environ. Hazards 2020, 19, 417–435. [Google Scholar]
- Papaioannou, G.; Efstratiadis, A.; Vasiliades, L.; Loukas, A.; Papalexiou, S.M.; Koukouvinos, A.; Tsoukalas, I.; Kossieris, P. An operational method for Flood Directive implementation in ungauged urban areas. Hydrology 2018, 5, 24. [Google Scholar] [CrossRef]
- Papaioannou, G.; Varlas, G.; Terti, G.; Papadopoulos, A.; Loukas, A.; Panagopoulos, Y.; Dimitriou, E. Flood inundation mapping at ungauged basins using coupled hydrometeorological-hydraulic modelling: The catastrophic case of the 2006 flash flood in Volos City, Greece. Water 2019, 11, 2328. [Google Scholar] [CrossRef]
- Special Secretariat for Water, Ministry of Environment and Energy. Preliminary Assessment of the Flood Directive; Ministry of Environment and Energy: Athens, Greece, 2018. Available online: https://floods.ypeka.gr/ (accessed on 20 March 2024).
- Papaioannou, G. Flood Hazard and Risk Modelling Framework for Ungauged Streams and Watersheds. Ph.D. Thesis, University of Thessaly, Volos, Greece, 2017. [Google Scholar]
- Diakakis, M.; Mavroulis, S.; Deligiannakis, G. Floods in Greece, a statistical and spatial approach. Nat. Hazards 2012, 62, 485–500. [Google Scholar] [CrossRef]
- Lekkas, E.; Diakakis, M.; Mavroulis, S.; Filis, C.; Bantekas, Y.; Gogou, M.; Katsetsiadou, K.-N.; Mavrouli, M.; Giannopoulos, V.; Sarantopoulou, A.; et al. The early September 2023 Daniel storm in Thessaly Region (Central Greece). In Newsletter of Environmental, Disaster and Crises Management Strategies; The National and Kapodistrian University of Athens: Athens, Greece, 2023; p. 30. ISSN 2653-9454. [Google Scholar]
- Skilodimou, H.D.; Bathrellos, G.D.; Alexakis, D.E. Flood hazard Assessment mapping in burned and urban areas. Sustainability 2021, 13, 4455. [Google Scholar] [CrossRef]
- Khoeun, C.; Sok, T.; Chan, R.; Khe, S.; Ich, I.; Chan, K.; Oeurng, C. Assessing flood hazard index using Analytical Hierarchy Process (AHP) and Geographical Information System (GIS) in Stung Sen River Basin. IOP Conf. Ser. Earth Environ. Sci. 2022, 1091, 012031. [Google Scholar] [CrossRef]
- Chen, Y.; Wang, D.; Zhang, L.; Guo, H.; Ma, J.; Gao, W. Flood risk assessment of Wuhan, China, using a multi-criteria analysis model with the improved AHP-Entropy method. Environ. Sci. Pollut. Res. 2023, 30, 96001–96018. [Google Scholar] [CrossRef]
- Dash, P.; Sar, J. Identification and validation of potential flood hazard area using GIS-based multi-criteria analysis and satellite data-derived water index. J. Flood Risk Manag. 2020, 13, e12620. [Google Scholar] [CrossRef]
- Du, S.; Zhang, Z. Impact of cover change of land use on flood vulnerability in Jiangsu province. E3S Web Conf. 2021, 308, 01004. [Google Scholar] [CrossRef]
- Mitra, R.; Saha, P.; Das, J. Assessment of the performance of GIS-based analytical hierarchical process (AHP) approach for flood modelling in Uttar Dinajpur district of West Bengal, India. Geomat. Nat. Hazards Risk 2022, 13, 2183–2226. [Google Scholar] [CrossRef]
- Katsikatsos, G.; Mylonakis, J.; Vidakis, M.; Hecht, J.; Papadeas, G. Geological Map of Greece Scale 1:50,000, Sheet “Volos”; Institute of Geology and Mineral Exploration: Acharnae, Greece, 1986. [Google Scholar]
- Diakakis, M. Flood history analysis and its contribution to flood hazard assessment—The case of Marathonas, Greece. Bull. Geol. Soc. Greece 2017, 43, 1323. [Google Scholar] [CrossRef]
- Saaty, T.L. A scaling method for priorities in hierarchical structures. J. Math. Psychol. 1977, 15, 234–281. [Google Scholar] [CrossRef]
- Saaty, T.L. How to make a decision: The analytic hierarchy process. Eur. J. Oper. Res. 1990, 48, 9–26. [Google Scholar] [CrossRef]
- Saaty, T.L. The analytic hierarchy process in conflict management. Int. J. Confl. Manag. 1990, 1, 47–68. [Google Scholar] [CrossRef]
- Saaty, T.L. Decision Making with the Analytic Network Process; eBooks: Nedlands, Australia, 2006; pp. 1–26. [Google Scholar] [CrossRef]
- Saaty, R. The analytic hierarchy process—What it is and how it is used. Math. Model. 1987, 9, 161–176. [Google Scholar] [CrossRef]
- Toosi, A.S.; Calbimonte, G.H.; Nouri, H.; Alaghmand, S. River basin-scale flood hazard assessment using a modified multi-criteria decision analysis approach: A case study. J. Hydrol. 2019, 574, 660–671. [Google Scholar] [CrossRef]
- Więckowski, J.; Sałabun, W. Sensitivity analysis approaches in multi-criteria decision analysis: A systematic review. Appl. Soft Comput. 2023, 148, 110915. [Google Scholar] [CrossRef]
- Chalkias, C. Geographical Analysis Using Geoinformatics; Kallipos, Open Academic Editions: Athens, Greece, 2015; ISBN 978-960-603-453-4. [Google Scholar]
- Lappas, I.; Kallioras, A. Flood susceptibility assessment through GIS-based multi-criteria approach and analytical hierarchy process (AHP) in a river basin in Central Greece. Int. Res. J. Eng. Technol. 2019, 06, 738–751. [Google Scholar]
- Prall, M.C.; Brandt, U.S.; Halvorsen, N.S.; Hansen, M.U.; Dahlberg, N.; Andersen, K.J. A comprehensive approach for assessing social flood vulnerability and social flood risk: The case of Denmark. Int. J. Disaster Risk Reduct. 2024, 111, 104686. [Google Scholar] [CrossRef]
- Shastry, A.; Carter, E.; Coltin, B.; Sleeter, R.; McMichael, S.; Eggleston, J. Mapping floods from remote sensing data and quantifying the effects of surface obstruction by clouds and vegetation. Remote Sens. Environ. 2023, 291, 113556. [Google Scholar] [CrossRef]
Disclaimer/Publisher’s Note: The statements, opinions and data contained in all publications are solely those of the individual author(s) and contributor(s) and not of MDPI and/or the editor(s). MDPI and/or the editor(s) disclaim responsibility for any injury to people or property resulting from any ideas, methods, instructions or products referred to in the content. |
© 2025 by the authors. Licensee MDPI, Basel, Switzerland. This article is an open access article distributed under the terms and conditions of the Creative Commons Attribution (CC BY) license (https://creativecommons.org/licenses/by/4.0/).