1. Introduction
Flooding poses a significant threat to communities worldwide, particularly in low-lying and flood-prone regions where climate variability and land use changes exacerbate vulnerabilities [
1]. In Guyana, Tabatinga and Lethem township are exemplary case studies of such vulnerabilities, given their geographical positioning within the Upper Takutu-Upper Essequibo Region and proximity to major water bodies like the Takutu River [
2]. These communities experience recurrent flood events primarily driven by intense rainfall, river overflows, and topographical lowlands, leading to socio-economic hardships, infrastructure damage, and environmental degradation [
3].
Efforts to manage and mitigate flood risks in these areas have traditionally focused on infrastructural solutions, such as roads, bridges, and drainage systems. However, these strategies often fail to offer sustainable and adaptive resilience, especially amid climate change uncertainties [
4]. Consequently, there is increasing recognition of the potential for Nature-Based Solutions (NBSs) to complement conventional approaches by harnessing ecological processes to reduce flood risks, enhance ecosystem services, and promote community resilience [
5,
6]. NBSs, such as wetland restoration, floodplain management, and sustainable land use planning, utilise natural or modified ecosystems to buffer floodwaters and restore ecological integrity [
7].
Integrating NBSs into flood risk management in Guyana aligns with regional development objectives that emphasise environmental sustainability, socio-economic growth, and climate adaptation [
8]. The country’s rich natural landscape, comprising wetlands, riverine systems, and forested areas, provides essential ecological infrastructure that can be strategically utilised for flood mitigation, especially in vulnerable communities like Lethem and Tabatinga [
9]. Moreover, the participation of local communities and stakeholders is crucial in designing and implementing effective NBSs, ensuring solutions are culturally acceptable, ecologically appropriate, and socio-economically beneficial [
10].
Despite its promising prospects, integrating NBSs into flood management faces challenges for both households and regional authorities. The challenges include funding to restart local businesses, limited access to transportation and communication networks at the household and community levels, effectively addressing disruption to education and health services, as indicated by the closure of schools and limited access to hospitals and health centres, limited supply of food due to the destruction of livelihoods, and inability to maintain household incomes due to loss of employment [
11]. Flooding also revealed the limited capacity of households to respond to flooding and isolated households in Lethem and Tabatinga from other communities within the Region and the neighbouring Brazil, as illustrated in the flood maps, and it impacted the coordination of some of the more complex developmental initiatives, posing additional barriers/difficulties in implementing comprehensive NBS strategies. Governments and development agencies frequently prioritise complex infrastructure investments, often neglecting ecological approaches that could be more cost-effective and sustainable over the long term [
12]. Furthermore, land tenure issues, community engagement, and environmental governance represent additional barriers to implementing comprehensive NBS strategies, particularly in remote and indigenous territories where land rights may be complex [
13].
The integrated approach used in the study emphasises the interrelationship that combines advanced hydrological modelling, remote sensing, and socio-economic assessment. The application of these techniques in a holistic and integrated manner allows for the collection and analysis of flood data for the determination of the extent to which the communities would be impacted and the measures required to reduce flood risk [
14]. These techniques allow for a nuanced understanding of flood dynamics, identifies priority areas for ecological restoration, and evaluates social vulnerabilities and community capacities [
15]. Moreover, cutting-edge technologies like Geographic Information Systems (GISs), satellite imagery, and hydrodynamic models facilitate evidence-based decision-making and targeted interventions tailored to local environmental and socio-economic contexts [
16].
In the Upper Takutu region, especially Lethem and Tabatinga, recent hydrological studies have employed remote sensing and modelling techniques to analyse flood patterns, identify vulnerable zones, and simulate flood scenarios under varying environmental conditions [
2,
17]. These analyses underscore the importance of integrating ecological buffers with structural infrastructure to optimise flood resilience. They also reveal critical insights into the spatial distribution of flood risks, informing the potential placement of ecological restoration projects, such as wetlands and floodplains, as effective NBSs.
In recent years, the application of hydrological and hydraulic modelling tools, such as HEC-RAS and HEC-HMS, combined with high-resolution digital elevation models (DEMs), has enhanced understanding of flood inundation dynamics in these communities [
18]. These models, validated through ground observations and historical records, have demonstrated the capacity to predict flood extents and depths, guiding the strategic deployment of ecological interventions to mitigate impacts [
17]. Such technical advances are critical for designing holistic flood management systems that integrate ecological, structural, and social dimensions.
Socio-economic assessments complement physical modelling by elucidating community vulnerabilities, livelihood dependencies, and social resilience capacities [
19]. In Lethem and Tabatinga, recurrent flooding disrupts daily life, health, housing, and access to essential services, disproportionately affecting women, children, the elderly, and low-income households [
20]. Understanding these social dimensions can inform the development of community-centred NBSs, ensuring solutions are equitable, culturally appropriate, and capable of fostering local ownership and stewardship [
10].
Furthermore, the valuable lessons learned from historical flood events and climate variability highlight the necessity of adaptive management frameworks incorporating continuous data collection, monitoring, and stakeholder engagement [
1]. Integrating flood early warning systems with ecological buffers can significantly improve community preparedness and response, reducing flood damage and enhancing resilience [
21]. These systems benefit from real-time remote sensing data, community reporting, and hydrological models that provide predictive insights for proactive decision-making.
Policy frameworks and institutional arrangements are fundamental enablers for mainstreaming NBSs into flood risk management. Recognising the ecological and social benefits of NBSs, regional policies should promote land use planning that avoids development in flood-prone zones, incentivises wetland conservation, and allocates resources for ecological restoration projects [
5]. Collaboration among government agencies, local communities, NGOs, and private sector stakeholders is vital to overcoming implementation barriers, ensuring sustainable and inclusive outcomes [
13].
The primary aim of this study is to provide a comprehensive assessment of flood risks and the implementation of Nature-Based Solutions (NBSs) in Lethem and Tabatinga, thereby informing sustainable flood mitigation strategies tailored to the region’s unique environmental and socio-economic contexts. The objectives of this study are fourfold: i. identifying vulnerable and flood-prone areas through remote sensing and hydrological assessments; ii. evaluating existing infrastructure and environmental conditions affecting flood dynamics; iii. engaging local communities and stakeholders to incorporate traditional knowledge and promote participatory planning; and iv. developing a robust NBS framework that integrates environmental system restoration and sustainable land use practices.
2. Materials and Methods
2.1. Overview of Remote Sensing Technology
One of the methodologies employed in the execution of the project, as presented in this study, utilised the advanced remote sensing technology and hydrological modelling to identify flood-prone areas in Lethem and Tabatinga, located in the Upper Takutu Region. The study focuses on Lethem and Tabatinga, two closely situated communities in the Upper Takutu-Upper Essequibo Region. Given their proximity, both areas share similar hydrological characteristics and climatic conditions. The Region’s diverse topography, which includes floodplains and undulating terrains, is particularly susceptible to flooding, necessitating a detailed analysis to identify vulnerable zones.
2.2. Remote Sensing Data Acquisition and Preprocessing
Digital Elevation Model (DEM) Acquisition: The first step in the methodology involved using Quantum Geographical Information Systems (QGIS) to download and extract terrain data from the Planet.com repository. Planet NICFI 30m global elevation data was used for the study, which was freely available for academic and research purposes. The data was accessed via the Planter Explorer graphical user interface, which provided the option of saving images in the format of GeoTIFF. The AOI was then clipped using QGIS version 3.28.3 and finally projected to the UTM Zone 21N (WGS 84 datum) coordinate projection.
A 30 m resolution DEM was obtained and reclassified to a 20 m resolution to enhance the accuracy of the flood model. This high-resolution DEM was the foundational layer for subsequent hydrological analyses:
https://www.planet.com. The original 30 m Digital Elevation Model (DEM) was resampled to a 20 m resolution using bilinear interpolation. This resampling was conducted to match the grid requirements of the hydrological model and facilitate smoother elevation transitions in the terrain surface. It is important to note that this resampling does not enhance the inherent accuracy of the dataset but was used to maintain consistency in model input parameters. The limitations of the original dataset’s resolution are acknowledged, and the results are interpreted within this context.
Streamline and Basin Creation: Streamlines and basins were delineated using the DEM to understand the direction of the surface water flow within Lethem and Tabatinga. This process involved using hydrological tools in QGIS to define the boundaries of watersheds or sub-watersheds, which are crucial for accurate hydrological modelling. The delineation helps understand how water accumulates and flows across the landscape, highlighting potential flood zones.
2.3. Hydrological and Hydraulic Modelling
Land Use/Land Cover (LULC) Calibration: Sentinel-2 imagery with a 10 m resolution was employed to obtain Land Use/Land Cover (LULC) data. This data was used to calibrate the hydrological model by incorporating the Manning’s n value roughness coefficients, which account for the surface roughness based on different land cover types. The calibration ensures that the model accurately reflects real-world conditions, improving the reliability of flood predictions.
Rain-on-Grid Model Simulation: The HEC-RAS (Hydrologic Engineering Centre’s River Analysis System) software (by US Army Corps of Engineer, USA) was used to create a rain-on-grid model, which simulates the impact of a rainfall event over a specified area. This study simulated a catastrophic flood event in May 2021 using rainfall data from the Climate Hazards Group InfraRed Precipitation with Station data (CHIRPS). CHIRPS combines real-time meteorological station data with infrared satellite data to provide accurate precipitation estimates. This simulation helped to understand the flood dynamics and identify the area’s most at risk of inundation.
2.4. Data Analysis and Validation
Flow Direction and Accumulation Analysis: The flow direction and accumulation patterns derived from the DEM and LULC data were analysed to identify areas where water is likely to accumulate during heavy rainfall. This analysis pinpointed specific zones within Lethem and Tabatinga that are highly susceptible to flooding.
Model Validation: The accuracy of the flood model was validated using historical flood data and ground truthing. Field surveys and local knowledge were employed to verify the modelled flood extents and ensure that the simulation results accurately reflect real-world flood events. This validation process is crucial for the model’s credibility and ensuring reliable findings.
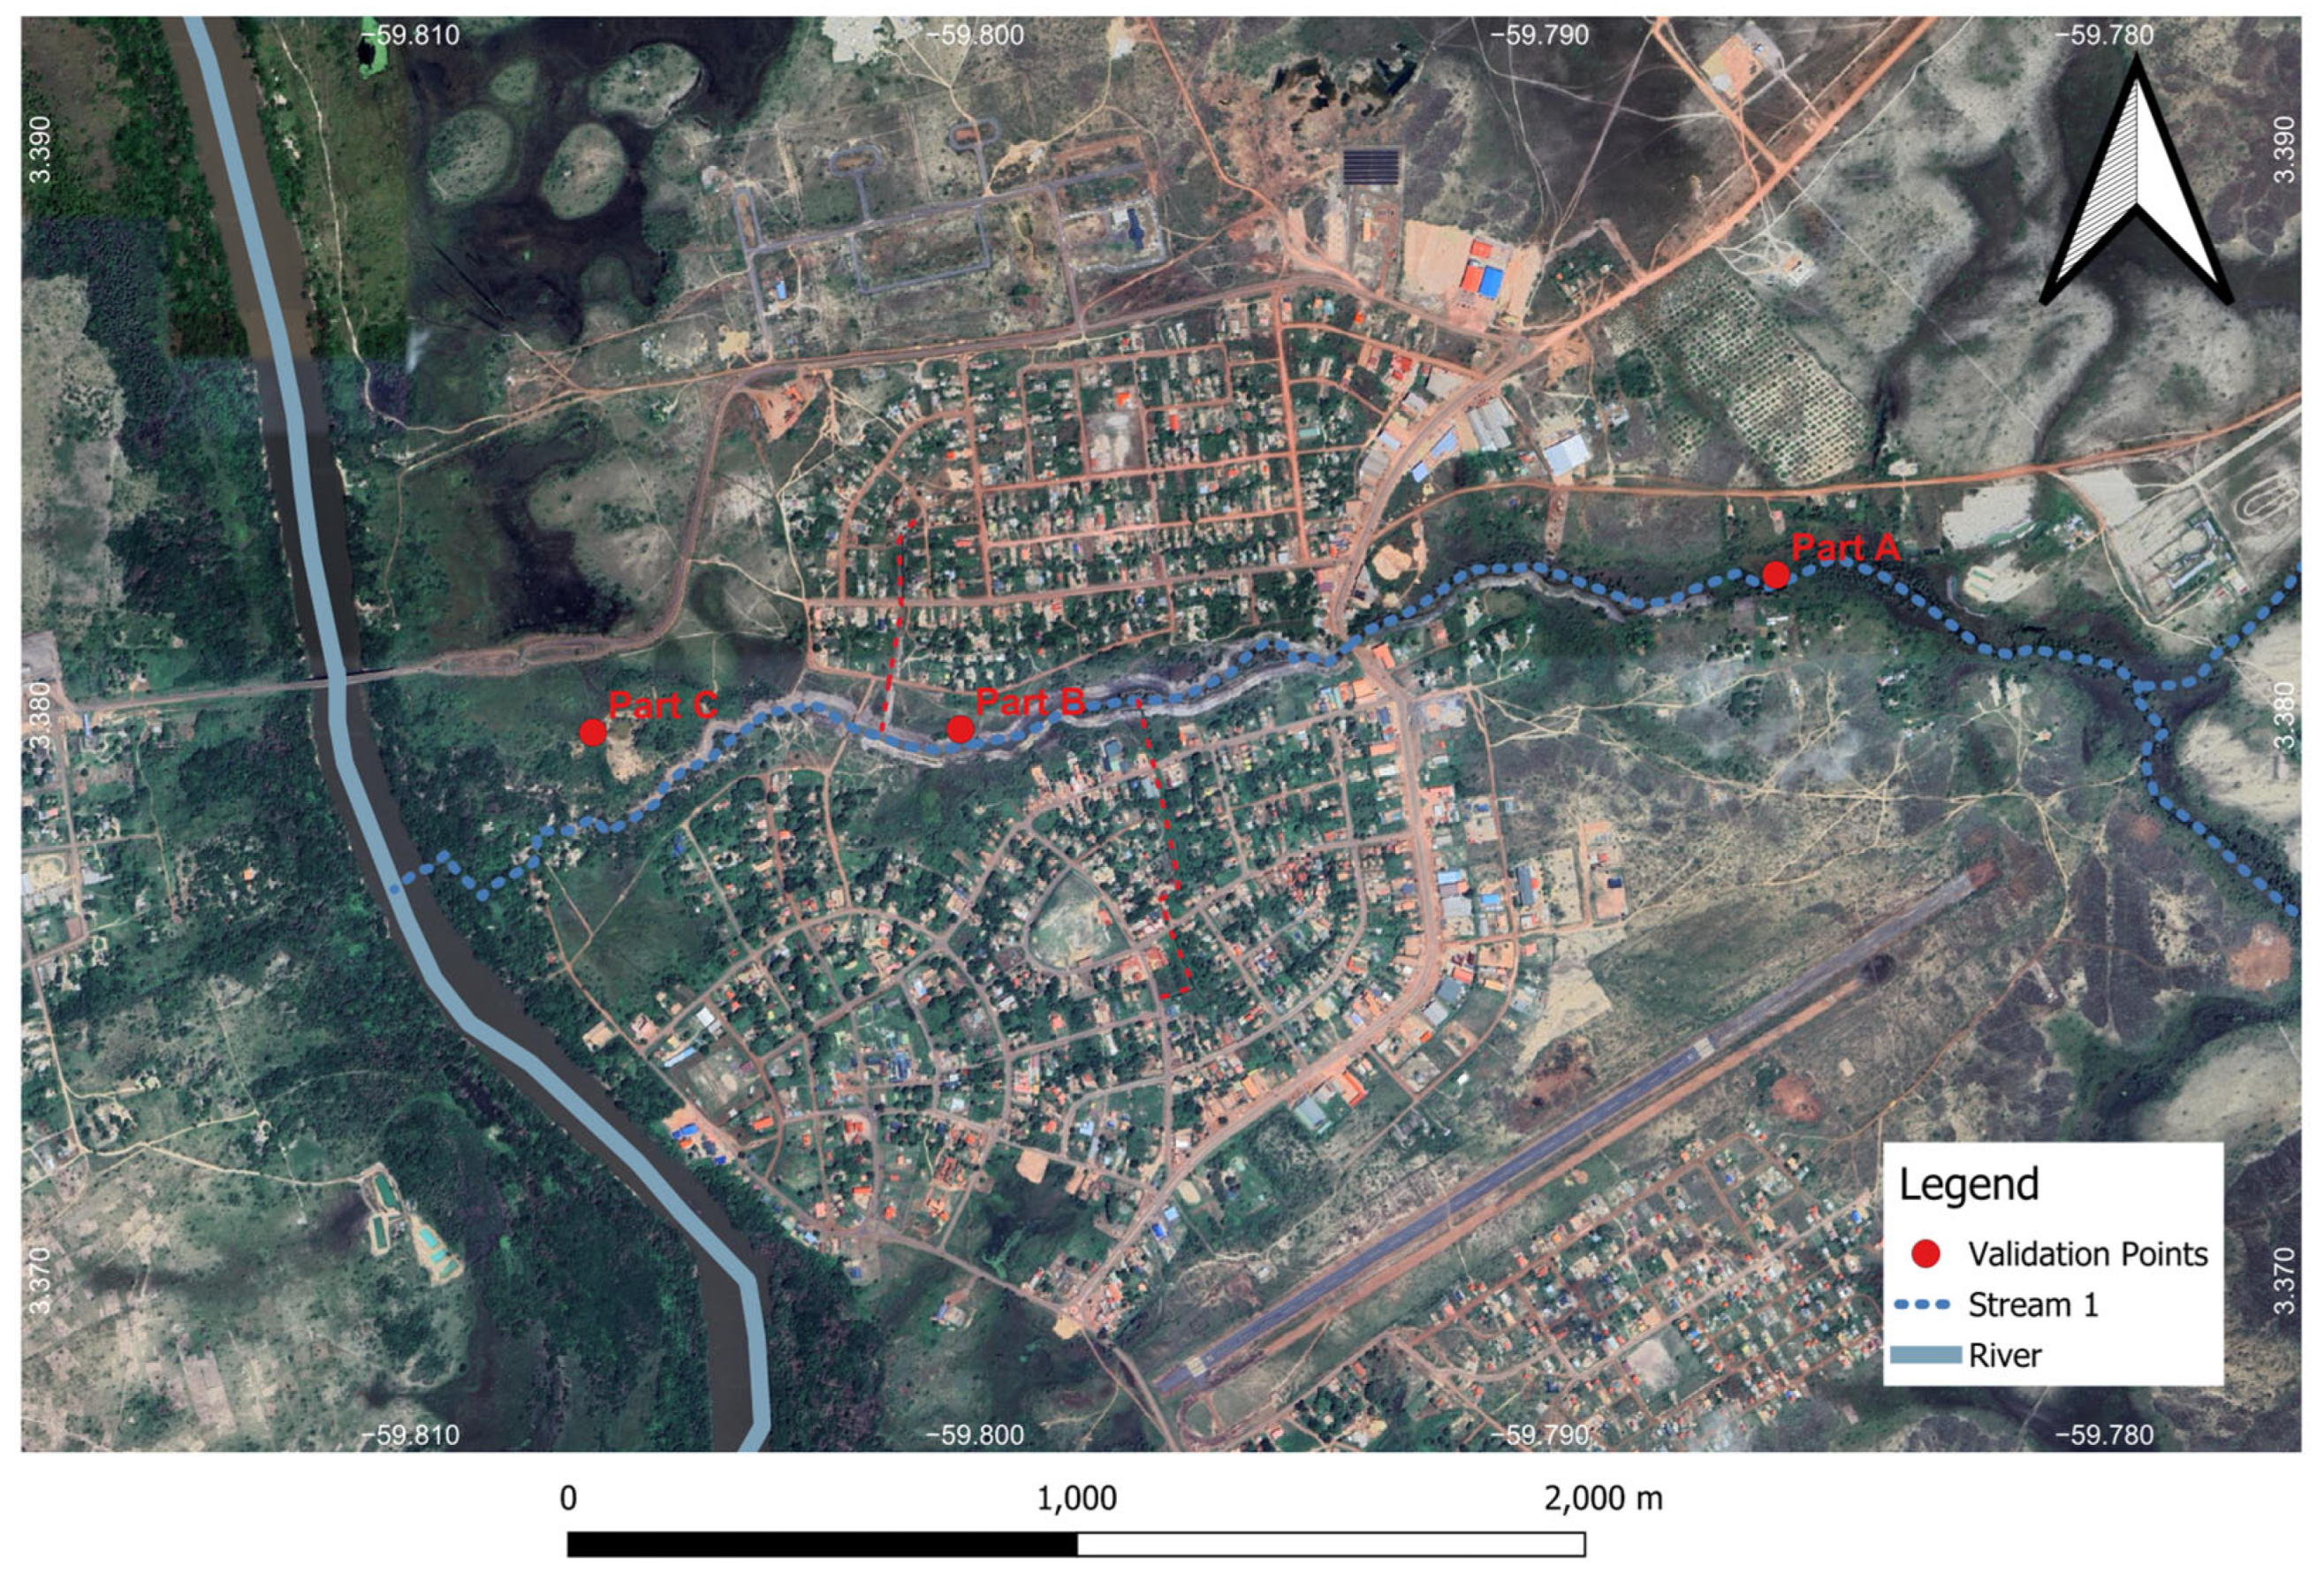
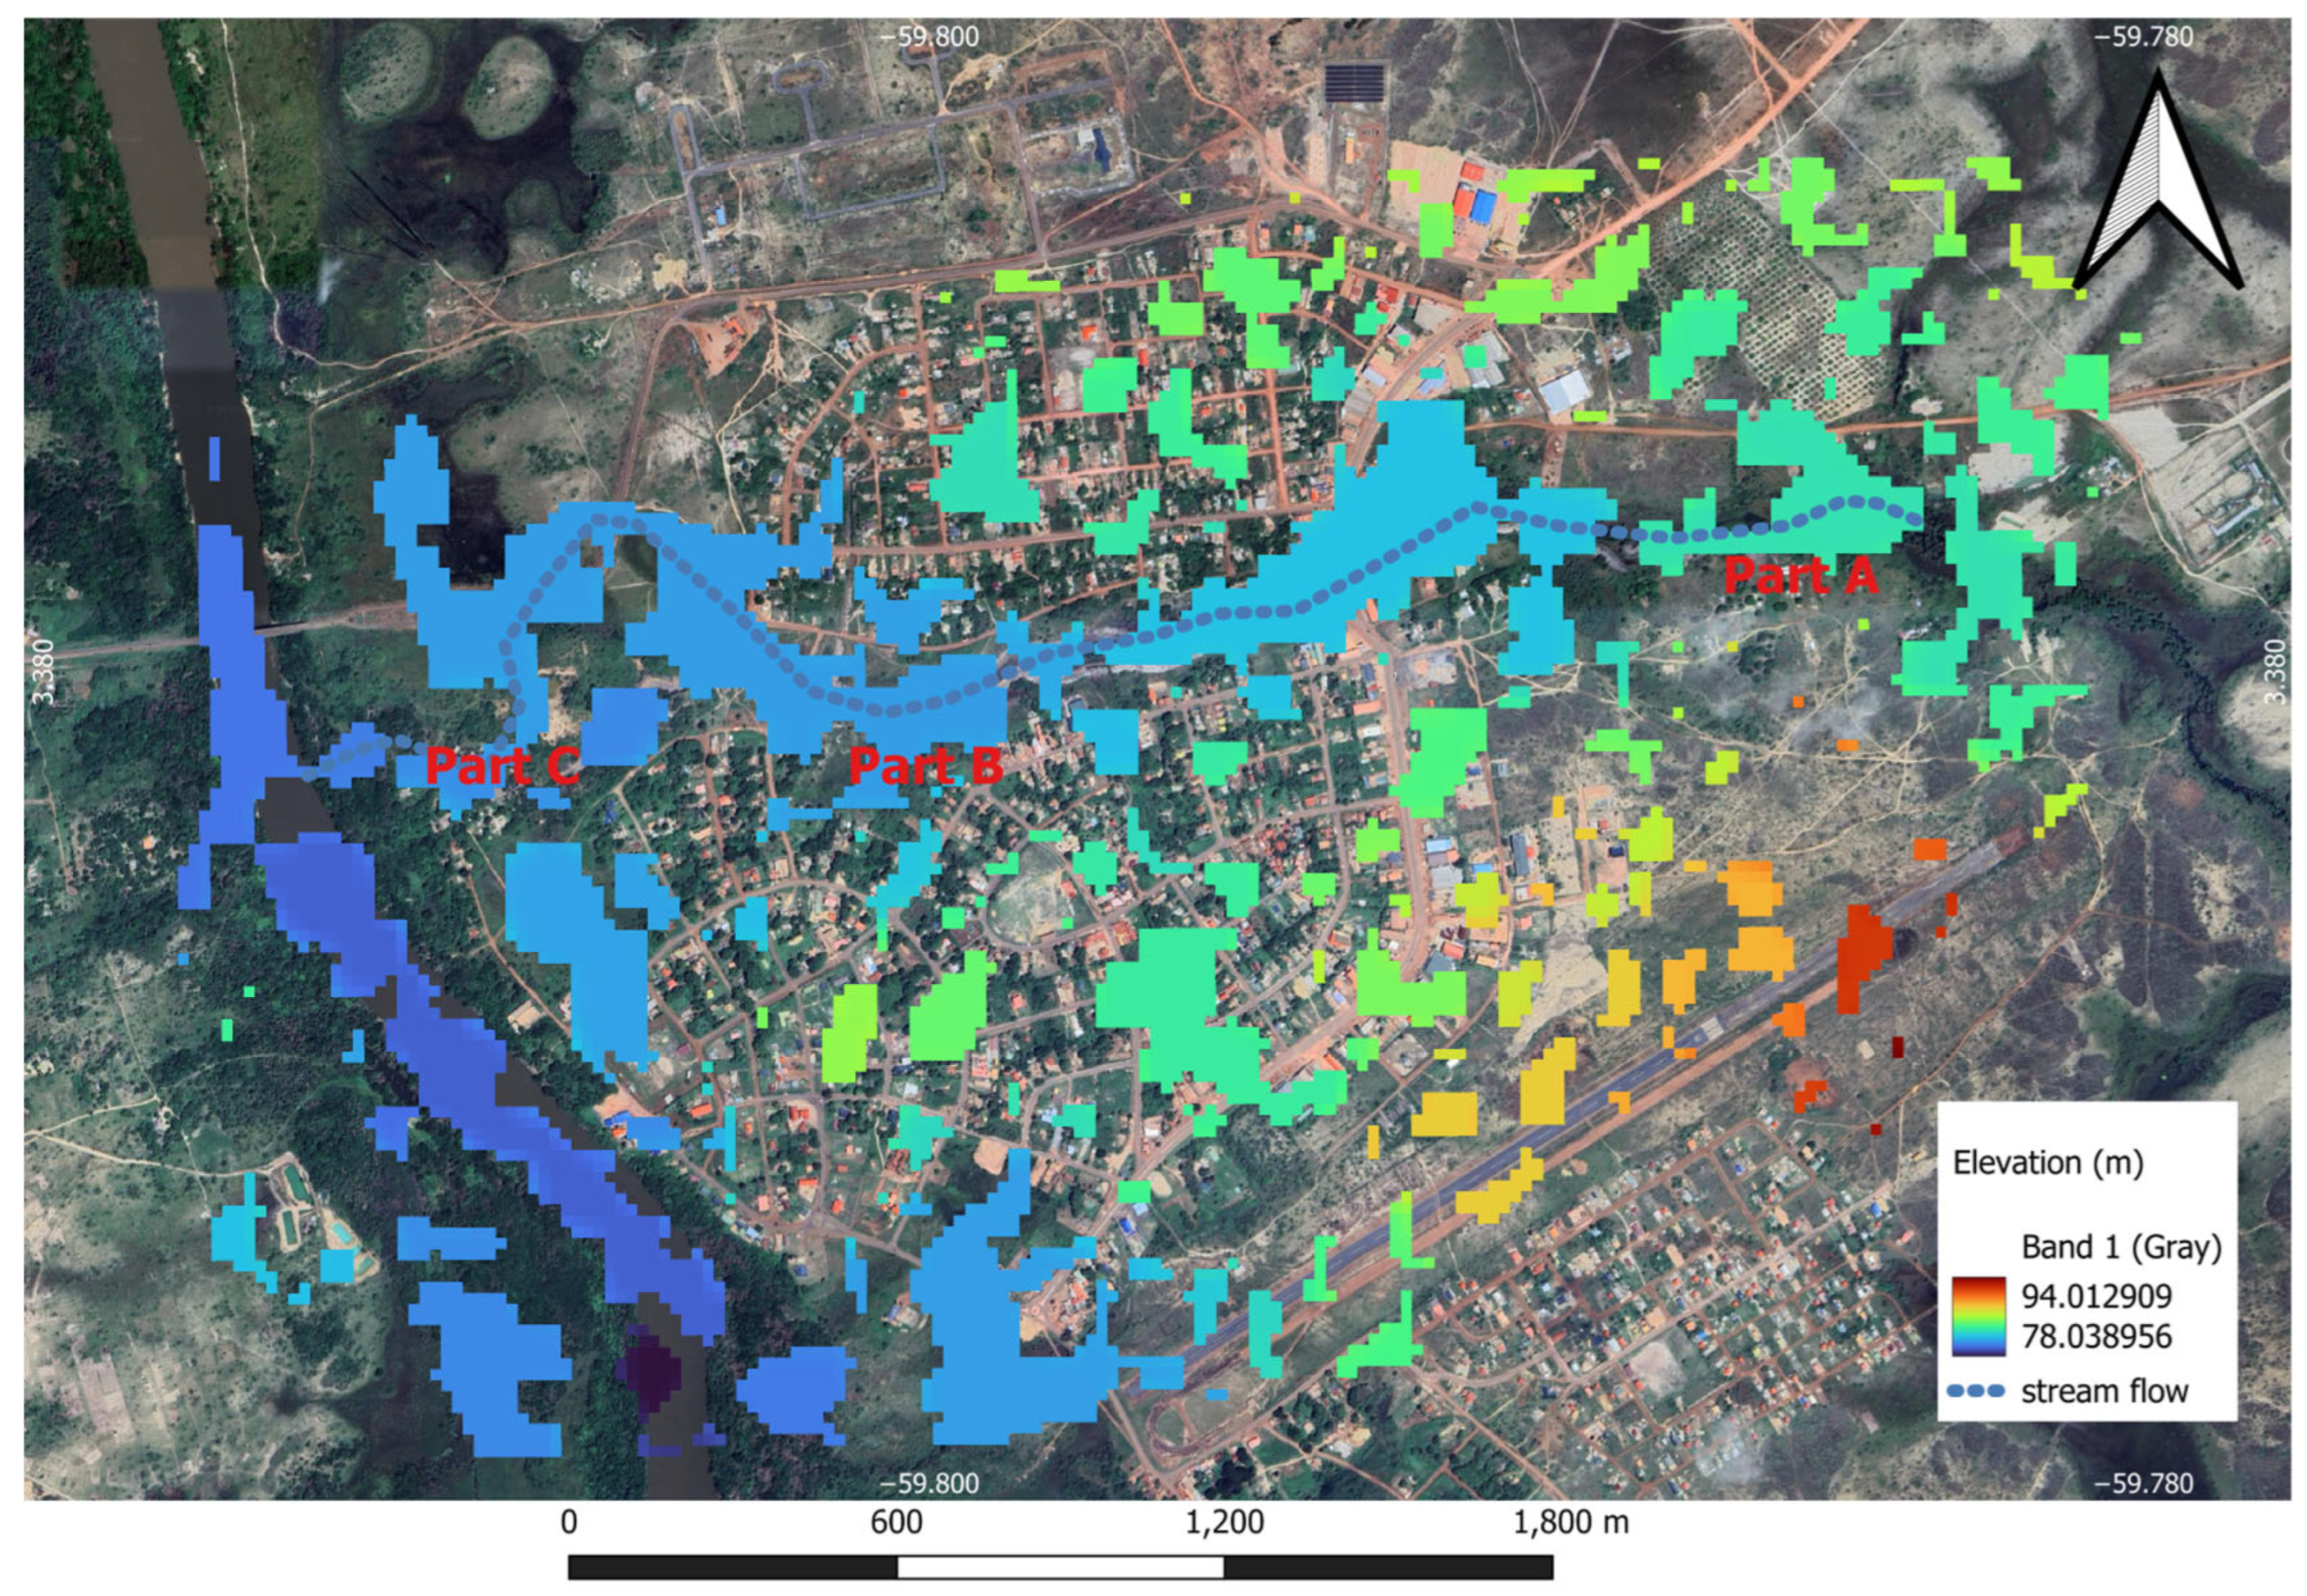
Historical data included information obtained from the Guyana Civil Defence Commission on the flood event, which occurred in the study area during the May 2021 flood. Spatial as well as temporal references of the severity of the flood and the extent were inferred from the aforementioned reports. Three specific points along the bank of the Tabatinga Canal (denoted as stream 1, see
Figure 1) were used to observe the impacts of the peak floodwaters. Surveys were conducted at points, including Part A, Part B, and Part C, as well as at water marks of structures, and accounts from residents were collected to determine flood depths. These observed values were then compared to the outputs of the HEC-RAS depth simulation. The Root Mean Square Error (RMSE) was then computed to average the magnitude of error of the difference between the observed values and the simulated values.
2.5. Methodology for the Data Source and Analysis of the Socio-Economic Impact of Flooding in Lethem and Tabatinga
A questionnaire was designed using the Likert scale format and administered face-to-face to selected households from the target communities of Lethem and Tabatinga. These communities are among the most vulnerable and at risk of flooding. The total number of households in the study areas is 711, disaggregated as 496 (69.8%) and 215 (30.2%) for Lethem and Tabatinga, respectively. The sample comprised 356 households (217—Lethem and 139—Tabatinga) computed using the following formula at a 5% margin of error and 95% confidence level:
where n = Sample size; N = Population of the study area; e = Margin of error.
The survey was undertaken to determine how much the households were affected socially and economically by flooding, land use change in the communities, level of protection, household and community coping capacity and strategy, and government and private sector involvement, disaggregated by location, age and gender. Other data include networking capacity and the assistance required to address flooding and sustain livelihoods, strengthen resilience, and ultimately support the Nature-Based Solution that will be implemented. The Statistical Package for Social Sciences (SPSS) was used to analyse the data. Socio-economic analysis included an overview of the trends and patterns in the socio-economic data and exploratory analysis, including the development of Chi-Square models to assess the communities’ perspectives and impacts caused by flooding events on their livelihoods. The analysis was intended to complement the macro flood models with extreme rainfall scenarios and inform the planned interventions that will be adopted.
3. Results
3.1. Socio-Economic Baseline Background
Secondary reports on flooding in the Upper Takutu area showed minimal information on the socio-economic impacts of flooding. Reports within the area mainly focused on the town of Lethem as it is the most populous location in the Region. Lethem is the central business hub in the Upper Takutu–Upper Essequibo Region and Guyana’s southern urban centre. It is also a pivotal tourism point as the town’s location provides ideal access to the Rupununi savannah lands, and due to its proximity to the Brazilian border vis-à-vis the Takutu River, visitors can also visit the neighbouring Brazil via the Takutu Bridge. Lethem has several commercial activities, including those in the hospitality industry (e.g., restaurants and guest houses), retail sales (e.g., stores and supermarkets), and banking. The town can be accessed from the capital Georgetown via a 402.336 km (250-mile) roadway or via air travel, as Lethem has a single paved airstrip, often servicing daily flights, mainly from Georgetown.
The main economic activities in the surrounding communities include mining, mainly artisanal, small-scale commerce, and agriculture. The agriculture sector for the area produces cash crops, coconuts, as well as nut trees and fruit trees, such as mangoes and cashews. As part of the area’s value-added agriculture activity, there is a cashew processing centre and many small-scale cattle farms predominantly using free-roaming cattle systems. Lethem, with a population of 1702, has an estimated 151 individuals working in commerce services, 70 professional technicians, 56 industrial service providers, 32 clergy members, and 14 agriculture service providers [
22,
23]. Most of the remaining population works in farming, mining, or tourism.
Media reports showed that 100 persons were evacuated and 500 individuals were affected by flooding events in Lethem in 2022 [
24]. The reports also stated that flood waters reached as high as 5 feet and often submerged the Lethem market. Water levels also restrict access to large vehicles in the communities, often hindering clean-up. The Red Cross has reported that flooding events in the area often require considerable evacuation efforts and many emergency supplies, including hygiene kits, jerry cans, rubber boots, mosquito nets, and clean-up kits [
25]. The Situation Brief generated by the Region 9 Executive Office reported that in 2011, a flooding event affected 67 farms surrounding Lethem, and over 800 farms within the entire Region reported crop losses. Reports from the High Commission of Guyana in South Africa indicated that during the 2022 flooding event, the area had a reported loss of 400 cattle, 600 horses, thousands of commercial fish, and hundreds of small ruminant livestock. Reports from the
Guyana Times outlined that one flooding event in Lethem often costs millions in clean-up supplies and equipment [
26]. The results here demonstrate the impact context of flooding in the communities that can build the basis for the feasibility of any flood mitigation strategy.
3.2. Socio-Economic Impacts to Flooding
All the reports conducted for flooding in Lethem and Tabatinga have readily identified several socio-economic issues. The main issues identified are the displacement of households and damage to household infrastructure. Significant economic costs go towards emergency supplies, evacuating and facilitating families at shelters, and clean-up costs. According to
Table 1, the community members’ source of income and their capacity to deal with a flooding event are related events. The results showed that the majority of the community members indicated that they are incapable of dealing with major flooding events. Noteworthy from the results in
Table 1, the highest proportion of respondents stating they are incapable of dealing with flooding events was the farmers. Agriculture is a major source of income in both communities and unlike the other sources of income where a flooding event can temporarily halt these activities, agriculture losses are more long-term and require a longer time and a larger cost of recovery.
As reported in
Table 2, the majority of the community members, regardless of their source of income, indicated that a flooding event disrupts their work between 10 and 20 days, with a large proportion also indicating being disrupted between 21 and 30 days. A smaller proportion indicated disruptions over 30 days. The farmers, hunters, and fishermen had the highest proportion, indicating a disruption over 30 days, which further speaks to the challenges of the impacts of flooding to the agriculture sector in the area. Although the socio-economic impacts of flooding in Lethem can be identified, no reports were observed where the impacts were quantified.
In the absence of secondary data and reports, the study gathered preliminary data to assess the damage cost of a flooding event according to the community members. The data (
Table 3) was collected and cross-referenced based on the source of income of the respondent. The majority of the respondents, especially the farmers, hunters, and fishermen, indicated that a typical flooding event can cost their household between GYD 60,000 and 90,000. The public sector workers in the area that were interviewed did not report damages beyond GYD 90,000, which can be attributed to two factors: either the public sector workers sampled live in an area in the community that was not as impacted or the losses incurred are not as extensive, as farmers, hunters, loggers and miners have more specialised equipment which can be affected. Given that the average household income falls between GYD 100,000 and GYD 200,000 a month, this potential flood damage represents a significant proportion of the average household income, which essentially verifies the respondents stating their inability to deal with flooding in
Table 1.
The findings of the survey revealed that the two communities were unprepared for the severity of the floods, leading to the unexpected socio-economic challenges experienced. This indicates that flood management plans and programmes should be strongly correlated with the hydrological data, which could be used to better understand the duration, severity, and intensity of floods and the need for collaboration. Overall, the households agreed that both the government and the private sector have a role to play in addressing flooding in the communities. This approach allows for planned and coordinated interventions at the household, community, and regional levels. It is the opinion of the majority of the households in the post-assessment survey that, with the anticipated level of coordination, the NBSs would have been successful in dealing with a similar duration, severity, and intensity of rainfall as previously experienced.
3.3. Identification of Vulnerable Areas
Lethem and Tabatinga are recognised as flood-vulnerable areas due to their geographical location and susceptibility to heavy rainfall. The recent flooding in these areas has highlighted the challenges faced by residents living in low-lying areas prone to inundation during periods of intense rainfall. With the water levels rising significantly, communities in Lethem and Tabatinga have been grappling with the impact of flooding on their homes, livelihoods, and infrastructure, necessitating urgent intervention to address the immediate needs of the affected population.
In Lethem and Tabatinga, the situation has been exacerbated by the overloading and overflowing of bordering rivers, leading to widespread flooding and damage to crops, livestock, and infrastructure. The higher-than-usual flood levels for 2021, surpassing those experienced in the 2005 flood, have posed a significant threat to residents and their properties. Similarly, in Tabatinga, the rising water levels have prompted concerns about the safety and well-being of the local population, especially pregnant women and those due to deliver, requiring special attention and arrangements to ensure their access to essential healthcare services during emergencies.
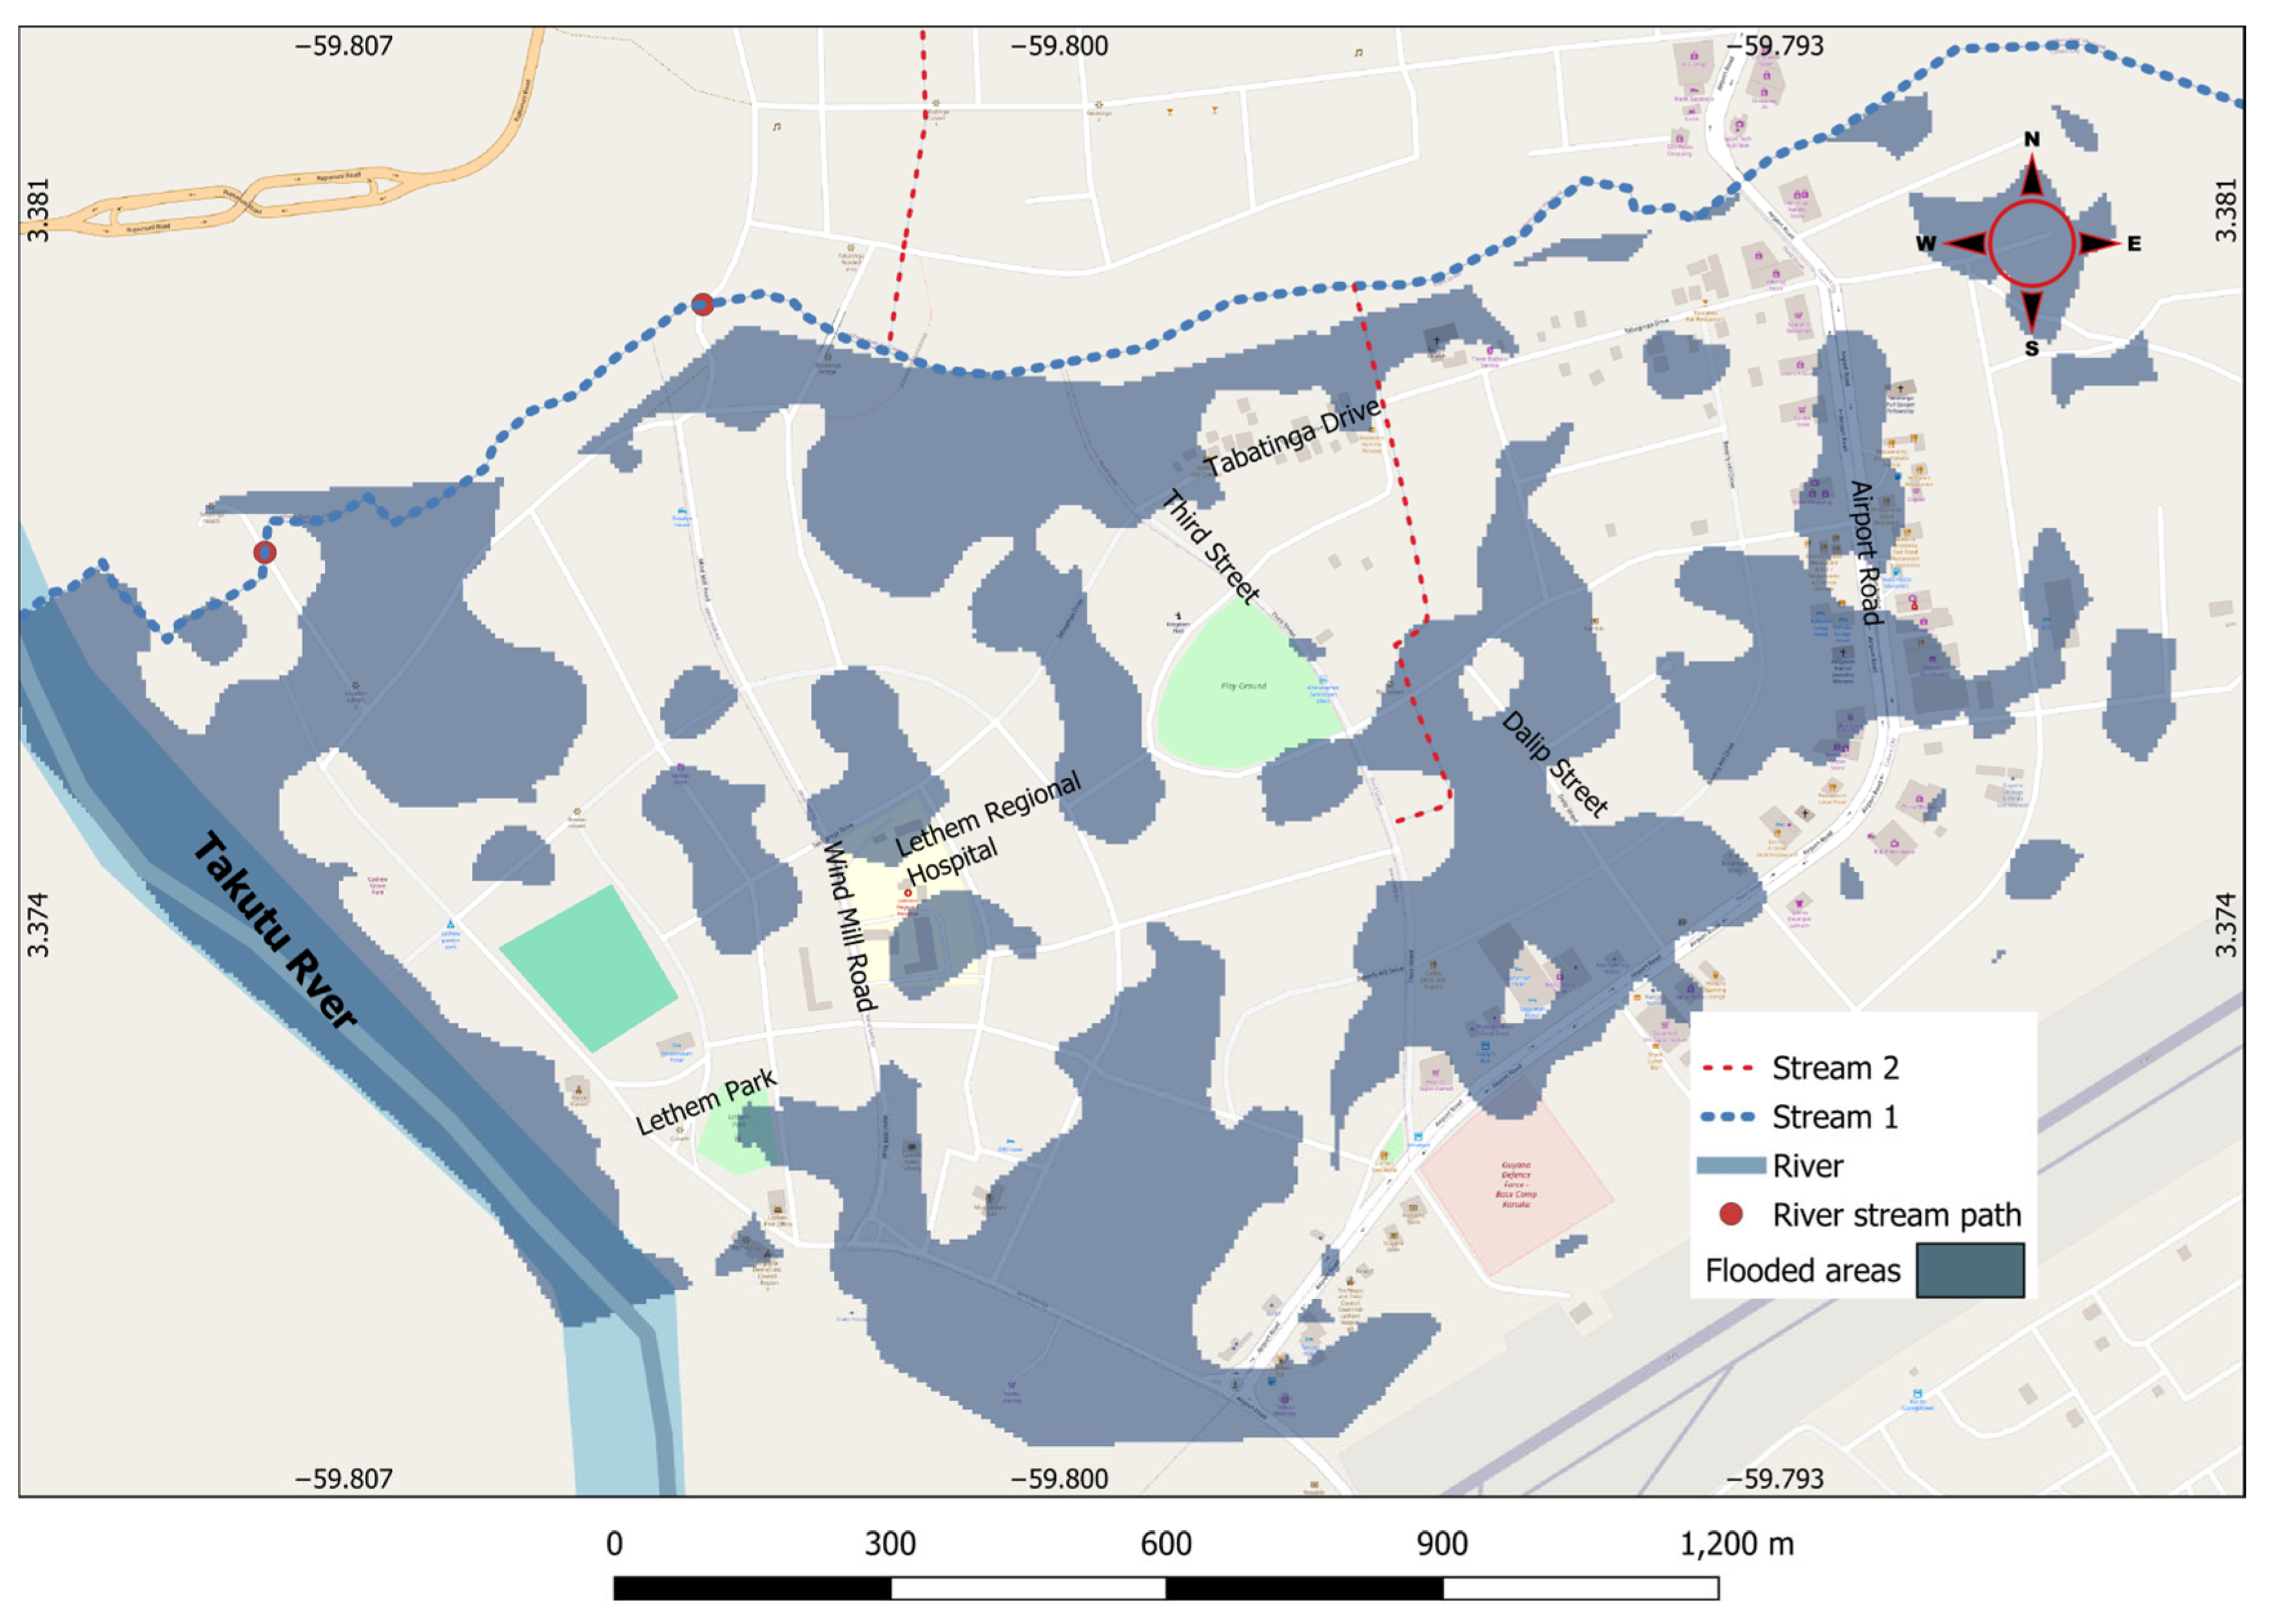
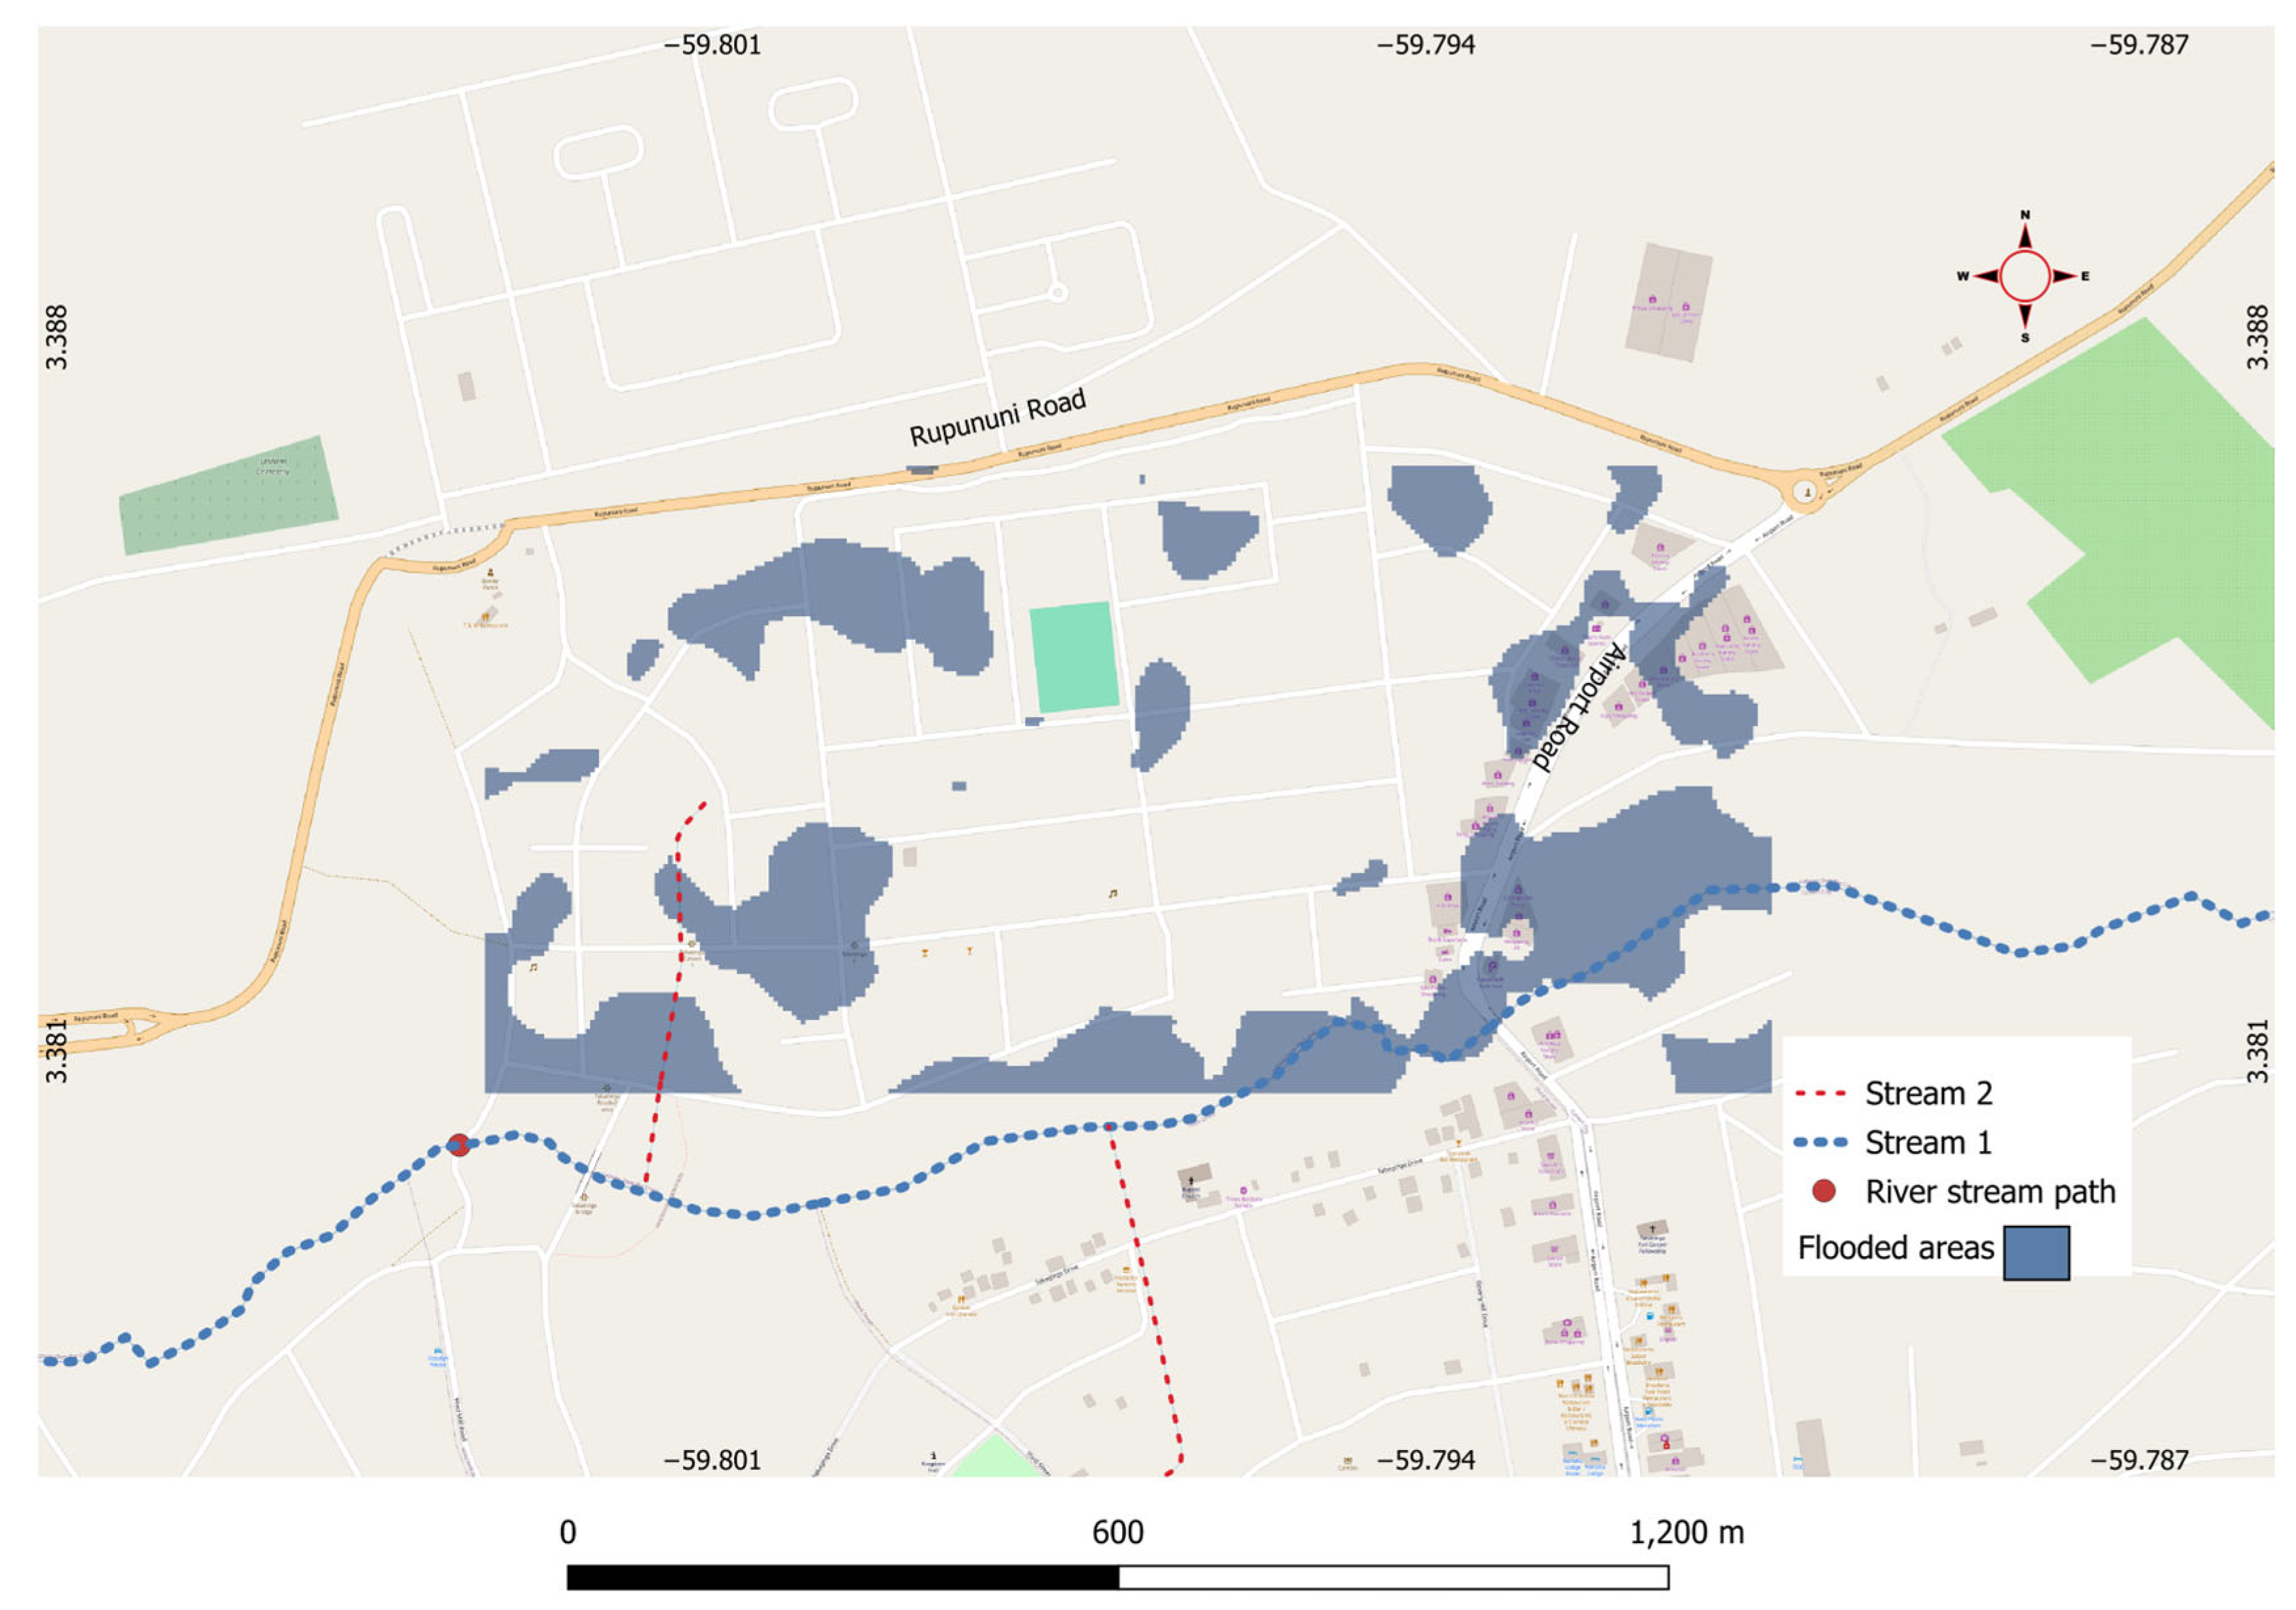
In May 2021, Lethem and Tabatinga experienced significant flooding events, primarily concentrated near the banks of the Takatu River. The satellite imagery analysis revealed that the upswelling of the Takatu River, leading to the backflow of water into streams, was identified as the leading cause of flooding in both communities. This phenomenon, coupled with heavy rainfall, exacerbated the flooding situation, highlighting the vulnerability of these areas to such natural disasters. The flood events of this period (May 2021) are captured and presented in the maps below, showing the vulnerable areas in Lethem (
Figure 2) and Tabatinga (
Figure 3).
The methodology employed in the study allowed for detecting flooded areas by analysing variations in radar backscatter using Sentinel-1 C-band Synthetic Aperture Radar (SAR) imagery. The zones where radar backscatter significantly changed were identified by comparing pre-flood and flood conditions, indicating flooding-affected areas. The analysis also emphasised the importance of monitoring river levels and drainage systems to mitigate the impact of flooding in Lethem and Tabatinga.
The methodology employs satellite imagery to detect flooded areas within Lethem and Tabatinga by analysing variations in radar backscatter with the use of Sentinel-1 C-band Synthetic Aperture Radar (SAR) imagery in Google Earth Engine (GEE), as summarily presented below:
Pre-flood images: 1 April 2021 to 30 April 2021.
Flood event images: from 19 May 2021 to 26 May 2021.
These periods allowed for comparison between normal conditions and flood conditions.
The pre-flood images were selected from 1 to 30 April, as this period accurately reflected the ground conditions relevant to flooding incidents, with no flooding events reported. Extending this timeframe would involve processing unnecessary satellite imagery. The dates for the flood event images were determined based on meteorological records and reported flooding incidents. This range was narrowed down to the specific week when the media and government agencies first reported the highest severity of the flood. This period also coincided with the availability of satellite imagery, which is not always guaranteed. Sentinel-1 satellites pass over regions at defined intervals. The dates of the flood events align with both the satellite passes and the reports of flooding on the ground.
- 2.
Image collection and loading
Pre-flood collection: Images were filtered by the areas of interest, Lethem and Tabatinga, the date range (1–30 April 2021), the instrument mode (Interferometric Wide swath—IW), polarisation (‘VV’—vertical transmit and receive), and the satellite pass (descending orbit).
Flood collection: Filters were applied from 19 May to 26 May 2021.
- 3.
Image processing
With advanced speckled filtering and the Refined Lee method to reduce noise, a focal median operation with a 50 m radius was performed, followed by a neighbourhood reduction which calculated the mean over a 5-pixel square kernel. Images then underwent speckle filtering, and the median image was computed to represent the typical conditions for each period.
Differential images were then computed by subtracting the pre-flood median from the flood median image. This highlighted zones where the radar backscatter has significantly changed, an indication of flooding. With the use of remote sensing, the baseline for flooding within the Lethem and Tabatinga zones was computed using the following methods:
Historical flood events were identified via print media reports and government agencies (such as the Department of Public Information, the Civil Defence Commission and the Ministry of Agriculture).
With the use of Google Earth Engine, a script was compiled that executed the following steps:
- A.
Defining our area of interest (Lethem district).
- B.
Loading rainfall estimates from Climate Hazards Group InfraRed Precipitation with Station data (CHIRPS), a 35+ year quasi-global rainfall dataset, 1981–Present.
- C.
A function was then written to compute the total accumulated rainfall for the past 7 days before the known flood event dates. This function maps the list of known flood event dates, sums the precipitation for each period, and uses a reducer to acquire the average precipitation in the defined area of interest.
Table 4 below presents the results of the computations performed to define our baseline.
The historical flood event data in
Table 3 offers valuable insights into the precipitation patterns associated with flooding incidents in the study areas. On 22 May 2022, a significant flood event occurred, characterised by a total precipitation of 190.52 mm over seven days. This substantial amount of rainfall played a crucial role in triggering flooding in the areas, highlighting the vulnerability of the areas to heavy rainfall events. The data underscores the importance of monitoring and managing rainfall levels to mitigate the impact of flooding in Lethem and Tabatinga.
Similarly, another notable flood event occurred on 27 May 2021, with a total precipitation of 100.88 mm recorded over seven days. This event serves as a reminder of the recurrent nature of flooding in the Region and the need for proactive measures to address the challenges posed by heavy rainfall. By analysing the historical data on flood events and corresponding rainfall, stakeholders can better understand the precipitation thresholds that lead to flooding, enabling them to develop effective strategies for flood risk reduction and disaster preparedness.
Furthermore, the data highlights additional flood events on 18 June 2021, 4 July 2018, 23 July 2017, and 11 May 2011, each associated with varying precipitation levels over seven days. These events demonstrate the variability in rainfall patterns that can trigger flooding in Lethem and Tabatinga, emphasising the need for adaptive and resilient flood management practices. By leveraging the insights provided by the historical data, decision-makers can enhance their capacity to anticipate and respond to future flood events, ultimately reducing the vulnerability of communities in the region to the impacts of flooding.
Analysing historical flood events and corresponding rainfall data offers a foundation for informed decision-making and risk assessment in Lethem and Tabatinga. By recognising the historical trends and patterns of flooding, stakeholders can implement targeted interventions to enhance flood resilience, protect livelihoods, and safeguard infrastructure against the adverse effects of extreme weather events. The data presented in
Table 3 serves as a valuable resource for guidance in appropriate NBS recommendations aimed at building a more resilient and sustainable future for Lethem and Tabatinga in the face of recurrent flood risks.
3.4. Nature-Based Solution Intervention for Consideration
This section on Nature-Based Solution Intervention for flood mitigation in Lethem and Tabatinga details the plan for intervention to combat flooding challenges in these two communities. Recognising the unique environmental dynamics of these areas, as detailed in the previous sections, characterised by vulnerable communities, this section presents the possible and available NBSs for consideration, and proposes two low-cost and community-supportive solutions. The section also presents the output of the Multi-Criteria Analyses of the considered NBSs, the functions of each NBS, and why the two low-cost and community-supportive solutions are proposed for implementation. Through a holistic approach rooted in collaboration and adaptive management, these proposed interventions seek to establish a sustainable foundation for resilient communities and thriving ecosystems amidst the challenges posed by climate change and the growth of Lethem and Tabatinga.
Nature-Based Solutions (NBSs) represent an innovative and multifaceted approach to addressing environmental challenges, particularly in the context of flood mitigation in areas such as Lethem and Tabatinga. NBSs can be broadly defined as “actions to protect, sustainably manage and restore natural or modified ecosystems that address societal challenges effectively and adaptively, simultaneously providing human well-being and biodiversity benefits” [
27]. This definition encapsulates the holistic nature of NBSs, emphasising their role in not only mitigating flood risks but also enhancing ecological resilience and supporting the socio-economic well-being of communities. By harnessing the inherent capacity of natural systems to provide services such as flood regulation, water purification, and habitat provision, NBS interventions offer a sustainable alternative to conventional engineering solutions [
28].
At the core of NBS principles lies a deep commitment to ecological integrity and conserving natural habitats and biodiversity [
29]. These principles advocate for the preservation and restoration of ecosystems, recognising their essential role in maintaining ecological balance and supporting human livelihoods. By safeguarding biodiversity and ecosystem services, NBS interventions contribute to the resilience of natural systems, enabling them to better withstand and recover from disturbances such as flooding events. Moreover, NBS principles emphasise the importance of integrating local knowledge and engaging with communities in the planning and implementation interventions [
30]. This participatory approach fosters a sense of ownership and stewardship among stakeholders, enhancing the effectiveness and sustainability of NBS initiatives. For this reason, we engaged with the members of communities in Lethem and Tabatinga, and especially the community leadership, between 6 and 9 April 2024.
3.4.1. Multi-Criteria Analysis (MCA) of the Considered NBSs
A few Nature-Based Solutions (NBSs) documented in the literature were considered for this task. However, implementing the documented solutions for flood management in Lethem and Tabatinga caused some challenges for our team due to the following reasons: Initial Investment Costs, Maintenance and Monitoring, Land Ownership and Access, Community Engagement, Regulatory Compliance, Long-Term Planning and Commitment, Resource Constraints, and Not Full Stakeholder Buy-In. To address these challenges, the team identified and prioritised five (5) specific Nature-Based Solutions that align with the project’s research objective and for which collaboration with local partners or organisations (here, the Town Council) is possible for implementation support. The team also leveraged the existing data and resources, focusing on two pilot projects or demonstration sites. These were the suggested solutions that the team developed with clear timelines and milestones to maximise the impact of our efforts within the available timeframe and resources. The solutions proposed for implementation and subjected to Multi-Criteria Analyses (MCA) are shown below (
Figure 4).
Multi-Criteria Analysis (MCA) is a decision-making tool to evaluate and compare multiple alternatives or options based on predefined criteria or objectives [
31,
32]. In evaluating Nature-Based Solution (NBS) types to be implemented at Lethem and Tabatinga, MCA was employed to assess the effectiveness, feasibility, and suitability of the various NBS interventions for addressing flood mitigation and environmental adaptation. The process we followed in achieving this includes
Identification of Criteria: We first considered defining the criteria to evaluate the NBS types. These evaluation criteria that we identified include 1. Regulating Flood risk reduction; 2. Socio-cultural; 3. Provisioning Support; 4. Aesthetic; 5. Health; 6. Economic; 7. Circulation/Mobility; 8. Effectiveness, and 9. Sustainability.
Selection of Alternatives: Next, a range of NBS types or interventions are identified as potential options for addressing the environmental challenge. The five (5) Nature-Based Solutions subjected to Multi-Criteria Analysis (MCA) Evaluation are Swale (Sw), Flood Conveyance Solutions (FCSs), Water retention and detention solutions or Bio-retention Solutions (BRSs), Bank Erosion Control (BEC) Solutions, and Flood Impact Reduction (FIR).
The weighting of Criteria: Each criterion is assigned a weight or importance score relative to the others, reflecting its relative priority in the decision-making process. Our engagement with on-ground stakeholders or expert judgement typically determines this weighting.
Evaluation of Alternatives: These NBS types are then evaluated against the criteria, using relevant data and information to assess their performance. This involves qualitative assessments, such as expert opinions.
Aggregation of Results: The results of the evaluations are aggregated to provide an overall assessment of each NBS type. This involves scoring or ranking the alternatives based on their performance against the criteria and weighting factors.
3.4.2. Outputs of the MCA
During consultations with key stakeholders, including the Mayor and other community representatives in Lethem and Tabatinga, a systematic evaluation of the proposed Nature-Based Solutions (NBSs) for flood mitigation was conducted. The views expressed were classified according to nine (9) criteria and twenty-seven (27) benefit indicators, as presented in
Table 5 for Lethem and
Table 6 for Tabatinga. Each criterion and indicator of benefits was assessed through a ranking system ranging from 1 to 10, with 1 representing the lowest and 10 the highest level of perceived benefits attributed to the proposed intervention’s effectiveness in mitigating flood impacts. The five NBS options subjected to this Multi-Criteria Analysis (MCA) evaluation are Swale (Sw), Flood Conveyance Solutions (FCSs), Water retention and detention solutions, also known as Bio-retention Solutions (BRSs), Bank Erosion Control (BEC) Solutions, and Flood Impact Reduction (FIR). This evaluation aimed to discern the most suitable NBSs for implementation within the respective communities based on their effectiveness, feasibility, and overall contributions to flood risk reduction.
The Multi-Criteria Analysis Framework for NBS Consideration for Lethem (
Table 5) comprehensively evaluates different types of Nature-Based Solutions (NBSs) across various criteria. The table ranks Swale (Sw), Flood Conveyance Solutions (FCSs), Bio-retention Solutions (BRSs), Bank Erosion Control (BEC) Solutions, and Flood Impact Reduction (FIR) based on their performance in 9 evaluation criteria. The total scores for each type of NBS provide a quantitative assessment of their effectiveness, with Sw scoring the highest at 182 points, followed by BRSs at 183 points, FCSs at 168 points, FIR at 116 points, and BEC at 114 points. This data indicates that BRS is the most effective NBS option in Lethem, scoring highest across the evaluation criteria.
Among the evaluation criteria, Sw and FCSs are suggested to perform well in regulating flood risk reduction, while BRSs are expected to enhance land use planning and management. Additionally, BRSs score high in socio-cultural factors, environmental aspects, and sustainability, making them a versatile and practical NBS option for Lethem. The evaluation also revealed that FIR and BEC have lower total scores. This is not surprising as the town (Lethem) currently has swale-like structures (apart from green grass) as a form of drainage in place in the community. The Town Mayor emphasised the need for a dam-like provision in the community to store excess water during heavy rainfall, thereby regulating flooding. Bio-retention solutions are the closest NBSs that appear to be collaborative and supported for implementation in the town of Lethem; hence, they are the one the team would like to propose to support the town’s effort.
The Multi-Criteria Analysis Framework for NBS Consideration for Tabatinga offers a detailed evaluation of various Nature-Based Solutions (NBSs) based on 9 key criteria. The table (
Table 6) ranks Swale (Sw), Flood Conveyance Solutions (FCSs), Bio-retention Solutions (BRSs), Bank Erosion Control (BEC) Solutions, and Flood Impact Reduction (FIR) according to their performance across different evaluation criteria for Tabatinga community. The total scores for each type of NBS provide a quantitative measure of their effectiveness, with Sw scoring 178 points, FCSs scoring 172 points, BRSs scoring 138 points, FIR scoring 116 points, and BEC scoring 115 points. This suggests that Sw is the most effective NBS option in Tabatinga, followed closely by FCSs, while BRSs, FIR, and BEC have lower total scores. However, since Swale-like interventions exist in the community, we propose considering the Flood Conveyance Solution (FCS) as the Nature-Based Solution to address the flood that the Tabatinga canal may instigate.
3.4.3. Flood Risk Prevention Functions of the Considered NBSs
There are existing guidelines for Nature-Based Solution integration in River basins. One of those is the work by ADB [
33]. This publication helped the team consider the NBSs that could be implemented in Lethem and Tabatinga with limited time and resources. The flood risk prevention functions of each of the considered NBSs were considered for the functions expected of a flood risk management effort. These interventions are grouped by functions with related actions and are presented in
Table 6. The two (2) interventions being proposed to be implemented at the demonstration sites in Lethem and Tabatinga are expected to perform the functions highlighted as “X” in
Table 7.
Flood Conveyance Solutions: These interventions aim to enhance the river’s capacity to handle high discharge events, such as heavy rainfall. By improving drainage in the areas, these solutions are expected to facilitate the swift release and downstream flow of stormwater, reducing the risk of flooding and minimising the potential for flash floods downstream.
Water Retention and Detention—Bio-Retention Solutions: These solutions would focus on smoothing out the peaks of high discharge events by incorporating temporary stormwater storage mechanisms. This stored water can be gradually released into the river network, helping regulate water flow and reduce the impact of heavy rainfall events.
3.5. Macro Flood Model of Past Flood in Lethem and Tabatinga
The Macro Flood model results reveal significant insights into the extent and degree of flood impacts in Lethem and Tabatinga. Utilising advanced hydrological and hydraulic modelling tools, such as HEC-RAS and HEC-HMS, the study simulated a catastrophic flood event from May 2021. This model, underpinned by high-resolution Digital Elevation Models (DEMs) and calibrated with Sentinel-2 Land Use/Land Cover (LULC) data, accurately depicts flood inundation patterns. The results presented here highlight critical areas of vulnerability where water accumulates and flows, exposing residential zones, infrastructure, and economic activities to substantial flood risks. These findings provide a detailed understanding of the spatial distribution and intensity of flooding, serving as a vital resource for developing targeted flood mitigation strategies and enhancing community resilience in these hinterland towns.
3.5.1. Flood Depths and Accumulation
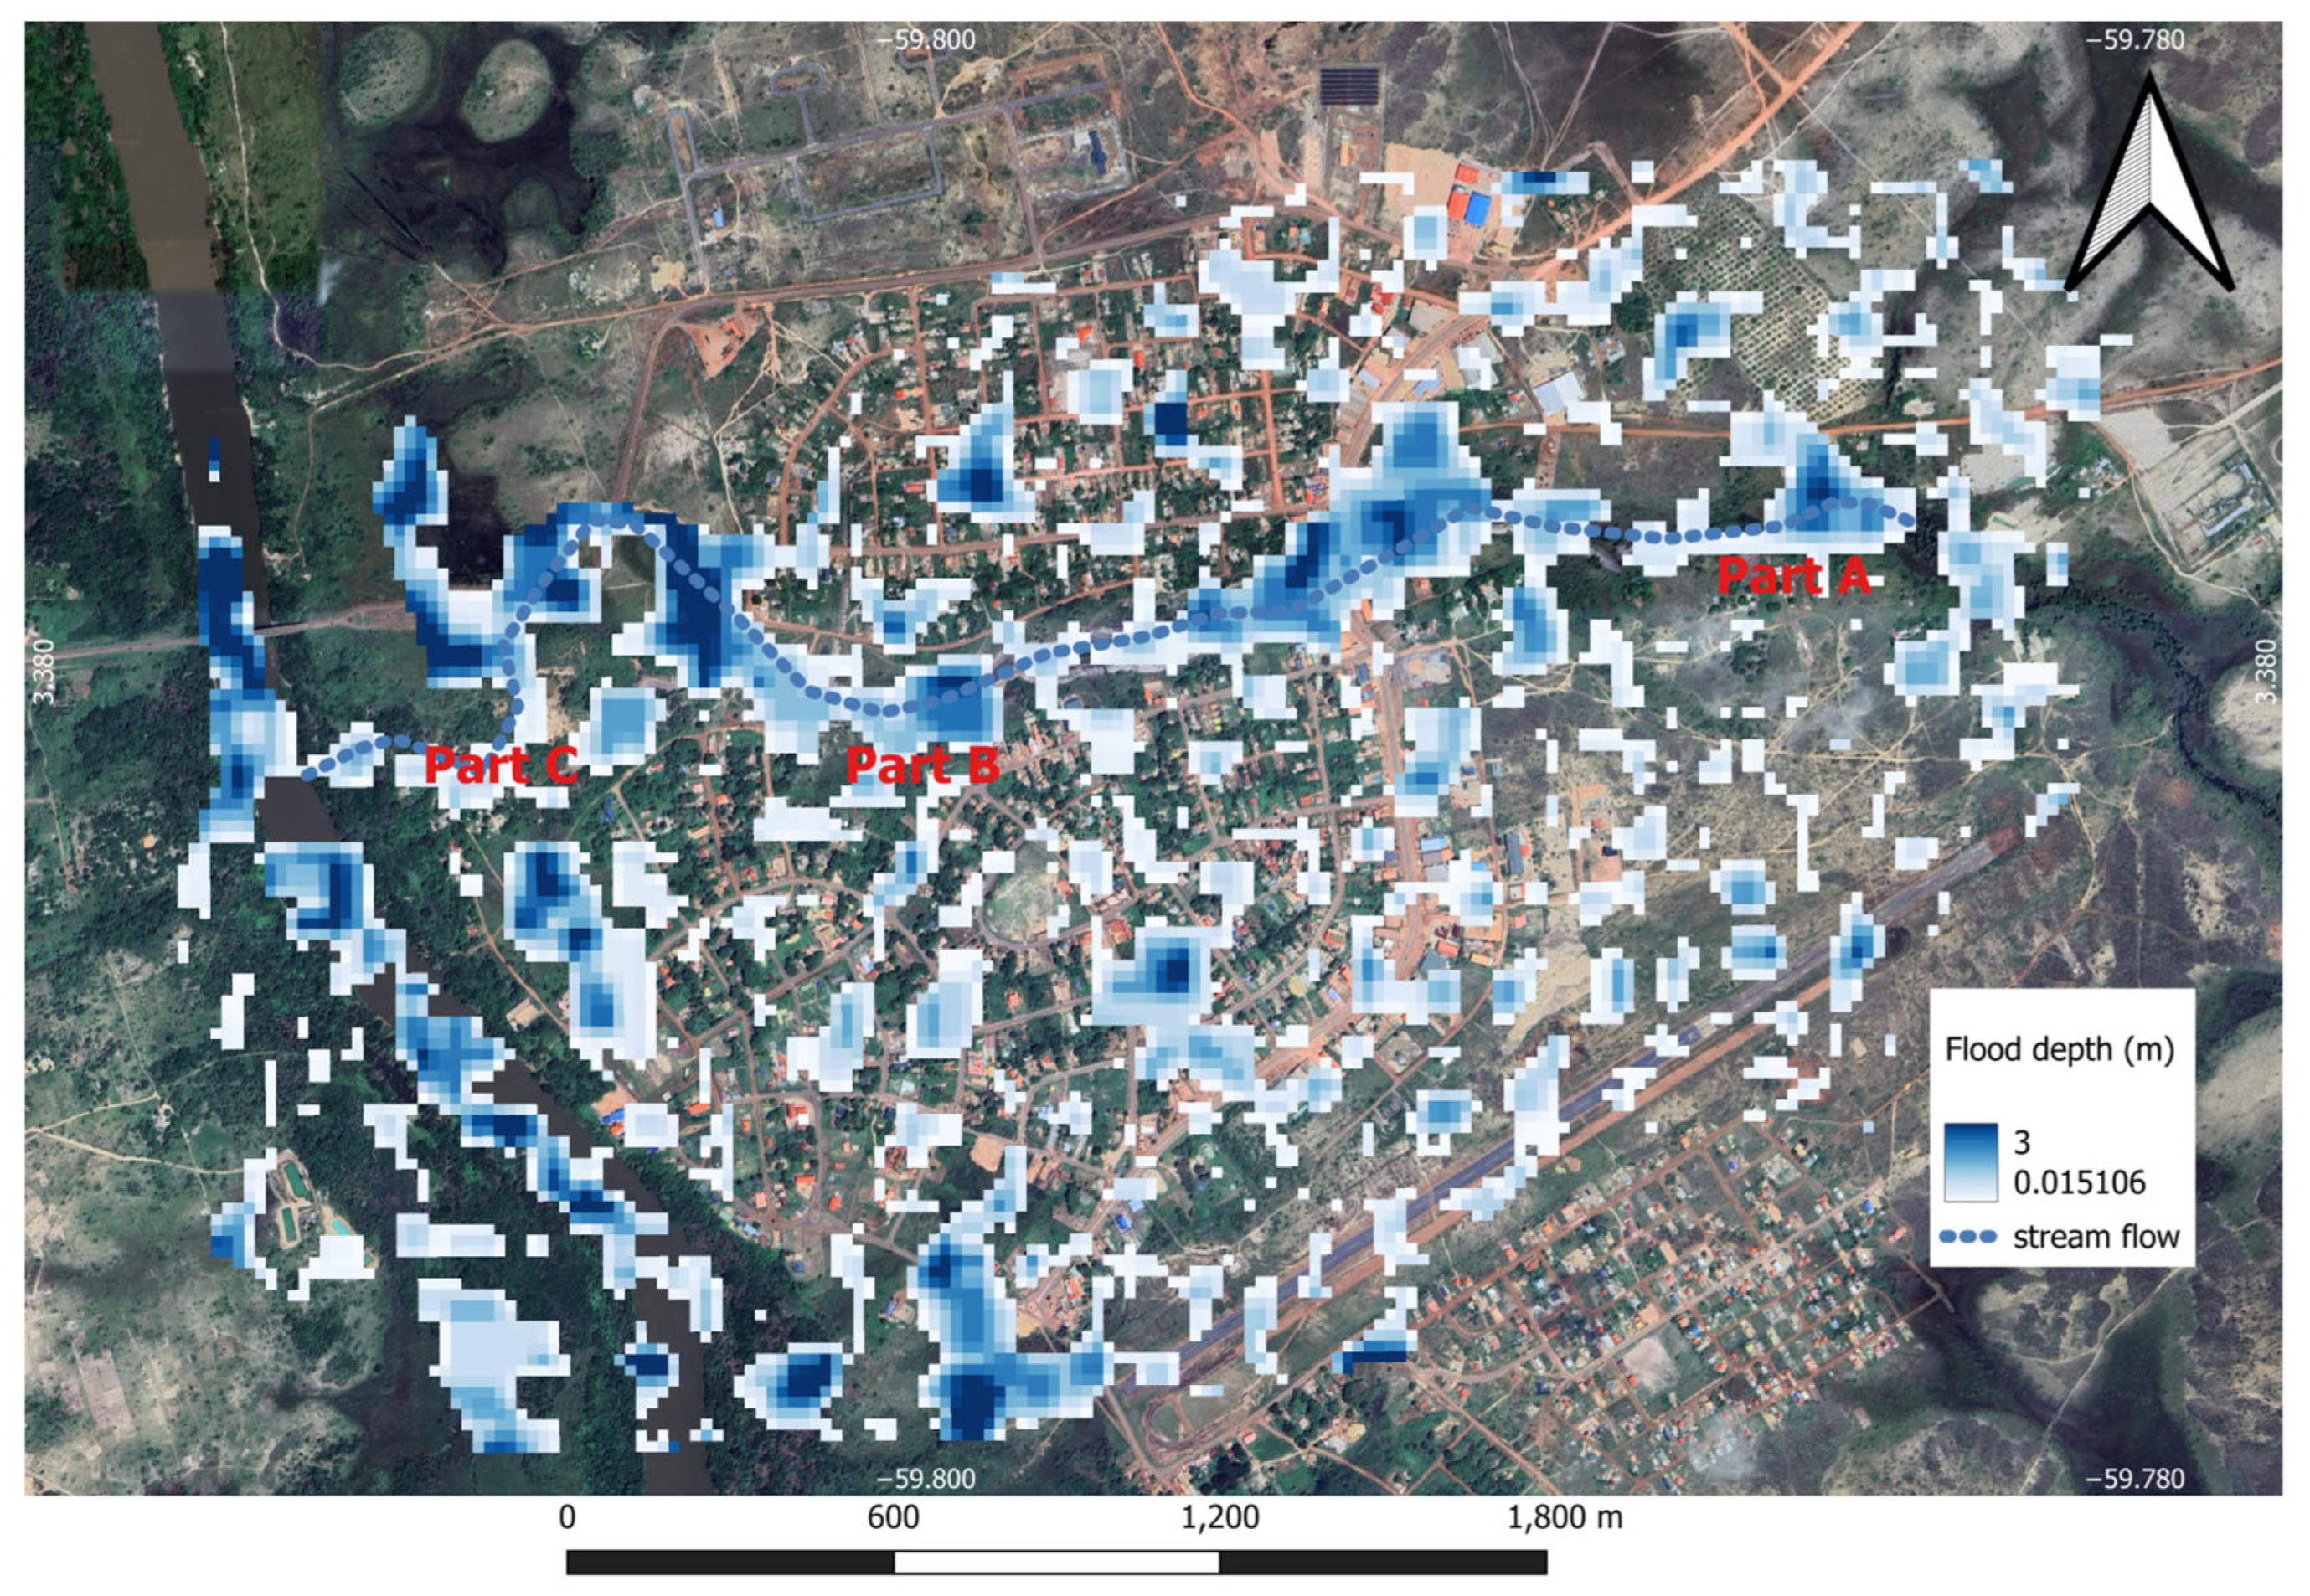
The HEC-RAS simulation model, conducted for the 30 May 2021, flood event, revealed that certain areas in Lethem and Tabatinga were submerged under more than 1 m of floodwater (
Figure 5). This finding aligns with ground reports and observations, which documented the evacuation of many families to government shelters due to the rising floodwaters. The model’s results underscore the severity of the flooding and its significant impact on the local population, emphasising the urgent need for effective flood management strategies.
Flooding in Lethem and Tabatinga is primarily attributed to the overtopping of the Rio Branco River in Brazil and the Takutu River, compounded by torrential rainfall. The HEC-RAS model goes beyond analysing river dynamics by incorporating direct rainfall simulation over the terrain. This approach provides a comprehensive understanding of how water is distributed and flows across the floodplains, following the natural topographical features of the area. By simulating the interaction between rainfall and terrain, the model offers valuable insights into the mechanics of flooding in these regions.
The simulation results highlight how surface water accumulation corresponds with the topographical characteristics of Lethem and Tabatinga. As shown in
Figure 6, the HEC-RAS simulation run on 30 May 2021, reveals that elevation significantly influences water accumulation, with low-lying areas in both Lethem and Tabatinga particularly vulnerable to flooding. The results highlight that the areas most prone to inundation are those adjacent to the Tabatinga Canal, which borders both localities. These low-lying areas experienced substantial water accumulation, exacerbating the flood impact and highlighting the importance of elevation in flood risk assessment. This information is crucial for identifying high-risk zones and planning effective flood mitigation and evacuation strategies.
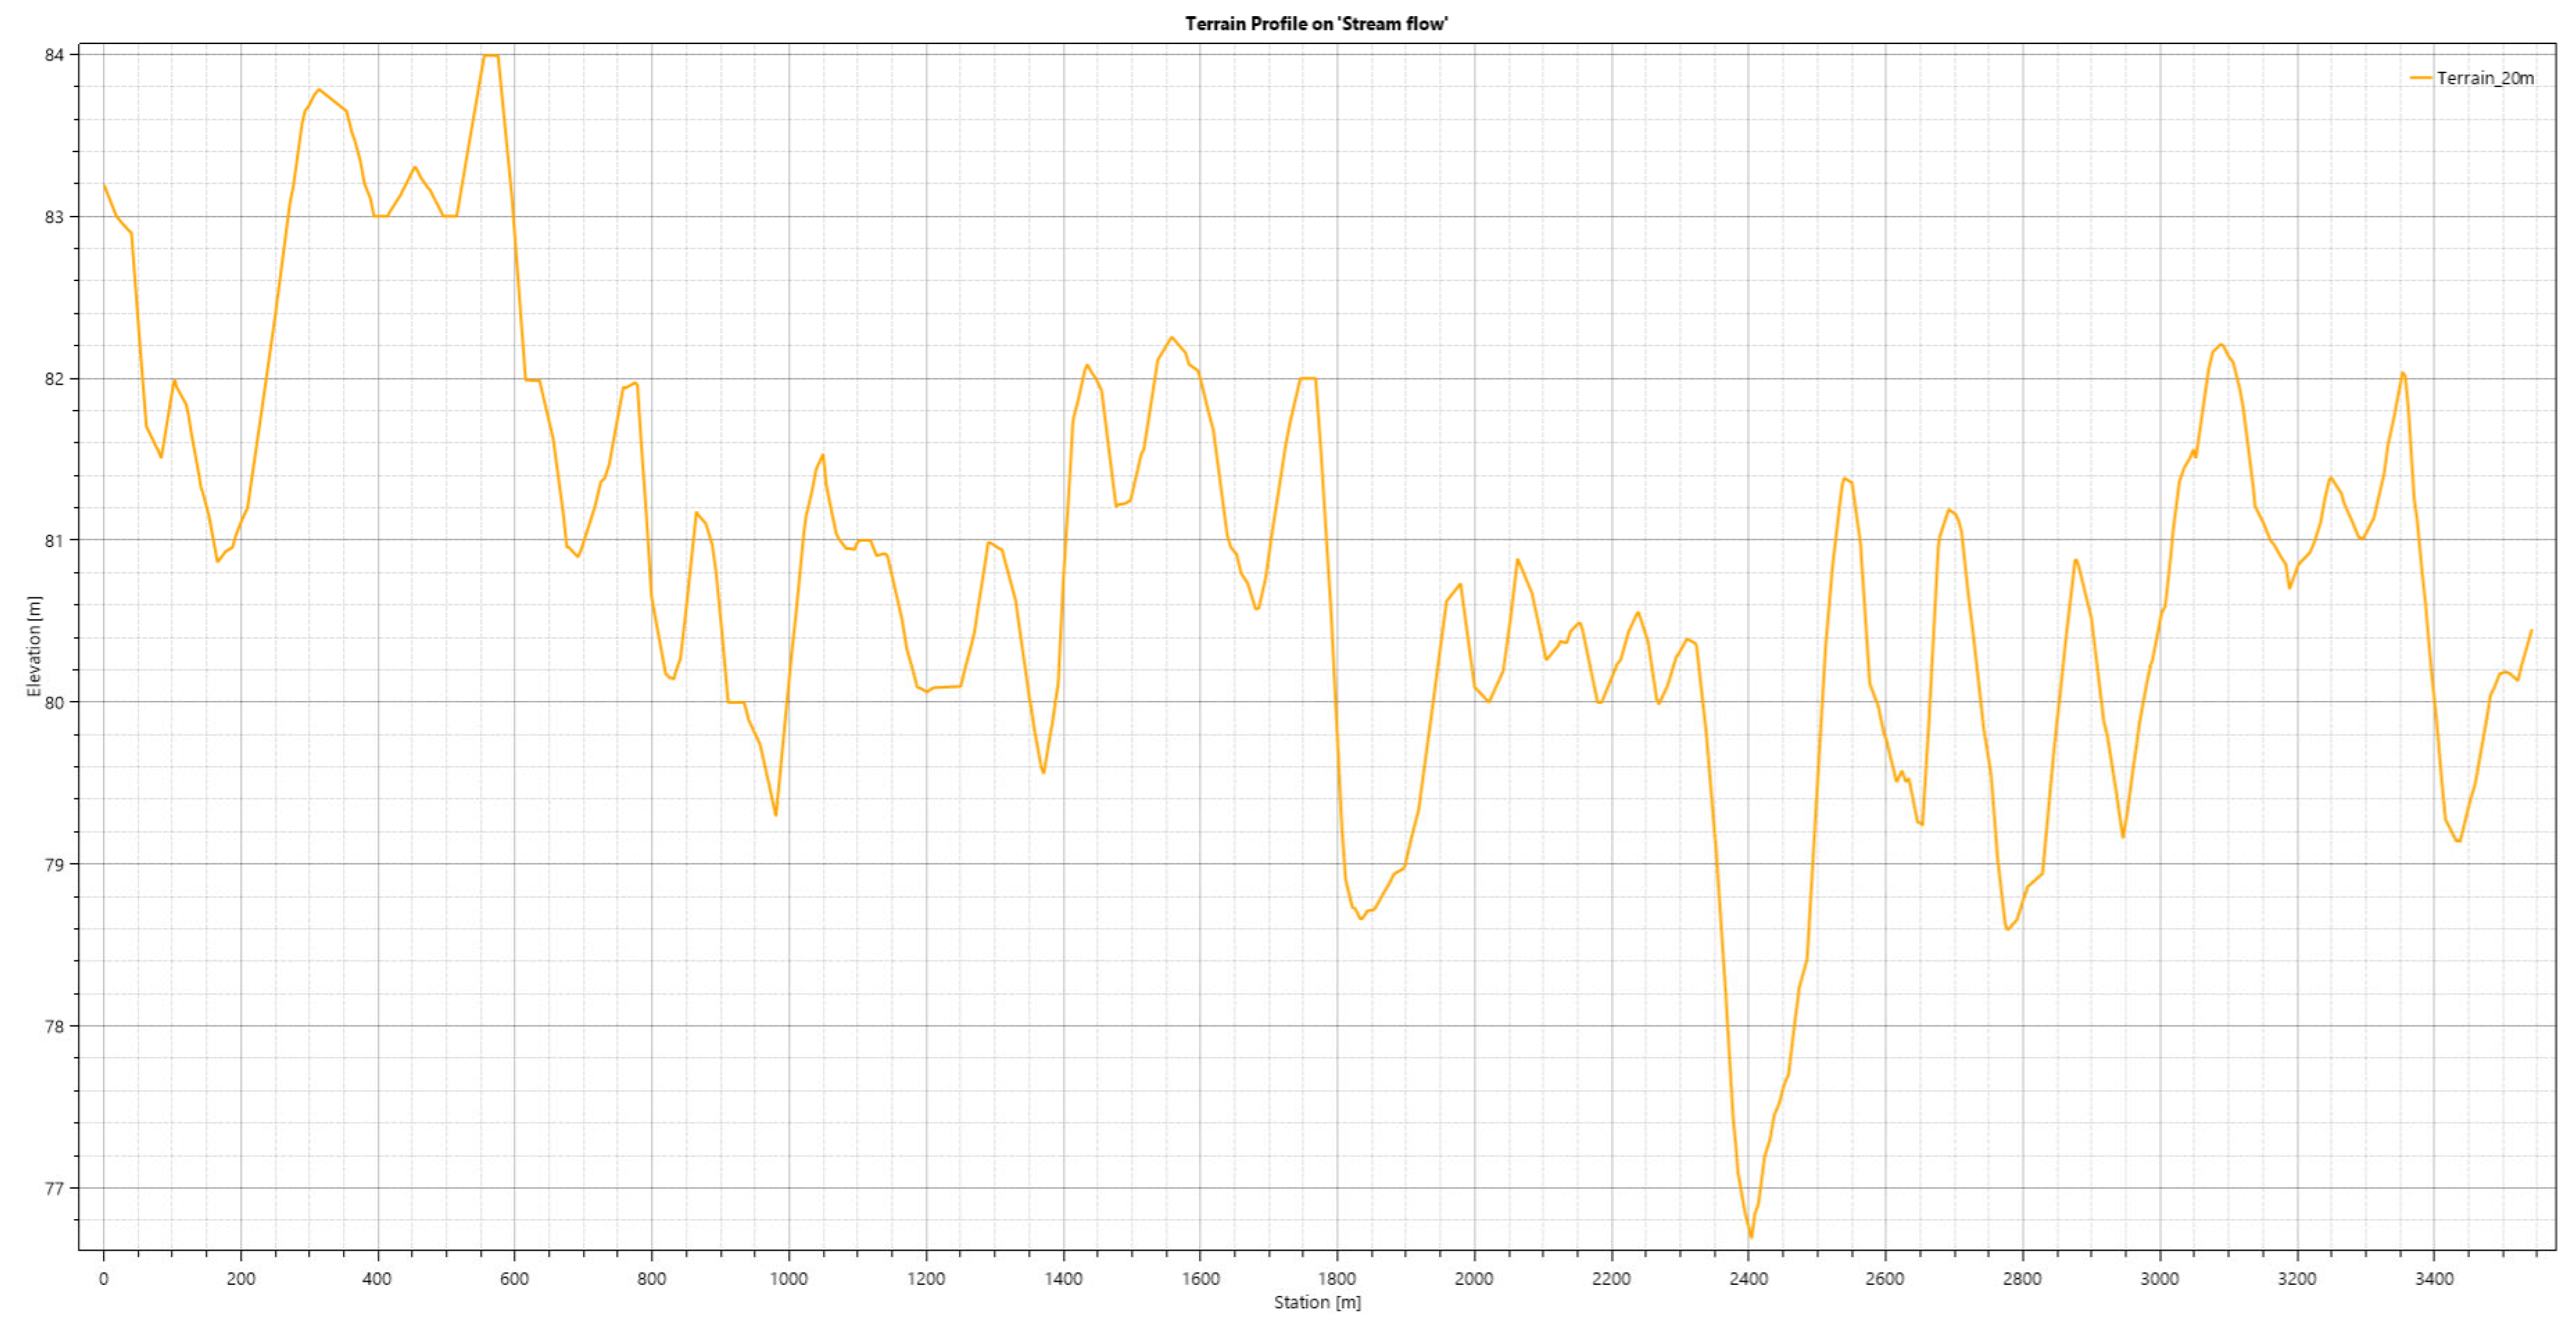
As depicted in
Figure 7, the cross-section of Tabatinga Creek illustrates the actual flow path of water during flood events of Tabatinga Creek. The terrain profile clearly shows the elevation changes and the direction in which floodwaters move along the creek. This analysis underscores the necessity for drainage improvements and flood mitigation measures along Tabatinga Creek to manage the water flow effectively. By addressing the terrain profile and flow dynamics depicted in the cross-section, infrastructure planners and policymakers can prioritise initiatives that enhance the resilience to flooding, reducing the risk of damage to local communities and infrastructure.
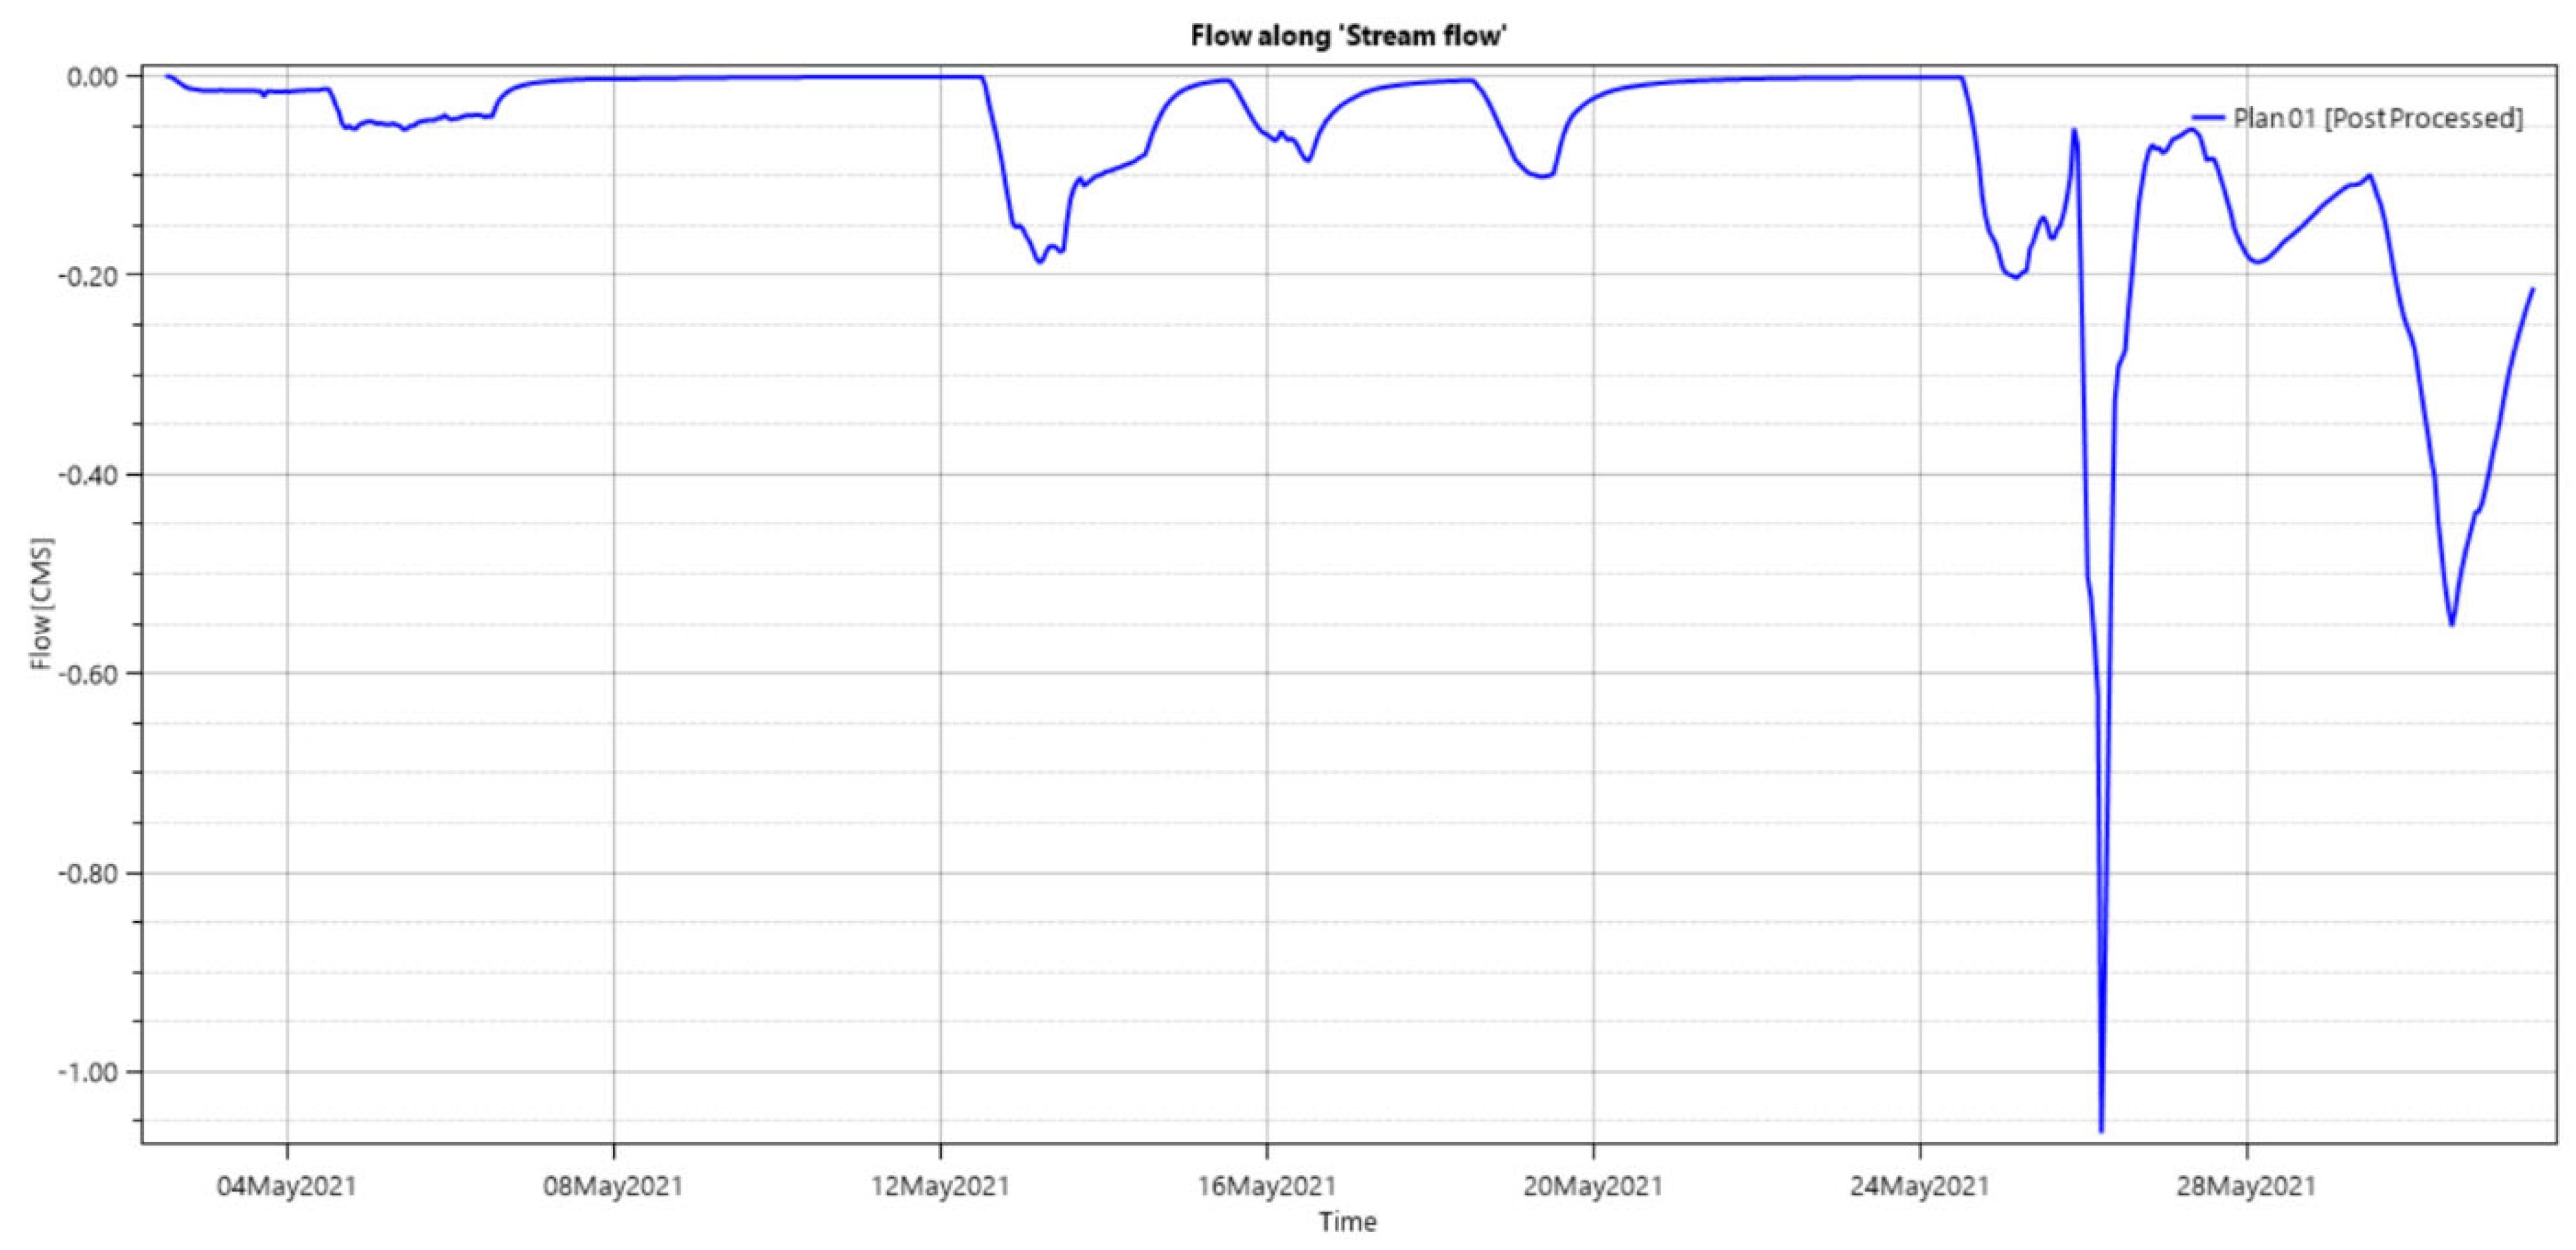
Figure 8 illustrates the minimal stream flow in Tabatinga Creek from 4 May 2021 to 24 May 2021 and highlights the significant water accumulation and overtopping of the stream channel between 26 May and 28 May 2021, resulting in the flooding of the surrounding communities. During this period of 26 and 28 May, there was a notable increase in the volume of water in the stream, indicating reduced drainage capacity and heightened vulnerability to flood events and flooding of the nearby communities, as presented. The findings here underscore the critical impact of these floodwaters on the local population and infrastructure.
3.5.2. Model Validation
The Root Mean Square Error (RMSE), a statistical measure comparing actual flood depths at specific points with predicted model depths, was calculated to validate the flood model. The validation points, located in Part A, Part B, and Part C, along the banks of the Tabatinga Canal bordering Lethem and Tabatinga, reported actual flood levels of 0.91 m, 0.45 m, and 0.5 m, respectively, during the specified period. In comparison, the model predicted flood depths of 0.88 m for Part A, 0.66 m for Part B, and 0.53 m for Part C. The RMSE computed for these points was found to be 0.1237.
Given that the predicted flood depths range from 0 to 3 m, the relative error of our model was calculated as 4.12% (0.1237/3). This low margin of error indicates that the model performed well in simulating the flood depths in the study area. The RMSE value demonstrates that the model’s predictions are closely aligned with actual flood levels reported by residents, validating its reliability and accuracy. This level of performance assures us that the model can be effectively used to predict and manage flood risks in Lethem and Tabatinga, providing a robust tool for flood risk assessment and mitigation planning in the region.
3.5.3. Uncertainty and Sensitivity Analysis
Uncertainties in the input data of the flood model encompass several key factors: rainfall estimates, topography or terrain modelling, roughness coefficients, and land use and land cover maps. These uncertainties were systematically addressed through a series of Monte Carlo simulations to assess the impact of risk and uncertainty in the HEC-RAS rain-on-grid model. Monte Carlo simulations use Python to model the probability of different outcomes using random variables, incorporating minimum and maximum rainfall thresholds of 0 mm and 48.2 mm, respectively.
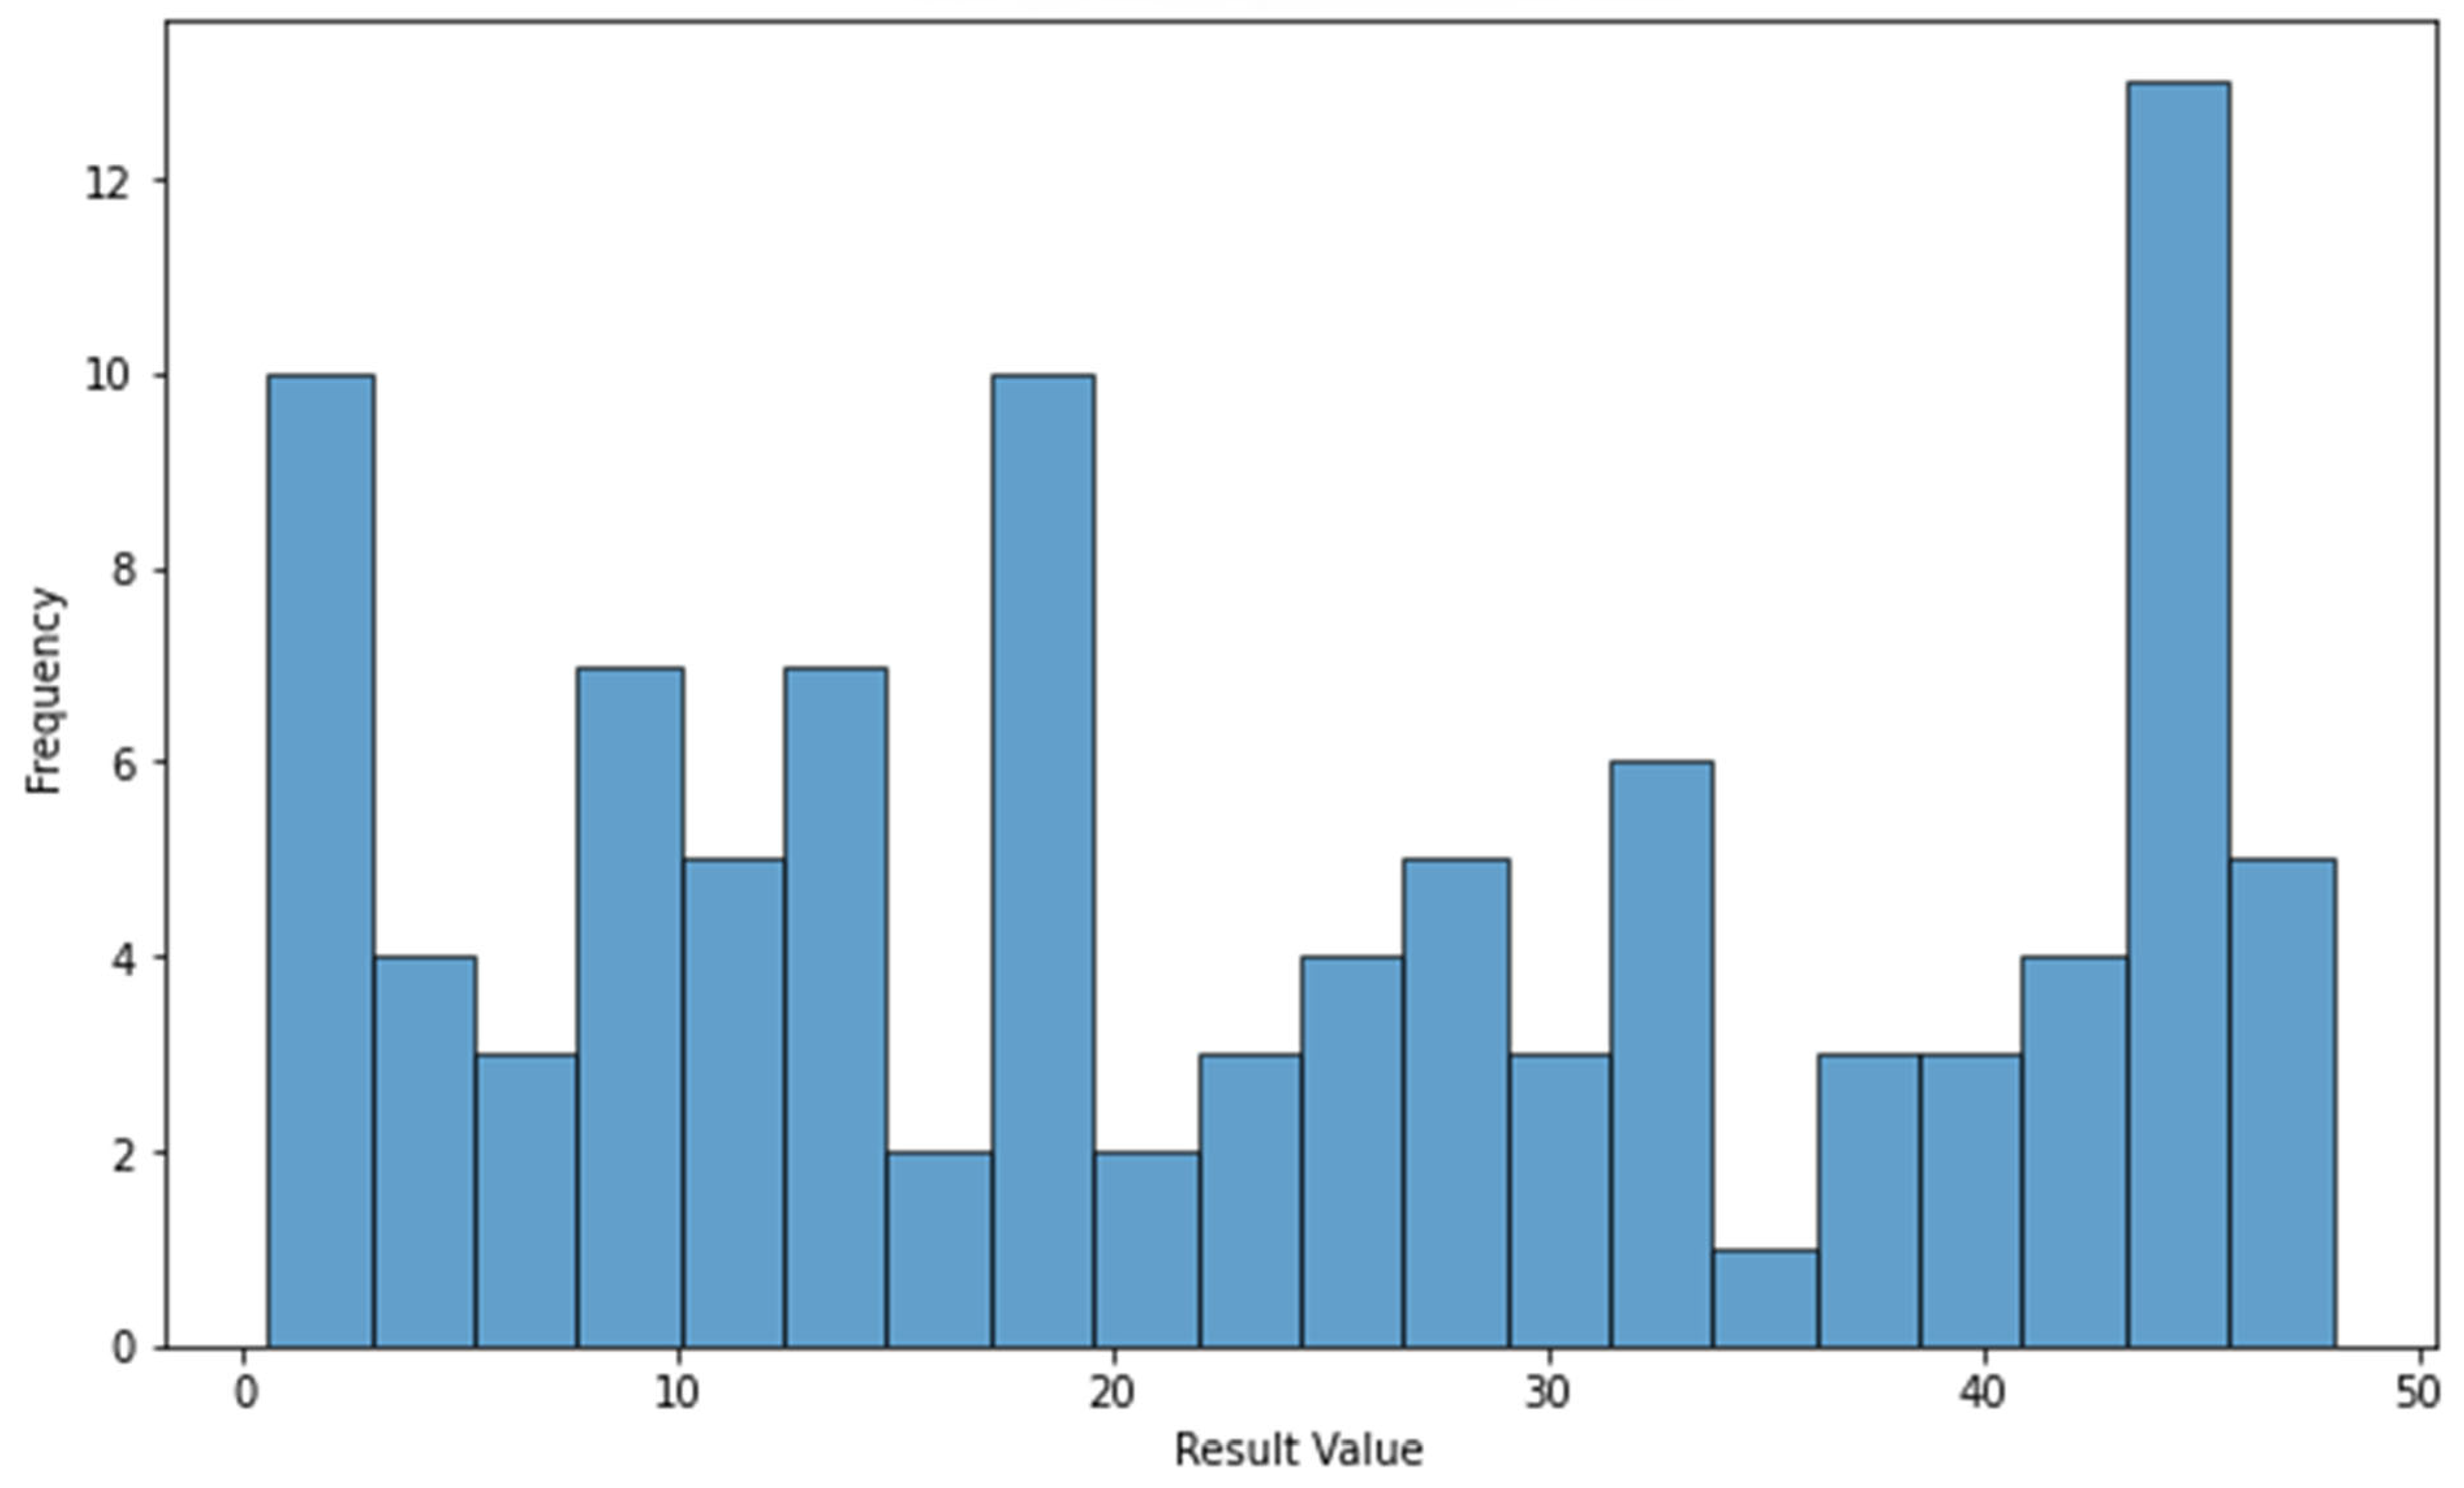
The Monte Carlo Simulation generated outputs from 100 simulations, providing a robust assessment of the model’s performance under varying conditions. The statistical analysis of the simulation results is as follows: the mean of the simulated rainfall is 24.5 mm, with a median of 24.1 mm and a standard deviation of 14.1 mm. The range of simulated rainfall spans from a minimum of 0.1 mm to a maximum of 48.1 mm, illustrating the variability in rainfall scenarios considered in the simulations. Percentile values further characterise the distribution of simulated rainfall: the 5th percentile is 2.5 mm, the 25th percentile is 12.4 mm, the 50th percentile (median) is 24.1 mm, the 75th percentile is 36.8 mm, and the 95th percentile is 45.9 mm. These percentile values provide insights into the likelihood of experiencing different levels of rainfall intensity during flood events, aiding in the preparation of risk-based flood management strategies.
Addressing uncertainties in input data is critical for ensuring the reliability and accuracy of flood modelling and risk assessment. The Monte Carlo Simulation approach effectively quantifies the uncertainties associated with rainfall estimates, terrain modelling, roughness coefficients, and land use data in the HEC-RAS rain-on-grid model. By generating a broad range of rainfall scenarios, the simulations comprehensively understand the potential outcomes and their associated probabilities. This information is invaluable for decision-makers and planners tasked with developing flood risk management strategies that are robust and adaptive to varying environmental conditions and uncertainties.
Figure 9 illustrates a slightly right-skewed distribution derived from the Monte Carlo simulations, suggesting that most simulations fall on the higher end of the parameter range. While most rainfall values are concentrated toward the lower end, occasional high values are on the distribution’s right tail. These infrequent but impactful high values contribute to the overall distribution, highlighting the potential risk of flooding events. The skewed distribution indicates that while average rainfall values are more common, higher rainfall intensities could lead to significant flooding, emphasising the importance of preparing for and mitigating extreme weather events in flood risk management strategies.
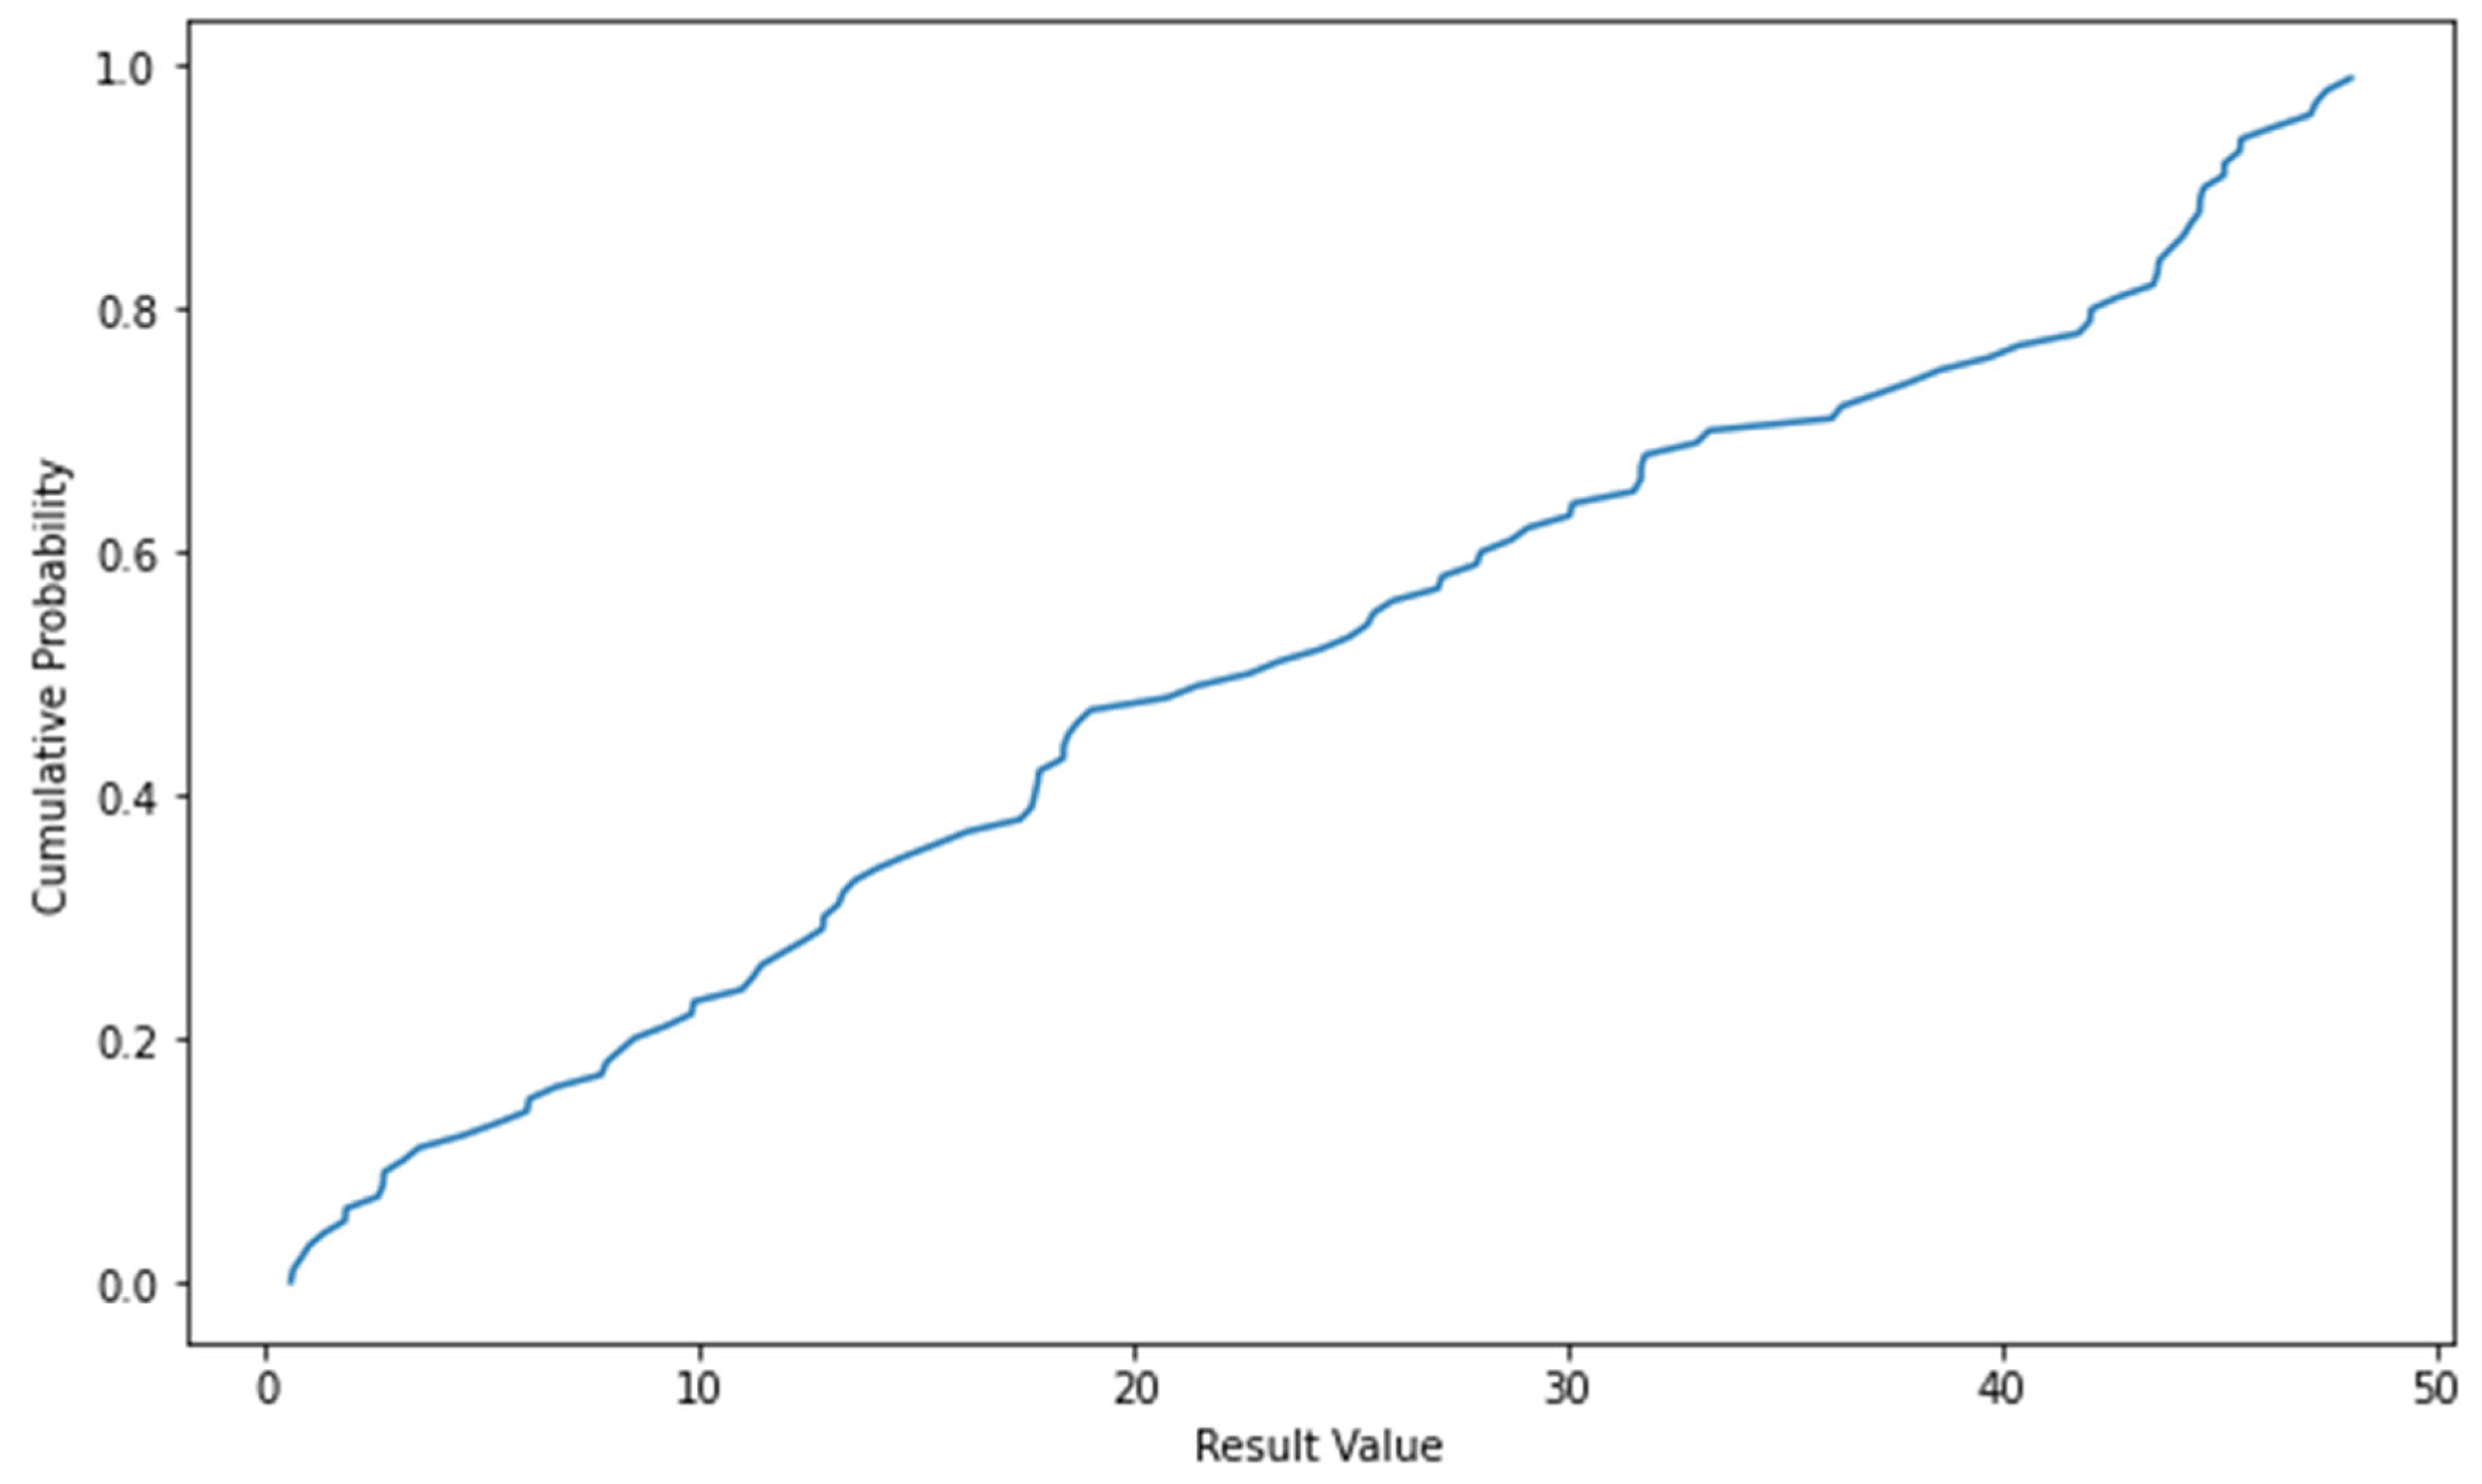
The Cumulative Density Function (CDF) provides insight into the likelihood of various outcomes based on the Monte Carlo simulation data (
Figure 10). At
x = 20 mm, the CDF value is 0.5, indicating a 50% probability that the simulated rainfall will be 20 mm or less. This value is the median or 50th percentile, directly inferred from the CDF plot. The CDF plot allows for understanding the distribution of simulated rainfall outcomes, showing how likely different rainfall intensities are during flood events. It is a crucial tool for assessing the risk of flooding and planning appropriate flood management measures based on different rainfall scenarios.
The uncertainty analysis quantifies the model’s uncertainty by generating key statistical parameters describing the simulation results’ central tendency and spread. The analysis reveals that the model has a mean or central tendency of 24.5 mm under the specified conditions. This indicates the average simulated rainfall expected during the flood event. The model also exhibits moderate variability, with a standard deviation of 14.1 mm, showing how much the simulated rainfall values typically deviate from the mean. This information is essential for understanding the reliability and robustness of the flood model, allowing decision-makers to better prepare for and mitigate flood risks in Lethem and Tabatinga based on the model’s outputs.
3.5.4. Data Limitations
The data quality used in the HEC-RAS rain-on-grid model was crucial for producing reliable flood simulations. Primary data sources included rainfall data from CHIRPS, topography data from Planet.com, and land use/land cover data from Living Atlas of the World (
https://livingatlas.arcgis.com/). These reputable and widely used sources provide a solid foundation for the model. However, the availability of historical flood records was limited, and anecdotal information was obtained from residents and stakeholders in the study areas. This lack of historical data posed challenges in accurately calibrating the model and understanding the full extent of flood risk in the Region.
The digital elevation or topographical data used in the model had a spatial resolution of 30 m, reclassified to 20 m. While this resolution was adequate for many purposes, it may not have captured every minute detail in the study areas. Additionally, the rainfall data was available daily, whereas an hourly rate would have been preferable for more accurate tracking of short-term flooding events. These model-building and calibration limitations were primarily due to data scarcity and the high costs of acquiring higher spatial and temporal resolution data. For instance, acquiring lidar data could have provided higher-resolution terrain data, but it was cost-prohibitive. Similarly, there were no functioning automatic weather stations available from private or government entities for hourly rainfall data, and satellite estimates of hourly rainfall did not correlate well with ground station data, which recorded 24 h rainfall. Despite these challenges, the CHIRPS 24 h rainfall datasets showed high correlations with ground station data, providing a reliable basis for the model’s rainfall inputs.
3.5.5. 10-Year Return Period
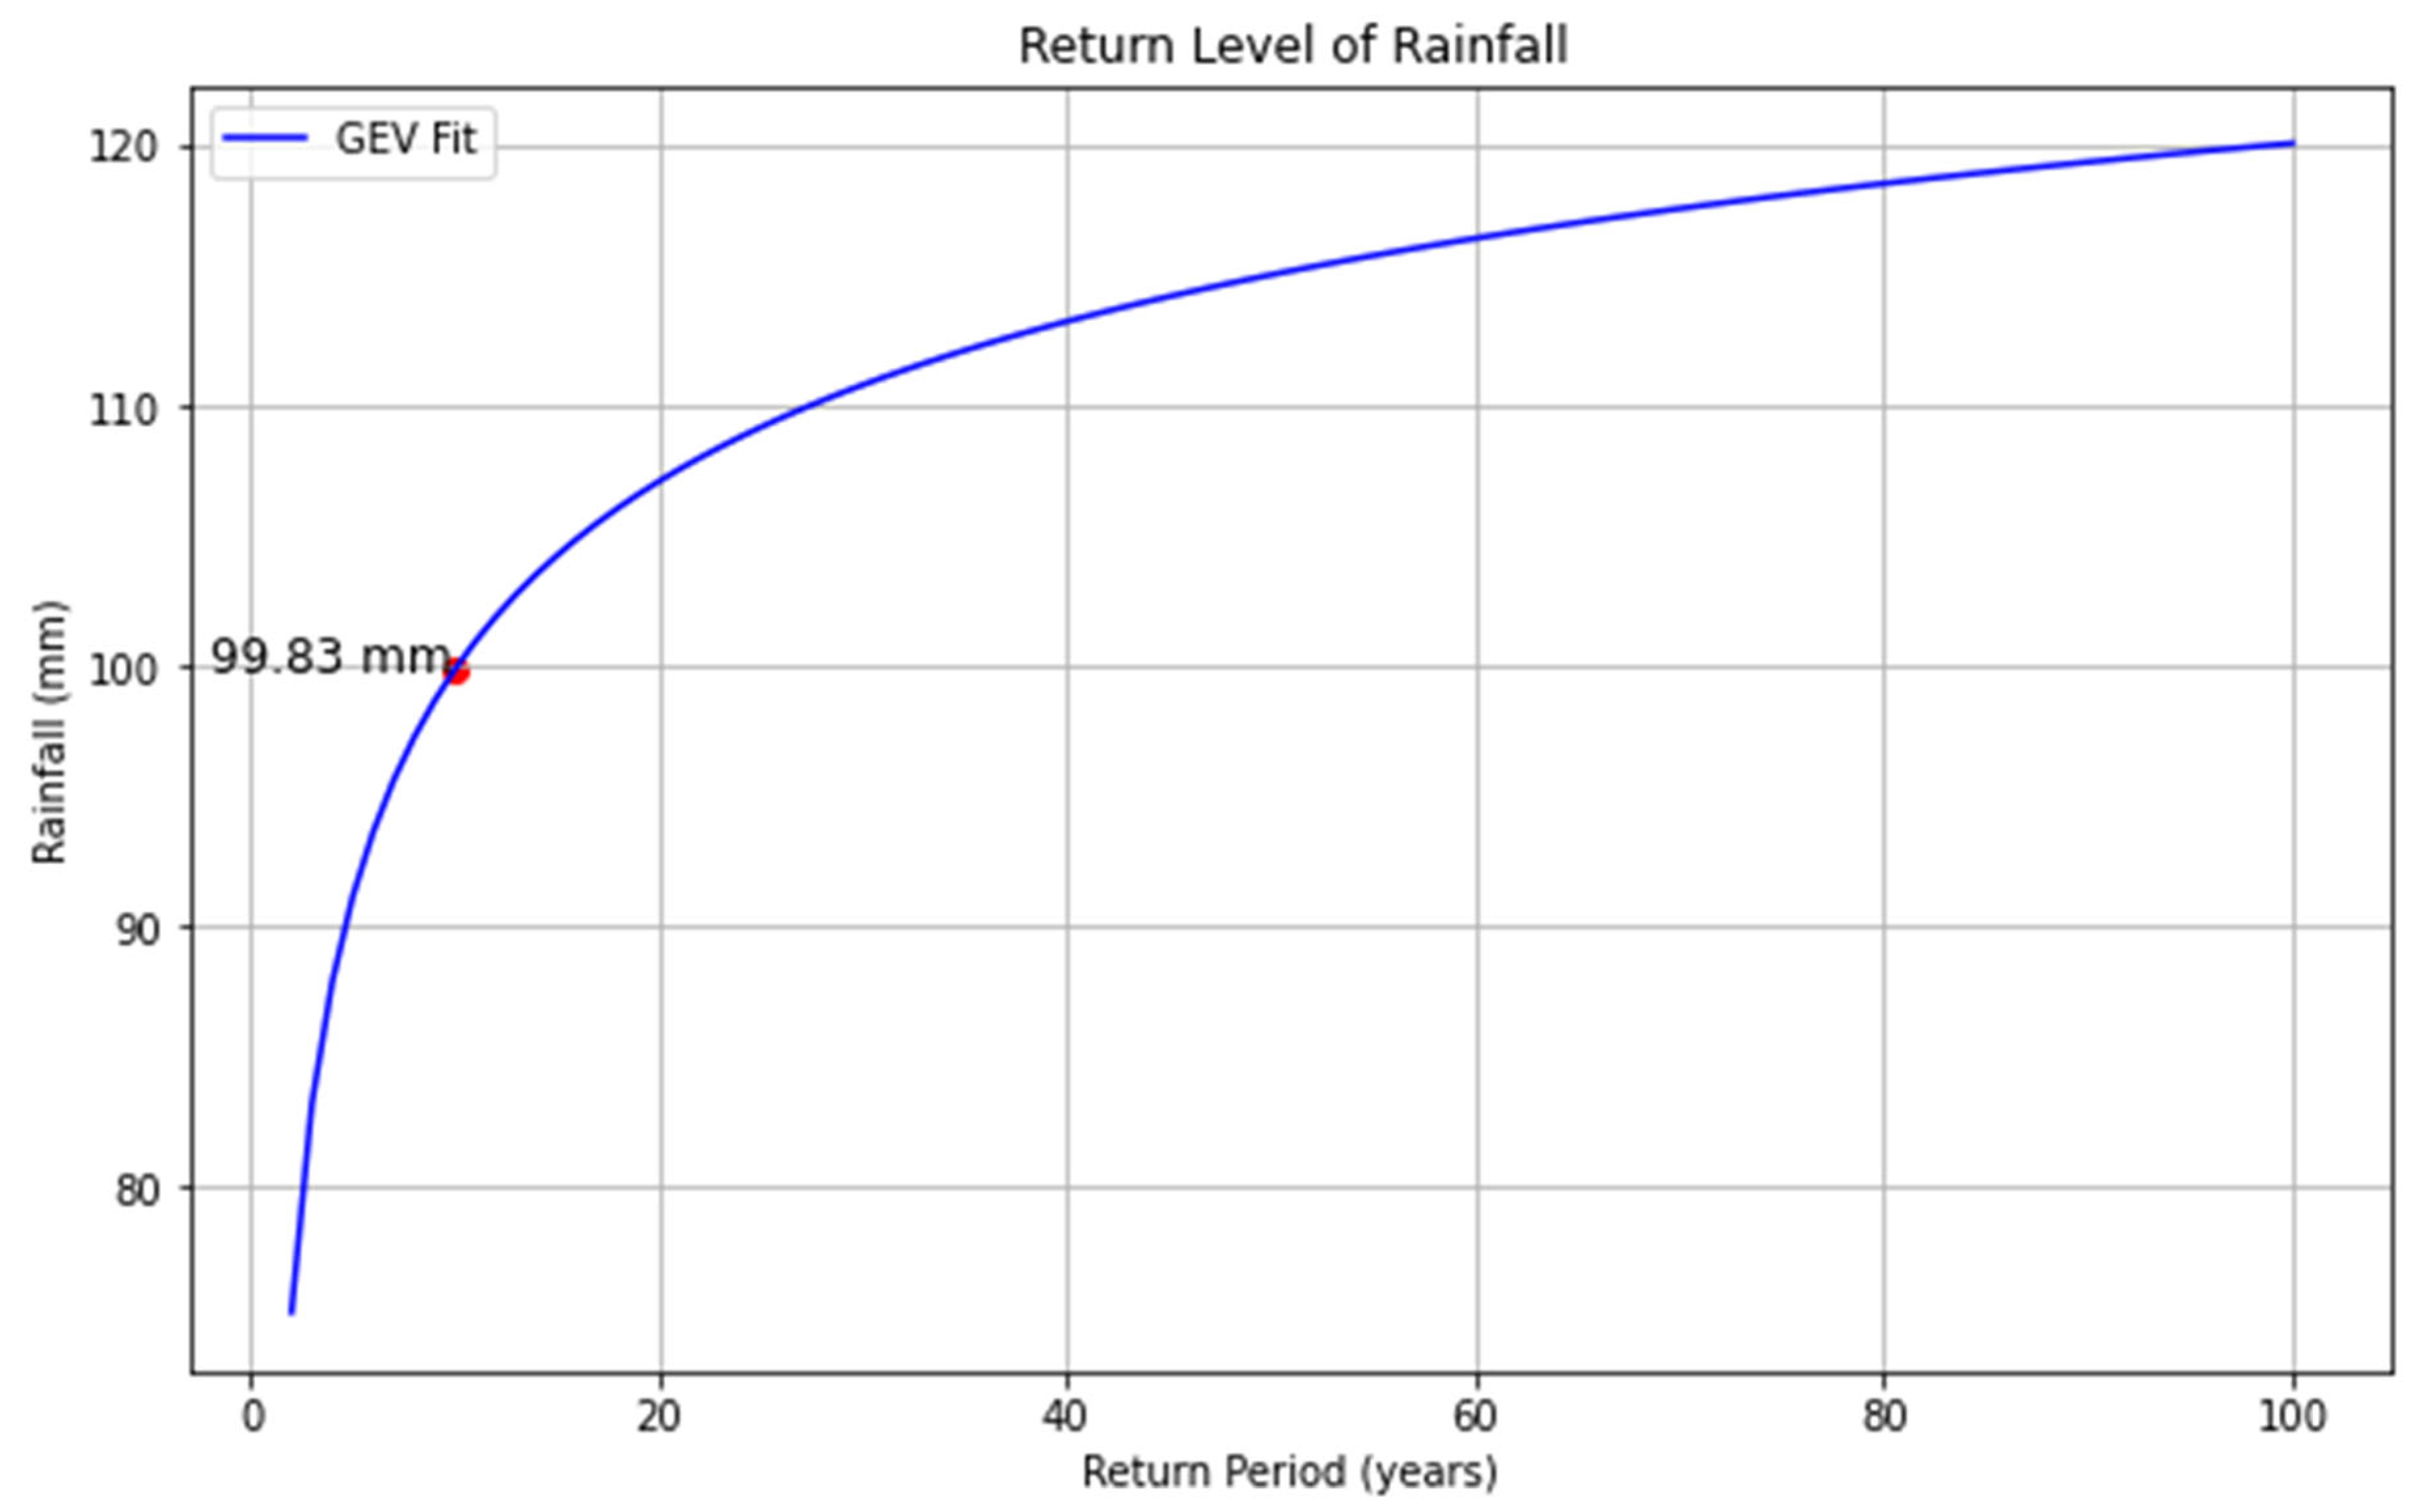
An essential consideration in flood risk analysis for Lethem and Tabatinga is the impact of climate change on the local rainfall regime. It is widely acknowledged that global warming will likely increase the frequency and intensity of extreme meteorological events, including heavy rainfall and flooding. Understanding the intensity and likelihood of rainfall events for specific return periods, such as the 10-year return period, is crucial for assessing and preparing for flood risks in these areas. Incorporating this parameter into flood risk management, urban planning, infrastructure design, emergency preparedness, and environmental management strategies can significantly enhance their effectiveness. Return periods are calculated using historical rainfall data spanning several decades. A probability distribution is fitted to observed rainfall data, and this distribution curve is used to estimate rainfall levels corresponding to different return periods. For instance, using the Generalised Extreme Value (GEV) distribution and daily rainfall estimates from CHIRPS for the period 1 January 1981, to 31 March 2024, the rainfall estimated for a 10-year return period is approximately 100 mm (
Figure 11). In any given year, there is a 10% chance that the area will experience rainfall exceeding this threshold, potentially leading to flooding, especially when compared to the established 71 mm rainfall over 7 days.
Understanding these probabilities is critical for developing effective flood risk management strategies. By quantifying the likelihood of extreme rainfall events, stakeholders can make informed decisions about infrastructure resilience, emergency response preparedness, and environmental protection measures. This approach ensures that Lethem and Tabatinga are better prepared to mitigate and adapt to the increasing risks posed by climate change-induced extreme weather events, thereby safeguarding communities and enhancing overall resilience to floods and other natural disasters that may be triggered by rainfall.
3.6. Overview of the Implemented NBSs
3.6.1. Flood Conveyance Solution (FCS) Implementation for Tabatinga
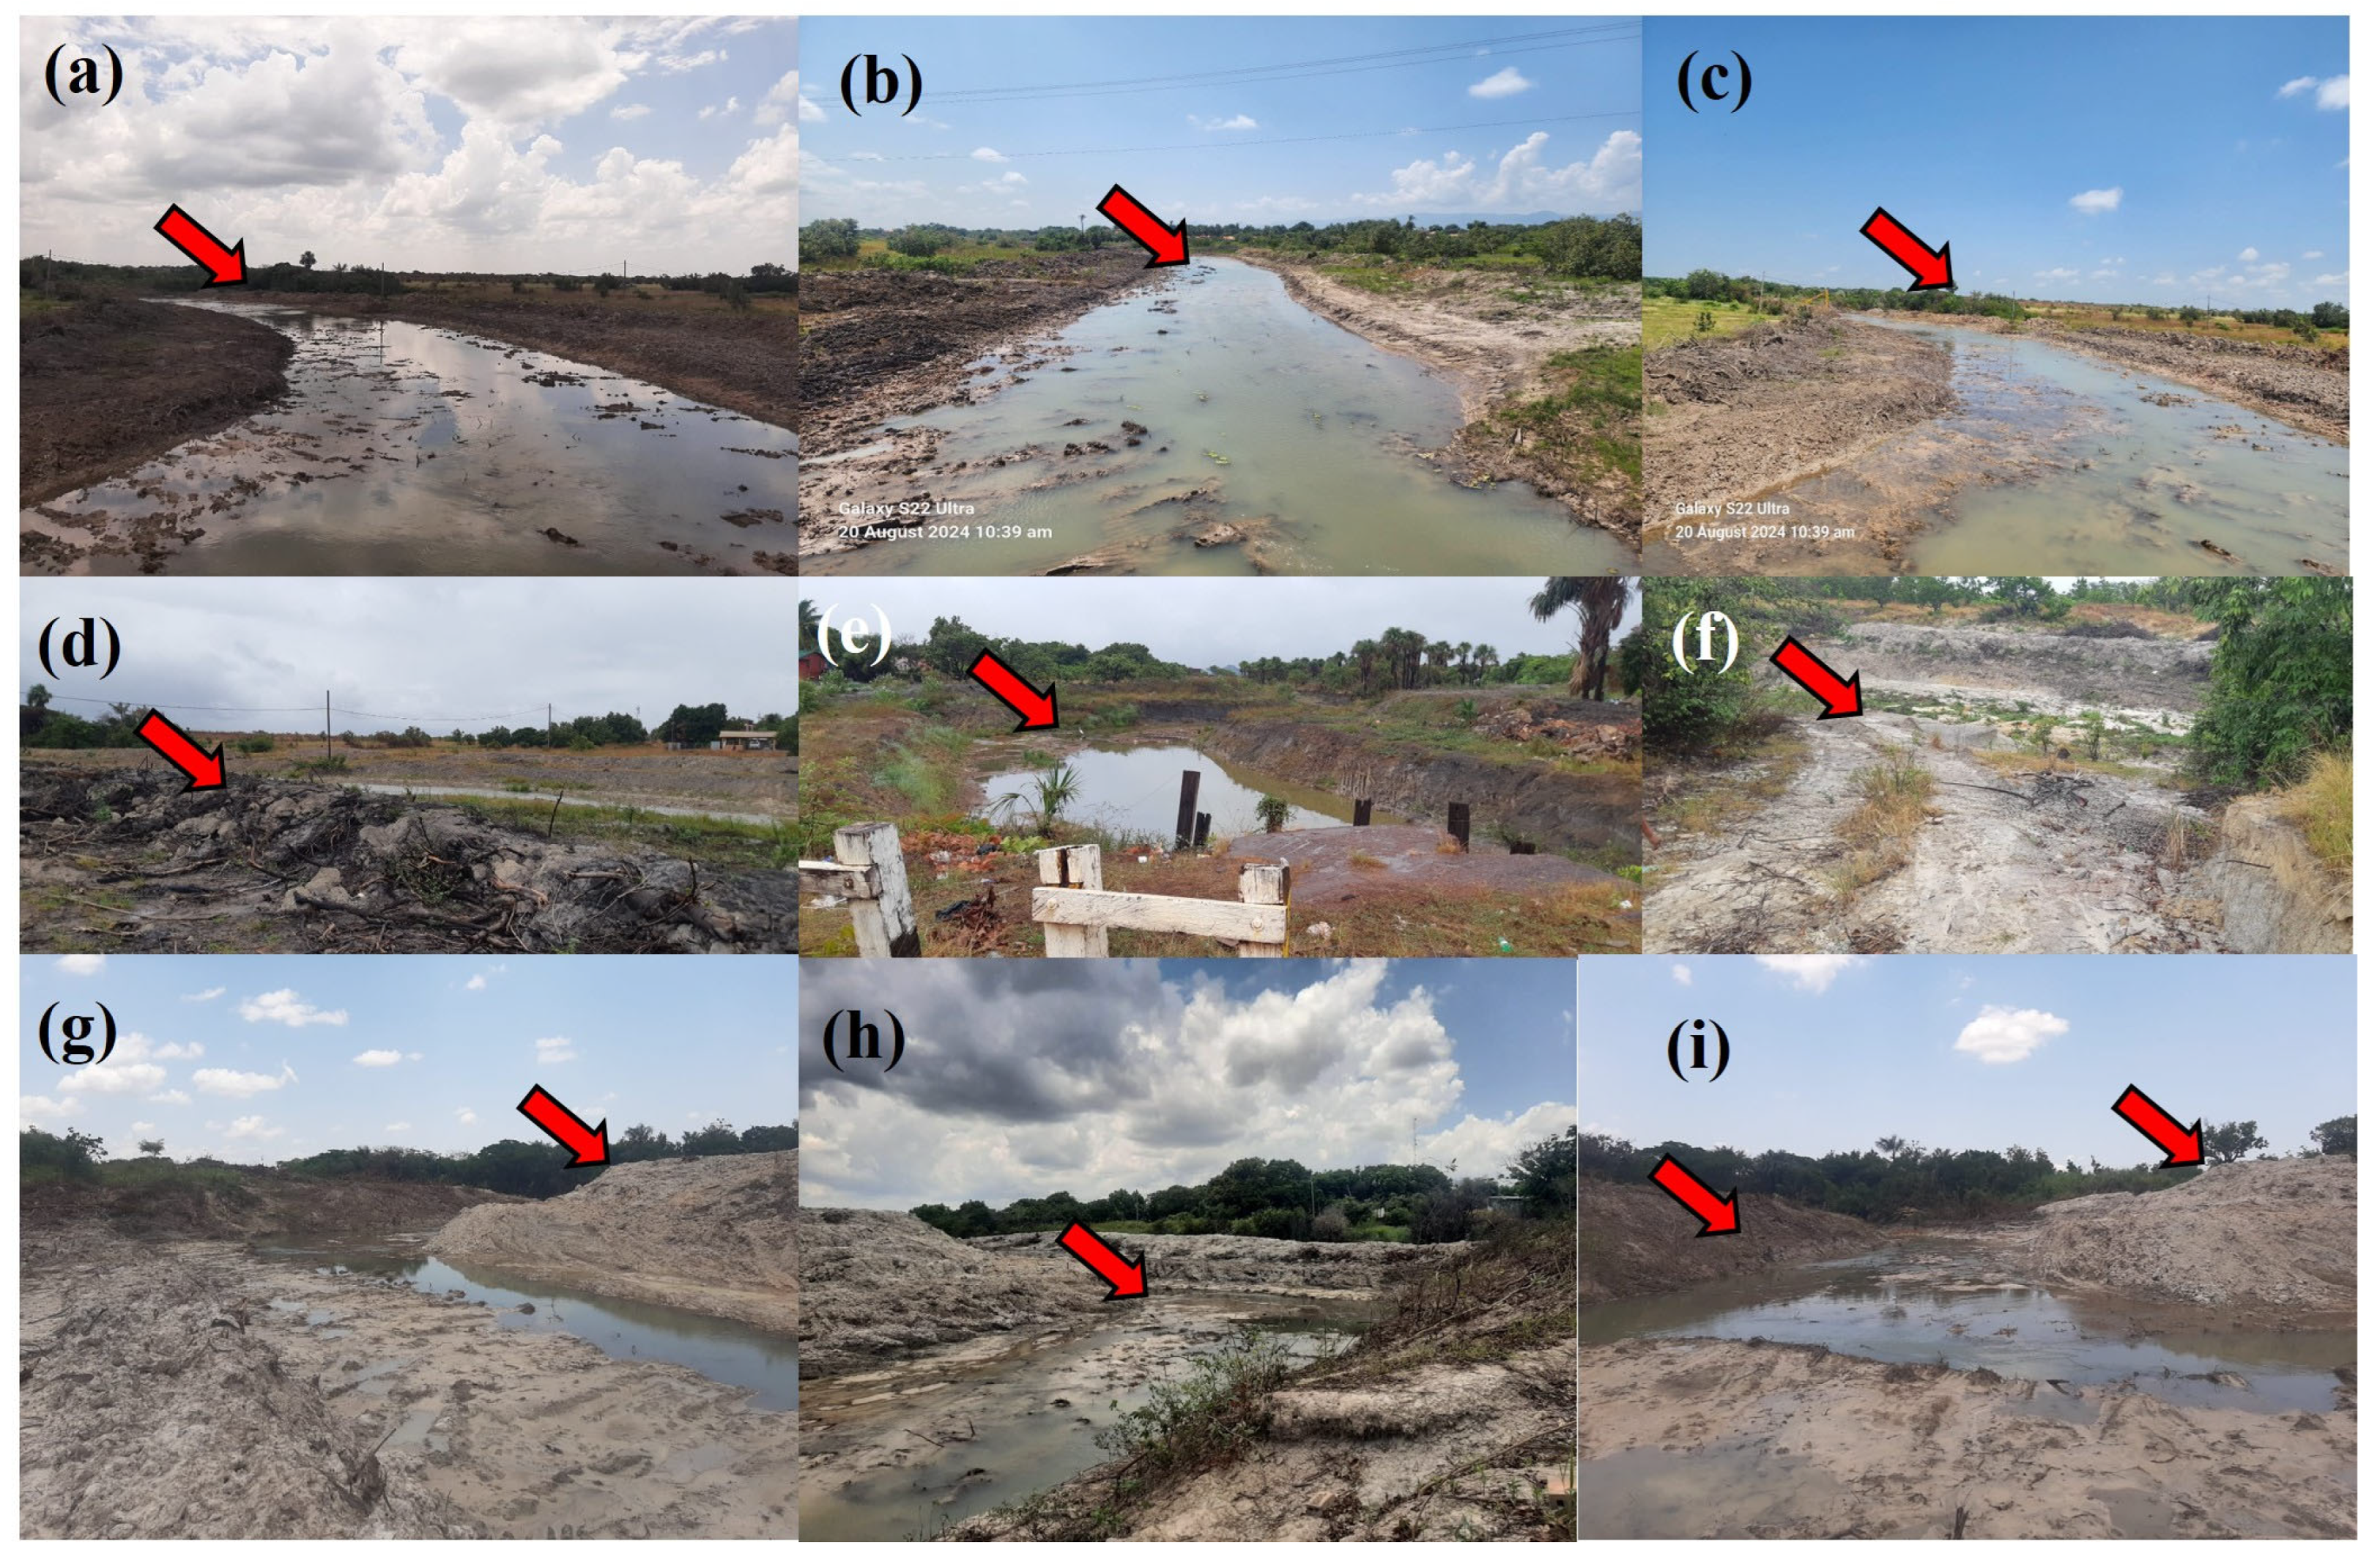
Flood conveyance solutions are integral to nature-based flood management strategies, enhancing a river’s capacity to accommodate high discharge events, such as heavy and continuous rainfall (
Figure 12 and
Figure 13). Improving the drainage infrastructure of the areas facilitates the swift conveyance and release of stormwater downstream, thus mitigating the risk of local flooding. By enabling efficient flow and drainage, flood conveyance solutions reduce the likelihood of flash floods in downstream areas and help prevent the accumulation of water that can lead to devastating inundation. These interventions focused on natural drainage patterns and channel morphology, harnessing the power of natural processes to enhance flood resilience, protect communities, and promote sustainable water management practices within riverine landscapes.
With the engagement and support of the Town Council, we implemented a Flood Conveyance Solution (FCS) as a strategic, nature-based approach to manage and mitigate flood risks in Tabatinga by efficiently moving excess water away from vulnerable areas into the Tabatinga Canal. The process we followed for this intervention is described in this subsection.
Examples of the benefits which we do hope the implemented FCS intervention would deliver to the Tabatinga Community, the implementation area, include but are not limited to
- -
Flood Risk Reduction: We hope that after this implementation, the FCS will help to mitigate the impacts of flooding by efficiently conveying excess water away from vulnerable areas, reducing property damage, and protecting lives.
- -
Infrastructure Protection: By diverting floodwaters away from critical infrastructure such as roads, bridges, utilities, and buildings, we hope that the implementation of the FCS would help to safeguard essential services and economic assets.
- -
Enhanced Resilience: We do hope that implementing FCS improves the resilience of communities to climate change and extreme weather events by providing reliable flood management infrastructure and reducing vulnerability to flood hazards.
- -
Economic Benefits: Avoiding flood damage through effective conveyance solutions can result in significant cost savings for communities and governments regarding disaster recovery, emergency response, and infrastructure repair.
- -
Environmental Benefits: We do hope that the implemented FCS infrastructure can minimise adverse environmental impacts by preserving natural habitats, maintaining water quality, and supporting ecosystem functions such as groundwater recharge and sediment transport.
- -
Community Safety and Well-being: By reducing the risk of flooding and associated hazards, FCS enhances community safety, public health, and overall quality of life for residents and stakeholders.
The Flood Conveyance Solution (FCS) was designed to enhance the natural drainage capacity of Tabatinga by improving the river’s ability to manage large volumes of water during high discharge events. The intervention focused on expanding existing natural channels and creating new ones, desilting the creek, and strategically placing conduits to allow water to flow more freely and efficiently.
3.6.2. Implementation of Water Storage and Bio-Retention Solutions (BRS) in Lethem
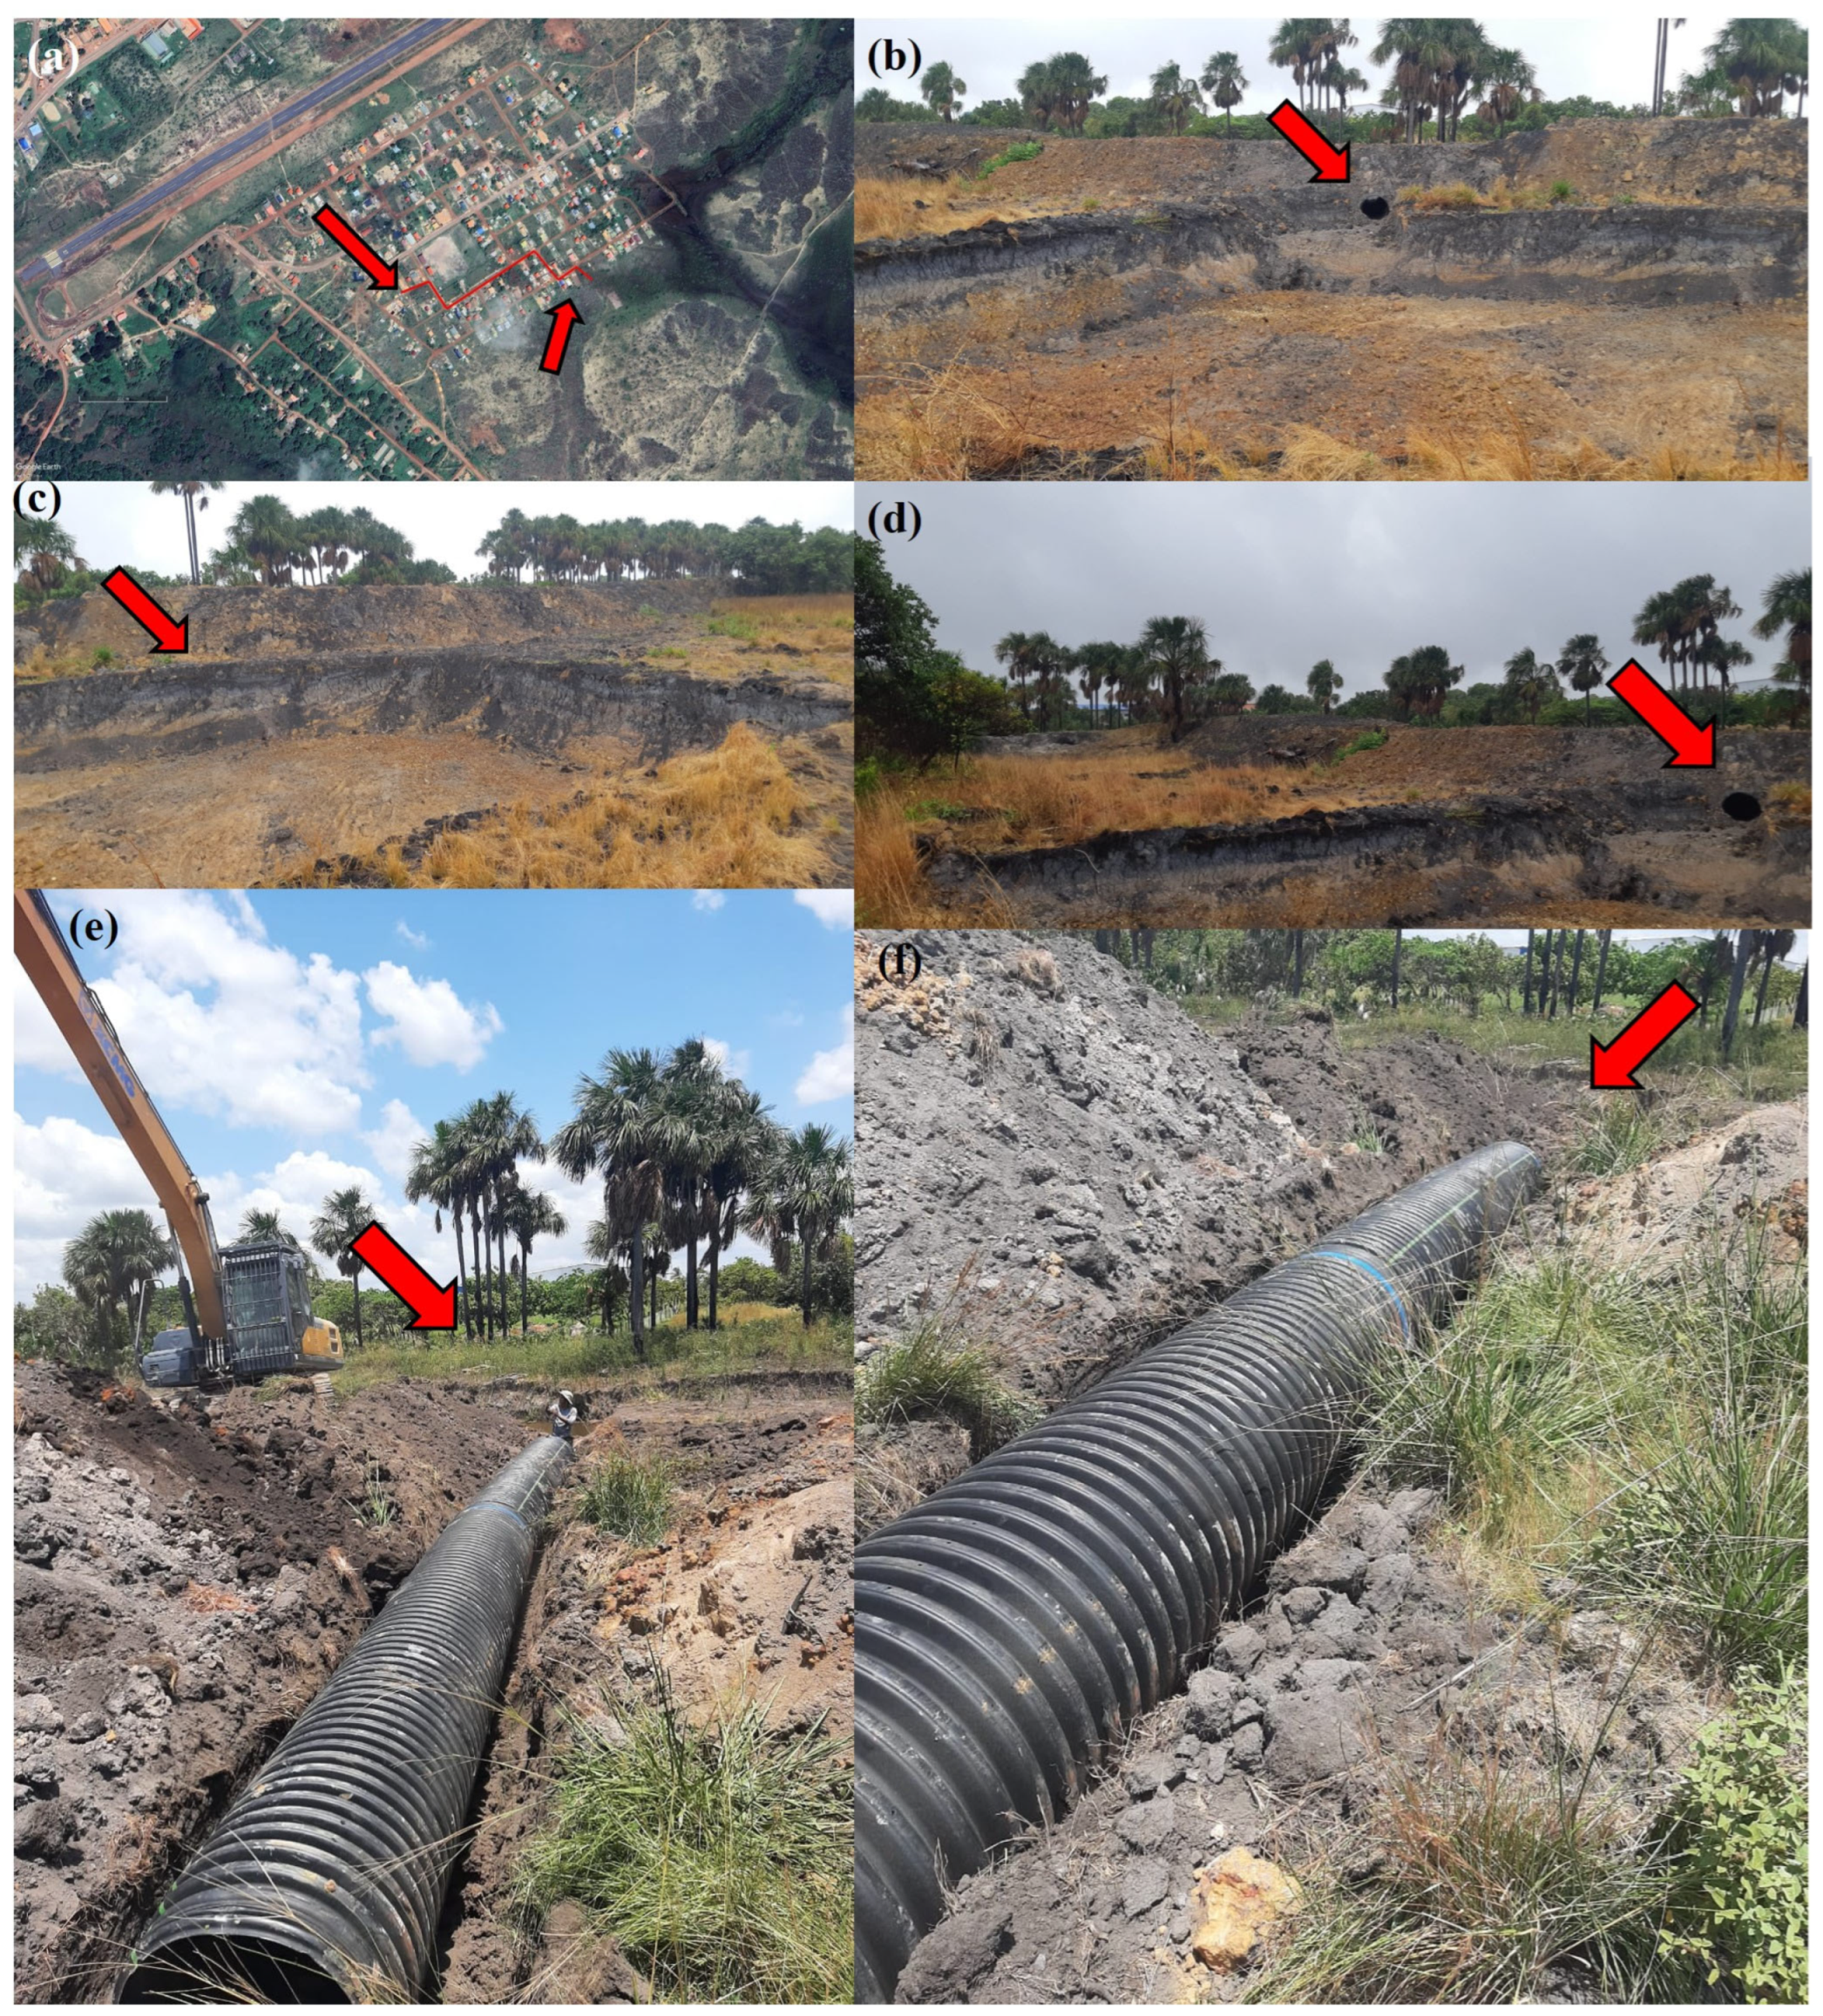
As part of bio-retention Nature-Based Solutions, water retention and detention play a crucial role in mitigating the impacts of high discharge events, such as heavy rainfall. These solutions involve creating temporary storage systems to smooth out stormwater runoff peaks (
Figure 14). By capturing excess water during intense rain, these retention and detention structures help prevent immediate flooding and reduce the strain on downstream river networks. The stored water is gradually released into the environment through natural processes such as infiltration and evapotranspiration, replenishing groundwater reserves and sustaining river flows during dry periods. This approach safeguards against flooding, promotes water security, enhances ecosystem resilience, and fosters sustainable water management practices within riverine ecosystems.
We implemented water storage and Bio-retention Solutions (BRSs) as Nature-Based Solutions for Culvert City in Lethem, and the steps involved are presented in this subsection.
Examples of benefits which we do hope this intervention will deliver to the implementation area include but are not limited to
- -
Flood Mitigation: BRS can reduce the risk of flooding by capturing and storing rainwater, slowing down runoff, and reducing peak flows.
- -
Water Quality Improvement: Bio-retention systems can filter pollutants from stormwater runoff, improving water quality in rivers, streams, and groundwater.
- -
Groundwater Recharge: Water storage solutions such as infiltration basins and permeable pavements can replenish groundwater supplies, contributing to water security.
- -
Climate Resilience: Implementing this Nature-Based Solution could enhance the resilience of communities to climate change impacts such as increased rainfall intensity and prolonged droughts.
- -
Community Engagement and Social Benefits: Involving local communities in the planning, implementation, and maintenance of BRS fosters social cohesion, creates green spaces for recreation, and improves overall quality of life.
3.7. Assessment of the Post-Implementation: Evaluation and Modelling
Implementing Nature-Based Solutions (NBSs) in Tabatinga and the Culvert City Housing Scheme in Lethem marks a significant milestone in enhancing flood resilience across the Municipality of Lethem. With these interventions, all five constituencies within the municipality have now been integrated into a broader flood mitigation strategy, ensuring that key vulnerable areas benefit from improved water management solutions. By addressing the recurrent flooding challenges, these measures are expected to reduce the frequency and severity of flood events, mitigating the socio-economic and environmental impacts historically experienced by residents. It is anticipated that moving forward, none of the areas benefiting from these interventions will experience the magnitude of flooding recorded in previous years. However, a structured post-implementation assessment is required to determine the effectiveness of these solutions and provide insights for future improvements.
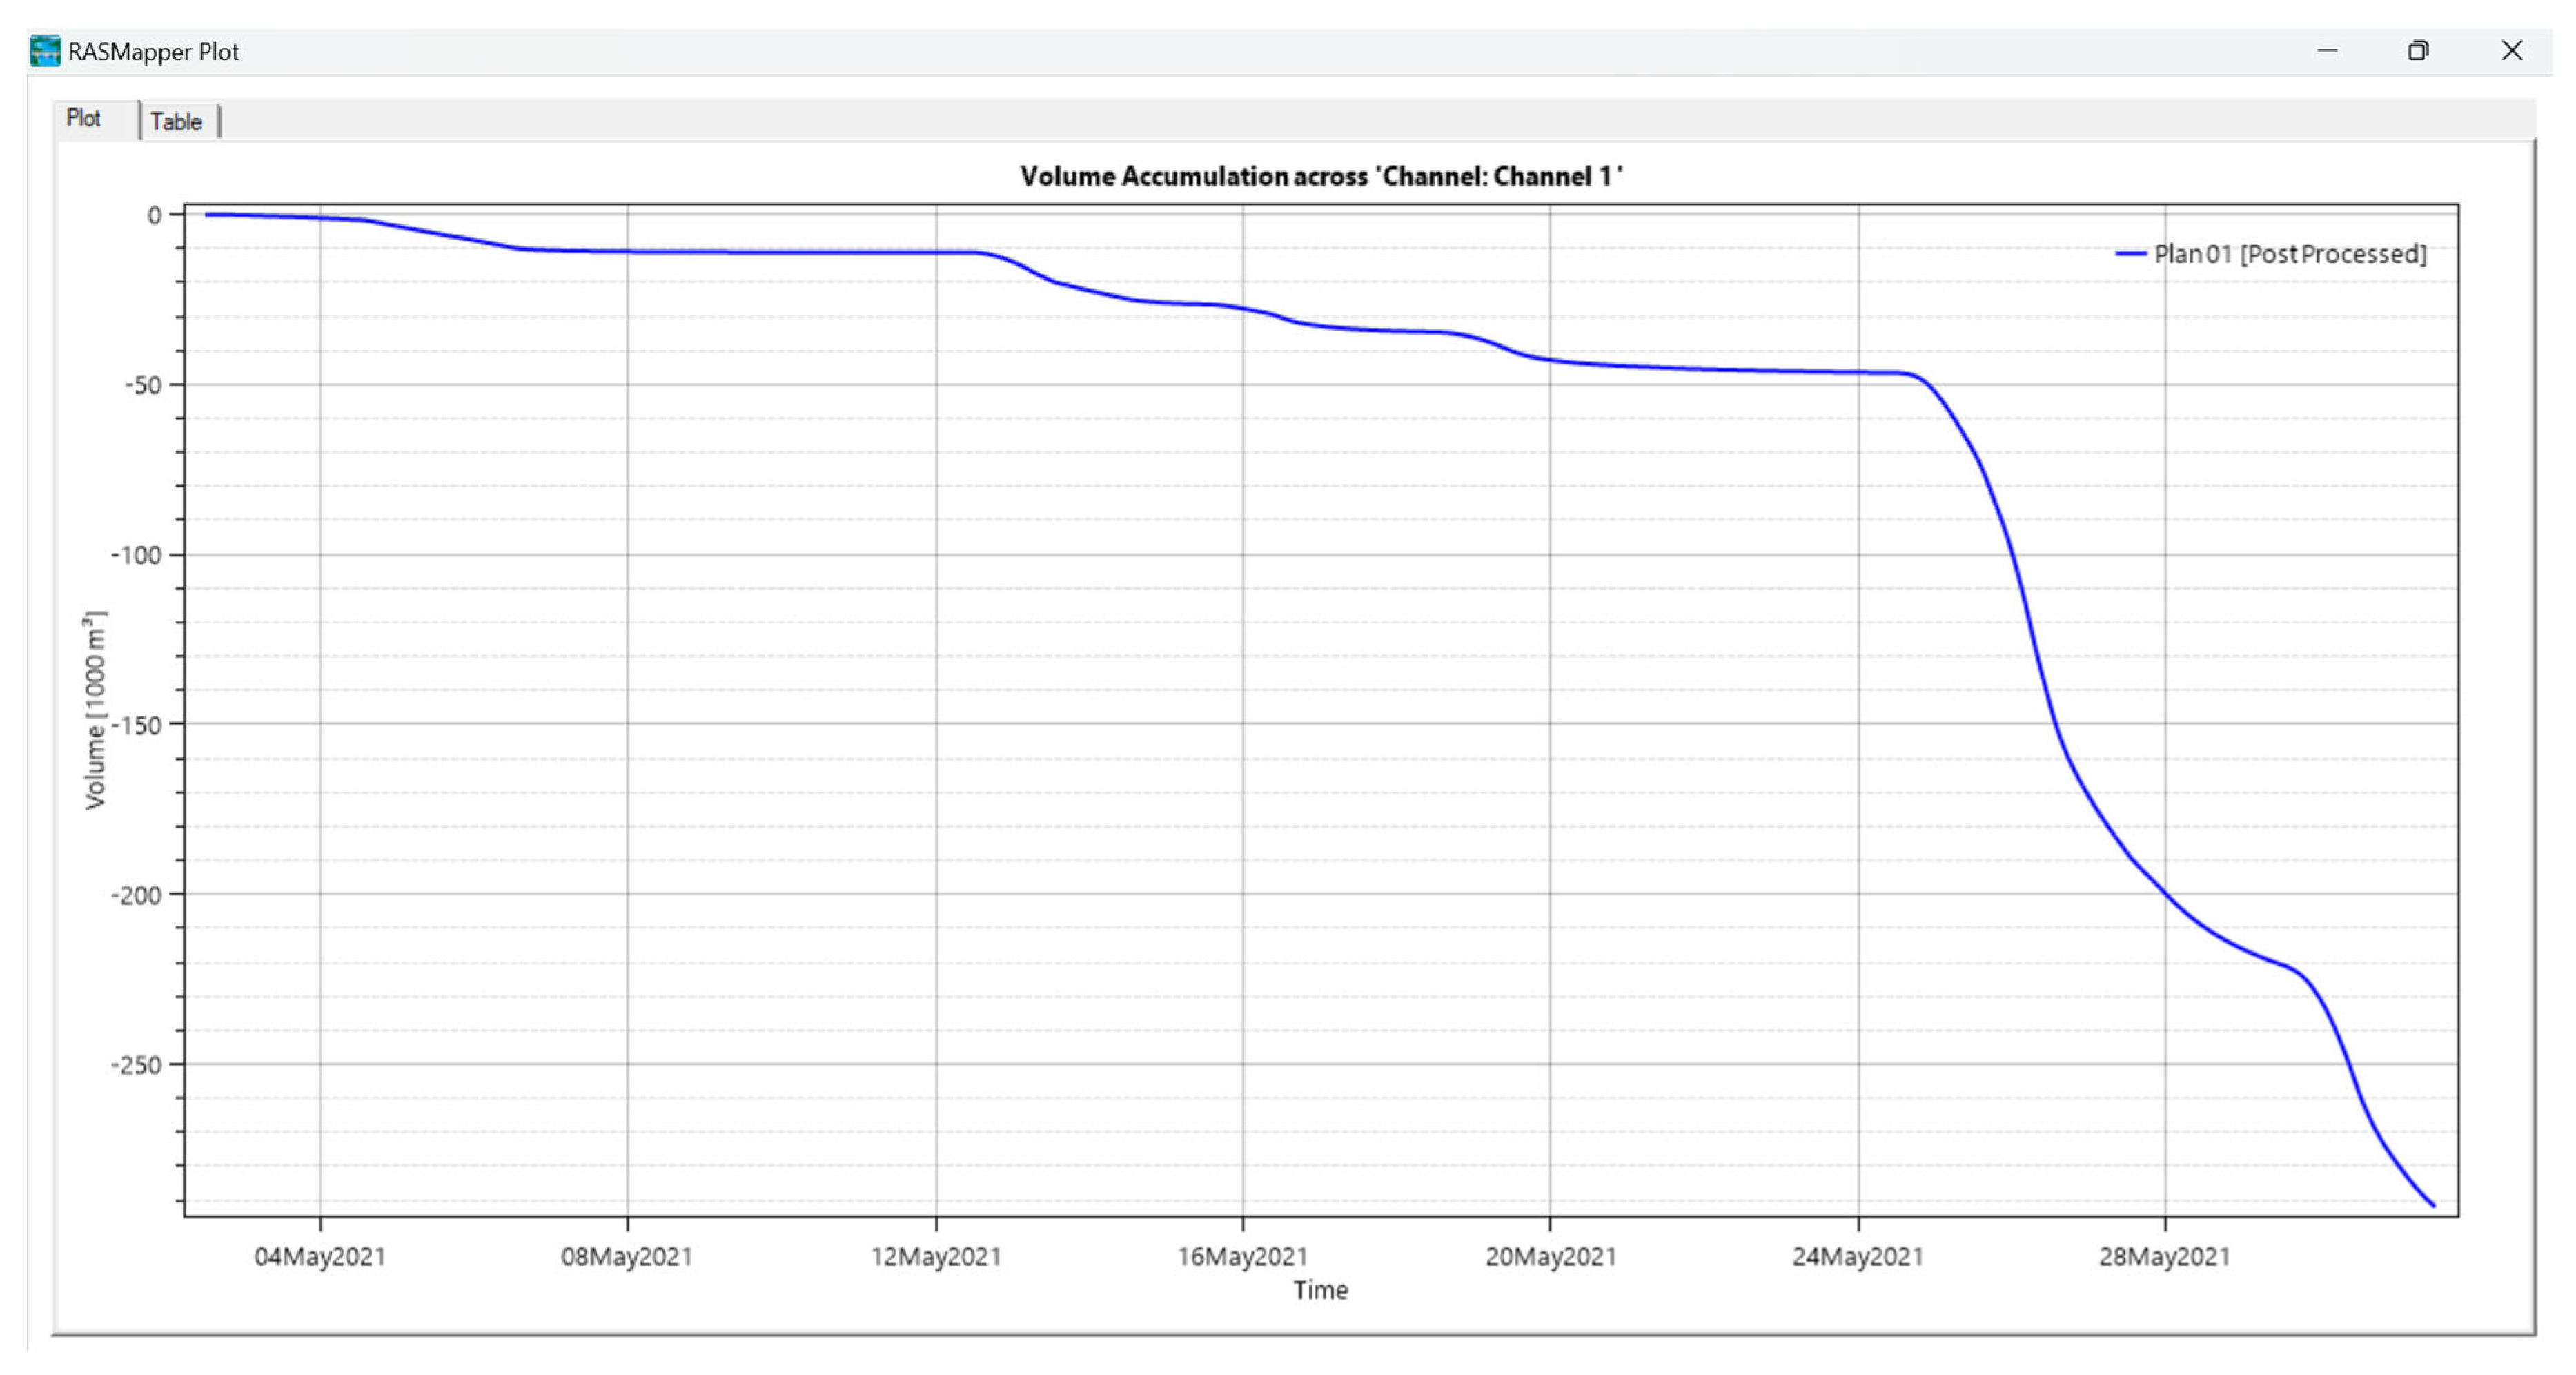
Figure 15 illustrates the performance of the newly implemented Flood Conveyance Solution when integrated into a model simulating the rainfall event that caused severe flooding in Lethem and Tabatinga from 1 to 31 May 2021. The rainfall estimates used in the model were derived from the Climate Hazards Group InfraRed Precipitation with Station data (CHIRPS). In the first week of May, moderate rainfall events were recorded, including 22.78 mm on 5 May and 20.75 mm on 6 May. During this period, the channel demonstrated effective surface water management, with a gradual decrease in channel volume corresponding to moderate rainfall–runoff. This indicates that the channel was accommodating surface water well.
In mid-May (7–19 May), short-term increases in water volume were observed following rainfall events on 13 May (35.29 mm), 14 May (17.65 mm), and 19 May (19.13 mm). However, the system showed resilience, as it managed to drain water quickly between these events. Late May, however, presented the most significant challenge, with intense rainfall events recorded on 25 May (48.30 mm), 26 May (53.05 mm), and 30 May (35.37 mm). During this period, a steep decline in channel volume was observed, suggesting a possible channel overflow or rapid drainage due to downstream boundary conditions. Based on this scenario, two key conclusions can be drawn: during moderate rainfall events, the Flood Conveyance Solutions channel functions effectively as a buffer, managing gradual changes in surface water volume and the high-intensity rainfall events will not overwhelm the FCS channel’s capacity.
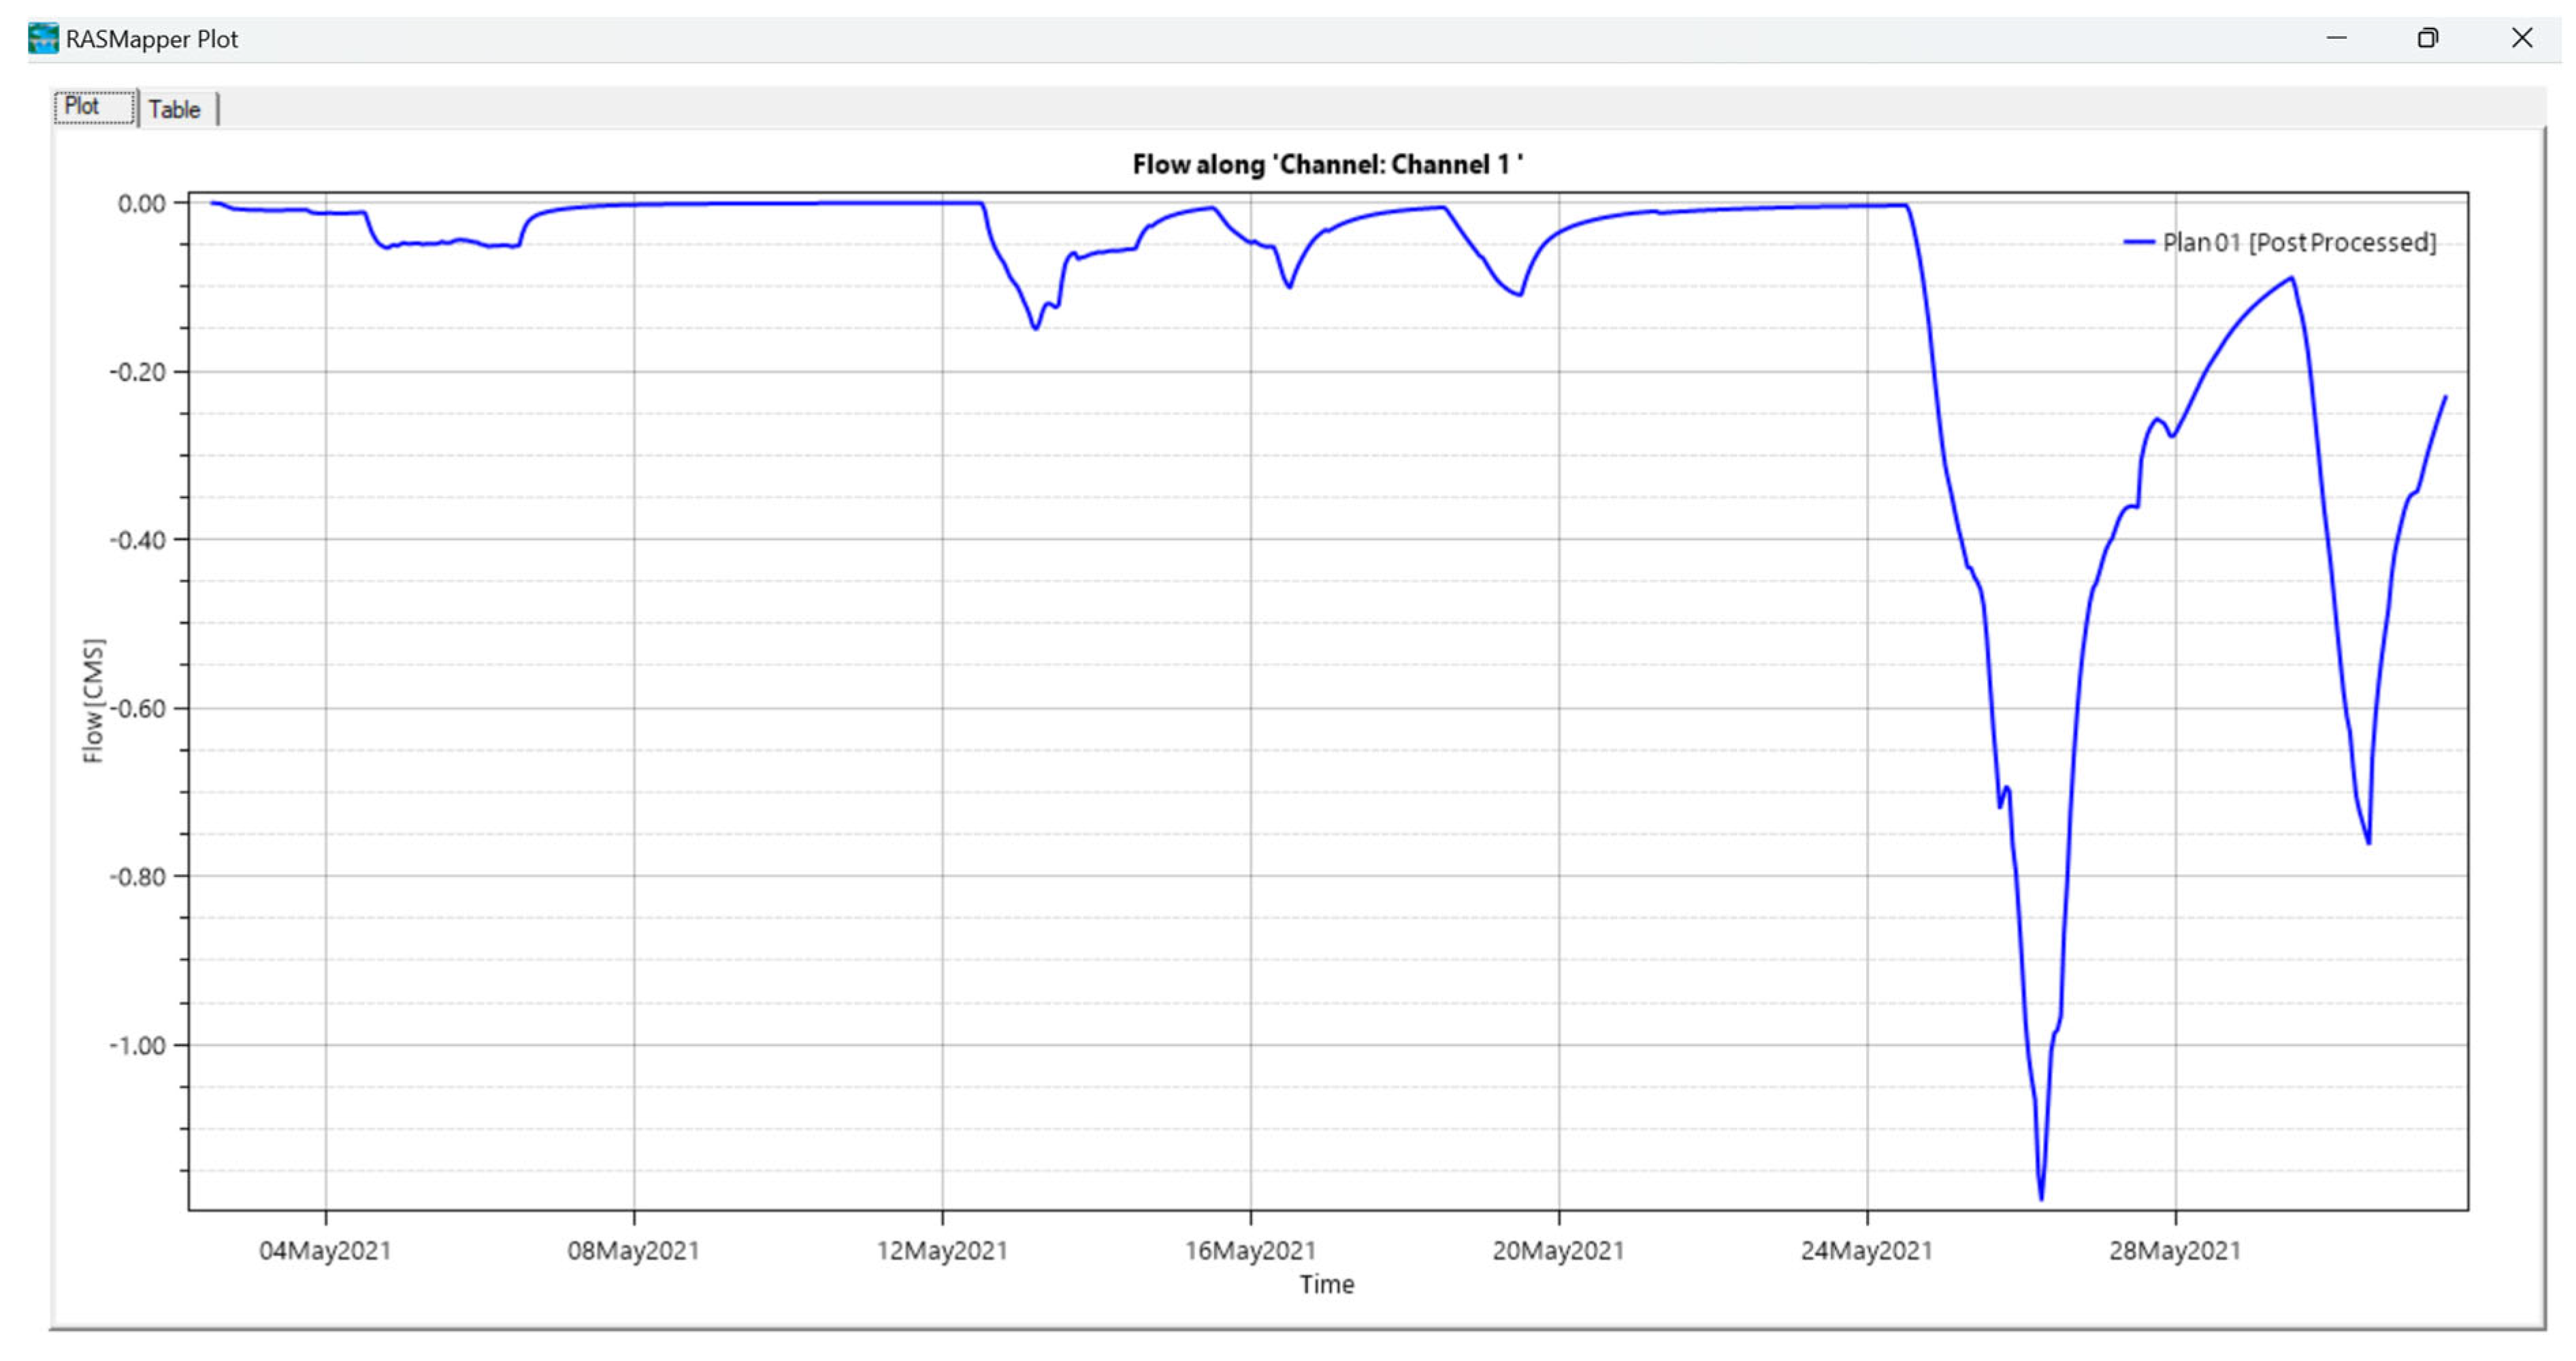
Figure 16 demonstrates the correlation between rainfall in Lethem and Tabatinga and the flow dynamics within the newly modelled FCS channel. In early May (1–6 May), rainfall primarily contributes to minor downstream flow or is stored within the channel, as indicated by the minimal fluctuations in flow observed during this period. A slight backwater effect becomes noticeable by mid-May (7–9 May). However, the minor surges caused by increased rainfall dissipate quickly during dry intervals, suggesting the FCS channel’s ability to effectively manage light to moderate rainfall events. However, during the peak intensity events in late May (20–31 May), pronounced and harmful spikes in flow are observed, indicating strong reverse flow resulting from excessively high water levels. Based on the model’s findings, the FCS channel intervention provides relief during moderate to high rainfall events.
The post-implementation modelling of the impact of the Flood Conveyance Solution channel along the Tabatinga Canal, which spans over 900 m in length, 20 m in width, and 6 m in depth, was conducted using the RAS Mapper interface within HEC-RAS, as illustrated in
Figure 17. This hydraulic modelling tool was employed to simulate the channel’s performance under various flow conditions, providing critical insights into its capacity to manage water levels and reduce flood risks. The channel dimensions were carefully designed to accommodate anticipated increases in rainfall volumes, as indicated by the upward trend observed in regional precipitation data. With HEC-RAS, the analysis ensured a robust evaluation of the channel’s effectiveness in mitigating flood impacts. It offered a data-driven foundation for assessing its contribution to the broader Nature-Based Solution (NBS) strategy implemented in the area.
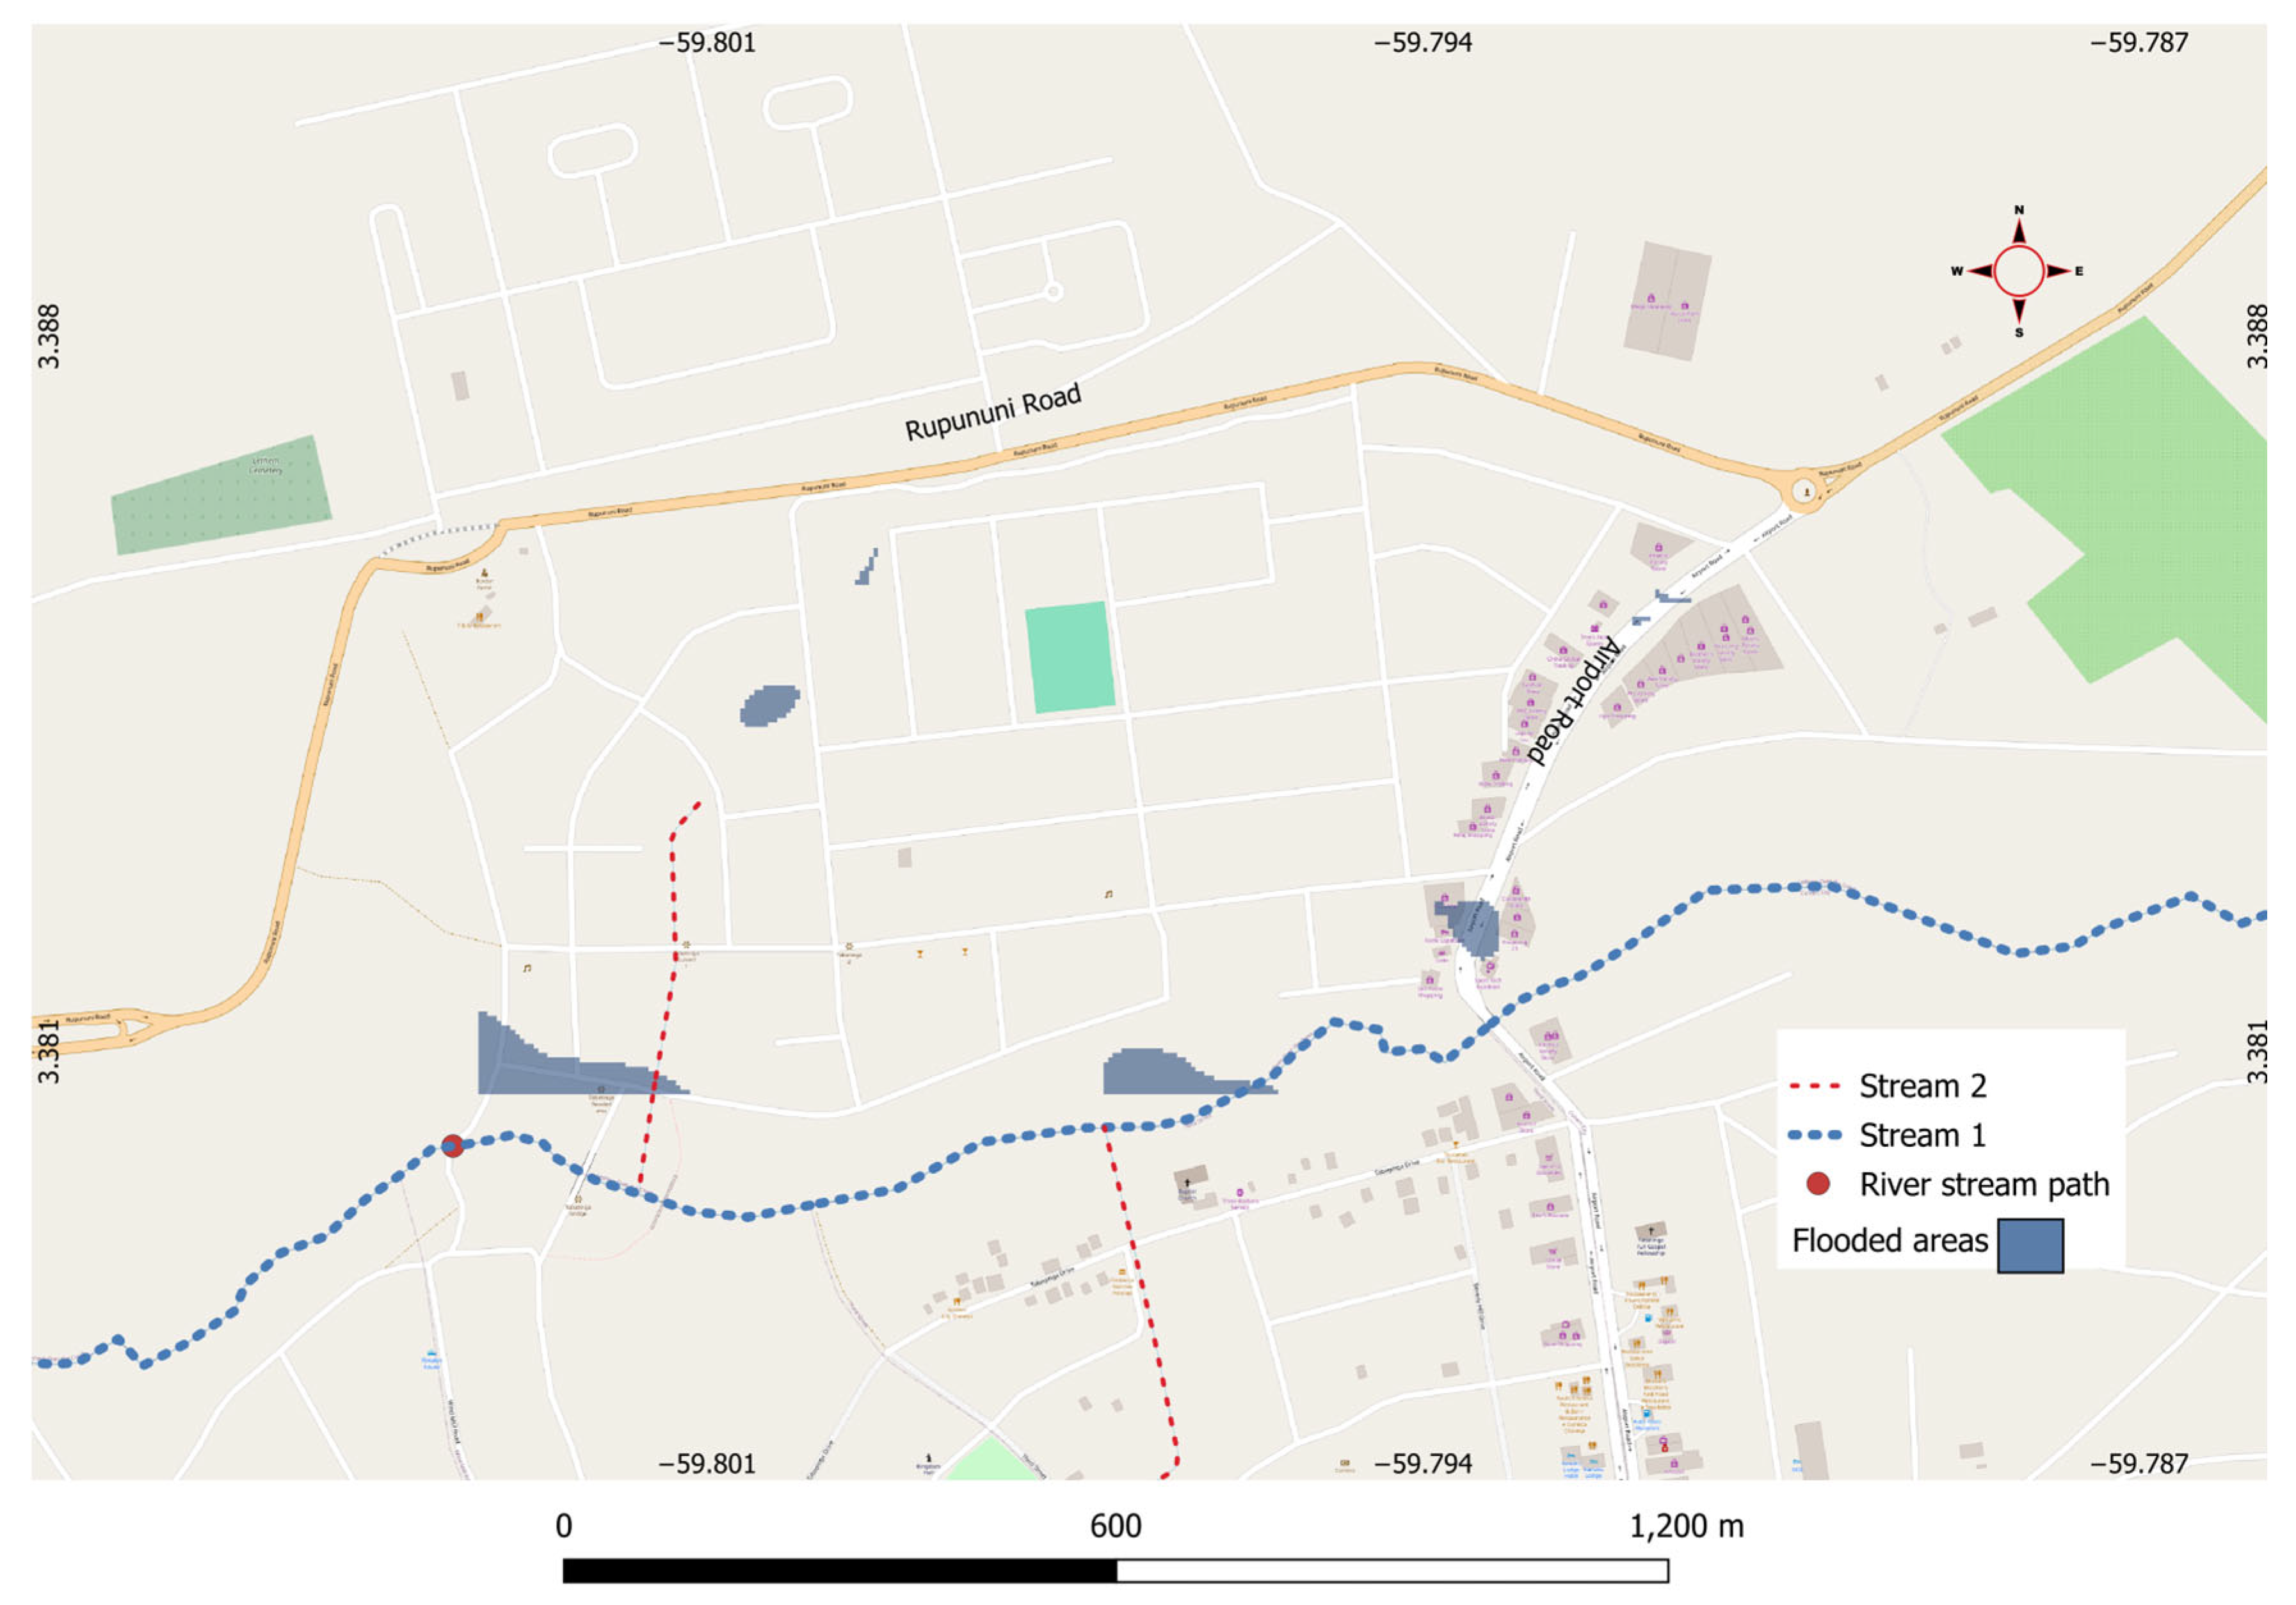
Implementing Flood Conveyance Solutions along the Tabatinga River Channel represents a transformative step toward mitigating the severe flooding that has historically plagued the region. As depicted in
Figure 17, the modelled output of the flooded area post-implementation shows a significant reduction in inundation, even after high-intensity rainfall events. The newly constructed channel, combined with strategic floodplain management and storage solutions, effectively redirects and manages excess water, minimising its impact on surrounding communities. This intervention addresses the root causes of past flooding by enhancing the river’s capacity to handle increased flow volumes, reducing the likelihood of overflow and damage to infrastructure and livelihoods.
The effectiveness of this solution is particularly evident during the modelling of extreme rainfall events, which previously overwhelmed the region’s natural and artificial drainage systems. The model demonstrates that the Flood Conveyance Solutions not only alleviate immediate flooding but also provide long-term resilience by incorporating features such as detention basins and controlled overflow zones. These measures ensure that even during peak rainfall periods, water is managed efficiently, preventing the destructive backflow and stagnation that characterised past floods. By integrating these solutions, the area is now better equipped to handle the increasing rainfall trends observed in recent years, safeguarding residents and ecosystems from the devastating impacts of flooding.
Given the compelling results from the modelled scenarios, it is clear that the Flood Conveyance Solutions will fundamentally alter the community’s vulnerability to flooding. The significant reduction in flooded areas, even under high-intensity rainfall conditions, underscores the success of this intervention. The Tabatinga region is expected to experience a marked decline in flood-related disruptions, ensuring its communities’ greater safety, stability, and economic resilience. This project serves as a model for other flood-prone areas in the Upper Takatu Region, demonstrating how innovative engineering and Nature-Based Solutions can work harmoniously to address the growing challenges of climate change and extreme weather events.
The rainfall modelling outputs (
Figure 16), which analyse the performance of flood mitigation interventions in Tabatinga, are equally applicable to Culvert City, Lethem, due to the proximity and similar climatic conditions shared by the two communities. The data demonstrate that the interventions, including the flood conveyance channel and associated water management strategies, effectively reduce the impact of high-intensity rainfall events. This suggests that the findings and interpretations derived from Tabatinga’s modelling can be extended to Culvert City, providing valuable insights into the expected performance of the Water Storage and Bio-retention Solutions (BRSs) implemented there. The similarities in rainfall patterns and flood risks between the two areas further support the applicability of these results, ensuring that the conclusions drawn for Tabatinga are relevant for assessing the effectiveness of interventions in Culvert City.
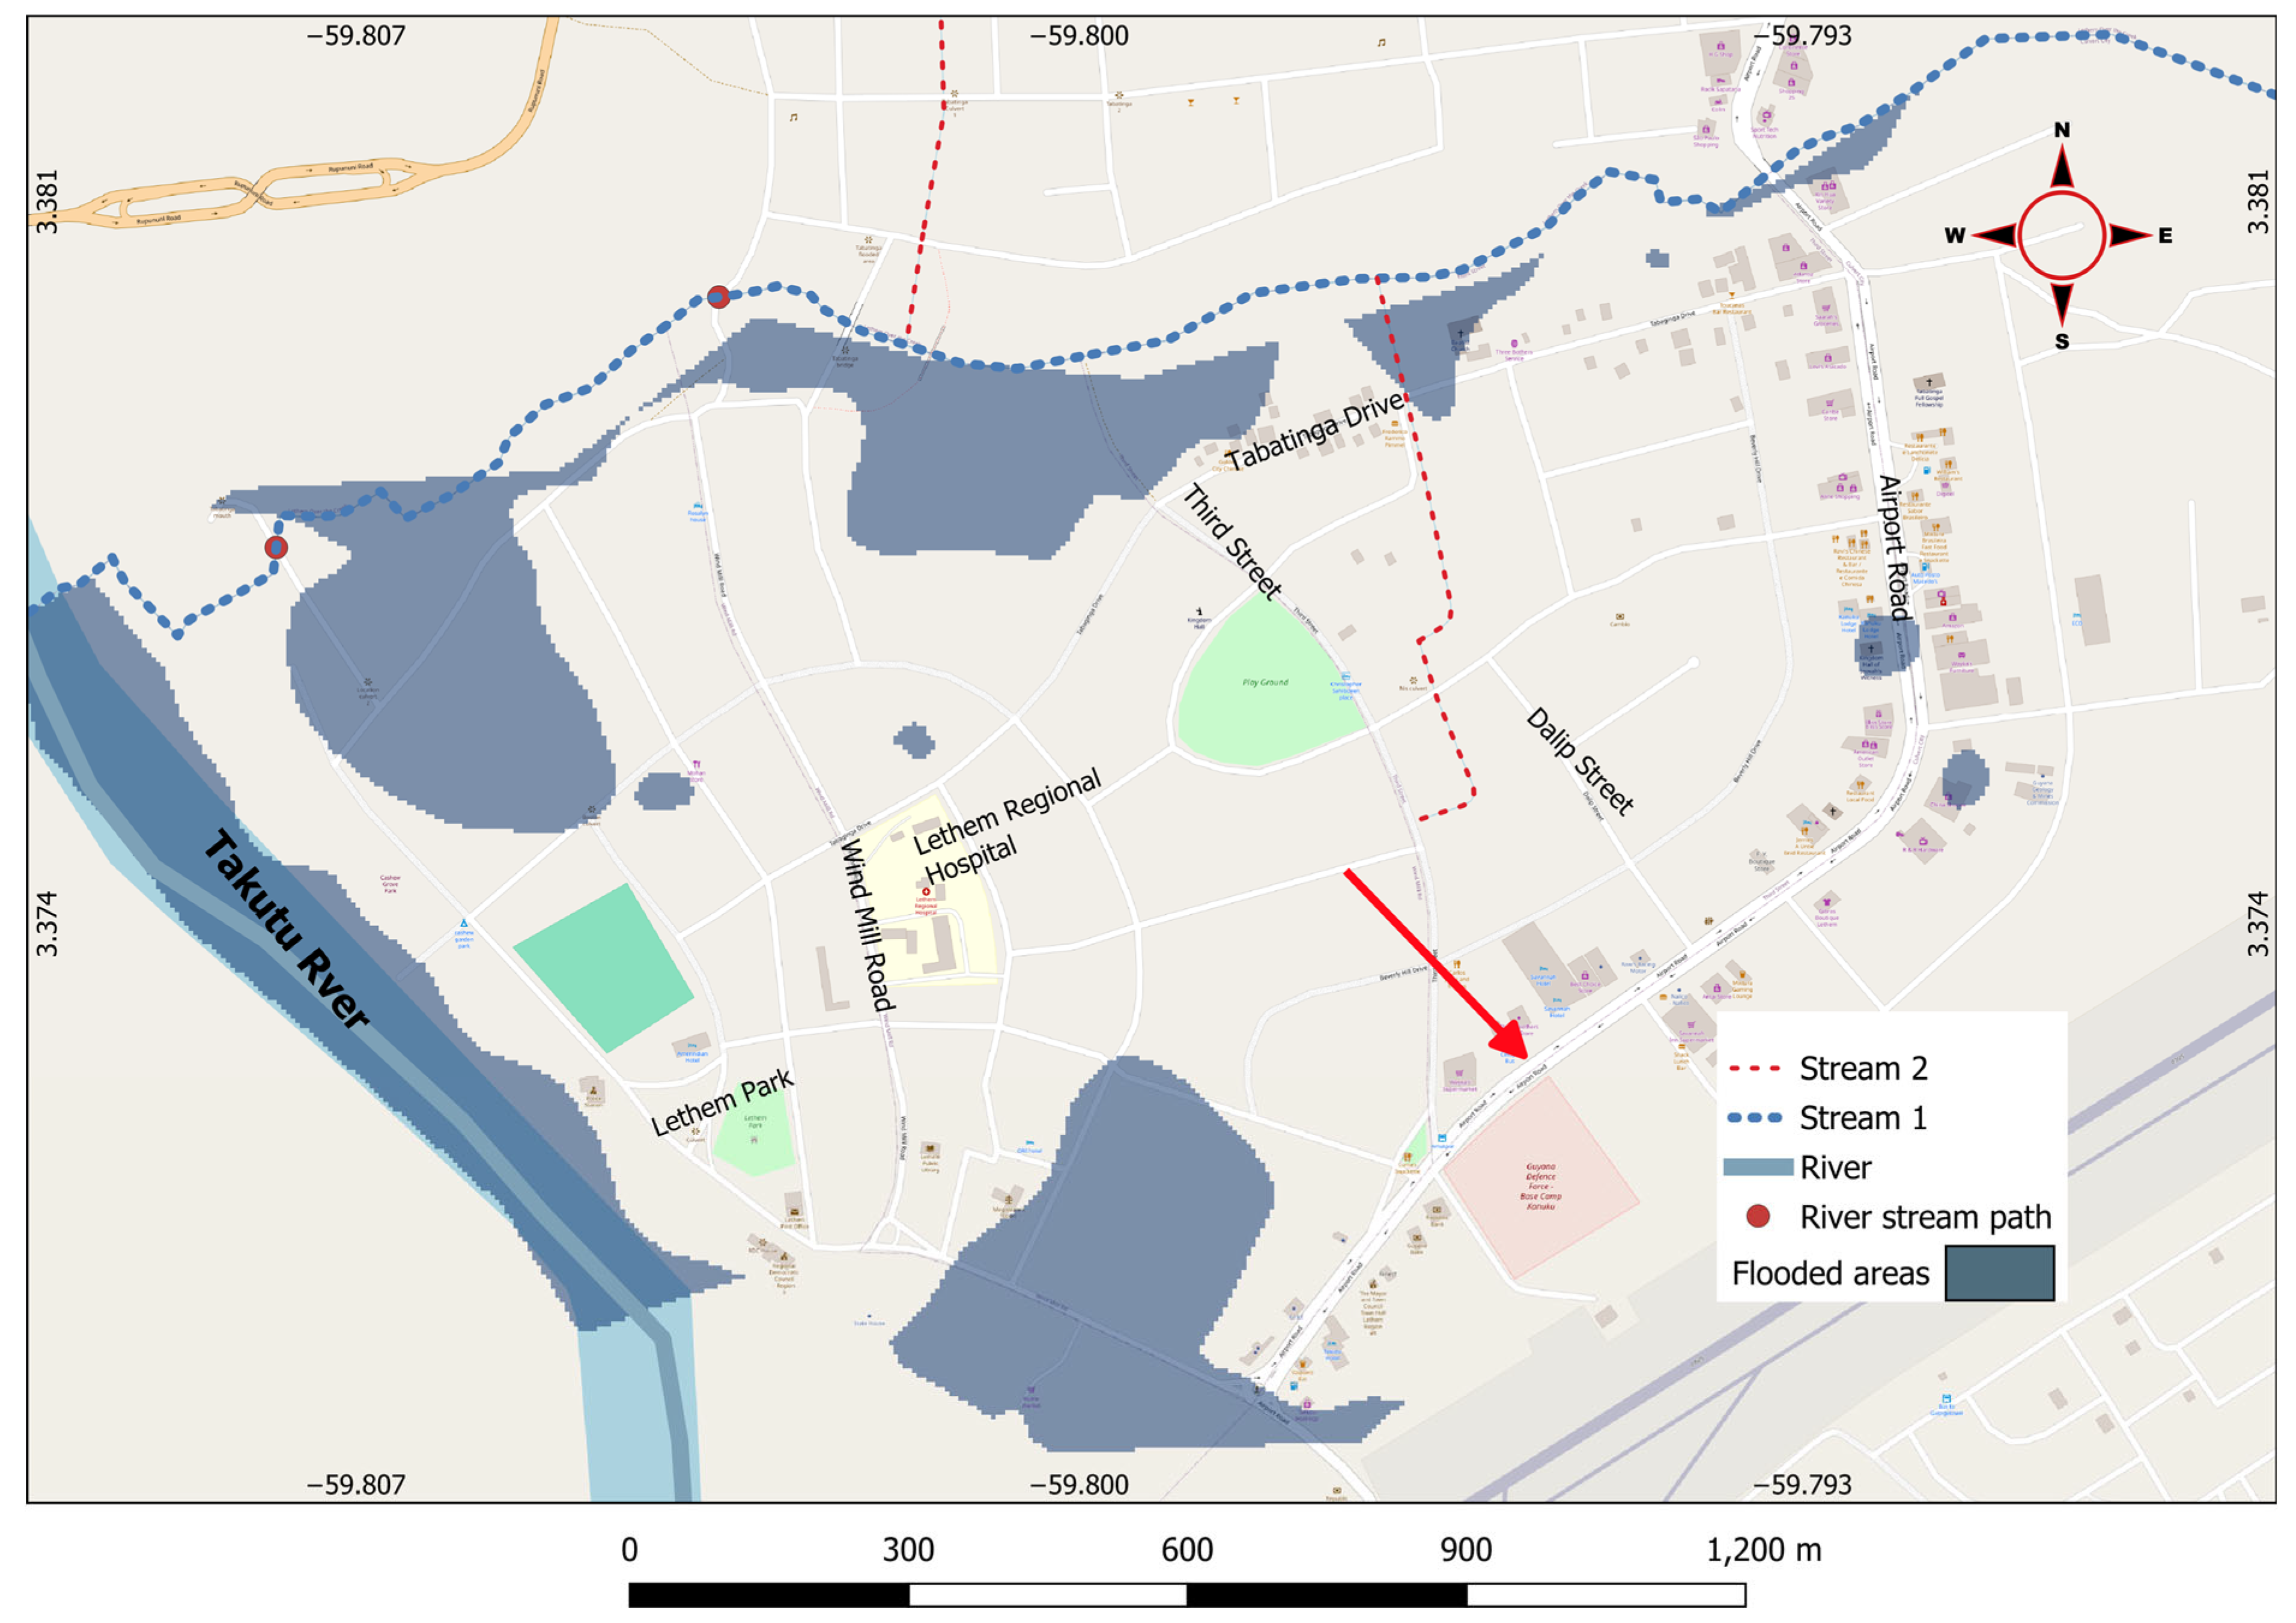
The evaluation and modelling of the post-implementation of BRS in Culvert City indicate that the intervention significantly mitigates the impact of high-intensity rainfall on the community. Integrating water storage and bio-retention systems ensures that excess rainfall is effectively managed, reducing the risk of flooding and its associated damages. As shown in the modelling output (
Figure 18), these solutions provide a robust buffer against extreme weather events, preventing widespread flooding previously experienced in the area.
In Lethem, the implementation of Water Storage and Bio-retention Solutions (BRSs) represents a strategic approach to mitigating flooding by addressing the challenges posed by heavy rainfall events. These solutions capture and retain stormwater runoff, allowing it to percolate into the ground or be gradually released into the river network. This process reduces the immediate volume of water entering the drainage system and enhances groundwater recharge, contributing to long-term water resource sustainability. Integrating BRS into the hydrological modelling framework provides a clear understanding of its effectiveness, particularly in high-intensity rainfall scenarios. This highlights the transformative impact of the intervention, demonstrating how areas historically prone to annual flooding, such as the Culvert City New Housing Scheme, are now significantly less vulnerable.
Figure 18 illustrates the modelled outcomes of the BRS intervention, showcasing a marked reduction in localised flooding within the Culvert City area. The BRS system, which includes bio-retention basins and rubberised 40-inch tubing, effectively captures runoff from residential yards and directs it into designated drainage pathways. This infrastructure modelled into the system shows that the stormwater is managed efficiently by this BRS intervention, preventing the accumulation of water in low-lying areas previously inundated during peak rainfall periods. The modelling output confirms that the BRS intervention has successfully altered the hydrological dynamics of the site, reducing the risk of flooding and enhancing the community’s resilience. This is particularly evident in the New Housing Scheme area, where implementing BRS has led to a noticeable decline in the modelled flood scenario. The result presented in
Figure 18 underscores the effectiveness of the BRS intervention in mitigating flood risks during high-intensity rainfall events. By retaining stormwater and regulating its release, the system minimises the strain on existing drainage infrastructure and reduces the likelihood of overflow. This approach addresses the immediate challenges of flooding and provides a sustainable solution for managing stormwater in the face of increasing rainfall variability.
3.8. Assessment of the Post Implementation: Socio-Economic
Nature-Based Solutions (NBSs) have gained prominence as sustainable approaches to mitigating flood risks while enhancing Socio-economic resilience in vulnerable communities. Implementing NBS interventions in Lethem and Tabatinga aimed to address persistent flooding challenges through ecosystem-based adaptations. This chapter assesses residents’ socio-economic perceptions after implementing these measures, providing insights into their experiences, challenges, and observed benefits. By comparing data from the pre-implementation baseline survey with the post-implementation assessment, this analysis explores changes in key socio-economic indicators such as employment, income stability, educational attainment, gender participation, and access to essential services.
Understanding residents’ perceptions is critical for evaluating the effectiveness of the NBS interventions and their long-term impact on livelihoods, community cohesion, and disaster resilience. The findings presented in this chapter highlight shifts in socio-economic conditions, community engagement, and adaptation strategies since the intervention. Additionally, the assessment identifies persisting vulnerabilities and areas for improvement to inform future policy and decision-making processes. Through a data-driven approach, this chapter contributes to the broader discourse on assessing the implemented solutions.
In the end-line survey, the respondents from the communities were asked to respond to their level of satisfaction with the activities implemented as part of the NBS flood mitigation plan in the area stemming from this project (
Table 8).
For both communities, the proportion of respondents indicating that they are satisfied with the implemented solutions to address the flooding issue was similar, around 70%. When asked about the number of flood incidences experienced in the last six months since implementing the NBSs, the majority of the respondents from both communities indicated that there were no notable flood incidences and the remaining proportion indicated that the past six months saw fewer flood incidences compared to the year before (
Table 9).
Based on the end-line survey data, over 95% of the respondents from both communities indicated no working days were lost in the last six months. The survey also shows that the average community member earns between GYD 1000 and GYD 5000 per day. With the average days lost due to flooding being approximately 20 days, it can be estimated that each community member is averting an average loss of GYD 20,000–100,000 in livelihood earnings from a flooding event. This can be considered as an aversion benefit of the NBS activities generated from the project. Therefore, based on the average population affected by flooding in the two communities, the NBS activities have potentially reduced the livelihood cost by GYD 10,000,000–50,000,000 per flooding event in the last six (6) months. No comprehensive data was sourced on the volume of agricultural produce for the area; however, based on the baseline estimates, in addition to overall damage cost per household, every flooding event averted in the past six (6) months potentially saved the community GYD 61,000,000.00 in farm losses and damages (baseline survey information).
The end-line survey also includes several policy and management-related perspectives that can help drive future management plans in the community. A key policy point is community education, awareness of the flooding issues, and management practices that all stakeholders need. To develop effective community awareness policies beyond the NBS activities, understanding the community perspective about the factors that lead to flooding and how participatory management actions are important.
4. Conclusions
The findings of this study underscore the critical role that Nature-Based Solutions (NBSs) can play in enhancing flood resilience in vulnerable regions such as Lethem and Tabatinga. By leveraging ecological infrastructure, such as vegetated swales, green roofs, riparian buffers, and floodplain restoration, areas prone to flooding can benefit from sustainable, cost-effective, and environmentally friendly alternatives to conventional complex engineering approaches. Integrating NBS addresses immediate flood risks and promotes ecosystem services, biodiversity conservation, and overall ecological health, aligning with broader climate adaptation and sustainable development objectives. These solutions, rooted in ecological principles, can transform flood management paradigms from reactive infrastructure-based strategies to proactive, resilient, and adaptive frameworks sensitive to local environmental and socio-economic contexts.
Empirical evaluations through the pilot projects and multi-criteria analyses demonstrated that carefully planned and community-supported NBS interventions are feasible within the socio-economic constraints of the studied communities. The socio-economic analysis showed that farmers are the most vulnerable group in the communities, with agriculture being the most prominent livelihood activity in the areas. Although initial investments and resource limitations pose challenges, the long-term benefits, such as reduced maintenance costs, improved water quality, and heightened community awareness, enhance their attractiveness as sustainable solutions. Importantly, the active engagement of local stakeholders, including community members, local authorities, and environmental agencies, is paramount in ensuring the success and sustainability of these interventions. This participatory approach fosters shared ownership, enhances local capacity, and facilitates adaptive management practices, ensuring that NBS implementations are contextually appropriate and socially inclusive.
Despite promising outcomes, several challenges remain in scaling and mainstreaming NBSs within regional flood management strategies. Legal, regulatory, and land access issues and continuous monitoring and maintenance require robust governance frameworks and adequate institutional support. Moreover, recognising the diversity of ecological and hydrological landscapes necessitates tailored solutions that encompass site-specific considerations and maximum community participation. Future research should focus on refining implementation methodologies, developing standardised performance indicators, and exploring innovative financing mechanisms that can mobilise investments for NBS projects. Such efforts are essential to transition from pilot initiatives to integrated, large-scale flood resilience strategies harmonising ecological integrity with socio-economic development.
Ultimately, integrating NBSs into the existing flood management paradigm presents a paradigm shift towards more sustainable, adaptive, and community-centred approaches. Their successful deployment mitigates flood risks and advances broader environmental objectives, including biodiversity conservation and climate resilience. As climate change amplifies hydrological uncertainties, adopting Nature-Based Solutions will be indispensable for building resilient communities that can withstand and recover from future flood events. Embracing a holistic, multi-disciplinary approach—combining scientific research, local knowledge, and policy support—will be critical to operationalising these solutions effectively. Such integration promises a resilient and sustainable future, safeguarding lives, livelihoods, and ecosystems in vulnerable flood-prone regions.
While the post-implementation results of the NBS strategies demonstrated measurable reductions in flood extent and improved water retention in critical areas, the study also highlighted several challenges. These include delays in the maintenance of drainage infrastructure, limited institutional capacity for long-term monitoring, and socio-political constraints affecting land use enforcement. Additionally, although community engagement was high during the early stages, sustaining involvement over time remains a concern. These findings underscore that while Nature-Based Solutions hold significant promise, their success depends on continued investment in institutional frameworks, local capacity-building, and integration with conventional infrastructure planning. Future efforts should focus on adaptive management approaches that address these challenges while scaling the benefits of NBSs across similarly vulnerable regions.
