1. Introduction
China’s unique geographical environments and climatic conditions give rise to frequent and severe flooding, which has long posed significant constraints on national economic development and threats to public safety and property [
1]. In response, the Chinese government has made substantial investments over seven decades to construct comprehensive flood control systems across major river basins, integrating reservoirs, sluice gates, embankments, flood storage areas, and diversion channels [
2,
3,
4]. Since the mid-1980s, decision support systems have been progressively applied to reservoir flood forecasting and operation, starting with pilot projects in the Yangtze, Yellow, and Huaihe River basins and expanding nationwide to small and medium-sized water systems, thereby enhancing the scientific basis of flood management [
5,
6,
7]. Water conservancy focus shifted to scientific operation and management in the 21st century. Scientific operation refers to a decision-making process in flood control decisions that achieves “risk-controllable” and “multi-objective balance,” specifically encompassing three connotations: (1) dynamically responding to the non-stationarity of upstream inflow; (2) coordinating the priorities of objectives such as “flood control safety,” “water supply guarantee,” and “ecological protection”; (3) providing decision-makers with quantitative evidence-based scheduling schemes (rather than empirical judgments). Reservoir flood forecasting and operation—a model integrating engineering and non-engineering flood control measures—has become a core component of water resource management, aiming to optimize engineering efficiency, mitigate flood impacts, and minimize disaster losses through strategic operation [
8]. Improving the sophistication of such decision-making processes has thus emerged as a critical priority in flood and drought resilience strategies [
9].
Within decision theory, multi-criteria decision making (MCDM) encompasses two principal paradigms: multi-objective decision making (MODM) and multi-attribute decision making (MADM). The former addresses continuous decision variables and infinite solution spaces through vector optimization, while the latter focuses on discrete variables and finite alternatives, emphasizing solution evaluation and selection. Classified by information characteristics, MADM can be deterministic or stochastic; by stakeholder composition, it includes single-person and group decision contexts [
10]. In reservoir flood operation, the typical process—first generating non-dominated solutions via optimization/simulation models and then selecting an optimal compromise based on decision-maker preferences—essentially constitutes a multi-attribute decision problem, requiring systematic integration of scheme generation, evaluation, and optimization [
11].
Decades of research on multi-attribute decision making for reservoir flood scheduling have advanced three key domains: indicator system construction, weighting methodologies, and evaluation techniques. Researchers have developed multi-level frameworks that synthesize engineering practices and theoretical insights, incorporating multidimensional factors such as upstream/downstream flood safety, post-flood capacity, and inter-basin coordination while prioritizing practical indicators like advanced monitoring technologies and environmental adaptability [
12,
13]. Methodological innovations include the integration of traditional approaches (e.g., Analytic Hierarchy Process (AHP), entropy weighting) with novel techniques (e.g., fuzzy logic, combined weighting) to enhance objectivity in weight assignment, alongside the adoption of hybrid models merging fuzzy evaluation, grey relational analysis, and machine learning for comprehensive scheme assessment [
14,
15,
16].
Notwithstanding these advancements, critical gaps persist in risk analysis, primarily due to two unresolved challenges: (1) the underrepresentation of indicator uncertainty, where dynamic flood risks—shaped by hydrological variability, structural constraints, and operational complexities—are often oversimplified using static point estimates rather than probabilistic descriptions, compromising evaluation reliability; and (2) the ambiguity in weighting consistency, as divergent subjective/objective methods can yield conflicting results despite growing efforts in combined weighting, with limited progress in quantifying resultant uncertainty. For example, the Colorado River Basin in North America, where climate change-induced hydrological variability has intensified the need to handle dynamic indicator uncertainties in reservoir operations, with recent studies having advanced in probabilistic forecasting [
17,
18], and there is potential to further integrate weight conflict resolution. The Rhine River Basin in Europe, a transboundary system where weight assignment conflicts between riparian countries have been a key challenge, with existing efforts having utilized fuzzy multi-criteria methods to tackle such issues, and there is scope to further integrate considerations of temporal indicator dynamics [
19]. The Ganges-Brahmaputra Basin in South Asia, where monsoon-driven flood variability demands robust handling of indicator uncertainties, with current research having advanced in using machine learning for forecasting and having mentioned the need to address weight ambiguity, laying a foundation for further integration in this aspect [
20,
21,
22,
23]. These limitations highlight an urgent need for robust methodologies to address the probabilistic nature of flood control operation decisions.
Existing studies have made progress in addressing uncertainties in flood risk assessment through separate methodological advancements. For capturing indicator uncertainties, studies have applied LSTM networks to model temporal dynamics of hydrological indicators (e.g., reservoir water levels and downstream flows) due to their strength in handling sequential data, demonstrating effectiveness in quantifying dynamic fluctuations [
24,
25]. For reconciling weight conflicts, research has explored combined weighting methods (e.g., [
26] combined subjective and objective weights) and game theory-based coordination (e.g., [
27,
28,
29] mentioned conflict mitigation in multi-method weighting), highlighting the value of game theory in balancing divergent results from methods like AHP and entropy weight. However, critical review of these studies reveals a gap: while long short-term memory (LSTM) excels in modeling temporal indicator uncertainties and game theory is effective in resolving weight conflicts, few studies have systematically integrated these two methodologies to address multi-source uncertainties simultaneously in reservoir group flood control decision-making.
This study addresses the aforementioned challenges by proposing an innovative risk analysis framework for reservoir group flood scheduling under multi-source uncertainty. Specifically, it aims to: (1) leverage LSTM networks to model temporal dependencies and quantify uncertainties in evaluation indicators using sequential data analytics; (2) develop a game theory-based framework for adaptive weight calculation, conflict resolution among divergent weighting methods, and probabilistic assessment of weight uncertainty; (3) formalize scheduling risk as the probability of failing to meet predefined flood safety thresholds, supported by mathematical formulations and solution algorithms that integrate uncertainty propagation; and (4) validate the framework through a case study of the Qiantang River Basin’s cascade reservoir system, demonstrating its applicability in real-world risk assessment. By bridging deterministic decision models with probabilistic risk analysis, this research seeks to establish a foundational framework that enhances the scientific rigor of flood control decision-making under uncertainty.
2. Methodology
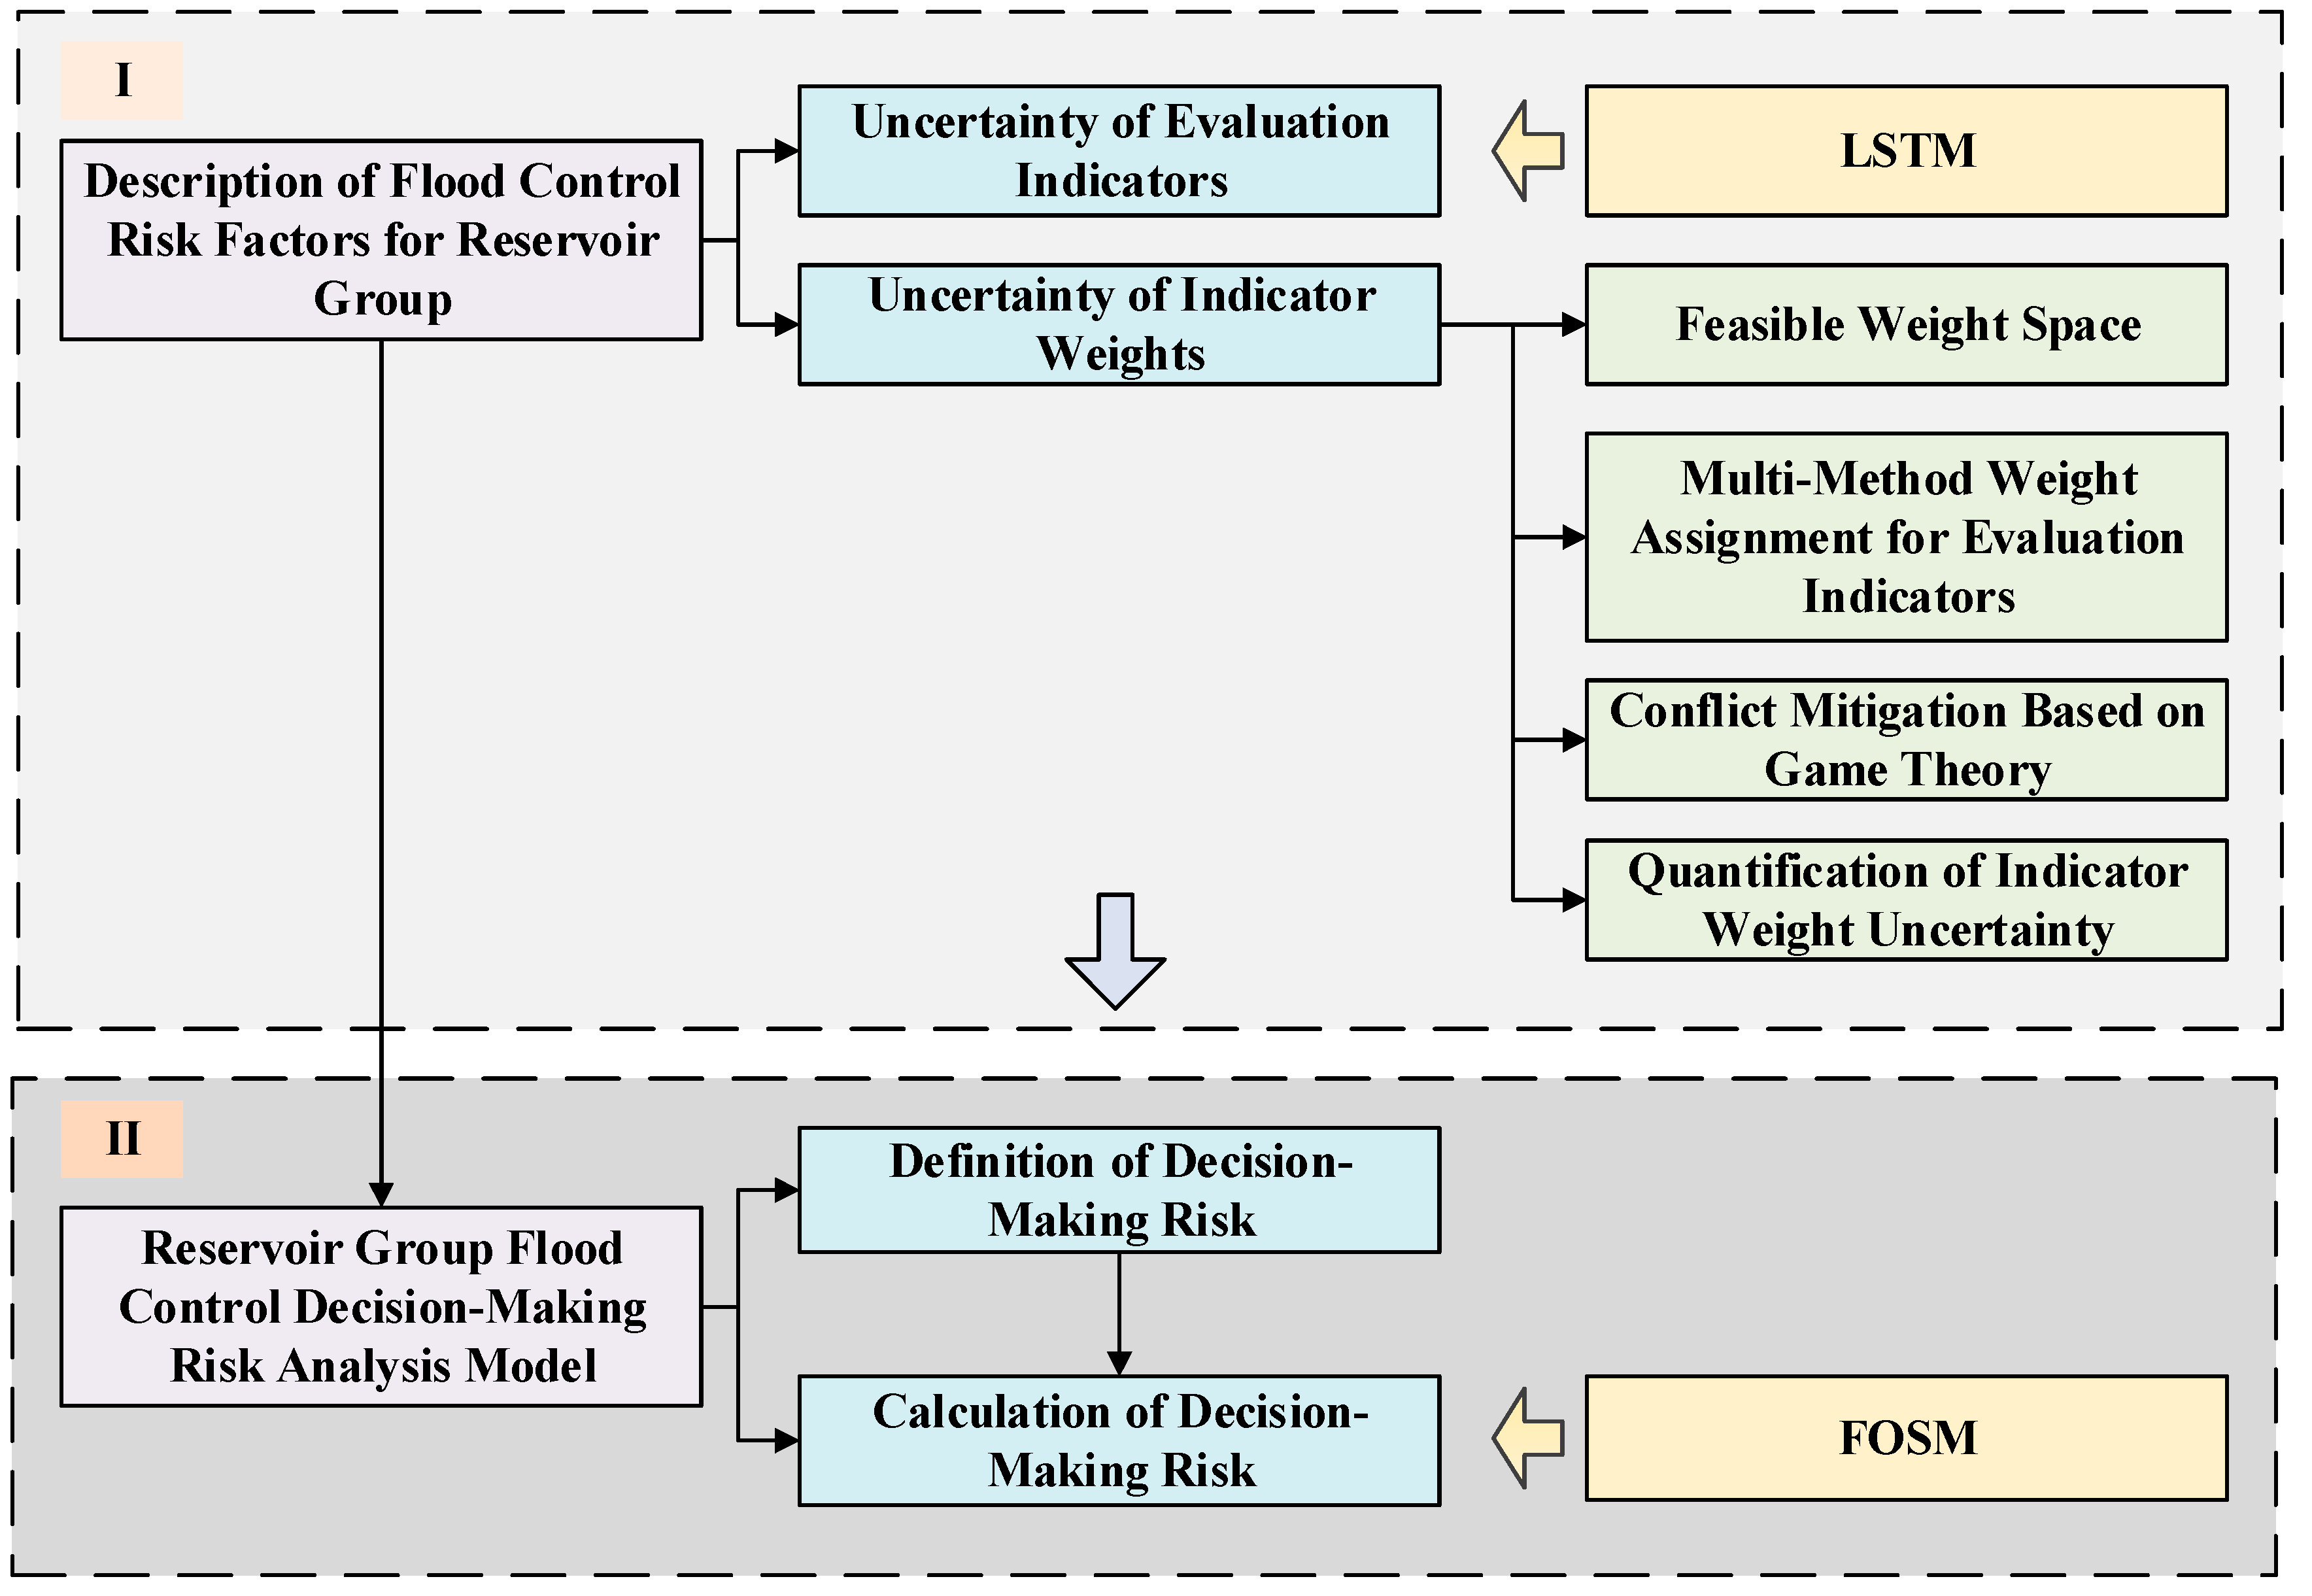
The framework of the proposed reservoir group flood control decision-making risk analysis model is shown in
Figure 1. The uncertainties of flood control risk evaluation indicators and indicator weights are selected as the main factors of flood control operation risk for reservoir groups. First, a mathematical model of long short-term memory (LSTM) is constructed to quantify the uncertainty of risk evaluation indicators. The concept of feasible weight space and four common weight forms are introduced, and then multiple subjective and objective weighting methods are used to assign weights to evaluation indicators. Finally, game theory is adopted to resolve conflicts in multi-method weighting and estimate the feasible region of weights, and the probability distribution with interval constraints is used to quantify the weight uncertainty.
The flood control decision-making risk of reservoir groups is defined as the probability that the evaluated safety level cannot be achieved, with corresponding mathematical expressions and solution calculation methods provided. Specifically, it is defined as the probability that the actual flood control safety level of reservoir groups fails to reach the evaluated safety level due to the uncertainties of flood control risk evaluation indicators and their weights, and its expression is given. The first order second moment (FOSM) method is used to derive the calculation of flood control operation decision-making risk.
2.1. Uncertainty of Evaluation Indicators
This study uses the LSTM method to predict indicator values and analyzes the uncertainty of risk evaluation indicators. Compared with traditional time-series models (e.g., Autoregressive Integrated Moving Average model (ARIMA)), LSTM can effectively capture long-period dependencies in inflow data (such as the half-month scale precipitation-runoff lag effect) through its gating mechanism, addressing ARIMA’s insufficiency in fitting nonlinear relationships. Compared with other deep learning models (e.g., Gated Recurrent Unit (GRU)), LSTM’s cell state structure is more suitable for handling complex temporal characteristics in flood control decisions that combine “sudden fluctuations” and “gradual trends” (e.g., during the flood season, there may be both short-term rainstorm peaks and base flow growth from continuous precipitation). Its output of “probability distribution prediction” (rather than point prediction) can directly provide a basis for subsequent uncertainty quantification, which is difficult to achieve with models such as random forests. These characteristics make it an excellent choice for the “temporal uncertainty quantification” module in the framework.
Step 1. Assume there are z evaluation indicators, each with m measured values (i.e., the sample sequence length is m). Therefore, the historical measured data of the indicators are processed into time series, denoted as , , .
Step 2. Train the LSTM with the previous
n (
n <
m) indicator data. Use the calibrated LSTM to predict the (
n + 1)th indicator value
. The prediction error of the (
n + 1)th indicator value can be calculated as follows:
Step 3. Similarly, train the LSTM with the indicator data from the previous
n + 1 years. Use the calibrated model to predict the (
n + 2)th indicator value. The prediction error of the (
n + 2)th indicator value can be calculated as follows:
Step 4. Similarly predict the indicator data from the (
n + 2)th to the
m-th, and then obtain the prediction error series (with a length of
m −
n) of the indicator values as follows:
Step 5. We assume that the prediction errors of indicator values follow a normal distribution
,
. The calculation method for the standard deviation is as follows:
Step 6. We use the entire indicator sequence to calibrate the parameters of the LSTM model and predict the (
m + 1)th value of the indicator,
. Then, the next value of the indicator can be expressed as follows:
Therefore, the expectation and variance of the
t-th indicator can be obtained by the following equations:
where
represents the expectation and
represents the variance.
2.2. Uncertainty of Indicator Weights
2.2.1. Feasible Weight Space
To flexibly handle the uncertainty of indicator weights in the flood control risk evaluation process, the concept of Feasible Weight Space (FWS) is first introduced. The FWS can be represented by the probability density function fW(w), which typically has four possibilities: the indicator weights are uniquely determined, the indicator weights follow a uniform distribution within a specified interval, the indicator weights follow an arbitrary type of distribution within a specified interval, and the indicator weight information is completely unknown.
- (1)
Indicator weights are uniquely determined
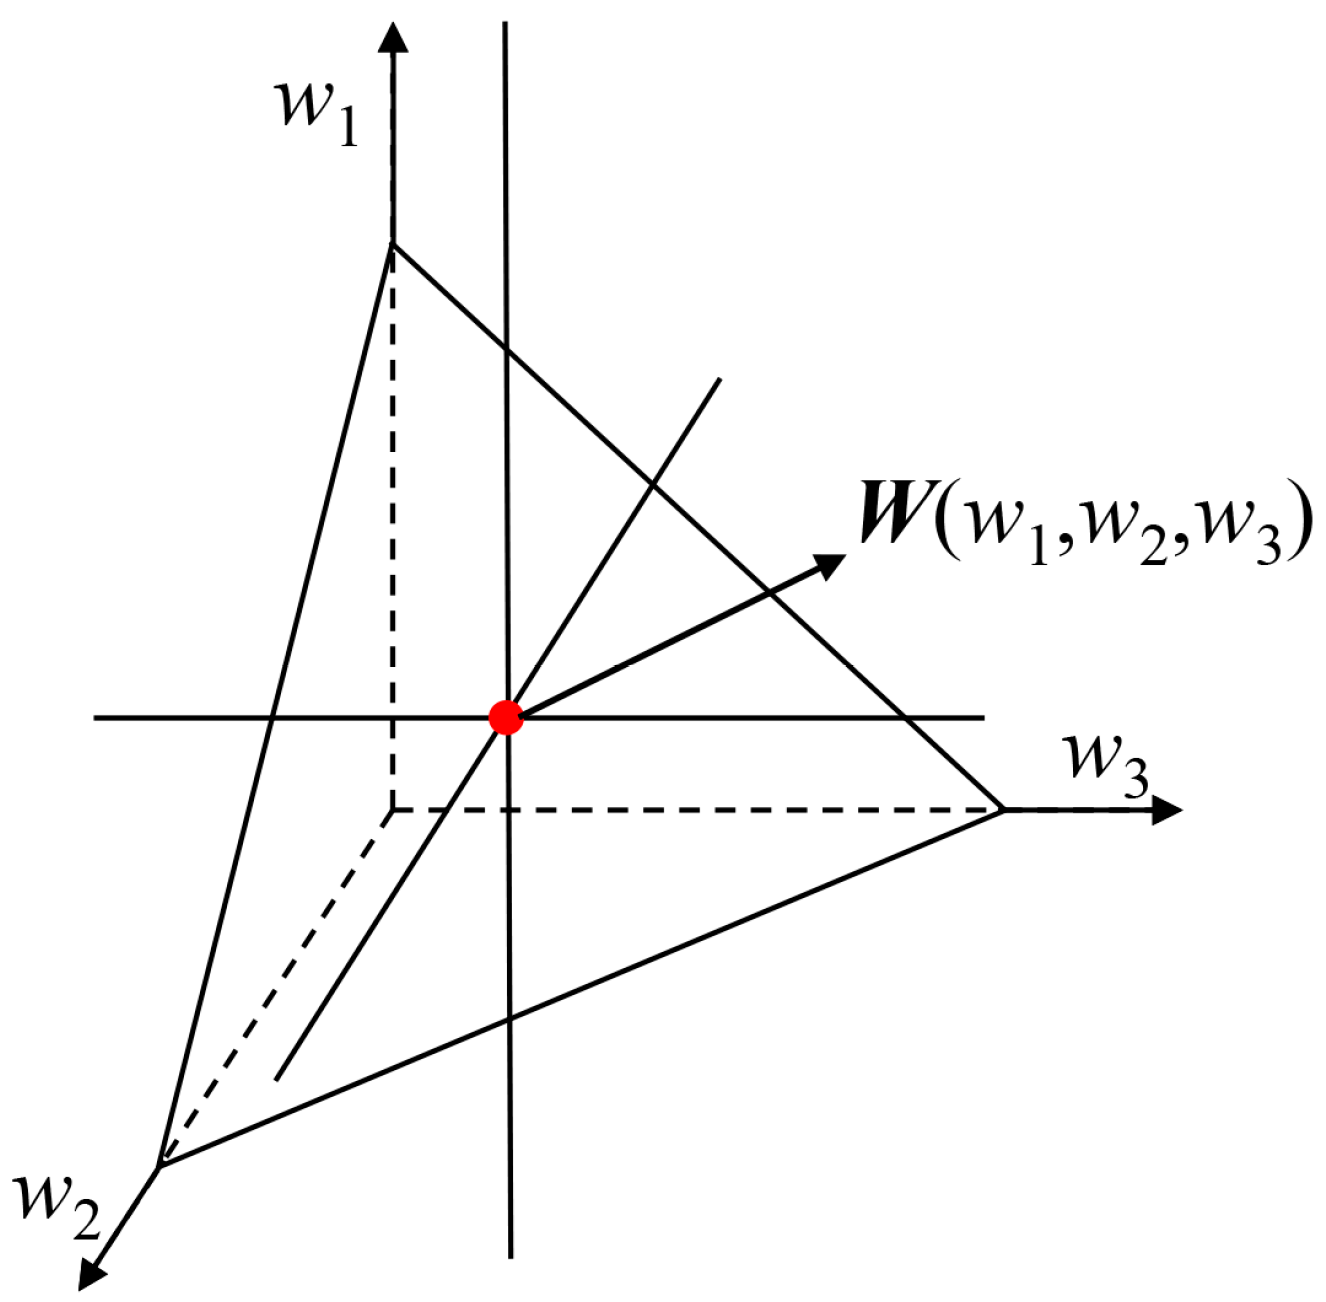
When indicator weights are deterministic values, the feasible weight space is uniquely determined. Taking a three-dimensional space (with three evaluation indicators) as an example, the feasible weight space is a point
W(
w1,
w2,
w3) in the three-dimensional space, where
w1,
w2, and
w3 denote the indicator weights, as shown in
Figure 2.
- (2)
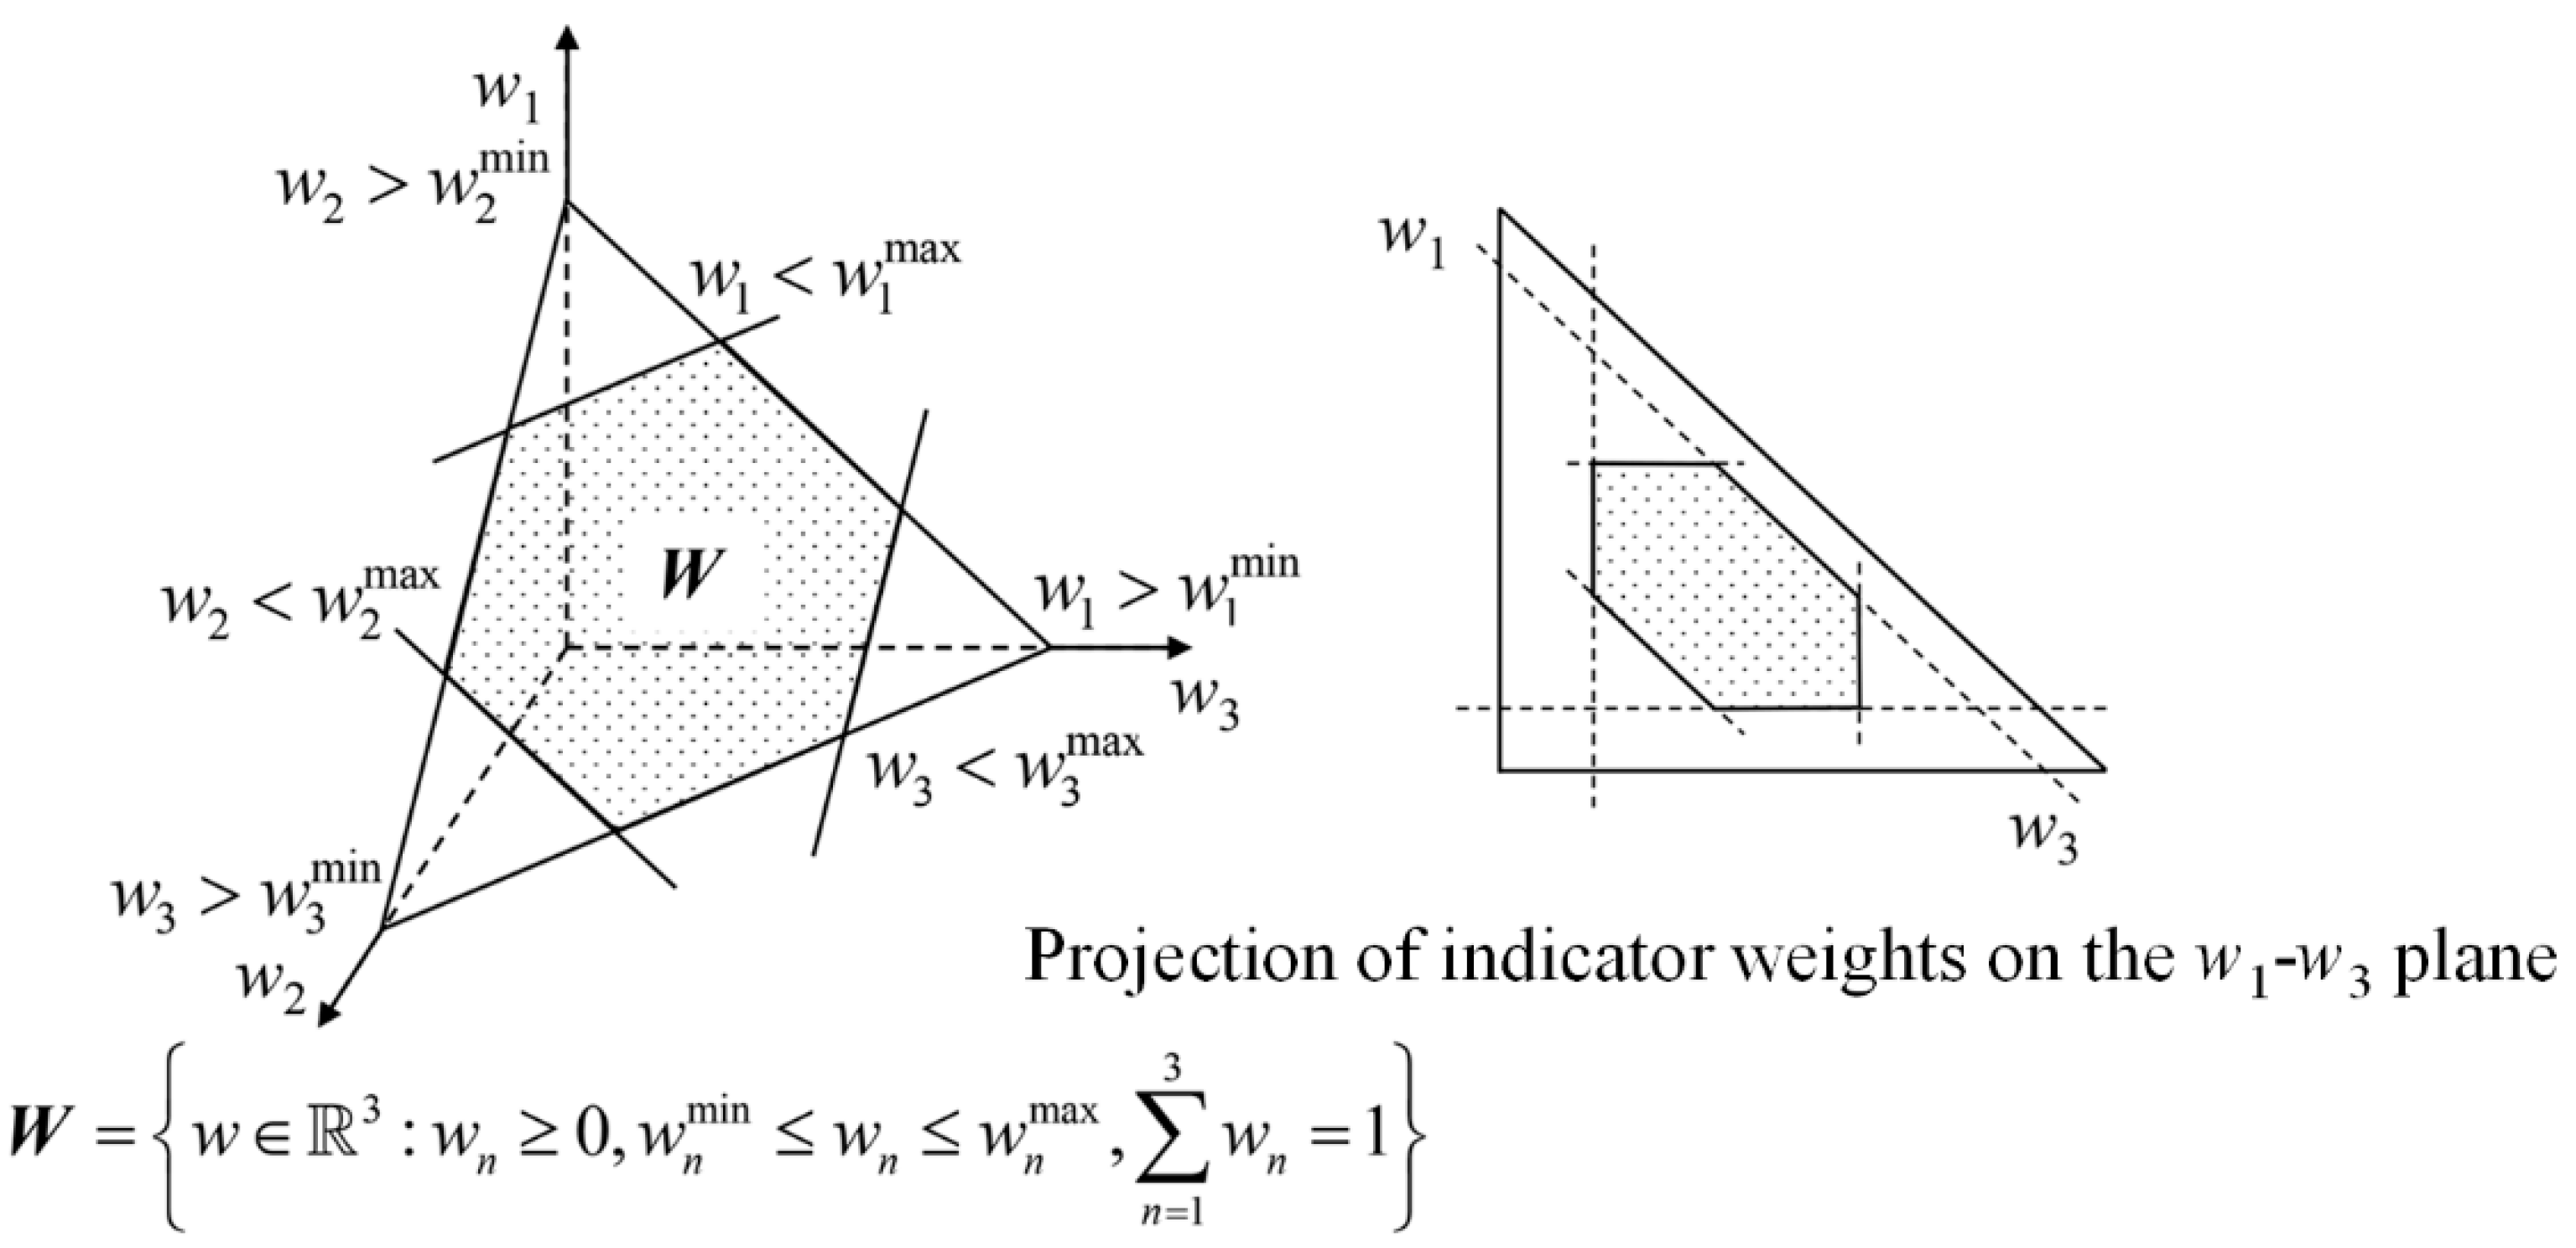
Indicator weights follow a uniform distribution within a specified interval
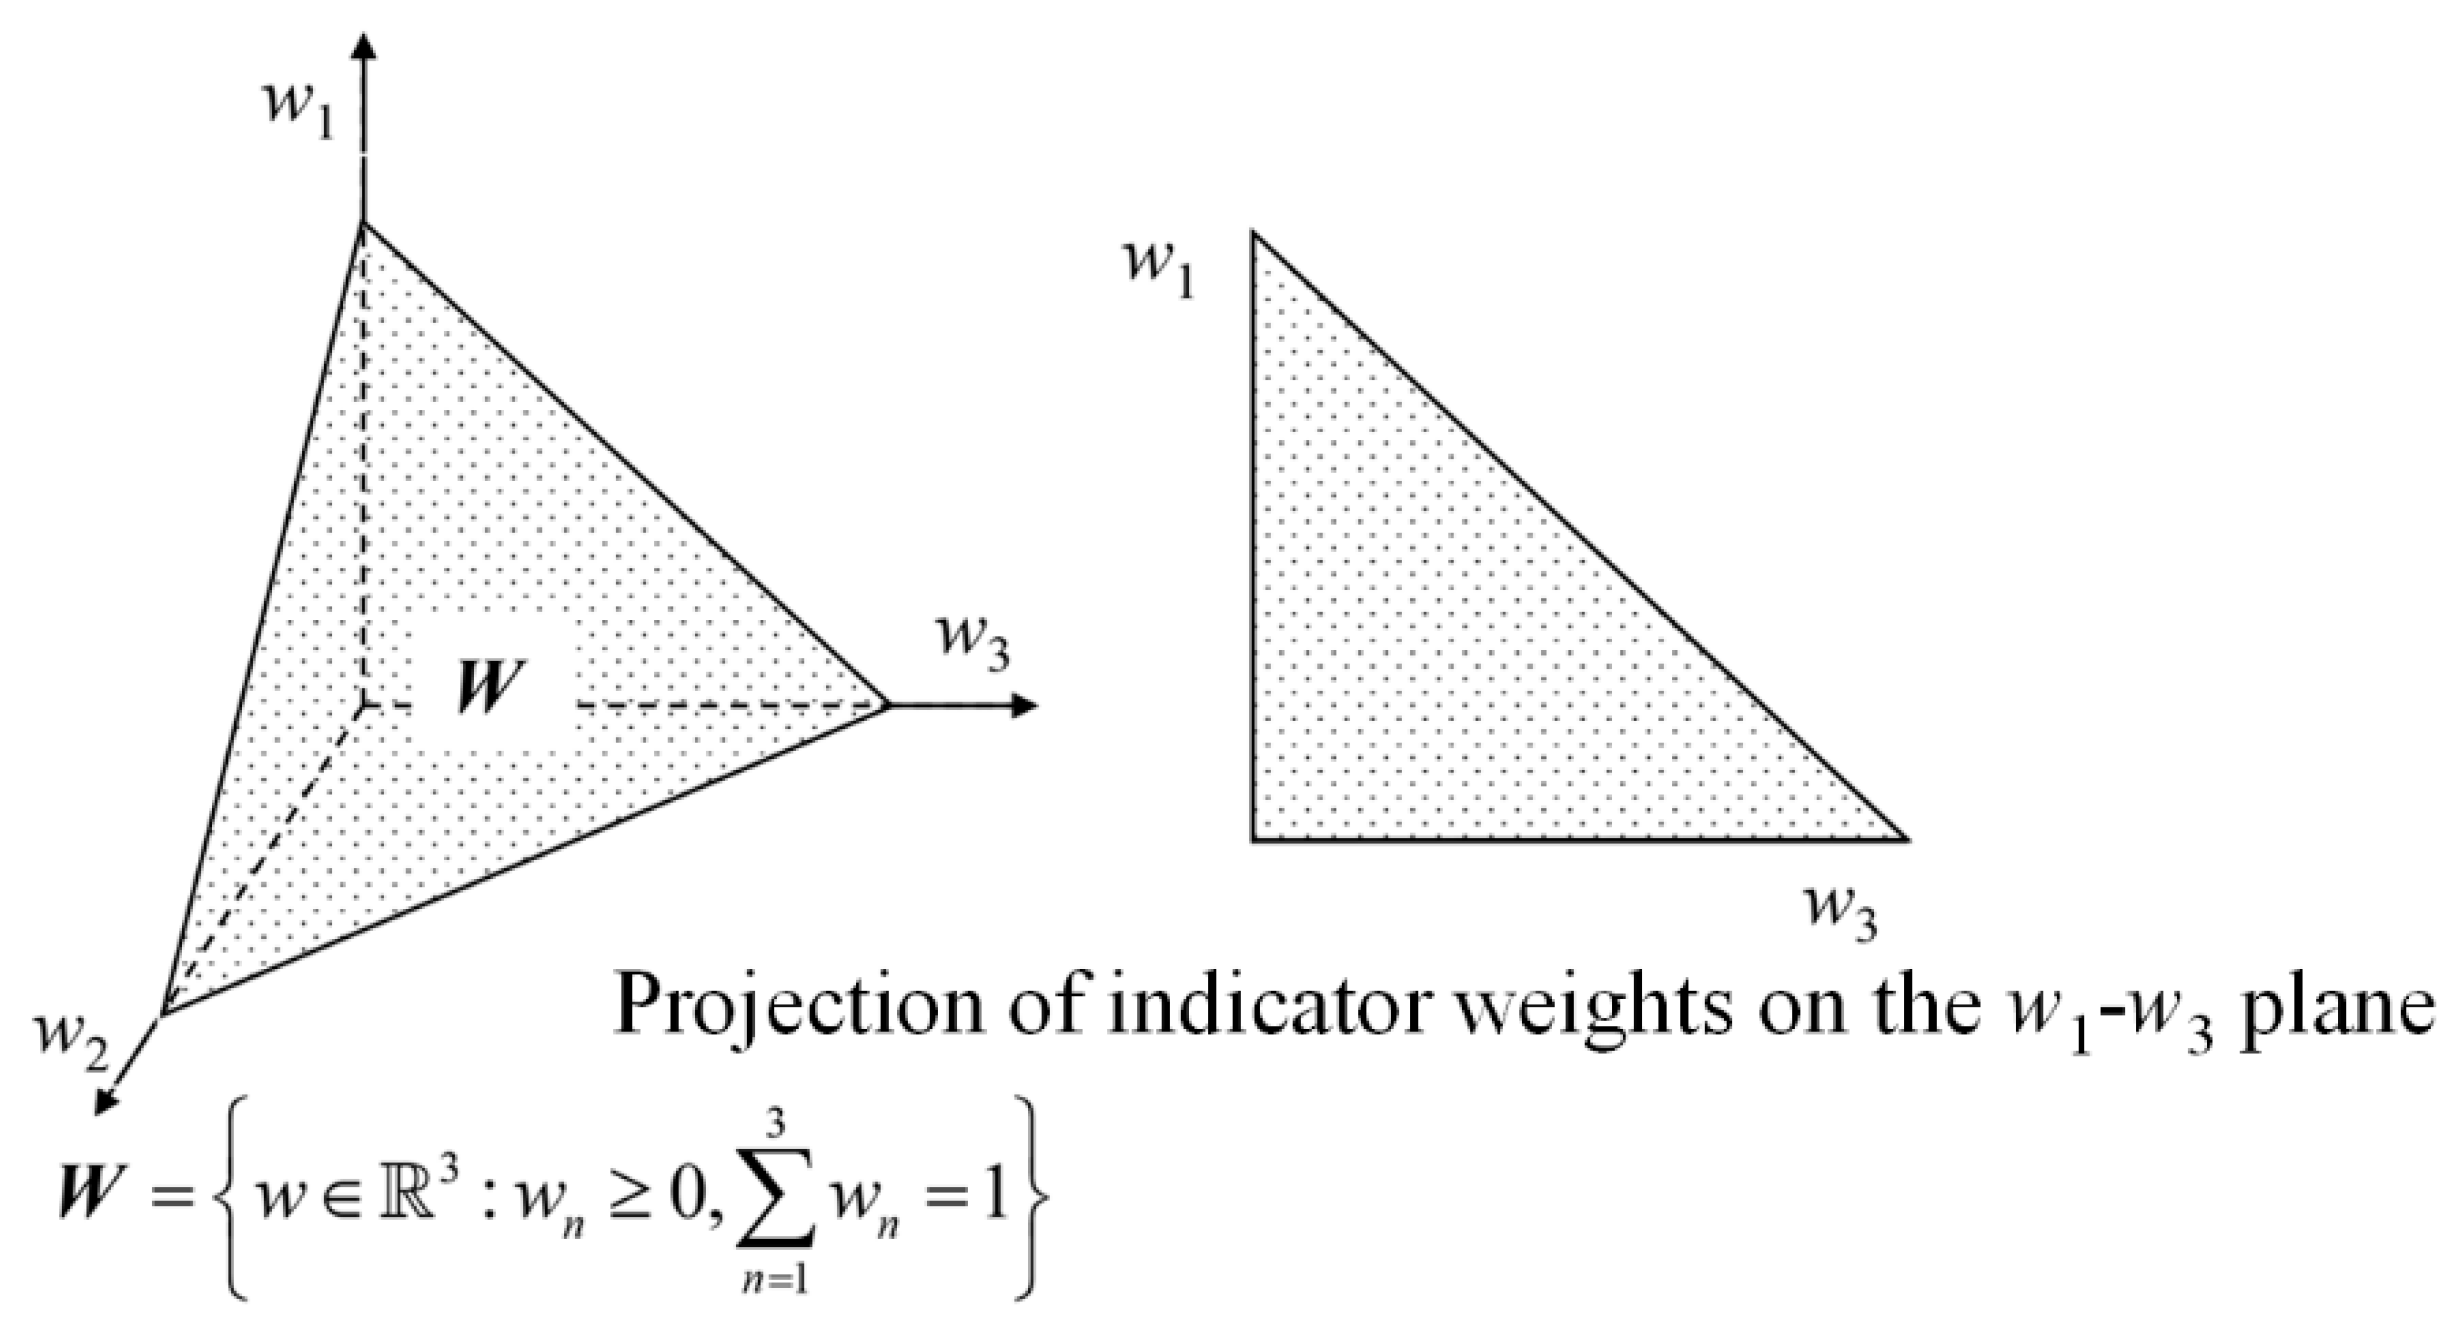
In evaluations, due to the complexity of indicators, differences among weighting methods, or variations in expert opinions, it is often challenging to reach a consensus on weight when dealing with incomplete and uncertain information. Using fixed numerical values to represent weights in such cases may fail to capture the inherent variability of indicators and methodological differences. Interval estimation of weights provides a more robust approach to express this uncertainty and avoid information loss. Taking a three-dimensional space as an example, if indicator weights are assumed to follow a uniform distribution within specified intervals, the FWS is a hexagonal plane as shown in
Figure 3, with the specific expression given by Equation (8):
- (3)
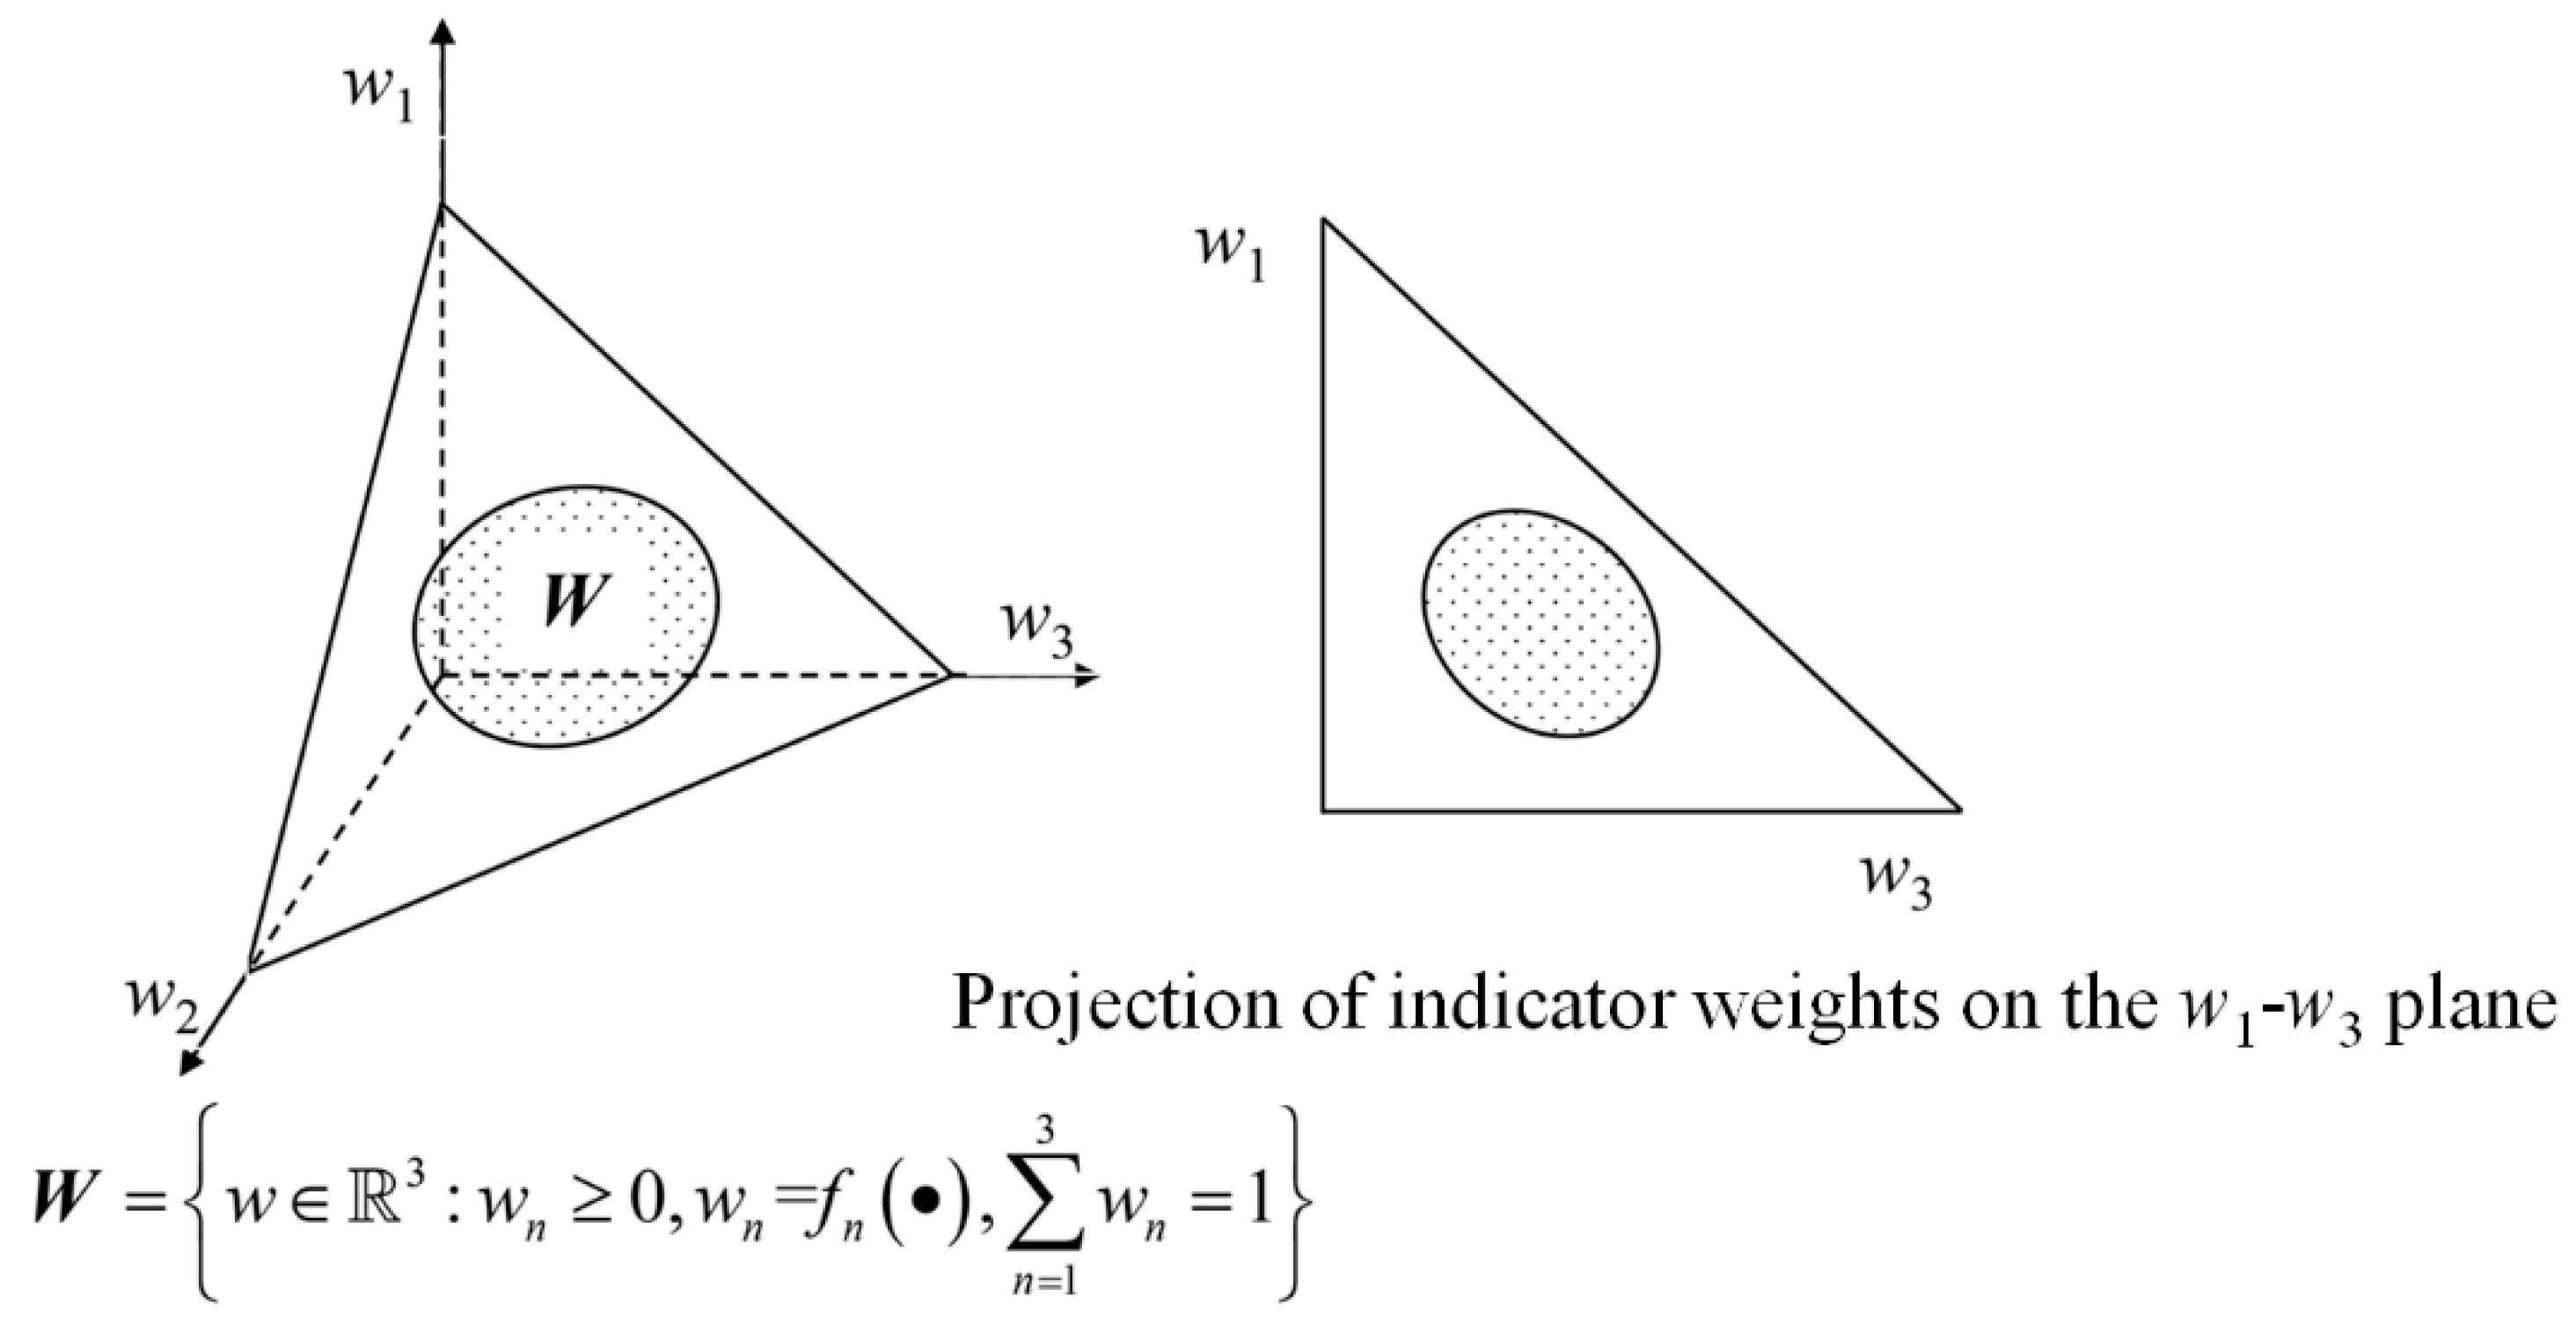
Indicator weights follow an arbitrary type of distribution within a specified interval
In addition to the uniform distribution of indicator weights within specified intervals described above, indicator weights can also be characterized in a more general form, i.e., following an arbitrary type of distribution within specified intervals. Taking a three-dimensional space as an example, the indicator FWS can be described as the shaded area shown in
Figure 4, with the specific expression given by Equation (9):
- (4)
Indicator weight information is completely unknown
Another special case is that due to various factors such as limited knowledge and evaluation environment, it is difficult to accurately provide corresponding weight information for indicators at the initial stage of evaluation. This special case can be addressed by exploring the FWS of the entire weight space through the idea of inverse weight analysis, thereby providing a corresponding reference. Taking a three-dimensional space as an example, the FWS in this case can be described as the triangular region shown in
Figure 5, with the specific expression given by Equation (10):
2.2.2. Multi-Method Weight Assignment for Evaluation Indicators
To more accurately reflect the importance of each indicator and improve the objectivity and accuracy of evaluation results, different weight assignment methods for evaluation indicators have been successively proposed. This paper adopts four weight assignment methods with distinct characteristics (
Table 1):
(M1) Subjective weighting method: Analytic Hierarchy Process (AHP), which calculates weights using the relative magnitude information of numbers;
(M2) Information quantity-based method: Entropy weight method, which calculates weights by using data entropy values, i.e., the magnitude of information;
(M3) Data fluctuation-based method: Criteria Importance Through Intercriteria Correlation (CRITIC), which calculates weights by using data volatility or correlation between data;
(M4) Information concentration-based method: Principal Component Analysis (PCA), which calculates weights based on the principle of data information concentration and uses the variance explanation rate.
2.2.3. Conflict Mitigation Based on Game Theory
Game Theory primarily studies the interactions among formalized incentive structures, serving as a mathematical theory and method for researching phenomena with competitive or confrontational characteristics. In the safety evaluation process of hydraulic sluices, the indicator weights obtained by different weighting methods often exhibit certain conflicts. Therefore, this paper introduces Game Theory into the field of safety evaluation, with the main idea being to perform secondary fusion and aggregation of conflicting indicator weights based on the Nash equilibrium criterion, so as to achieve the purpose of conflict mitigation. The weight set obtained by each method is defined as the basic weight vector,
,
, where L is the number of indicator weighting methods, and the basic weight vectors are derived from different weighting methods adopted. Any linear combination of the basic weight vectors can be expressed as:
where
is the linear combination coefficient.
Taking the Nash equilibrium as the coordination objective, an equilibrium or compromise is sought among the basic weights obtained by different weighting methods, and finally the coordinated weights are determined to minimize the total deviation from each basic weight. The objective function expression used in the optimization is:
The above optimization model can be solved by means of various optimization algorithms (such as Particle Swarm Optimization, PSO) or existing tools (such as the global solver in LINGO 17.0 ×64), and the optimal linear combination coefficients are obtained as:
. The coordinated weight vector after conflict resolution is further calculated using the following equation:
As mentioned above, the game theory optimization method is used to carry out secondary fusion and aggregation of the basic weight vectors into a coordinated weight vector. The feasible weight space (FWS) can then be defined as a subspace expanding outward centered around the coordinated weight point, expressed as:
where λ denotes the weight uncertainty level, and its value is related to the degree of conflict between different weighting methods. A smaller λ can be taken when the conflict between different weighting methods is relatively low and the coordinated weights obtained through optimization calculations are relatively close; when the conflict between different weighting methods is significant, a larger λ should be adopted to obtain a broader FWS covering a wider range.
Using the feasible weight space is obviously more reasonable than only using coordinated weights, as it can incorporate as much weight information as possible in the risk analysis for flood control operation of reservoir groups, thereby avoiding information loss. Furthermore, weight uncertainty can be quantified by any type of probability distribution with interval constraints within the boundaries of the weight feasible region.
2.2.4. Description of Weight Uncertainty
For a specific risk analysis for flood control operation of reservoir groups, indicator weights are affected by many factors. It is difficult to distinguish which factor plays a dominant role. According to the Central Limit Theorem [
30], when a random variable is influenced by multiple factors and it is impossible to determine which factor dominates, the random variable tends to follow a normal distribution,
. Therefore, we assume that the distribution of weight uncertainty in a specific domain tends to be a normal distribution. The expectation of the normal distribution is the coordinated weight, and the standard deviation is taken as one-tenth of the expected value. The rationality is judged according to the 3σ criterion of the normal distribution.
2.3. Reservoir Group Flood Control Decision-Making Risk Definition
Risk is generally used to describe the probability of adverse events or the combination of such probabilities with corresponding consequences. According to the characteristics of flood control operation for reservoir groups, we define the decision-making risk as the probability that the actual flood control safety level fails to reach the evaluated safety level due to the uncertainties of flood control risk evaluation indicators and their weights. Based on this definition, for the
t-th evaluation indicator, the decision-making risk of flood control operation for reservoir groups is expressed as follows:
where
t is the indicator index,
.
represents the risk of the
t-th indicator.
denotes the actual value of the
t-th indicator (herein referring to the flood control safety level).
represents the evaluated value of the
t-th indicator.
2.4. Risk Calculation
Direct integration method [
30], Monte Carlo (MC) simulation method [
31], and First Order Second Moment (FOSM) method [
32] are several commonly used risk calculation methods. The direct integration method requires analytical solution and numerical integration of the risk performance function, which is unrealistic for complex flood control operation risk calculations of reservoir groups. The MC method has been successfully applied to evaluate risks in different fields. However, the calculation accuracy of the MC method usually depends on the sample size, so this method is time-consuming and may not meet the timeliness requirements of risk evaluation and real-time early warning for flood control operation of reservoir groups. The FOSM method only requires the first two moments (i.e., mathematical expectation and variance) of random variables to calculate reliability and risk, making it an effective risk assessment method, especially for complex systems. To improve calculation accuracy, methods such as First Order Third Moment (FOTM) and Second Order Third Moment (SOTM) have been further proposed. However, while improving accuracy, these methods also bring higher calculation costs and stricter data requirements. This paper selects the FOSM method for risk calculation. Risk analysis of flood control operation decisions for reservoir groups is a new research hotspot. To better understand the application of FOSM in this research, this section first briefly introduces its main principles, and then derives the decision-making risk calculation formula based on this.
2.4.1. FOSM Method
A system’s failure risk
is defined as
where
Capacity denotes the carrying capacity of the system;
Load represents the load acting on the system.
represents the probability that the load acting on the system exceeds the carrying capacity.
Define the performance function , then the risk can be written as . is a function of , where are independent uncertain factors applied to the system, i.e., .
Carrying out a Taylor expansion of the performance function around the mean point
and quadratic and higher-order terms, the performance function can be expressed as:
where
are the mean points of
.
The expectation and variance of the performance function can be further written as:
Then reliability index
can be calculated by the following equation:
Assuming that the performance function follows a normal distribution, the risk
can be calculated as follows:
where
is the probability density function of the performance function
G.
Define the variable
k as
. Then the performance function
G can be written as
. The risk
can be further calculated by the following equation:
where
is the cumulative distribution function (CDF) of the standard normal variable.
2.4.2. Calculation Formula of Reservoir Group Flood Control Decision-Making Risk Based on FOSM
The performance function
is defined as follows:
Then reservoir group flood control decision-making risk can be written as
Equations (23) and (24) involve two uncertain variables: the evaluation indicator value and its weight . To calculate decision-making risk using the FOSM method, the mean values of the evaluation indicator value and its weight are required. Therefore, the risk calculation can be performed as follows:
- (1)
Solution for Risk of the t-th Indicator
For simplicity, each variable is abbreviated as follows in the derivation:
Then the
can be written as:
Carrying out a Taylor expansion of
around the mean point
and ignoring quadratic and higher-order terms, y can be written as:
Then the
and
can be written as:
Unabbreviate the symbols
y,
and
, the mean and variance of
can be written as:
The reliability index
and risk
of the
t-th indicator can be calculated as:
- (2)
Comprehensive Risk Solution
Assume that the uncertainties in the indicator value and weight of the
t-th indicator only affect the
t-th indicator, that is, the performance functions
of different indicators are independent. Then, the expected value and variance of the performance function for comprehensive evaluation are calculated as follows:
The comprehensive reliability index
and risk
can be further calculated as:
3. Case Study
3.1. Reservoir Group System
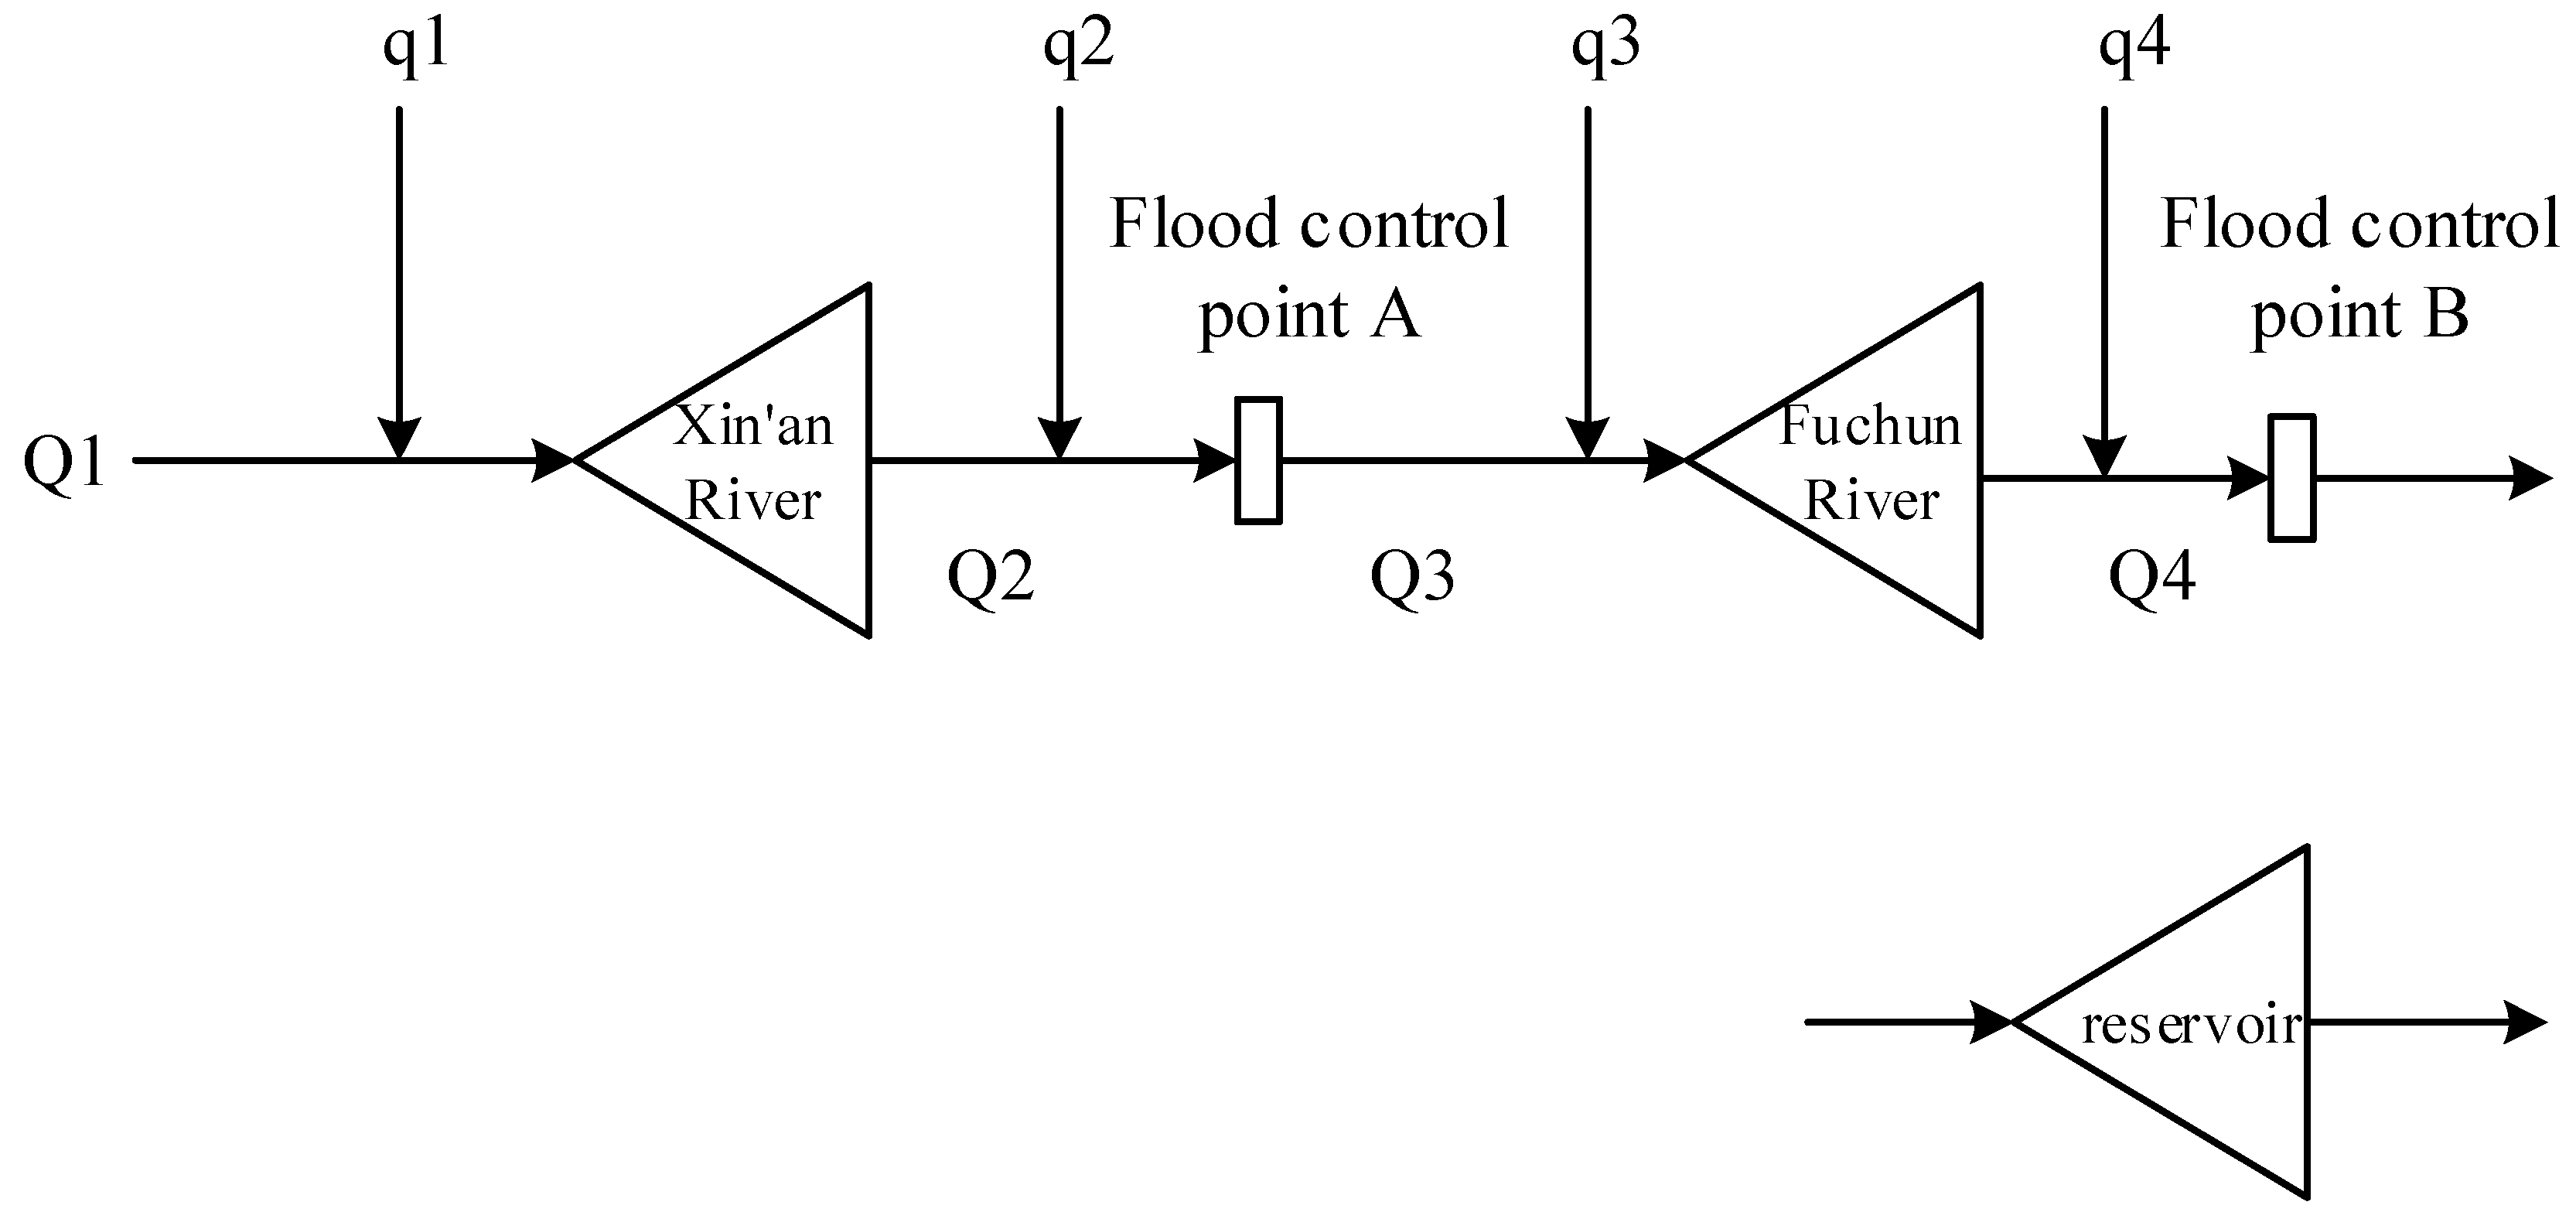
Case study is carried out on the cascade reservoir group system of Xin’an River and Fuchun River in the Qiantang River Basin. The two reservoirs and their downstream flood control objects can be generalized into a flood control system of “two reservoirs and two flood control points”, as shown in
Figure 6.
Xin’an River Reservoir (Upstream Controlling Reservoir)
Watershed Control: Dam site controls a drainage area of 10,480 km2 (19.6% of Qiantang River Basin), with an average annual flow of 370 m3/s.
Engineering Parameters: Normal water level 108 m, dam height 105 m, normal storage capacity 17.84 billion m3, regulated storage capacity 10.26 billion m3 (multi-year regulation, capacity coefficient 27.7%).
Flood Control Role: Intercepts upstream floods via “pre-discharge—peak interception—staggered discharge”, protecting Jiande, Tonglu, and western Hangzhou (peak reduction rate 66% during 2020 9-gate discharge).
Fuchun River Reservoir (Midstream Regulating Reservoir)
Watershed Control: Dam site controls 31,645 km2 (59.7% of Qiantang River Basin), average annual flow 1000 m3/s.
Engineering Parameters: Normal water level 23.5 m, dam height 23.5 m, normal storage capacity 440 million m3, regulated storage capacity 200 million m3 (daily regulation, capacity coefficient 0.5%).
Flood Control Role: Inherits Xin’an River’s discharge, adjusts Fuchun River flood peaks, and protects Hangzhou’s main urban area, Fuyang, and Tonglu by collaborating with tides (e.g., discharge ≤ 5000 m3/s).
The basin faces typical multi-source uncertainties in flood control: (i) Temporal variability of indicators (e.g., sudden rainfall-induced fluctuations in upstream inflows); (ii) Weight conflicts in multi-method weighting (e.g., subjective preferences for “upstream safety” vs. objective data emphasizing “downstream inundation risk”). These challenges are not unique to the Qiantang River Basin but are common in reservoir groups worldwide.
In this case study, Python 3.9 was chosen for its extensive ecosystem of data science libraries. For LSTM network implementation: TensorFlow 2.10 with Keras API, used to build and train the sequential model for temporal indicator uncertainty quantification. NumPy 1.24 and SciPy 1.10 were applied for game theory-based weight coordination. All code was executed with a 64-bit Windows 10 operating system, using an Intel Core i7-12700H processor and 32 GB RAM to ensure computational efficiency. The case study data is sourced from the Zhejiang Province Hydrological Management Center.
3.2. Uncertainty of Evaluation Indicators
3.2.1. Risk Assessment Indicator System
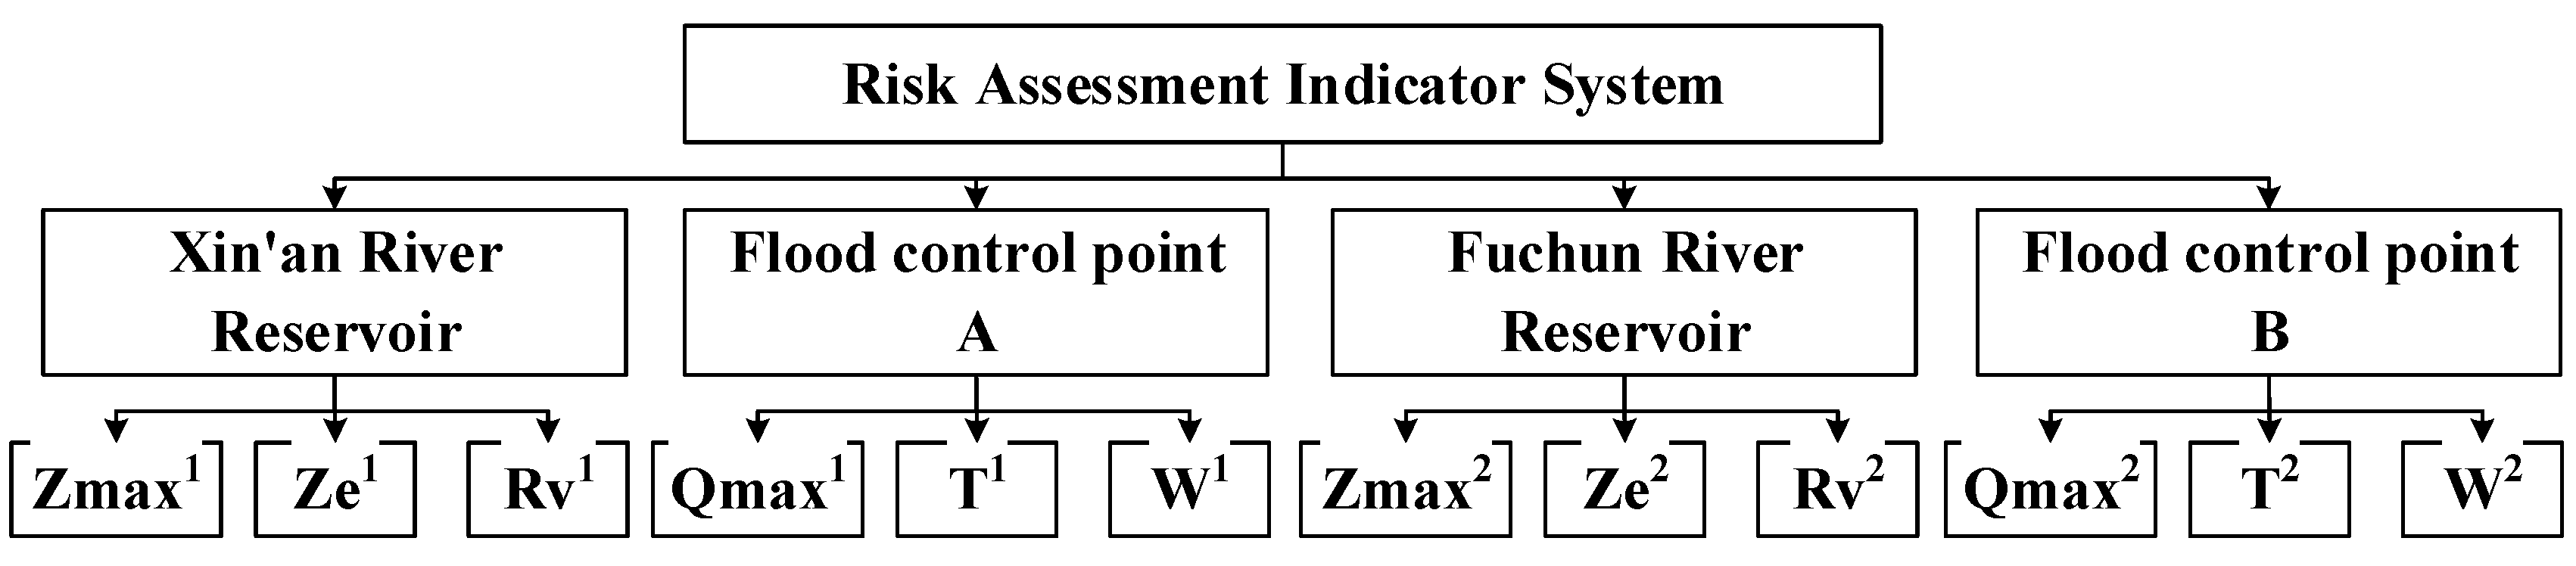
The construction of the multi-attribute decision-making indicator system for reservoir group flood control operation mainly includes three aspects: determination of the indicator system structure, indicator selection, and interpretation of indicator meanings. For flood control operation of reservoir groups during the flood season, it is necessary to comprehensively consider objectives such as the safety of reservoirs and upstream areas, the safety of downstream flood control objects, subsequent flood control capacity, and the coordination of flood control safety between upstream and downstream. In this regard, this study comprehensively considers the principles of operability, relative completeness, conciseness, and easy accessibility of indicator data, and selects six cost-type indicators (i.e., the smaller the better), including the maximum flood control water level (Zmax), the water level at the end of the operation period (Ze), the ratio of flood control storage used (Rv, the flood control storage used/total storage capacity), the maximum flow at the flood control point (Qmax), the duration of the flood control point exceeding the safe discharge (T), and the excess flood volume at the flood control point (W), to construct a hierarchical structure composed of the target layer, criterion layer, and indicator layer.
In view of the characteristics of the “two reservoirs and two flood control points” flood control system studied in this study, 12 evaluation indicators measuring the safety of reservoirs and flood control points are selected to construct a multi-attribute decision-making indicator system composed of three levels, as shown in
Figure 7.
3.2.2. Characterization of Indicator Uncertainty
A total of 1000 samples of the above indicators were collected. To eliminate the influence of dimensional differences between indicators and make the results more intuitive, each indicator value was standardized to a benefit-type indicator with a scale of 0–100 points. The data of the first 500 consecutive samples were selected to calibrate the LSTM model. The mathematical expectations and standard deviations of each indicator were obtained using the method proposed in
Section 2.1, as listed in
Table 2.
3.3. Uncertainty of Indicator Weights
The evaluation index system was weighted using various indicator weighting methods mentioned in
Section 2.2, and the results are shown in
Table 2. It can be seen from the table that the indicator weights obtained by the four methods are not completely consistent, showing certain conflicts. To address this, the game theory optimization method proposed in this paper was adopted for conflict resolution and weight aggregation, and the calculated coordinated weights are listed in
Table 3. To describe the randomness of indicator weights, they are defined as normal distribution random variables with interval constraints within the boundary of the weight feasible region. The mean of the normal distribution is the coordinated weight, and the standard deviation is set as one-tenth of the mean. According to the 3σ criterion of the normal distribution, the weights fall within the boundary of the weight feasible region with a probability of 99%.
3.4. Reservoir Group Flood Control Decision-Making Risk Analysis
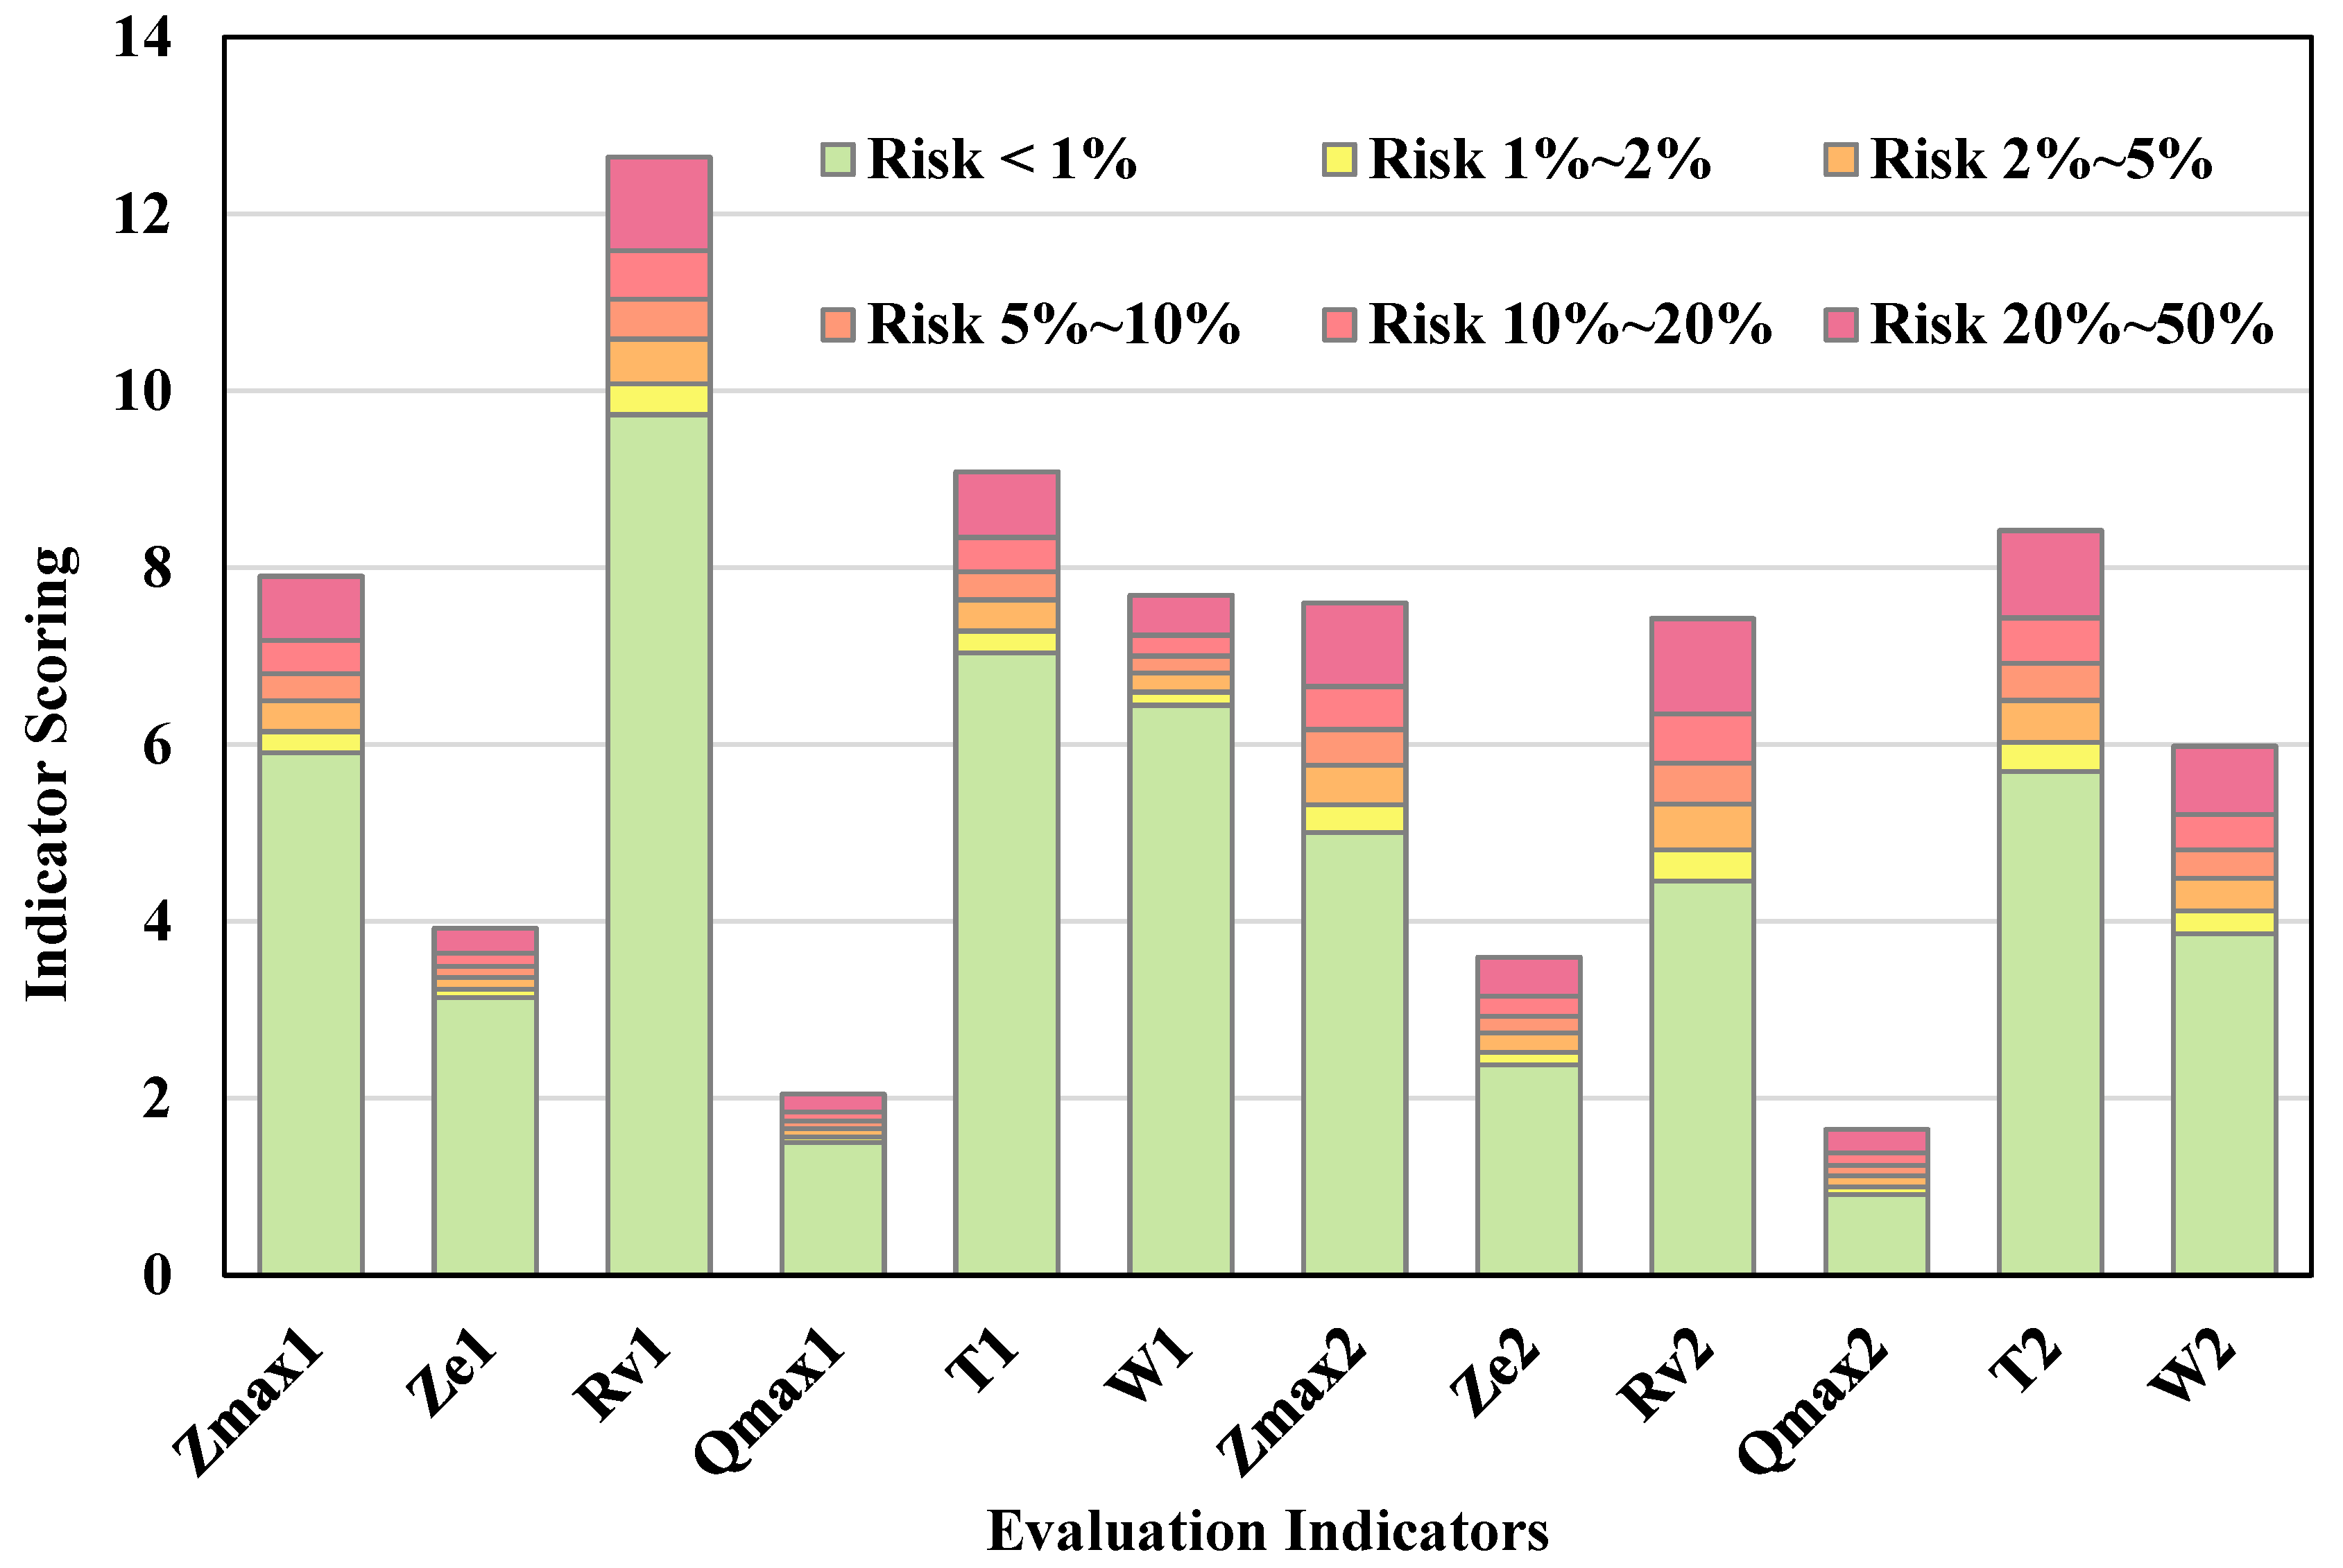
When analyzing the risk of flood control operation decisions for reservoir groups, we first define a risk level range from 1% to 50%. We then look up the reliability indices corresponding to these risk levels in the standard normal distribution table and calculate the scores for each indicator. The calculated scores represent the maximum allowable scores for each indicator under the current risk level. The results of the risk analysis for the flood control operation decisions of the reservoir group in the Qiantang River Basin are shown in
Table 3. Additionally,
Figure 8 is a histogram of the evaluation risks for each indicator, plotted based on
Table 4. This histogram uses different colors to indicate the risk levels corresponding to specific scores of each indicator, providing visual data support for professionals.
3.5. Generalizability of the Model to Other Regions
Flexibility in handling diverse hydrological characteristics: The LSTM component for quantifying temporal indicator uncertainties is not limited to monsoon-influenced basins. It can be adapted to capture indicator dynamics in regions with distinct hydrological regimes—for example, arid basins (e.g., the Murray-Darling Basin) with intermittent flows, or snowmelt-dominated basins (e.g., the Columbia River Basin) by adjusting input features (e.g., incorporating snow cover data) and training parameters. Similarly, the game theory-based weight coordination module, which focuses on reconciling conflicts between subjective and objective weighting results, is applicable regardless of whether the basin prioritizes flood control, hydropower, or ecological goals.
Adaptability to varying operational complexities: For reservoir systems with different operational scales (e.g., single reservoirs vs. large cascade systems) or management constraints (e.g., transboundary basins with cross-country coordination needs, such as the Mekong River), the model can be flexibly adjusted: The LSTM network can expand its input dimensions to include transboundary inflow data, while the game theory module can incorporate additional stakeholders (e.g., multiple countries) into the weight conflict resolution framework.
In the Colorado River Basin (characterized by water scarcity and multi-state operational conflicts), the model could quantify uncertainties in reservoir release indicators via LSTM and reconcile weight conflicts between upstream (water storage) and downstream (agricultural irrigation) priorities using game theory—demonstrating its adaptability to distinct hydrological and operational contexts.
In summary, while region-specific parameter tuning (e.g., LSTM training data length, game theory conflict coefficients) may be required, the core framework of integrating LSTM and game theory to address multi-source uncertainties in flood control decision-making is generalizable to diverse basins globally. Future work will further validate this by applying the model to basins with contrasting characteristics (e.g., the Nile River Basin) to strengthen evidence of its broad applicability.
4. Conclusions
The risk analysis model for flood control scheduling decisions in reservoir groups constructed in this study achieves interdisciplinary methodological innovations combining decision theory and hydraulic engineering:
Uncertainty Quantification Framework: A three-level analysis system of “indicator time-series modeling-weight conflict resolution-risk probability expression” is established. The LSTM is employed to handle dynamic uncertainties of indicators, game theory optimization is used to resolve discrepancies in weights from multiple methods, forming an uncertainty characterization system including indicator distribution parameters (μ, σ) and weight feasible regions.
Risk Analysis Methodology: Decision-making risk is formalized as the probability of safety level failure under the coupling of multi-dimensional uncertainties, and a risk calculation formula based on FOSM is derived, breaking through the simplified treatment of risks in traditional deterministic decision models.
Engineering Application Value: The proposed risk analysis process has been validated in the Qiantang River Basin reservoir group, capable of providing decision thresholds under different risk tolerances (e.g., upper limits of safety indicators at p = 1%), offering technical support for the transformation of hydraulic engineering from “experience-based decision-making” to “probability-based decision-making”.
The research findings provide a generalizable methodology for decision-making risk analysis in complex water conservancy systems. Follow-up studies can focus on multi-scenario risk simulation under climate change and the risk transmission mechanism of joint scheduling for reservoir groups.


