1. Introduction
Flood events pose significant challenges to riverine regions, triggering infrastructural damage, agricultural losses, and profound socio-economic disruptions. Managing these hazards becomes even more complex in areas with gradient development rivers, where variations in topography and flow patterns exacerbate flood behavior. Addressing this issue is imperative for safeguarding local communities and promoting sustainable water resource utilization. However, the existing flood management frameworks often prove insufficient, highlighting the need for advanced modeling approaches to accurately predict flood propagation and guide effective mitigation strategies.
Flood routing models range across a spectrum of complexity. Hydrological models, such as the Muskingum method, offer computational simplicity but are based on simplified storage–discharge relationships. At the other end, hydrodynamic models solve the full 1D Saint-Venant equations, providing high accuracy for dynamic flows. Intermediate approaches, including kinematic and diffusion wave models, offer a balance between accuracy and computational demand by simplifying the terms in the momentum equation [
1,
2,
3].
With the advent of computer numerical simulation techniques, numerous software tools have emerged to enhance flood prediction accuracy and efficiency. These include HEC-RAS from the U.S. Army Corps of Engineers, the MIKE series from the Danish Institute of Hydraulic Research, and Delft3D developed by Delft University [
4,
5]. Moving beyond purely one-dimensional modeling, researchers have proposed one- and two-dimensional coupled models [
6,
7,
8]. Furthermore, three-dimensional flood simulations leveraging GIS technology have facilitated real-time and dynamic visualizations of flood spread [
9,
10], enabling more nuanced analyses such as dam break scenarios [
11]. A parallel development is the growing application of modern surveying methods like drones and unmanned vessels for high-resolution data acquisition [
12,
13,
14].
In addition to modeling innovations, multi-objective optimization has become a focal area for reconciling flood control with other objectives like power generation and navigation. Chen et al. [
15,
16] introduced a holistic model accommodating these goals, later employing it to configure small- and medium-sized flood utilization schemes for the Xiluodu and Xiangjiaba terraced reservoirs and to develop real-time flood forecasting and scheduling plans for Danjiangkou Reservoir [
17]. More recently, Li et al. [
18] applied the artificial bee colony (ABC) algorithm to optimize long-term flood and power generation scheduling at Wan’an Reservoir, and Zhou et al. [
19] advanced a method for dynamically controlling reservoir flood limit levels under various risk conditions. These studies collectively underscore a trend toward integrated flood management, balancing risk reduction with sustainable resource use.
Despite these advancements, a critical gap persists in integrating high-resolution, field-acquired bathymetric data with hydrodynamic models to develop site-specific, optimized operational rules for cascade reservoirs in topographically complex, gradient-development rivers. Existing flood defense measures in such areas often rely on outdated or generalized data, leading to inaccurate risk assessments and suboptimal operational strategies. This study establishes the upstream and downstream hydropower stations as boundaries. River topographic data were acquired using unmanned vessel bathymetry, and flood propagation processes were simulated using a 1D hydrodynamic model. The flood control capacity was evaluated for flows with a specific probability of exceedance, commonly referred to as 5-year, 10-year, and 20-year return period floods. Integrating flood profile prediction results with flood control operation simulation analyses, we propose engineering measures and operational strategies to enhance regional flood control capacity.
2. Materials and Methods
2.1. Study Area
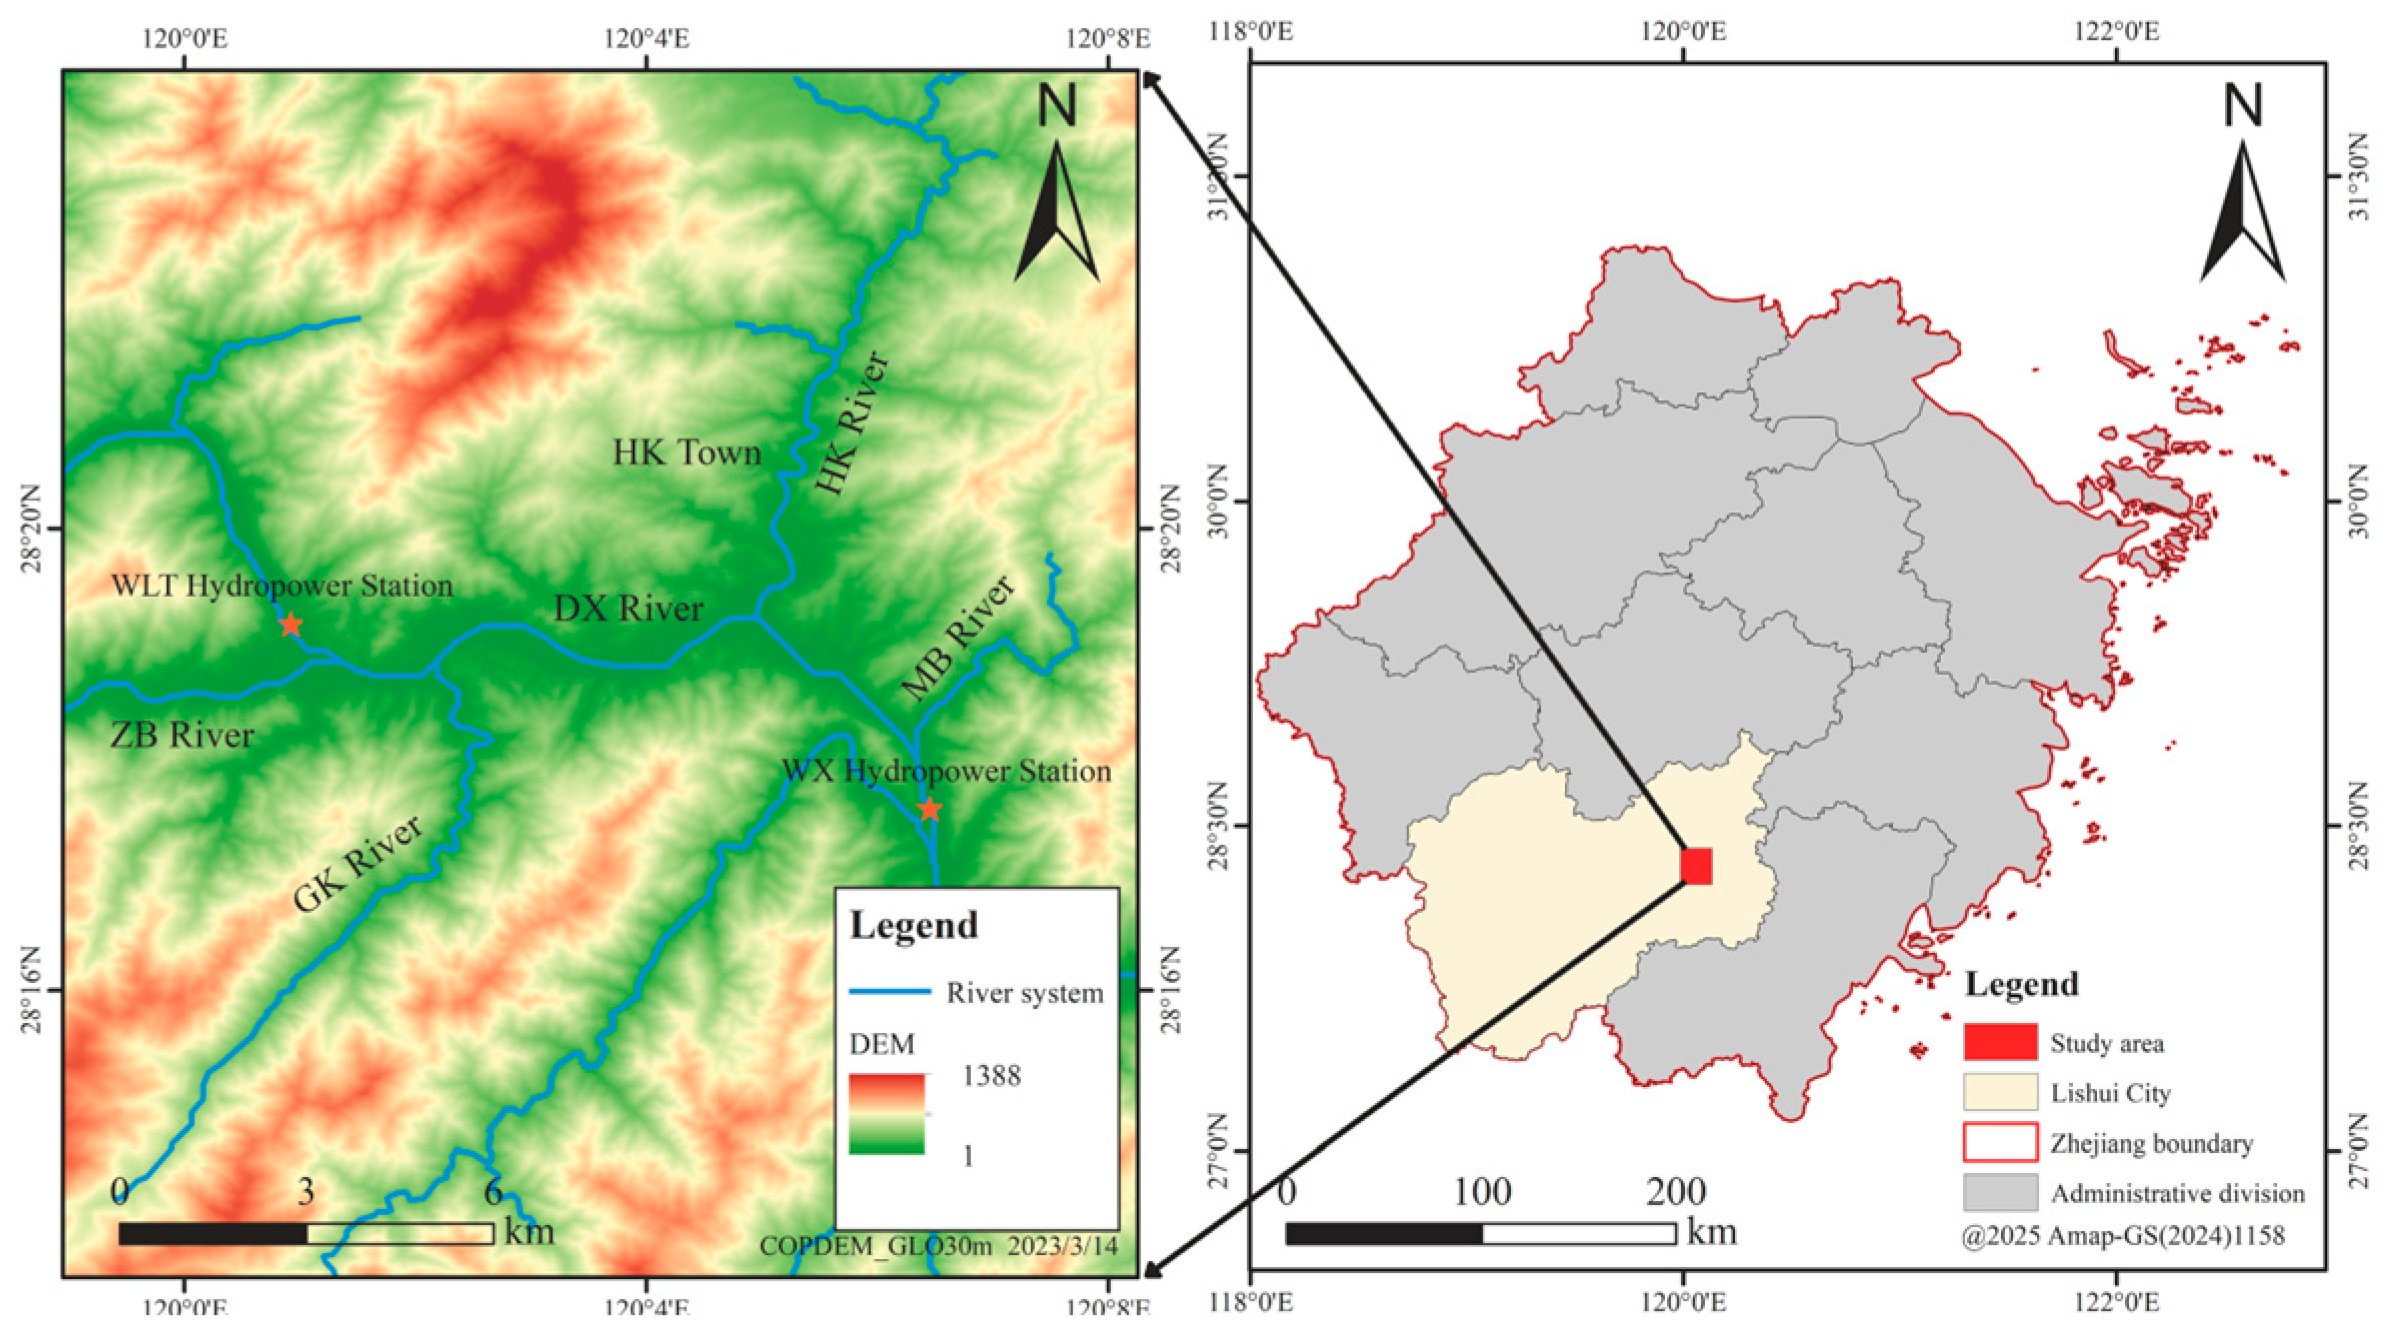
The study area is located in Zhejiang Province including two major rivers: the Daxi (DX) River and the Haikou (HK) River. The geographical distributions of these rivers are illustrated in
Figure 1. The rivers are typical mountain streams. Their main channels and tributaries form a dendritic pattern, generally aligned with the surrounding mountain range. The river valleys on both sides feature a steep terrain, and the channels have a large longitudinal gradient. Riverbeds are covered by thick layers of boulders and cobbles. Both the valley width and channel width vary considerably, creating alternating shallow and deep pools, with the rivers meandering through the valleys yet remaining constrained by steep valley walls. As a result, flow velocities are relatively high. Between the upstream Wuliting (WLT) Hydropower Station and the downstream Waixiong (WX) Hydropower Station, three other rivers—the Zhenbu (ZB) River, the Guankeng (GK) River, and the Mabu (MB) River—converge in a mountainous canyon. In this section, the channels are winding, have a larger longitudinal slope than channel drop, and exhibit turbulent flows. Overall, the watershed’s topography decreases from southwest to northeast and includes a vast mountainous region with pronounced elevation changes. Approximately 10% of the basin lies above an elevation if 1000 m; around 45% is between 600 m and 1000 m, and roughly 30% consists of hills below 250 m.
2.2. Cascade Hydropower System Characteristics
The upstream hydropower station is located 11.38 km from the downstream station, with its dam controlling a catchment area of 8870 km
2 (representing 49% of the entire basin) and having a long-term average annual inflow of 8.66 billion m
3; it features a normal pool level of 36.5 m with a corresponding reservoir capacity of 24.24 million m
3, while the check flood level (
p = 0.5%) is 41.1 m, yielding a total reservoir capacity of 45.75 million m
3. This station utilizes bulb turbines with a design discharge of 810 m
3/s and a rated head of 6.5 m, resulting in an installed capacity of 42 MW that generates an annual energy output of 113 million kW·h with an annual utilization of 2380 h. The characteristic water levels of the upstream hydropower station are detailed in
Table 1.
The downstream hydropower station controls a catchment area of 9265 km
2 above the dam site, with a long-term average annual inflow of 9.01 billion m
3. It maintains a normal pool level of 28 m, corresponding to a reservoir capacity of 17.17 million m
3. Designed for a discharge of 850 m
3/s and operating at a rated head of 7 m, the station has an installed capacity of 48 MW. This configuration yields an annual energy output of 145 million kW·h with 2350 annual utilization hours. The characteristic water levels of the downstream hydropower station are provided in
Table 2.
2.3. River Cross-Section Data Acquisition
2.3.1. Unmanned Vessel Bathymetry Principle
The unmanned vessel measurement system (Shanghai Huace Navigation Technology Co., Ltd., Shanghai, China) comprises four components: the hull, the communication system, the control system, and the data acquisition system. The hull serves as the carrier platform, and it is constructed from corrosion-resistant, lightweight, and high-strength materials. Propelled by stern-mounted dual propellers and powered by onboard lithium batteries, it ensures operational stability. The communication system facilitates bidirectional data transmission between the vessel and the base station. Through radio frequency point-to-point communication, it transmits real-time status, attitude, mission information, and measurement data (including bathymetry, flow velocity, and positioning). Centimeter-level positioning is achieved using an onboard real-time kinematic (RTK) (Shanghai Huace Navigation Technology Co., Ltd., Shanghai, China) rover paired with a reference station (shore-based or utilizing Continuously Operating Reference Station (CORS)). The control system features both autonomous and remote-operated modes, enabling route planning via electronic charts or manual intervention for complex scenarios. As the core component, the data acquisition system collects and records critical data (e.g., bathymetry and positioning) through onboard equipment, including sounders and Acoustic Doppler Current Profiler (ADCP) (Teledyne RD Instruments, Poway, CA, USA). This data is processed by software to provide foundational bathymetric information for topographic mapping.
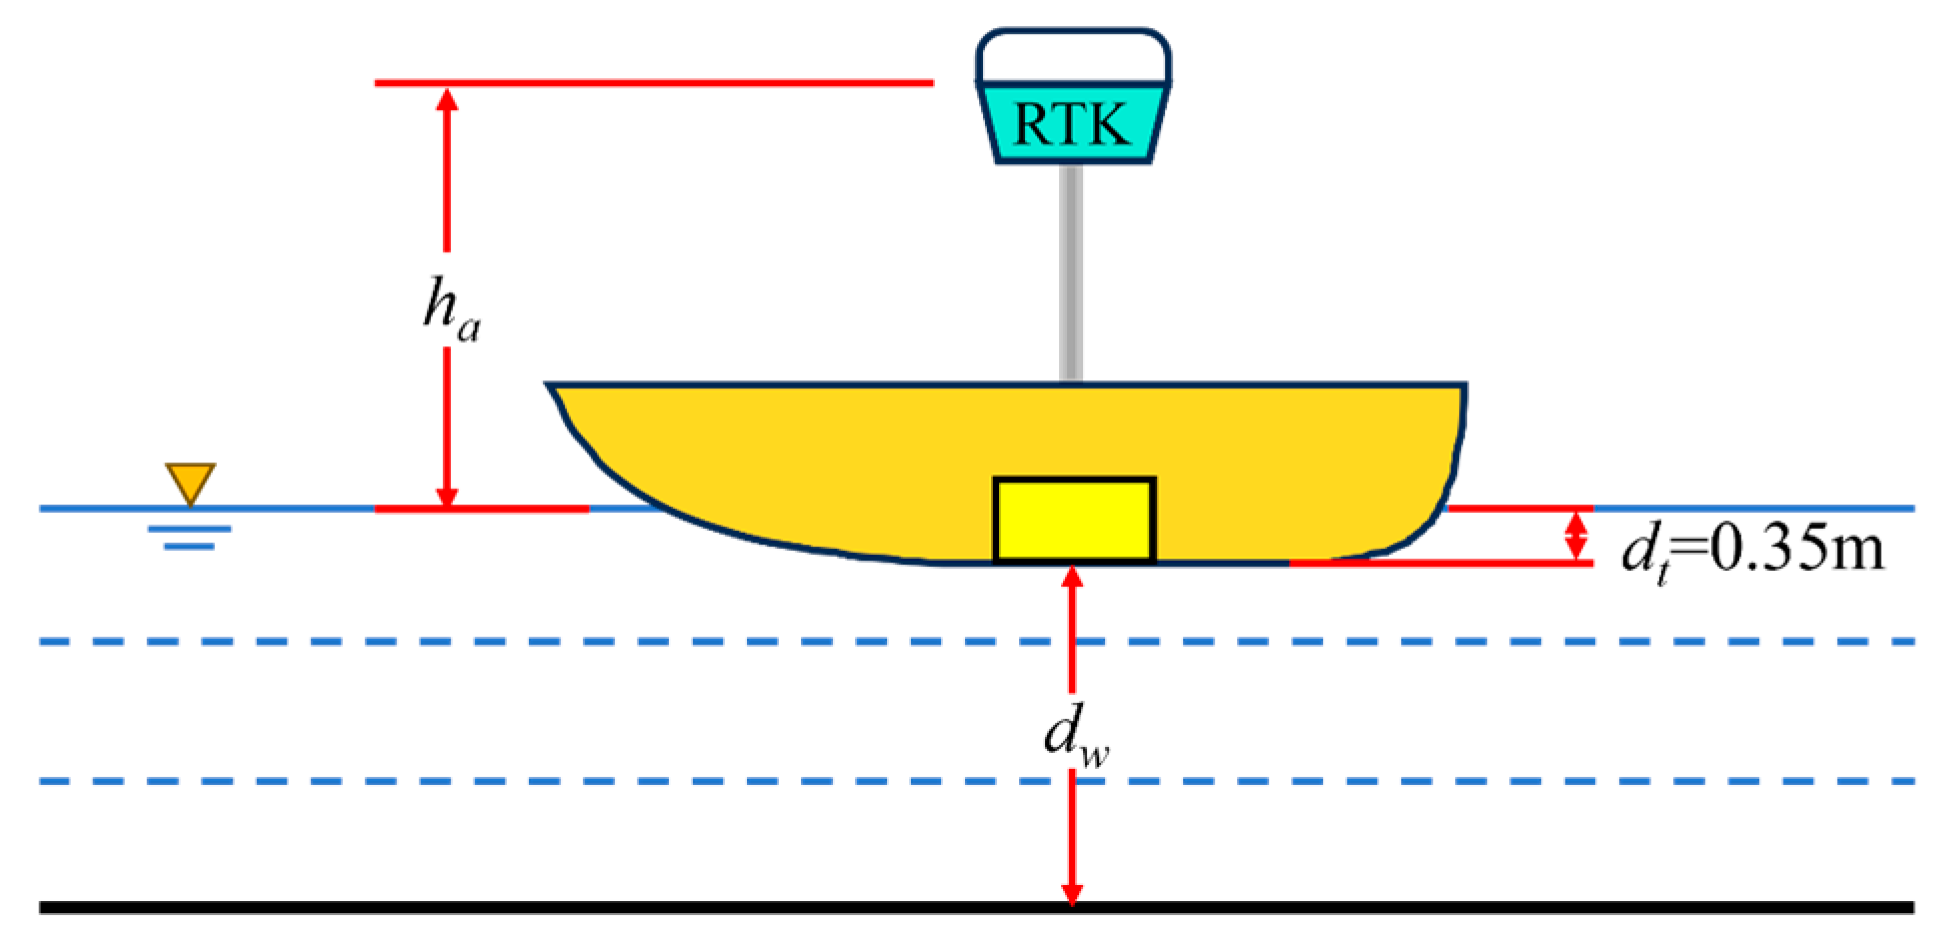
The unmanned vessel is equipped with RTK and a depth sounder. It uses RTK to obtain position information and the depth sounder to obtain water depth information. The following formula is used:
where
is the seafloor elevation, measured in m;
is the phase center elevation measured by RTK, measured in m;
is the antenna height, measured in m;
is the transducer draft, measured in m; and
is the water depth, measured in m.
The operational schematic is shown in
Figure 2.
2.3.2. Bathymetric Survey Methods
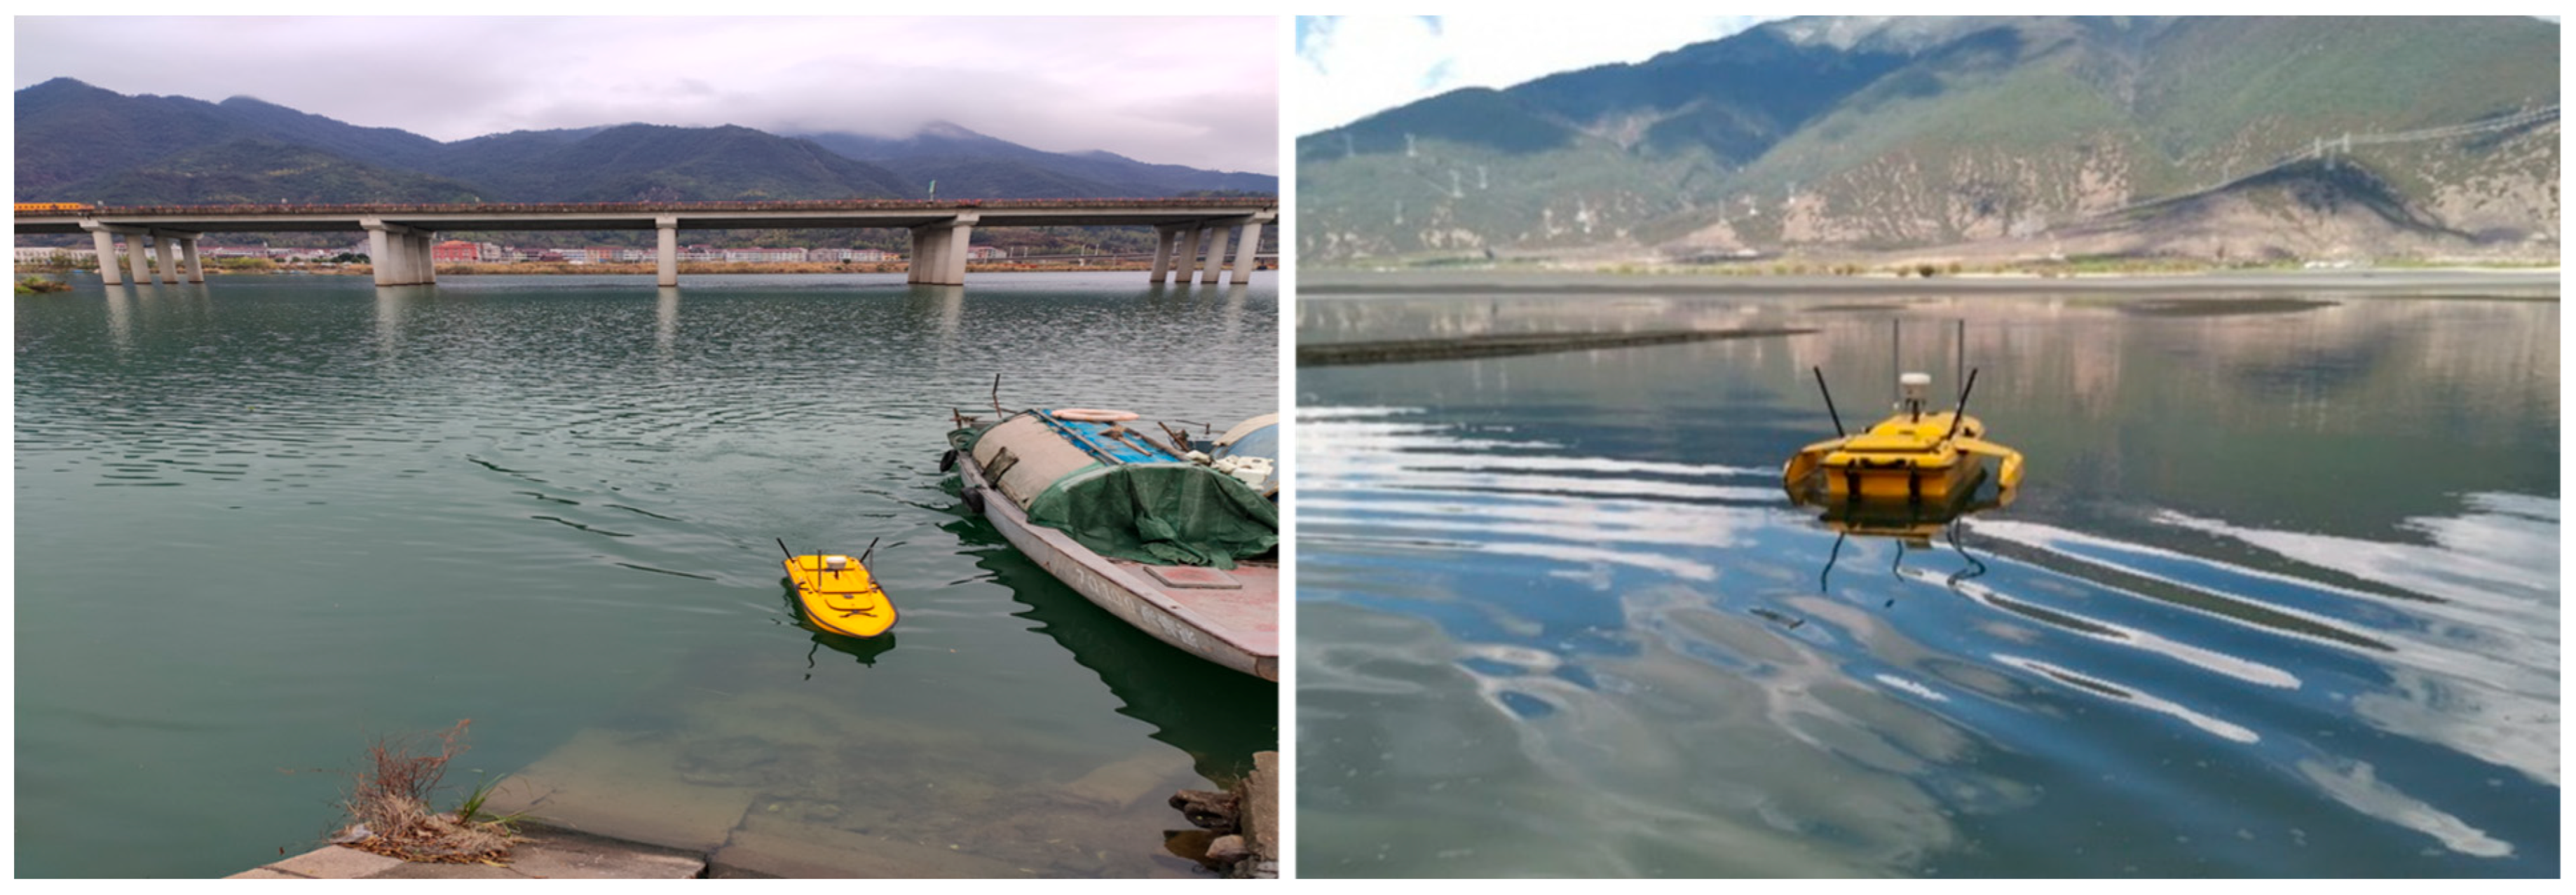
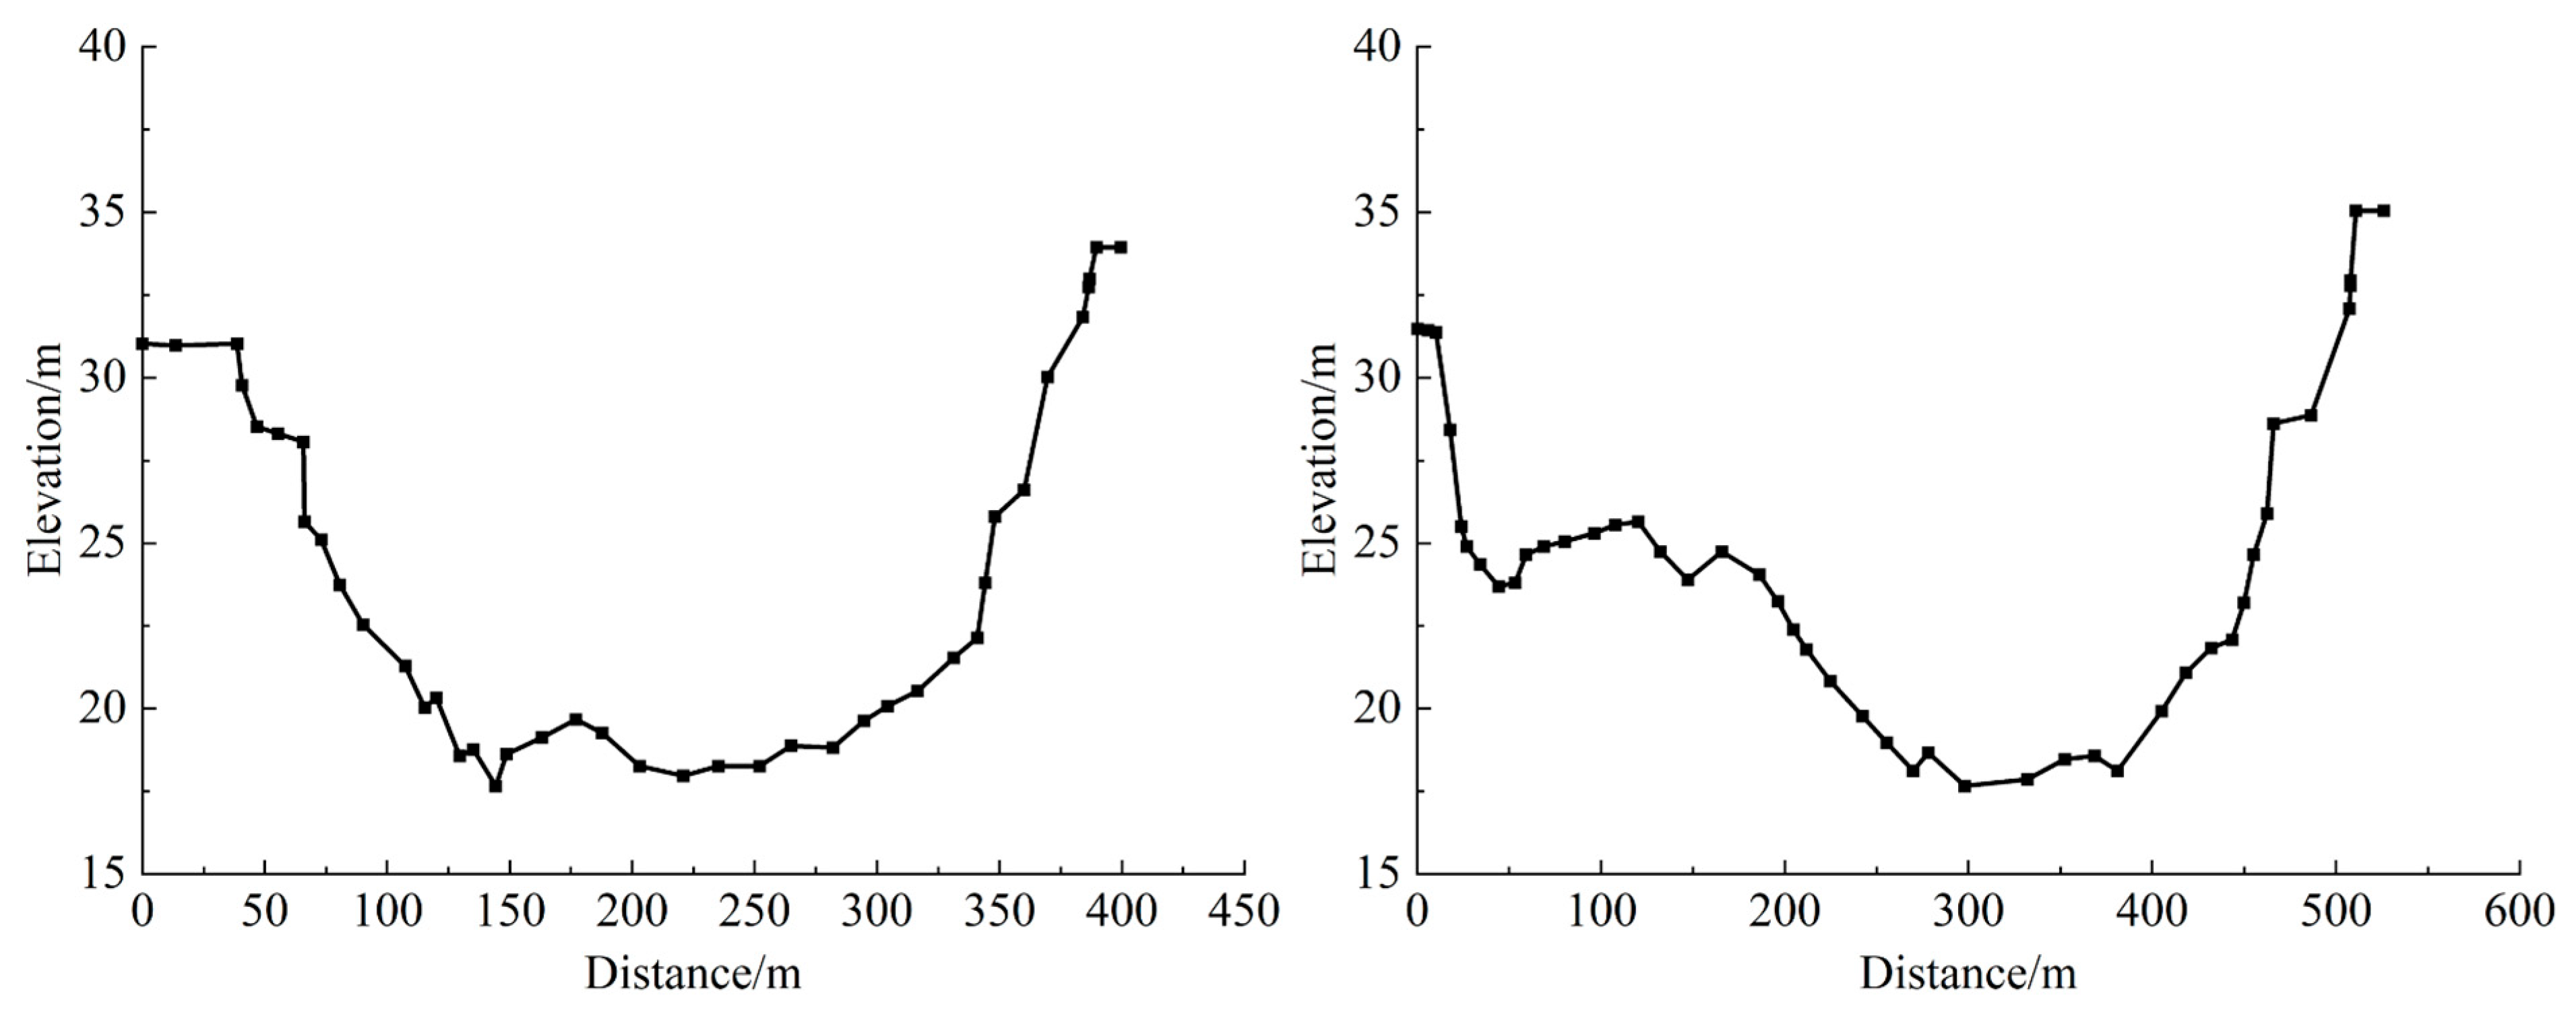
Underwater topographic surveying employed unmanned vessel bathymetry integrated with a centimeter-level accuracy RTK system that assessed Zhejiang CORS, which achieved horizontal and vertical accuracies of ±2 cm and ±3 cm, respectively. The workflow involved planning survey areas and deploying control points on electronic maps while avoiding signal obstructions, establishing a shore-based control center at open locations for equipment connection and parameter configuration (instruments, communication interfaces, and coordinate systems), and conducting initial measurements under manual control with real-time monitoring. Subsequent network RTK 3D bathymetric surveys utilized the GNSS receiver configured as an RTK rover paired with the sounder, exclusively applying fixed solutions. Post-processing refined raw data by eliminating spurious depths—defined here as outliers exceeding three standard deviations from the local depth mean—exported coordinate data to generate underwater topography, extracted river cross-sections using the Global Mapper 20.0 software, and supplemented embankment data through handheld RTK surveys. The field measurement of the river section is shown in
Figure 3. Partial-section measurement results are shown in
Figure 4.
2.4. Hydrodynamic Model Formulation and Setup
2.4.1. Model Formulation
The one-dimensional (1D) hydrodynamic simulations were performed using the HEC-RAS 5.0.7 software [
20], which was developed by the U.S. Army Corps of Engineers. The model solves the full 1D Saint-Venant equations for unsteady flows, which consist of the continuity and momentum equations. The core equations for unsteady flow calculations are the continuity equation and the momentum equation.
Assuming that
Q is the flow discharge of a fluid microcluster passing through a section of cross-sectional area
A per unit time, it is expressed as follows:
where
AT is the area of the overland flow cross-section, measured in m
2;
Q is the flow through the differential control body, measured in m
3/s;
ql is the lateral confluence per unit length;
t is the computational time, measured in s; and
x is the length of the channel, measured in m.
The governing equations is
where
is the discharge of the change in the control body momentum with time and
is the vector sum of all forces acting on the differential control body in the x-direction, including the water pressure
Fp, the component force of gravity in the x-direction
Fg, the frictional resistance
Ff, and the momentum flux. These forces are calculated as follows:
where
is the density of water, measured in kg/m
3;
g is the acceleration of gravity, measured in m/s
2; and
is the distance, measured in m.
The momentum flux can be written as
Substituting Equations (4)–(6) into Equation (3) gives the final momentum, Equation (8), after simplification, where
2.4.2. River Channel Schematization and Spillway Gates
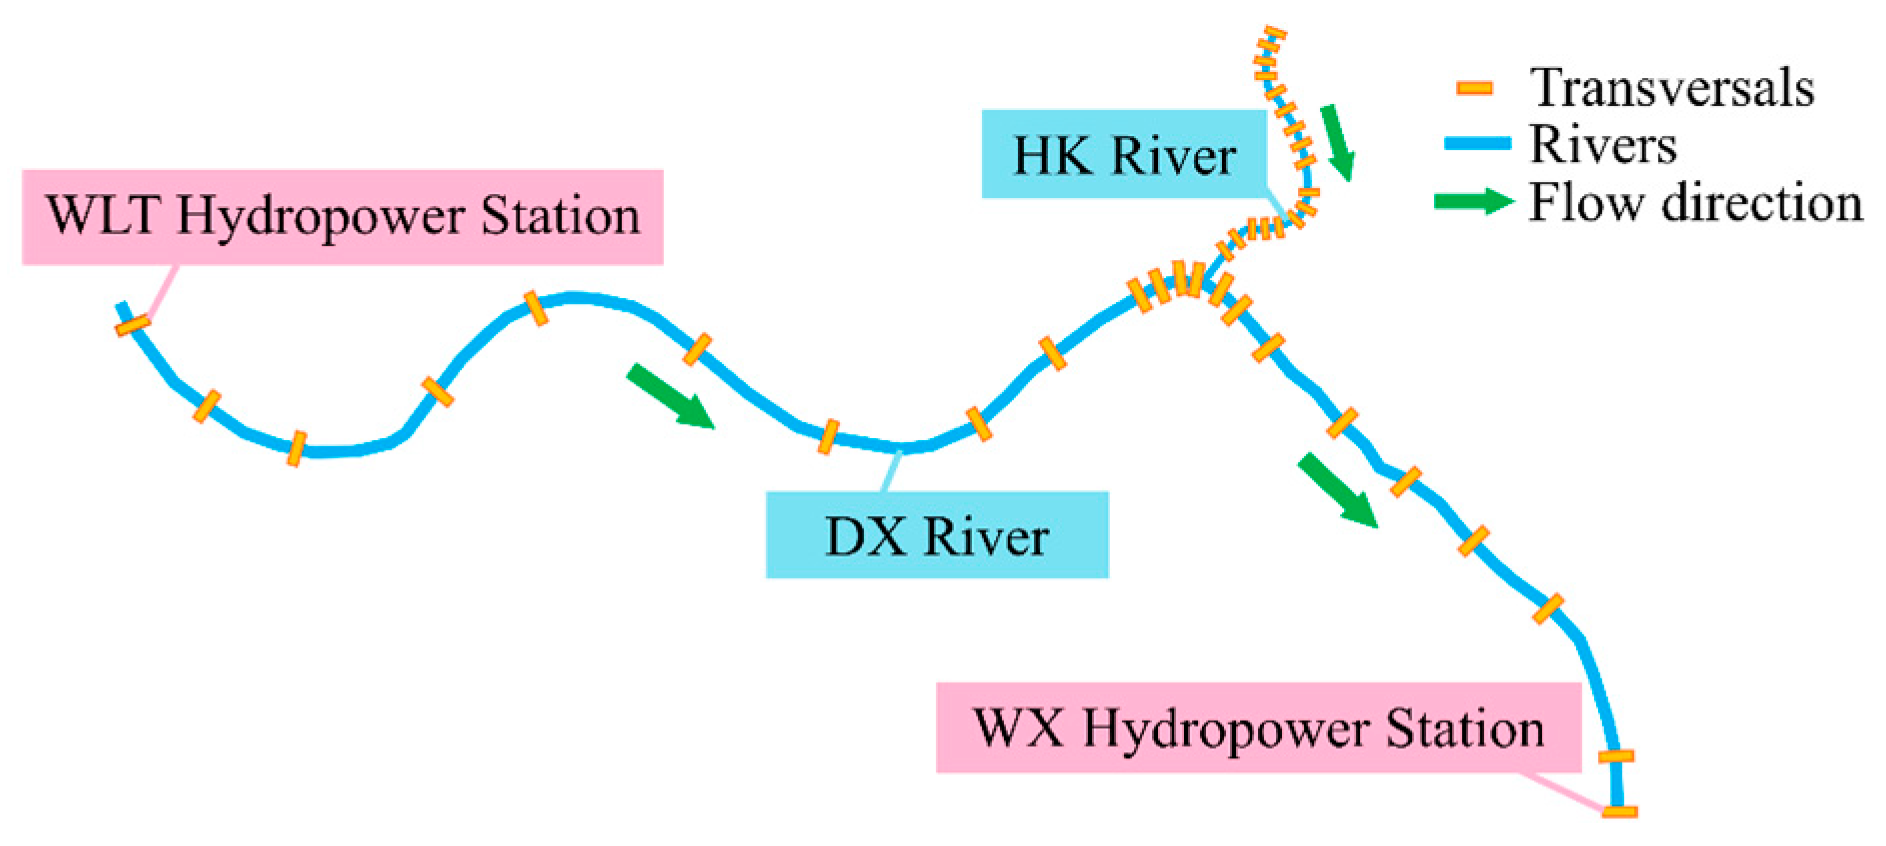
The DX River flows from west to east, beginning at the upstream hydropower station and continuing to the downstream hydropower station. The river’s estuary originates in HK Town and merges into the DX River, making it necessary to include the estuary in any generalization of the river system. Drawing on fundamental river generalization principles and measurements from river cross-sections, 37 representative control sections were selected.
Figure 5 presents the hydrodynamic model used for flood routing. The integration of the high-resolution unmanned vessel bathymetry data into the model followed a systematic workflow. First, the raw bathymetric point cloud data was processed and merged with the terrestrial RTK survey data of the riverbanks to create a continuous digital elevation model (DEM) of the river corridor. Using HEC-GeoRAS within an ArcGIS environment, a river centerline and bank lines were digitized. A total of 37 representative cross-sections were then automatically extracted from the DEM to define the river’s geometry with high fidelity. Finally, the resulting geometric data file, containing the station and elevation data for each cross-section, was imported directly into the HEC-RAS model to define the river’s geometry.
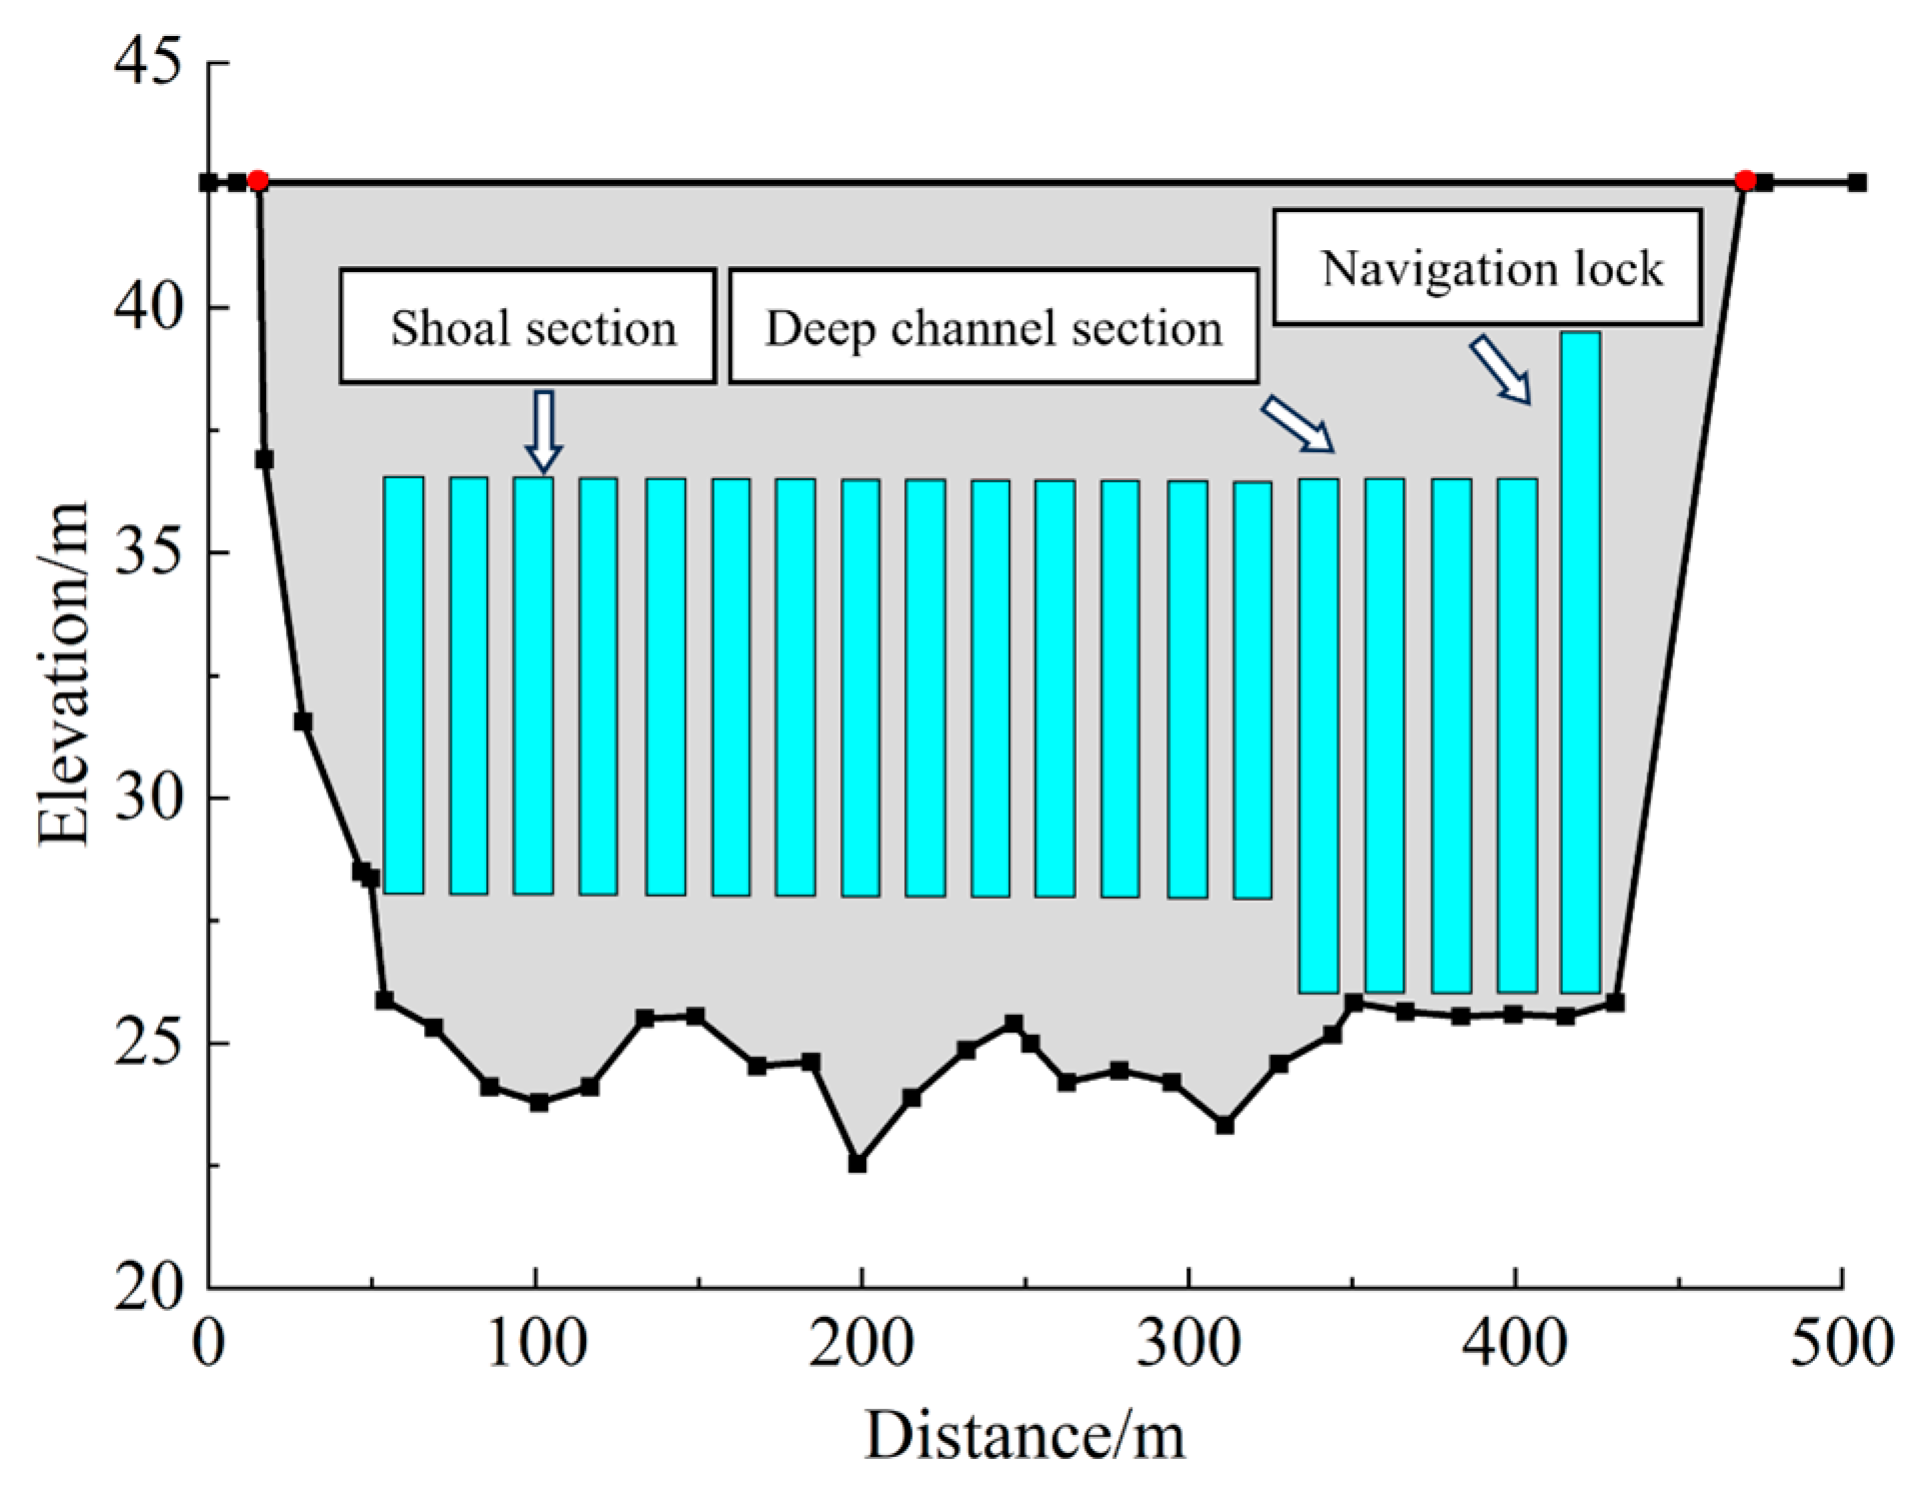
The upstream hydropower station features a dam crest elevation of 42.55 m with 18 spillway gates comprising four 12 m wide gates in the deep channel section at a gate sill elevation of 26.0 m, fourteen 12 m wide gates in the shoal section at a sill elevation of 28.0 m, and one 12 m wide navigation lock at a sill elevation of 26 m. The gate configuration model, which was established based on engineering design documents, is presented in
Figure 6.
The downstream hydropower station has a dam crest elevation of 35.52 m with 15 spillway gates comprising five 12 m wide gates in the deep channel section at a gate sill elevation of 17.0 m, ten 12 m wide gates in the shoal section at a sill elevation of 18.0 m, and one 12 m wide navigation lock at a sill elevation of 17 m. The gate configuration model, which was established based on engineering design documents, is presented in
Figure 7.
2.4.3. Boundary Conditions
The inflow boundary condition adopts the flood peak discharge calculated using the Zhejiang rational formula method, which is expressed as
where
Q is the peak discharge, measured in m
3/s;
F is the watershed area, measured in km
2;
L is the maximum flow length from the outlet to the watershed divide along the main channel, measured in km;
m is the concentration parameter;
J is the average gradient along flow length
L;
is the concentration time of the watershed, measured in h;
ht is the net rainfall representing the maximum rainfall during period
under complete concentration, or the net rainfall of an individual flood peak under partial concentration, measured in mm.
The concentration parameter
m relates to watershed geometric characteristics and vegetation conditions. For this specific basin, it is determined by
where
m is an empirical, dimensionless concentration parameter reflecting watershed geometric characteristics and vegetation conditions.
Given that four tributaries converge within the DX river reach, the combined impact on the design flood peak of the downstream channel cannot be neglected. Peak discharge calculations must therefore account for superposition effects from all five rivers. The corresponding design flood discharges are provided in
Table 3.
The outlet section corresponds to the downstream hydropower station, where the outlet boundary condition adopts the water level at this downstream cross-section. With reference to relevant regulatory standards, water level variations under different flood frequencies were calculated. The resulting control water levels are presented in
Table 4.
2.4.4. Simulation Scenarios
The assessment of the DX River’s flooding capacity is based on flood frequencies of once in 5, 10, and 20 years. These return periods were selected as they align with regional flood management standards for urban and residential areas and represent frequent to moderately severe events of primary concern for local stakeholders. The analytical framework presented is scalable and can be extended to higher return periods if required. In the following sections, a series of calculations and analyses will be performed under different flood frequency scenarios to evaluate the current flow capacity of the DX River. These scenarios also consider how water levels at the confluence of the HK River and the DX River influence flood discharge capacity. Findings from the analysis will clarify the river’s flow characteristics, quantify its existing flood discharge capacity, and inform subsequent efforts to develop a plan for capacity enhancement. The assessment of the DX River’s current flooding capacity is divided into three working conditions, defined by varying inflow and outflow boundary conditions. These conditions are based on flood frequencies of once in five years, once in ten years, and once in twenty years. Details of each working condition are provided in
Table 5.
2.4.5. Model Calibration and Validation
To ensure the accuracy of the hydrodynamic model, a calibration and validation process was performed. The model was calibrated by adjusting Manning’s roughness coefficient (n) to best match the observed data. The primary calibration parameter, Manning’s n, was varied within a physically realistic range (0.025–0.045) for the main channel and floodplains.
For validation, a historical flood event from August 2019 was simulated. The inflow hydrograph for this event was used as the upstream boundary condition, and the observed stage–discharge curve at the downstream station was used as the downstream boundary. Simulated water levels were then compared against recorded water level data from a temporary gauging station located near section 7 + 500. The validation results showed strong agreement, with a coefficient of determination (R2) of 0.96 and a root mean square error (RMSE) of 0.12 m, confirming the model’s reliability for simulating flood propagation in the study reach.
2.5. Flood Control Operation Optimization Criteria
The primary flood control objective of the reservoir is to mitigate flood disasters in downstream areas. The reservoir scheduling problem is typically addressed by establishing a mathematical model for flood control operations and applying optimization methods, among which the most widely adopted criteria include the shortest flood-duration criterion, the maximum peak-shaving criterion, the minimum spillage criterion, and the minimum flood-damage criterion. This study employs the maximum peak-shaving criterion.
Operating under the premise of ensuring dam safety, the maximum peak-shaving criterion aims to attenuate the peak inflow of flood events, thereby achieving the minimization of the maximum discharge. This relationship is expressed as
where
is the discharge at time step t, measured in m
3/s;
is the tributary flood inflow at time step t, measured in m
3/s; and
are the operation start and end times, measured in s, respectively.
3. Results
3.1. Flood Propagation Simulation
Based on the aforementioned conditions, hydrodynamic simulations were conducted for the DX River reach and its tributaries, with computational results summarized in
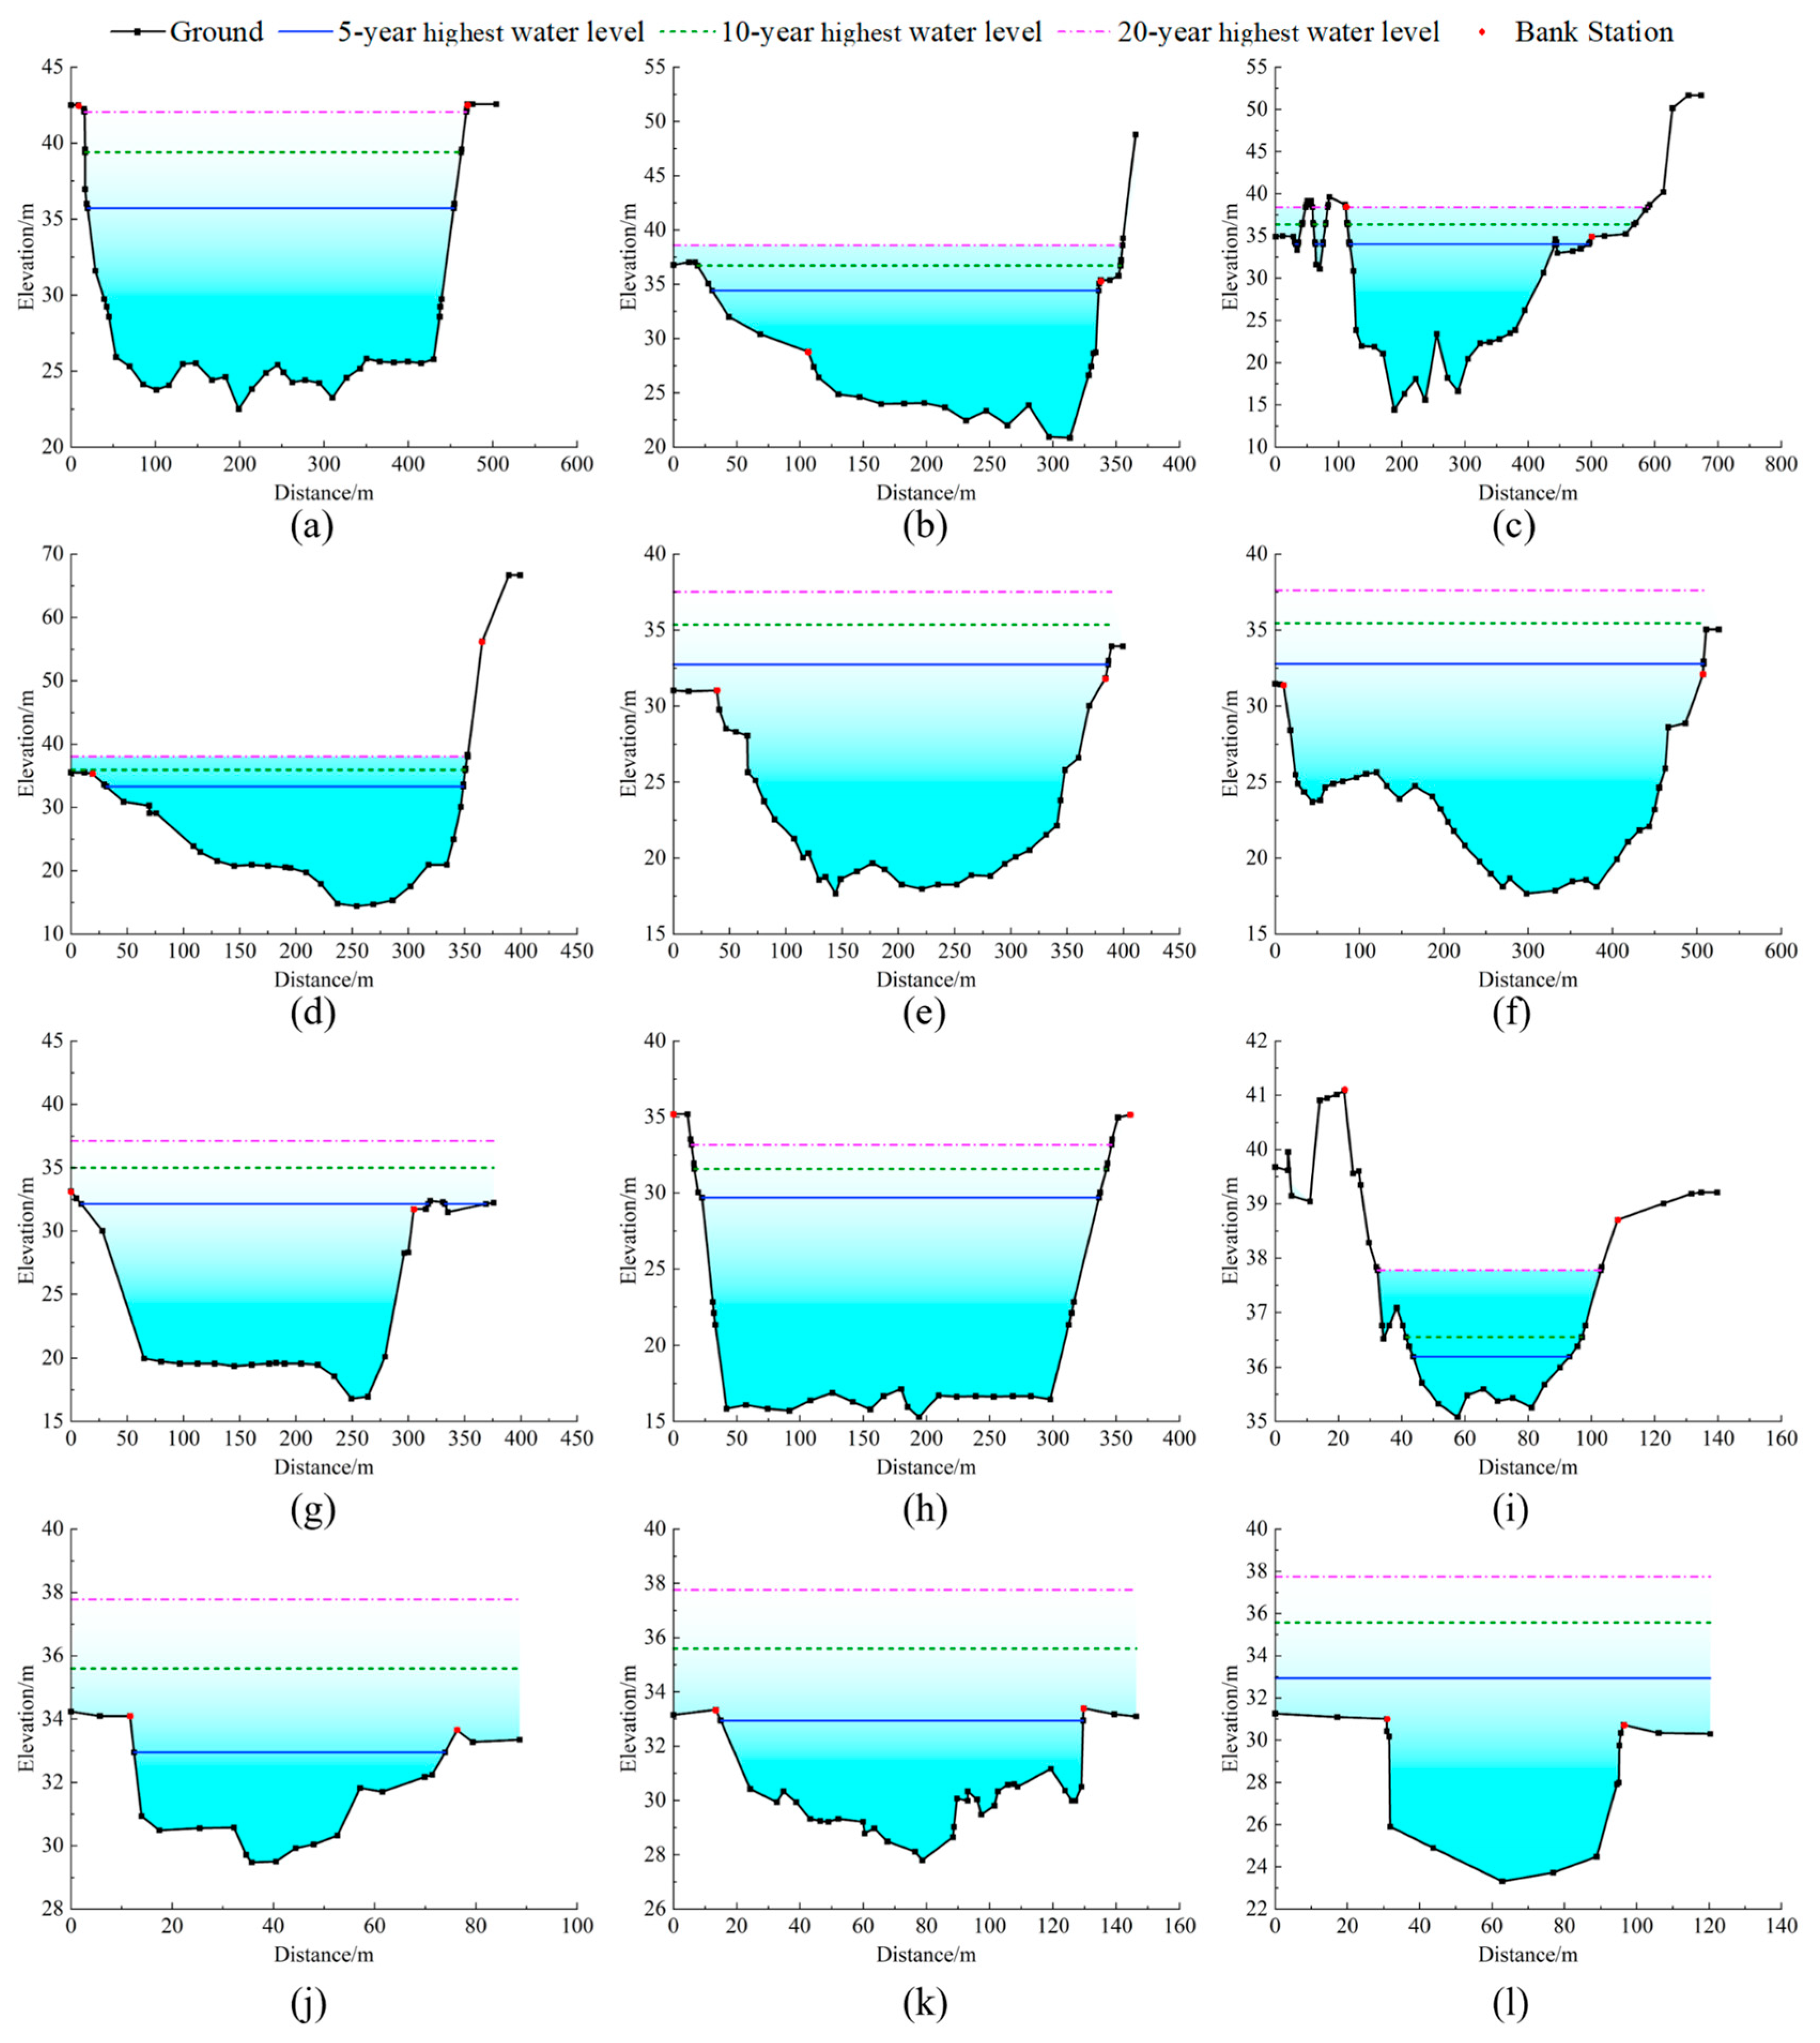
Table 6. To thoroughly analyze water level variations at compound cross-sections, representative river sections were specifically selected. The corresponding water level changes under different flood frequencies are illustrated in
Figure 8.
Flood analysis from the upstream to downstream hydropower stations indicates that under the 5-year return period flood, overflow sections in the DX river reach are primarily concentrated near HK Town. As shown in
Figure 8f,g, the water level exceedance reaches 0.8 m along the left bank over a 853 m stretch (7% of the left-bank length) and 0.2 m along the right bank over 2211.1 m (19.4% of the right-bank length). Consequently, 93% of the left bank and 80.5% of the right bank satisfy the 5-year flood control standard, while the section traversing HK Town fails to meet this standard.
Similarly, overflow in the HK river reach predominantly occurs near HK Town.
Figure 8 shows exceedances of 1.8 m along the left bank over 690 m (40% of the bank’s length) and 2.0 m along the right bank over 985 m (57.4% of the bank’s length). Thus, only 60% (left) and 42.6% (right) of this reach meet the 5-year flood control standard.
Under 10-year and 20-year return period floods, overflow sections expand significantly in both DX and HK reaches. All village cross-sections experience varying degrees of overflow characterized by continuous water level exceedance. Such widespread exceedance poses substantial life and property losses to riverside communities during these higher-magnitude flood events.
3.2. Coordinated Flood Control Strategy
Reservoir flood control operations can be classified into two categories: those with downstream protection objectives and those without. When flood control objectives exist, the reservoir must be operated according to the downstream flood defense capacity to achieve disaster mitigation, benefit enhancement, and hazard elimination. In the absence of such objectives, the primary focus shifts to ensuring dam safety while concurrently addressing reservoir inundation concerns. The fundamental goal of flood control operations is to maximize reservoir efficacy in flood management while safeguarding dam integrity, contingent upon specified protection requirements.
The upstream and downstream hydropower stations form a cascaded system, with basin runoff exhibiting distinct seasonal variations. The flood season spans May to September, during which the reservoir water level must not exceed the normal pool level of 28 m. To maintain power generation efficiency, the minimum operating level is constrained to 27.75 m (dead storage level). During flood events, hydropower dispatch must prioritize flood control operations to ensure downstream public safety and dam security.
Using the maximum peak-shaving criterion as the optimization principle, the cross-section at stake 7 + 269.50 was selected as the control section. The discharge thresholds for initiating pre-release (1160 m
3/s, 2280 m
3/s, and 3680 m
3/s) were determined from hydrodynamic simulations as the inflow levels that begin to pose an overflow risk at the critical downstream control section for the 5-, 10-, and 20-year floods, respectively. Gate operation parameters are provided in
Table 7. Computational results are presented in
Figure 9 and
Figure 10.
During upstream flood releases, the downstream reservoir must execute gate operations per
Table 7’s opening/closing regime with spillway gates actuated at 1 m/s while observing the following rules: When upstream discharge exceeds 1160 m
3/s, WX Reservoir initiates pre-release operations to lower the pool level to 27.8 m while sequentially opening spillway gates to maintain an equivalent discharge magnitude to the incoming flow; should the discharge increase beyond 2280 m
3/s, pre-release intensity escalates to achieve a 27.2 m water level under continued sequential gate operation with matched discharge control; if the discharge surpasses 3680 m
3/s, deep pre-release reduces the level to 26.2 m with all gates fully raised above the water before flood arrival, enforcing strict equivalence between release and inflow. Throughout this process, real-time monitoring of downstream water levels enables dynamic adjustment of active gates and opening heights for precise discharge control, concurrently safeguarding riverside communities and infrastructure to ensure flood control security and reliability. It is important to note that these operational rules were designed to be practically feasible. The specified pre-release timings provide sufficient lead time for operators, and the required gate opening and closing speeds (1 m/s) are well within the design specifications of the existing dam infrastructure, ensuring that the proposed strategy can be implemented effectively in a real-world flood event.
4. Discussion
The severe overflow risk concentrated in HK Town can be attributed to a combination of geomorphic and hydraulic factors. As shown in the cross-section data (e.g.,
Figure 8f), this river reach acts as a natural bottleneck, where the channel width narrows significantly. Furthermore, the confluence with the HK River just upstream of this section introduces additional discharge, while the relatively mild channel slope in this segment (compared to upstream reaches) reduces flow velocity and promotes water level rise. The backwater effect from the downstream WX Hydropower Station, although regulated, may also contribute to elevated water levels during large flood events. The ability to pinpoint this vulnerability was critically dependent on the high-resolution bathymetric data acquired by the unmanned vessel. Traditional, sparser cross-section data would likely have failed to capture this localized hydraulic constriction, leading to an underestimation of the flood risk.
To address the identified flood risks, we developed a coordinated operational strategy for the cascade hydropower stations. The proposed rules, based on the maximum peak-shaving criterion, proactively create flood storage capacity in the downstream reservoir before the flood peak arrives. This is achieved through a tiered pre-release mechanism triggered by specific upstream discharge thresholds. Simulations indicate that implementing this strategy can lower the peak water level at the critical section (stake 7 + 359.77) by approximately 1.2 m during a 20-year return period flood, effectively keeping the water level below the embankment crest and preventing overflow. This demonstrates a significant improvement over the current operational practice, which reacts more passively to incoming floods.
The present study contributes to the ongoing effort to refine reservoir operations for flood control, a field characterized by diverse and advancing methodologies. The proposed “geometry-driven” approach, which prioritizes downstream safety through high-resolution bathymetry, is distinct from “forecast-driven” or “risk-based” strategies. Such strategies, as exemplified by the work of Li et al. [
21] and more recently by Zhou et al. [
19], focus on dynamically raising the flood limited water level (FLWL) to enhance water conservation and utilization benefits, contingent upon predefined acceptable risk levels. From a methodological standpoint, the work presented herein shares common ground with research that integrates hydrodynamic models directly into operational optimization, as demonstrated by Yao et al. [
22]. However, while these advanced approaches are essential, their reliability is critically predicated on the physical accuracy of the underlying hydraulic model. The foundational contribution of this research, therefore, lies in improving this accuracy through the integration of high-resolution, field-measured data. An accurate representation of the river’s true conveyance capacity is a critical prerequisite, ensuring that sophisticated operational strategies are based on a reliable depiction of the real-world system, thereby minimizing the risk of model-induced operational errors.
While many studies use hypothetical or standard river geometries, our work demonstrates a complete workflow from ‘data-to-decision,’ which is crucial for practical application in complex, data-scarce river systems. The focus on a gradient-development river with significant topographic variability also addresses a specific gap in the literature.
While this study provides a robust framework, several limitations should be acknowledged. The primary limitation is the use of a 1D hydrodynamic model. Although highly efficient and accurate for simulating in-channel flood propagation and water levels, a 1D model cannot simulate the complex, two-dimensional dynamics of overbank flow across the floodplain. To overcome this, future efforts should focus on developing a coupled 1D-2D model to generate detailed inundation maps and enable more precise risk assessments for communities like HK Town. Furthermore, the model’s predictions are inherently dependent on parameters such as Manning’s roughness and empirically derived flood inflows, which carry uncertainties. For instance, a sensitivity analysis showed that a ±10% variation in the Manning’s roughness coefficient altered peak water levels by up to ±0.25 m at critical sections, highlighting the importance of careful calibration. Furthermore, an interesting parallel can be drawn from petroleum engineering, where the “mobility ratio” describes the efficiency of fluid displacement [
23]. Conceptually, an uncontrolled flood wave has unfavorable “mobility,” leading to inefficient conveyance and rapid water level rise. Our strategy effectively improves this dynamic by attenuating the peak, creating a more stable propagation front. Exploring this theoretical analogy presents a promising avenue for future research. The reliability of the operational strategy could be significantly enhanced by integrating real-time forecasting systems and more sophisticated hydrological models to improve inflow prediction. Lastly, our analysis assumes a static channel morphology; however, sediment transport can alter riverbed topography over time. Long-term studies incorporating sediment dynamics are therefore necessary to evaluate the sustained effectiveness of the proposed flood control measures and ensure their long-term resilience.
5. Conclusions
This study addressed the critical challenge of flood risk management in a topographically complex, regulated river system where traditional data was insufficient for accurate risk assessments. By integrating high-resolution bathymetry acquired from an unmanned vessel with 1D hydrodynamic modeling, we established a high-fidelity platform to analyze flood propagation and optimize reservoir operations. Our analysis pinpointed a localized hydraulic bottleneck as the primary source of overflow risk, a finding enabled by the precision of the unmanned vessel data. The central contribution of this work is the development of a proactive, coordinated operational strategy for the cascade reservoirs, which replaces a reactive flood response with a preemptive one by creating downstream storage based on upstream discharge triggers. Ultimately, this study demonstrates a robust and transferable ‘data-to-decision’ workflow for enhancing flood resilience in similar data-scarce, gradient-development river basins. Future research should aim to build upon this framework by integrating real-time flood forecasting systems for adaptive operational control, incorporating sediment transport models to assess long-term morphological changes, and developing coupled 1D-2D hydrodynamic models for detailed floodplain inundation mapping. Such advancements will further enhance the resilience of riverine communities in an era of changing climate.
Author Contributions
Conceptualization, H.G.; Methodology, J.H.; Formal analysis, W.S., D.H. and J.M.; Investigation, Q.W.; Resources, J.H.; Data curation, Y.L.; Writing—original draft, H.G. and J.M.; Writing—review & editing, J.C. All authors have read and agreed to the published version of the manuscript.
Funding
This work is supported by the joint funds of the Zhejiang Provincial Natural Science Foundation of China (LZJWZ22E090004).
Data Availability Statement
The original contributions presented in this study are included in the article. Further inquiries can be directed to the corresponding author.
Conflicts of Interest
The authors declare no conflict of interest.
References
- Chow, V.T. Open-Channel Hydraulics; McGraw-Hill: New York, NY, USA, 1959. [Google Scholar]
- Cunge, J.A. On the subject of a flood propagation computation method (Muskingum method). J. Hydraul. Res. 1969, 7, 205–230. [Google Scholar] [CrossRef]
- McCarthy, G.T. The unit hydrograph and Flood routing. In Proceedings of the Conference of the North Atlantic Division, US Army Corps of Engineers, New London, CT, USA, 24 June 1938. [Google Scholar]
- Post, D.A.; Kinsey-Henderson, A.E.; Stewart, L.K.; Roth, C.H.; Reghenzani, J. Optimising drainage from sugar cane fields using a one-dimensional flow routing model: A case study from Ripple Creek, North Queensland. Environ. Model. Softw. 2003, 18, 713–720. [Google Scholar] [CrossRef]
- Gasiunas, S.; Seporaitis, M.; Cesna, B.B.; Valincius, M.; Pabarcius, R.; Laurinavicius, D. Interfacial share of co-current steam-water flow estimation II. Enhanced single phase fluent model in conjunction with measured profiles of steam velocity and longitudinal water temperature. Heat Transf. Res. 2012, 43, 425–442. [Google Scholar] [CrossRef]
- Förster, S.; Chatterjee, C.; Bronstert, A. Hydrodynamic simulation of the operational management of a proposed flood emergency storage area at the Middle Elbe River. River Res. Appl. 2008, 24, 845–863. [Google Scholar] [CrossRef]
- Jang, S.H.; Jung, S.W. Flood routing simulation for dam failure time estimation. In Proceedings of the IEEE 2012 International Conference on Systems and Informatics, Yantai, China, 19–20 May 2012; pp. 167–169. [Google Scholar]
- Liang, Q.; Yi, Q.; Yang, Z.; Li, Z. A coupled 1D-2D hydrodynamic model for flood simulation in flood detention basin. Nat. Hazards 2015, 75, 1303–1325. [Google Scholar]
- Li, Y.; Pan, L.; Liu, T.; Wei, C. Three-dimensional GIS based dynamic visualization simulation system for flood routing. In Proceedings of the IEEE 2012 2nd International Conference on Computer Science and Network Technology, Changchun, China, 29–31 December 2012; pp. 1409–1412. [Google Scholar]
- Wang, X.; Chen, W.; Zhou, Z.; Zhu, Y.; Wang, C.; Liu, Z. Three-dimensional flood routing of a dam break based on a high-precision digital model of a dense urban area. Nat. Hazards 2017, 86, 1147. [Google Scholar] [CrossRef]
- Wang, Z.; Bowles, D.S. Three-dimensional non-cohesive earthen dam breach model. Adv. Water Resour. 2006, 29, 1528–1545. [Google Scholar] [CrossRef]
- Adams, S.M.; Friedland, C.J. A survey of unmanned aerial vehicle (UAV) usage for imagery collection in disaster research and management. In Proceedings of the 9th International Workshop on Remote Sensing for Disaster Response, Stanford, CA, USA, 15–16 September 2011. [Google Scholar]
- Tahar, K.N.; Ahmad, A. A simulation study on the capabilities of rotor wing unmanned aerial vehicle in aerial terrain mapping. Int. J. Phys. Sci. 2012, 7, 1300–1306. [Google Scholar] [CrossRef][Green Version]
- Poole, G.C.; Stanford, J.A.; Frissell, C.A.; Running, S.W. Three dimensional mapping of geomorphic controls on flood Plain hydrology and connectivity from aerial photos. Geomorphology 2002, 48, 329–347. [Google Scholar] [CrossRef]
- Fang, C.; Xuemin, W. The Optimal Utilization of Flood in Small and Medium magnitude for Cascade Reservoirs in Jinsha River. In Proceedings of the 2019 International Conference on Architecture, Civil and Hydraulic Engineering (ACHE2019), Guangzhou, China, 20–22 December 2019; IOP Conference Series: Materials Science and Engineering. IOP Publishing: Bristol, UK, 2020; Volume 794, p. 012024. [Google Scholar]
- Kim, Y.; Sun, B.; Kim, P.; Jo, M.B.; Ri, T.H.; Pak, G.H. A study on optimal operation of gate-controlled reservoir system for flood control based on PSO algorithm combined with rearrangement method of partial solution groups. J. Hydrol. 2021, 593, 125783. [Google Scholar] [CrossRef]
- Zhang, J.; Min, Y.; Feng, B.; Duan, W. Research and Application of Key Technologies for Dynamic Control of Reservoir Water Level in Flood Season. Water 2021, 13, 3576. [Google Scholar] [CrossRef]
- Li, J.; Yang, Z.; Liu, Z.; Tian, Y. Research of the utilization efficiency of non-flood season flood resources by artificial bee colony algorithm based on multi-strategy hybrid search. Water Supply 2023, 23, 1987–2000. [Google Scholar] [CrossRef]
- Zhou, L.; Kang, L.; Hou, S.; Guo, J. Research on Flood Risk Control Methods and Reservoir Flood Control Operation Oriented towards Floodwater Utilization. Water 2023, 16, 43. [Google Scholar] [CrossRef]
- Brunner, G.W. HEC-RAS River Analysis System: Hydraulic Reference Manual; Version 5.0.7; U.S. Army Corps of Engineers, Hydrologic Engineering Center: Davis, CA, USA, 2019.
- Li, X.; Guo, S.; Liu, P.; Chen, G. Dynamic control of flood limited water level for reservoir operation by considering inflow uncertainty. J. Hydrol. 2010, 391, 124–132. [Google Scholar] [CrossRef]
- Yao, L.; Peng, Y.; Yu, X.; Zhang, Z.; Luo, S. Improving Flood Control Optimal Operation of River-Type Cascade Reservoirs through Coupling with 1D Hydrodynamic Model. Water Resour. Manag. 2025, 39, 3443–3466. [Google Scholar] [CrossRef]
- Ahmadi, Y.; Hassanbeygi, M.; Kharrat, R. The Effect of Temperature and Injection Rate during Water Flooding Using Carbonate Core Samples: An Experimental Approach. Iran. J. Oil Gas Sci. Technol. 2016, 5, 43–52. [Google Scholar]
| Disclaimer/Publisher’s Note: The statements, opinions and data contained in all publications are solely those of the individual author(s) and contributor(s) and not of MDPI and/or the editor(s). MDPI and/or the editor(s) disclaim responsibility for any injury to people or property resulting from any ideas, methods, instructions or products referred to in the content. |
© 2025 by the authors. Licensee MDPI, Basel, Switzerland. This article is an open access article distributed under the terms and conditions of the Creative Commons Attribution (CC BY) license (https://creativecommons.org/licenses/by/4.0/).
