Abstract
Managed freshwater replenishment is a significant restoration method in the Yellow River Delta. However, their impacts on plankton communities, which are key bioindicators of aquatic ecosystem health and sensitive to the changes in the environment, remain poorly quantified. In this study, we conducted plankton surveys across wetlands subjected to freshwater restoration durations ranging from 5 to 22 years. We assessed shifts in phytoplankton and zooplankton community structure, biomass, diversity, and their relationships with environmental drivers. Results revealed distinct temporal dynamics: phytoplankton biomass and diversity followed a “U-shaped” trajectory (initial decline followed by recovery), while zooplankton biomass decreased but diversity increased with restoration duration. Canonical Correspondence Analysis (CCA) and Partial Least Squares Path Modeling (PLS-PM) identified salinity (Cl−, SO42−) and dissolved nitrate (NO3−) as primary environmental controls for both groups. Cyanobacteria dominated phytoplankton biomass initially but declined with restoration age, while rotifers replaced copepods as the dominant zooplankton taxon over time. These findings demonstrate that freshwater restoration restructures plankton communities through salinity-mediated physiological constraints and altered nutrient availability, with implications for ecosystem function and adaptive management in anthropogenically influenced deltas.
1. Introduction
Coastal wetlands globally confront escalating salinity stress from sea-level rise, storm surges, and altered freshwater regimes, influencing their ecological integrity [1,2,3]. Within these ecosystems, plankton communities, exhibiting high phylogenetic-ecological variability yet high environmental sensitivity, serve as keystone regulators of biological pumps and biogeochemical cycles [4,5]. Specifically, phytoplankton constitute the foundation of aquatic energy flow and primary productivity [6,7], whereas zooplankton mediate trophic transfers by controlling algal biomass and supporting fisheries [8,9]. Critically, plankton community structure responds rapidly to physicochemical variables (temperature, pH, nutrients, salinity) due to short life cycles and small size [10], rendering them ideal bioindicators of ecosystem state.
To mitigate salinization, managed freshwater restoration (FR) has emerged as a key strategy to restore coastal wetlands in deltaic wetlands [11,12]. As a key anthropogenic intervention to counteract hydrological deficits, freshwater restoration is intrinsically linked to concurrent shifts in salinity gradients, sediment transport, nutrient loading, and hydrodynamic regimes that have profound implications for deltaic ecosystem integrity [11,13]. Previous studies confirm that variations in plankton communities (phytoplankton and zooplankton) are primarily governed by fluctuations in physicochemical and hydrological conditions [14,15]. Consequently, plankton assemblages in this delta are inevitably altered by freshwater restoration operations implemented under current water management strategies [16]. For instance, pulsed freshwater inputs may increase phytoplankton biomass through reduced salinity and enhanced nutrient availability, whereas zooplankton diversity often declines abruptly when critical salinity thresholds are breached. In turn, plankton dynamics serve as sensitive bioindicators of FR effectiveness, largely due to their tight coupling with hydrological and chemical alterations. Notably, nonlinear community responses can amplify subtle water quality perturbations, making plankton more reliable indicators of FR outcomes than conventional physicochemical measurements alone [17]. Furthermore, spatial redistributions of plankton according to FR duration provide critical insights into habitat suitability, as species realign distributions according to physiological tolerances under managed flow regimes. Collectively, plankton communities face reconfigured stressors under FR interventions, particularly trade-offs between frequent productivity pulses and long-term community stability. Understanding the interactions between human-managed water replenishment and plankton dynamics is therefore crucial for adaptive delta management and represents a priority for global estuarine conservation.
Plankton, which typically includes phytoplankton and zooplankton, is an important component of aquatic ecosystems and plays a significant ecological role in oceans, freshwater lakes, and rivers [8]. Phytoplankton is one of the main components of primary productivity in river–lake ecosystems and serves as the foundation for energy flow, material transport, and information transfer in these ecosystems [6]. Zooplankton plays a bridging role in the trophic levels. By feeding, it restricts the growth and reproduction of phytoplankton and microorganisms, and it also serves as a food source for higher trophic levels such as shrimp and fish [15]. The community structure of plankton is closely related to the water environment, like temperature, water transparency, pH, nutrient and salt concentration, chemical oxygen demand, etc. [10], which is attributable to their small size, rapid generation times, and acute environmental responsiveness. Critically, key uncertainties persist regarding long-term restoration impacts: whether prolonged FR duration induces irreversible ecological trade-offs, and whether optimized restoration timeframes could achieve equivalent benefits while conserving water resources.
Within the plankton communities of the Yellow River Delta, the differential responses to ecological freshwater restoration-induced hydrological shifts for phytoplankton and zooplankton dynamics constitute a primary management concern, given their foundational role in estuarine food webs and critical functions in biogeochemical cycling [7,14]. In the present study, we synchronously estimated the responses of phytoplankton and zooplankton communities to freshwater restoration, focusing on their dynamics in structure, abundance, diversity and influencing mechanisms in the Yellow River Delta, an intersection region that is significantly affected by both freshwater and saltwater.
2. Materials and Methods
2.1. Study Area and Sampling
The Yellow River Delta Nature Reserve (118°33′~119°20′ E, 37°35′~38°12′ N) is located at the estuary of the Yellow River in Dongying City, Shandong Province (Figure 1). It is adjacent to the Bohai Sea in the north and the Laizhou Bay in the east, lying between the northeastern Asian inland and the Jianghuai Plain. From 1972 to 1999, the Yellow River experienced flow interruptions in 22 out of 28 years. To resolve water scarcity and downstream flow disruptions in the basin, the Water-Sediment Regulation Scheme was launched by the Yellow River Conservancy Commission in 2002. With the help of water-sediment regulation after 2002, freshwater has been annually diverted from the Yellow River into the replenishment zones via constructed channels. Within protected areas, sustained ecological water replenishment commenced in 2002, 2006, and 2019 for wetland restoration. This has enabled surface water depths in some rehabilitated zones to recover and stabilize at 1.0 m year-round. Initially, freshwater supplementation was primarily concentrated on the Qingshuigou flow path (the study area during the ecological restoration period), with the magnitude of freshwater input remaining relatively low. However, after the proposal of the major strategy for ecological protection and high-quality development of the Yellow River Basin in 2019, the intensity of water supplementation to the Qingshuigou flow path has been significantly increased (Figure 2). Therefore, accounting for environmental heterogeneity, this study selected three adjacent wetland zones implementing water replenishment projects in distinct periods (2002, 2006, and 2019), designated as Rs02 (22-year restoration), Rs06 (18-year restoration), and Rs19 (5-year restoration), respectively. These wetlands are hydrologically isolated by bank revetment structures, forming independent wetlands. In June 2024, nine sampling sites were selected in three restored wetlands of the Yellow River Delta, with three replicate sites set in each wetland. The environmental factors, phytoplankton, and zooplankton communities in the freshwater restoration wetlands in the Yellow River Delta were investigated.
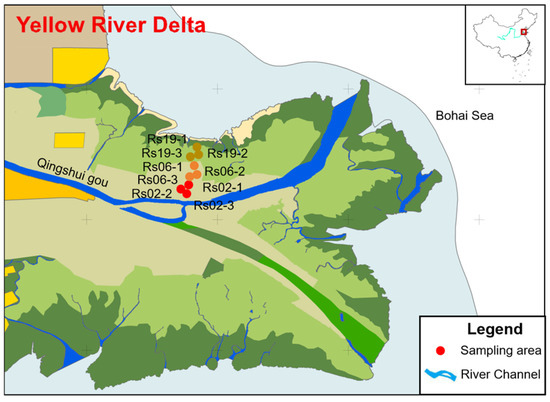
Figure 1.
Location of sampling sites in the Yellow River Delta.
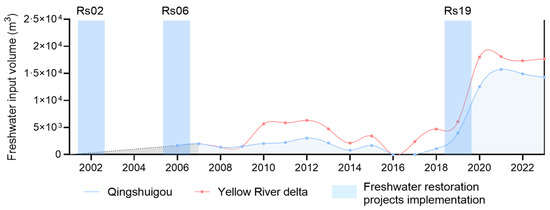
Figure 2.
Amount of ecological freshwater replenishment of coastal wetlands in the Yellow River Delta since 2002.
2.2. Environmental Factors Determination
Surface water samples were collected in 1 L clean bottles. The temperature (T), dissolved oxygen (DO), and pH were measured with a multi-parameter water quality meter (YSI-ProPlus). All operations and indicator monitoring were conducted in strict accordance with the Environmental Quality Standards for Surface Water (GB 3838-2002) issued by the Ministry of Ecology and Environment of China [18]. Total Nitrogen (TN) was measured using alkaline persulfate digestion with ultraviolet spectrophotometric detection. Nitrate-Nitrogen (NO3−-N) was determined via cadmium reduction spectrophotometry. Ammonium-Nitrogen (NH4+-N) was quantified using the phenate method. Sulfate (SO42−) and Chloride (Cl−) concentrations were assessed by ion chromatography. Chemical Oxygen Demand (COD) was analyzed via the closed reflux dichromate method, adhering to established protocols. The permanganate index (CODMn) was obtained through acidic potassium permanganate titration.
2.3. Plankton Collection, Identification, and Enumeration
Qualitative and quantitative samples of phytoplankton and zooplankton were collected at each site using a NO.25 plankton net (sieve aperture: 0.064 mm). These plankton nets were dragged slowly in a “∞” pattern at a speed of 20–30 cm/s between the water surface and 0.5 m depth for 1–3 min. When the water depth was greater than 5 m, samples at the bottom of the photic layer would be conducted for stratified sampling. Subsequently, after lifting the net out of water, the qualitative samples were collected from the bottom container into a 100 mL stoppered polyethylene bottle via the bottom outlet. Nets were rinsed immediately after one site’s sample collection for subsequent deployments to prevent cross-contamination between sampling events.
Phytoplankton taxonomic identification of qualitative sample was conducted at species level based on Freshwater Algae of China: Systematics, Ecology and Classification [19], and the zooplankton taxonomic identification were based on Methodology for Freshwater Plankton Research [20] and Cladocera of the Yangtze River Basin [21]. For quantitative phytoplankton samples, 1 L of water was collected with a 1 L PVC hydrophore, fixed with Lugol’s iodine and transferred to the laboratory immediately, and then allowed to stand for 24–48 h to facilitate precipitation. After sedimentation, the supernatant was decanted until the phytoplankton concentrate reached the 50 mL calibration mark. The concentrated sample was transferred to a 100 mL graduated cylinder, homogenized by vigorous agitation, and a 60 μL qualitative subsample was aspirated from the base of the vessel. For Cladocera and Copepoda quantification, a 5 mL aliquot of the homogenized sample was precisely transferred using a volumetric pipette. Rotifera enumeration required vigorous agitation of the concentrated sample to ensure homogeneity, followed by pipetting a 1 mL subsample into a specialized 1 mL plankton counting chamber. Zooplankton remains were quantified via the head/tail counting method, wherein a single counting methodology was consistently applied to remains of identical species or decomposition state; when discrepancies occurred, priority was given to the method yielding higher counts. Biomass of rotifers (mg/L) was calculated using the volume method, while that of cladocerans and copepods (mg/L) was determined via length–weight regression equations; phytoplankton biomass (mg/L) was obtained by converting volume measurements. All identifications were conducted by Qingdao Tianqin Aquatic Biological Inspection Co. (Qingdao, China) using an optical microscope (ZOOM645, BM2000).
2.4. Plankton Biodiversity
To describe the composition, biodiversity, and structure of plankton communities (including phytoplankton and zooplankton), we calculated the indices of species diversity with Shannon–Wiener diversity index (H’) [22]:
where H’ is the Shannon–Wiener diversity index, S is the species amount, n is the number of individuals of each species, and N is the total number of individuals.
2.5. Partial Least Squares Approach Path Model
Path analysis was conducted using Partial Least Squares Path Modeling (PLS-PM) to investigate the hypothesized relationships between environmental factors and plankton biomass. This variance-based structural equation modeling technique was implemented with the plspm function within the “plspm” package in R Studio (version 2022.12.0), chosen for its suitability with complex models and smaller sample sizes. Based on the research of general relationship of plankton community to environmental factors [23,24,25], the factors chosen in this study were phytoplankton biomass (PB), zooplankton biomass (ZB), dissolved oxygen (DO), pH, TN contents, NO3−-N contents, NH4+-N contents, and Cl− and SO42− contents of the surface water. The model incorporated key environmental drivers as predictors: salinity (represented by Cl− and SO42− concentrations), nitrogen content (measured as TN, NH4+-N, and NO3−-N), water organic matter levels, and restoration duration. The primary endogenous response variable analyzed was plankton biomass, encompassing both zooplankton and phytoplankton communities. The adequacy and explanatory power of the established path model were rigorously evaluated using standard PLS-PM metrics; the model fit was assessed via the Goodness-of-Fit (GOF) index and the coefficient of determination (R2).
3. Results
3.1. Characteristics of Environmental Factors According to the Freshwater Restoration Periods
The values of the environmental factors for the freshwater restoration wetlands with different restoration durations ranging from 5 to 22 years (Rs02, Rs06 and Rs19) are listed in Table 1. All the factors changed according to the restoration duration, indicating that the freshwater implementation is a strong external stress on the coastal wetland system. With the increase of the water replenishment years, the TN, NO3−-N, NH4+-N, SO42−, Cl−, permanganate index, DO, and pH decreased by 14.12% (p > 0.05), 45.69% (p < 0.05), 20.66% (p > 0.05), 49.25% (p < 0.05), 71.83% (p < 0.05), 46.65% (p < 0.05), 25.94% (p < 0.05), and 1.58% (p < 0.05), respectively, whereas COD increased by 11.42% (p < 0.05). The opposite changes in COD and permanganate index indicate an increase in refractory organic matter and a decrease in biodegradable organic matter in water bodies.

Table 1.
Values of environmental factors in freshwater restoration wetlands (surface water) with different restoration durations ranging from 5 to 22 years (Rs02, Rs06 and Rs19).
3.2. Phytoplankton and Zooplankton Species Composition in the Yellow River Delta
Within the freshwater restoration wetlands with different restoration duration, a total of 53 phytoplankton species from five phyla were detected, including Cyanobacteria (9 species, 16.98%), Bacillariophyta (23 species, 42.39%), Chlorophyta (18 species, 33.96%), Euglenophyta (2 species, 3.77%) and Dinophyta (1 species, 1.89%). A total of 23 zooplankton species from four phyla were detected, including Rotifera (11 species, 47.83%), Cladocera (1 species, 4.35%), Copepoda (8 species, 34.78%) and Rhizopoda (3 species, 13.04%).
3.3. Changes in the Plankton Structure According to the Freshwater Restoration
The freshwater restoration led to spatial variations in the distribution of phytoplankton and zooplankton biomass, diversity and community composition (Figure 3 and Figure 4). The average biomass of phytoplankton in the 22-year and 5-year freshwater restoration period were 12.95 mg/L (Rs02) and 11.14 mg/L (Rs19), respectively (Figure 3). With the medium period (Rs06), the average phytoplankton biomass was 3.46 mg/L, which was 73.28%~68.94% lower than those of longer and shorter restoration period. The Shannon-Wiener diversity index of phytoplankton ranged from 0.224 to 1.099, with an average value of 0.68. Similarly with the biomass, it was lowest in the Rs06, and higher in the Rs02 and Rs19. In freshwater restoration wetlands, Cyanobacteria accounts for 85.55% of the total biomass, followed by Bacillariophyta (7.24%) and Chlorophyta (6.98%), and lowest with Dinophyta (0.13%) and Euglenophyta (0.10%). With increasing restoration period, the biomass percentage of Cyanobacteria decreased from 96.21% to 72.55%, whereas the Bacillariophyta and Chlorophyta increased from 2.87% to 14.22%, and 0.72% to 13.13%, respectively. The Euglenophyta was not detected in the Rs02, and Dinophyta was not detected in the Rs19. From a species abundance perspective, dominant phytoplankton species exhibited clear spatial differentiation: In Rs02, Pseudanabaena (58.65%) and Merismopedia (32.27%) collectively represented >90% of total abundance. Rs06 demonstrated near-monospecific dominance by Merismopedia (92.77%), while Rs19 reverted to a dual dominance pattern with Merismopedia (68.49%) and Pseudanabaena (30.20%). Notably, both taxa are characteristic freshwater phytoplankton, with their distribution patterns reflecting distinct habitat conditions shaped by restoration chronology.
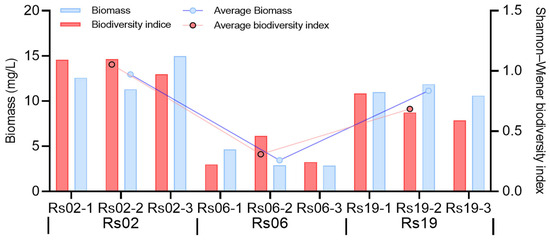
Figure 3.
Trends in the phytoplankton biomass and biodiversity index according to the freshwater restoration duration of the Yellow River delta.
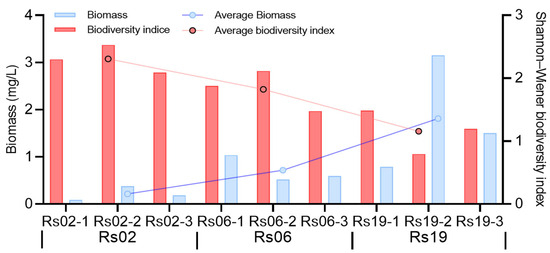
Figure 4.
Trends in the zooplankton biomass and biodiversity index according to the freshwater restoration duration of the Yellow River delta.
The average biomass of zooplankton in the 22-year, 8-year and 5-year freshwater restoration period were 0.19 mg/L (Rs02), 0.66 mg/L (Rs06) and 1.76 mg/L (Rs19), respectively (Figure 4). The Shannon-Wiener diversity index of zooplankton ranged from 0.79 to 2.53, with an average value of 1.76. Contrary to biomass, the diversity index increases with restoration duration, and the highest diversity happened in the Rs02 with an average of 2.31. In freshwater restoration wetlands, Copepoda accounts for 94.34% of the total biomass, followed by Rotatoria (5.54%), and lowest with and Cladocera (0.11%) and Rhizopoda (0.01%). With increasing restoration period, the percentage of Copepoda decreased from 99.10% to 91.83%, whereas the Rotatoria increased from 0.9% to 8.13%. The Euglenophyta was not detected in the Rs02, and Dinophyta was not detected in the Rs19. From a species abundance perspective, in the restored wetlands, harpacticoid copepods (Harpacticoida) constituted >50% of total abundance and dominated the zooplankton community in Rs19 and Rs06, whereas harpacticoid copepods (Harpacticoida, 31.63% abundance) and Brachionus urceolaris with 18.33% abundance prevailed in Rs02. This successional shift suggests restoration age modulates zooplankton community assembly.
3.4. Responses of Plankton to Environmental Factors Under the Influence of Freshwater Restoration
The relationships between plankton and environmental parameters under the influence of freshwater restoration gradient are shown in Figure 5 and Figure 6. The Canonical Correspondence Analysis (CCA) identified key environmental drivers for phytoplankton and zooplankton communities. Salinity changes, specifically chloride (Cl−) and sulfate (SO42−) ion concentrations, were the strongest factors for both groups, showing high correlations (r > 0.75 for phytoplankton, r > 0.6 for zooplankton). For phytoplankton, nitrate (NO3−) and the permanganate index (CODMn) were significant secondary influences. Similarly, for zooplankton, NO3− and CODMn were also important secondary factors, though their influence was slightly weaker than that of salinity ions for both plankton groups. Path analysis following CCA revealed salinity-driven effects on plankton: for phytoplankton, biomass negatively correlated with pH but positively with carbon/nitrogen content; conversely, for zooplankton, biomass negatively correlated with both pH and carbon/nitrogen content under salinity influence, while showing a positive correlation with dissolved oxygen.
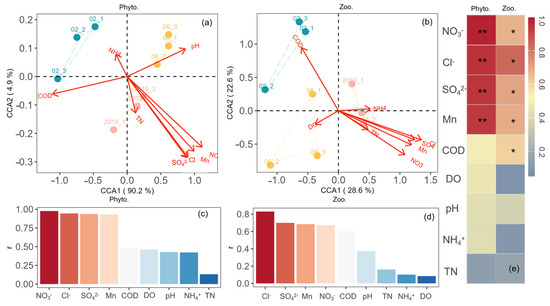
Figure 5.
Relationships between biological and environmental parameters. (a,c) CCA analysis for the relationships between phytoplankton parameters and environmental characteristics. (b,d) CCA analysis for the relationships between zooplankton parameters and environmental characteristics. (e) Pearson correlation analysis for the relationships between the plankton abundance and environmental parameters. ** is p < 0.01; * is p < 0.05.
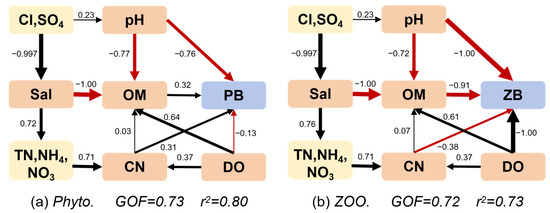
Figure 6.
Structural equation optimized model of phytoplankton (a), zooplankton (b), and environmental factors. (Sal, salinity; OM, organic matter; CN, contents of nitrogen; PB, biomass of phytoplankton; and ZB, biomass of zooplankton).
4. Discussions
4.1. Responses of Phytoplankton to Environmental Factors Under Freshwater Restoration
Cyanobacteria, Chlorophyta, and Bacillariophyta were the dominant taxa in the freshwater restoration wetlands of the YRB. The three phyla are representative examples of R-selected taxa, which are distinguished by their rapid growth and high reproduction rates [15]. These characteristics enable them to quickly exploit available resources, but leave them particularly vulnerable to changes in their habitats, like salinity, temperature, hydrological disturbance, and sediment discharge [26]. Compared with natural coastal wetlands of several major estuaries in China, Cyanobacteria were predominant in water replenishment wetlands of this and another study [12], in contrast to the diatom dominance characteristic of saline natural wetlands in the Pearl River Delta [27], Yellow River Delta [15] and Yangtze River Delta [28]. The contrasting dominance patterns in the salty wetlands versus Cyanobacteria in freshwater-replenished wetlands arises from contrasting environmental filters and adaptive traits. In the salty estuary, intense hydrodynamic disturbances from sediment-laden river discharge create chronically turbid, well-mixed waters. Whereas, diatoms thrive due to their heavy silica frustules that resist abrasion and salinity stress, maintaining access to light [29].
Conversely, the process of freshwater replenishment resulted in changes to hydrodynamic factors, including discharge and velocity, which in turn led to variations in physicochemical parameters such as salinity (Cl− and SO42−), pH, dissolved oxygen (DO), organic matter (OM), NO3−, and total nitrogen (TN), total phosphorus (TP), and soluble silicate. These parameters have a significant connection to plankton survival. This study carried out CCA and path analysis (Figure 5 and Figure 6) to investigate the relationships between environmental factors and plankton at different durations of the freshwater restoration, focusing on the correlations between physicochemical variables and plankton biomass, as well as the influence of freshwater restoration on the plankton community. The results showed that the main environmental factors affecting the growth of phytoplankton were salinity (Cl− and SO42−) and nutrient availability (NO3− and organic matter). Freshwater replenishment zones develop stable, stratified conditions where Cyanobacteria dominate through adaptive advantages due to low osmotic pressure. Their gas vesicles enable buoyancy regulation to occupy nutrient-rich surface layers during thermal stratification, while low N nutrients in YRD [30] activate nitrogen-fixing capabilities in heterocystous Cyanobacteria, circumventing nitrogen limitation that inhibits non-diatom competitors. Reduced turbulence in replenished wetlands diminishes silicate replenishment from sediments, hindering diatom frustule synthesis, while allowing Cyanobacteria to form surface scums that shade out competitors. In addition, with rising temperatures, dominant phytoplankton shifts: Bacillariophyta prevail below 20 °C, Chlorophyta dominate under 30 °C, and Cyanobacteria become prevalent under 40 °C [31]. Temperature likely drove the planktonic community succession, as shown by [32], who examined the correlation between phytoplankton and temperature in Lake Baikal. In our study, the average temperature was 29.22 °C, which was more favorable for the survival of Chlorophyta and Cyanobacteria.
Phytoplankton show a “U-shaped” trend in both biomass and diversity, decreasing initially and then increasing with longer restoration. This suggests early restoration stressors (e.g., salinity, nutrient imbalance) suppress phytoplankton, while improved conditions (e.g., stable hydrology, nutrient availability) later promote their recovery and species richness [15]. Reduced salinity due to prolonged wetland replenishment drives a shift from cyanobacterial dominance to increased biomass of green algae and diatoms through interconnected mechanisms [33]. Salinity decline directly disrupts cyanobacterial adaptations: the high-salt tolerance mechanisms of freshwater Cyanobacteria become energetically costly and unnecessary, eroding their competitive edge. Conversely, green algae and diatoms exhibit optimal growth and photosynthetic efficiency in low-salinity conditions, with diatoms further benefiting from reduced metabolic costs of silica frustule formation. Critically, nutrient competition dynamics shift: Cyanobacteria lose their advantage in nitrogen-limited settings as diminished salinity facilitates terrestrial nitrogen inputs (e.g., NO3−, NH4+), enabling green algae and diatoms to directly assimilate dissolved nitrogen without relying on cyanobacterial nitrogen fixation. Phosphorus bioavailability increases as lower salinity enhances phosphate solubility and sediment release, favoring diatoms and green algae with superior phosphate uptake kinetics over Cyanobacteria dependent on organic phosphorus hydrolysis. Diatoms gain additional leverage from rising silicic acid concentrations in freshwater inflows, reducing frustule synthesis costs and accelerating division. Thus, salinity reduction restructures the phytoplankton community by altering physiological constraints, nutrient accessibility, and trophic interactions, transitioning the ecosystem from cyanobacterial resilience to green algal and diatom competitiveness.
4.2. Responses of Zooplankton to Environmental Factors Under Freshwater Restoration
Copepoda was the dominant species in the freshwater restoration wetlands of the YRD. This is consistent with previous studies [34,35], which have documented that copepods are the dominant planktonic animals in most marine and oligotrophic freshwater systems, and are often replaced by cladocerans, rotifers, or protozoa in eutrophic lakes, acidic swamps, and tropical shallow waters [36,37]. The species abundance and biomass of zooplankton in the freshwater restoration wetlands were lower than those reported in lakes [38,39] and other large rivers like the Yangtze [40,41] and Huaihe [42].
Critically, zooplankton exhibited an inverse response to phytoplankton: biomass declined markedly from 1.76 mg/L in 5-year restoration sites (Rs19) to 0.19 mg/L in 22-year sites (Rs02), while Shannon diversity increased from 0.79 to 2.53 over the same gradient. This paradox reflects fundamental community restructuring, where prolonged freshwater input suppresses dominant copepods through physiological stress while facilitating opportunistic rotifer expansion. Taxonomic succession was pronounced: copepod biomass contribution decreased from 99.10% to 91.83% across the restoration chronosequence, while rotifers surged from 0.9% to 8.13% dominance. Canonical Correspondence Analysis identified salinity ions (Cl− and SO42−, r > 0.6) as the primary driver, with dissolved nitrate (NO3−) and organic matter (CODMn) as secondary factors. The mechanism centers on divergent osmoregulatory adaptations: rotifers (e.g., Brachionus) thrive under low salinity through efficient ion-channel regulation that minimizes energetic costs, coupled with r-selected parthenogenetic reproduction enabling explosive population growth when salinity stress eases [43]; conversely, copepods (e.g., Sinocalanus) decline due to high metabolic demands for hemolymph ion homeostasis in hypo-osmotic conditions, compounded by salinity disruption of their complex life cycle [44]. Path analysis further revealed that zooplankton biomass correlated negatively with both pH and carbon/nitrogen content under salinity mediation, where declining nitrate availability in long-restored wetlands limits protein synthesis for copepod molting, while reduced labile organic matter constrains microbial food webs supporting juvenile development. This transition carries significant trophic implications: while rotifer proliferation may help control cyanobacterial blooms, the biomass decline in lipid-rich copepods diminishes critical prey resources for fish larvae, potentially restructuring estuarine fisheries [45]. These salinity-driven zooplankton shifts demonstrate trade-offs between biodiversity gains and ecosystem function in managed deltas.
5. Conclusions
This study investigates the impacts of ecological freshwater restoration (FR) on plankton communities and environmental factors in the Yellow River Delta, revealing the dynamics in community structure and environmental factors. By surveying the taxa compositions of plankton populations according to the different durations of freshwater restoration wetlands, we found a total of 53 species of phytoplankton from five categories, and 30 species of zooplankton from four categories. With freshwater replenishment, the salinity and nutriment conditions in the water changed, which altered the species compositions of phytoplankton and zooplankton. With increasing restoration duration, the biomass of phytoplankton decreased first and increased, as did the diversity. In contrast, the biomass of zooplankton decreased, with the opposite for diversity. The correlation and path analysis revealed that the environmental factors such as salinity, dissolved nitrate, and organic matter contents were important for plankton biomass. Dissolved nitrate had the most influence on plankton with different restoration durations. The freshwater restoration affected the plankton biomass and diversity through changes in the environmental factors. The FR also affected the plankton by changing the relationship between the species, and the relationship between zooplankton and phytoplankton changed at different stages of the FR process.
Author Contributions
Conceptualization, J.J. and S.T.; Methodology, M.X., Y.H. and Z.Z.; Investigation, X.Z., B.Q. and L.H.; Software, Y.Z.; Writing—review and editing, J.J. All authors have read and agreed to the published version of the manuscript.
Funding
This research was funded by the National Youth Natural Science Foundation (42207527), Natural Science Foundation of Henan (252300421108; 252300421013), the National Key Research and Development Program (2021YFC3200402), and the Yellow River Conservancy Research Institute Basic Research Fund Special Project (HKY-JBYW-2022-04).
Data Availability Statement
Data available on request from the authors.
Acknowledgments
We thank the associate editor and the reviewers for their useful feedback that improved this paper. We thank the Huanghekou Administration for the assistance provided in the sampling work.
Conflicts of Interest
The authors declare no conflict of interest.
References
- He, Q.; Li, Z.A.; Daleo, P.; Lefcheck, J.S.; Thomsen, M.S.; Adams, J.B.; Bouma, T.J. Coastal wetland resilience through local, regional and global conservation. Nat. Rev. Biodivers. 2025, 1, 50–67. [Google Scholar] [CrossRef]
- Bai, J.H.; Zhao, Q.Q.; Lu, Q.Q.; Wang, J.J.; Reddy, K.R. Effects of freshwater input on trace element pollution in salt marsh soils of a typical coastal estuary, China. J. Hydrol. 2015, 520, 186–192. [Google Scholar] [CrossRef]
- Lu, W.Z.; Xiao, J.F.; Gao, H.Q.; Jia, Q.Y.; Li, Z.J.; Liang, J.; Xing, Q.H.; Mao, D.H.; Li, H.; Chu, X.J.; et al. Carbon fluxes of China’s coastal wetlands and impacts of reclamation and restoration. Glob. Change Biol. 2024, 30, 17280. [Google Scholar] [CrossRef] [PubMed]
- Dai, Y.; Yang, S.; Zhao, D.; Hu, C.M.; Xu, W.; Anderson, D.M.; Li, Y.; Song, X.P.; Boyce, D.G.; Gibson, L.; et al. Coastal phytoplankton blooms expand and intensify in the 21st century. Nature 2023, 615, 280–284. [Google Scholar] [CrossRef] [PubMed]
- James, C.C.; Barton, A.D.; Allen, L.Z.; Lampe, R.H.; Rabines, A.; Schulberg, A.; Zheng, H.; Goericke, R.; Goodwin, K.D.; Allen, A.E. Influence of nutrient supply on plankton microbiome biodiversity and distribution in a coastal upwelling region. Nat. Commun. 2022, 13, 2448. [Google Scholar] [CrossRef]
- Lizotte Michael, P. Polar Lakes and Rivers: Limnology of Arctic and Antarctic Aquatic Ecosystems; Oxford University Press: Oxford, UK, 2008. [Google Scholar]
- Liu, X.H.; Song, J.J.; Ren, Y.P.; Zhan, D.M.; Liu, T.; Liu, K.K.; Wu, H.Y.; Xu, B.D. Spatio-temporal patterns of zooplankton community in the Yellow River estuary: Effects of seasonal variability and water-sediment regulation. Mar. Environ. Res. 2023, 189, 106060. [Google Scholar] [CrossRef]
- Brierley, A.S. Plankton. Curr. Biol. 2017, 27, R478–R483. [Google Scholar] [CrossRef]
- Barton, A.D.; Pershing, A.J.; Litchman, E.; Record, N.R.; Edwards, K.F.; Finkel, Z.V.; Ward, B.A. The biogeography of marine plankton traits. Ecol. Lett. 2013, 16, 522–534. [Google Scholar] [CrossRef]
- Sun, X.W.; Zhang, H.Y.; Wang, Z.Y.; Huang, T.S.; Huang, H. Phytoplankton community response to environmental factors along a salinity gradient in a Seagoing River, Tianjin, China. Microorganisms 2022, 11, 75. [Google Scholar] [CrossRef]
- Yang, W.; Li, X.X.; Sun, T.; Pei, J.; Li, M. Macrobenthos functional groups as indicators of ecological restoration in the northern part of China’s Yellow River Delta Wetlands. Ecol. Indic. 2017, 82, 381–391. [Google Scholar] [CrossRef]
- Xiao, R.; Wang, Q.; Zhang, M.X.; Pan, W.B.; Wang, J.J. Plankton distribution patterns and the relationship with environmental gradients and hydrological connectivity of wetlands in the Yellow River Delta. Ecohydrol. Hydrobiol. 2020, 20, 584–596. [Google Scholar] [CrossRef]
- Zhao, Q.Q.; Bai, J.H.; Gao, Y.C.; Zhao, H.X.; Huang, Y.J.; Zhang, W.; Wang, J.N.; Chen, G.H. Effects of freshwater inputs on soil quality in the Yellow River Delta, China. Ecol. Indic. 2019, 98, 619–626. [Google Scholar] [CrossRef]
- Jiang, H.C.; Liu, D.Y.; Song, X.K.; Ma, Y.Q.; Wang, Y.J.; Liu, A.Y.; Cheng, L.; He, J.L.; Sun, S. Response of phytoplankton assemblages to nitrogen reduction in the Laizhou Bay, China. Mar. Pollut. Bull. 2018, 136, 524–532. [Google Scholar] [CrossRef]
- Song, J.; Hou, C.Y.; Liu, Q.; Wu, X.F.; Wang, Y.J.; Yi, Y.J. Spatial and temporal variations in the plankton community because of water and sediment regulation in the lower reaches of Yellow River. J. Clean. Prod. 2020, 261, 120972. [Google Scholar] [CrossRef]
- Fu, M.Z.; Zhao, L.L.; Zhang, Z.H.; Qu, P.; Song, H.J.; Yi, S.J.; Wang, Z.L. Phytoplankton assemblage distribution patterns under different Yellow River freshwater discharge scenarios. J. Sea Res. 2023, 192, 102348. [Google Scholar] [CrossRef]
- Patricia, C.F. Comparative Study of Ecological Indices for Assessing Human-Induced Disturbance in Coastal Wetlands of the Laurentian Great Lakes. Ecol. Indic. 2009, 9, 81–91. [Google Scholar] [CrossRef]
- GB 3838-2002; Environmental Quality Standards for Surface Water. Ministry of Ecology and Environment of China: Beijing, China, 2002.
- Hu, H.J.; Wei, Y.X. Freshwater Algae of China: Systematics, Classification and Ecology; Science Press: Beijing, China, 2002. [Google Scholar]
- Zhang, Z.S.; Huang, X.F. Methodology for Freshwater Plankton Research; Science Press: Beijing, China, 1991. [Google Scholar]
- Xiang, X.F.; Yu, G.L.; Chen, S.Z. Cladocera of the Yangtze River Basin; China Science and Technology Press: Beijing, China, 1991. [Google Scholar]
- Shannon, C.E. A mathematical theory of communication. Bell Syst. Tech. J. 1948, 27, 379–423. [Google Scholar] [CrossRef]
- Boyd, P.W.; Rynearson, T.A.; Armstrong, E.A.; Fu, F.; Hayashi, K.; Hu, Z.; Mulholland, M.R. Marine phytoplankton temperature versus growth responses from polar to tropical waters–outcome of a scientific community-wide study. PLoS ONE 2013, 8, 63091. [Google Scholar] [CrossRef]
- Marti, C.L.; Imberger, J.; Garibaldi, L.; Leoni, B. Using time scales to characterize phytoplankton assemblages in a deep subalpine lake during the thermal stratification period: Lake Iseo, Italy. Water Resour. Res. 2016, 52, 1762–1780. [Google Scholar] [CrossRef]
- O’Donnell, D.R.; Wilburn, P.; Silow, E.A.; Yampolsky, L.Y.; Litchman, E. Nitrogen and phosphorus colimitation of phytoplankton in Lake Baikal: Insights from a spatial survey and nutrient enrichment experiments. Limnol. Ocean. 2017, 62, 1383–1392. [Google Scholar] [CrossRef]
- Harris, G.P.; Trimbee, A.M. Phytoplankton population dynamics of a small reservoir: Physical/biological coupling and the time scales of community change. J. Plankton Res. 1986, 8, 1011–1025. [Google Scholar] [CrossRef]
- Xie, Y.L.; Cui, B.S.; Xie, T.; Cai, Y.Z.; Gao, F.; Chen, C.; Zhang, L. Distribution of phytoplankton and zooplankton in the Pearl River Delta river network in winter of 2021 and effects of salt tide. Wetl. Sci. 2022, 20, 666–680. (In Chinese) [Google Scholar]
- Jiang, Z.B.; Liu, J.J.; Chen, J.F.; Chen, Q.Z.; Yan, X.J.; Xuan, J.L.; Zeng, J.N. Responses of summer phytoplankton community to drastic environmental changes in the Changjiang (Yangtze River) estuary during the past 50 years. Water Res. 2014, 54, 1–11. [Google Scholar] [CrossRef] [PubMed]
- Liu, Y.; Yu, L.; Yao, Z.; Shen, Y.; Pan, Y. The effects of turbulence on the growth of three different diatom speciess. Front. Mar. Sci. 2024, 11, 140. [Google Scholar] [CrossRef]
- Wang, K.X.; Liu, Z.G.; Zhao, G.M.; Wang, W.H.; Su, D.P.; Lu, F.; Kang, Z.Q.; Zhang, Y.; Ni, X.; Zhao, L.H. Characteristics of soil carbon, nitrogen, phosphorus in soils and their ecological stoichiometric ratios in different habitats of Yellow River Delta. Mar. Geol. Front. 2025, 41, 90–99. (In Chinese) [Google Scholar]
- Lewandowska, A.; Sommer, U. Climate change and the spring bloom: A mesocosm study on the influence of light and temperature on phytoplankton and mesozooplankton. Mar. Ecol. Progr. 2010, 405, 101–111. [Google Scholar] [CrossRef]
- Richardson, T.L.; Gibson, C.E.; Heaney, S.I. Temperature, growth and seasonal succession of phytoplankton in Lake Baikal, Siberia. Freshw. Biol. 2010, 44, 431–440. [Google Scholar] [CrossRef]
- Vrieling, E.G.; Gieskes, W.W.C.; Beelen, T.P.M.; Van Santen, R.A. Diatom silica biomineralization: At nanoscale level a chemically uniform process. J. Struct. Biol. 2004, 147, 288–297. [Google Scholar] [CrossRef]
- Wang, Y.W.; Zhang, S.Y.; Sun, M.F.; Han, J.M.; Wang, Z.Y.; Chen, X.L.; Chen, Z.F.; Qin, H.M. Spatial-Temporal Pattern and Stability Analysis of Zooplankton Community Structure in the Lower Yellow River in China. Diversity 2025, 17, 162. [Google Scholar] [CrossRef]
- Liu, Z.W.; Yang, A.; Liu, J.H.; Xing, C.G.; Huang, S.Z.; Huo, Y.; Yang, Z.Y.; Huang, J.R.; Liu, W.Q. Turnover of phytoplankton and zooplankton communities driven by human-induced disturbances and climate changes in a small urban coastal wetland. Ecol. Indic. 2023, 157, 11. [Google Scholar] [CrossRef]
- Mao, Z.G.; Cao, Y.; Gu, X.H.; Zeng, Q.F.; Chen, H.H.; Jeppesen, E. Response of zooplankton to nutrient reduction and enhanced fish predation in a shallow eutrophic lake. Ecol. Appl. 2022, 33, 2750. [Google Scholar] [CrossRef] [PubMed]
- Li, Y.; Geng, M.D.; Yu, J.L.; Du, Y.X.; Xu, M.; Zhang, W.Z.; Wang, J.J.; Su, H.J.; Wang, R.; Chen, F.Z. Eutrophication decrease compositional dissimilarity in freshwater plankton communities. Sci. Total Environ. 2022, 821, 153434. [Google Scholar] [CrossRef] [PubMed]
- Doulka, E.; Kehayias, G. Seasonal vertical distribution and diel migration of zooplankton in a temperate stratified lake. Biologia 2011, 66, 308–319. [Google Scholar] [CrossRef]
- Liu, B.; Liu, J.; Jeppesen, E.; Chen, Y.; Liu, X.; Zhang, W. Horizontal distribution of pelagic crustacean zooplankton biomass and body size in contrasting habitat types in Lake Poyang, China. Environ. Sci. Pollut. Control. Ser. 2019, 26, 2270–2280. [Google Scholar] [CrossRef]
- He, T.; Zhang, J.H.; Zhang, C.L. Species and diversity of plankton in Baolong River on the upper reaches of the Yangtze River. Fresh Water Fish. 2014, 44, 51–55. [Google Scholar]
- Xu, Z.; Wang, Y.; Chen, Y.; Shen, H. Ecological study on zooplankton in maximum turbid zone of estuarine area of Changjiang Yangtze river. J. Fish. China 1995, 2, 39–48. [Google Scholar]
- Deng, D.G.; Xu, Z.H. The Prelimary Study of Crustacean Zooplankton of Bengbu Region in Huaihe River. J. Huaibei Coal Ind. Teach. Coll. 2006, 27, 40–43. [Google Scholar]
- He, Z.; Qin, J.; Wang, H.; Wang, Z.; Xia, X. Studies on the Saline and Hypersaline Zooplanktons from Jinan and Yinchuan Regions. Acta Hydrobiol. Sin. 1989, 13, 24–37. [Google Scholar] [CrossRef]
- Zhou, J.J.; Zhao, W. Mechanism of stress resistance of rotifer Brachionus plicatilis: A review. J. Dalian Ocean. Univ. 2020, 35, 768–774. (In Chinese) [Google Scholar]
- Bozza, D.C.; Freire, C.A.; Prodocimo, V. A systematic evaluation on the relationship between hypo-osmoregulation and hyper-osmoregulation in decapods of different habitats. J. Exp. Zool. Part A Ecol. Integr. Physiol. 2024, 341, 5–30. [Google Scholar] [CrossRef]
Disclaimer/Publisher’s Note: The statements, opinions and data contained in all publications are solely those of the individual author(s) and contributor(s) and not of MDPI and/or the editor(s). MDPI and/or the editor(s) disclaim responsibility for any injury to people or property resulting from any ideas, methods, instructions or products referred to in the content. |
© 2025 by the authors. Licensee MDPI, Basel, Switzerland. This article is an open access article distributed under the terms and conditions of the Creative Commons Attribution (CC BY) license (https://creativecommons.org/licenses/by/4.0/).