Abstract
Water systems are highly vulnerable to biofilm formation, which can compromise water quality, operational efficiency, and public health. Factors such as surface material properties and gravitational orientation of the surface play critical roles in the early stages of microbial attachment and biofilm development. This study examines the impact of gravity and surface composition on the initial adhesion of Pseudomonas fluorescens AR11—a model organism for biofilm research. Focusing on stainless steel (SS) and polycarbonate (PC), two materials commonly used in water and wastewater infrastructure, bacterial adhesion was evaluated at surface inclinations of 0°, 45°, 90°, and 180° to assess gravitational impact. After three hours of contact, fluorescence microscopy and image analysis were used to quantify surface coverage and cluster size distribution. The results showed that both material type and orientation significantly affected early biofilm formation. PC surfaces consistently exhibited higher bacterial adhesion at all angles, with modest variations, suggesting that material properties are a dominant factor in initial colonization. In contrast, SS showed angle-dependent variation, indicating a combined effect of gravitational convection and surface characteristics. These insights contribute to a deeper understanding of biofilm dynamics under realistic environmental conditions, including those encountered in space systems, and support the development of targeted strategies for biofilm control in water systems and spaceflight-related infrastructure.
1. Introduction
Biofilms, complex microbial communities that attach and grow on surfaces, consist primarily of extracellular polymeric substances (EPSs), while microorganisms constitute less than 10% of the biofilm’s dry mass [1,2]. From a morphological point of view, these complex systems involve microbial layers, clusters, microchannels, and voids, displaying non-uniform spatial distributions and temporal variations [3].
Biofilms play pivotal roles in diverse industries, notably contributing to wastewater treatment and bioremediation by enhancing processes like removing pollutants from contaminated environments [4]. In the agricultural sector, biofilms promote plant growth by aiding nutrient uptake [5]. Despite these positive effects, challenges emerge in various sectors. An example is found in water treatment distribution systems, where biofilms can jeopardize the quality of distributed water, posing challenges to water treatment processes [6,7]. Another instance is the aerospace industry, where biofilm growth has been observed in several space stations, including the International Space Station (ISS), which occasionally poses a threat to vital equipment, such as water recycling systems [8]. Considering all the above, a comprehensive understanding of biofilm formation is crucial for addressing both the positive and negative implications it presents across various applications.
Many parameters significantly influence the processes of bacterial adhesion and subsequent biofilm formation. These multifaceted factors extend to various domains, including environmental, nutritional, and microbial elements. Some critical examples encompass the composition of the bacterial community, nutrient levels, oxygen availability, the characteristics of the adhesion/growth surface, and the hydrodynamic features of the system [9,10,11,12,13,14,15,16]. The literature indicates that gravity, including bacterial transport (or motility) and gravitational deposition, influences biofilm formation, as it represents the mechanism by which bacteria come into contact with a surface [17]. More specifically, it is observed that bacterial adhesion is notably higher on the lower surface positioned at the downstream end of the flow compartment, in contrast to surfaces located upstream or upper surfaces, indicating a spatial preference for adhesion that is influenced by the relative position within the flow path [18,19,20]. This behavior is typically attributed to higher bacterial concentration at the lower surface caused by sedimentation. Also, Hogan et al. (2023) indicated that shear may inhibit the initial bacterial attachment to a heterogeneous lower surface inside a flow cell, which contributes to washing out the already sedimented bacteria [21]. In a previous study, Yang [18] demonstrated that gravitational deposition has a positive effect on biofilm formation under laminar flow conditions, with greater biofilm attachment and development at the lower part of capillary tube reactors. However, its influence diminishes as the flow rate increases. Furthermore, the same study suggests that the adaptable and reversible nature of biofilm responses to environmental changes is linked to a multifaceted relationship between factors such as gravity and bacterial motility, necessitating further investigation for a comprehensive understanding of biofilm formation [18]. In line with these studies, Jha et al. [20] confirmed that biofilms are formed on various horizontal surfaces due to the accumulation of bacteria; yet, they demonstrate a rather fragile structure. In practical applications, gravity-induced convection affects the sedimentation of bacteria, particularly those that are non-motile. Furthermore, Chang et al. [22] interconnected gravity effects with oxygen availability when biofilm was formed on confined geometries; interestingly, the most crucial factor appears to be oxygen availability, and once the latter is satisfied, biofilm growth is governed by gravity.
Once the bacteria approach a surface, the degree of attachment is also affected by the chemical and physical properties of the surface, including roughness, surface charge, stiffness, surface wettability, chemical composition, and topography [23,24]. Various surfaces have been studied regarding biofilm formation, including glass, polycarbonate and polypropylene plastics, stainless steel, and porcelain. There is conflicting information in the literature regarding bacterial adhesion and the formation of biofilms on various abiotic surfaces. According to the findings of Khelissa et al. [25], the adhesion of P. aeruginosa was higher on stainless steel compared to polycarbonate, and this adhesion was intensified as the incubation temperature increased. Another study reports that K. pneumoniae exhibits higher biofilm formation on stainless steel than on polystyrene and polypropylene [26].
In contrast, other studies have reported divergent results. Cells of C. sakazakii demonstrate a higher tendency for attachment to silicone and polycarbonate surfaces compared to stainless steel [27]. Kilic et al. [28] conducted a study that revealed that B. pumilus exhibited the greatest biofilm formation on polycarbonate surfaces, whereas the least amount of biofilm was observed on glass surfaces.
This study investigates the impact of gravity and surface type on the bacterial adhesion of P. fluorescens, a gram-negative and motile bacterium, at liquid–solid interfaces. Stainless steel and thermoplastic polycarbonate, both used in water distribution systems and space applications due to their durability and resistance properties, were selected for this study based on their relevance to biofilm susceptibility. This study quantifies surface coverage and clump formation after short-term exposure, providing insight into early biofilm development mechanisms relevant to both terrestrial and space-based applications. This work advances the current understanding by experimentally analyzing the combined influence of surface orientation and material type on the initial stages of bacterial adhesion under gravity-relevant conditions. This study’s design reflects conditions pertinent to both terrestrial and space-based water systems, highlighting previously underexplored interactions between physical orientation and surface-dependent microbial attachment.
2. Materials and Methods
2.1. Culture Conditions
The protocol for culture conditions in this study follows the methodology employed by Kampouraki et al. [29]. The present study utilizes Pseudomonas fluorescens AR11 (DSM no. 4358) for bacterial strain selection. P. fluorescens AR11 is an aerobic, gram-negative, and rod-shaped bacterium, typically measuring approximately 1–2 µm in length and 0.3–0.6 µm in width, and stock cultures were obtained from DSMZ-German Collection of Microorganisms and Cell Cultures GmbH (Braunschweig, Germany). The genus Pseudomonas was selected for its strong ability to form biofilms. P. fluorescens is widely used in environmental and industrial studies due to its biosurfactant production and consistent biofilm formation on various abiotic surfaces [30,31]. Strain AR11 was chosen for its reproducibility, environmental relevance, and BSL-1 classification, making it suitable for controlled biofilm studies under standard laboratory conditions [30].
The bacterial strain was cultured in a sterile mineral medium, provided by DSMZ, supplemented with glucose monohydrate (1.166 g/L) as the carbon source, maintaining a C/N ratio of approximately 4:1. The medium also included phosphate solution [(Na2HPO4 at 2.42 g/L and KH2PO4 at 1.505 g/L)], (NH4)2SO4·7H2O (0.495 g/L), MgSO4·7H2O (0.198 g/L), CaCl2·2H2O (0.0495 g/L), and a trace element solution containing EDTA (0.00495 g/L), FeSO4·7H2O (0.00198 g/L), ZnSO4·7H2O (9.9 × 10⁻⁵ g/L), MnCl2·4H2O (2.97 × 10⁻⁵ g/L), H3BO3 (2.9 × 10⁻⁴ g/L), CoCl2·6H2O (1.9 × 10⁻⁴ g/L), CuCl2·2H2O (9.9 × 10⁻⁶ g/L), NiCl2·6H2O (1.98 × 10⁻⁵ g/L), and Na2MoO4·2H2O (2.97 × 10⁻⁵ g/L) at a pH of 6.9. The bacterial cells were cultivated overnight at 30 °C under shaking (100 rpm) (RS Lab-7PRO, RS Lab), and the cell density was estimated using optical density measurements at 600 nm (OD). Subsequently, the cultures were diluted to an optical density of approximately 0.2 at a wavelength of 600 nm using a UV-1800 SHIMADZU Spectrophotometer (Kyoto, Japan) [29]. This OD value corresponds to about 16·106 bacterial cells [31], the early logarithmic phase of bacterial growth, and reflects a uniform cell concentration across experiments.
2.2. Bacterial Adhesion
Bacterial adhesion experiments were performed under batch conditions at a constant temperature of 30 °C for optimal growth of P fluorescens, a mesophilic organism. The tested materials were stainless steel (SS) and polycarbonate (PC) coupons (length × width × depth: 149.75 × 14.65 × 1.47 mm) purchased from BioSurface Technologies Corporation (Bozeman, MT, USA). Initially, the coupons were cleaned using a soft lint-free cloth soaked in a 2% solution of a commercial anionic surfactant (P1), followed by thorough rinsing with tap water to remove any remaining detergent residues. Afterwards, the stainless steel (SS) coupons were submerged in a 95% acetone solution for 30 s, while the polycarbonate (PC) coupons were immersed in a 70% isopropyl alcohol solution for at least 30 s. Following this step, the coupons were rinsed with sterile distilled water and left to air-dry [32,33,34]. The surfaces were sterilized inside a laminar flow cabinet to ensure that the process was conducted in a sterile environment. Four different setups were utilized, all of which were sterilized in a steam autoclave at 121 °C before the experiments, considering the angle between the area vector and gravitational force (weight, W). To distinguish between tests, we used four distinct angles, as shown in Figure 1 (0°, 45°, 90°, and 180°). The visualization of these setups and their corresponding dimensions was generated using SOLIDWORKS 2022 Software (Version: Student Premium) and is presented in Figure 2. Initially, six coupons made of the same material were placed in each empty chamber, and subsequently, the setup was inoculated with the bacterial culture (OD600 nm = 0.2). To ensure consistency across all configurations, the volume of nutrient liquid introduced into each setup was carefully adjusted to maintain a constant ratio of total wetted surface area (St) to liquid volume (V). The liquid quantity was sufficient to fully submerge the surfaces without overfilling the chambers. This approach ensured comparable surface-to-volume exposure conditions in all orientations (Figure 1). All experiments were conducted at a constant temperature of 30 °C for a short period of 3 h to achieve conditions favorable for early-stage bacterial adhesion without progressing to mature biofilm development. Every hour, two coupons were withdrawn and analyzed. Due to the short duration of the experiment, nutrient replacement was not performed, and any planktonic cells were removed at the end of each experiment by gently rinsing with sterile water. Bacterial adhesion was investigated for stainless steel (SS) coupons at all four angles (0°, 45°, 90°, and 180°), while polycarbonate (PC) coupons were used at three of the four angles (0°, 90°, and 180°). All experiments were performed in triplicate.
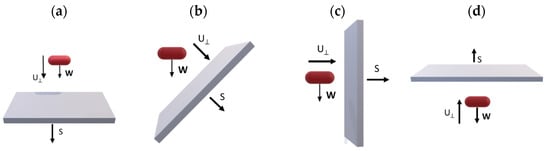
Figure 1.
Experiments performed at (a) 0°, (b) 45°, (c) 90°, and (d) 180° (W: gravity and S: area vectors).
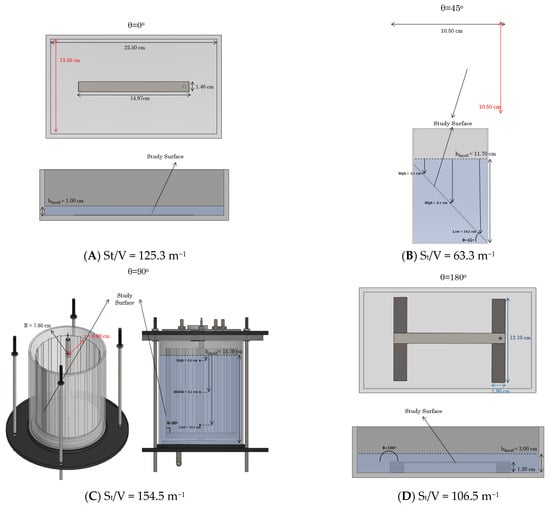
Figure 2.
Top and side views of test setups. Illustrations of the utilized setups are provided, displaying the dimensions and the height of the used setup (hliquid) once filled and prepared for testing. For clarity, the illustrations are depicted with only one coupon, while during the experiments, six coupons made of the same material were placed in each setup. (A) 0°, (B) 45°, (C) 90°, (D) 180°.
2.3. Detection of Bacterial Adhesion by Staining
Bacterial adhesion detection and subsequent analysis were conducted using epifluorescence microscopy. This study employed an upright microscope (Nikon, Eclipse Ci, Japan) specifically chosen for this purpose. The samples were stained using the fluorescent nucleic acid stain SYTO® 9 (green fluorescent), a component of the FilmTracer™ LIVE/DEAD® Biofilm Viability Kit (Eugene, OR, USA). To create the dye solution, an appropriate amount of SYTO® 9 (3 μL) stain was added to 1 mL of sterile distilled water in a sterile Eppendorf tube. The SYTO® 9 stain labeled bacteria with intact cell membranes (live) that appeared fluorescent green. The dye’s excitation/emission maxima were approximately 480/500 nm for SYTO® 9 and 490/635 nm for propidium iodide. The background remained virtually nonfluorescent. The coupons were withdrawn from the setup using sterile forceps. Then, sterile distilled water was pipetted to rinse the coupons to remove any planktonic cells [29]. Subsequently, the coupons were covered with 400 μL of dye solution and incubated at room temperature for 20–30 min, protected from light. After incubation, the coupons were gently rinsed with distilled water and observed under the microscope at a magnification of 10×. The appropriate filter, FITCH-3540C (for SYTO® 9), manufactured by Semrock, was used for image acquisition. The microscope was equipped with NIS-Elements L software (https://www.microscope.healthcare.nikon.com/en_AOM/products/cameras/nis-elements-l, accessed on 24 July 2025) (Nikon, Tokyo, Japan), which enabled the capture of images from sample observations.
For each tested coupon, three designated areas along the coupon’s length were selected to gain a comprehensive understanding of the combined effects of gravitational force and bacterial motility. In each area, at least 3–5 measurements were conducted. These three positions were strategically chosen: one at the top edge of the coupon, symbolized as “Top”; another in the middle of the coupon, referred to as “Centre”; and the third at the bottom edge of the coupon, denoted as “Bottom”. The nomenclature of these regions applies to inclined coupons and is depicted in Figure 3.
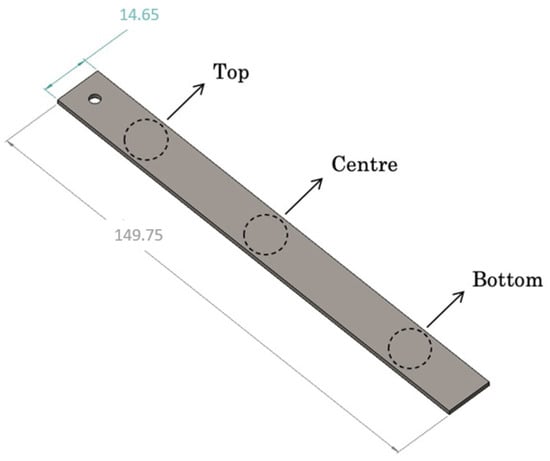
Figure 3.
Selected areas for examination on each coupon.
2.4. Characterization of Bacterial Adhesion by Surface Coverage and Size Distribution
To quantify the percentage of biofilm coverage area relative to the total captured area in the microscope images, the commercially available software ImageJ2 (National Institutes of Health) was used. Specifically, the images used for analysis comprise solely the observations made with the SYTO® 9 stain. A standardized method was used to count individual cells and clusters based on the fluorescence intensity in monochrome images. Before analysis, each image was converted to grayscale. Subsequently, the threshold was manually adjusted to ensure an accurate measurement of the bacterial cluster area, thereby minimizing the risk of undercounting or overcounting. Final area calculation was performed on the binary version of the image, which was subsequently generated. The results include the total count of cells, the area of each cell count, and the total area covered by bacteria. To establish the size distribution of counts, they were initially categorized into five groups based on their respective area sizes. Specifically, these categorized groups consist of bacterial cells with an area ranging from 0.15 to 1.50 μm2, corresponding to single-cell attachment. It is crucial to highlight that a single cell from another strain of P. fluorescens (PICF7) measures approximately 0.5 μm in width (or diameter) and 2.0 μm in length [35]. The remaining four groups represent clusters of cells of varying sizes: 1.50–7.50 μm2, 7.50–15.00 μm2, 15.00–150.00 μm2, and over 150.00 μm2. The ratio between the sum of the counts’ area in each size group and the total bacterial surface area represents the size distribution observed during each analysis. Area measurements are expressed in square micrometers (μm2), derived from the calibration of the microscope scale.
2.5. Statistical Analysis
Kolmogorov–Smirnov normality tests were initially performed to investigate whether data follow normal distribution using IBM SPSS Statistics Data Editor 23. Afterwards, a full factorial, univariate analysis was conducted to explore interactions between independent ordinal variables for each material, considering surface coverage as the dependent variable.
3. Results
To evaluate the impact of gravity on cell attachment to a surface, which is the initial stage of biofilm formation, a dense matrix of experiments was implemented at different angles between gravity and area vectors (shown in Figure 1 as W and S, respectively), while the spatial and temporal evolution of cells’ behavior was studied. Bulk measurements included optical density at 600 nm, whereas biofilms at early stages were estimated with epi-fluorescence analysis and subsequent quantitative image analysis. To facilitate a more straightforward presentation, certain abbreviations are employed. Specifically, the stainless steel surface is denoted as SS, while the polycarbonate surface is denoted as PC. The results for these surfaces at θ = 0° are indicated as SS0 and PC0, at θ = 90° as SS90 and PC90, and so on.
At the beginning and the end of each experiment, the OD of the culture mixture was measured. The results showed that the values of the OD are similar in all experiments, with minimal variation observed between replicates. For this reason, the results are presented in a single consolidated diagram derived from all experiments conducted within a specified time frame. As shown in Figure 4, the OD values exhibit negligible deviations over time, and the average values remain essentially constant throughout the 3 h incubation period.
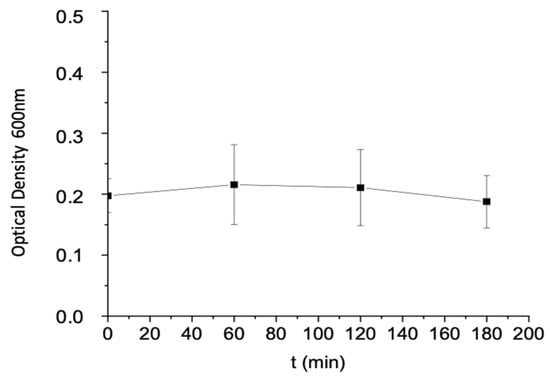
Figure 4.
Change in optical density with time.
The stability of OD values (close to 0.2) over time is consistent, indicating that the bacterial culture remained in the lag phase, during which active cell division had not yet begun. Therefore, bacterial adhesion likely originated from the initial planktonic population rather than from colonization due to increased cell density in the bulk. Furthermore, the lack of measurable growth suggests limited cell–cell interactions, which minimizes the likelihood of clump or microcolony formation during the incubation period [1,5]. However, some limited surface-associated proliferation may have occurred. To ensure that cellular aggregates did not originate from the inoculum, microscopic inspection of the seed culture took place before each experiment. No visible clumps or microcolonies were observed. While small-scale aggregation below the detection limit of light microscopy cannot be excluded entirely and bacteria prone to form biofilms can form biofilm aggregates in the liquid medium [36], the combination of low optical density and visual confirmation indicates that the inoculum consisted mainly of single cells.
3.1. Horizontal Placement of Surface (θ = 0°, 180°)
The results shown in Figure 5 present the ratio of surface area covered by biofilm when the wetted surface is placed horizontally (θ = 0° and 180°, Figure 1a,d). Figure 6 demonstrates representative images of biofilm obtained using fluorescence microscopy. It is apparent that gravity influences the biofilm formation onset. However, the underlying phenomena are rather complicated, as both the rate and degree of attachment are also dependent on the type of material in contact with the liquid medium. For bacterial attachment to a surface to be perpetual, the bacteria should first come into contact with the surface and subsequently attach to it, owing to the properties of the local micro-environment. The surface coverage was almost double in the case of PC compared to SS throughout all time periods. While gravitational orientation clearly influenced adhesion on SS, this effect was not evident on PC, indicating that material properties predominantly determined bacterial attachment on this surface. Nevertheless, the gravitational convection promotes the approximation of P. fluorescence to the surface, even though these bacteria exhibit self-generated movement due to various appendages on their surfaces, e.g., flagella and pili [37]. Surface coverage on SS0 was double that of SS180 at all times.
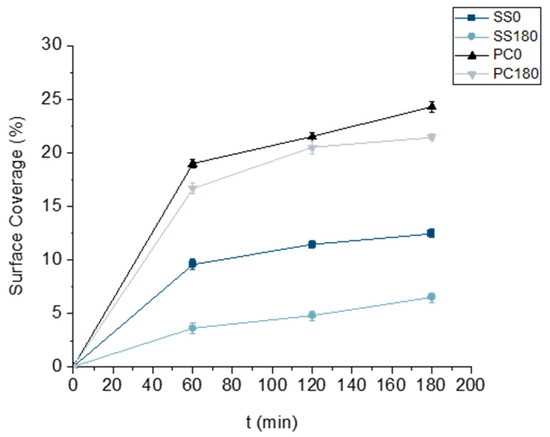
Figure 5.
Evolution of the percentage of surface coverage by biofilm over time for SS and PC at 0° and 180° angles.

Figure 6.
Evolution of surface coverage by biofilm over time for SS and PC at 0° and 180°.
As shown in Figure 5, surface coverage increased over time for both PC and SS, with remarkably low standard deviations across replicates, indicating good experimental reproducibility. While SD alone does not confirm spatial homogeneity, microscopic imaging performed at different surface positions (top, centre, and bottom) revealed consistent bacterial distribution across the entire coupon (Figure 6). These observations suggest that, under static and horizontal conditions (0° and 180°), biofilm formation was spatially uniform at the early stages of adhesion. This behavior was observed on both PC and SS, despite their markedly different chemical and physical surface properties. Representative microscopy images supporting this observation are provided in Figure 6. In the respective images acquired with propidium iodide (Figure S1), a faint red signal at 1, 2, and 3 h likely corresponds to background fluorescence or minor membrane compromise, indicating bacterial viability during initial attachment.
The results in Figure 7 illustrate the changes in the size distribution of the bacterial population attached to the surfaces over time. Since the surfaces were placed horizontally, the results are consolidated for the three control points. For SS material, surface orientation at 0° triggered the formation of bigger clusters compared to SS180, even after just 60 min of contact between the liquid medium and the surface. The same behavior, but to a lesser extent, was observed in the case of PC, where the surface coverage area was comparable in both PC0 and PC180 cases. In total, more clusters were observed on the PC surface than on the SS surface for all control points, confirming that PC material irreversibly attracts the bacterial cells. However, it is noteworthy that the rate that clusters are expanded from low to higher sizes seems higher for SS180 than SS0 or PC0 and comparable to that of PC180, i.e., clusters in the range of 15 to 150 μm2 increase (for the period 60 min to 180 min) from 12 to 23% (almost 92% increase) for SS180, from 18 to 32% (almost 78% increase) for SS0, from 14 to 19% (36% increase) for PC180, and from 20 to 24% (20% increase) for PC0.
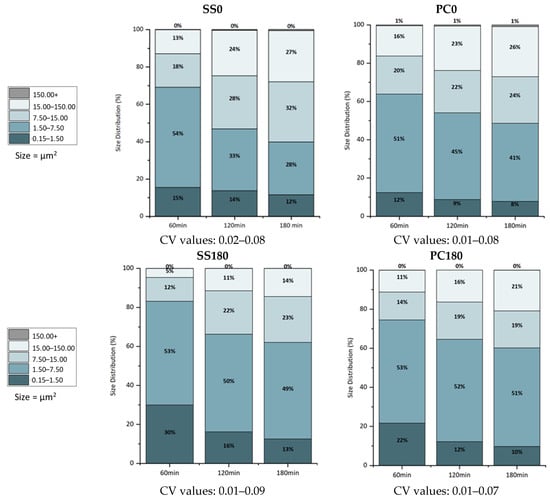
Figure 7.
Bacterial population size distributions for SS and PC at 0° and 180°.
The observed differences in biofilm formation between PC and SS can be attributed to the different surface properties and chemical compositions of the materials. SS presents low roughness [38] and is relatively hydrophilic [29]. Its surface is covered by a passive oxide layer primarily composed of chromium and iron oxides (e.g., Cr2O3 and Fe2O3) that produces a slightly negative surface charge [39]. On the other hand, the PC material is hydrophobic, demonstrating lower surface energy, composed of aromatic rings and carbonate linkages [40]. The observed higher adhesion to PC could be attributed to van der Waals interactions and/or the surface affinity of PC aromatic chains with components of the bacterial membrane, i.e., π-π stacking. Apparently, bacterial adhesion to the SS surface is expected to be more limited compared to PC; however, bacteria may attach to specific critical locations that are more prone to bacterial attachment, such as deficiencies in electropolishing. In these areas, biofilm clusters could expand more easily due to a micro-environment favorable for biofilm formation.
The coefficient of variation (CV) was also calculated using the following formula:
The standard deviation (σ) is the deviation obtained from the number of cells/clusters located in a certain size scale to the mean value of the number of cells/clusters obtained by processing all images for a certain experiment—the coefficients of variation for the size distributions in Figure 7 range from 1 to 9%. Table 1 shows the sum of individual bacterial cells and clusters of bacterial cells that comprise the bacterial population in each case, measured using ImageJ2 software. The results, especially in combination with those shown in Figure 7, confirm the enhanced bacterial deposition for SS0 compared to SS180. Interestingly, the sum of counts decreases with contact time, indicating that biofilm growth and structure are primarily influenced by the extent and attributes of the early stages of bacterial attachment, which, in turn, are strongly affected by the SS features. Surprisingly, in the case of PC, the number of attached cells after 60 min is higher for PC180 than for PC0. Taking also into account the size distribution for PC0 and PC180 (Figure 7), it is apparent that there is a slower transition towards larger clusters compared to SS0 and SS180. This behavior is more evident in the case of PC180, where the size distribution relies on the two smallest groups of clusters, e.g., 0.15–7.5.

Table 1.
Τotal number of bacterial cells and clusters per mm2 on SS and PC at 0° and 180°.
3.2. Inclined Surfaces
3.2.1. θ = 90°
The results of the image analysis from coupons placed vertically in a container are presented in Figure 8. Figure 9 shows representative images of the SS90 and PC90 surfaces with biofilm, corresponding to the area of the coupon referred to as the centre. It is apparent that gravity competes with other factors in biofilm formation, including material type and dissolved oxygen. In addition, spatial evolution was evident in both materials (Figure 8), confirming the pivotal role of dissolved oxygen. In particular, biofilm structures were formed on the “top” area, while at the midpoint, called the “centre” and “bottom” areas, the surface coverage area gradually decreased, although gravity would be expected to impose greater microbial accumulation closer to the bottom of the container. Remarkably, a crowded microbial community formed at the outer area of the coupons above the liquid medium level, at the non-wetted surface (see Supplementary Materials), suggesting that bacteria thrive on oxygen availability.

Figure 8.
Evolution of the percentage of surface coverage over time for SS and PC at 90°. The images correspond to the ‘’centre’’ area of the coupon.

Figure 9.
Evolution of surface coverage over time for SS and PC at 90°.
Furthermore, a higher percentage of surface coverage was observed for the PC surface for all control points compared to the SS ones (Figure 8). These results are consistent with those obtained at θ = 0° and 180°. However, temporal evolution depicted differences among experiments at different angles. In previous experiments, a substantial increase in bacterial attachment was observed during the first 60 min of contact time, after which the rate decreased significantly, whereas, at θ = 90°, the surface coverage increased almost linearly with time (Figure 8). In other words, it is evident that gravitational settling contributes significantly to first-order kinetics of initial adhesion, considering that the bulk concentration remains stable and that the slope in Figure 5 is high during the first 60 min and then reaches a plateau, while biofilm coverage is far from saturation. On the other hand, the linear increase in surface coverage at 90° implies kinetics close to zero order, most probably because bacterial transport via diffusion or motility towards the surface, in the absence of gravity-enhanced sedimentation, occurs at a constant rate.
The size distribution of the bacterial population attached to the surface over time for the SS and PC surfaces placed at 90° is shown in Figure 10, while the sum of individual bacterial cells and clusters of bacterial cells that comprise the attached bacterial population is presented in Table 2.
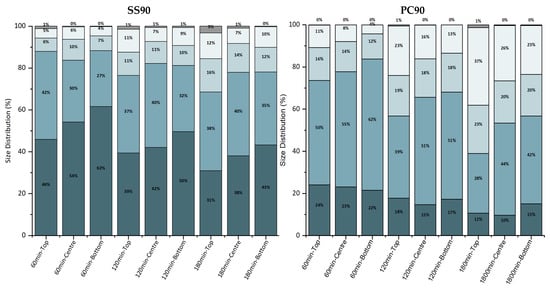
Figure 10.
Bacterial population size distributions for SS and PC at 90°.
Table 2.
Τotal number of bacterial cells and clusters per mm2 on SS and PC at 90°.
The size distribution of bacterial clusters on the SS surface increased over time, with the majority of clusters found at the top point. The number of bacterial cells and clusters decreased, with the most significant reduction occurring at the top point during all three hours of the experiment. Similar behavior was observed for the PC surface, where most of the bacterial clusters were found at the top point. In contrast, fewer clusters of bacterial cells were observed at the centre and bottom points. The two control points (centre and bottom) showed trivial differences.
The size distribution suggests that most clusters are located at the point closest to the liquid–air interface. Comparatively, more clusters were observed on the PC surface than on the SS surface for all control points. The sum of bacterial cells and aggregates is greater for the PC surface at all points examined. The decrease in this sum over time, which occurs in all cases, confirms the formation of the observed clusters.
3.2.2. θ = 45°
The results of bacterial attachment, expressed as a surface coverage percentage, for the SS material are presented in Figure 11, with respective images included in Figure 12. These images represent the central area of the coupon. The spatial and temporal evolution, as determined from the three control points over a 3 h period of the experiment, demonstrates significant differences (Figure 11). The top point, located closer to the free surface (2.10 cm), exhibits a more substantial increase in coverage rate over time than the centre and bottom points. The centre and bottom points are at greater distances from the free surface (6.10 and 10.30 cm, respectively) and exhibit slight differences. These differences in coverage percentages could result from the different distances of each point from the free surface, a characteristic parameter for each control point. This variation of this characteristic parameter is due to the placement of the substrate, as shown in Figure 1. Remarkably, the overall surface coverage was considerably lower in this case. For example, the highest surface coverage at the top area was around 5%, while for SS90, at the same spot, the coverage almost reached 10%. This behavior introduces another parameter that should be considered when designing such tests: the surface-over-volume ratio. For the SS45 test, the St/V ratio was significantly lower than for the other tests (Table 1), indicating that for the same surface, a much greater volume of nutrient medium is available. In other words, although the microbial count density remains the same, oxygen and nutrient availability become higher. Apparently, under these conditions, bacterial cells do not efficiently adhere to the surface; rather, the planktonic form or loose attachment is favorable.
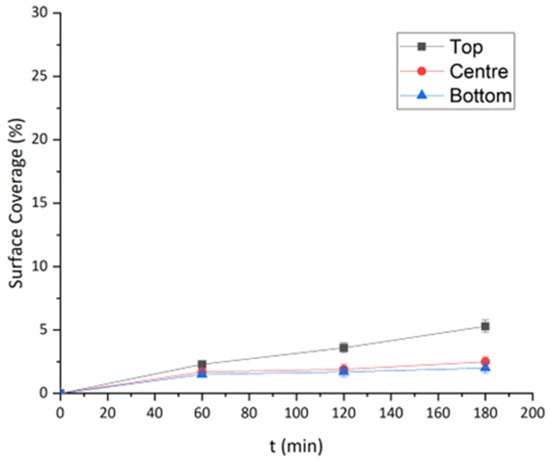
Figure 11.
Evolution of the percentage of surface coverage over time for SS at 45°.
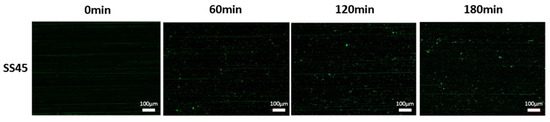
Figure 12.
Evolution of surface coverage over time for SS at 45°.
The distribution of the bacterial population size attached to the surface over time is presented in Figure 13. The results are presented separately for each control point, as differences were observed between the various points examined, which were attributed to surface placement (Figure 1). In addition, Table 3 presents the total number of bacterial cells and clusters of bacterial cells attached to SS45.

Figure 13.
Bacterial population size distributions for SS at 45°.
Table 3.
Total number of bacterial cells and clusters per mm2 on SS at 45°.
According to the analysis of the size distribution, it is evident that the number of clusters has increased gradually over time. The highest count of bacterial cell clusters was recorded at the top point, while the bottom point had the lowest value. Moreover, bacterial cells and cell clusters increased, with the most significant increase observed between the second and third hours.
Additionally, according to the total number of bacterial cells and clusters presented in Table 3, the top point demonstrated the most significant increase in bacterial cells and cell clusters across all 3 h experiments. Comparing the number of attached cells between 0°, 45°, and 90° from Table 1, Table 3 and Table 2, respectively, it is evident that St/V acts inversely to the number of attached cells, almost following linearity. As surface over volume reduces, or alternatively, as the volume-to-surface ratio increases, bacteria are hindered from reaching the wetted surface. In other words, full tanks or pipelines are less susceptible to biofilm formation.
All in all, although this study focused on the effect of gravitational force on the development of biofilms, the implications of other parameters were also investigated. The type of wetted surface takes precedence in the hierarchy of these factors, as in all cases, PC was at least twice as susceptible to biofilm formation as SS. The period of exposure to the nutrient medium, the inclination of the surface, and the distance of the wetted surface from the free surface (air–liquid interface) also played a significant role in biofilm formation for both examined surfaces. Univariate analysis for SS (Figures S3 and S4) showed that when the surface is perpendicular to the gravity component, biofilm formation is more intense compared to the other cases. The impact is much smaller for PC, where the physical/chemical affinity of microbes to its surface is probably a more significant factor. Indeed, in other studies [24], wetted surfaces with hydrophobic characteristics, such as PC and polyvinylidene fluoride, induced higher initial cell adhesion and biofilm development than wetted surfaces with hydrophilic behavior. Furthermore, the position of analysis (top, centre, and bottom), which is linked to the oxygen availability, was not a critical factor, as demonstrated by Fisher’s Least Significant Difference post hoc univariate analysis for PC (Table S1). “Top” and “Centre” positions did not present significant alterations in datasets, while the bottom was less prone to bacterial adhesion. Therefore, interactions between the independent variables of inclination and position of measurement are not considered strong (Figure S5), as is the case with SS.
It is worth noting that all experiments were conducted under static conditions, without the imposition of hydrodynamic flow. While this represents a limitation in revealing biofilm attachment in real water systems, where shear forces can influence bacterial adhesion, the use of static conditions allowed the isolation of the effects of gravity and material properties under controlled conditions. Incorporating flow dynamics was beyond the scope of this study. Nonetheless, the findings remain relevant, as many water systems—such as those in low-use pipelines, storage tanks, or space-based systems—undergo periods of stagnation during which gravitational and surface-dependent factors dominate microbial attachment.
4. Conclusions
The present study investigated the effect of surface type and inclination on biofilm formation using fluorescence microscopy. To this end, this study analyzed the resulting images to determine the percentage of surface coverage by biofilm and the size distribution of the bacterial population attached to each surface. This study found that the placement (inclination) of the surface plays a crucial role in biofilm formation, as different degrees of adhesion of the bacteria to the surfaces were observed at varying angles. This study revealed a higher degree of adhesion and enhancement of aggregate formation on a substrate with a slope of 0°, highlighting the role of gravity in cell settling. This study suggests that the placement of the surface influences the degree of adhesion and aggregation. When surfaces were placed at 90° and 180°, the degree of bacterial adhesion and aggregation was significantly affected, albeit to a lesser extent, for the PC polymer substrate than for the SS substrate.
Moreover, the type of substrate affects the degree of bacterial adhesion. Pseudomonas fluorescens strain displayed greater adhesion to PC polymer surfaces than SS ones. This observation indicates that the surface type plays a role in determining the degree of adhesion and biofilm formation.
The findings of this study hold significant implications for the design and management of engineered water systems prone to biofilm development. While horizontal surfaces are commonly associated with particle and cell accumulation due to gravitational settling, this study also highlights vertical and inverted surfaces, such as the walls and ceiling of a water tank, which can even reinforce significant microbial adhesion, particularly when surface properties promote cell attachment. Therefore, selecting materials with features that prevent microbial colonization is critical. Additionally, optimizing the orientation and configuration of system components may further mitigate biofilm initiation. These insights can inform material selection and system design strategies across various sectors, including industrial, environmental, and space-based applications.
Supplementary Materials
The following supporting information can be downloaded at: https://www.mdpi.com/article/10.3390/w17152277/s1, Figure S1. Images acquired using SYTO® 9 (upper rows) and their respective propidium iodide images (bottom rows) for the SS (A) and PC (B) surfaces at t = 2 h.; Figure S2. Binary mask image generated in ImageJ2 after thresholding. White regions represent bacterial cells or aggregates, while black regions represent uncovered surfaces. The software calculates the area covered (in μm2) based on the microscope scale, providing the % surface coverage (%Area) for quantitative analysis.; Figure S3. Profile plot of the interaction of time with inclination at different positions for SS.; Figure S4. Profile plot of the interaction of time with position at different inclinations.; Table S1: Multiple comparisons; and Figure S5. Profile plot of the interaction of time with inclinations at different positions.
Author Contributions
Conceptualization, M.P. and T.K.; methodology, M.P. and E.M.; software, E.M. and M.K.; validation, M.P. and E.M.; formal analysis, E.M.; investigation, M.P. and E.M.; resources, M.P. and T.K.; data curation, M.P. and E.M.; writing—original draft preparation, E.M.; writing—review and editing, M.P., M.K., and T.K.; visualization, E.M.; supervision, M.P.; project administration, T.K.; and funding acquisition, T.K. All authors have read and agreed to the published version of the manuscript.
Funding
This research received no external funding.
Data Availability Statement
Dataset available on request from the authors.
Conflicts of Interest
The authors declare no conflicts of interest.
References
- Flemming, H.-C.; Wingender, J. The Biofilm Matrix. Nat. Rev. Microbiol. 2010, 8, 623–633. [Google Scholar] [CrossRef]
- Seneviratne, C.; Jin, L.; Samaranayake, L. Biofilm Lifestyle of Candida: A Mini Review. Oral Dis. 2008, 14, 582–590. [Google Scholar] [CrossRef]
- de Beer, D.; Schramm, A. Micro-Environments and Mass Transfer Phenomena in Biofilms Studied with Microsensors. Water Sci. Technol. 1999, 39, 173–178. [Google Scholar] [CrossRef]
- Mishra, S.; Huang, Y.; Li, J.; Wu, X.; Zhou, Z.; Lei, Q.; Bhatt, P.; Chen, S. Biofilm-Mediated Bioremediation Is a Powerful Tool for the Removal of Environmental Pollutants. Chemosphere 2022, 294, 133609. [Google Scholar] [CrossRef]
- Flemming, H.-C.; Wuertz, S. Bacteria and Archaea on Earth and Their Abundance in Biofilms. Nat. Rev. Microbiol. 2019, 17, 247–260. [Google Scholar] [CrossRef] [PubMed]
- Douterelo, I.; Husband, S.; Loza, V.; Boxall, J. Dynamics of Biofilm Regrowth in Drinking Water Distribution Systems. Appl. Environ. Microbiol. 2016, 82, 4155–4168. [Google Scholar] [CrossRef] [PubMed]
- Waqas, U.; Farhan, A.; Haider, A.; Qumar, U.; Raza, A. Advancements in Biofilm Formation and Control in Potable Water Distribution Systems: A Comprehensive Review and Analysis of Chloramine Decay in Water Systems. J. Environ. Chem. Eng. 2023, 11, 111377. [Google Scholar] [CrossRef]
- Zea, L.; Nisar, Z.; Rubin, P.; Cortesão, M.; Luo, J.; McBride, S.A.; Moeller, R.; Klaus, D.; Müller, D.; Varanasi, K.K.; et al. Design of a Spaceflight Biofilm Experiment. Acta Astronaut. 2018, 148, 294–300. [Google Scholar] [CrossRef] [PubMed]
- Ahn, S.-J.; Burne, R.A. Effects of Oxygen on Biofilm Formation and the AtlA Autolysin of Streptococcus Mutans. J. Bacteriol. 2007, 189, 6293–6302. [Google Scholar] [CrossRef]
- Díaz, C.; Schilardi, P.; De Mele, M.F.L. Influence of Surface Sub-micropattern on the Adhesion of Pioneer Bacteria on Metals. Artif. Organs 2008, 32, 292–298. [Google Scholar] [CrossRef]
- Moreira, J.M.R.; Gomes, L.C.; Simões, M.; Melo, L.F.; Mergulhão, F.J. The Impact of Material Properties, Nutrient Load and Shear Stress on Biofouling in Food Industries. Food Bioprod. Process. 2015, 95, 228–236. [Google Scholar] [CrossRef]
- Pinto, M.; Langer, T.M.; Hüffer, T.; Hofmann, T.; Herndl, G.J. The Composition of Bacterial Communities Associated with Plastic Biofilms Differs between Different Polymers and Stages of Biofilm Succession. PLoS ONE 2019, 14, e0217165. [Google Scholar] [CrossRef]
- Bridier, A.; Briandet, R. Microbial Biofilms: Structural Plasticity and Emerging Properties. Microorganisms 2022, 10, 138. [Google Scholar] [CrossRef] [PubMed]
- Faria, S.I.; Teixeira-Santos, R.; Romeu, M.J.; Morais, J.; Vasconcelos, V.; Mergulhão, F.J. The Relative Importance of Shear Forces and Surface Hydrophobicity on Biofilm Formation by Coccoid Cyanobacteria. Polymers 2020, 12, 653. [Google Scholar] [CrossRef] [PubMed]
- Salgar-Chaparro, S.J.; Lepkova, K.; Pojtanabuntoeng, T.; Darwin, A.; Machuca, L.L. Nutrient Level Determines Biofilm Characteristics and Subsequent Impact on Microbial Corrosion and Biocide Effectiveness. Appl. Environ. Microbiol. 2020, 86, e02885-19. [Google Scholar] [CrossRef] [PubMed]
- Anggraini, W.; Purwanto, D.A.; Kusumawati, I.; Isnaeni, I.; Suryanto, S. Influence of the Environment on Biofilm Formation Candida Albicans of Vulvovaginal Candidiasis Isolate Patient. Pharmacogn. J. 2023, 15, 216–222. [Google Scholar] [CrossRef]
- Marra, D.; Recupido, F.; Toscano, G.; Caserta, S. Bacterial Motility in Biofilm Under Shear Flow. Chem. Eng. Trans. 2022, 93, 325–330. [Google Scholar] [CrossRef]
- Yang, Y. Effect of Gravitational Deposition on Biofilm Formation and Development. In Biofilms; Cambridge University Press: Cambridge, UK, 2008; pp. 1–9. [Google Scholar] [CrossRef]
- Diaz, A.M.; Li, W.; Irwin, T.D.; Calle, L.M.; Callahan, M.R. Investigation of Biofilm Formation and Control for Spacecraft—An Early Literature Review. In Proceedings of the 49th International Conference on Environmental Systems, Boston, MA, USA, 7–11 July 2019. [Google Scholar]
- Jha, P.K.; Dallagi, H.; Richard, E.; Deleplace, M.; Benezech, T.; Faille, C. Does the Vertical vs Horizontal Positioning of Surfaces Affect Either Biofilm Formation on Different Materials or Their Resistance to Detachment. Food Control 2022, 133, 108646. [Google Scholar] [CrossRef]
- Hogan, K.; Paul, S.; Lin, G.; Fuerte-Stone, J.; Sokurenko, E.V.; Thomas, W.E. Effect of Gravity on Bacterial Adhesion to Heterogeneous Surfaces. Pathogens 2023, 12, 941. [Google Scholar] [CrossRef]
- Chang, Y.-W.; Fragkopoulos, A.A.; Marquez, S.M.; Kim, H.D.; Angelini, T.E.; Fernández-Nieves, A. Biofilm Formation in Geometries with Different Surface Curvature and Oxygen Availability. New J. Phys. 2015, 17, 033017. [Google Scholar] [CrossRef]
- Crawford, R.J.; Webb, H.K.; Truong, V.K.; Hasan, J.; Ivanova, E.P. Surface Topographical Factors Influencing Bacterial Attachment. Adv. Colloid Interface Sci. 2012, 179–182, 142–149. [Google Scholar] [CrossRef]
- Zheng, S.; Bawazir, M.; Dhall, A.; Kim, H.-E.; He, L.; Heo, J.; Hwang, G. Implication of Surface Properties, Bacterial Motility, and Hydrodynamic Conditions on Bacterial Surface Sensing and Their Initial Adhesion. Front. Bioeng. Biotechnol. 2021, 9, 643722. [Google Scholar] [CrossRef]
- Khelissa, S.O.; Abdallah, M.; Jama, C.; Barras, A.; Chihib, N.-E. Comparative Study on the Impact of Growth Conditions on the Physiology and the Virulence of Pseudomonas Aeruginosa Biofilm and Planktonic Cells. J. Food Prot. 2019, 82, 1357–1363. [Google Scholar] [CrossRef]
- Bharathy, L.S.; Monisha, B.A.; Sathiyamurthy, K. Antibiotic Resistant Pattern of K. Pneumoniae and Their Biofilm Development on Diverse Surfaces. J. Pure Appl. Microbiol. 2022, 16, 1990–1997. [Google Scholar] [CrossRef]
- Jo, S.-H.; Baek, S.-B.; Ha, J.-H.; Ha, S.-D. Maturation and Survival of Cronobacter Biofilms on Silicone, Polycarbonate, and Stainless Steel after UV Light and Ethanol Immersion Treatments. J. Food Prot. 2010, 73, 952–956. [Google Scholar] [CrossRef]
- Kilic, T.; Coleri Cihan, A. Biofilm Formation of the Facultative Thermophile Bacillus Pumilus D194A and Affects of Sanitation Agents on Its Biofilms. Microbiology 2020, 89, 64–73. [Google Scholar] [CrossRef]
- Kampouraki, Z.C.; Petala, M.; Boumpakis, A.; Skordaris, G.; Michailidis, N.; Deliyanni, E.; Kostoglou, M.; Karapantsios, T.D. Wetting and Imbibition Characteristics of Pseudomonas Fluorescens Biofilms Grown on Stainless Steel. Langmuir 2022, 38, 9810–9821. [Google Scholar] [CrossRef] [PubMed]
- Angarano, V.; Smet, C.; Akkermans, S.; Akritidou, T.; Huyck, B.; Chieffi, A.; Impe, J.F.M.V. A Reproducible Method for Growing Biofilms on Polystyrene Surfaces: Biomass and Bacterial Viability Evolution of Pseudomonas Fluorescens and Staphylococcus Epidermidis. Appl. Sci. 2020, 10, 4544. [Google Scholar] [CrossRef]
- Fazli, M.; Almblad, H.; Rybtke, M.L.; Givskov, M.; Eberl, L.; Tolker-Nielsen, T. Regulation of Biofilm Formation in PSeudomonas and BUrkholderia Species. Environ. Microbiol. 2014, 16, 1961–1981. [Google Scholar] [CrossRef] [PubMed]
- ECSS-Q-ST-70-01C Rev.1 DIR1; Cleanliness and Contamination Control. European Cooperation for Space Standardization (ECSS): Noordwijk, The Netherlands, 2024.
- Petala, M.; Tsiridis, V.; Darakas, E.; Kostoglou, M. Longevity Aspects of Potable Water Disinfected by Ionic Silver: Kinetic Experiments and Modeling. Water 2020, 12, 258. [Google Scholar] [CrossRef]
- Petala, M.; Tsiridis, V.; Darakas, E.; Mintsouli, I.; Sotiropoulos, S.; Kostoglou, M.; Karapantsios, T.; Rebeyre, P. Silver Deposition on Wetted Materials Used in the Potable Water Systems of the International Space Station. In Proceedings of the 46th International Conference on Environmental Systems, Vienna, Austria, 10–14 July 2016. [Google Scholar]
- Martínez-García, P.M.; Ruano-Rosa, D.; Schilirò, E.; Prieto, P.; Ramos, C.; Rodríguez-Palenzuela, P.; Mercado-Blanco, J. Complete Genome Sequence of Pseudomonas Fluorescens Strain PICF7, an Indigenous Root Endophyte from Olive (Olea Europaea L.) and Effective Biocontrol Agent against Verticillium Dahliae. Stand. Genomic Sci. 2015, 10, 10. [Google Scholar] [CrossRef] [PubMed]
- Sauer, K.; Stoodley, P.; Goeres, D.M.; Hall-Stoodley, L.; Burmølle, M.; Stewart, P.S.; Bjarnsholt, T. The Biofilm Life Cycle: Expanding the Conceptual Model of Biofilm Formation. Nat. Rev. Microbiol. 2022, 20, 608–620. [Google Scholar] [CrossRef] [PubMed]
- Kearns, D.B. A Field Guide to Bacterial Swarming Motility. Nat. Rev. Microbiol. 2010, 8, 634–644. [Google Scholar] [CrossRef]
- Kampouraki, Z.C.; Petala, M.; Zacharias, K.; Konstantinidis, A.; Zabulis, X.; Karamaounas, P.; Kostoglou, M.; Karapantsios, T.D. Highly Sensitive Resistance Spectroscopy Technique for Online Monitoring of Biofilm Growth on Metallic Surfaces. Environ. Res. 2024, 240, 117401. [Google Scholar] [CrossRef] [PubMed]
- Trigwell, S.; Selvaduray, G. Effect of Surface Treatment on the Surface Characteristics of AISI 316L Stainless Steel; Kennedy Space Center. 2025. Available online: https://ntrs.nasa.gov/citations/20120003602 (accessed on 20 March 2025).
- Saarikoski, I.; Suvanto, M.; Pakkanen, T.A. Modification of Polycarbonate Surface Properties by Nano-, Micro-, and Hierarchical Micro–Nanostructuring. Appl. Surf. Sci. 2009, 255, 9000–9005. [Google Scholar] [CrossRef]
Disclaimer/Publisher’s Note: The statements, opinions and data contained in all publications are solely those of the individual author(s) and contributor(s) and not of MDPI and/or the editor(s). MDPI and/or the editor(s) disclaim responsibility for any injury to people or property resulting from any ideas, methods, instructions or products referred to in the content. |
© 2025 by the authors. Licensee MDPI, Basel, Switzerland. This article is an open access article distributed under the terms and conditions of the Creative Commons Attribution (CC BY) license (https://creativecommons.org/licenses/by/4.0/).