1. Introduction
Water scarcity in Saudi Arabia is further exacerbated by the absence of permanent rivers or lakes [
1], forcing the country to rely heavily on non-renewable groundwater resources and energy-intensive desalination [
2]. According to Chowdhury and Al-Zahrani [
3], Saudi Arabia’s annual water demand has been increasing at an alarming rate, with agriculture consuming approximately 85% of the total water usage. This situation necessitates the development and implementation of efficient water management strategies, particularly in the agricultural sector, to ensure long-term water security and sustainability [
4]. In arid and semi-arid regions where water scarcity is a persistent challenge [
5], accurate estimation of reference evapotranspiration (ET) becomes essential for sustainable water management and agricultural planning [
6]. ET represents the combined process of water loss from the Earth’s surface through evaporation from soil and water bodies and transpiration from vegetation [
7]. As a critical component of the hydrological cycle, evapotranspiration significantly influences water resource availability [
8], agricultural water productivity [
9], and ecosystem sustainability [
10].
By definition, reference ET is the ET rate from a hypothetical reference plant with specific characteristics under given climatic conditions and serves as a standard measure for estimating plant water requirements and designing irrigation systems [
11]. Aly, Darwish [
12] stated that reference ET is a complex system, influenced by non-linear factors such as temperature (T), solar radiation (RS), relative humidity (RH), and wind speed (U
2) [
13]. The concept of reference ET and methods for its estimation have evolved significantly over the past century [
14]. Several conventional methods have been developed and applied for estimating reference ET [
15], each with its strengths and limitations [
16]. These methods can be broadly categorized into temperature-based, radiation-based, and combination approaches [
17]. Temperature-based methods, such as the Hargreaves–Samani equation [
18], rely primarily on air temperature data and have gained popularity due to their simplicity and minimal data requirements. According to Raziei and Pereira [
19], these methods perform reasonably well in arid and semi-arid regions where temperature is a dominant factor influencing ET. However, their accuracy may be compromised in humid regions or areas with significant advection effects [
20]. Radiation-based methods, including the Priestley–Taylor equation [
21], incorporate solar radiation data along with temperature to estimate reference ET [
20]. These methods are based on the principle that energy availability is a primary driver of ET processes [
22,
23]. As highlighted by Vishwakarma, Pandey [
24] radiation-based methods often provide more accurate estimates than temperature-based approaches, particularly in regions with high RS levels such as Saudi Arabia.
Combination methods, exemplified by the P–M ASCE [
25], P–M FAO [
26], and P–M KSA [
27] models, integrate both energy balance and mass transfer principles to provide comprehensive reference ET estimates [
16]. These methods account for various meteorological parameters and have demonstrated superior performance across diverse climatic conditions [
7]. However, as noted by Kisi, Sanikhani [
28], the extensive data requirements of these methods present significant challenges in data-scarce regions. According to Subedi and Chávez [
16], the P–M FAO considered very accurate for calculating grass reference ET on a daily basis but may not be applicable for applying to hourly timestep. Moreover, the P–M ASCE can calculate both grass and alfalfa plant reference ET on both hourly and daily timesteps, but the plant coefficient (K
plt) needs to be developed also for alfalfa reference surfaces to avoid errors in estimating reference ET due to using fixed canopy surface resistance (r
c) for the entire day.
Zhang, Chen [
29] examined five different ways to scale up hourly latent heat data to get a daily estimate of reference ET under different energy and crop-growing conditions. The study indicated that the evaporative fraction (EF) and crop coefficient (Kc) approaches usually worked better and were more consistent, especially between 11:00 and 15:00, when the average R
2 was 0.96. Using machine learning and deep learning models like CNN, ANN, RF, and XGBoost, Ferreira and da Cunha [
30] looked at how to use limited hourly meteorological data, specifically temperature and relative humidity, to estimate daily reference ET. Results show that convolutional neural networks (CNNs) trained with 24 h hourly data and hourly extraterrestrial radiation did much better than traditional models that used daily data. In regional scenarios, RMSE was reduced by up to 28.2%, and NSE and R
2 were increased by up to 21.7% and 11.4%, respectively. Using long-term weather data, Djaman, Irmak [
31] compared five methods for estimating reference ET—FAO-56 Penman–Monteith, Hargreaves–Samani, Blaney–Criddle, Priestley–Taylor, and radiation-based models—at three dry sites in Saudi Arabia. The results show that the FAO-56 technique is still the best, but simpler empirical models like Hargreaves–Samani can give good estimates when there is not a lot of data available. Calibrating them for a specific site makes them work better. Ji, Chen [
32] studied how well eleven reference ET equations worked by comparing them to the FAO-56 Penman–Monteith standard in Riyadh’s hot, dry climate. The results show that many empirical models were very different from FAO-56 values. However, the Hargreaves–Samani and Makkink equations did fairly well, suggesting that they could be good for estimating reference ET in dry areas with little data.
Despite the widespread use of the Penman–Monteith (P–M) model for estimating reference ET, significant inconsistencies arise when applying its different formulations—namely, those prescribed by ASCE, FAO, and country-specific modifications such as the P–M KSA model. While previous research has evaluated these models under temperate or semi-arid environments, comparative studies under hyper-arid conditions, such as those prevailing in Saudi Arabia, remain scarce. Additionally, little attention has been given to the influence of plant height (hplt) on reference ET calculations, especially when derived from high-frequency (hourly) meteorological inputs. Most existing validations of P–M formulations rely on daily or coarser temporal scales, which may overlook the intra-day variability crucial for precise water budgeting in extreme climates.
The present study introduces several contributions to the field of reference ET modeling. Firstly, it provides a comparative evaluation of P–M ASCE, P–M FAO, and P–M KSA formulations using hourly timestep meteorological data under hyper-arid conditions, capturing short-term atmospheric fluctuations often missed in daily-scale studies. Secondly, it includes a systematic assessment of model sensitivity to hplt, a parameter often fixed in conventional studies, enabling more realistic simulations across diverse agricultural applications. Thirdly, it analyzes the accuracy of daily reference ET derived from hourly reference ET, offering insight into cumulative error propagation and temporal aggregation effects across the three models. Collectively, these contributions address a critical knowledge gap by extending the validation of reference ET models into hyper-arid climates using a high-resolution temporal framework and contextualized agronomic parameters, ultimately supporting improved irrigation scheduling and water resource planning in regions such as the Riyadh region of Saudi Arabia.
3. Results and Discussion
3.1. Climatic Parameters
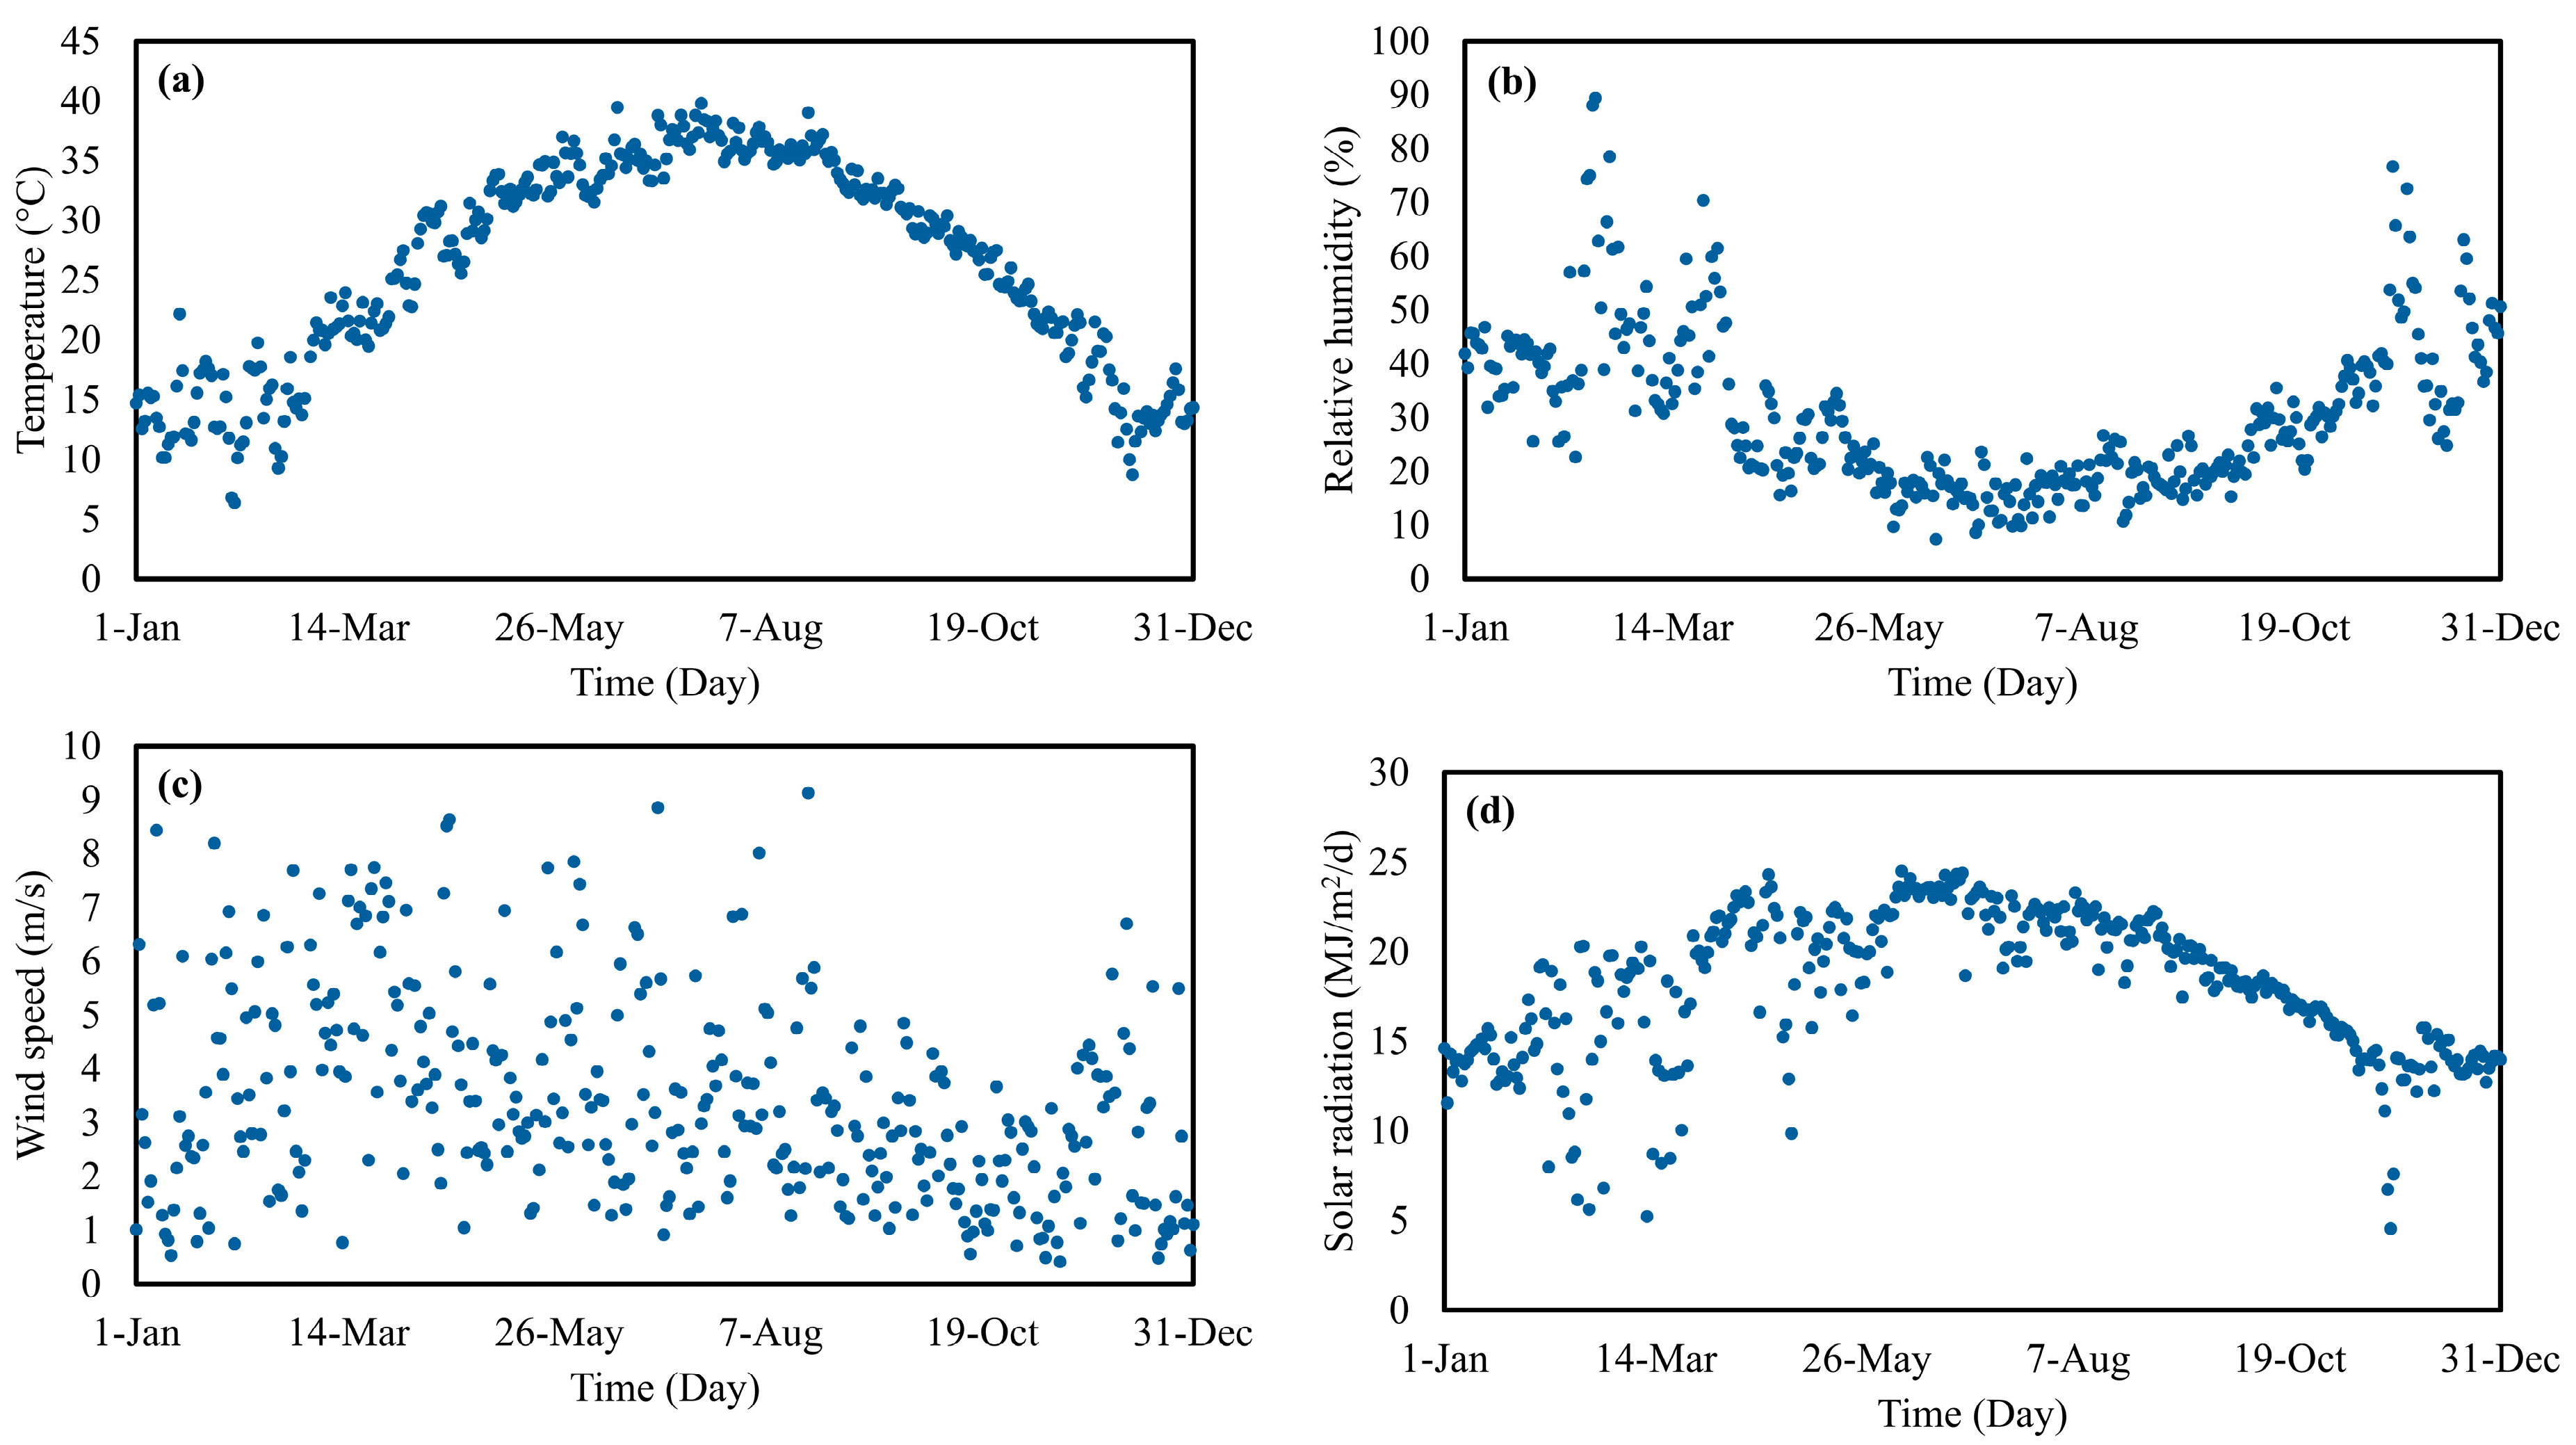
The annual climatology of the Riyadh province, when viewed through the four principal drivers of reference evapotranspiration (ET) (
Figure 2), reveals a picture both instructive and exacting for any Penman–Monteith implementation in hyper-arid regions. Firstly, air temperature in Riyadh exhibits one of the steepest seasonal amplitudes on record: daily means rise from approximately 12 °C in mid-winter to peaks approaching 40 °C in mid-summer. Such extremes inexorably elevate saturation vapor pressure deficit (SVPD), imposing the highest ET demand precisely when water availability is most precious. Secondly, relative humidity, which oscillates between modest winter maxima of 50–60% and precipitous summer minima below 15%, increases the plant’s need for water. The convergence of high temperature and low humidity, therefore, underpins the very apex of the highest ETₒ values during June, July, and August.
Thirdly, wind speed, though only moderate (2–5 m/s), plays a non-negligible role in sustaining the turbulent transfer of moisture from the canopy layer into the free atmosphere. The spring months, marked by slightly more variable and gusty breezes, engender transient surges in ET that would be entirely overlooked by coarse daily averaging. Finally, incoming solar radiation, which attains daily totals of more than 25 MJ /m2 in the clear-sky summer months, supplies the latent heat necessary for phase change. Its annual profile closely parallels that of temperature, reinforcing the correlation between radiative forcing and ET output. Taken together, these four drivers produce an ET regime that is both temporally punctuated and climatically extreme. The hourly timestep approach thus emerges as indispensable: only by resolving diurnal peaks and troughs can one accurately capture the true evapotranspiration load—and, by extension, the water requirements—of any reference surface in this setting.
3.2. Hourly Reference ET Investigation
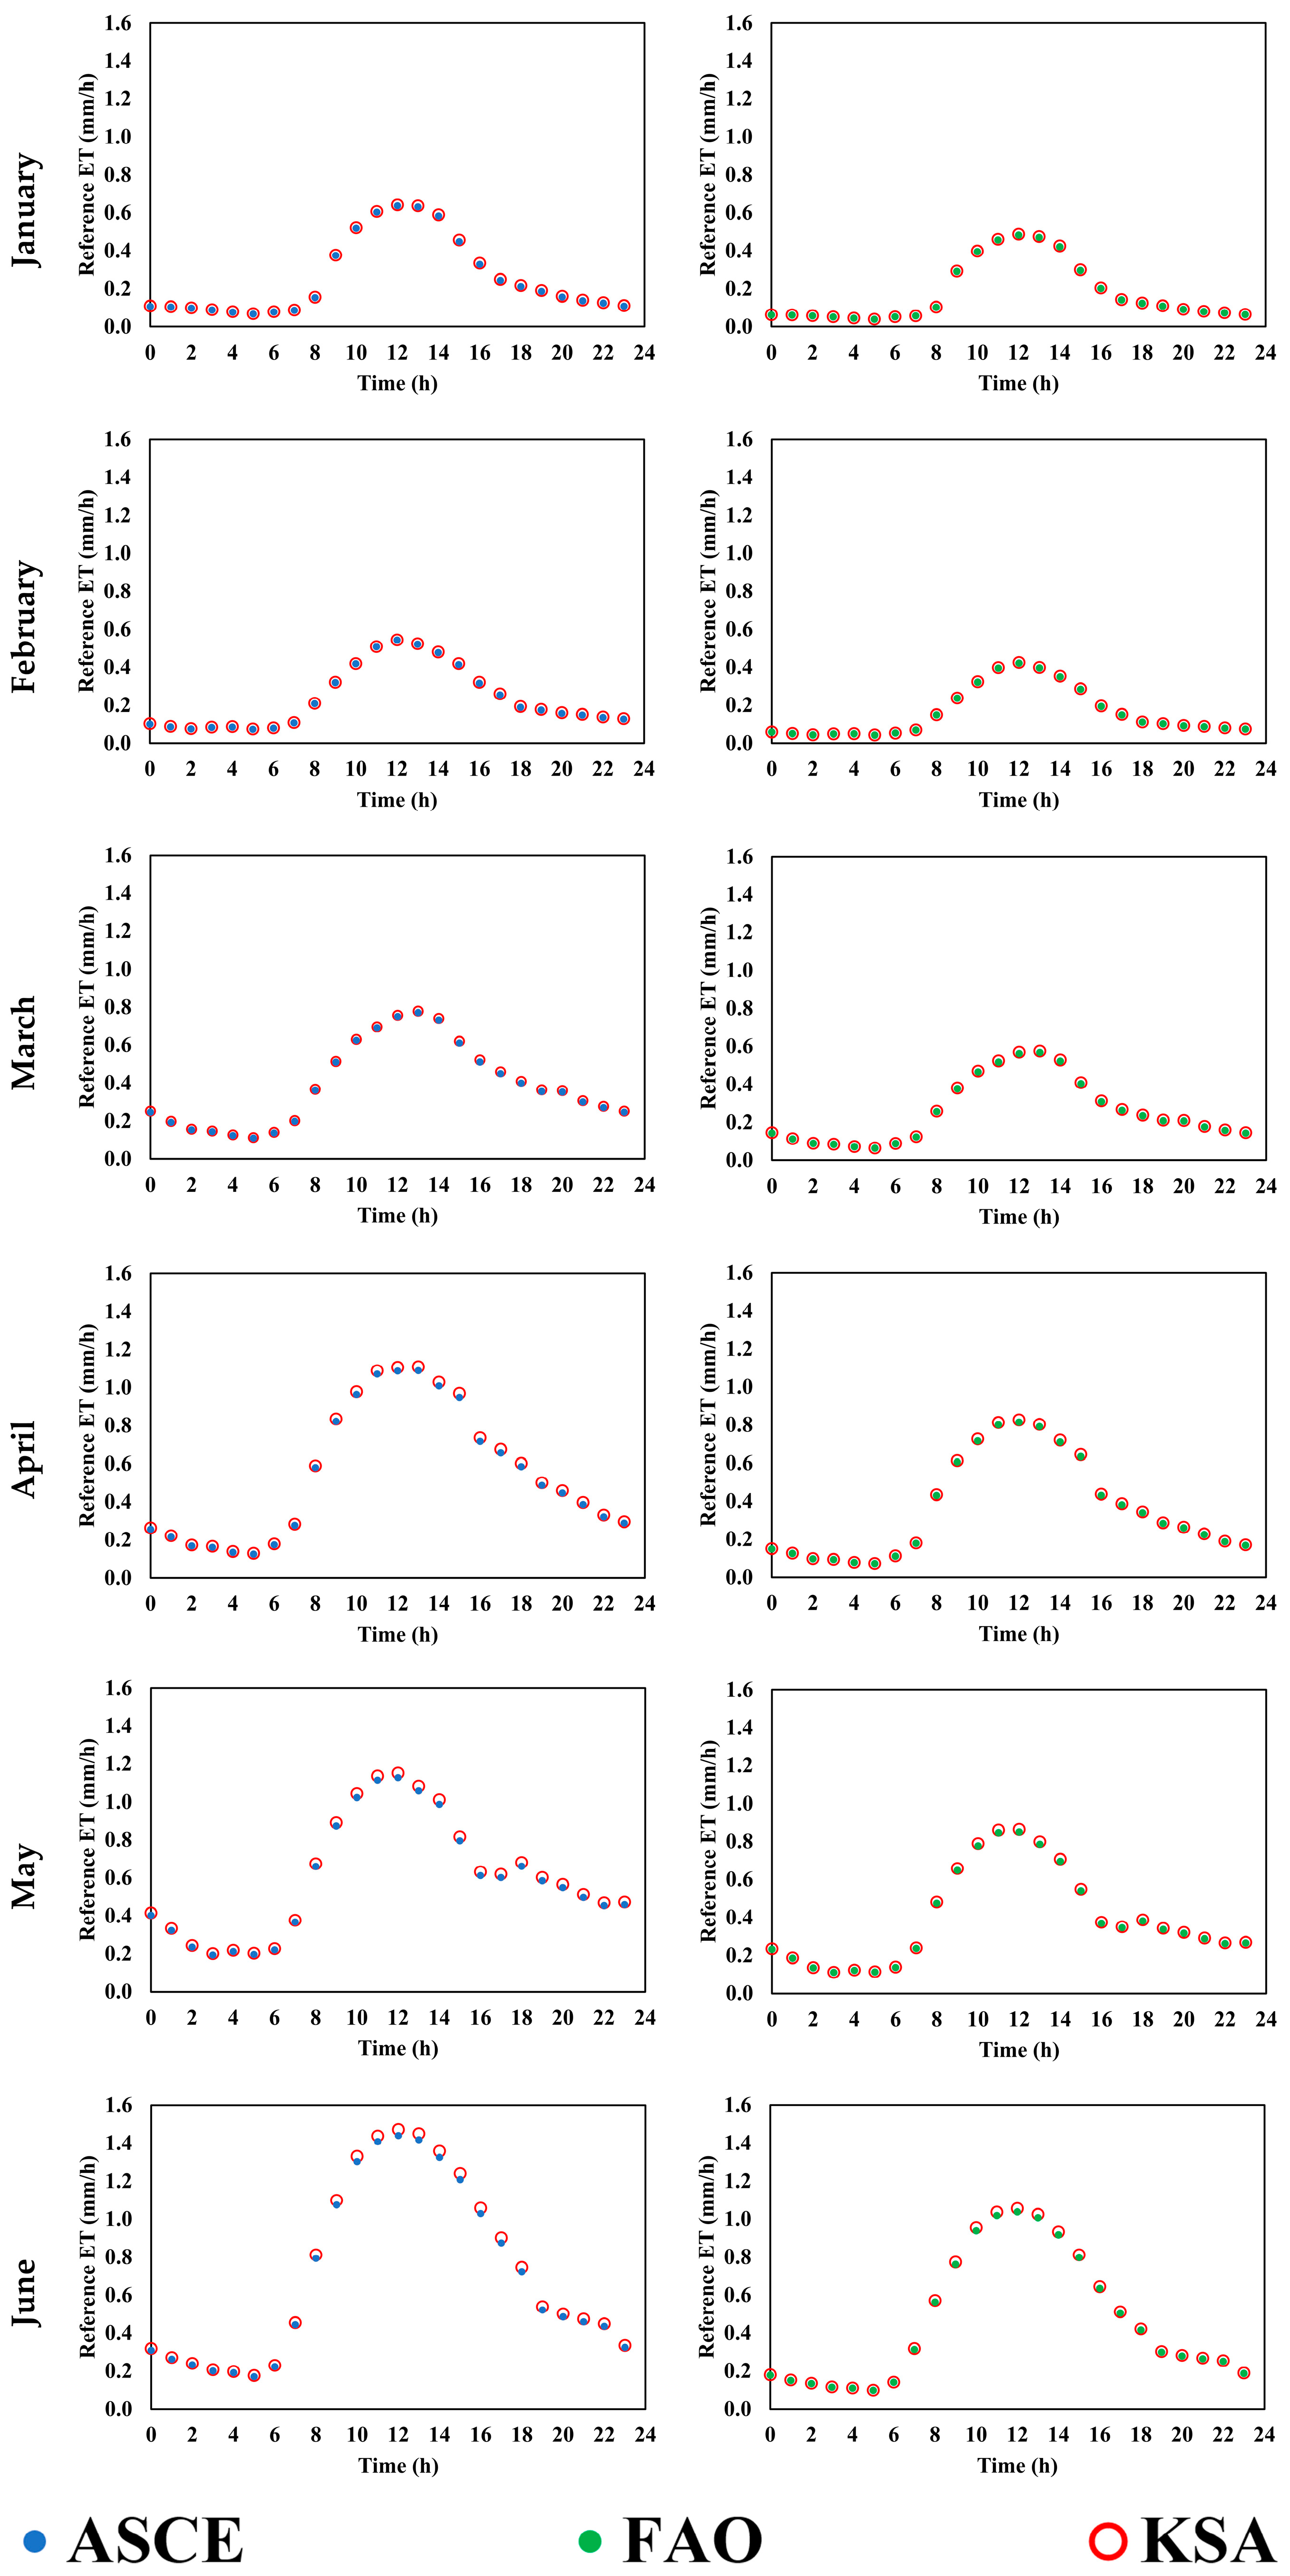
Figure 3 presents a comprehensive analysis of hourly reference evapotranspiration (ET) comparisons based on average monthly data. The findings juxtapose ET estimates derived from three widely adopted methodologies: the ASCE-standardized Penman–Monteith (P–M ASCE), the FAO Penman–Monteith (P–M FAO), and the regionally calibrated Penman–Monteith KSA formulation. The comparison is stratified by two plant height conditions—50 cm and 12 cm—to reflect different aerodynamic and surface resistance regimes. The first set of comparisons examines ASCE versus KSA reference ET estimates at a plant height of 50 cm, while the second set contrasts FAO against KSA values at 12 cm.
These plant heights were chosen to reflect typical reference vegetation for tall and short plant surfaces, respectively, and the analysis provides insight into both methodological and biophysical influences on evapotranspiration dynamics. The temporal distribution of reference ET across the diurnal cycle reveals clear and systematic trends. For the 50 cm canopy height, the KSA method consistently produces slightly higher hourly reference ET values than the ASCE formulation, particularly during midday hours, when solar radiation and temperature reach their maxima. The observed divergence is most prominent during the summer months (April to August), a period marked by elevated temperatures, intense solar radiation, and low humidity—conditions that amplify the aerodynamic and radiative components of the P–M equation. Conversely, the FAO estimates at 12 cm yield reference ET values that are marginally lower than their KSA counterparts, although the magnitude of divergence is somewhat smaller than in the ASCE comparison. This difference reflects the enhanced aerodynamic resistance associated with shorter vegetation, which modulates the transfer of water vapor from the canopy surface to the atmosphere.
Quantitative metrics derived from the twelve-month hourly data substantiate these observations. The bias between ASCE and KSA (h = 50 cm) remains negative across all months, typically between –0.003 and –0.007 mm h−1, indicating that the KSA model slightly overestimates reference ET relative to ASCE under identical input conditions. The corresponding RMSE values range from 0.003 to 0.007 mm h−1, with maximum error occurring during the summer peak, further reinforcing the sensitivity of model divergence to climatic extremity. For the FAO and KSA comparison at 12 cm, the mean monthly bias is even smaller (–0.002 mm h−1), and RMSE rarely exceeds 0.003 mm h−1. These values represent a small fraction—typically under 5%—of the absolute hourly reference ET magnitude, indicating a high degree of concordance across models. However, it is worth emphasizing that while these absolute differences may appear numerically minor, their diurnal concentration during periods of peak evaporative demand can lead to non-trivial cumulative errors in daily and seasonal water budgeting. In practical terms, for irrigation scheduling and plant water requirement assessments, even small hourly inaccuracies can propagate into meaningful discrepancies when extrapolated over time. The seasonal modulation of model agreement is also notable. During cooler months (November to February), the three formulations converge closely, with minimal model-to-model deviation. This convergence is expected given the reduced vapor pressure deficits, lower aerodynamic activity, and more stable radiative regimes. In contrast, from late spring through early autumn, the intensification of atmospheric demand reveals the distinct assumptions embedded in each model, most notably in the KSA formulation, which has been explicitly tuned to account for the arid conditions of Saudi Arabia.
From a methodological standpoint, this study provides compelling empirical validation of the KSA variant of the Penman–Monteith model under high-resolution (hourly) meteorological forcing. That the KSA method maintains strong concordance with both ASCE and FAO standards across all months—and especially under severe arid stress—speaks to its robustness and adaptability for regional application.
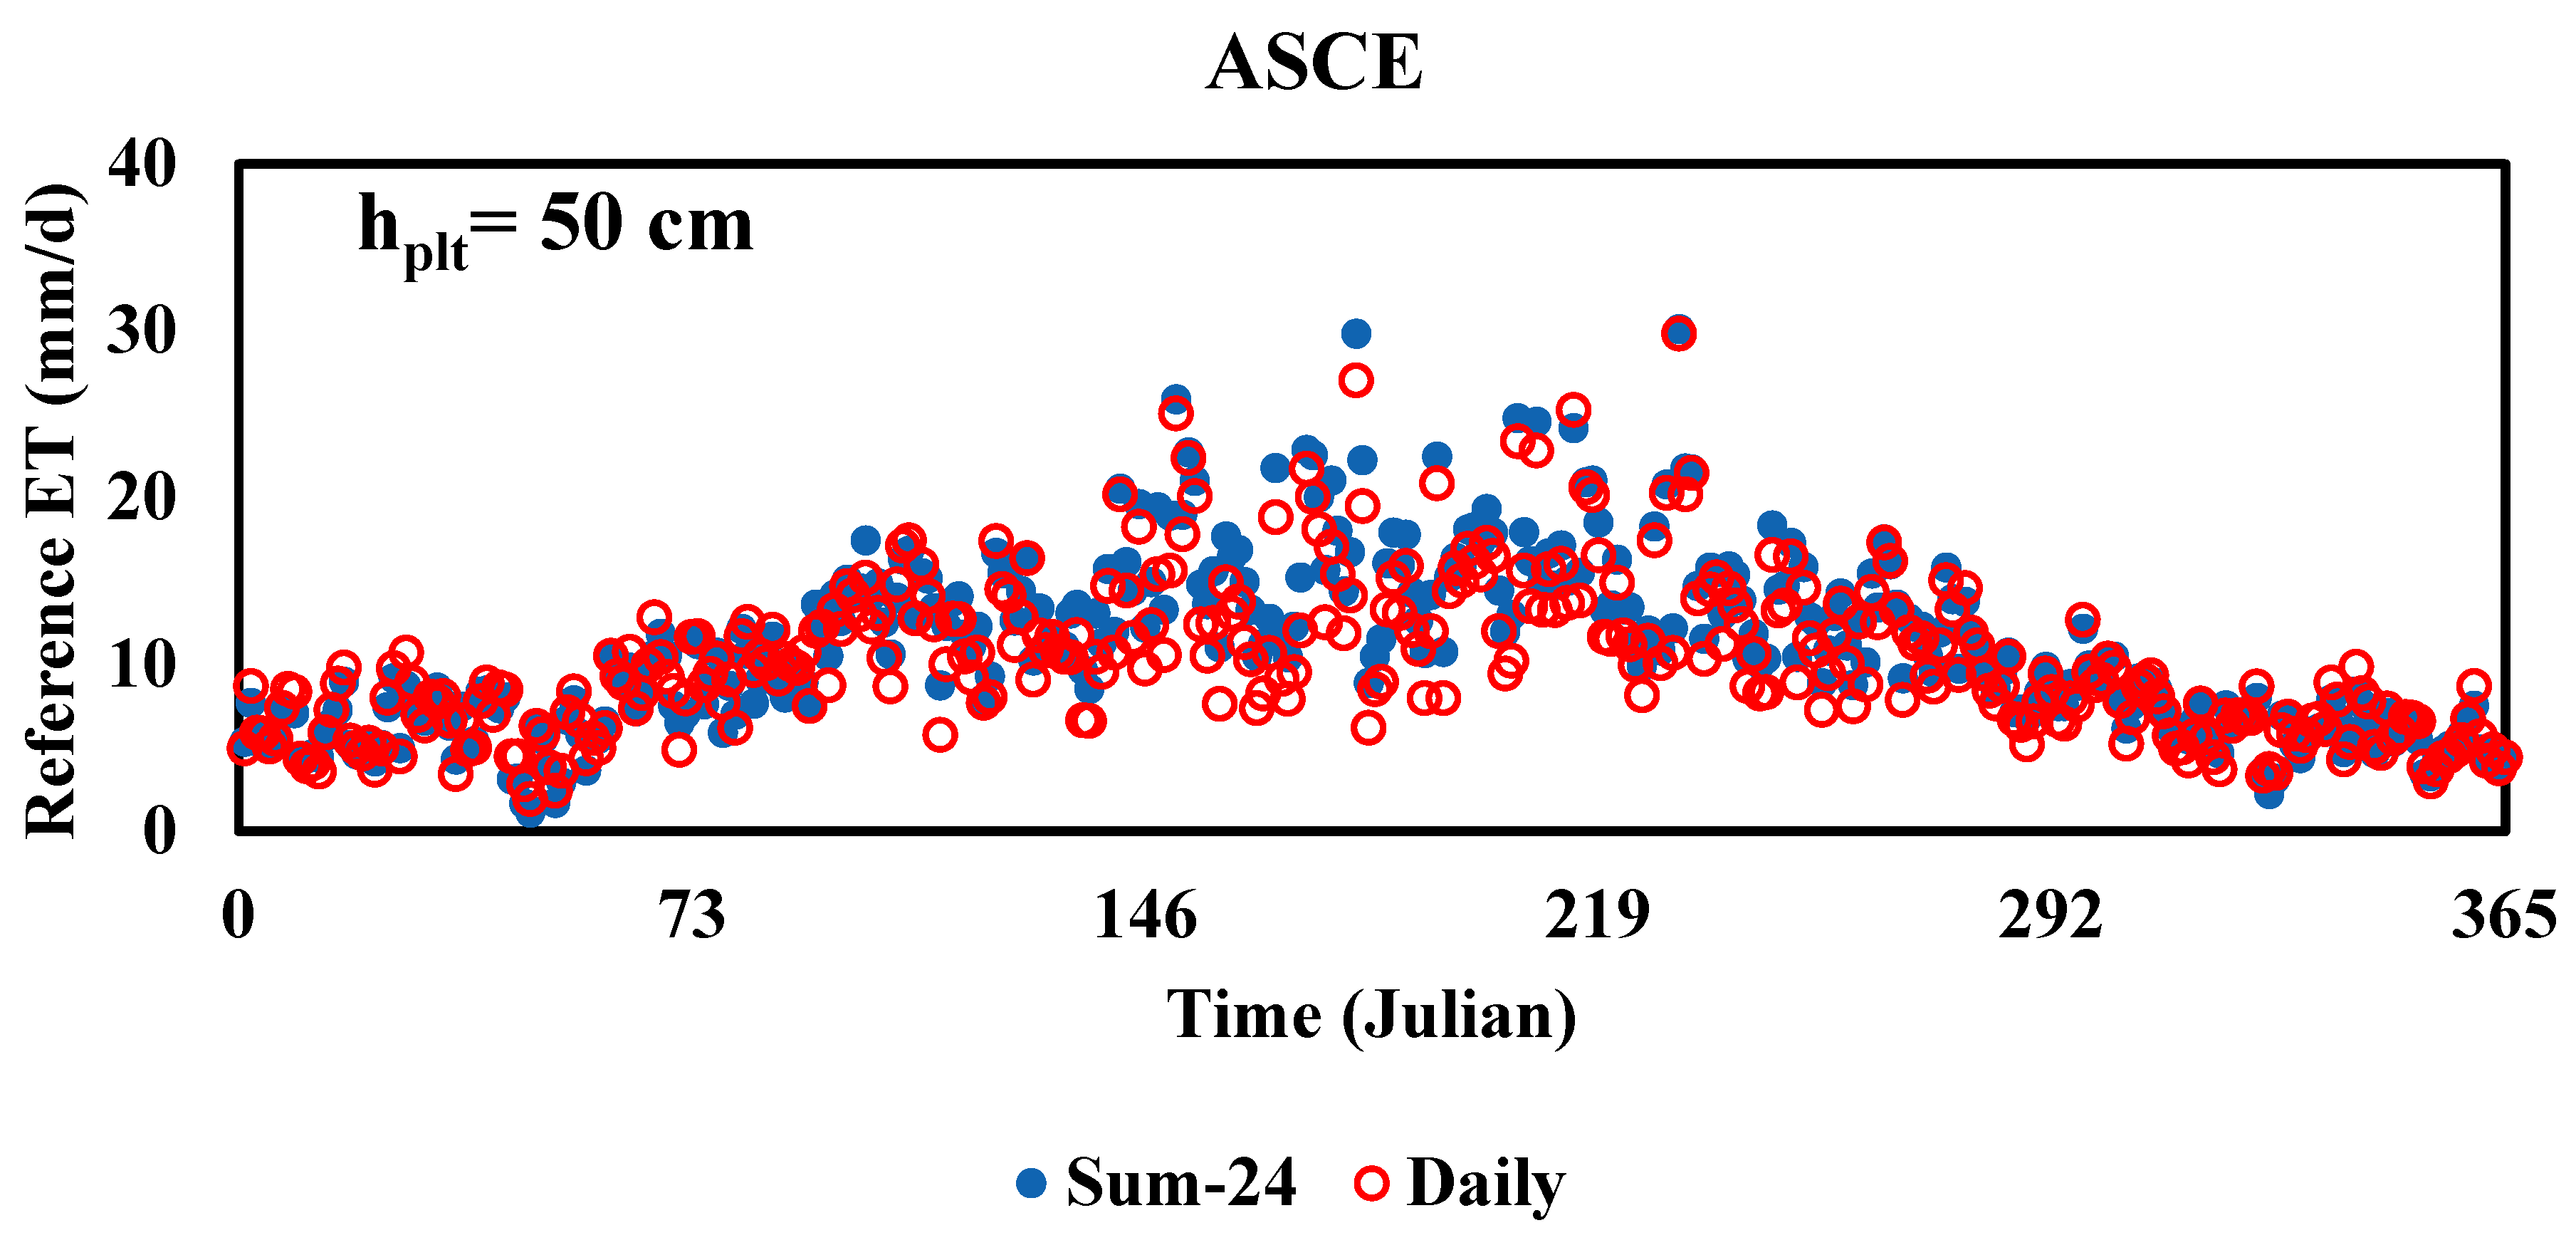
3.2.1. Hourly ETr of ASCE Model (hplt = 50 cm)
The comparative analysis of average hourly reference evapotranspiration (ET) versus daily reference ET divided by 24 h reveals model-specific biases and distributional characteristics across four standardized methodologies: ASCE, KSA at hplt = 50 cm, FAO, and KSA at hplt = 12 cm.
Figure 4 demonstrates a strong linear correlation (R
2 > 90%) between average hourly and daily/24 ET
r. However, systematic deviations occur during high-evaporative periods (June, July, and August), where daily/24 values underestimate observed hourly ET
r by 4–12%.
Table 4 confirms non-normal distributions for both hourly and daily/24 ET
r, with all normality tests rejecting the null hypothesis. This non-normality invalidates parametric statistical assumptions. Hence, the Wilcoxon test was applied.
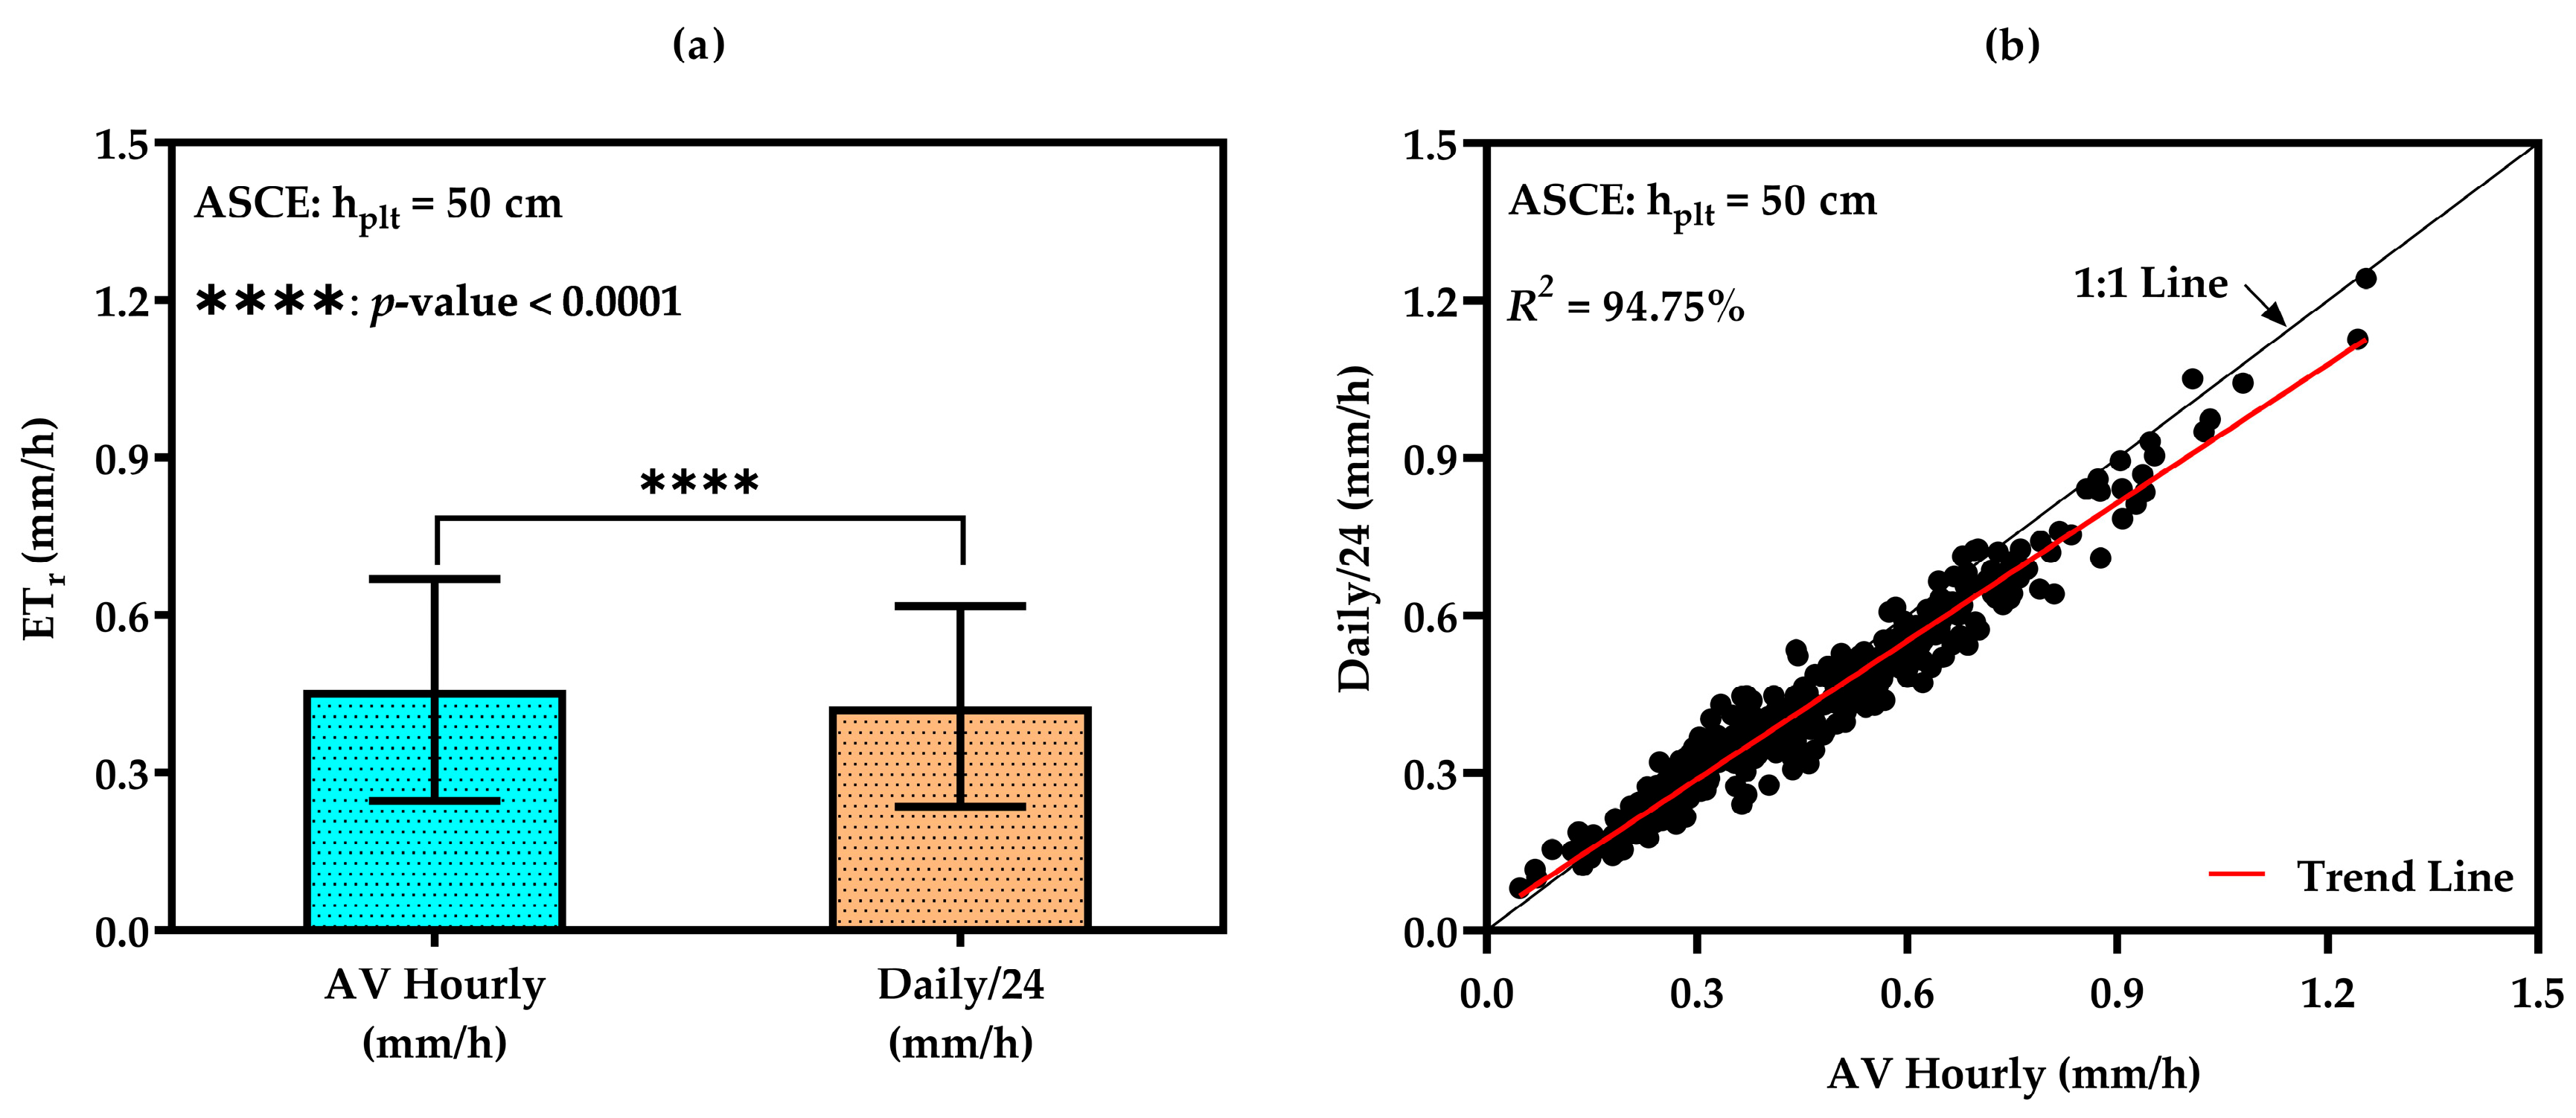
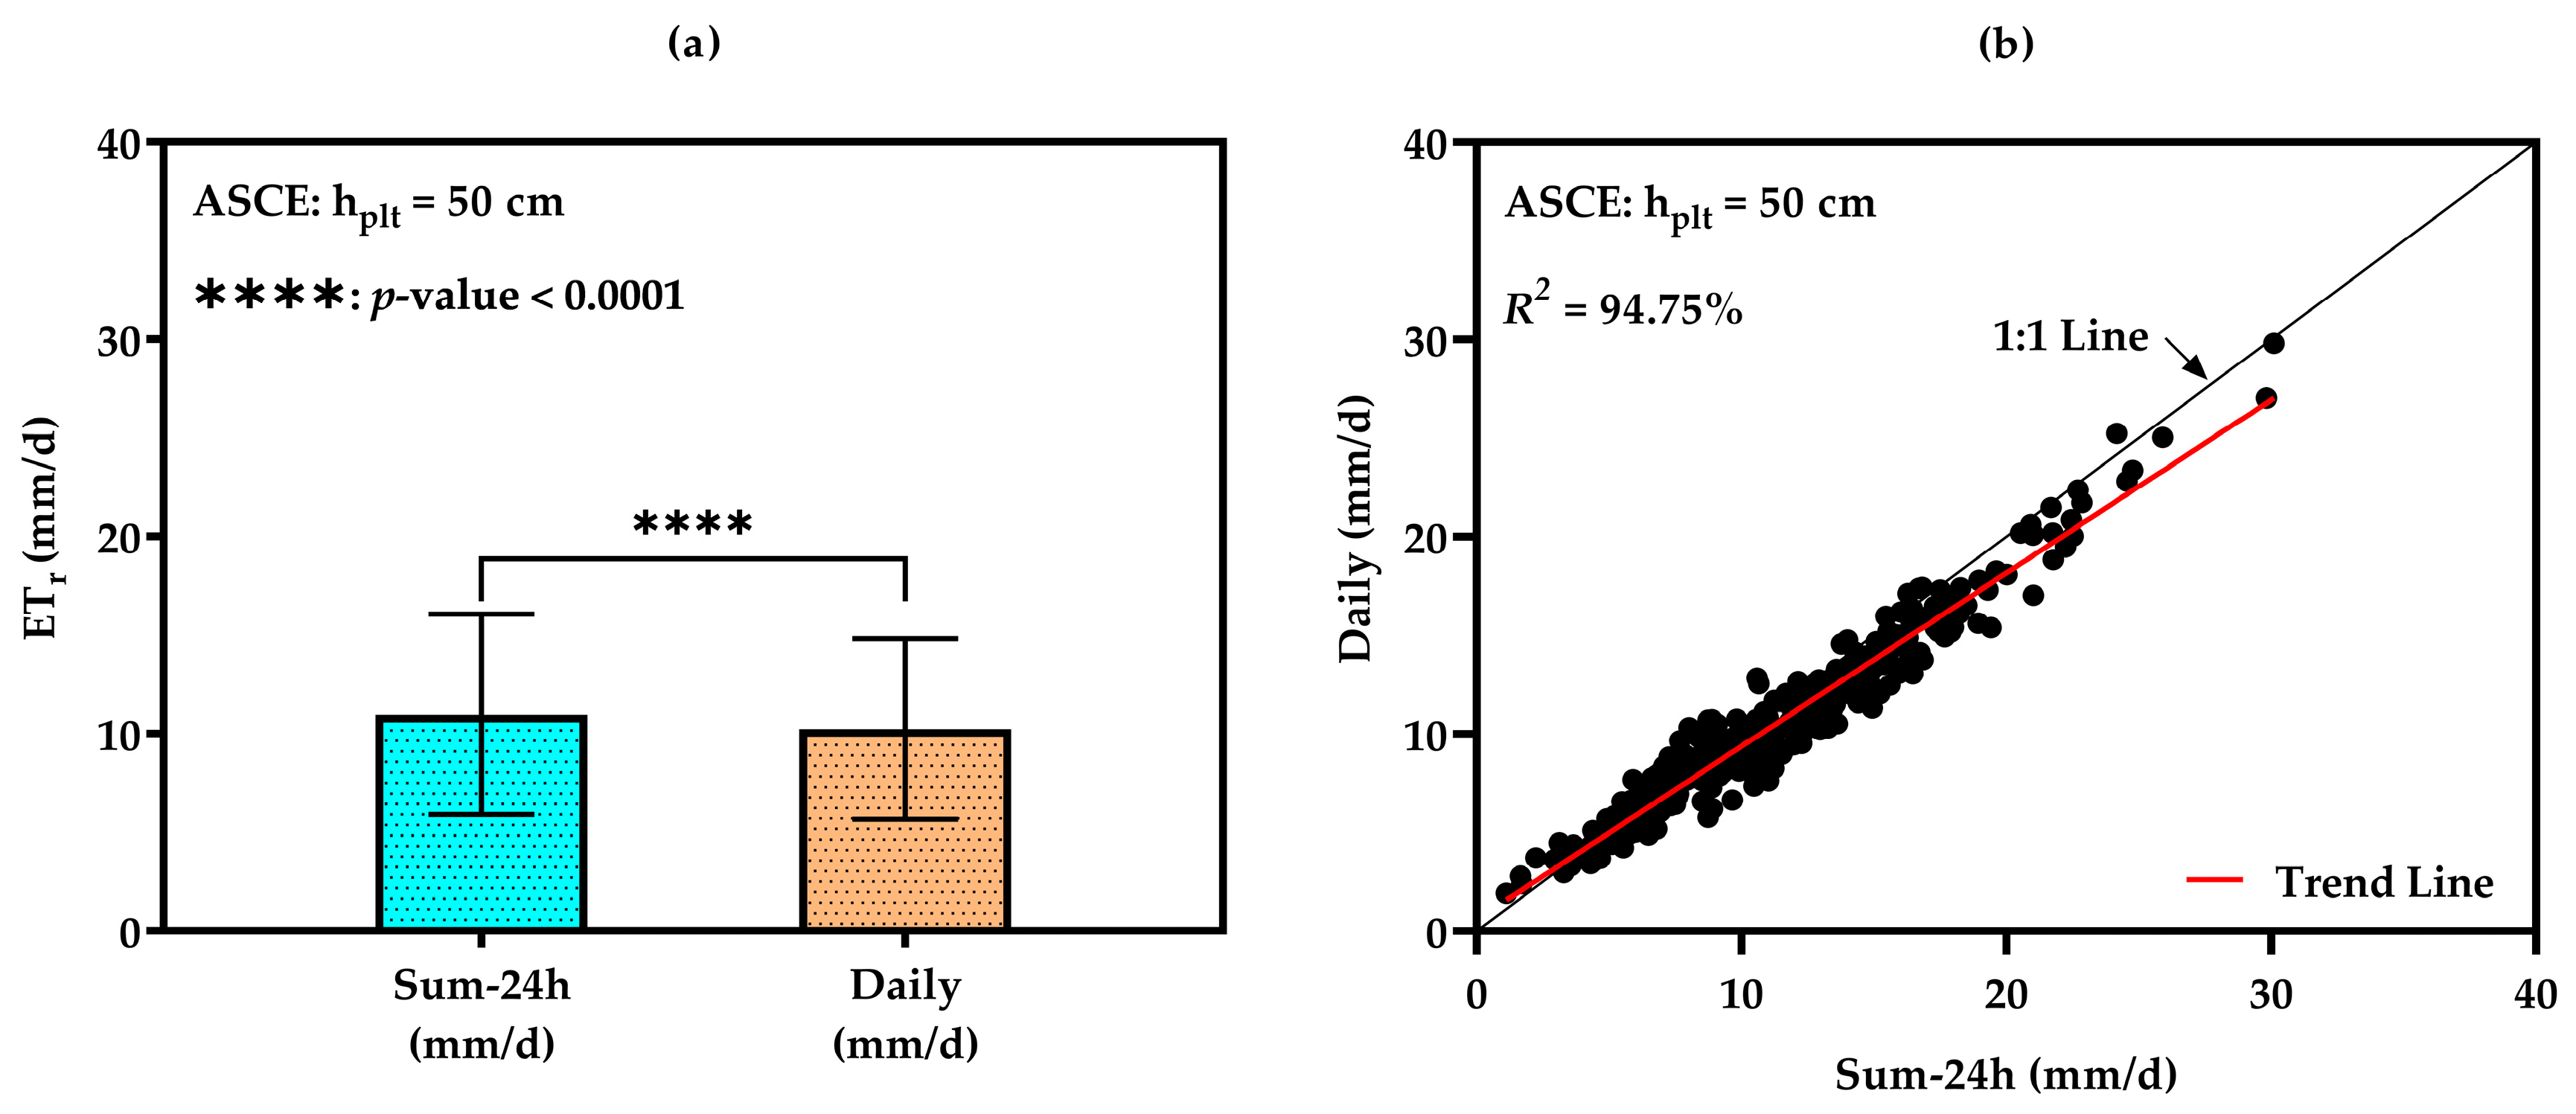
As depicted in
Figure 5a, the Wilcoxon signed-rank test indicated a statistically significant difference (
p < 0.0001), confirming that the two methods are not identically distributed. However, the high Pearson correlation coefficient (r = 0.97) and coefficient of determination (R
2 = 94.75%) demonstrate a strong linear relationship between the two datasets (
Figure 5b). Moreover, the descriptive statistics show that the average hourly ET
r (mean = 0.457 mm/h) is slightly higher than the daily/24 estimate (mean = 0.426 mm/h), with both methods exhibiting similar variability. The negative bias (b = −0.0312 mm/h) confirms that daily/24 values tend to underestimate ET
r relative to the hourly computation. Despite this, the Nash–Sutcliffe Efficiency (NSE = 0.92) confirms strong predictive performance. In the same context, the error metrics, including RMSE (0.06 mm/h) and MAE (0.05 mm/h), are low, indicating high accuracy. The Index of Agreement (d = 0.98) and the Confidence Index (c = 0.95) further support the reliability and consistency of the daily/24 method, where c is classified as excellent according to
Table 3.
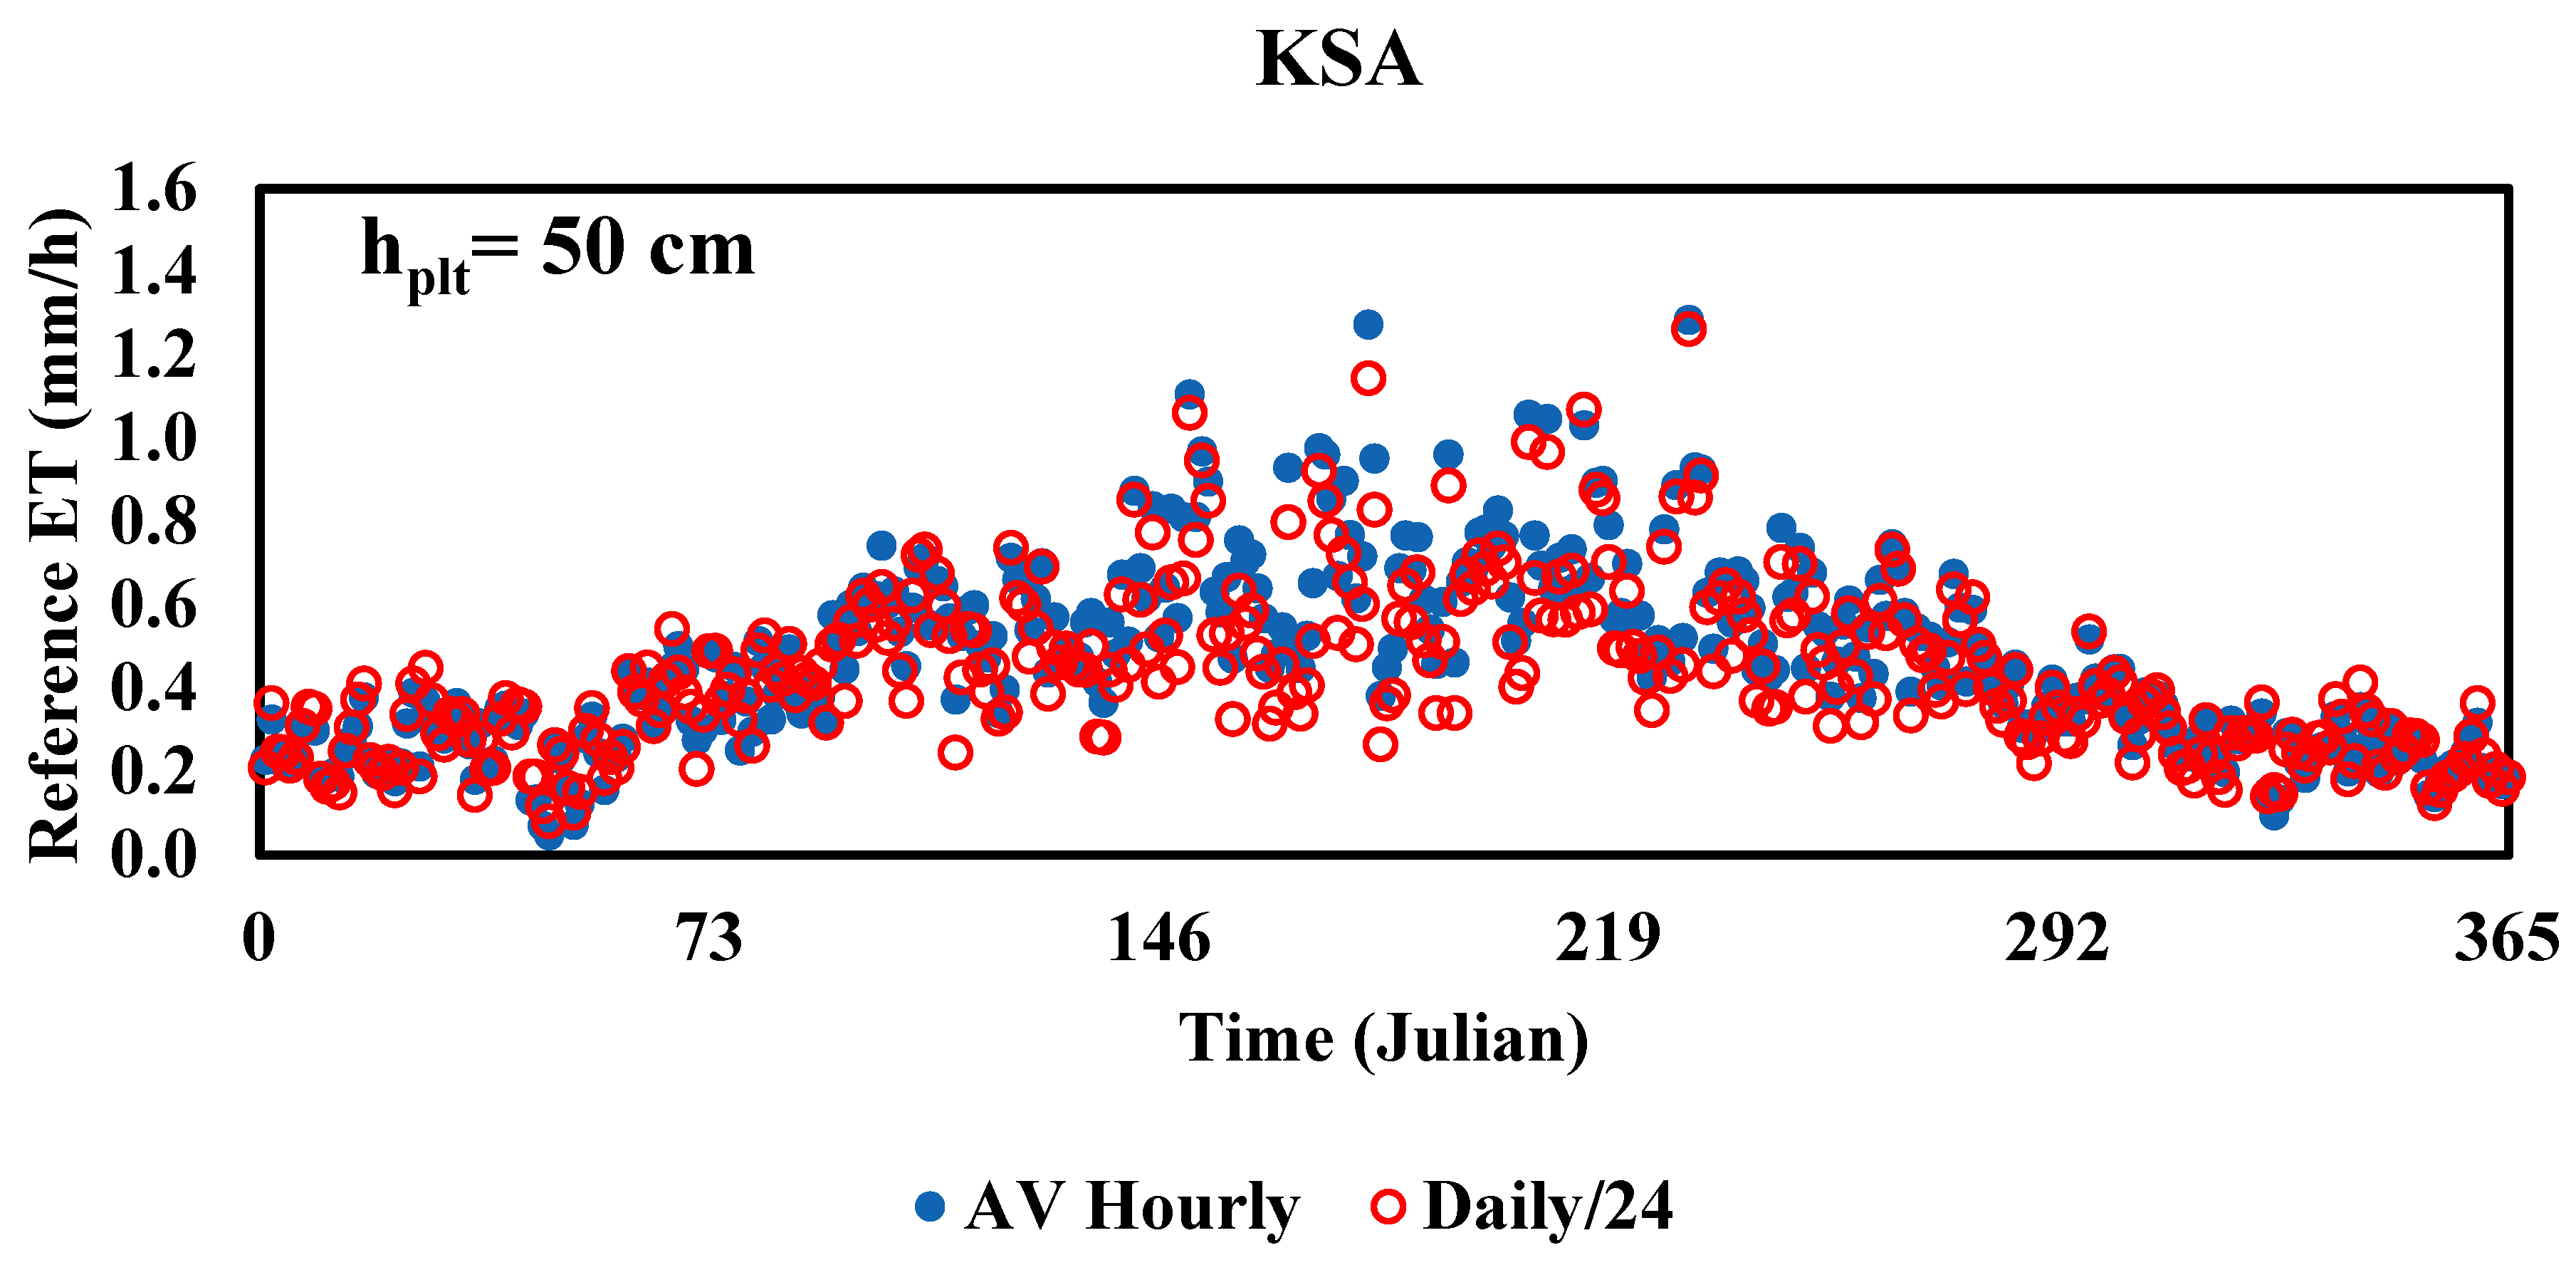
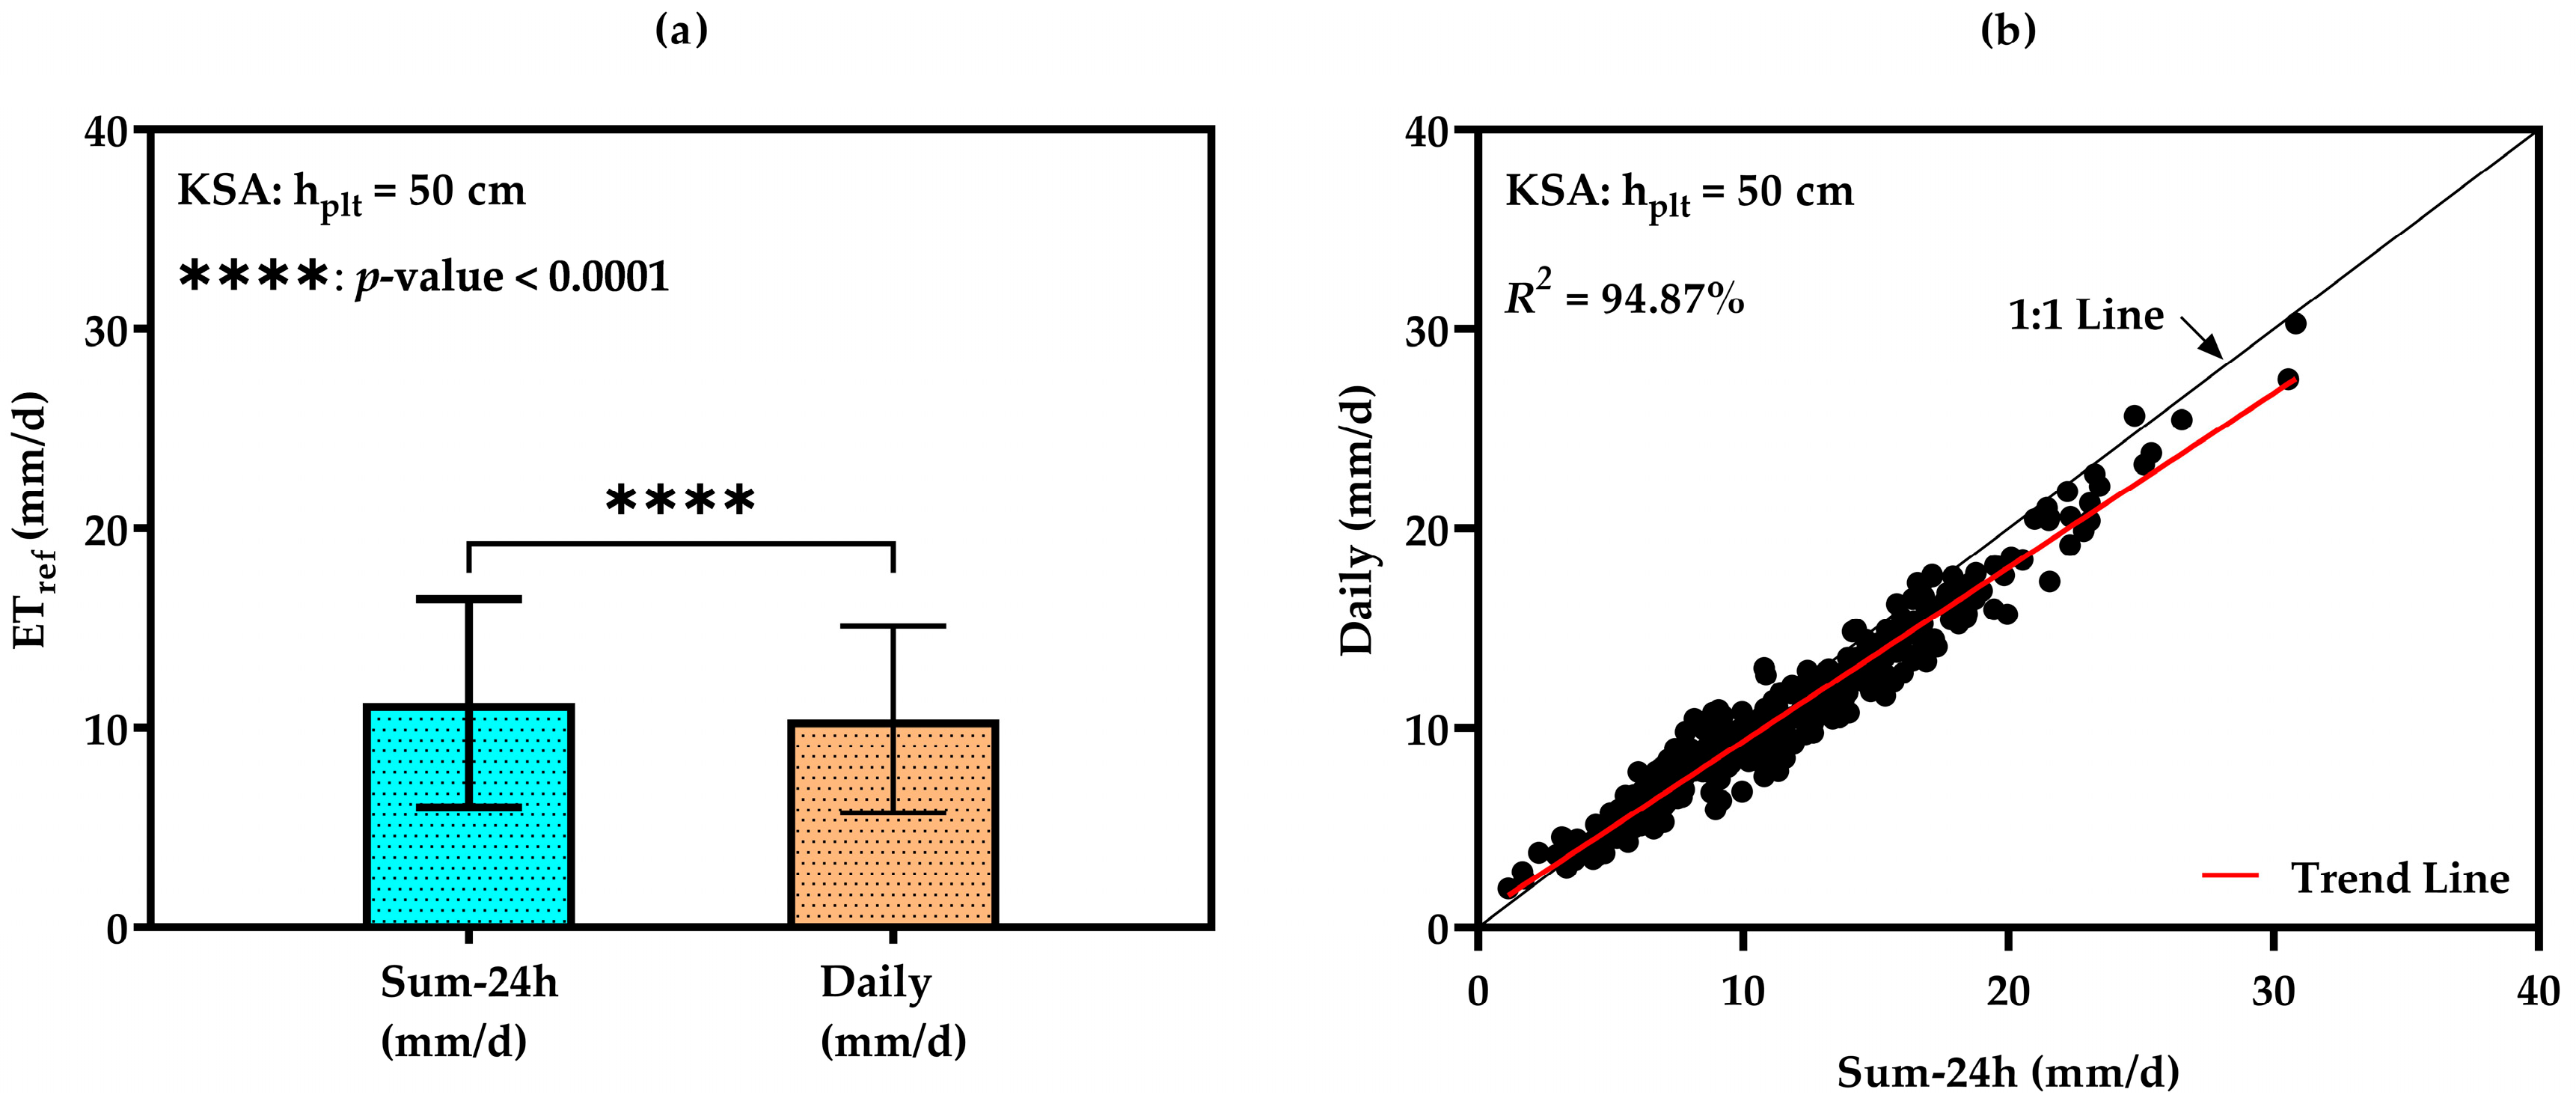
3.2.2. Hourly ETref of KSA Model (hplt = 50 cm)
The scatterplot (
Figure 6) indicates weaker agreement (R
2 = 81%) compared with ASCE, with daily/24 underestimating hourly ET
ref by 7–15% during spring midday peaks. Greater variability in hourly ET
ref suggests that aerodynamic components for taller plants amplify diurnal fluctuations, which daily approximations fail to capture. Normality tests parallel ASCE, rejecting normality for both datasets (all
p < 0.0001),
Table 5. Hence, the non-parametric Wilcoxon test was applied.
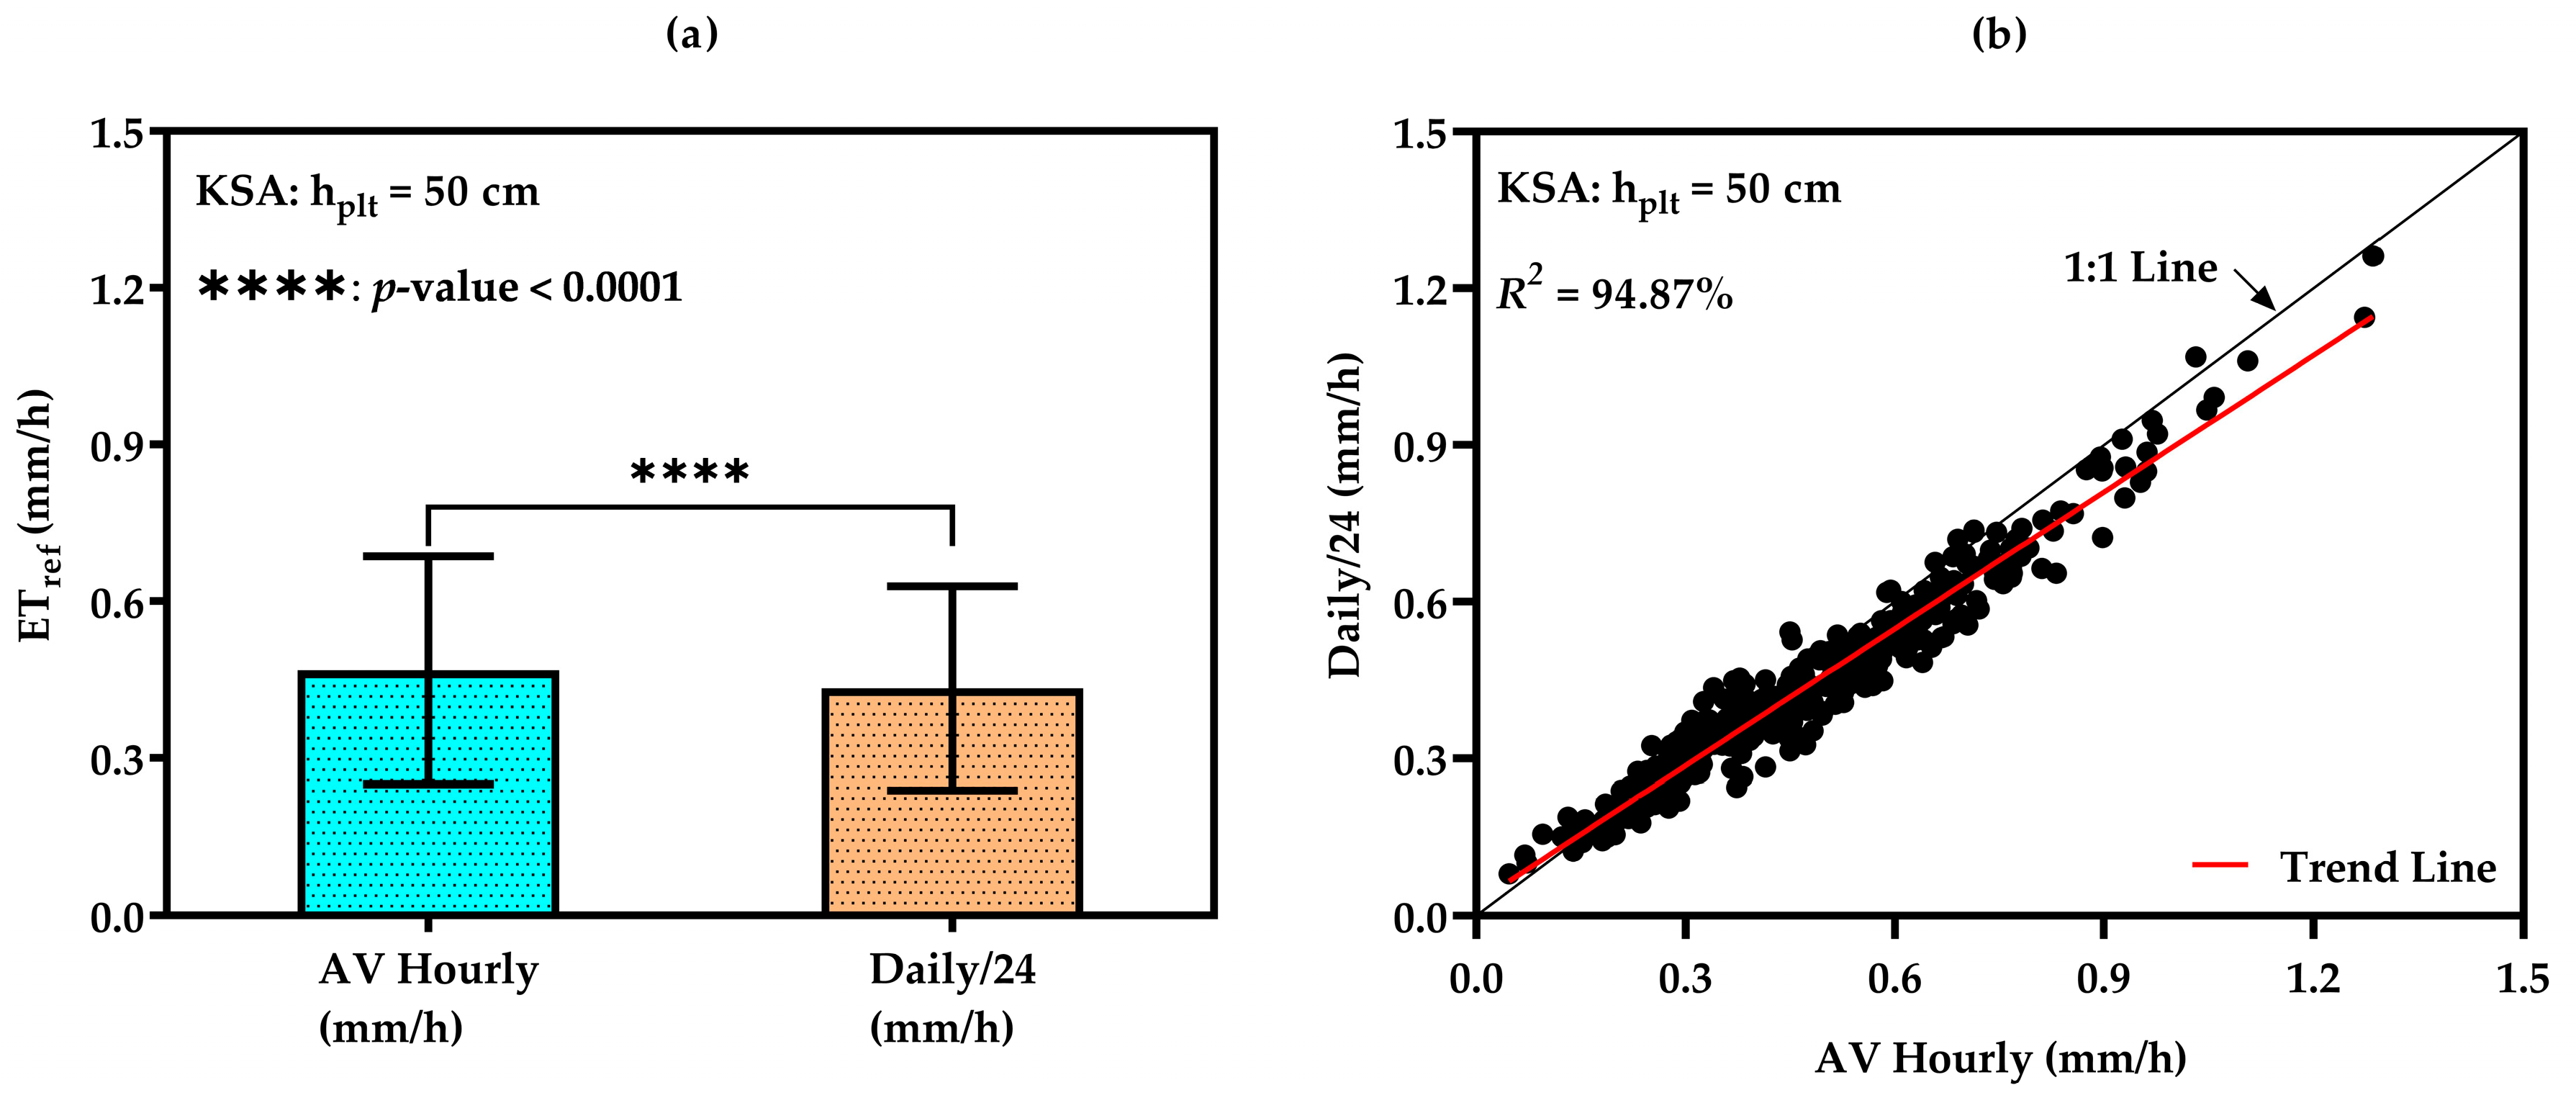
At h
plt = 50 cm, the Wilcoxon signed-rank test confirmed a statistically significant difference (
p < 0.0001) (
Figure 7a). This non-parametric test confirms that the two paired data sets are not identically distributed, with the hourly method consistently producing slightly higher ET
ref values (mean = 0.468 mm/h) compared with the daily/24 method (mean = 0.433 mm/h). This systematic difference is further supported by the observed negative bias (b = −0.04), suggesting that the daily/24 approximation tends to underestimate ET
ref relative to the hourly method. Despite this bias, the high Pearson correlation coefficient (r = 0.97) and coefficient of determination (R
2 = 94.87%) demonstrate a strong linear relationship between the two datasets (
Figure 7b), indicating that they track ET
ref dynamics similarly over time.
The model performance statistics reinforce this observation: the Nash–Sutcliffe Efficiency (NSE = 0.92) confirms strong predictive performance, while the RMSE (0.06 mm/h) and MAE (0.05 mm/h) indicate high accuracy. Furthermore, the Index of Agreement (d = 0.98) and Confidence Index (c = 0.95, excellent class) reflect strong agreement and reliability between the two estimation approaches.
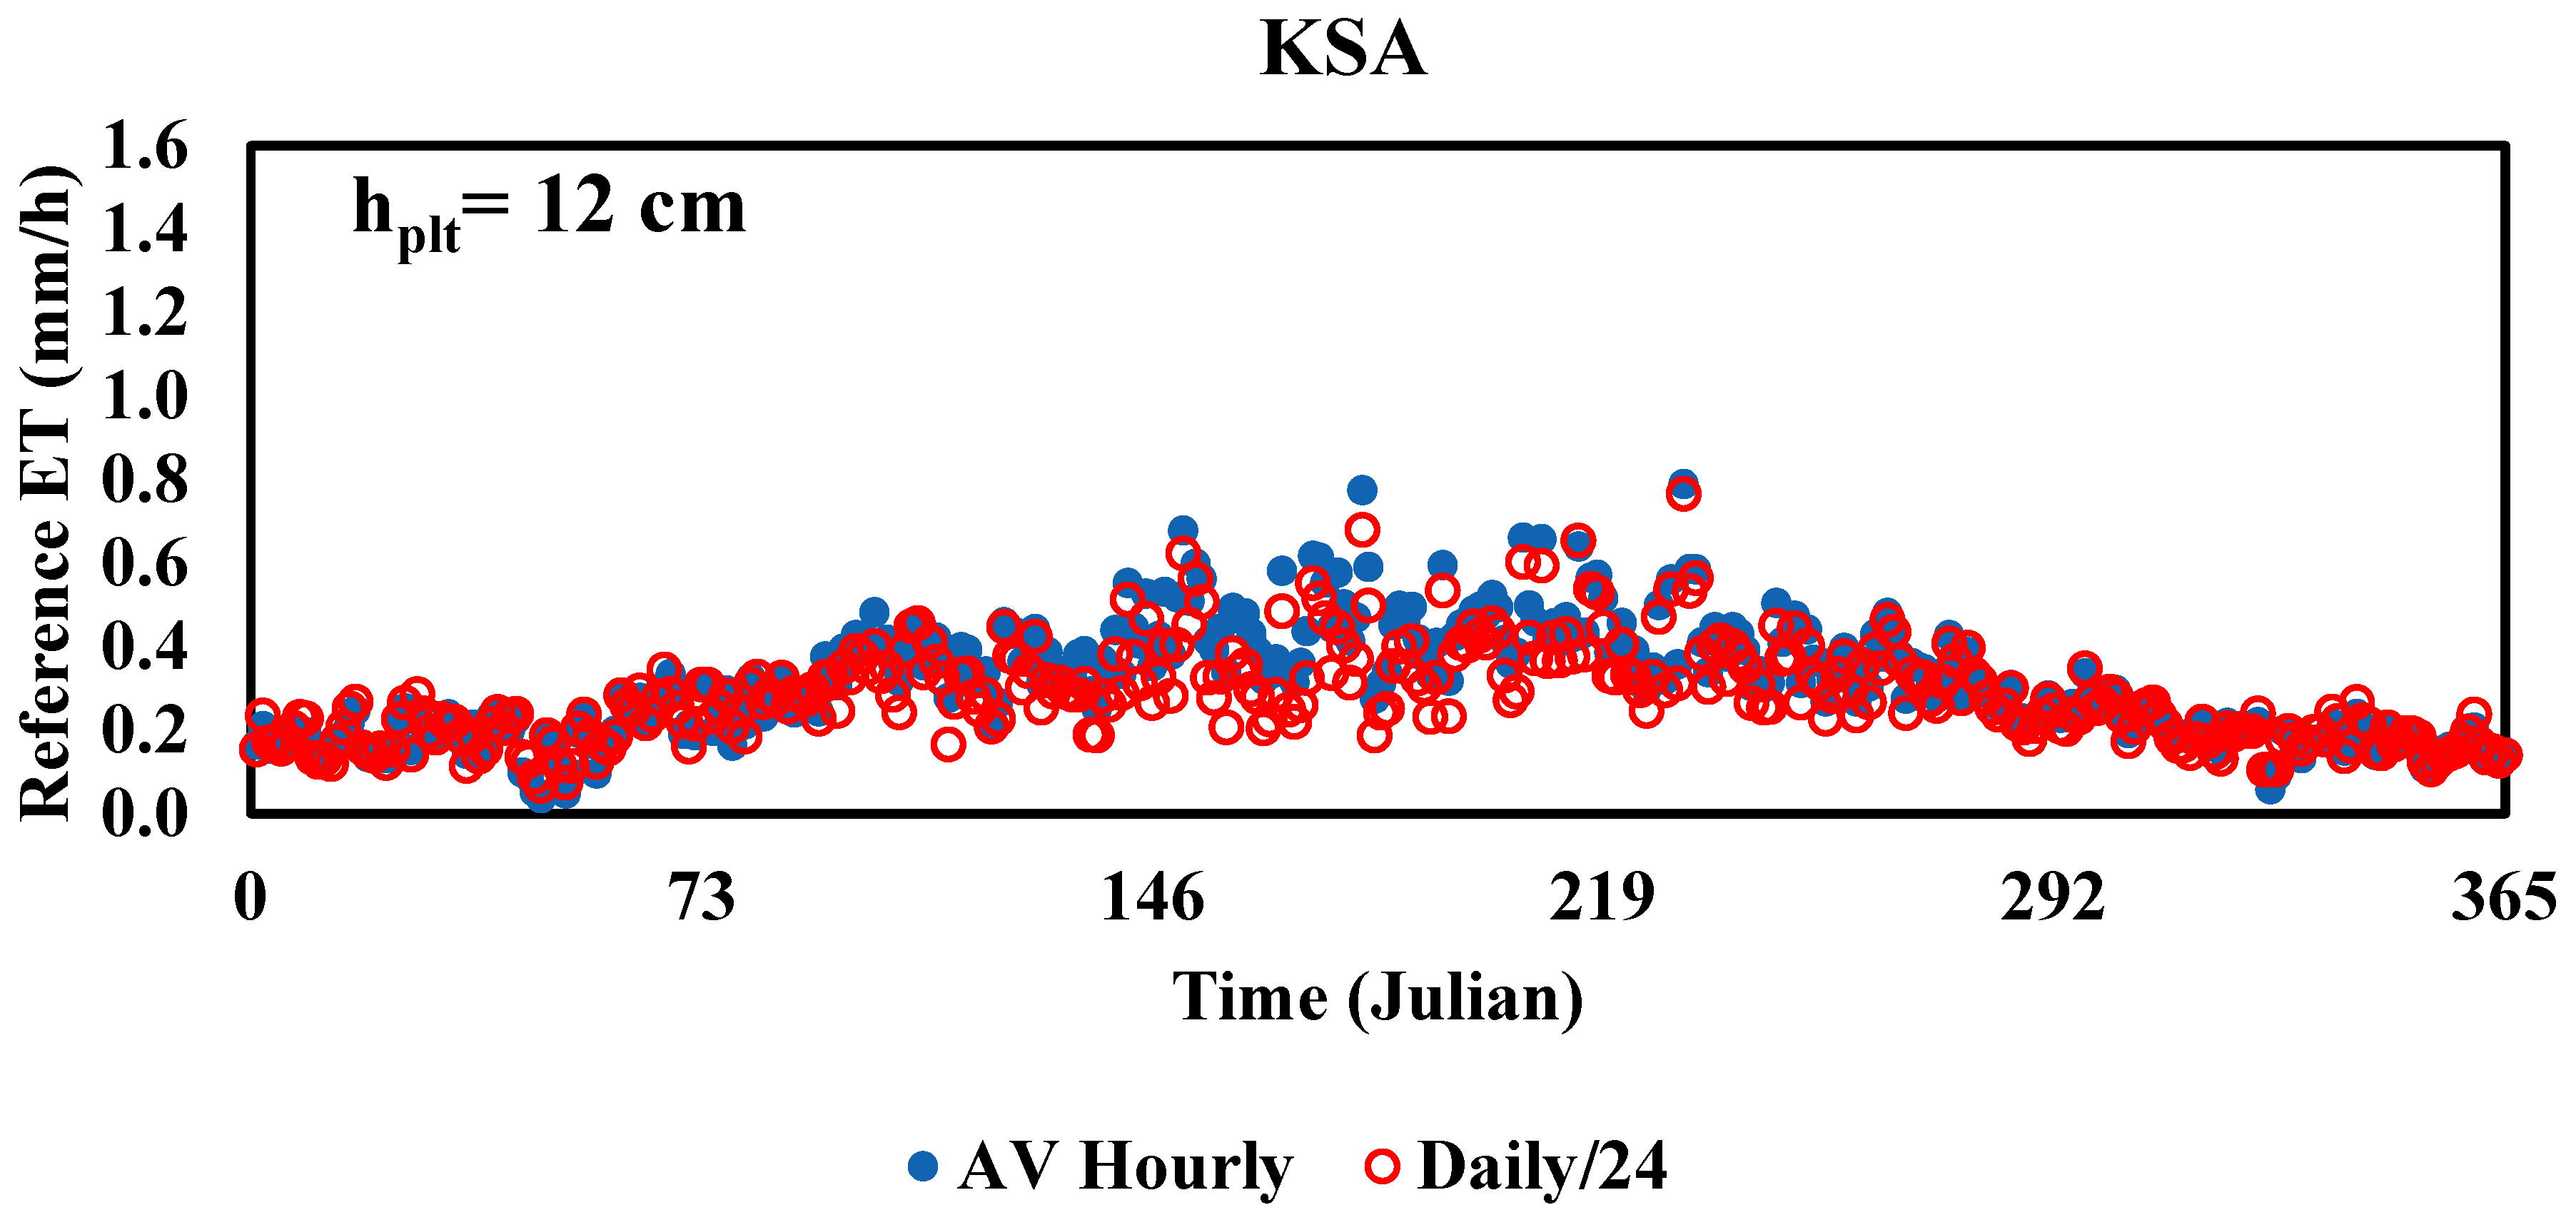
3.2.3. Hourly ETo of FAO Model (hplt = 12 cm)
Figure 8 shows the strongest correlation (R
2 = 92%) among models. Despite this, because of
Table 6, normality tests uniformly reject normality (i.e., Anderson–Darling
p < 0.0001). Low-evaporation months (December, January, and February) exhibit 8–10% overestimation by daily/24, attributed to reduced nighttime atmospheric demand. This model demonstrates the least bias, though temporal mismatches persist.
The comparison between ET
o computed as average hourly values and as daily/24 h revealed statistically and practically significant differences. The Wilcoxon signed-rank test confirmed a statistically significant difference (
p < 0.0001) as depicted in
Figure 9a, indicating that the two methods are not identically distributed. Despite this, the Pearson correlation coefficient (r = 0.96) and coefficient of determination (R
2 = 92.41%) demonstrate a strong linear relationship between the two datasets, as supported by a 1:1 plot (
Figure 9b).
Descriptive statistics show that the hourly ETref (mean = 0.307 mm/h) is slightly higher than the daily/24 estimate (mean = 0.282 mm/h), with both methods exhibiting similar variability. In addition, the negative bias (b = −0.03 mm/h) indicates systematic underestimation by the daily/24 method. Model performance statistics further support the consistency: the Nash–Sutcliffe efficiency (NSE = 0.87) and index of agreement (d = 0.96) suggest that the hourly method captures the variability of ETo much more reliably. Error magnitudes remain moderate, while the RMSE (0.05 mm/h) and MAE (0.04 mm/h) indicate high accuracy. Furthermore, the Confidence Index (c = 0.93) reflects strong agreement and reliability between the two estimation approaches (excellent class).
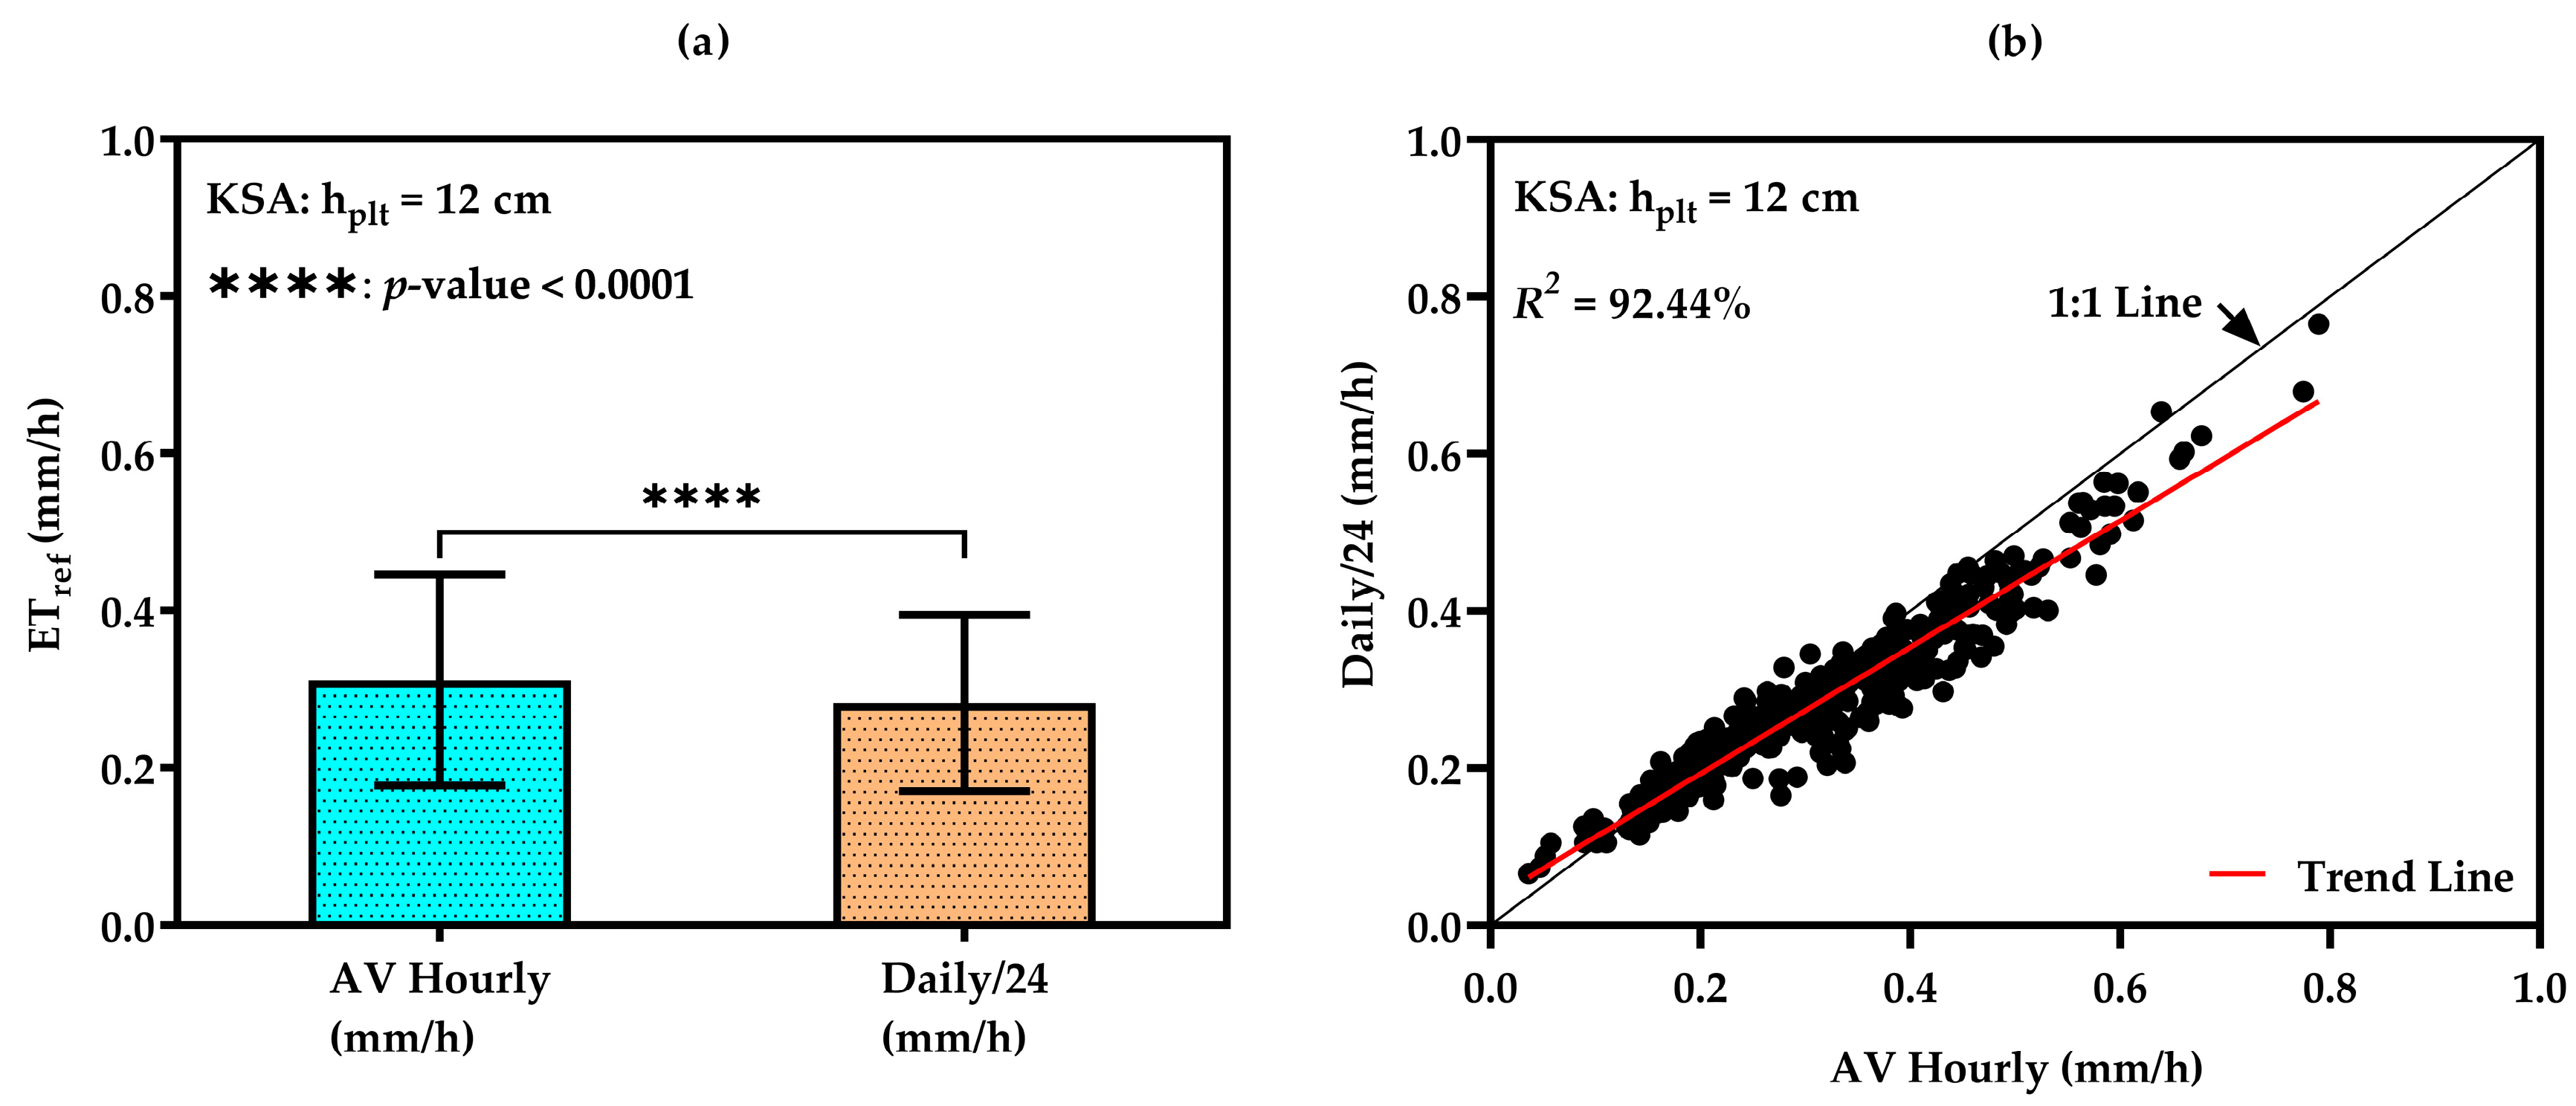
3.2.4. Hourly ETref of KSA Model (hplt = 12 cm)
For shorter canopies, daily/24 consistently underestimates hourly ET
ref by 9–18% during summer (
Figure 10). Normality tests confirm non-normal distributions (all
p < 0.05),
Table 7. The pronounced bias at reduced height highlights canopy-structure influences on diurnal ET partitioning, which daily downscaling inadequately represents. For how sensitive the model is, factors like aerodynamic and plant-height parameters (e.g., KSA
50 vs. KSA
12) significantly affect downscaling accuracy, with taller canopies exhibiting greater hourly variability.
The Wilcoxon signed-rank test (
Figure 11a) confirmed a statistically significant difference (
p < 0.0001), indicating a consistent difference across paired observations. Descriptive statistics show that the hourly ET
ref values (mean = 0.312 mm/h) are systematically higher than those derived from daily/24 approximations (mean = 0.283 mm/h), supported by a negative average bias (b = −0.03 mm/h). This underlines the daily/24 method’s tendency to underestimate actual ET
ref values due to temporal aggregation. Nonetheless, the Pearson correlation coefficient (r = 0.96) and coefficient of determination (R
2 = 92.44%) demonstrate a strong linear relationship between the two datasets as plotted in
Figure 11b. This strong linearity is further supported by the high index of agreement (d = 0.96) and a confidence index (c = 0.92), both of which suggest high consistency between the two approaches. The Nash–Sutcliffe Efficiency (NSE = 0.86) confirms good predictive performance, while the RMSE (0.05 mm/h) and MAE (0.04 mm/h) indicate high accuracy.
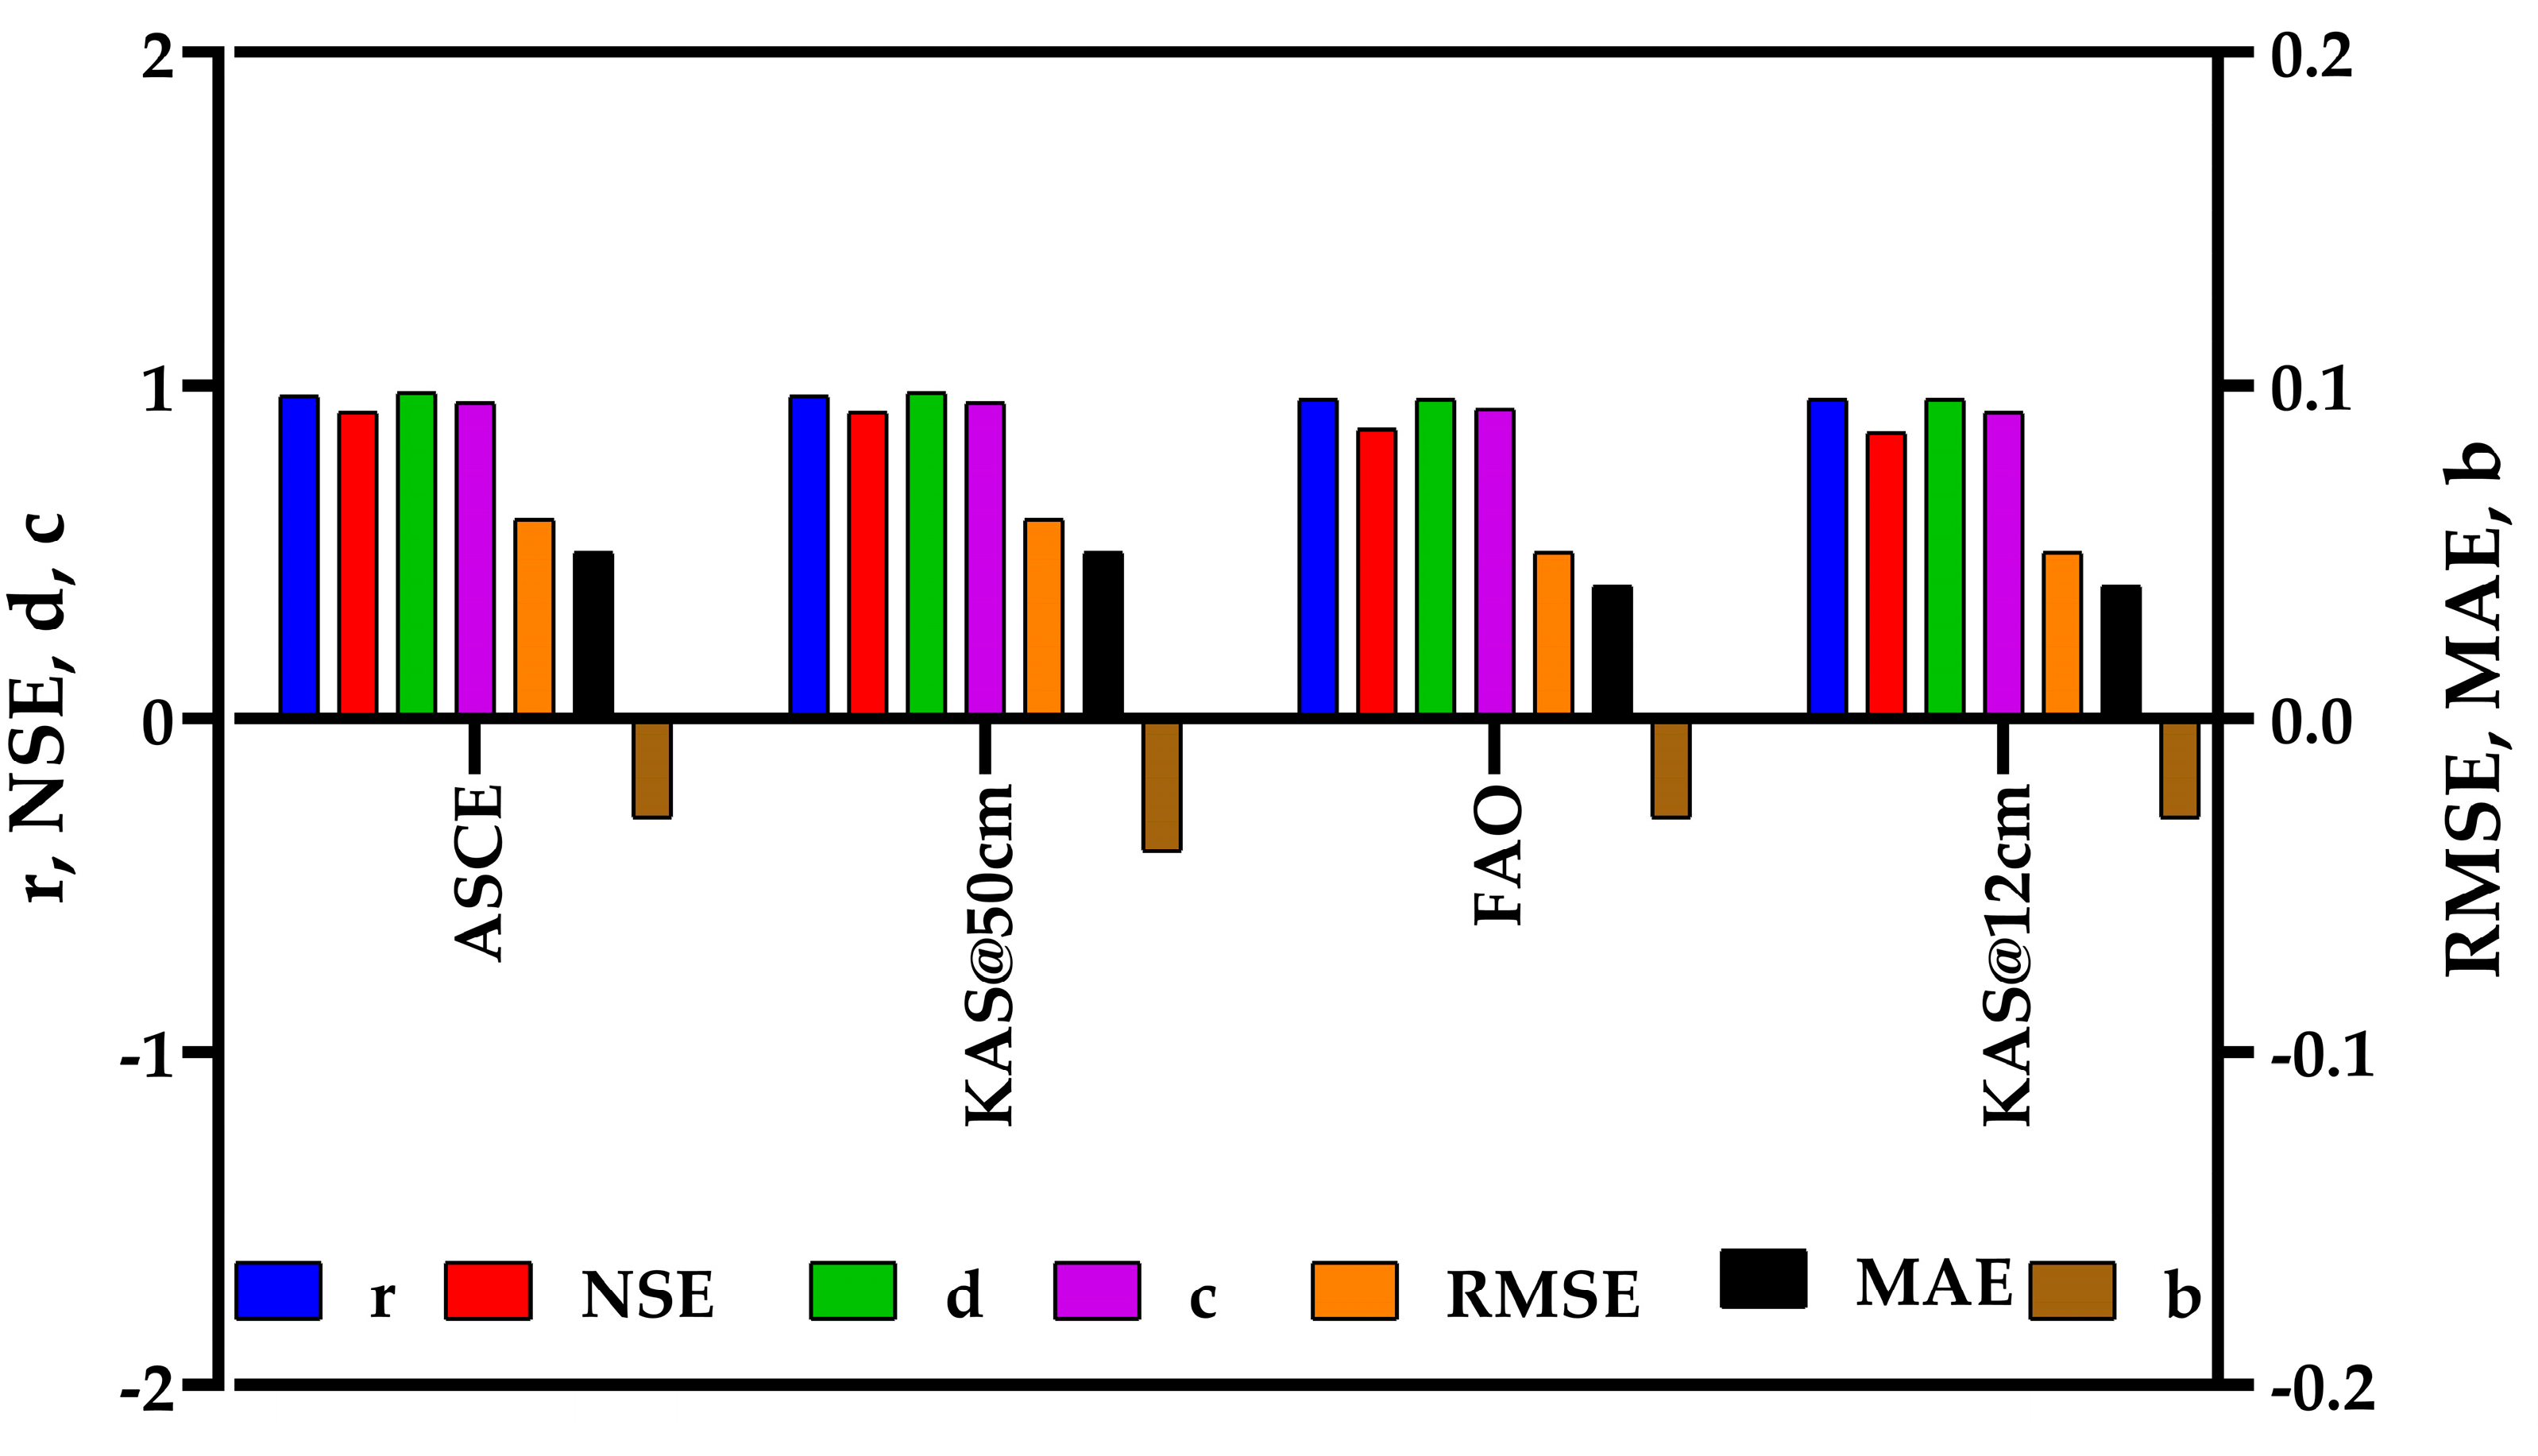
Figure 12 depicts a visual comparative bar chart illustrating the statistical performance metrics for the four reference ET mathematical models—ASCE, KSA at 50 cm, FAO, and KSA at 12 cm—based on paired hourly ET data. These results highlight that although both estimation approaches are closely aligned in temporal trends. While daily/24 estimates are computationally convenient, they may mask diurnal ET variability and lead to underestimation, especially under fluctuating meteorological conditions. The significant Wilcoxon result also suggests that averaging across the diurnal cycle introduces aggregation bias not captured in the daily/24 approximation. The small but consistent underestimation associated with the daily/24 method may be attributed to the loss of intra-daily variability, particularly under high temporal resolution meteorological conditions. Therefore, for applications requiring precise reference ET—such as irrigation scheduling or hydrological modeling—the hourly method is preferable due to its higher fidelity. On the other hand, the daily/24 method provides a reliable approximation of average hourly ET and is suitable for use in operational and research contexts where direct hourly data are unavailable.
3.3. Daily Reference ET Investigation
3.3.1. Daily ETr of ASCE Model (hplt = 50 cm)
This study evaluates the agreement between conventional daily reference evapotranspiration (ET) and the sum of 24-hourly ET across four standardized models: ASCE, KSA at plant height = 50 cm, FAO, and KSA at plant height = 12 cm. The analysis leverages full-year datasets (365 days) for each model, with statistical validation via normality tests and graphical comparisons.
Figure 13 illustrates a strong linear correlation (R
2 > 90%) between daily ET
r and 24 h cumulative ET
r. However, systematic deviations emerge during high-evaporative periods (e.g., June, July, and August), where daily values underestimate the 24 h sum by 4–12%.
Table 8 confirms non-normality for both datasets (all
p < 0.0001). This indicates that parametric statistical methods are invalid for temporal scaling.
The Wilcoxon signed-rank test revealed a statistically significant difference between the sum-24 h ET
r and daily ET
r (
p < 0.0001), indicating systematic and non-random deviations between paired observations (
Figure 14a). The sum-24 h ET
r consistently exceeded the daily-calculated values, with respective means of 10.976 mm/d and 10.227 mm/d, with both methods exhibiting comparable variability (standard deviations of 5.07 and 4.58 mm/d, respectively). The minimum and median values also suggest that the daily method tends to slightly underestimate ET
r, which is further supported by the negative average bias (b = −0.75 mm/d). Despite this difference, the two approaches show a strong linear relationship, as evidenced by the Pearson correlation coefficient (r = 0.97) and the coefficient of determination (R
2 = 94.75%), which indicates a strong linear relationship between the two datasets (
Figure 14b).
Performance statistics further validate this consistency: The Nash–Sutcliffe Efficiency (NSE = 0.92) confirms that the sum-24 h method provides a reliable approximation of the daily ETr. Error metrics such as RMSE (1.43 mm/d) and MAE (1.13 mm/d) are within acceptable limits for hydrological modeling, reinforcing the practical interchangeability of the two approaches under most conditions. Furthermore, the Index of Agreement (d = 0.98) and Confidence Index (c = 0.95) reflect a high degree of concordance and reliability between the methods. These findings suggest that while statistically distinguishable, the daily ETr estimates are sufficiently accurate for operational and research applications, particularly when hourly data are unavailable.
3.3.2. Daily ETref of KSA Model (hplt = 50 cm)
The scatterplot (
Figure 15) reveals moderate agreement (R
2 = 81%), with daily ET
ref underestimating the 24 h sum by 7–15% during spring midday peaks. Normality tests uniformly reject normality (all
p < 0.0001), mirroring ASCE’s distribution characteristics,
Table 9. The heightened variability suggests aerodynamic influences at taller plant heights amplify diurnal flux discrepancies.
A statistical comparison was conducted between sum-24 h ET
ref values and those computed directly as daily ET
ref values. The Wilcoxon signed-rank test (
Figure 16a) indicated a statistically significant difference (
p < 0.0001), suggesting that the two methods are not identically distributed. However, the strength of their relationship is underscored by a Pearson correlation coefficient of r = 0.97 and a coefficient of determination (R
2) of 94.87%, indicating a strong linear association (
Figure 16b).
Descriptive statistics reveal that the sum-24 h ETref has a slightly higher mean (11.237 mm/d) compared with the daily ETref (10.402 mm/d), with both methods exhibiting similar variability (standard deviations of 5.23 and 4.68 mm/d, respectively). The average bias b = −0.84 mm/d confirms a consistent underestimation by the daily method relative to the sum-24 h values. In addition, model performance metrics further support the reliability of the daily ETref estimates. The Nash–Sutcliffe Efficiency (NSE = 0.92) indicates strong predictive accuracy. However, the RMSE (1.5 mm/d) and MAE (1.19 mm/d) indicate that the underestimation by the daily method is non-negligible, especially in water-sensitive applications such as precision irrigation or plant modeling. The Index of Agreement (d = 0.98) and the Confidence Index (c = 0.95) reflect high concordance and model reliability, where c is classified as excellent.
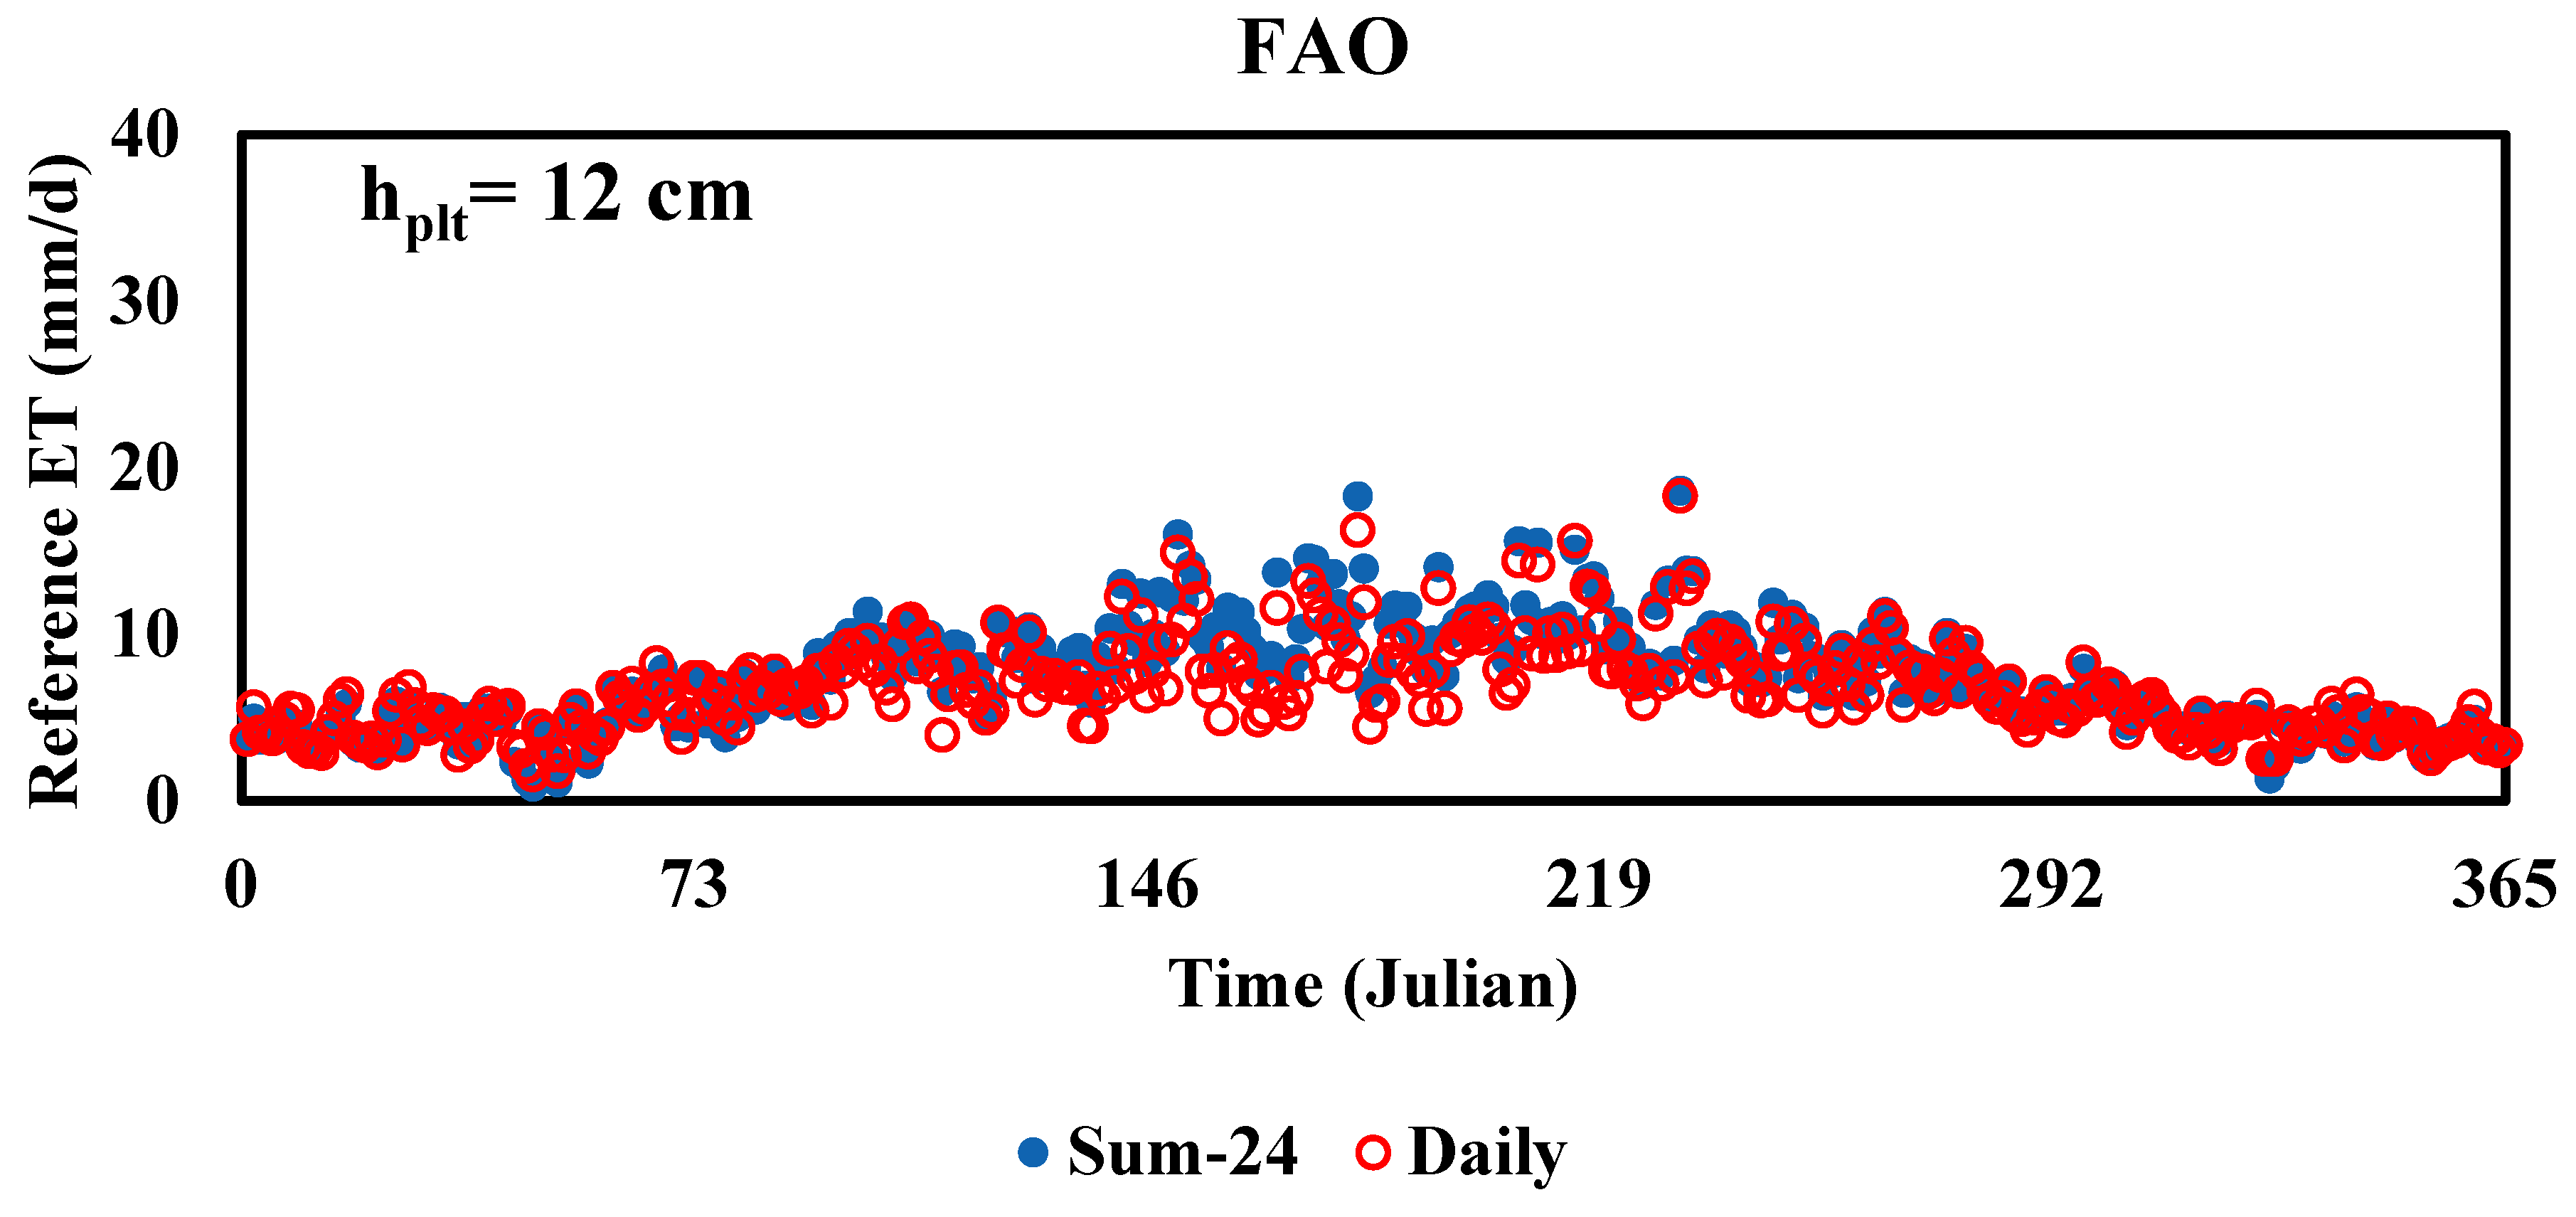
3.3.3. Daily ETo of FAO Model (hplt = 12 cm)
Figure 17 demonstrates the strongest correlation (R
2 = 92%) among models. Despite this, normality tests reject both distributions (Anderson–Darling
p < 0.0001),
Table 10. Low-evaporation months (December, January, and February) exhibit 8–10% overestimation by daily ET
o, attributed to reduced nighttime atmospheric demand. This model shows the least absolute bias but retains seasonally dependent errors.
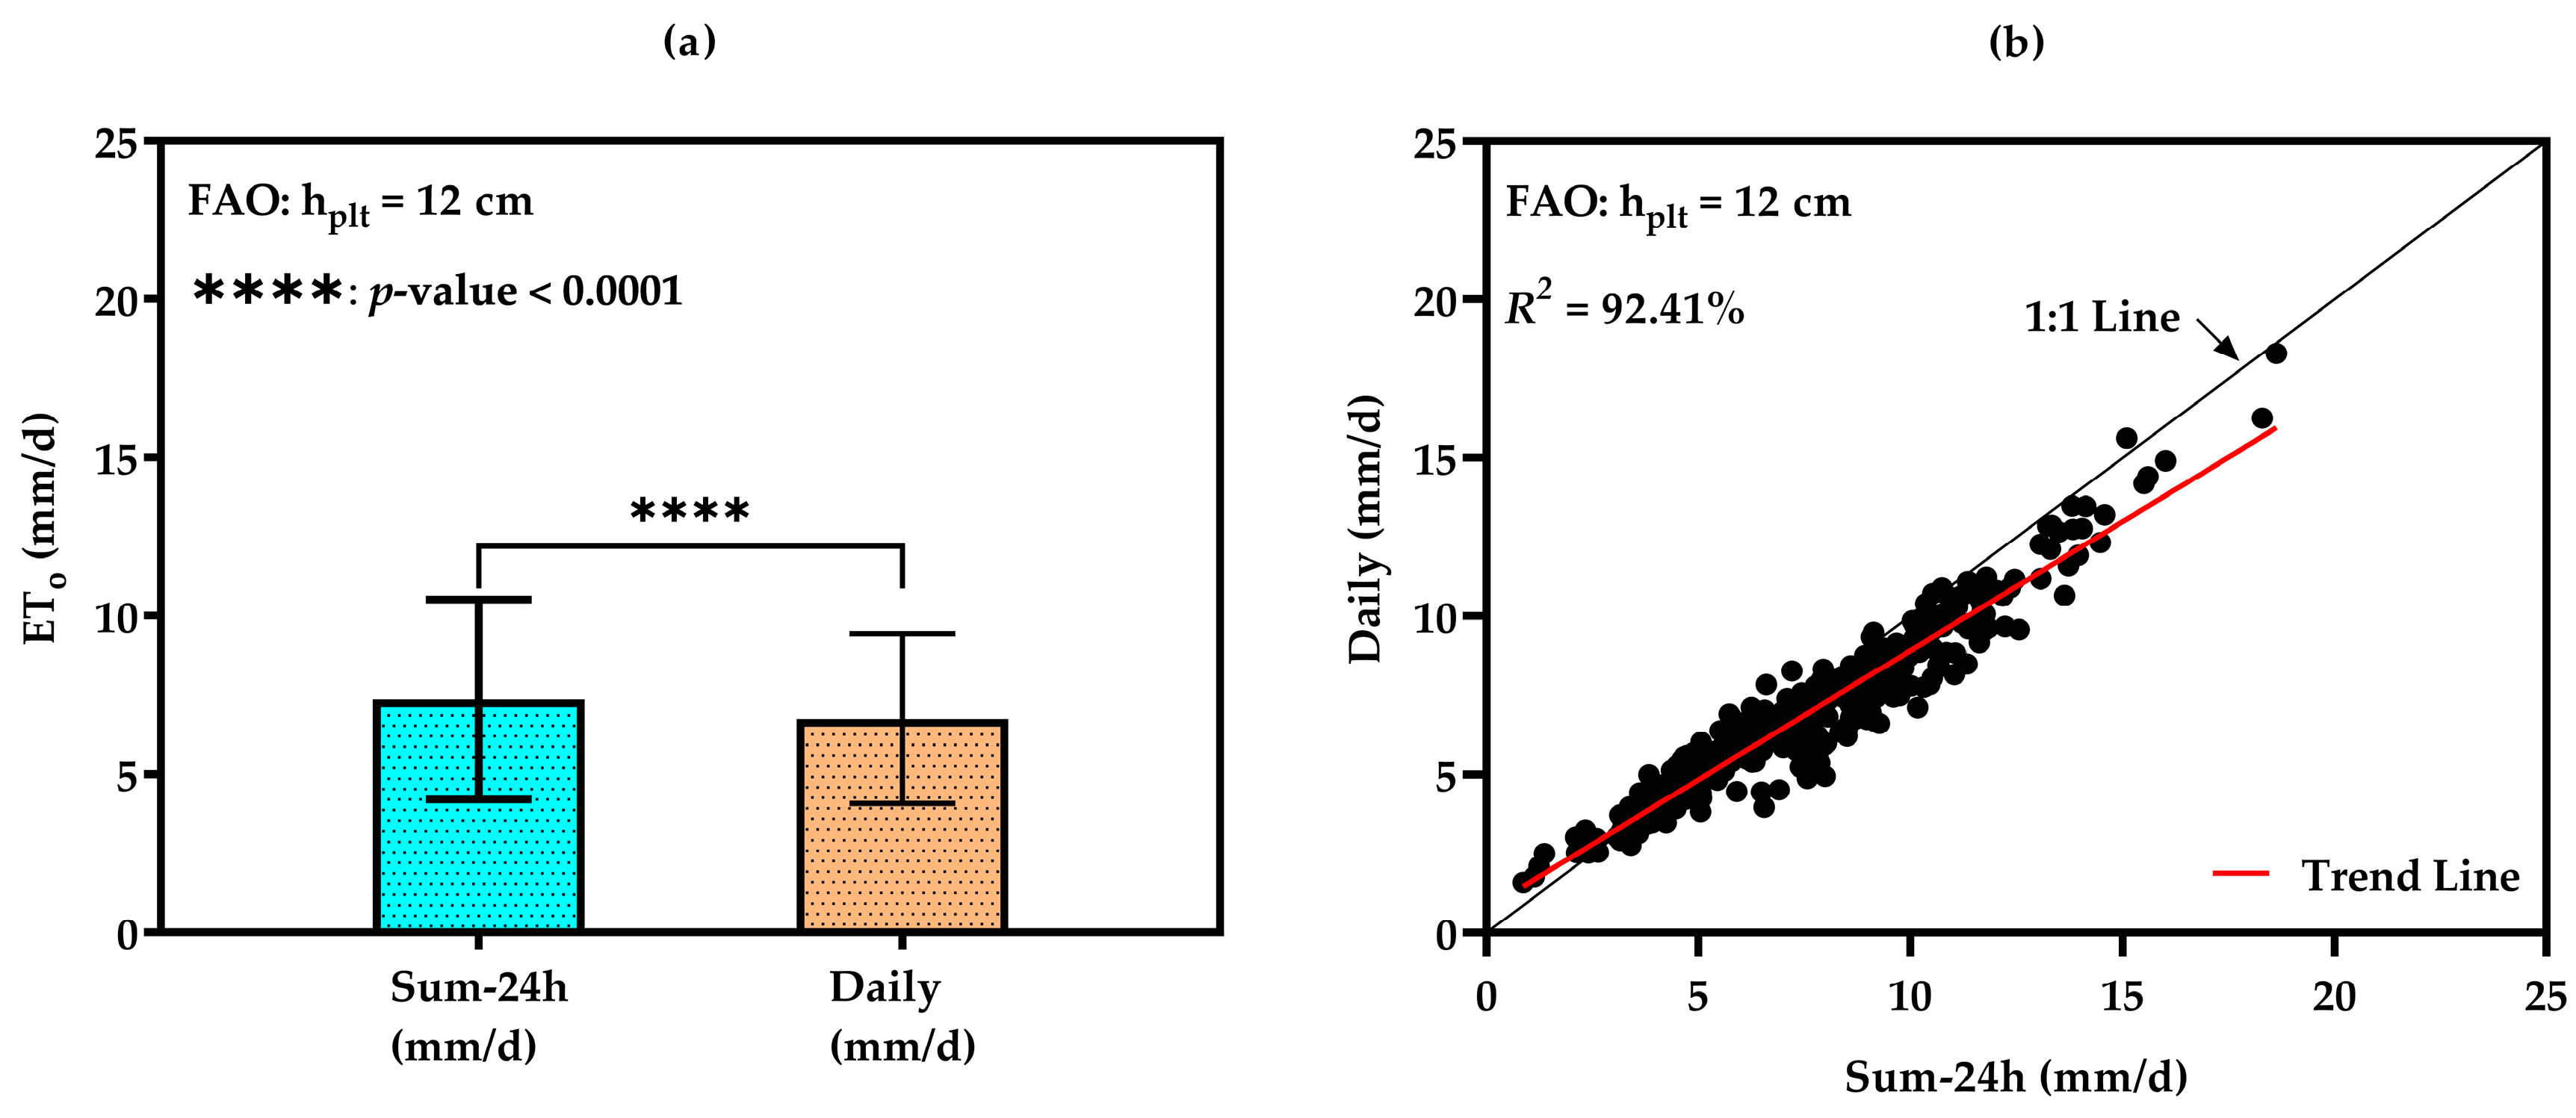
The comparison between daily ET
o values calculated using either the sum-24 h estimates or as a daily computation at a reference plant height of 12 cm demonstrates a statistically significant discrepancy. The Wilcoxon signed-rank test yielded a
p-value < 0.0001 (
Figure 18a), indicating a systematic and non-random difference between the two methods.
The sum-24 h ET
o (mean = 7.368 mm/d) consistently exceeded the daily method (mean = 6.761 mm/d), with both methods exhibiting similar variability (standard deviations of 3.16 and 2.68 mm/d, respectively). The negative average bias of −0.61 mm/d confirms a tendency for underestimation by the daily approach. Despite this deviation, the two methods exhibited strong agreement in their temporal patterns, as shown by a high Pearson correlation coefficient (r = 0.96) and R
2 = 92.41% (
Figure 18b). Additional performance metrics—Nash–Sutcliffe efficiency (NSE = 0.87), index of agreement (d = 0.96), and confidence index (c = 0.93)—further support the reliability and coherence of the sum-24 h method in replicating the daily ET
o dynamics. While the RMSE (1.12 mm/d) and MAE (0.85 mm/d) are moderate, they are relevant in applications requiring high precision, such as deficit irrigation or water balance assessments.
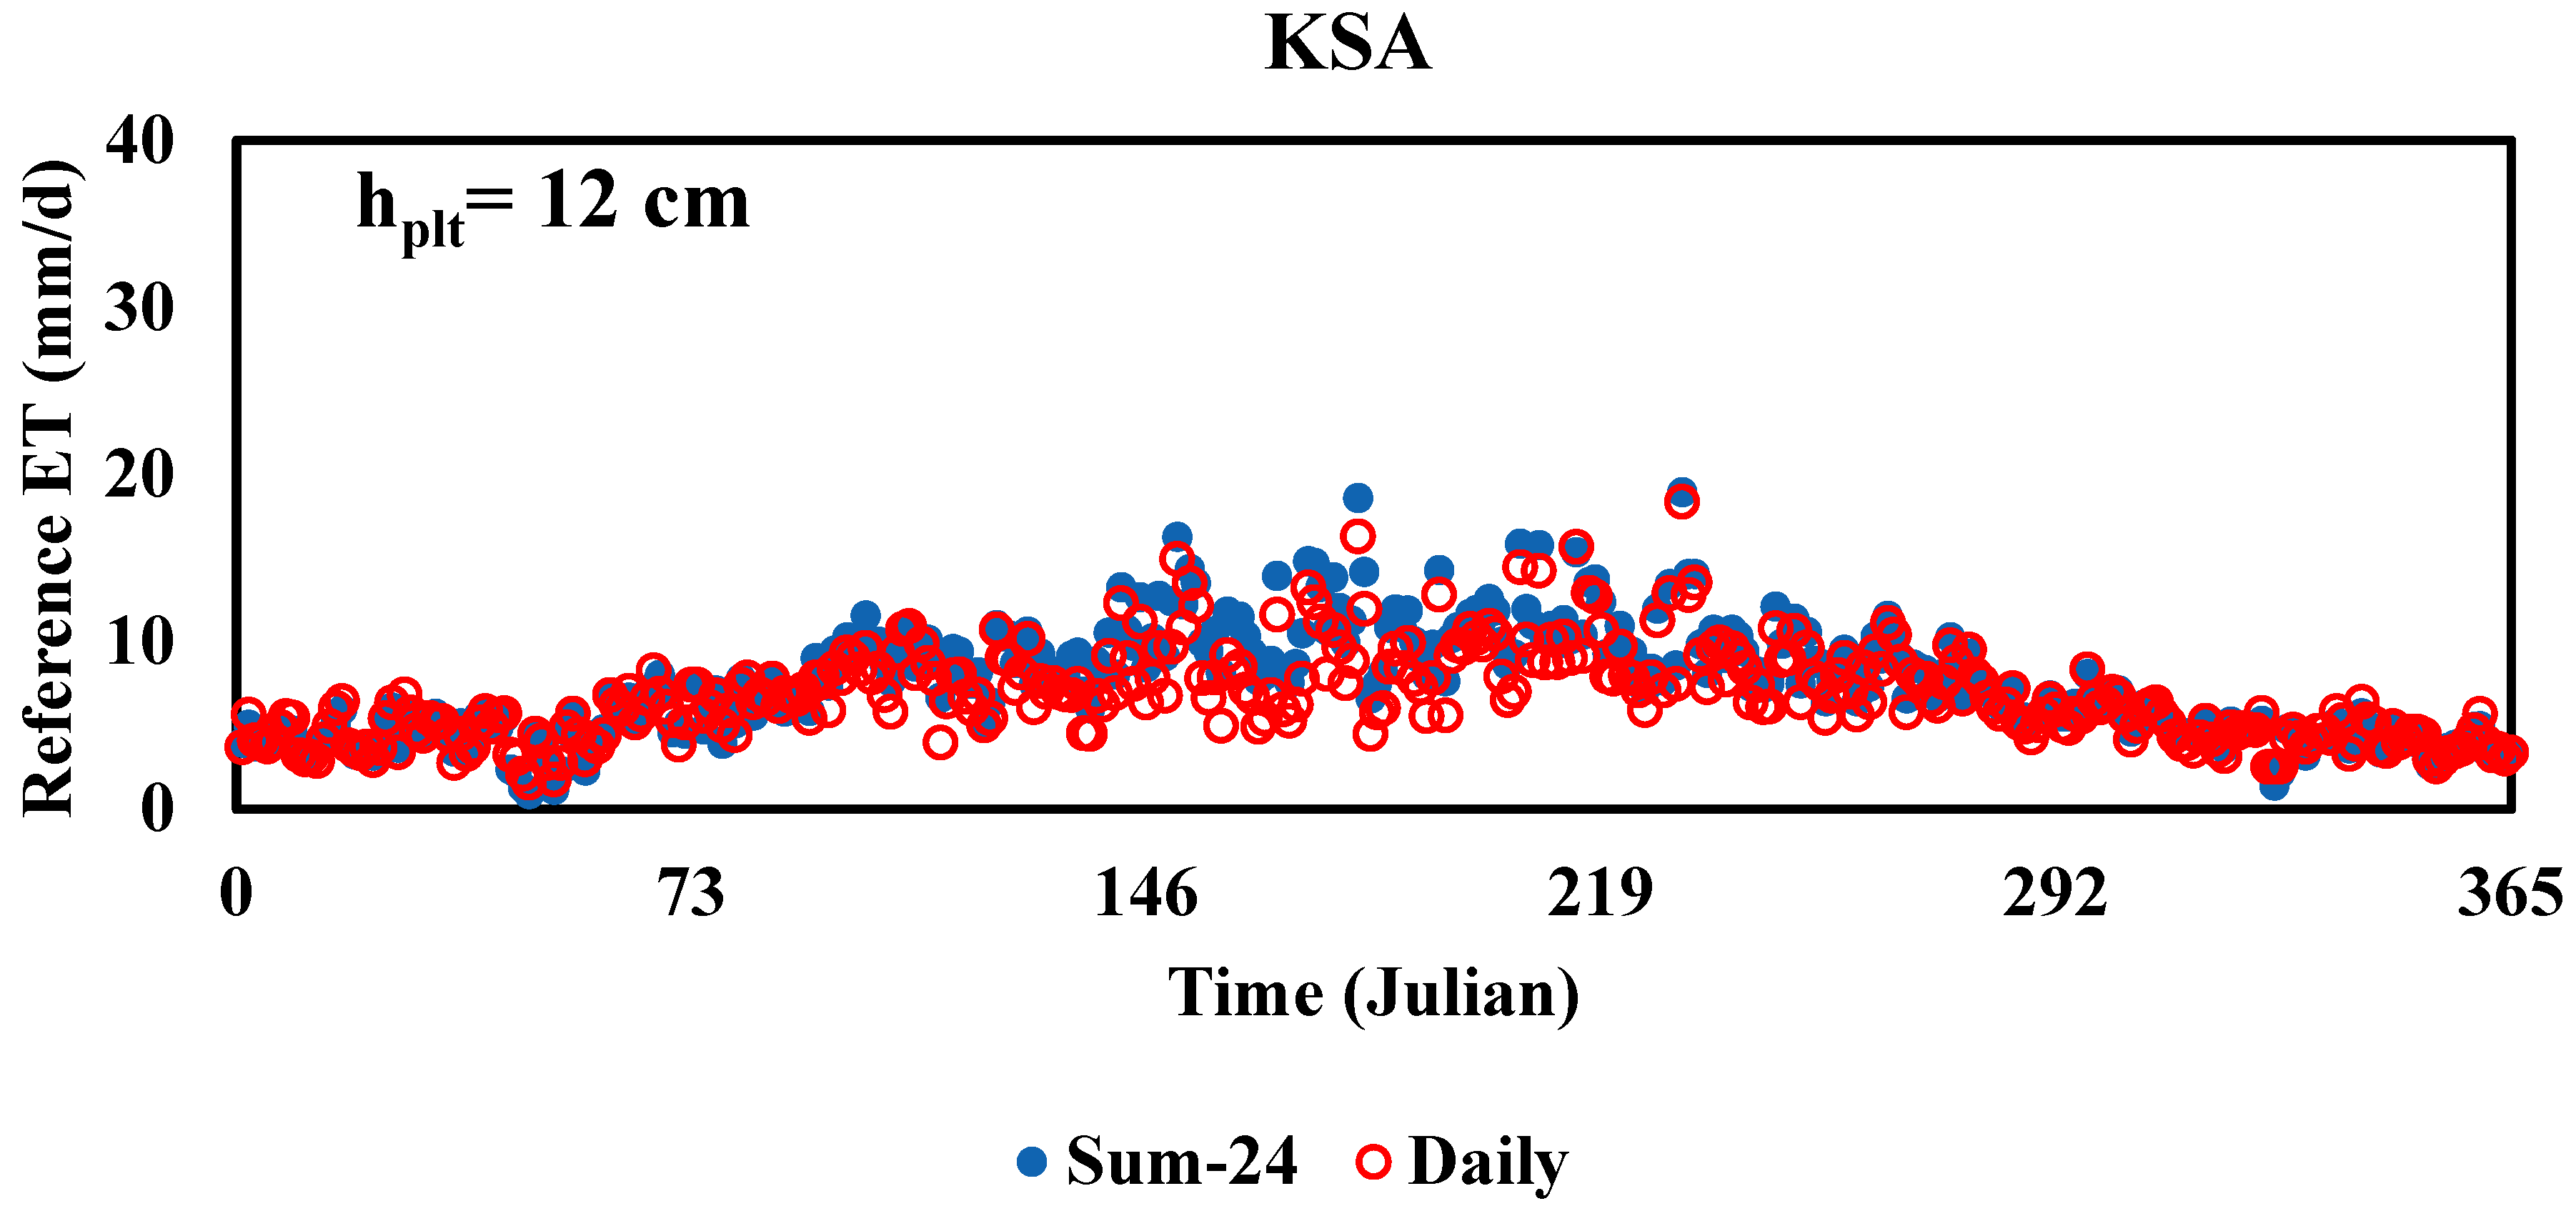
3.3.4. Daily ETref of KSA Model (hplt = 12 cm)
For shorter canopies, daily ET
ref consistently underestimates the sum of 24 h by 9–18% during summer (
Figure 19).
Table 11 mentions the normality tests that confirm non-normality (all
p < 0.0001). The pronounced bias at reduced plant height underscores the role of canopy structure in diurnal ET partitioning, which daily approximations fail to capture. For how sensitive the model is, taller canopies (KSA@ 50 cm) exhibit greater variability than shorter ones (KSA@ 12 cm). FAO’s robustness stems from its global calibration, while KSA variants show height-dependent discrepancies.
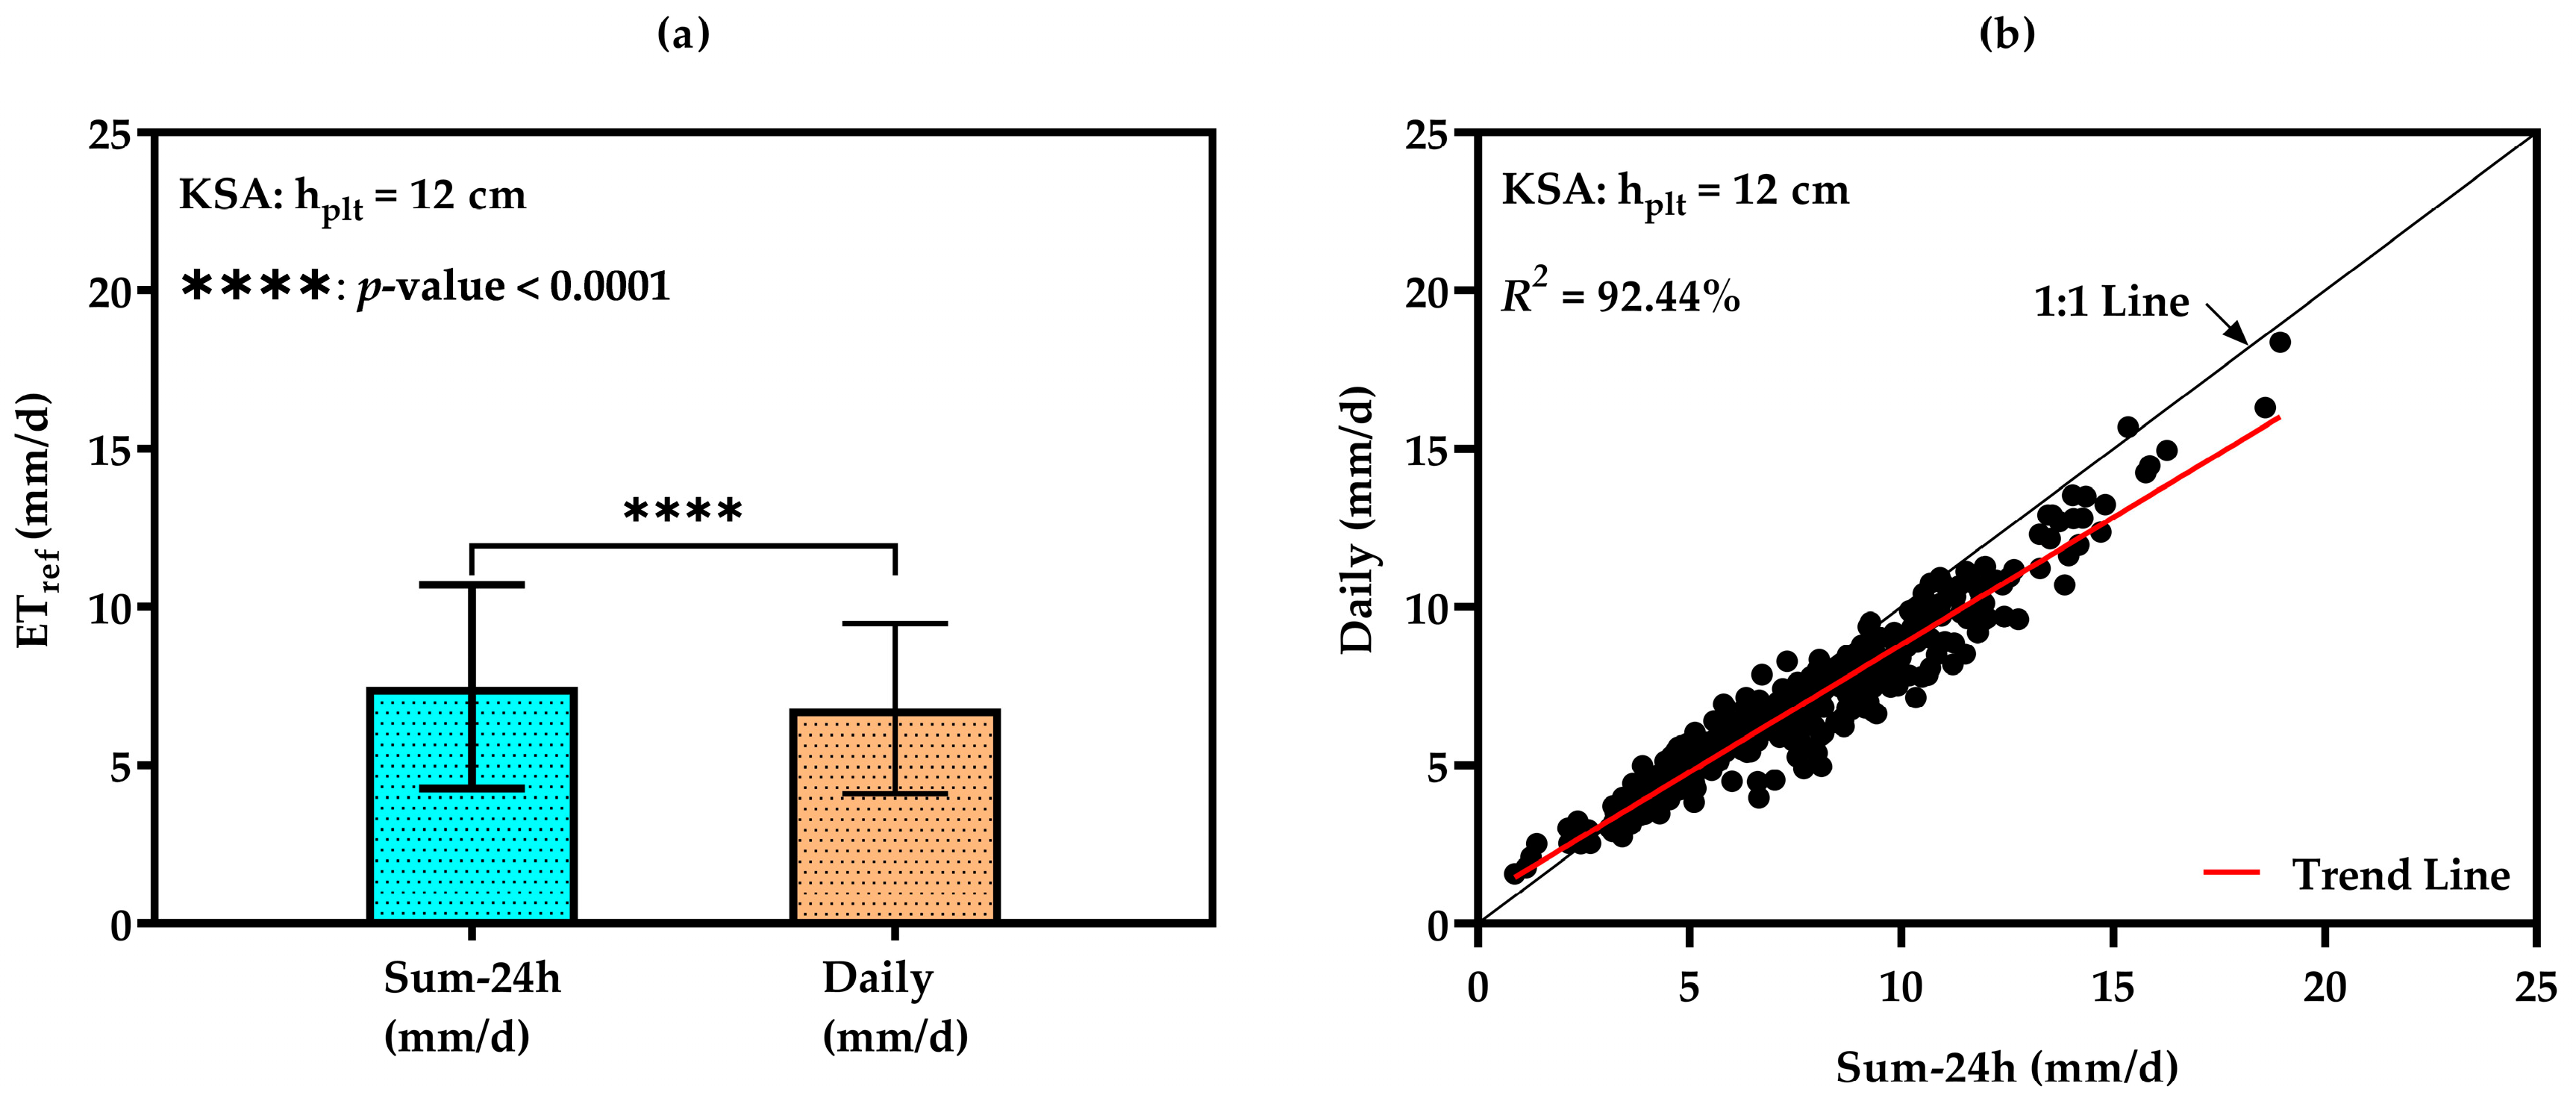
A comparative analysis was conducted between daily ET
ref values derived from the sum of 24 h estimates and those computed directly as daily values at a h
plt of 12 cm. The Wilcoxon signed-rank test (
Figure 20a) confirmed a statistically significant difference (
p < 0.0001), indicating that the two methods are not identically distributed. However, the high Pearson correlation coefficient (r = 0.96) and coefficient of determination (R
2 = 92.44%) demonstrate a strong linear relationship between the two datasets (
Figure 20b). Moreover, descriptive statistics reveal that the sum-24 h ET
ref has a slightly higher mean (7.48 mm/d) compared with the daily ET
ref (6.78 mm/d), with both methods showing similar variability (standard deviations of 3.22 and 2.70 mm/d, respectively).
The average bias of −0.67 mm/d indicates a consistent underestimation by the daily method. In the same context, model performance metrics further support the reliability of the daily ETref estimates. The Nash–Sutcliffe Efficiency (NSE = 0.86) suggests good predictive accuracy, while the Root Mean Square Error (RMSE = 1.19 mm/d) and Mean Absolute Error (MAE = 0.91 mm/d) are within acceptable limits. The Index of Agreement (d = 0.96) and Confidence Index (c = 0.92) confirm strong agreement and model reliability, where c could be classified as excellent.
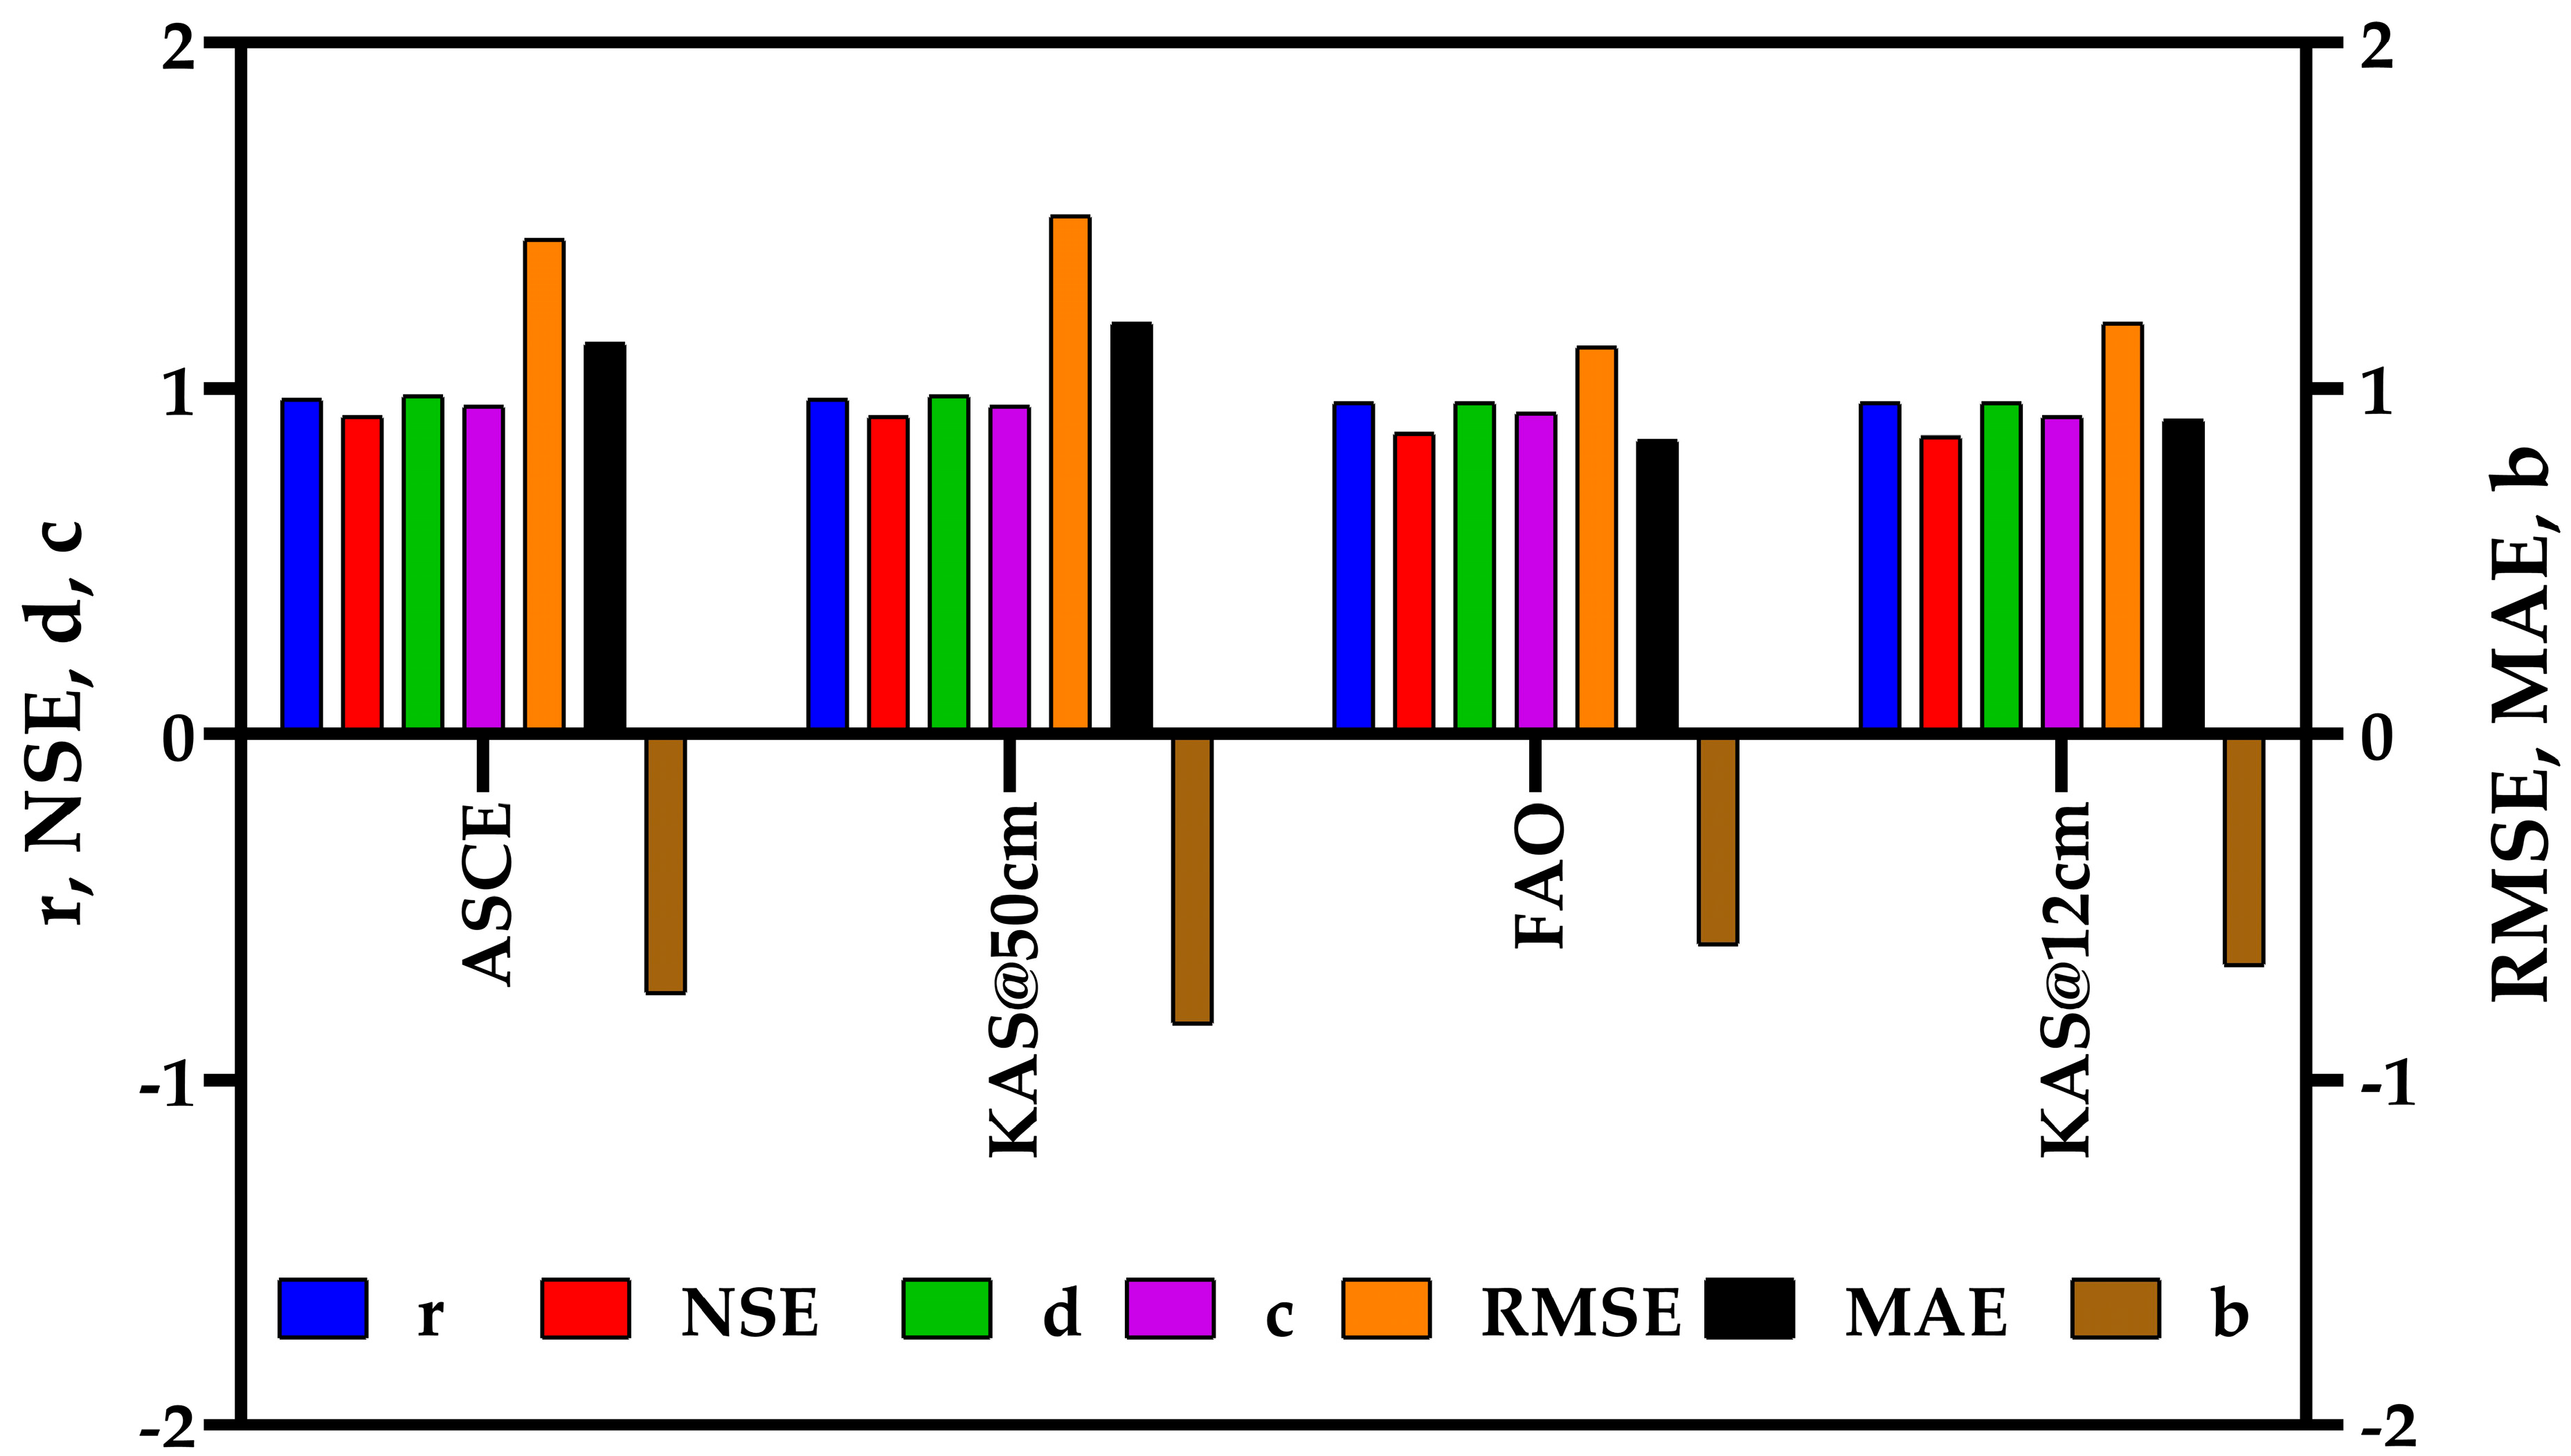
Figure 21 depicts a visual comparative bar chart illustrating the statistical performance metrics for the four reference ET mathematical models—ASCE, KSA at 50 cm, FAO, and KSA at 12 cm—based on paired daily ET estimates. These results confirm that the direct daily method, although computationally simpler, tends to smooth over intra-daily climatic variability, leading to underestimation, especially under arid or variable weather conditions common in the KSA region. These results confirm that while the two methods are statistically distinguishable, the daily reference ET estimates are sufficiently accurate and consistent for practical applications, especially when hourly data is unavailable. Consequently, the use of a sum-24 h reference ET is recommended for improved accuracy in hydrological modeling and irrigation planning.
Generally, using conventional daily reference ET as a proxy for sum-24 h ET introduces quantifiable, model-specific biases exacerbated by non-normal distributions. The ASCE and FAO models show the strongest correlations, but errors remain significant during seasonal extremes. For precise water resource management, direct hourly measurement is recommended over daily approximations. Future work should develop plant-height-specific correction factors to minimize scaling errors.
Practically, the underestimation of actual ET can lead to several important consequences, particularly in precision irrigation and water resource management. One major impact is under-irrigation, where underestimated plant water requirements may result in water stress, reduced yield, and diminished plant quality. Additionally, it can lead to inefficient water budgeting, causing supply deficits, especially in arid and semi-arid regions. The bias introduced in irrigation scheduling models may reduce soil moisture availability and negatively affect plant growth, particularly during peak ET periods. Furthermore, it may introduce a distortion in climate impact assessments, hindering accurate evaluation of changing water demands under climate variability. Lastly, it can create overconfidence in apparent water savings, falsely suggesting improvements in system efficiency or conservation outcomes.
3.4. Ratio of P–M Mathematical Models
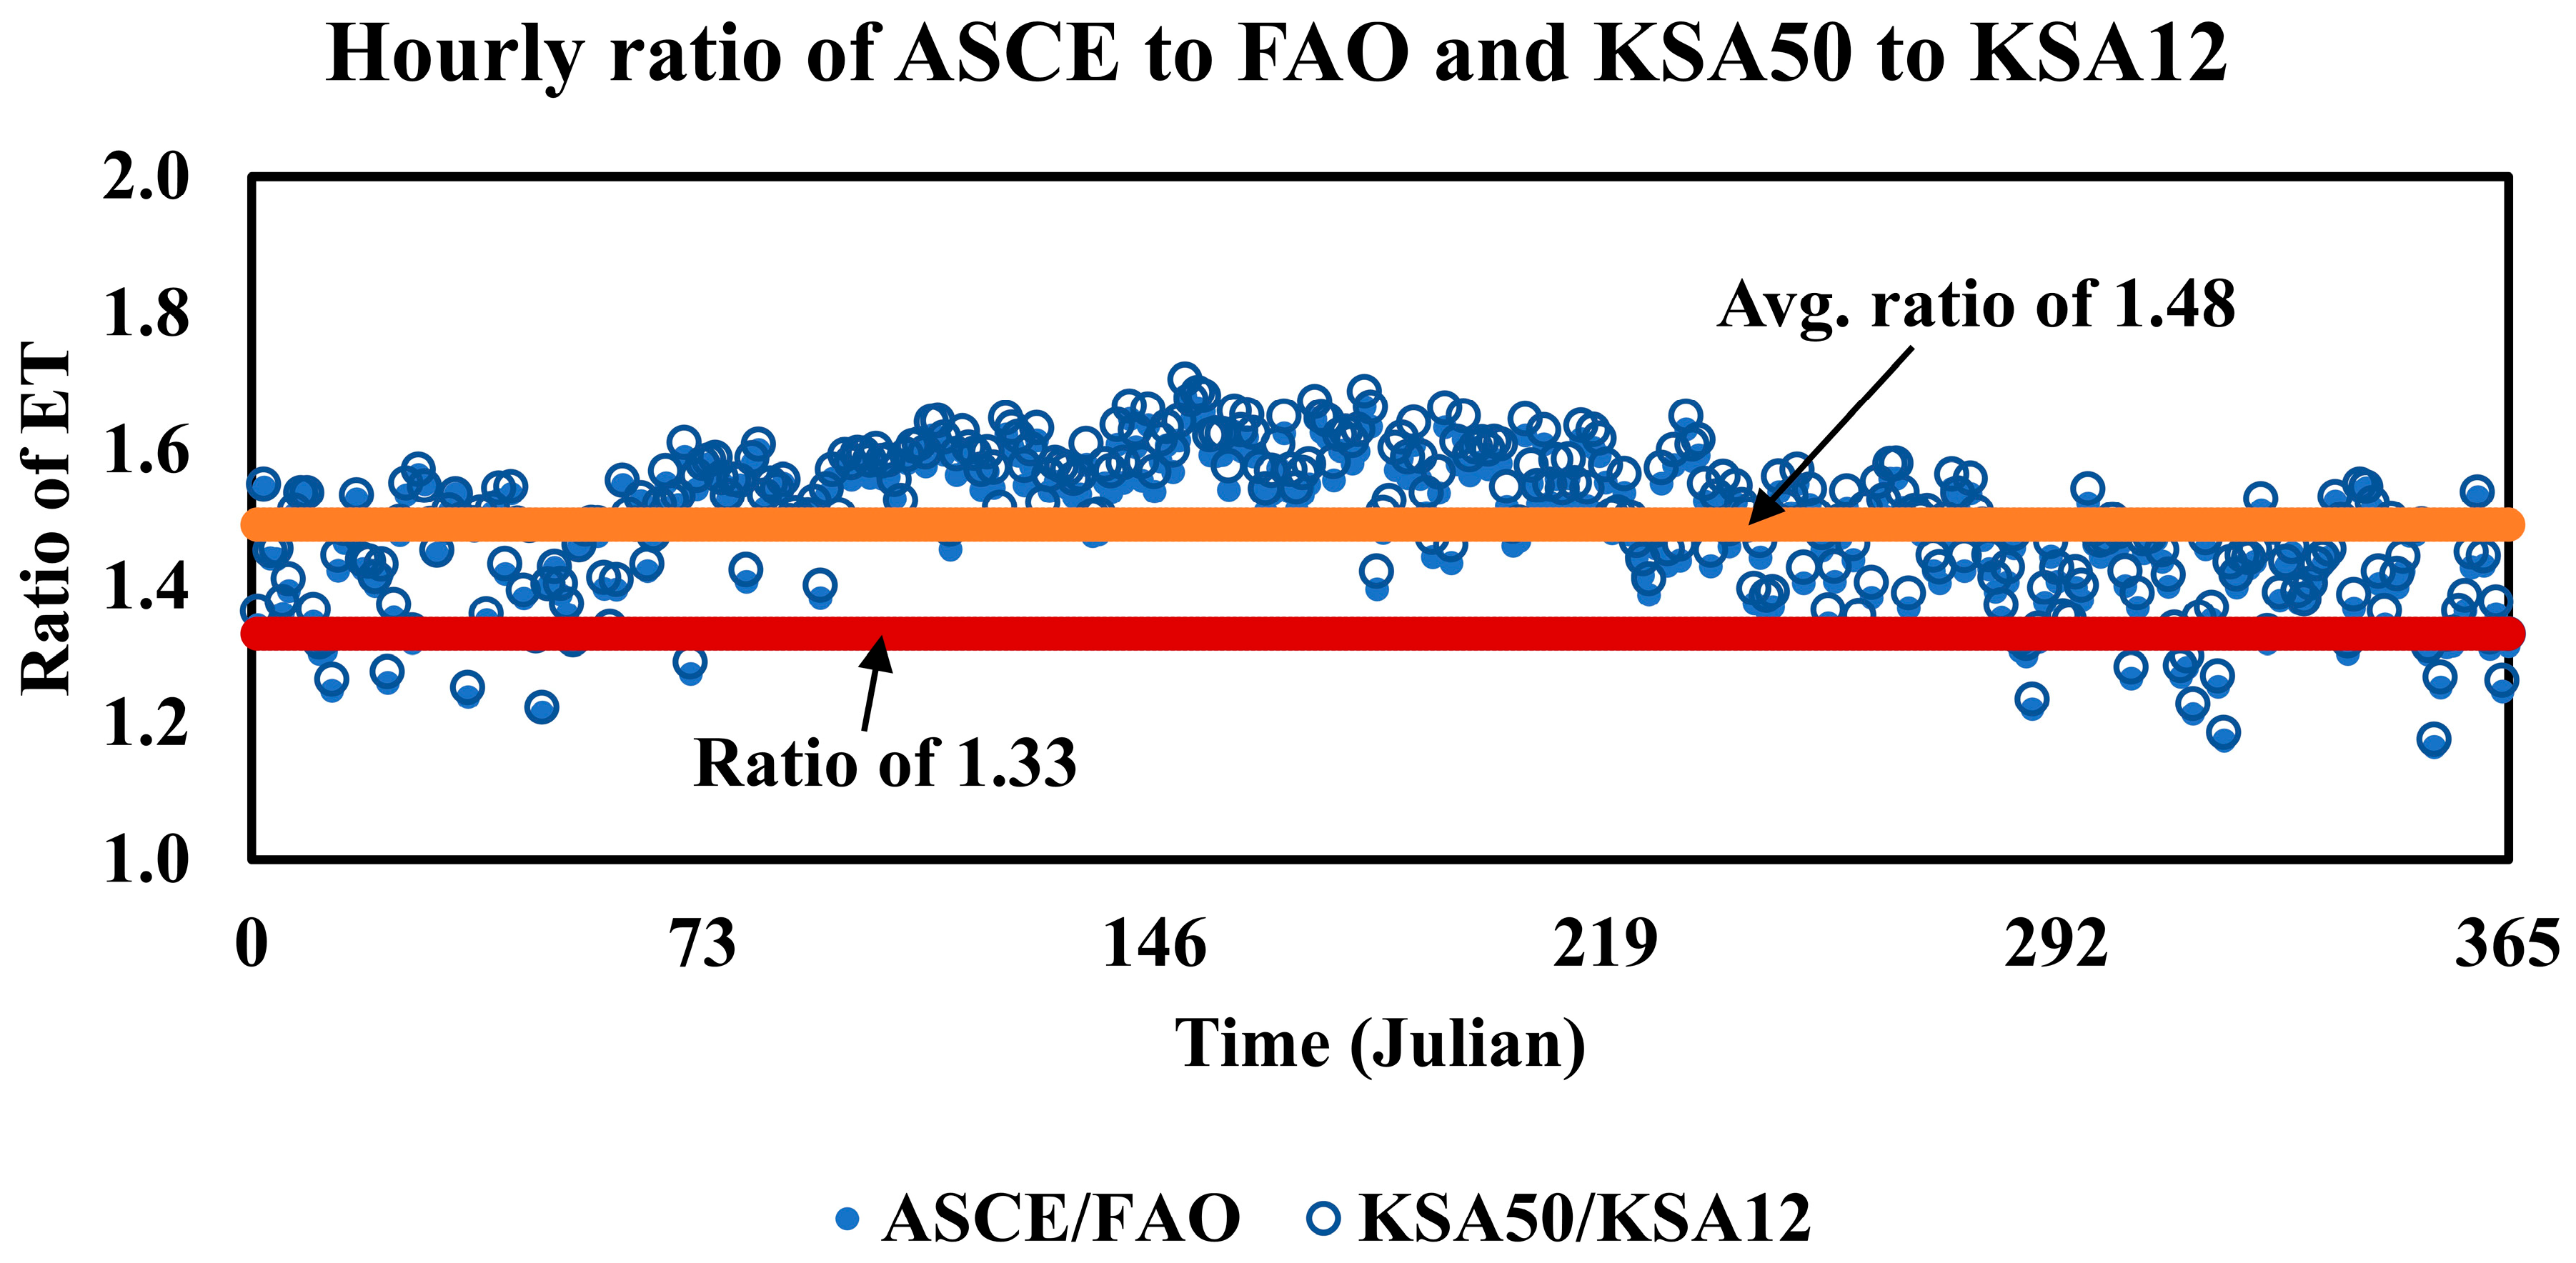
Figure 22 depicts the hourly dataset that provided a granular view of the comparative performance of the evapotranspiration models, revealing distinct patterns in the ratios of ASCE/FAO and KSA
50/ KSA
12. The overall mean ASCE/FAO ratio for hourly data across the entire year was approximately 1.472. This indicates that, on average, the ASCE-PM model estimated hourly ET rates that were approximately 47.2% higher than those estimated by the FAO PM model. A detailed examination of the hourly data revealed that the ASCE/FAO ratios exhibited a considerable range, from a minimum of approximately 1.248 (observed on Day 353, 19 December 2024) to a maximum of 1.674 (recorded on Day 70, 11 March 2024). This wide range indicates significant temporal variability in the relative performance of these two models throughout the year. The consistent ratio significantly greater than 1.0 throughout the year indicates a systematic bias, where the ASCE-PM model consistently estimated higher hourly evapotranspiration rates compared with the FAO PM model.
The overall mean KSA50/ KSA12 ratio for hourly data was approximately 1.483. This implies that the KSA model for a 50 cm plant height estimated hourly ET rates were, on average, 48.3% higher than those for a 12 cm plant height. The hourly ratios for KSA50/ KSA12 also demonstrated substantial variability, ranging from a minimum of approximately 1.257 (observed on Day 353, 19 December 2024) to a maximum of 1.687 (recorded on Day 70, 11 March 2024). This range is notably like that observed for the ASCE/FAO ratio.
The persistent ratio exceeding 1.0 reinforces the finding that the KSA model’s output is highly sensitive to the specified plant height, with taller canopies yielding higher estimated ET. As depicted in
Figure 22, the hourly ratios for both pairs of models exhibited clear temporal variability, suggesting that the discrepancies are not static but influenced by changing environmental conditions or seasonal patterns. The study demonstrated that, under arid climatic conditions, the hourly ratio of ASCE to FAO and KSA
50 to KSA
12 reached 1.48—exceeding the commonly cited ASCE reference ratio of 1.33 reported by Allen, Pereira [
26].
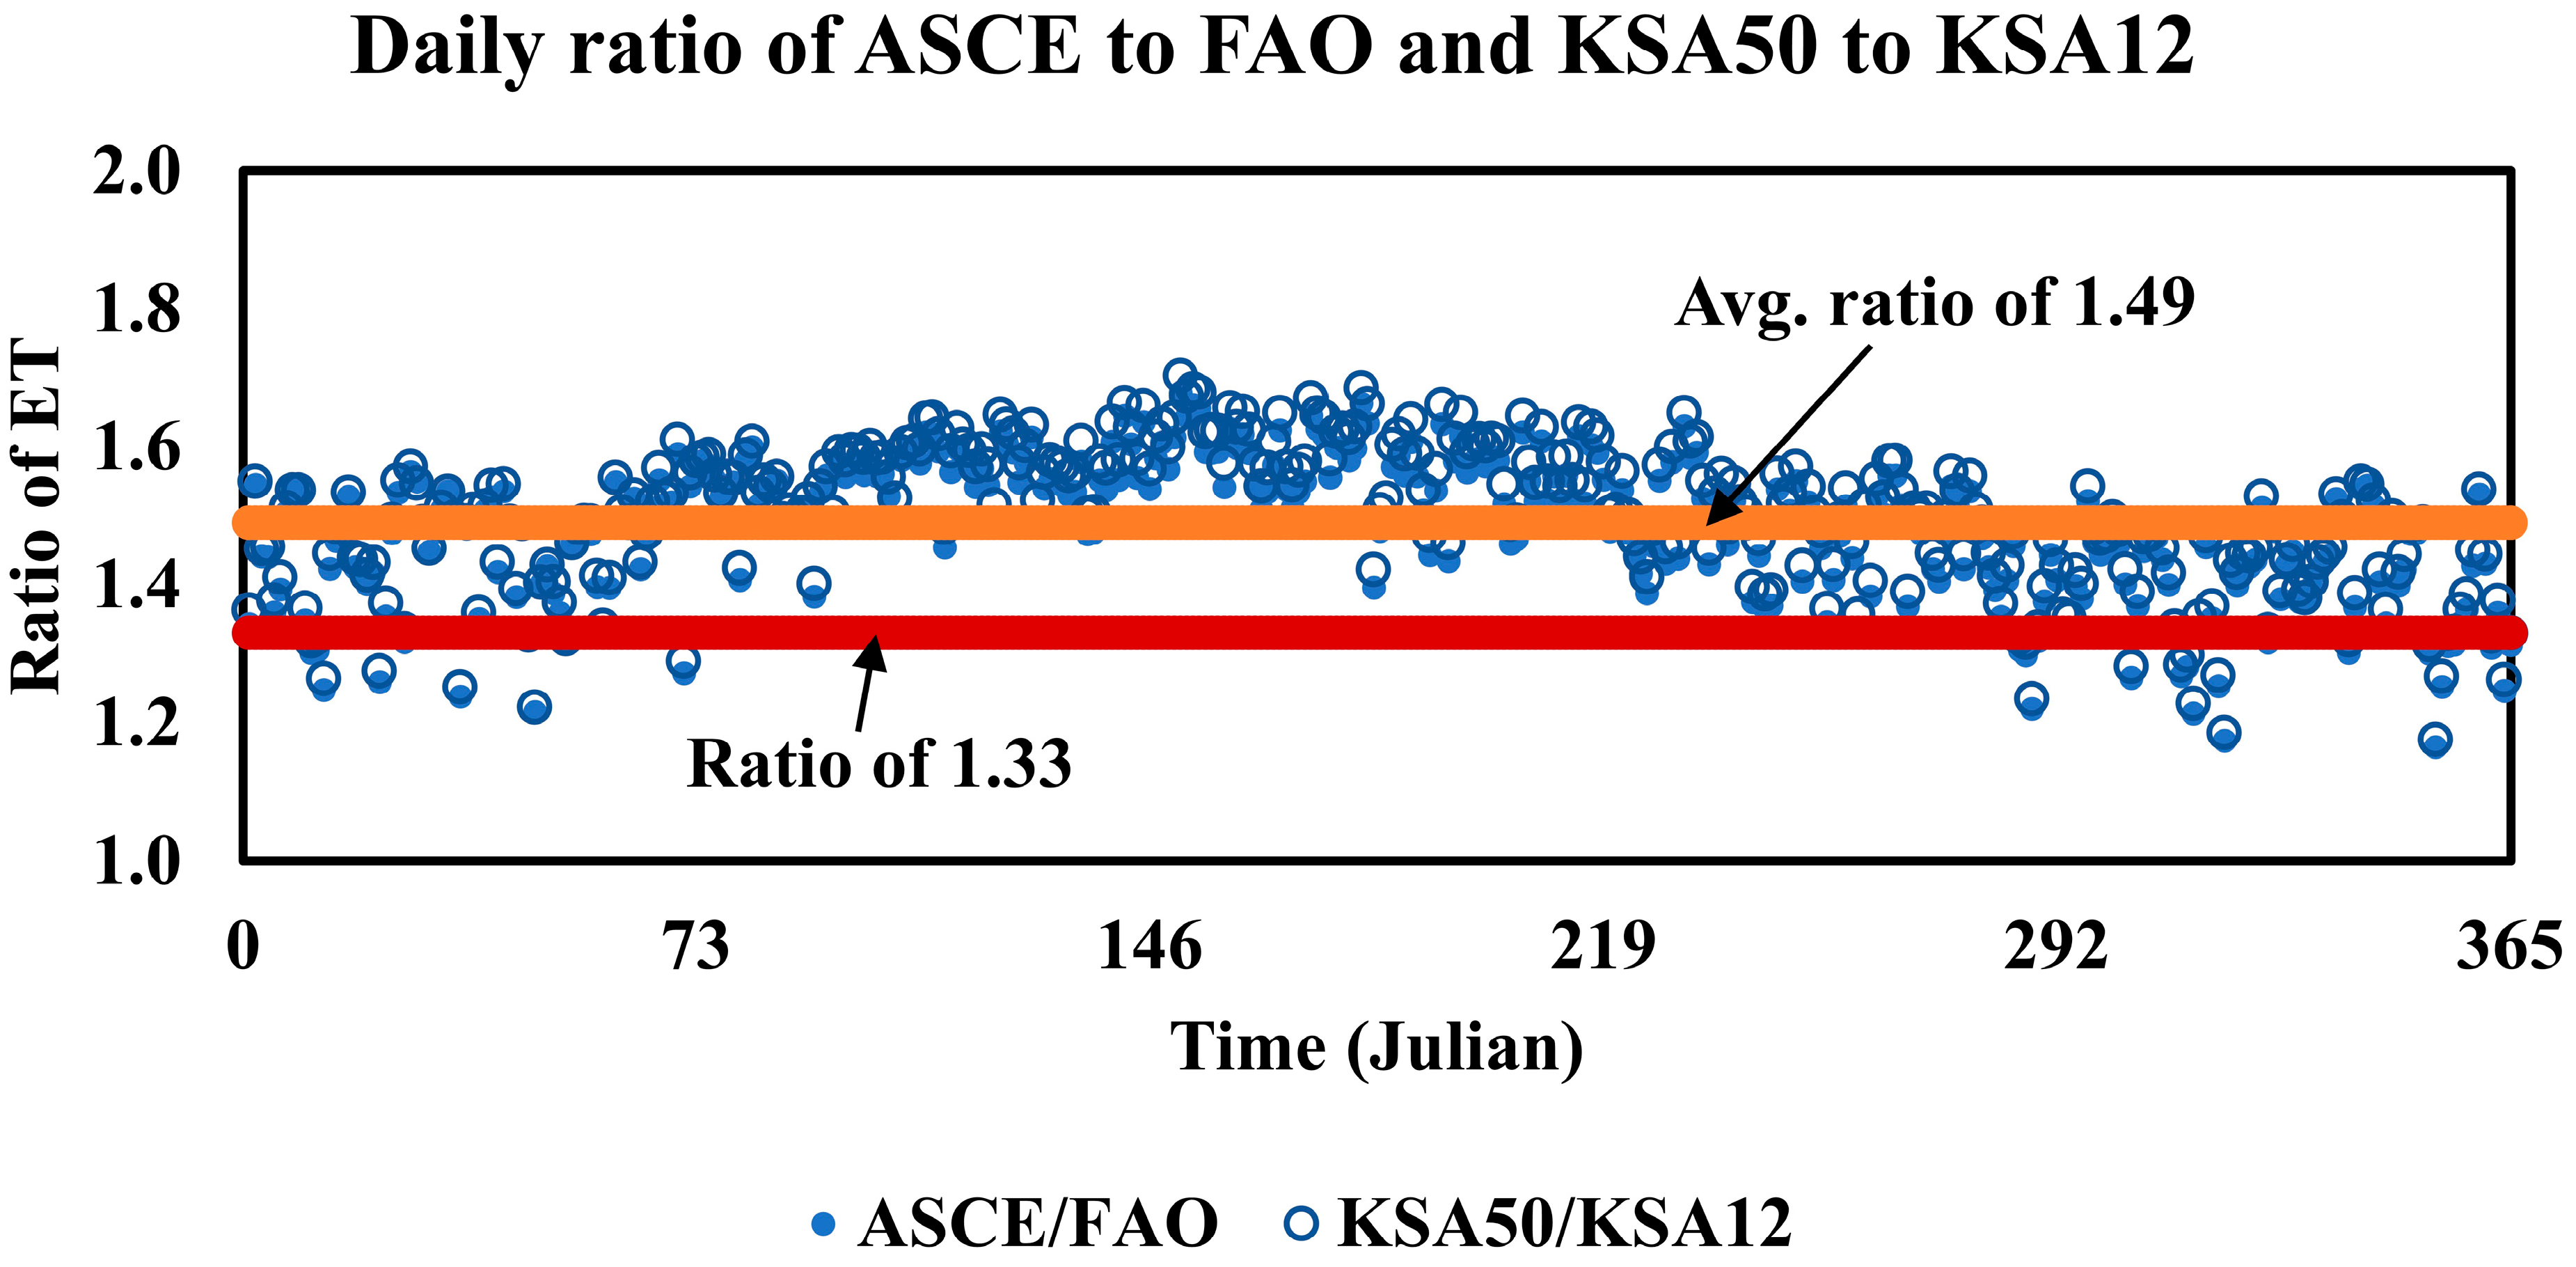
Figure 23 depicts the daily dataset that provided a broader temporal perspective on the comparative model performance, generally mirroring the trends observed in the hourly data but with potentially different magnitudes of variability due to aggregation effects. The overall mean ASCE/FAO ratio for daily data was approximately 1.483. This average is remarkably close to the hourly mean, suggesting a consistent systemic difference between ASCE-PM and FAO PM regardless of temporal aggregation. The daily data showed the ASCE/FAO ratios ranging from a minimum of approximately 1.165 (observed on Day 353, 19 December 2024) to a maximum of 1.678 (recorded on Day 151, 31 May 2024). This range is also substantial, indicating daily fluctuations in relative model performance. The consistent daily ratio significantly above 1.0 confirms the systematic tendency of the ASCE-PM model to estimate higher daily evapotranspiration rates compared with the FAO PM model.
The overall mean KSA
50/ KSA
12 ratio for daily data was approximately 1.503. This average is slightly higher than the hourly mean for the same ratio, indicating that the KSA model for a 50 cm plant height consistently estimated daily ET rates that were approximately 50.3% higher than those for a 12 cm plant height. The daily ratios for KSA
50/ KSA
12 ranged from a minimum of approximately 1.175 (observed on Day 353, 19 December 2024) to a maximum of 1.703 (recorded on Day 151, 31 May 2024). This range is consistent with the hourly observations, reaffirming the strong influence of plant height within the KSA framework. The sustained ratio greater than 1.0 reinforces the direct relationship between plant height and estimated ET within the KSA models. As illustrated in
Figure 23, the daily ratios also exhibited temporal fluctuations. The study revealed that, under arid climatic conditions, the daily ratio of ASCE to FAO and KSA
50 to KSA
12 reached 1.49, surpassing the commonly referenced ASCE ratio of 1.33, as reported by Fitriani, Bowo [
56].
3.5. Study Limitations
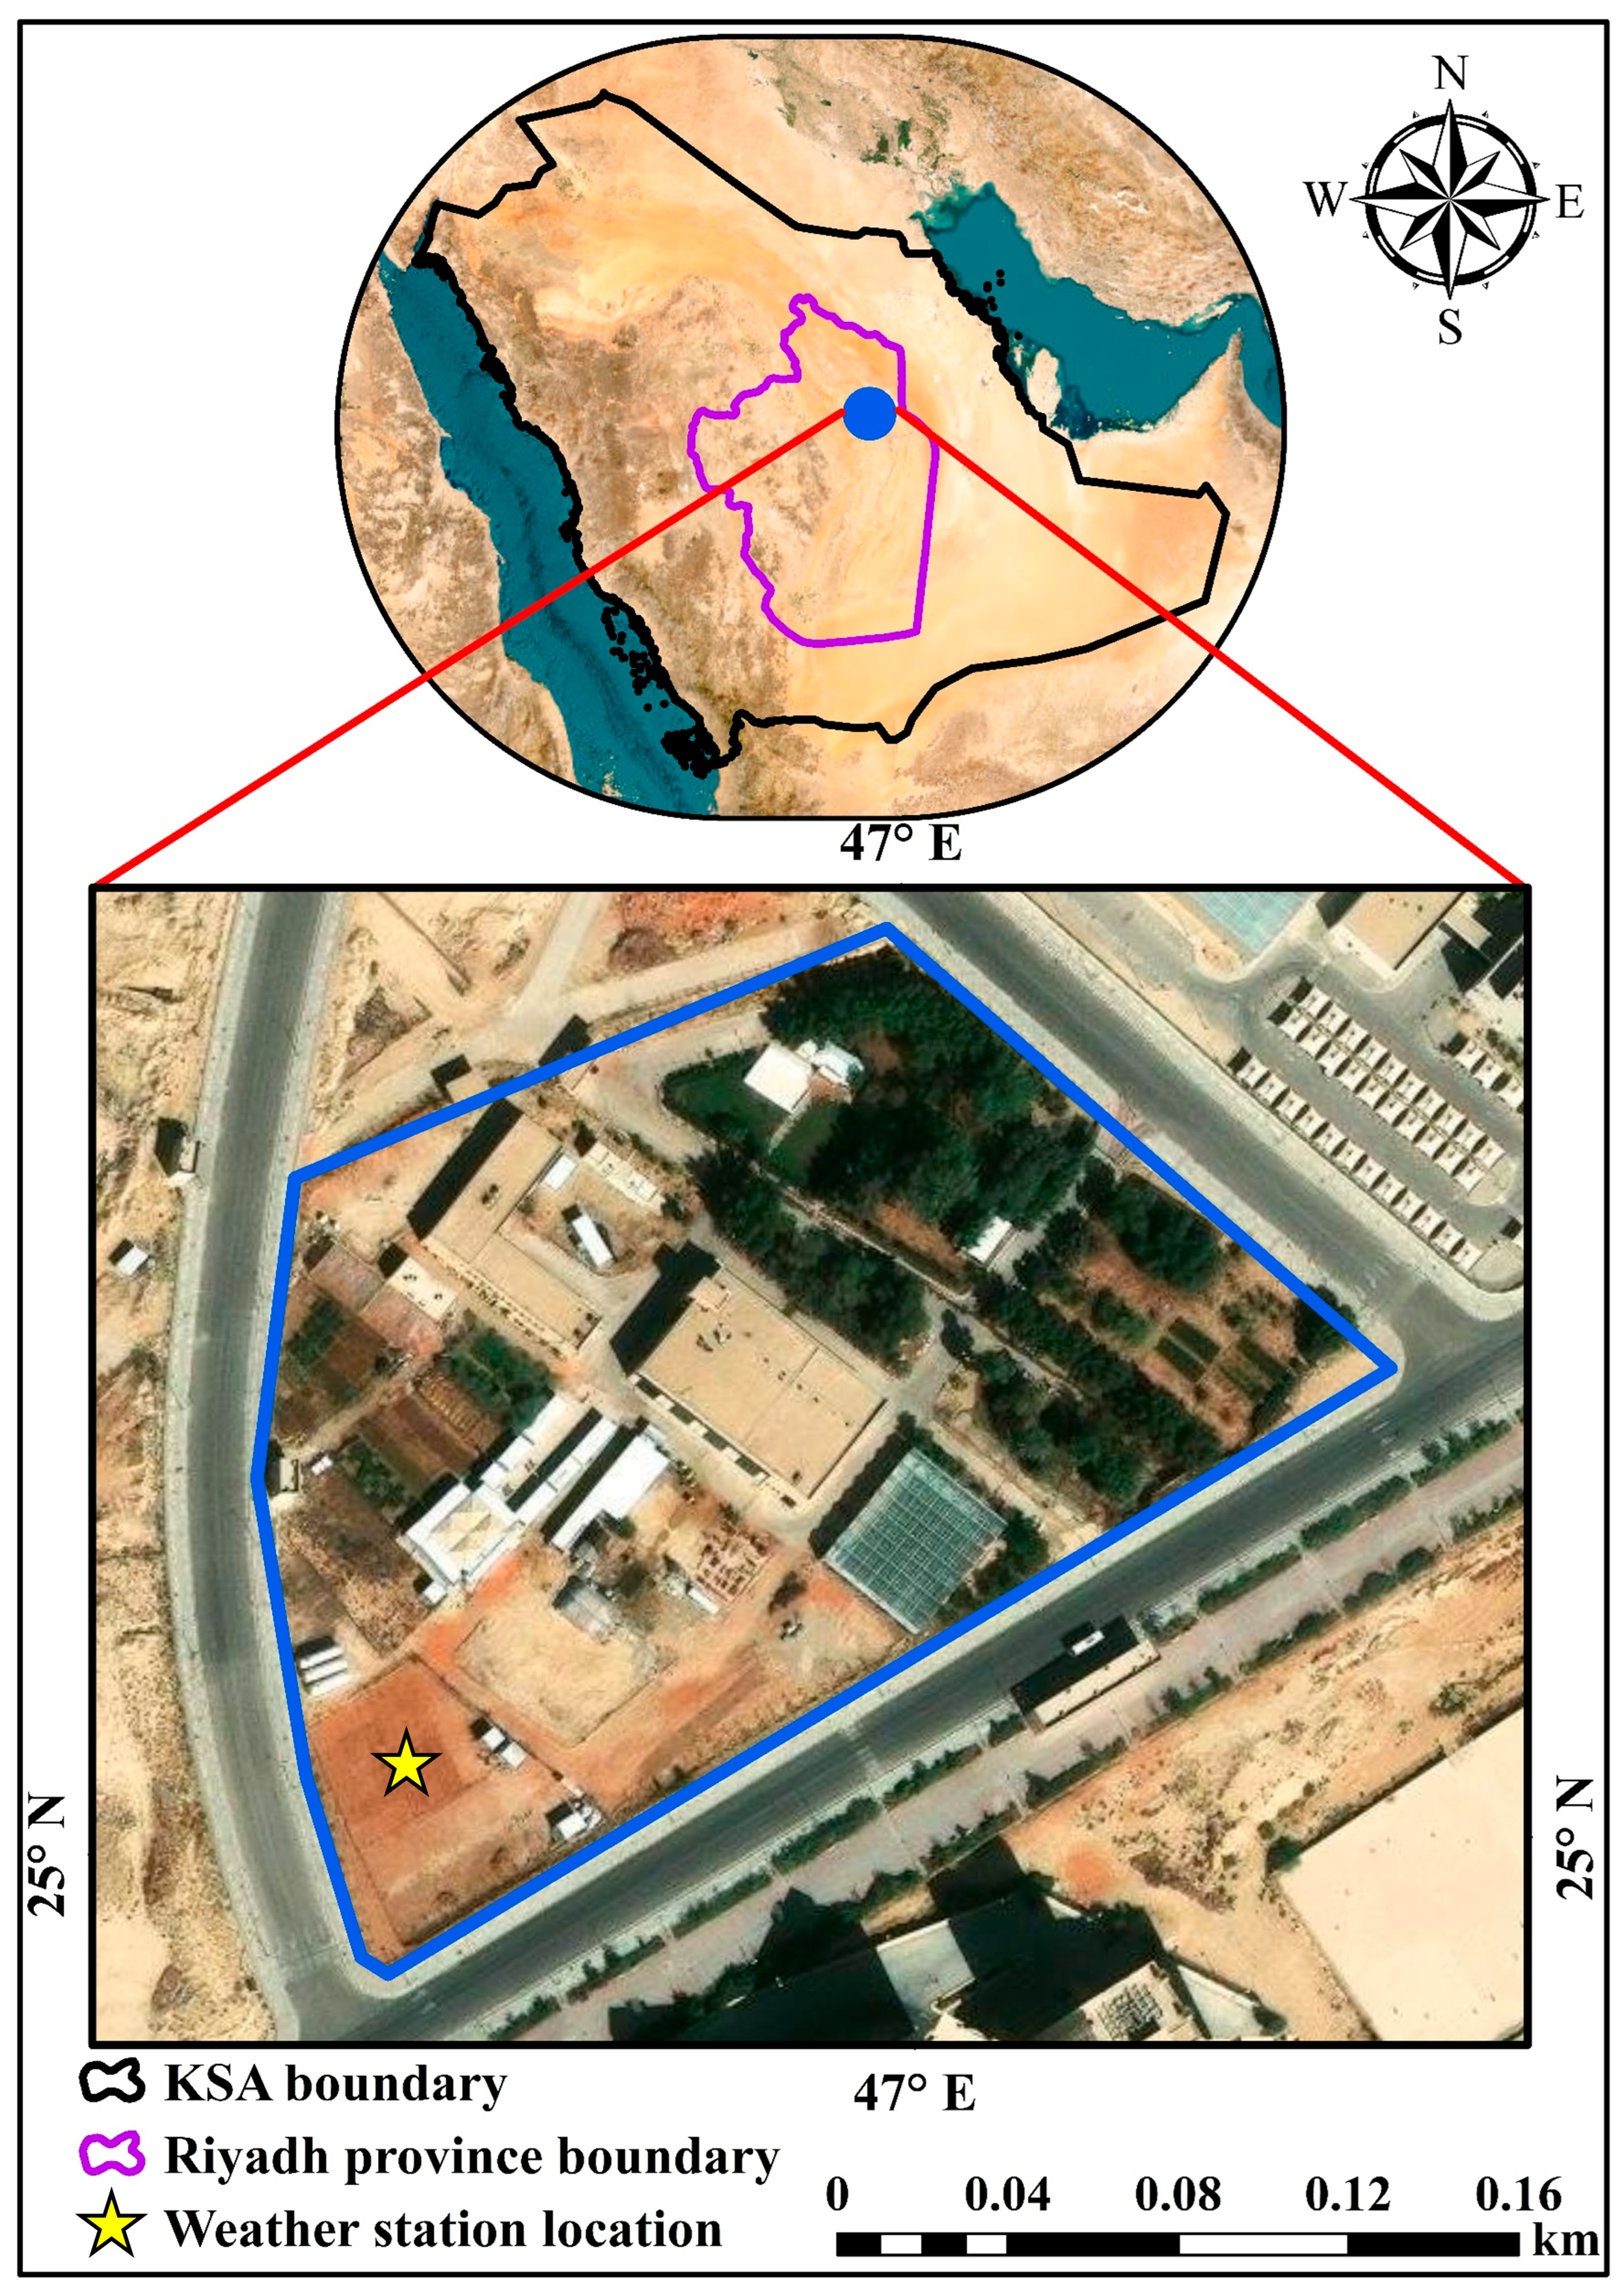
This study is subject to several limitations. The study excludes field reference ET data obtained directly through methods such as lysimeters or soil water balance. This comparison is restricted to three mathematical formulations of the Penman–Monteith (P–M) equation: the ASCE, FAO, and KSA forms. The results illustrate the distinctions among these models rather than their accuracy in representing actual ET rates. All three models examined in this study are variations of the indirect Penman–Monteith method, indicating the presence of inherent uncertainties in the estimates. The data collected over five years was recorded every minute; however, the analysis focused solely on weather data from a single weather station in Riyadh, Saudi Arabia, characterized by its extremely dry climate. The results may not be generalizable to other locations or climates. The spatial limitation reduces the applicability of the study’s conclusions in other regions, particularly where hydrometeorological conditions differ significantly. It is essential to acknowledge that mathematical models such as Penman–Monteith possess specific data requirements. These models require extensive and precise weather data, which may be difficult to obtain in certain regions. Further studies may focus on expanding to additional arid and/or humid regions, integrating remote sensing data, or developing model-specific correction algorithms to mitigate biases, particularly for various plant heights.
4. Conclusions
The analysis of climatic parameters in this study was based on a high-resolution meteorological dataset obtained from the weather station that provided minutely records of key atmospheric variables, including solar radiation (RS), relative humidity (RH), wind speed at 2 m (U2), air temperature (T), and rainfall, spanning a full calendar year. Reference ET was computed using three universal mathematical models—ASCE, FAO at 50 and 12 cm reference plant, and KSA. Calculations were performed at multiple temporal resolutions—hourly, hourly averaged over 24 h, daily, and daily as the sum of 24-hourly values—to assess the sensitivity and consistency of reference ET estimates across different time scales. For hourly ET investigation, the findings emphasize that although daily/24 calculations offer operational simplicity, they may suppress diurnal variability and lead to consistent underestimation, particularly under fluctuating climatic conditions. Consequently, for precision applications such as real-time irrigation scheduling or high-resolution hydrological modeling, the use of hourly-based ET is recommended for improved accuracy. For daily ET investigation, the results confirm that the direct daily method, although computationally simpler, tends to smooth over intra-daily climatic variability, leading to underestimation, especially under arid or variable weather conditions common in the KSA region. Consequently, the use of sum-24 h reference ET is recommended for improved accuracy in hydrological modeling and irrigation planning. For practical applications, the daily reference ET estimates are sufficiently accurate and consistent, especially when hourly data are unavailable.
This study offers several contributions to the field of reference ET modeling. The study initially compares the P–M ASCE, P–M FAO, and P–M KSA formulations utilizing hourly meteorological data in hyper-arid conditions. This identifies transient atmospheric variations often overlooked in analyses focused on daily data. Secondly, it encompasses a systematic assessment of the model’s sensitivity to hplt, a parameter frequently established in conventional studies. This enables the execution of more realistic simulations across a broader range of diverse agricultural applications. This study examines the accuracy of daily reference ET derived from hourly reference ET data. This provides insights into the accumulation of errors over time and their impact on the three models. These contributions address a significant gap in understanding by validating reference ET models in arid climates through a high-resolution temporal framework and contextualized agronomic parameters. This will enhance irrigation scheduling and water resource planning in arid and hyper-arid regions such as Saudi Arabia. Moreover, it contributes to the growing body of literature emphasizing the importance of high-frequency meteorological data for improving ET estimation accuracy in arid and semi-arid regions.


 ,
, 


