Article

Study on Solid-Liquid Two-Phase Flow and Wear Characteristics in Multistage Centrifugal Pumps Based on the Euler-Lagrange Approach

College of Hydraulic Science and Engineering, Yangzhou University, Yangzhou 225009, China
*
Author to whom correspondence should be addressed.
Water 2025, 17(15), 2271; https://doi.org/10.3390/w17152271
Submission received: 27 June 2025 / Revised: 28 July 2025 / Accepted: 29 July 2025 / Published: 30 July 2025

Abstract

Multistage centrifugal pumps, owing to their high head characteristics, are commonly applied in domains like subsea resource exploitation and groundwater extraction. However, the wear of flow passage components caused by solid particles in the fluid severely threatens equipment lifespan and system safety. To investigate the influence of solid-liquid two-phase flow on pump performance and wear, this study conducted numerical simulations of the solid-liquid two-phase flow within multistage centrifugal pumps based on the Euler–Lagrange approach and the Tabakoff wear model. The simulation results showed good agreement with experimental data. Under the design operating condition, compared to the clear water condition, the efficiency under the solid-liquid two-phase flow condition decreased by 1.64%, and the head coefficient decreased by 0.13. As the flow rate increases, particle momentum increases, the particle Stokes number increases, inertial forces are enhanced, and the coupling effect with the fluid weakens, leading to an increased impact intensity on flow passage components. This results in a gradual increase in the wear area of the impeller front shroud, back shroud, pressure side, and the peripheral casing. Under the same flow rate condition, when particles enter the pump chamber of a subsequent stage from a preceding stage, the fluid, after being rectified by the return guide vane, exhibits a more uniform flow pattern and reduced turbulence intensity. The particle Stokes number in the subsequent stage is smaller than that in the preceding stage, weakening inertial effects and enhancing the coupling effect with the fluid. This leads to a reduced impact intensity on flow passage components, resulting in a smaller wear area of these components in the subsequent stage compared to the preceding stage. This research offers critical theoretical foundations and practical guidelines for developing wear-resistant multistage centrifugal pumps in solid-liquid two-phase flow applications, with direct implications for extending service life and optimizing hydraulic performance.

1. Introduction

Multistage centrifugal pumps are pivotal components in fluid conveying systems, and their performance directly dictates the performance and operational reliability of the entire system [1,2]. They find extensive application in various scenarios, including deep-sea mining, groundwater extraction, and agricultural irrigation and drainage [3]. However, in practical applications, the continuous impact and cutting action of numerous solid particles within the fluid against flow passage components stand as the primary cause of wear and deformation under long-term operation, severely threatening equipment lifespan and system safety [4,5]. Therefore, an in-depth investigation into the wear mechanisms and patterns under varying discharge conditions in the pump system is of great significance for optimizing designs to enhance its wear resistance.
Researchers have conducted extensive studies on the factors influencing the hydraulic function of multistage centrifugal pumps [6,7]. Wang et al. [8] analyzed various energy losses within multistage centrifugal pumps. Liu et al. [9] established that impeller-diffuser interaction and multiphase flow morphology principally influence flow field fluctuations in multistage centrifugal pumps. Maleki et al. [10] investigated the influence of liquid viscous properties on the flow domain of multistage centrifugal pumps, discovering that an increase in viscosity leads to a shift in the pump’s best efficiency point. Pugliese et al. [11] explored how the number of stages affects the hydraulic performance of multistage centrifugal pumps. Zhai et al. [12] identified backflow, jet-wake flow, and rotor-stator interaction fluid behavior as dominant influences on energy loss and hydraulic performance degradation in pumping systems. Gu et al. [13] found that the axial oscillation frequency of floating impellers periodically impacts the efficiency and head coefficient of multistage centrifugal pumps. Sampedro et al. [14] studied the implementation of multistage centrifugal pumping devices integrated with compressed air reservoirs. Xu et al. [15] analyzed the effects of blade wrap angles on the internal flow field of a multistage centrifugal pump running in reverse as a turbine. Gu et al. [16] analyzed the impact of floating impellers on the hydraulic performance of multistage centrifugal pumps under conditions of damaged sealing gaskets. To enhance the hydraulic performance of multistage centrifugal pumps, Ping et al. [17] introduced machine learning and hybrid algorithms to predict and optimize pump efficiency and head under all operating conditions. Wu et al. [18] developed an integrated design optimization framework incorporating design of experiments algorithms, which effectively improves the efficiency and head of multistage centrifugal pumps. Zhao et al. [19] innovatively redesigned blades based on neural network models and inverse design methods to maximize the efficiency of multistage centrifugal pumps and reduce hydraulic losses. In summary, substantial progress has been made in existing research on the factors influencing the hydraulic performance of multistage centrifugal pumps, but their analysis objects have primarily been limited to clear water media. This presents challenges for comprehensively understanding and predicting their actual operating characteristics and potential issues in solid-liquid two-phase flow.
Regarding the issues of solid particle motion in pumps and the wear it causes, researchers have conducted extensive studies [20,21]. Dong et al. [22] discovered that the presence of solid particles in centrifugal pumps leads to significant changes in head, efficiency, and shaft power. Shen et al. [23] assessed the influence of particle diameter, shape, and concentration on pump performance. Peng et al. [24] employed the Euler–Lagrange method to simulate solid-liquid two-phase flow in pumps under different particle volume concentrations, with results indicating that as particle volumetric fraction rises, both pump head and efficiency decrease. Beyond affecting the hydraulic performance of pumps, the physical properties of solid particles also exert a non-negligible influence on the formation and development of wear mechanisms [25,26]. Zhao et al. [27] investigated the significant impact of particle sharpness on pump wear. Mendi et al. [28] discovered that as particle volumetric fraction rises, the wear rate of blades gradually increases. Pu et al. [29] utilized a two-way coupling method to analysis the effect of particle density on the wear characteristics of solid-liquid two-phase flow within pumps, showing that as particle density increases, the wear on centrifugal pump walls correspondingly intensifies. The wear characteristics of pumps are not only dependent on the physical attributes of solid particles but are also significantly influenced by their operating conditions [30,31]. Wang et al. [32] used numerical simulation methods to study the wear characteristics of solid-liquid two-phase flow in pumps under flow separation regimes, with findings revealing that as the degree of stall increases, the wear rate in the impeller gradually decreases. Pan et al. [33] simulated solid-liquid two-phase flow under various pump and turbine operating conditions, finding that the runner/impeller is the component most susceptible to wear. Although existing research has achieved significant results concerning the impact of particle parameters or different operating conditions on pump wear, a systematic elucidation of the wear characteristics of various key components in multistage centrifugal pumps under different flow rate conditions, and their differential evolution mechanisms, is still lacking.
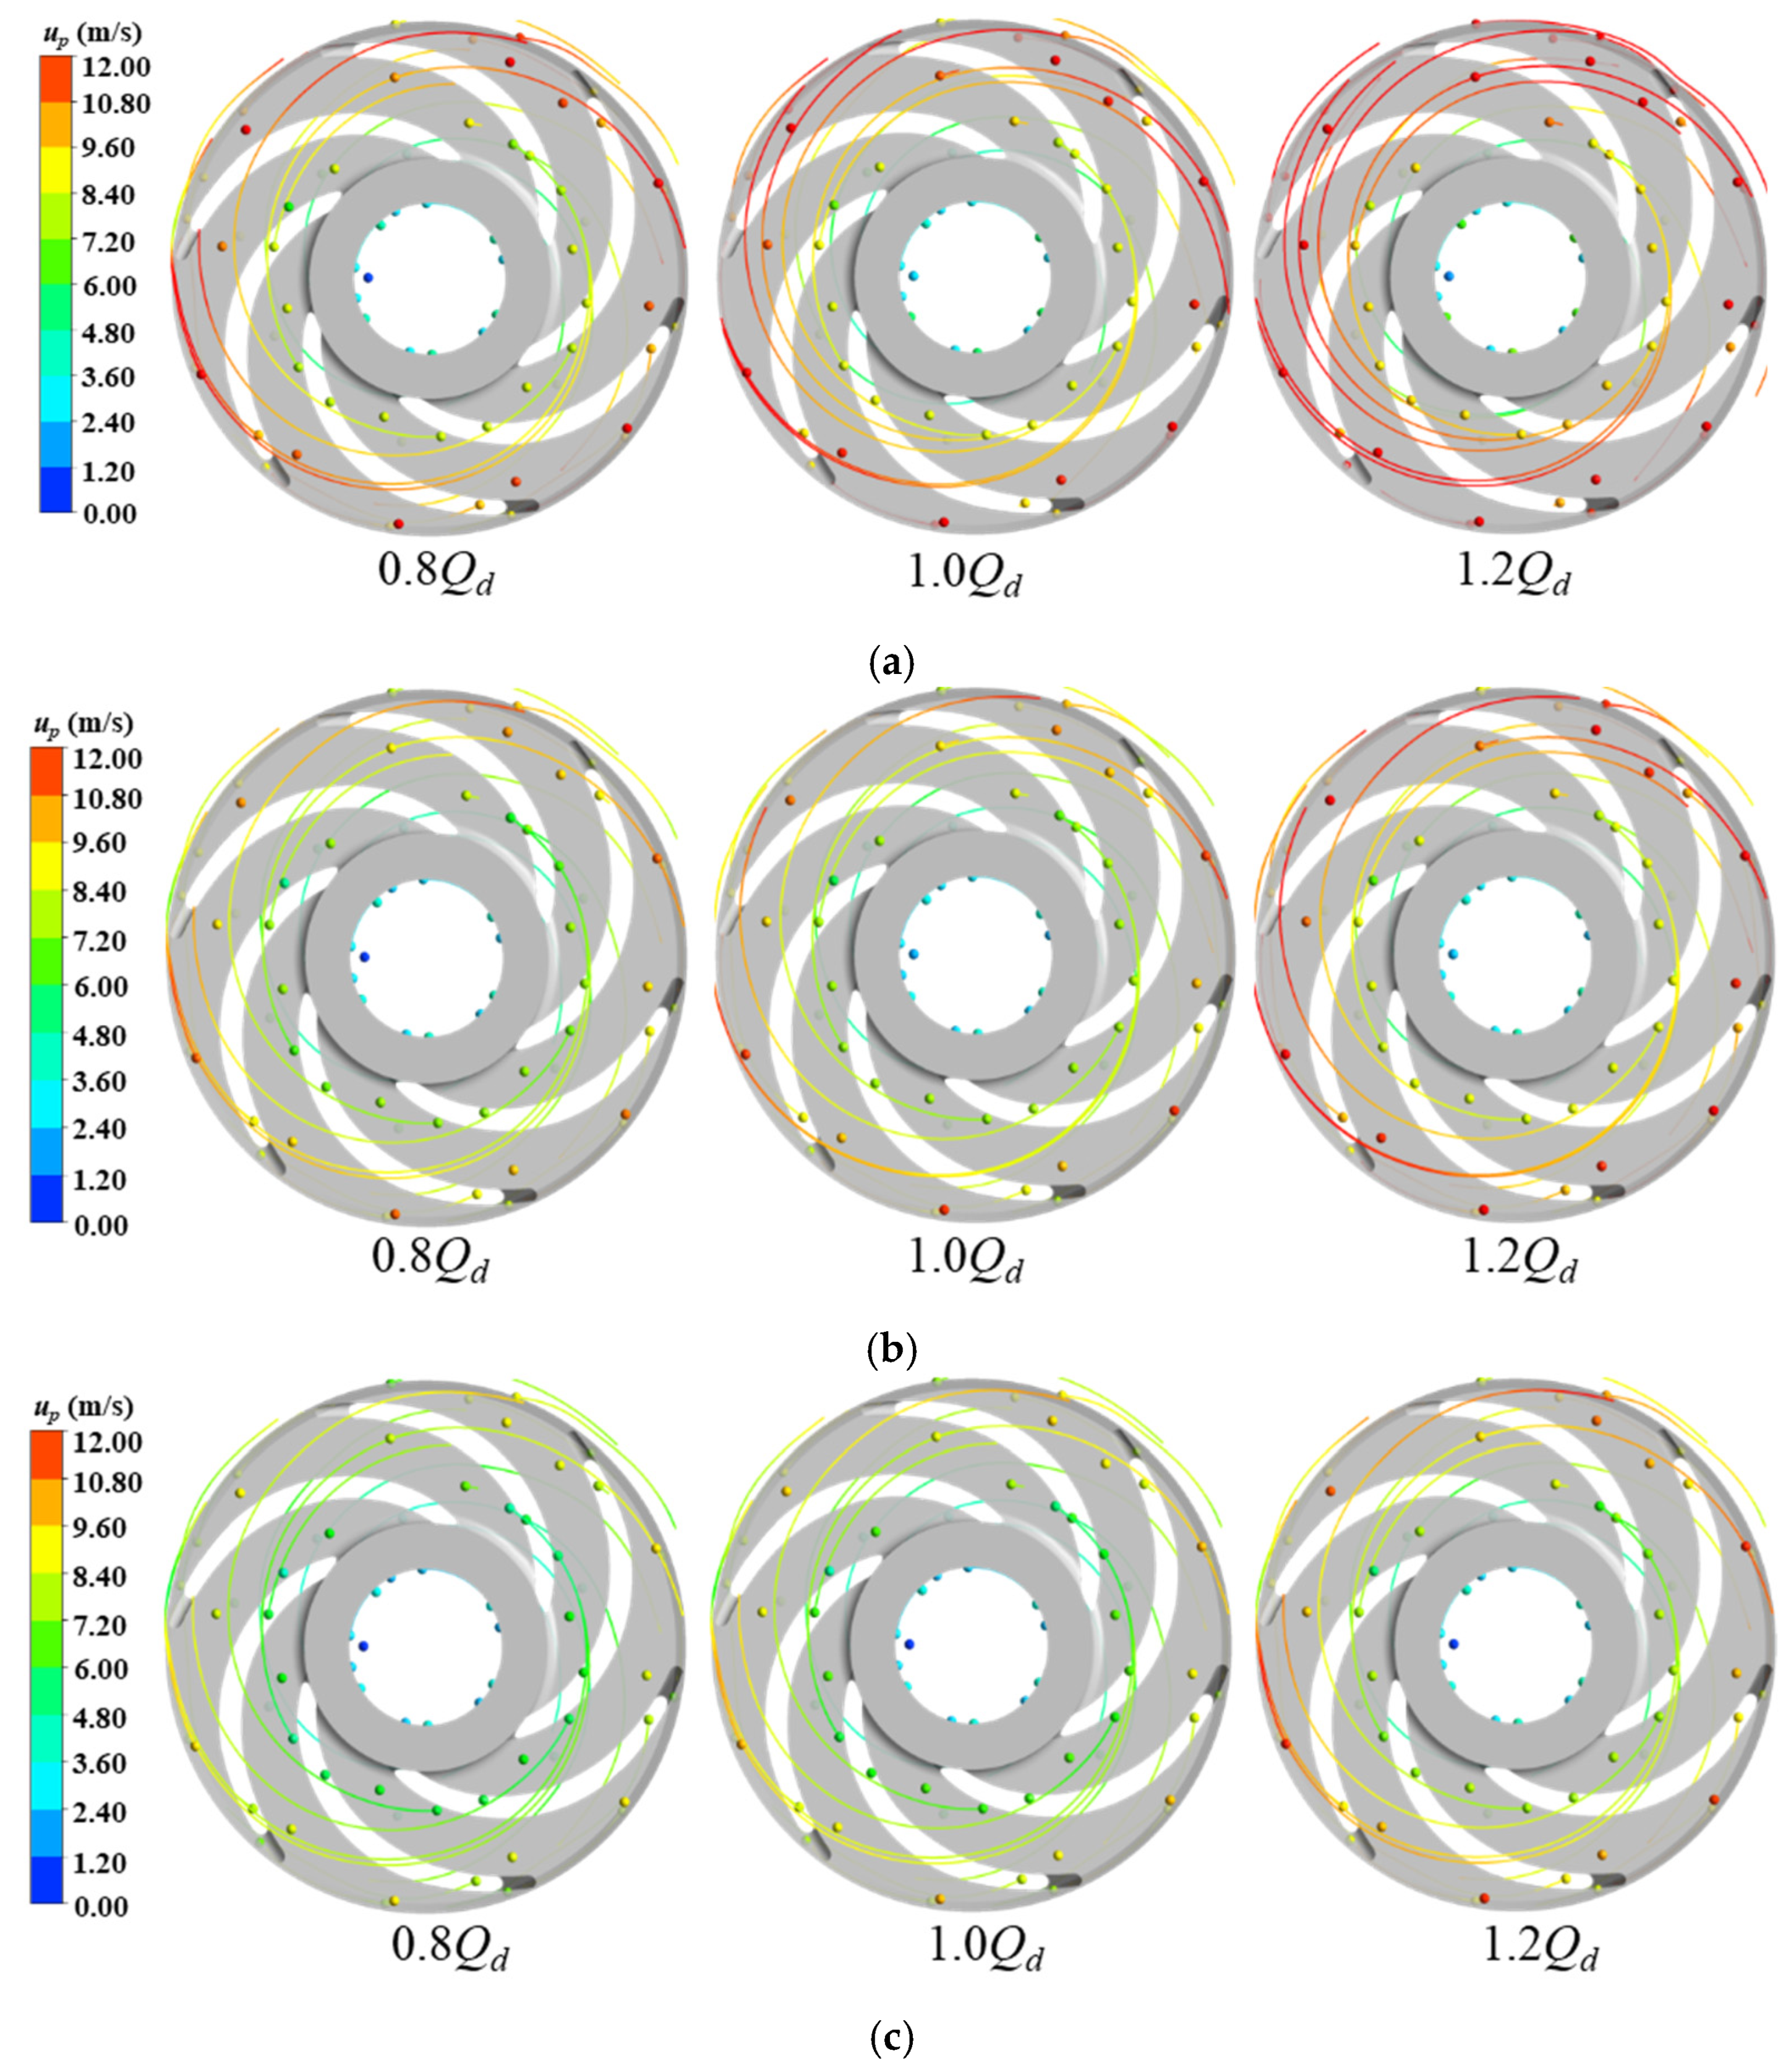
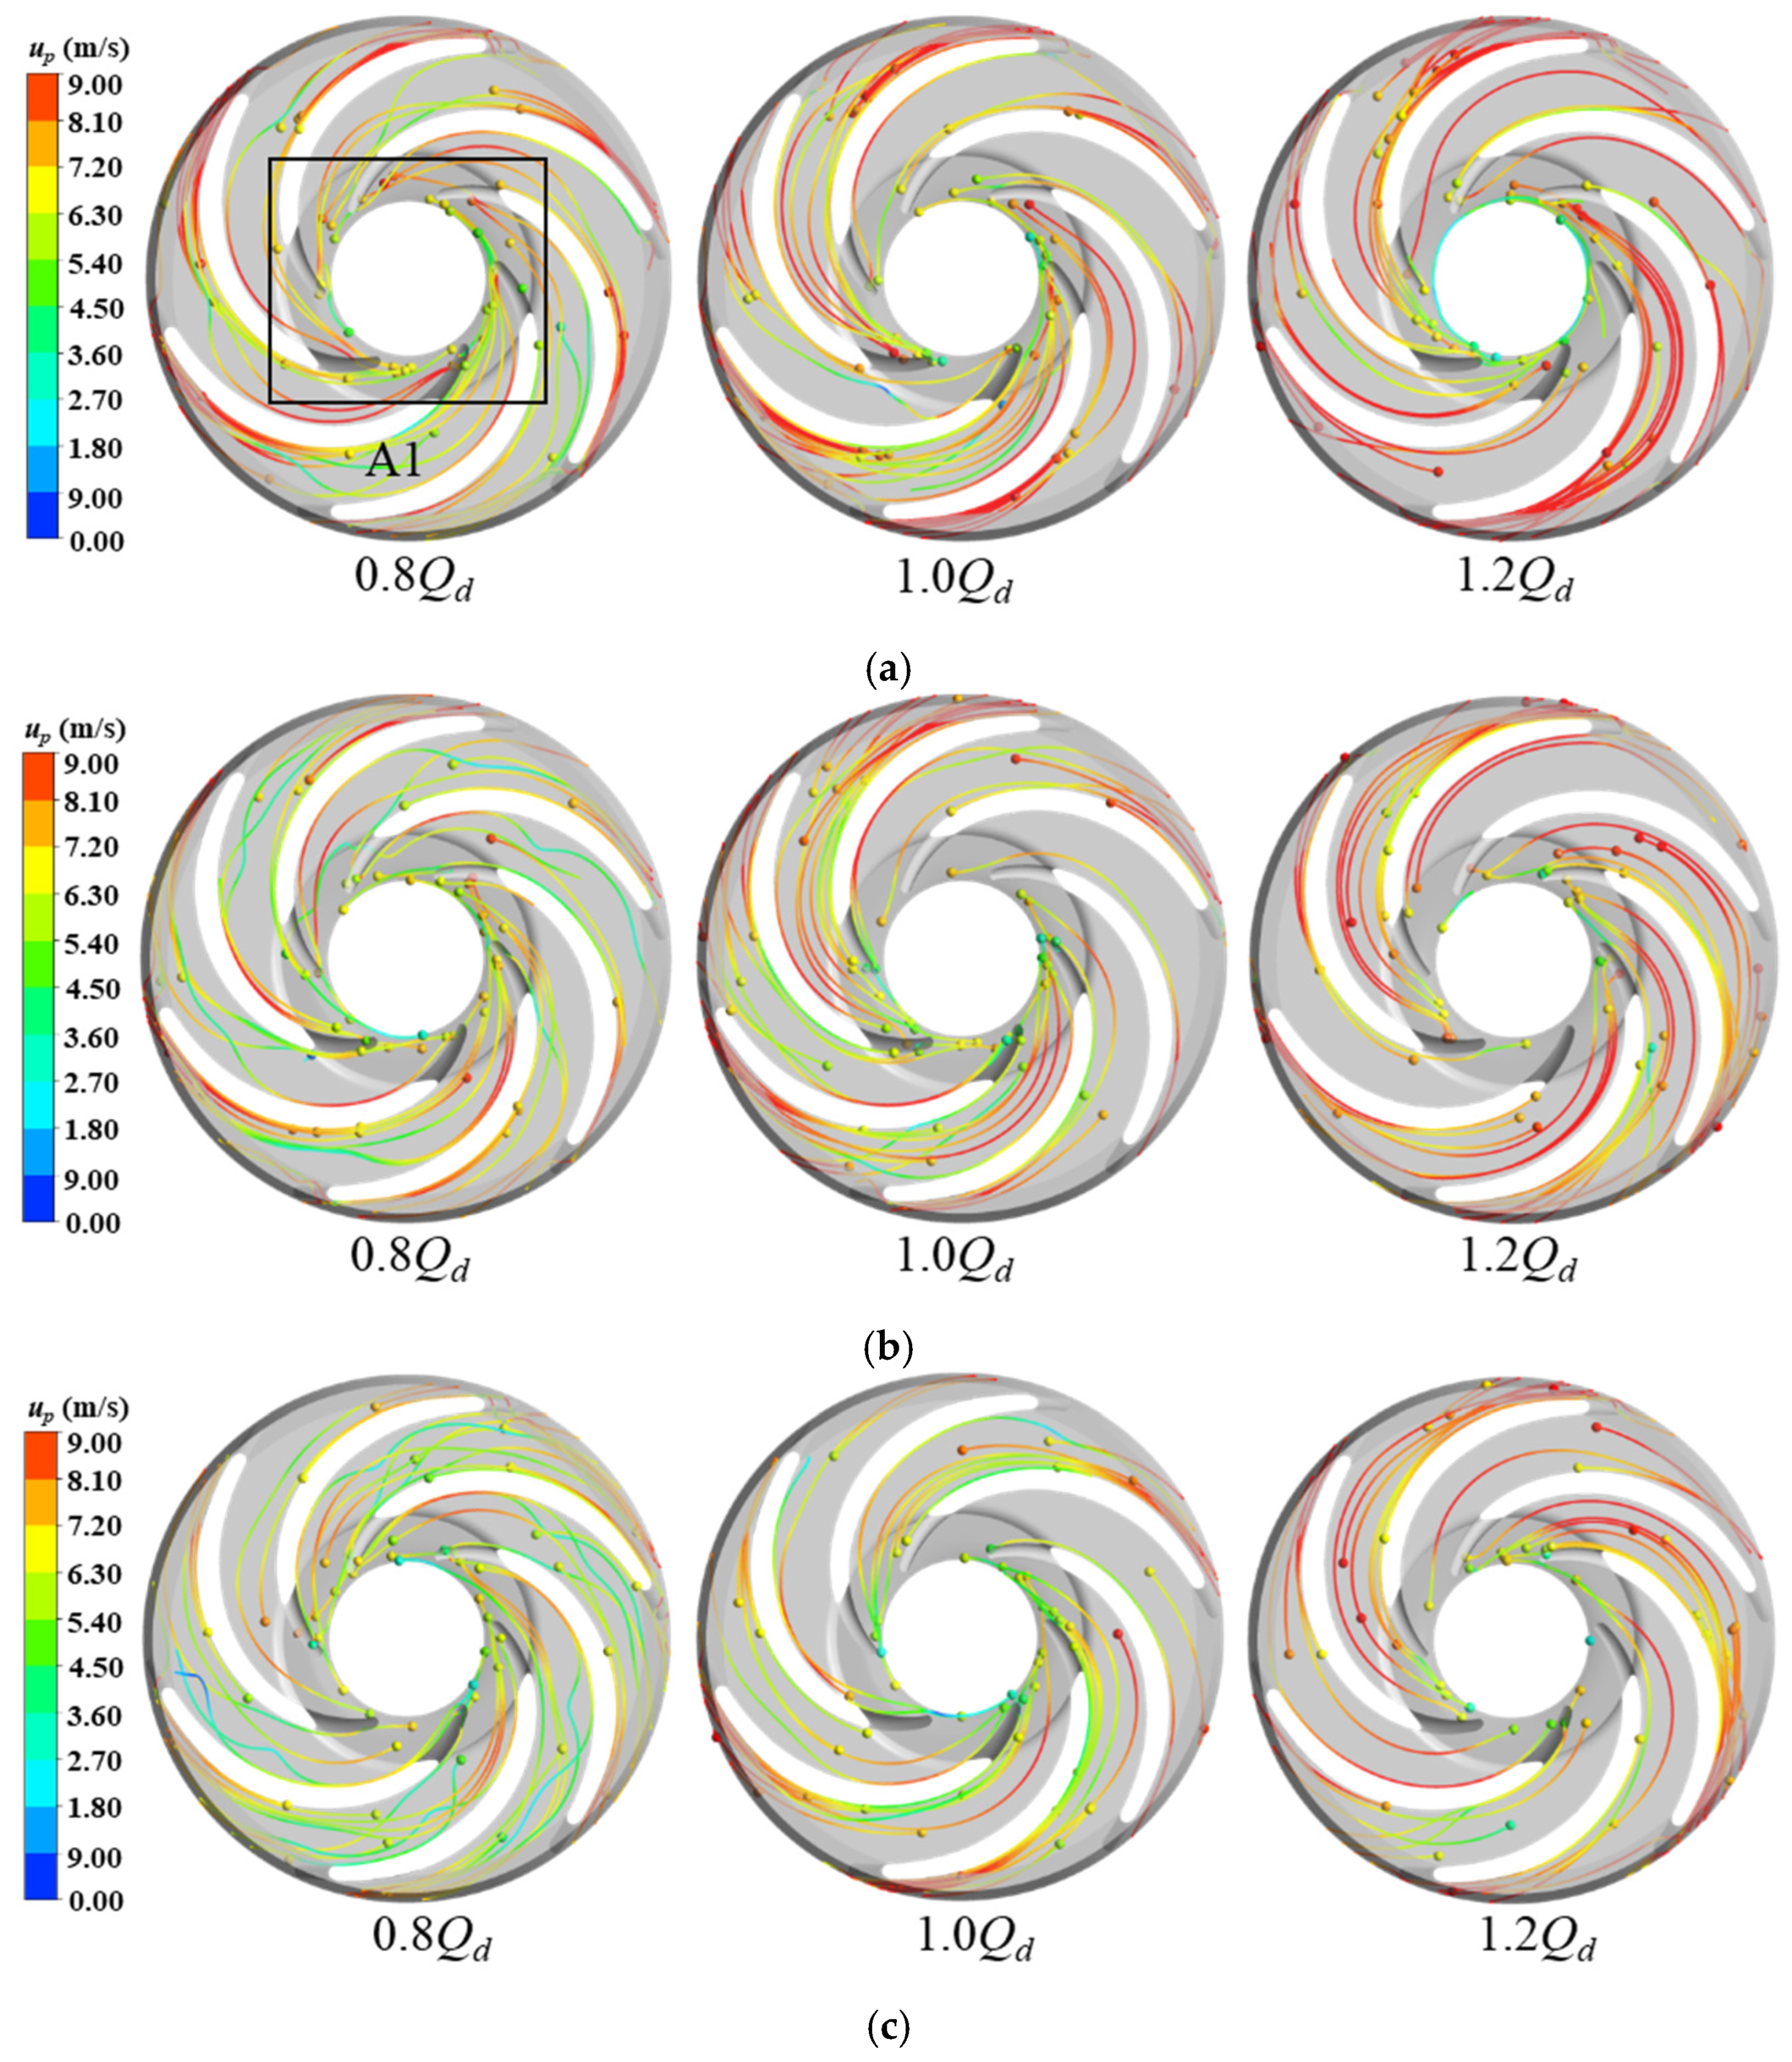
To investigate the solid-liquid two-phase flow characteristics and the wear patterns of key components in multistage centrifugal pumps under different flow rate conditions, this paper employs the Euler–Lagrange approach and the Tabakoff wear model. Combined with experimental results, the study analyzes the influence mechanisms of varying flow rates on particle trajectories within the pump, the wear distribution on the impeller and peripheral casing, and hydraulic performance.
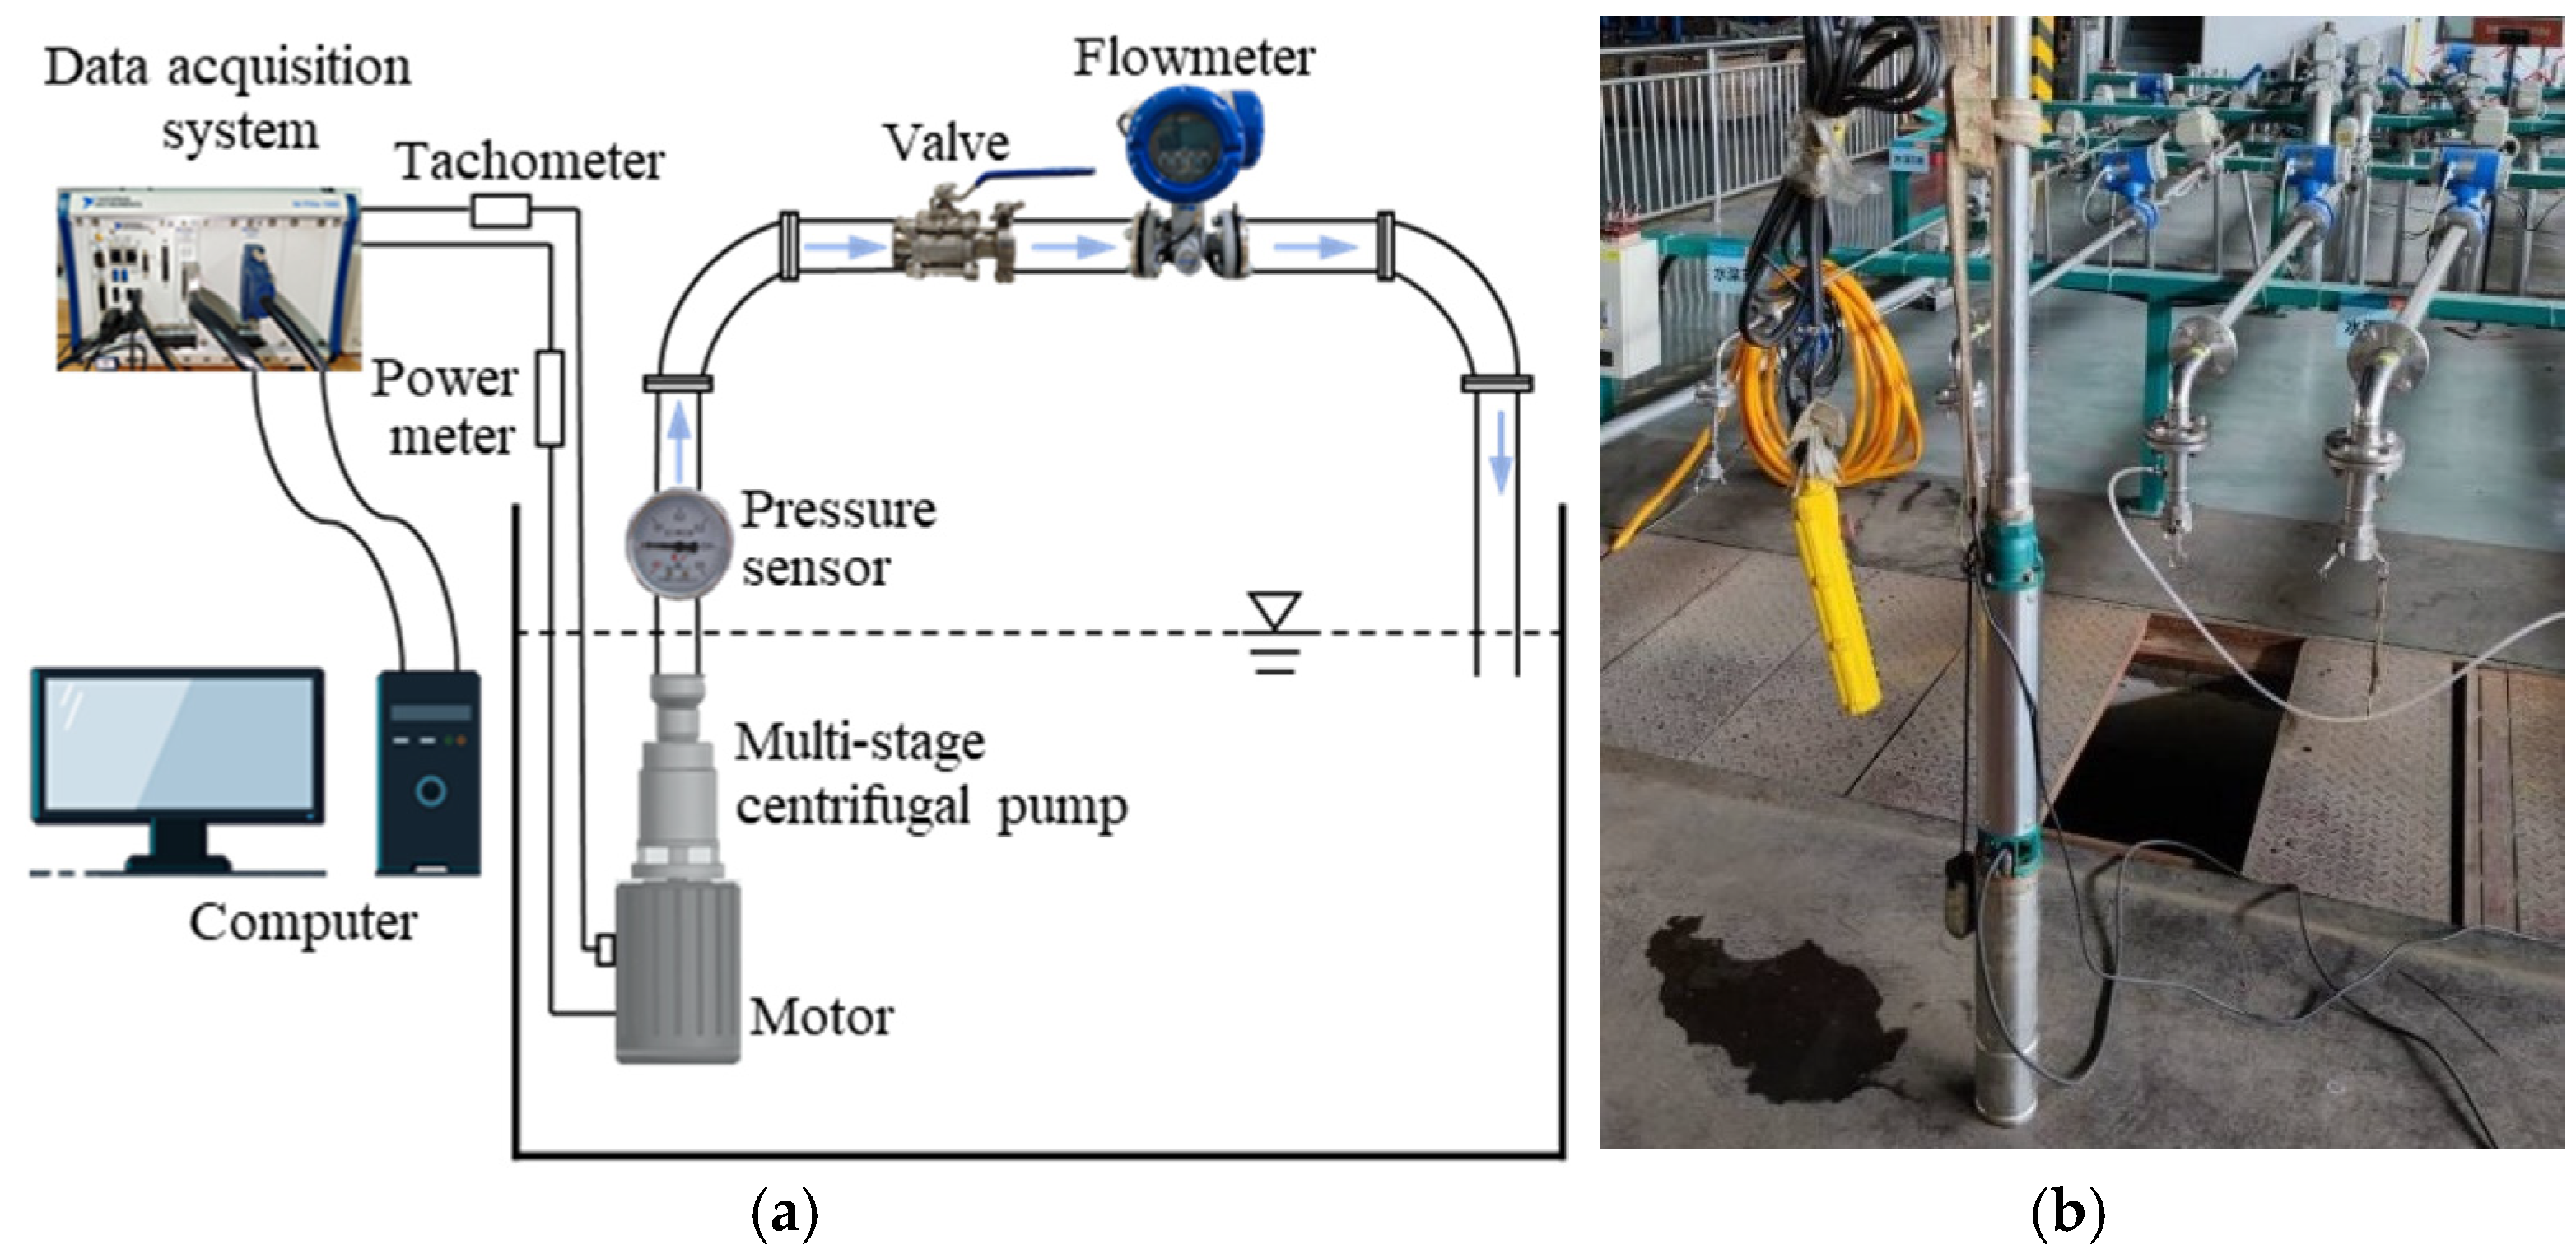
Section 2 presents the pump parameters and experimental setup. 
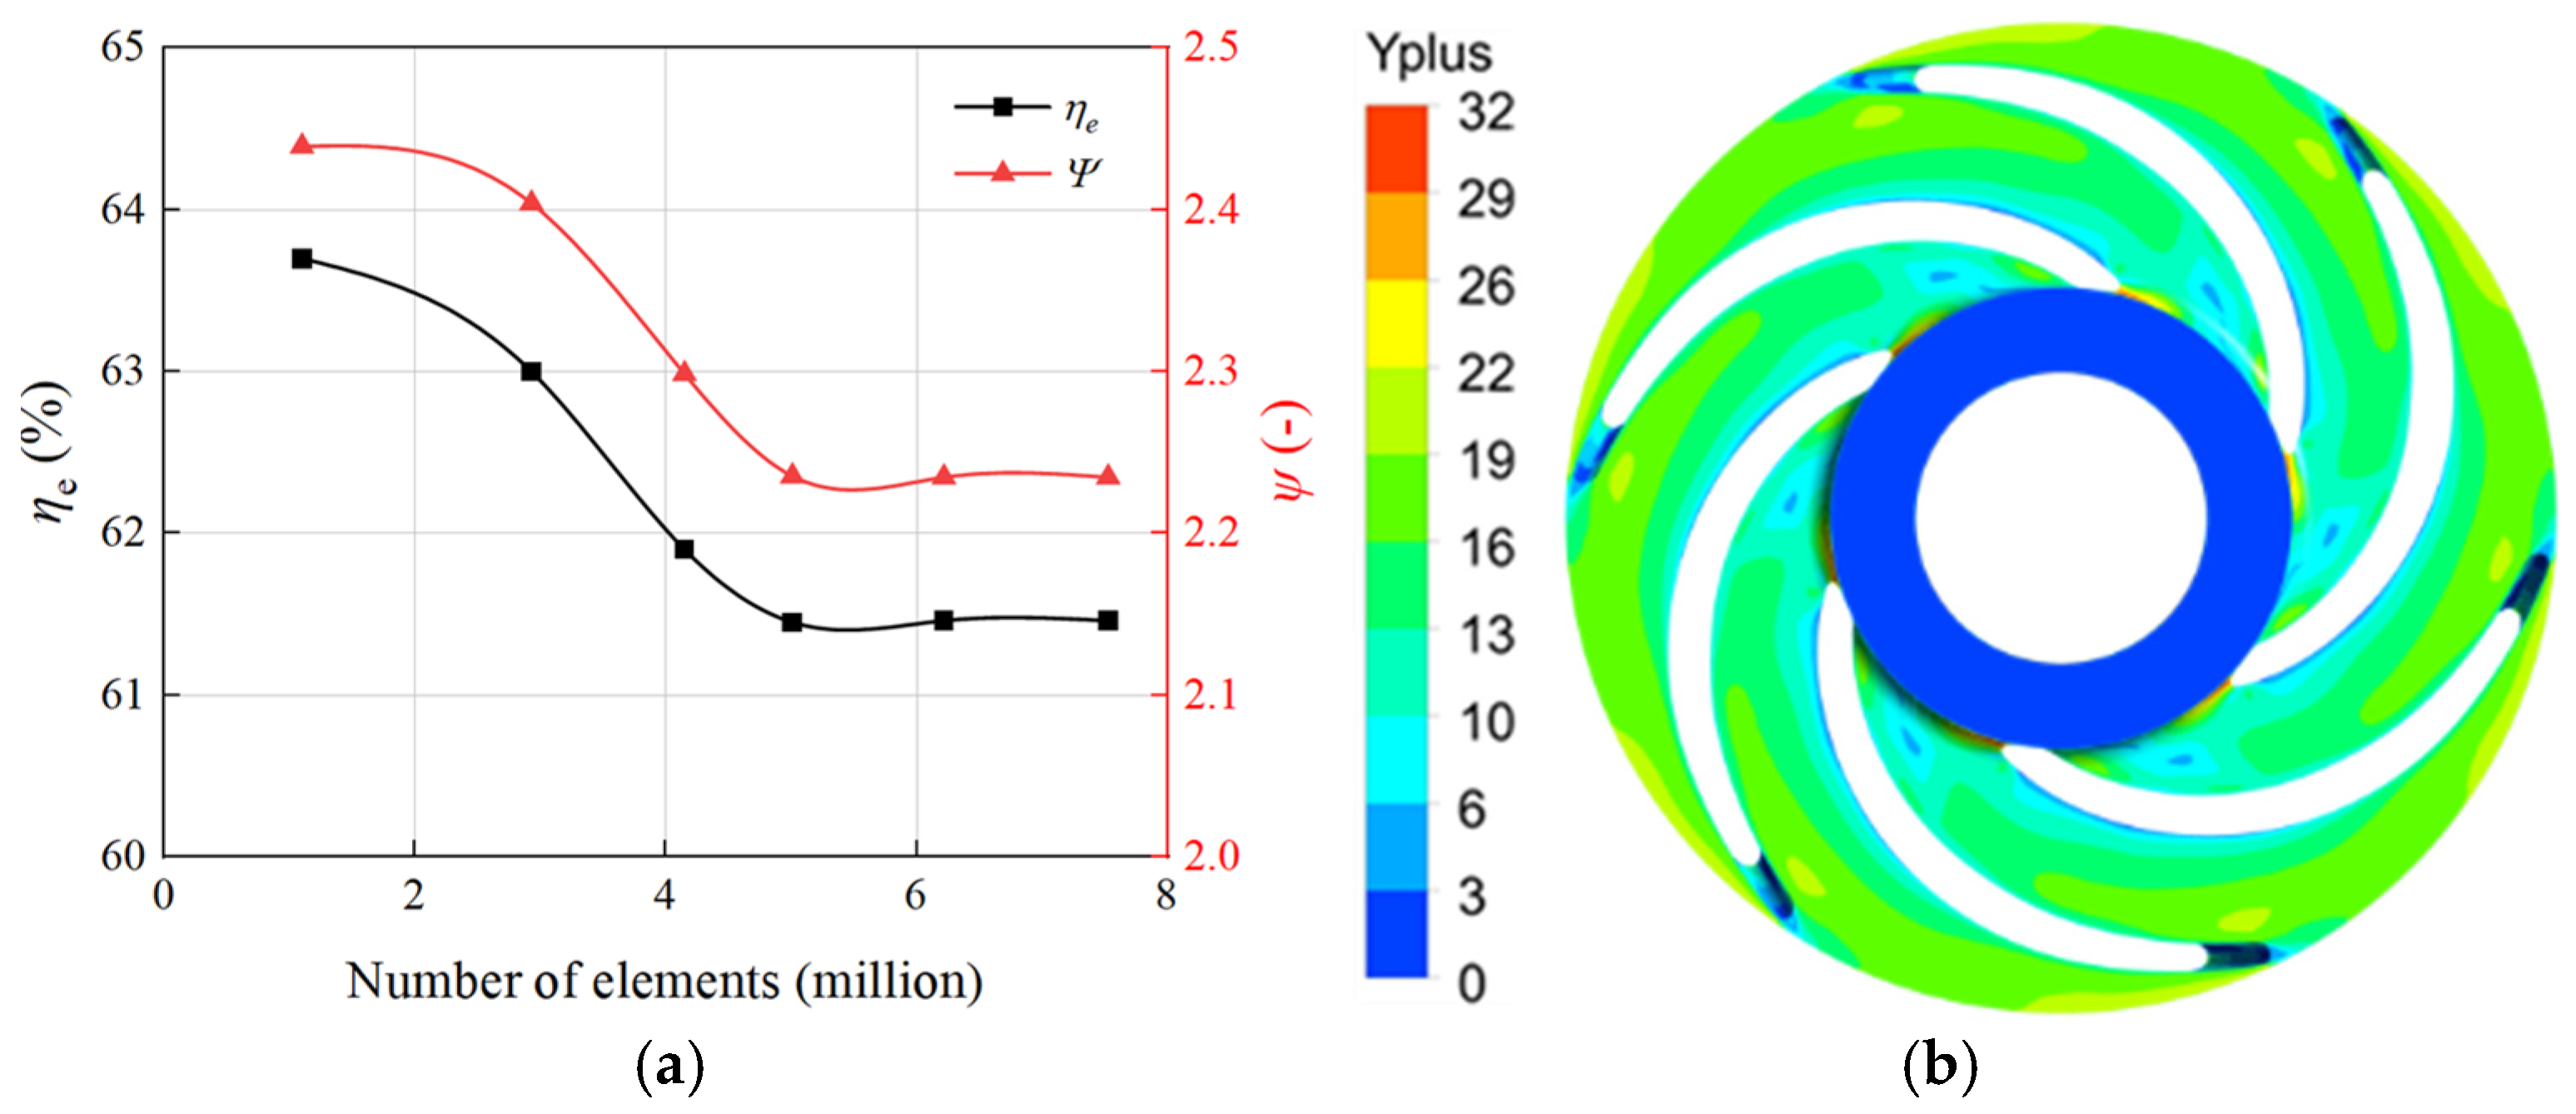
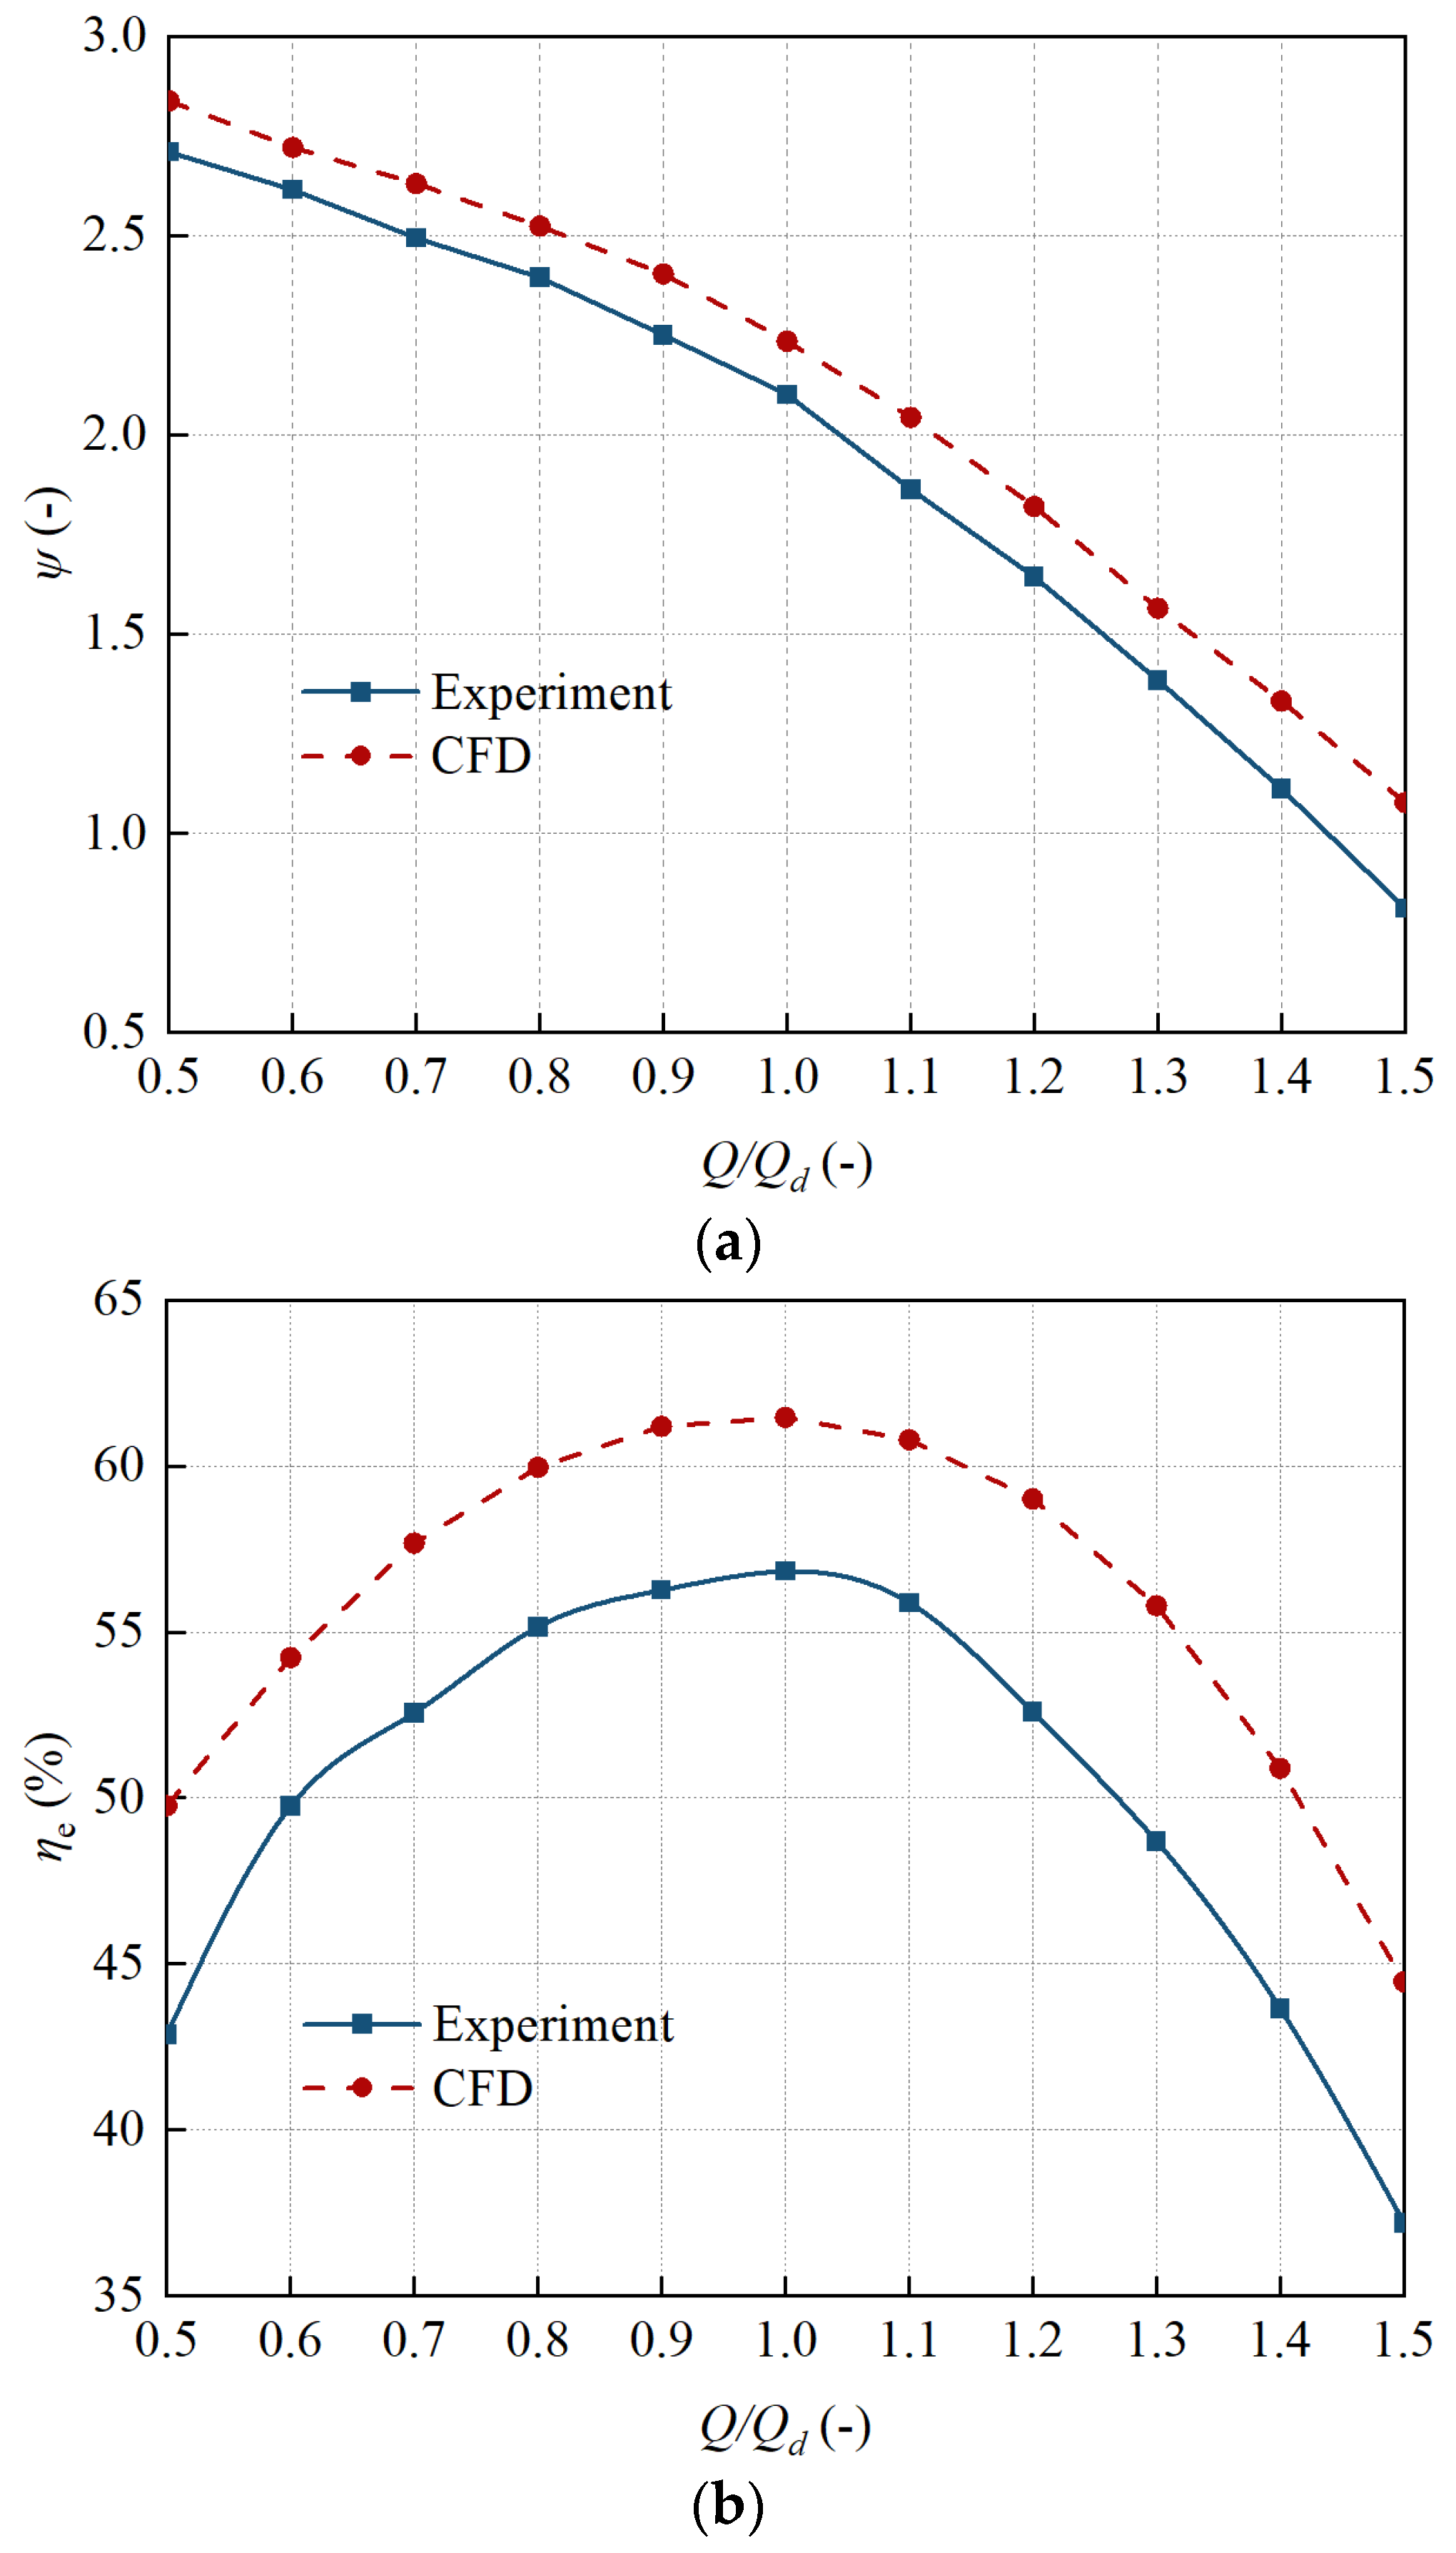
Section 3 details the configuration of the numerical simulation and validates the simulation results with experimental data. Section 4 analyzes the influence of flow rate on wear in the impeller and peripheral casing, as well as on hydraulic performance. This study holds significant importance for improving the unit performance, safe operation, and service life of multistage centrifugal pumps handling solid-liquid two-phase flow.

2. Multi-Stage Centrifugal Pump

2.1. Pump Parameters

This study focuses on a three-stage centrifugal pump, the structure of which is illustrated in Figure 1. Key components include the impellers, return guide vanes, and pump shaft. Continuous impingement by a high concentration of solid particles within the fluid leads to wear and deformation on the surfaces of the flow-passing components. This paper focuses on elucidating the wear mechanisms caused by such impacts and the resulting deterioration patterns in the pump’s hydraulic performance under varying flow rate conditions.
The design flow rate (Qd) is 13 m3/h, the single-stage design head (Hd) is 9.5 m, and the rotational speed (n) is 2850 r/min. Key geometric parameters are provided in Table 1.

2.2. Experimental Setup

To verify the precision of the computational models, experimental verification was conducted using the three-stage centrifugal pump. The experimental setup is shown in Figure 2. Pressure transducers, with an accuracy of 0.2%, were used to measure the pressure on the discharge pipe. The pump outlet pressure was calculated by accounting for the plumb distance between the transducer and the pump centerline, along with the pipe flow losses. The pressure at the pump inlet was established as the sum of the local atmospheric pressure, the submergence depth, and the inlet pipe flow losses. The calculation of frictional pressure drop is based on the relevant methods described in Ref. [34]. A turbine flow meter, with an error of 0.3%, was applied to measure the pump flow rate. The pump input power was computed as the product of the motor power and the motor efficiency. The rotational speed was measured using a tachometer with an error of 0.05%. Random uncertainty was estimated with a 95% confidence interval. The total measurement variability in submerged environments was estimated in accordance with the international standard (ISO 9906:2012) [35], which covers grades 1, 2, and 3 for hydraulic performance acceptance tests of rotodynamic pumps. The uncertainties in head and efficiency were within 1.5% and 3.2%, respectively, satisfying the Grade 1 requirements.

3. Numerical Simulation Methods

3.1. Particle Parameters

Given the high sophistication of the interior flow dynamics in multistage centrifugal pumps, this study employs a bidirectional coupled Eulerian–Lagrangian approach using ANSYS CFX 2020 R2 software to explore the solid-liquid two-phase flow characteristics and the wear patterns on the impeller and peripheral casing under varying flow rate conditions. The numerical simulation was simplified based on the following assumptions: First, the particulate phase consists of monodisperse spherical particles, and phase change is neglected. Second, given that the particulate volume fraction in natural fluids is generally below 10% and a filtration device is installed at the pump inlet, inter-particle collisions are disregarded. Third, the liquid phase is treated as an incompressible continuous phase, while the solid particles are modeled as a discrete phase. The physical properties of each phase are assumed constant. In this study, the Eulerian–Lagrangian approach was employed for numerical simulation of solid-liquid two-phase flow in multistage centrifugal pumps. Considering the dilute-phase condition with particle volume fractions below 10%, where interparticle collision probabilities are substantially reduced, and accounting for the prohibitive computational costs associated with resolving transient turbulent flows in the complex geometry of multistage pumps, we implemented the assumption of monodisperse spherical particles. This justified simplification maintains computational feasibility while effectively capturing the essential hydrodynamic characteristics of the two-phase flow system [36,37].

3.2. Liquid Phase Governing Equations

According to the assumptions in Section 3.1, the liquid-phase flow in the multistage centrifugal pump can be simplified as a three-dimensional incompressible viscous turbulent flow, which is solved using the Reynolds-averaged Navier–Stokes equations [38,39]. The corresponding governing equations are as follows:
Continuity equation:
u i x i = 0
Momentum equation:
ρ u i t + u j u i x j = x j μ e f f u i x j + u j x i p x i + g i + F i
where u is the velocity of liquid, p is the static pressure, ρ is the liquid phase density, μeff is the effective viscosity, t is the time, gi is the component of gravitational acceleration, and Fi is the additional component of the momentum exchange source term representing solid-liquid Interaction (i, j = 1, 2, 3).

3.3. Solid Phase Governing Equations

The stresses exerted upon solid particles within the centrifugal pump can be classified into two categories. The first category comprises the buoyant force, pressure gradient force, and inertial force. These forces are determined exclusively by the intrinsic characteristics of the flow field and are independent of particle-fluid relative motion. The second category includes the drag force, virtual mass force, Basset force, Magnus lift force, and Saffman lift force, whose magnitudes and directions depend on the relative motion characteristics between the two phases [40,41]. When the continuous phase is water, the Basset force and Saffman lift force are negligible compared to the drag force. Furthermore, the Magnus and Saffman lift forces exhibit significant effects only on micron-sized particles, whereas the solid particles transported by centrifugal pumps typically fall within the millimeter range [42]. Consequently, this study exclusively considers the drag force, gravitational force, buoyant force, virtual mass force, and pressure gradient force. The governing equation, based on the generalized Newton’s second law, is expressed as:
m p d u p d t = F D + F G + F B + F V M + F p
where mp is the particle mass, up is the particle velocity, FD is the drag force, FG is the gravitational force, FB is the buoyant force, FVM is the virtual mass force, and Fp is the pressure gradient force. The subscript p designates particle-related quantities.
The drag force FD, which is the primary force acting on solid particles in the fluid, is directly related to the particle properties and the relative motion between the solid particles and the fluid. For spherical particles, the drag force equation is expressed as [43]:
F D = 1 2 C D ρ A u u p 2 = m p 18 μ C D R e p 24 ρ p d p 2 u u p
R e p = ρ d p u u p μ
where CD is the drag coefficient, Rep is the particle Reynolds number, ρp is the particle phase density, and dp is the particle diameter.
The drag coefficient of spherical particles is given as:
C D = a 1 + a 2 Re p + a 3 Re p 2
where a1, a2, and a3 are constants, which are applicable in several scopes of ReP.
The governing equations for the gravitational force FG and buoyant force FB are:
F G + F B = m p 1 ρ ρ p g
Particle dynamics within the fluid medium induces a corresponding acceleration in the surrounding fluid, resulting in a growth in the dynamic energy of both the particles and the fluid. Therefore, an additional inertial force, termed the virtual mass force FVM, acts on the particles during acceleration. The governing equation is formulated as:
F V M = m p ρ ρ p C V M d u d t d u p d t
where CVM is the virtual mass coefficient, conventionally set to 0.5.
The pressure gradient force Fp is expressed as:
F P = m p ρ p p

3.4. Wear Governing Equations

In multistage centrifugal pumps handling solid-liquid two-phase flow, the wear of solid particles on wall surfaces constitutes a complex process. The wear severity is influenced by multiple factors, including particle shape, hardness, impact conditions, and wall material properties. Once the particle characteristics and flow-passing wall materials are determined, wear can be simplified as a function of particle impact angle and impact velocity. This study employs the empirical Tabakoff wear model, which demonstrates significant advantages through its accurate characterization of particle-wall collision and rebound behavior, making it particularly suitable for complex flow conditions involving frequent impacts on impellers and guide vanes in high-velocity flows [44]. Consequently, the Tabakoff wear model is utilized to investigate wear patterns on pump components under solid-liquid two-phase conditions across varying flow rate conditions.
The Tabakoff wear model is expressed as follows:
E = f γ u P u 1 2 cos 2 γ 1 R t 2 + u P u 2 sin γ 4
where:
f ( γ ) = 1 + k 1 k 12 sin π γ 2 γ r 2
R t = 1 u p u 3 sin γ
f ( γ ) = 1.0 γ 2 γ 0 0.0 γ > 2 γ 0
where E is the dimensionless erosion parameter, γ is the impact angle in radians between the approaching particle track and the wall, γ 0 being the angle of maximum erosion, and k1, k12, u1, u2, and u3 are model constants and depend on the particle/wall material combination, as detailed in Table 2.

3.5. Stokes Number of Particles

The Stokes criterion is employed to evaluate particulate motion characteristics. Defined as a non-dimensional parameter describing the dynamics of suspended particles in fluid flow, the Stokes number quantifies particle response to fluid turbulence. When the Stokes number is less than 1, drag force dominates particle motion, resulting in particles closely following fluid streamlines; when the Stokes number exceeds 1, inertial forces dominate, causing particles to significantly deviate from streamlines [45,46]. The Stokes number is defined by relaxation time scale ratio between particulate and system, expressed as:
S t = τ p u p L l = ρ p d p 2 u p 18 μ L l
where τp is the non-dimensional particulate response time, and Ll represents the characteristic length of the fluid.
The Stokes number calculation for each flow domain is performed by determining the characteristic length Ll and particle inflow velocity up specific to four key regions. In the rear shroud domain, Ll equals the axial clearance to the rear chamber. In the front shroud domain, Ll equals the axial clearance to the front chamber. In the impeller domain, Ll adopts the outlet diameter. In the volute domain, Ll is set as the inner diameter. All velocities up are derived from Eulerian–Lagrangian coupled simulations as described in Section 3.2, ensuring consistent methodology across components.

3.6. Computational Settings

The SST k-ω turbulence model was selected due to the presence of a strong swirling flow field in the solid-liquid two-phase multistage centrifugal pump [47]. The boundary conditions were configured as follows: a total pressure inlet, a mass flow outlet, and the impeller domain assigned as a rotating frame with its shroud set to a rotating wall. All wall boundaries adopted a no-slip condition, with specific parameters detailed in Table 3.
To systematically evaluate the influence mechanisms of varying flow rates on particle trajectories, wear distribution across the impeller and peripheral casing, and hydraulic performance within the pump, the following parameters were configured: particle density 2650 kg/m3, particle diameter dp 0.5 mm, volumetric concentration 2%, with flow rates set to 0.8Qd, 1.0Qd, and 1.2Qd. Hardware configuration includes two Intel(R) Xeon(R) Gold 6266C CPUs with a base frequency of 3.00 GHz and 256 GB of RAM. The total computation time was one week.

3.7. Hexahedral Mesh Generation

The computational domains of the three-stage centrifugal pump include the inlet, side chambers, impellers, return guide vanes, and outlet. To eliminate the influence of the inlet and outlet geometries on the solid-liquid two-phase flow within the pump, the inlet and outlet structures were replaced with straight pipes. Hexahedral meshes were generated using ICEM CFD 2020 R2, as shown in Figure 3. O-type, C-type, and Y-type meshing techniques were applied to the impeller and return guide vane domains to map the flow channels, ensuring high grid quality. The front and rear side chambers and return guide vanes were meshed as continuous domains without interfaces. The selected turbulence closure scheme and near-wall modeling approach met the prescribed y+ criteria while maintaining Jacobian values above 0.5 and cell skewness angles greater than 18° [48].

3.8. Mesh Sensitivity

To obtain grid-independent solutions, a grid independence analysis was conducted using six distinct mesh schemes. At the design flow rate, the head coefficient (ψ) and efficiency (ηe) under varying grid densities are illustrated in Figure 4. The head coefficient and efficiency are defined as follows [49]:
Head coefficient ψ:
ψ = 2 g H u 0 2
where u0 is the circumferential velocity of blade trailing edge.
Numerical efficiency ηe:
η e = ρ g H Q P i n
where Pin is the pump shaft power.
Pump shaft power Pin:
P i n = T ω
where T is the impeller torque and ω is the angular velocity of impeller.
The computational domain adopts a parameter configuration where the boundary layer is meshed with 10 layers, with the first layer height set to 0.05 mm and a growth rate of 1.1. ANSYS CFX’s Automatic wall treatment is used, which is an adaptive approach that dynamically selects between a Low-Re model and wall functions based on local y+ values, seamlessly blending between them. This strictly satisfies both the turbulence model requirements and the demands for numerical simulation accuracy. As shown in Figure 4b, the impeller region achieves an average y+ value of approximately 28, fully complying with the y+ criterion for the selected turbulence model.
Numerical simulation results indicate that the head coefficient and efficiency stabilize at 2.23 and 61.46%, respectively, when the mesh count reaches 6.22 million. To accurately simulate solid-liquid two-phase flow in the multistage centrifugal pump under varying flow conditions, a grid comprising 6.22 million hexahedral elements was employed for subsequent simulations.

3.9. Experimental Validation

To validate the accuracy of the three-stage centrifugal pump performance simulation, verification experiments were conducted based on the test rig shown in Figure 2. Three repeated tests were performed, with the average values of the head coefficient and efficiency taken for comparison with numerical simulation results. As illustrated in Figure 5, within the flow rate range from 0.5Qd to 1.5Qd, the maximum absolute errors between simulated and experimental results were 0.28 for the head coefficient and 7.23% for efficiency. From 0.5Qd to 1.8Qd, the simulation results followed the same trend as experimental data. For complex fluid machinery such as multistage centrifugal pumps, this level of simulation accuracy is sufficient for practical solid-liquid two-phase flow analysis [50]. For multistage centrifugal pumps as complex fluid machinery, when the error between numerical simulations and experimental results is controlled within 10%, it demonstrates the reliability of the numerical simulation method [51].

4. Results and Discussion

4.1. Influence of Pump Flow Rate

Figure 6 presents the performance curves of the multistage centrifugal pump under varying flow rates. Efficiency and head were nondimensionalized using Equations (15) and (16). With solid particles of diameter dp 0.5 mm and volumetric concentration Cv 5%, Non-dimensionalization of Efficiency and Head. Under the operating condition with solid particles of diameter 0.5 mm and volume concentration 5%, the presence of solid particles significantly influences the performance parameters of the multistage centrifugal pump. Compared to the pure water condition, the pump efficiency under solid-liquid two-phase flow decreases by 1.37%, 1.64%, and 1.80% at flow rates of 0.8Qd, 1.0Qd, and 1.2Qd, respectively. Similarly, the head coefficient decreases by 0.10, 0.13, and 0.16 at these flow rates. The reason is that as the flow rate increases, the momentum of the particles also rises, leading to intensified energy dissipation caused by inertial collisions of the particles. Simultaneously, to sustain particle transport, the impeller must perform additional work on the solid-phase particles. These factors collectively result in an increase in pump shaft power, thereby causing a decline in both efficiency and head coefficient.

4.2. Wear Analysis

Figure 7 shows the wear rate distribution contours on the front shrouds of the impellers under different flow rates. Table 4 presents the average erosion rates of impeller front shrouds under different flow rates. As the flow rate increases from 0.8Qd to 1.2Qd, the wear area and average wear rate of the front shroud of the same stage impeller gradually increase. The maximum average wear rate is 3.25 × 10⁻⁶ kg/m2/s. The high wear regions are mainly concentrated on the outer edge of the impeller, showing a band-like distribution. Under the same flow rate condition, the wear area and average wear rate of the lower stage impeller’s front shroud are consistently smaller than those of the upper stage impeller. The reason is that as the flow rate increases, the momentum of the particles gradually increases, intensifying their impact on the front shroud, thereby enlarging the wear area on the same-stage front shroud. Under the same flow condition, when particles enter from the inlet, they are affected by the inlet structure’s influence on the fluid, resulting in stronger impacts on the front shroud of the first-stage impeller. After the particles flow out of the first-stage impeller, they enter the front chamber of the downstream impeller through the rectification of the return guide vanes. The rectification effect of the return guide vanes effectively reduces the particle momentum and changes their impact angle, thereby reducing the wear area on the front shroud of the downstream impeller.
Figure 8 shows the wear rate distribution contours on the inner surface of the rear shrouds under different flow rates. Table 5 presents the average wear rates of impeller back shrouds under different flow rates. As the flow rate increases from 0.8Qd to 1.0Qd, the average wear rate and the wear area on the inner side of the back shroud of the same stage impeller show an increasing trend. The maximum average wear rate is 6.06 × 10⁻⁶ kg/m2/s, and the red high wear area gradually expands, mainly concentrated in the A1 region. Under the same flow rate condition, the average wear rate and the wear area on the inner side of the lower stage impeller’s back shroud are consistently smaller than those of the upper stage. The reason is that for the same impeller stage, the increased flow rate leads to higher velocities of both fluid and particles inside the impeller and rear chamber, resulting in greater particle momentum. This enhances both the impact intensity and frequency of particles on the inner surface of the rear shroud, thereby aggravating wear. Meanwhile, particles directly impact region A1 after entering the impeller, causing the most severe wear in this area. Under the same flow condition, after the flow rectification by the upstream return guide vanes, the particles entering the downstream impeller exhibit more uniform velocity distribution. This optimization of particle impact angles on the inner surface of the rear shroud effectively reduces impact intensity, consequently decreasing the wear area on the rear shroud of the downstream impeller.
Figure 9 shows the wear distribution on the pressure side and suction side of the impeller under different flow rates. Table 6 presents the average wear rates of impellers under different flow rates. In the same stage impeller, as the flow rate increases, both the wear area and average wear rate on the pressure side and suction side of the impeller show an increasing trend. The maximum average wear rate is 5.39 × 10⁻⁶ kg/m2/s. Under the same flow condition, the wear area on the suction side is smaller than that on the pressure side. At identical flow rates, the wear areas on both the pressure side and suction side of the upstream impeller stage are larger than those of the downstream stage. The reason is that as the flow rate increases, the momentum of solid particles increases accordingly, directly leading to enhanced impact intensity and frequency of particles on both the pressure side and suction side of the impeller, thereby aggravating wear. When particles enter the impeller, they initially maintain a relatively large axial velocity component, causing them to impact the pressure side earlier and more directly. On the other hand, some particles collide with the leading edge of the blades and then rebound or deflect into the flow passage region near the pressure side of the blades, resulting in intensified wear in this area. These two factors collectively cause the wear area on the pressure side to be larger than that on the suction side. Under the same flow condition, the upstream return guide vanes provide certain interception and flow rectification effects on particles, reducing the number of particles entering the downstream impeller and optimizing the impact angles of particles entering the impeller. Consequently, the wear areas on both the pressure side and suction side of the upstream impeller stage are larger than those of the downstream stage.
Figure 10 shows the wear rate distribution contours in the peripheral casing under different flow rates. Table 7 presents the average wear rates of pump casings under different flow rates. As the flow rate increases, the average wear rate and the red high wear area within the same stage pump casing show an increasing trend. The red high wear is mainly concentrated in the A2 region, with a maximum average wear rate of 5.39 × 10⁻⁶ kg/m2/s. Under the same flow rate condition, the average wear rate and the wear rate of the upper stage pump casing are greater than those of the lower stage pump casing. This phenomenon occurs because increased flow rates enhance particle momentum, resulting in stronger impacts on the peripheral casing and consequently enlarging the red high-wear area in the same-stage casing. When particles are discharged from the impeller, they directly impact region A2, leading to more concentrated wear in this area. As particles move from the upstream to downstream casing chambers, the return guide vanes provide flow rectification and obstruction effects, gradually reducing the particle volume concentration entering the downstream peripheral casing. Therefore, under the same flow condition, the wear rate in the upstream peripheral casing exceeds that in the downstream casing.

4.3. Particle Trajectory Analysis

Figure 11 illustrates the particle trajectories within the front shroud region of the impeller under different flow rates. As the flow rate increases, the particle velocities in the front shroud region of the same-stage impeller progressively rise; the maximum value is 12.8 m/s, with significantly higher velocities observed near the outer edge compared to the inner region. Under identical flow conditions, when particles enter the front shroud region of downstream impeller stages, their velocities decrease due to the flow rectification effect of the return guide vanes, as compared to the first-stage impeller. Upon entering the front chamber, particles continuously migrate toward the outer edge under the centrifugal force generated by the impeller rotation, resulting in particle accumulation in this region. Consequently, the outer edge of the front shroud not only experiences direct impacts from high-velocity particles but also suffers from increased collision frequency due to elevated local particle concentration. The combined effect of high-velocity impacts and frequent collisions leads to substantially more severe wear in the outer edge region of the front shroud compared to other areas.
Figure 12 shows the particle trajectories in the rear shroud region of the impeller under different flow rates. As the flow rate increases, the particle velocity inside the rear shroud of the same-stage impeller increases accordingly; the maximum value is 13.5 m/s. After entering the impeller, particles initially impact region A1 on the inner surface of the rear shroud directly, then accelerate along the main flow direction driven by the impeller blades. This direct and continuous impact of high-speed particles guided by the inlet effect is the fundamental cause of the most severe wear in region A1. Under the same flow condition, when particles pass through the return guide vanes from the upstream impeller, the impact angle on the inner surface of the downstream impeller’s rear shroud is optimized, resulting in more uniform velocity distribution of particles entering the impeller. This reduces the impact intensity of particles on the rear shroud of the downstream impeller, consequently making the wear area on the inner surface of the downstream impeller’s rear shroud smaller than that of the upstream impeller.
Figure 13 shows the particle trajectories in the impeller domain under different flow rates. As the flow rate increases, the particle velocity within the impeller domain gradually rises; the maximum value is 14.9 m/s, leading to increased momentum and consequently stronger impacts on both the pressure side and suction side of the impeller blades, resulting in aggravated wear. When particles enter the impeller passage from the inlet, their flow direction changes abruptly from axial to radial. Due to particle inertia after this deflection, particles directly impact the leading edge of blades in the impeller inlet region. Subsequently, under the combined action of centrifugal force and fluid drag, particles migrate and move along the region near the pressure side of the blades. This causes both the collision frequency and impact intensity on the pressure side to exceed those on the suction side, resulting in consistently greater wear on the pressure side compared to the suction side. Under the same flow condition, after particles exit the upstream impeller and pass through the return guide vanes for flow rectification and partial interception, the number of particles entering the downstream impeller decreases relatively. Meanwhile, the flow guidance effect of the return guide vanes optimizes the impact angles of particles entering the downstream impeller, reducing the normal impact component of particles on the blades. Consequently, the wear on both the pressure side and suction side of the downstream impeller becomes less severe than that of the upstream impeller.
Figure 14 shows the particle trajectories in the pump chamber domain under different flow rates. As the flow rate increases, the particle velocity in region A3 of the same-stage pump chamber rises accordingly; the maximum value is 15.7 m/s. Enhanced momentum leads to stronger impacts on the peripheral casing wall, resulting in gradual expansion of the wear area on the casing. Within region A3, the particle trajectories exhibit uniform distribution. Under identical flow conditions, compared with the upstream peripheral casing, the number of particles entering the corresponding region of the downstream casing shows a significant decreasing trend. This occurs because when particles are discharged from the upstream impeller and pass through the return guide vanes, the rectification and obstruction effects cause partial particle sedimentation and retention. Consequently, fewer particles enter the downstream peripheral casing, reducing both impact intensity and frequency on the casing wall. This mechanism explains why the wear area on the upstream peripheral casing exceeds that on the downstream casing.

4.4. Particle Stokes Number Analysis

Figure 15 shows the particle Stokes number distribution curves in the front shroud region of the impeller under different flow rates. Under the conditions of particle diameter 0.5 mm and volume concentration 5%, as the flow rate increases from 0.8Qd to 1.2Qd, the particle Stokes number in the front shroud region of the same-stage impeller shows a monotonic increasing trend, with all values greater than 1. Under identical flow conditions, the particle Stokes number in the front shroud region of the upstream impeller stage is higher than that of the downstream stage. With increasing flow rate, the particle velocity and momentum in the front shroud region of the same-stage impeller increase, leading to higher particle Stokes numbers. This indicates weakened particle-fluid coupling and enhanced inertial dominance, resulting in increased probability of inertial particle collisions and expanded wear areas. Under the same flow condition, the particle Stokes number in the front shroud region of the upstream impeller stage is lower than that in the downstream stage. After particles exit the upstream impeller and pass through the return guide vanes, they enter the front chamber of the downstream impeller with effectively reduced momentum and optimized impact angles. This weakens particle inertial effects, improves particle-fluid coupling in the downstream front chamber, and reduces the probability of inertial collisions, ultimately leading to less severe wear on the front shroud of the downstream impeller compared to the upstream stage.
Figure 16 shows the particle Stokes number distribution curves in the inner region of the rear shroud under different flow rates. As the flow rate increases from 0.8Qd to 1.2Qd, the particle Stokes number in the inner region of the rear shroud for the same-stage impeller exhibits a monotonic increasing trend, with all values exceeding 1. Under identical flow conditions, the particle Stokes number in the inner region of the rear shroud for the upstream impeller stage consistently remains higher than that for the downstream stage. The underlying mechanism is that increased flow rates elevate particle velocities at the impeller outlet, resulting in higher Stokes numbers and enhanced particle inertial effects. This intensifies both the frequency and strength of direct impacts on the inner surface of the rear shroud, leading to expanded wear areas. Under the same flow condition, after undergoing flow rectification through the upstream impeller and return guide vanes, the particle Stokes number in the inner region of the downstream impeller’s rear shroud decreases. This reduction in Stokes number weakens the relative inertial effects, improves particle-fluid coupling, and correspondingly reduces both the probability of direct inertial impacts and the impact intensity on the inner surface of the rear shroud. Consequently, the wear area on the inner surface of the downstream impeller’s rear shroud becomes smaller than that of the upstream stage.
Figure 17 shows the particle Stokes number distribution curves in the impeller domain under different flow rates. As the flow rate increases from 0.8Qd to 1.2Qd, the particle Stokes number in the same-stage impeller domain exhibits an increasing trend. Under identical flow conditions, the particle Stokes number in the upstream impeller domain is higher than that in the downstream domain. The increased flow rate leads to higher particle velocities and consequently larger Stokes numbers, enhancing particle inertial effects. This results in greater impact momentum and frequency of particles on both the pressure side and suction side of the impeller, thereby aggravating wear. Under the same flow condition, the particle Stokes number in the downstream impeller domain is smaller than that in the upstream domain. After particles pass through the upstream impeller and return guide vanes, the interception and flow rectification effects reduce the number of particles entering the downstream impeller and decrease the particle Stokes number. This weakens the relative inertial effects, improves particle-fluid coupling, and reduces both the probability of direct inertial collisions and impact intensity on blade surfaces. Consequently, wear on both the pressure side and suction side of the downstream impeller is less severe than that of the upstream impeller.
Figure 18 shows the particle Stokes number distribution curves in the peripheral casing domain under different flow rates. As the flow rate increases from 0.8Qd to 1.2Qd, the particle Stokes number in the same-stage peripheral casing domain exhibits an increasing trend, with all values exceeding 1. Under identical flow conditions, the particle Stokes number in the upstream peripheral casing domain is higher than that in the downstream domain. The underlying mechanism is that increased flow rates lead to higher particle ejection velocities from the impeller outlet, resulting in larger Stokes numbers and enhanced inertial forces. This intensifies particle impacts on the peripheral casing, thereby aggravating wear. Under the same flow condition, when particles move from the upstream impeller to the downstream casing chamber, the flow rectification effect of the return guide vanes reduces the particle Stokes number. This improvement in particle-fluid coupling weakens inertial effects, consequently decreasing both the intensity of direct, high-velocity impacts on the casing and the resulting wear severity in the downstream peripheral casing compared to the upstream casing.

5. Conclusions

To investigate the solid-liquid two-phase flow characteristics and wear patterns of impellers and peripheral casings in multistage centrifugal pumps under different flow conditions, numerical simulations were conducted based on the Euler–Lagrange approach and Tabakoff wear model. Hydraulic performance experiments verified the accuracy of the numerical simulations, enabling analysis of flow rate variations on particle trajectories, wear distributions of impellers and peripheral casings, and hydraulic performance. The following conclusions were drawn.
(1)
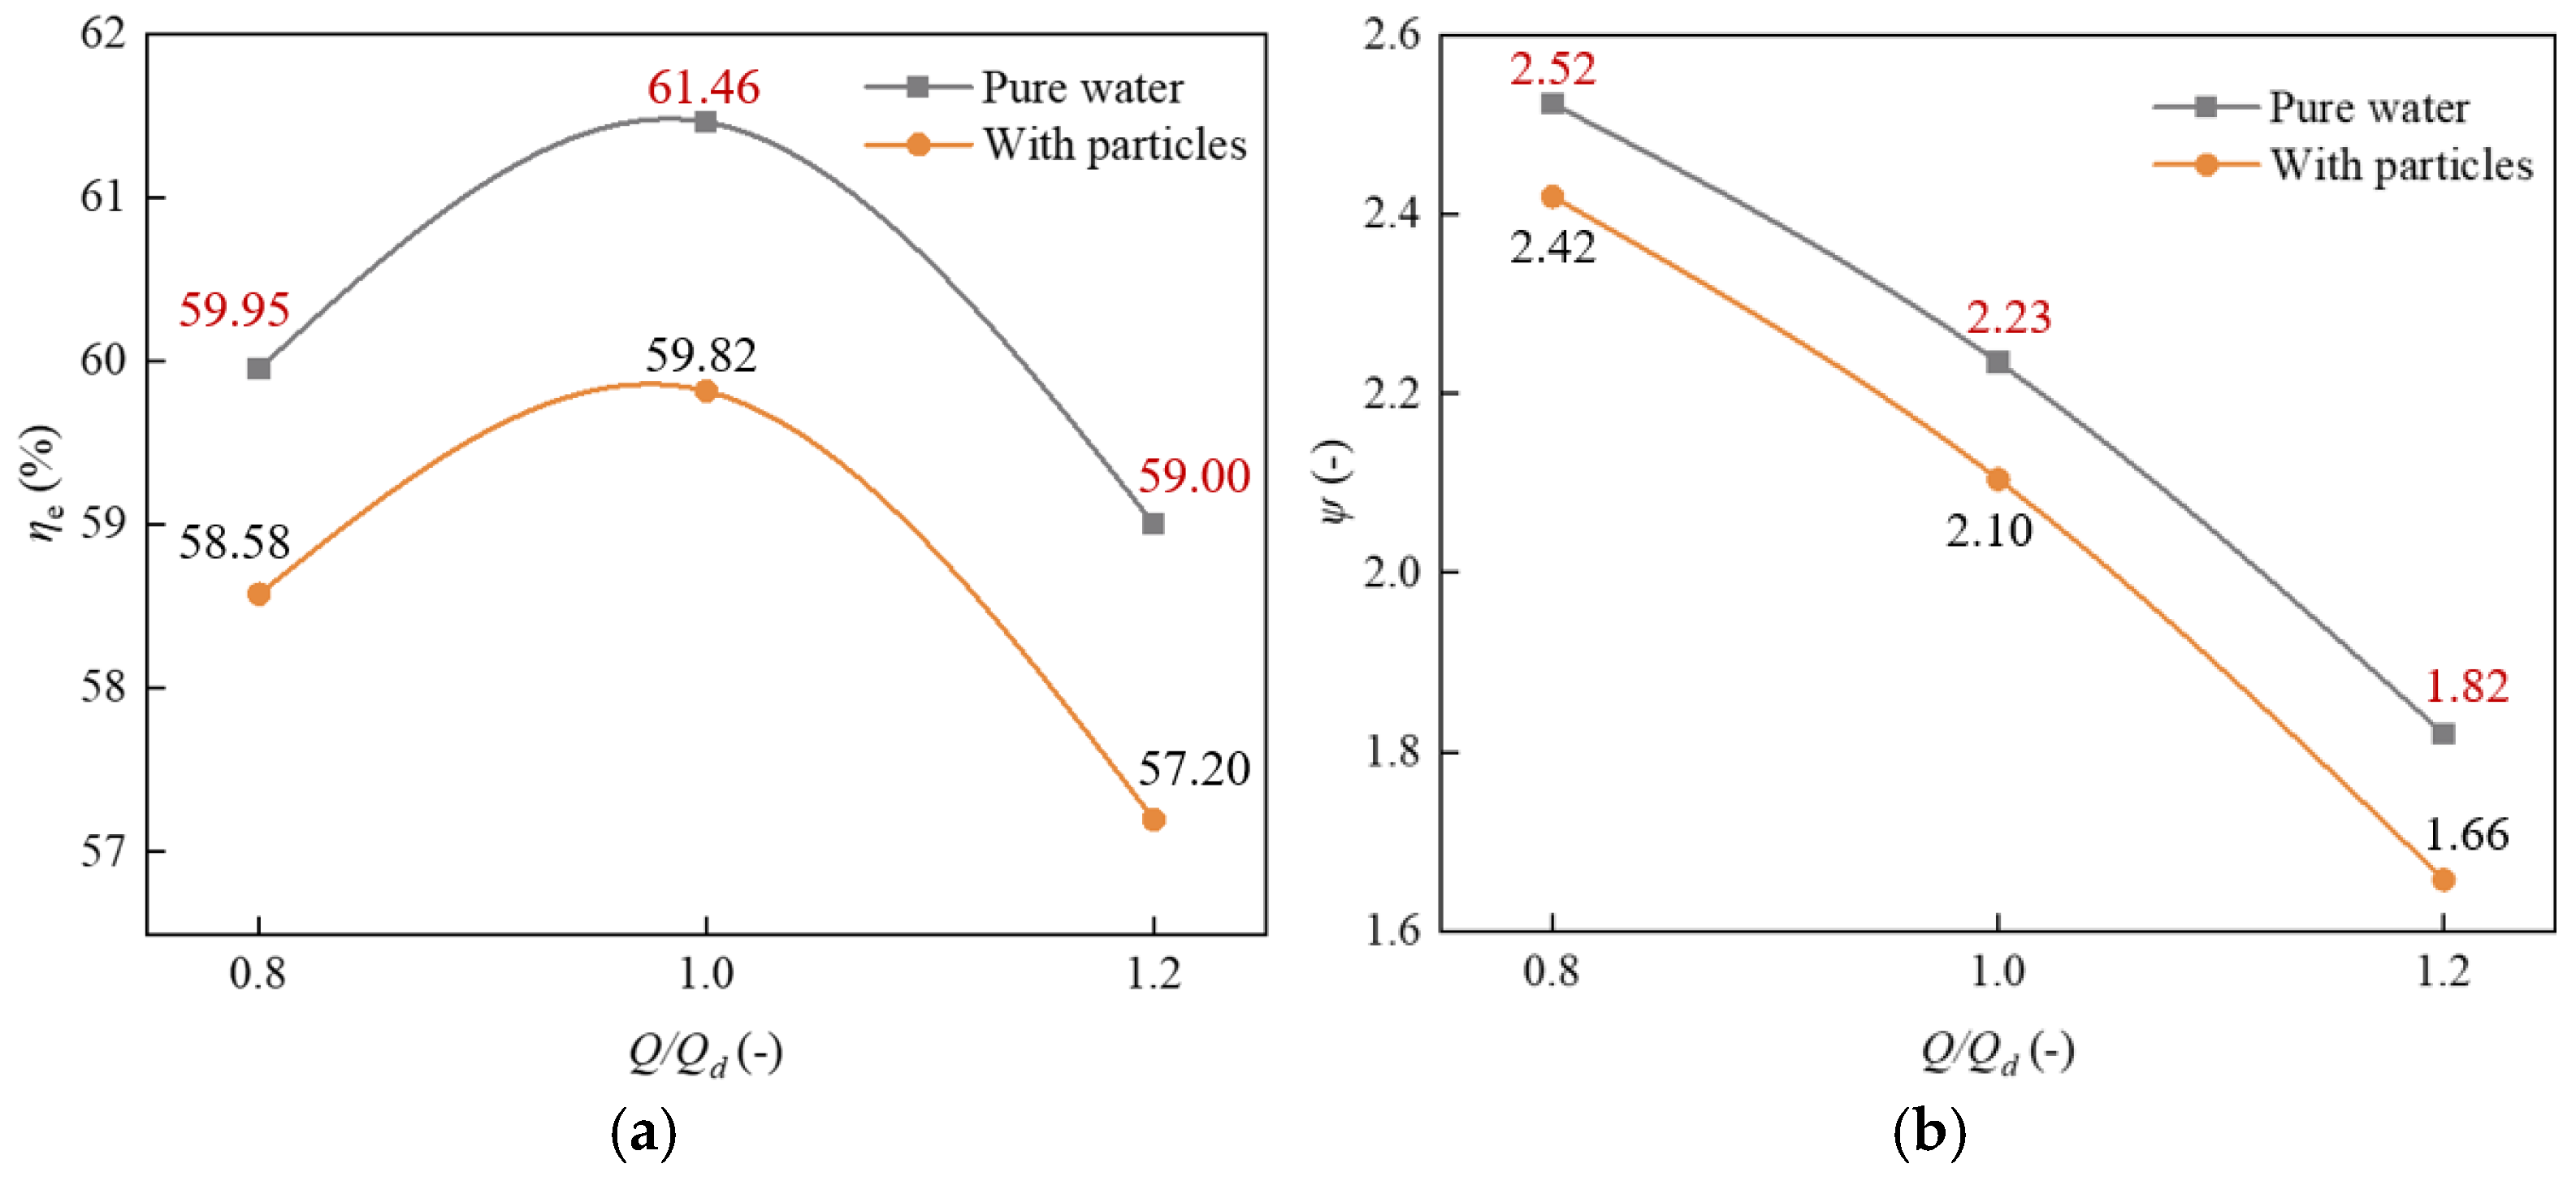
As the flow rate increases, both efficiency and head of the centrifugal pump under solid-liquid two-phase conditions gradually decrease compared to clean water conditions. This occurs because higher flow rates enhance particle momentum, intensifying energy dissipation through inertial collisions. Simultaneously, the impeller requires additional work to maintain particle transport. These combined effects lead to increased shaft power, ultimately resulting in degraded pump performance characteristics.
(2)
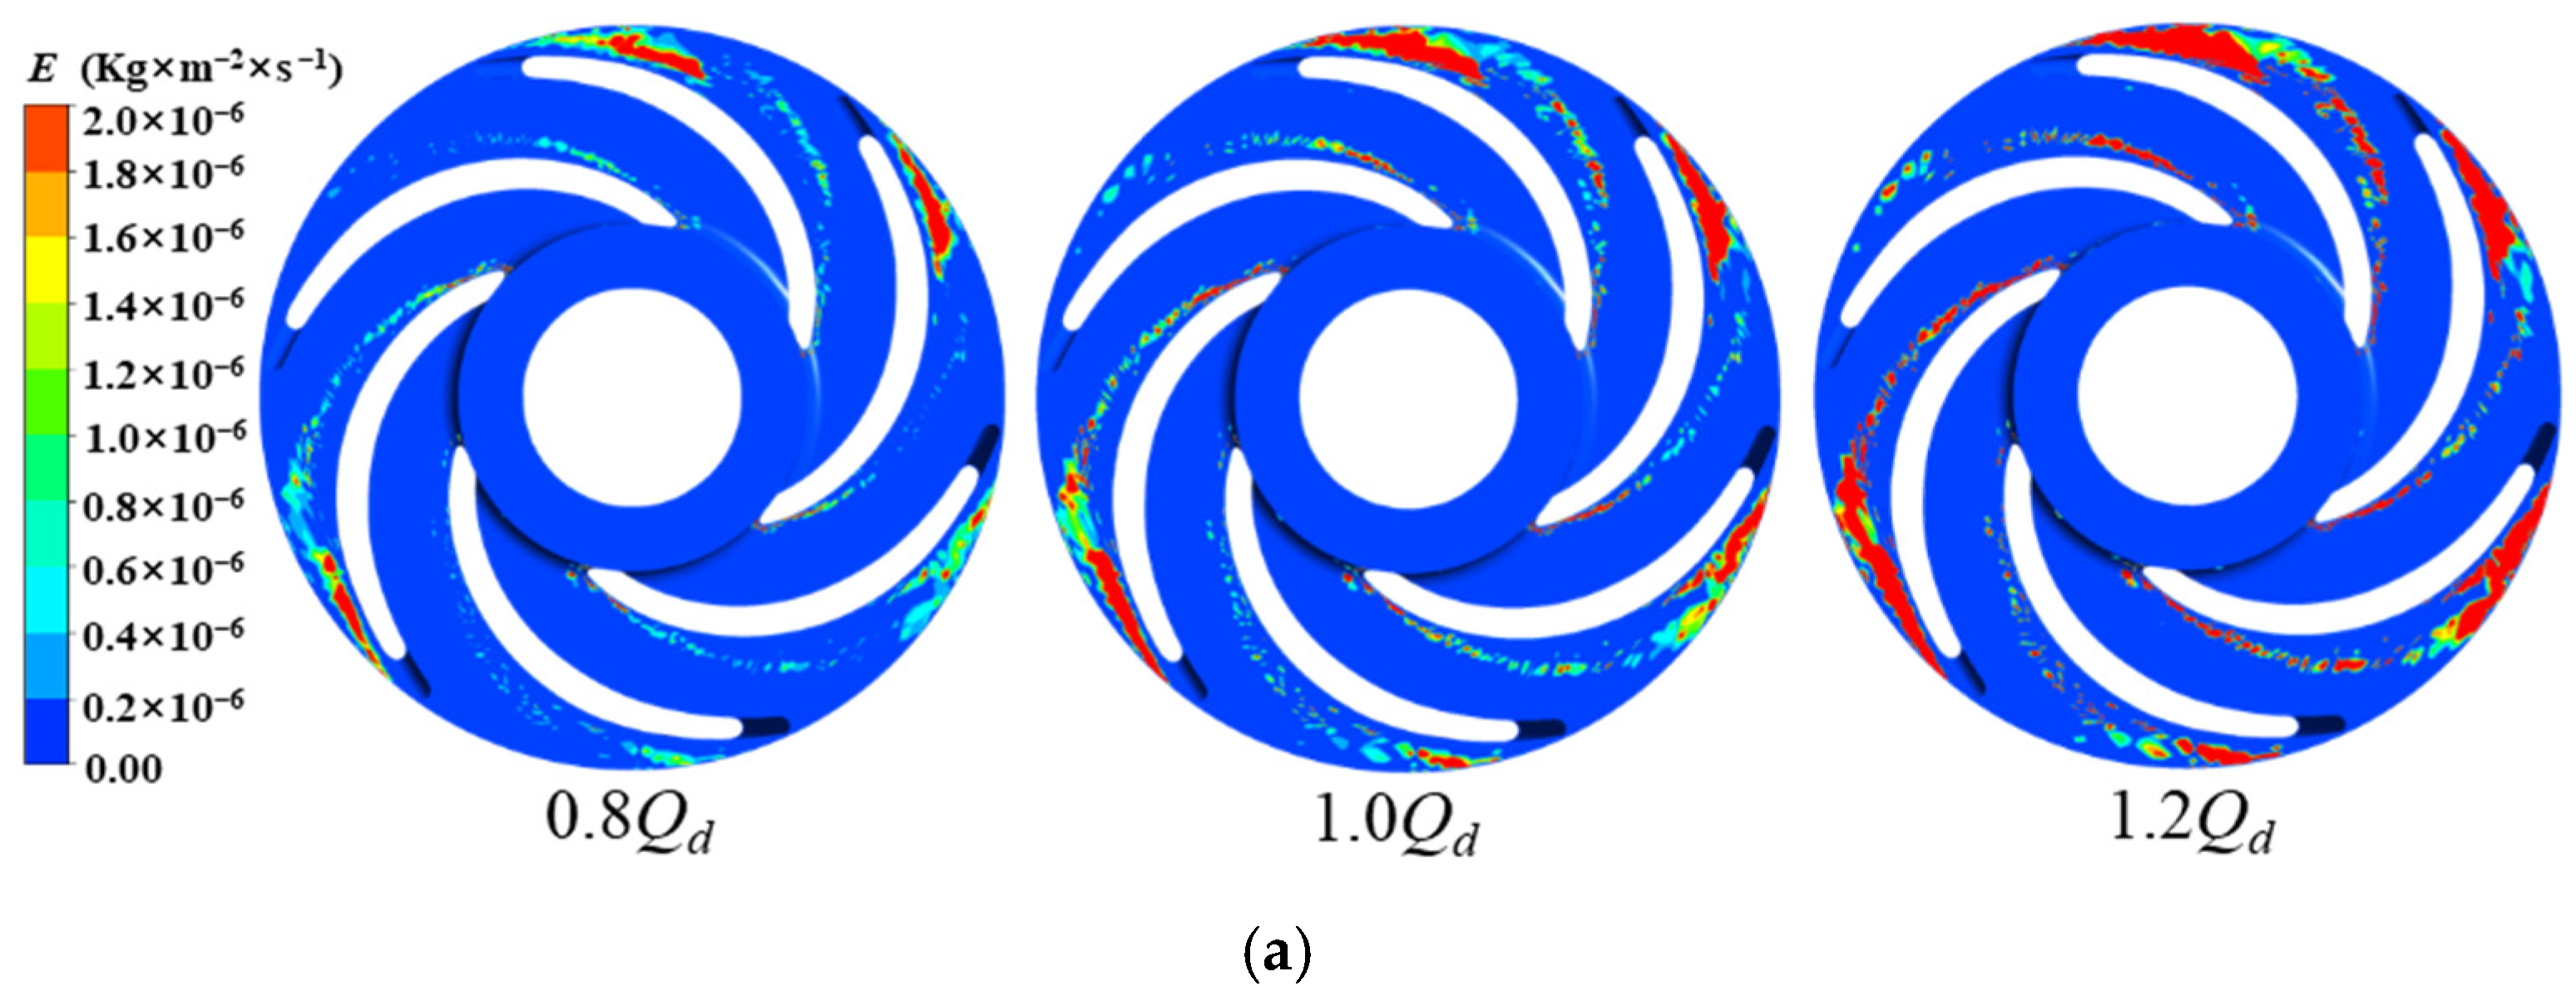
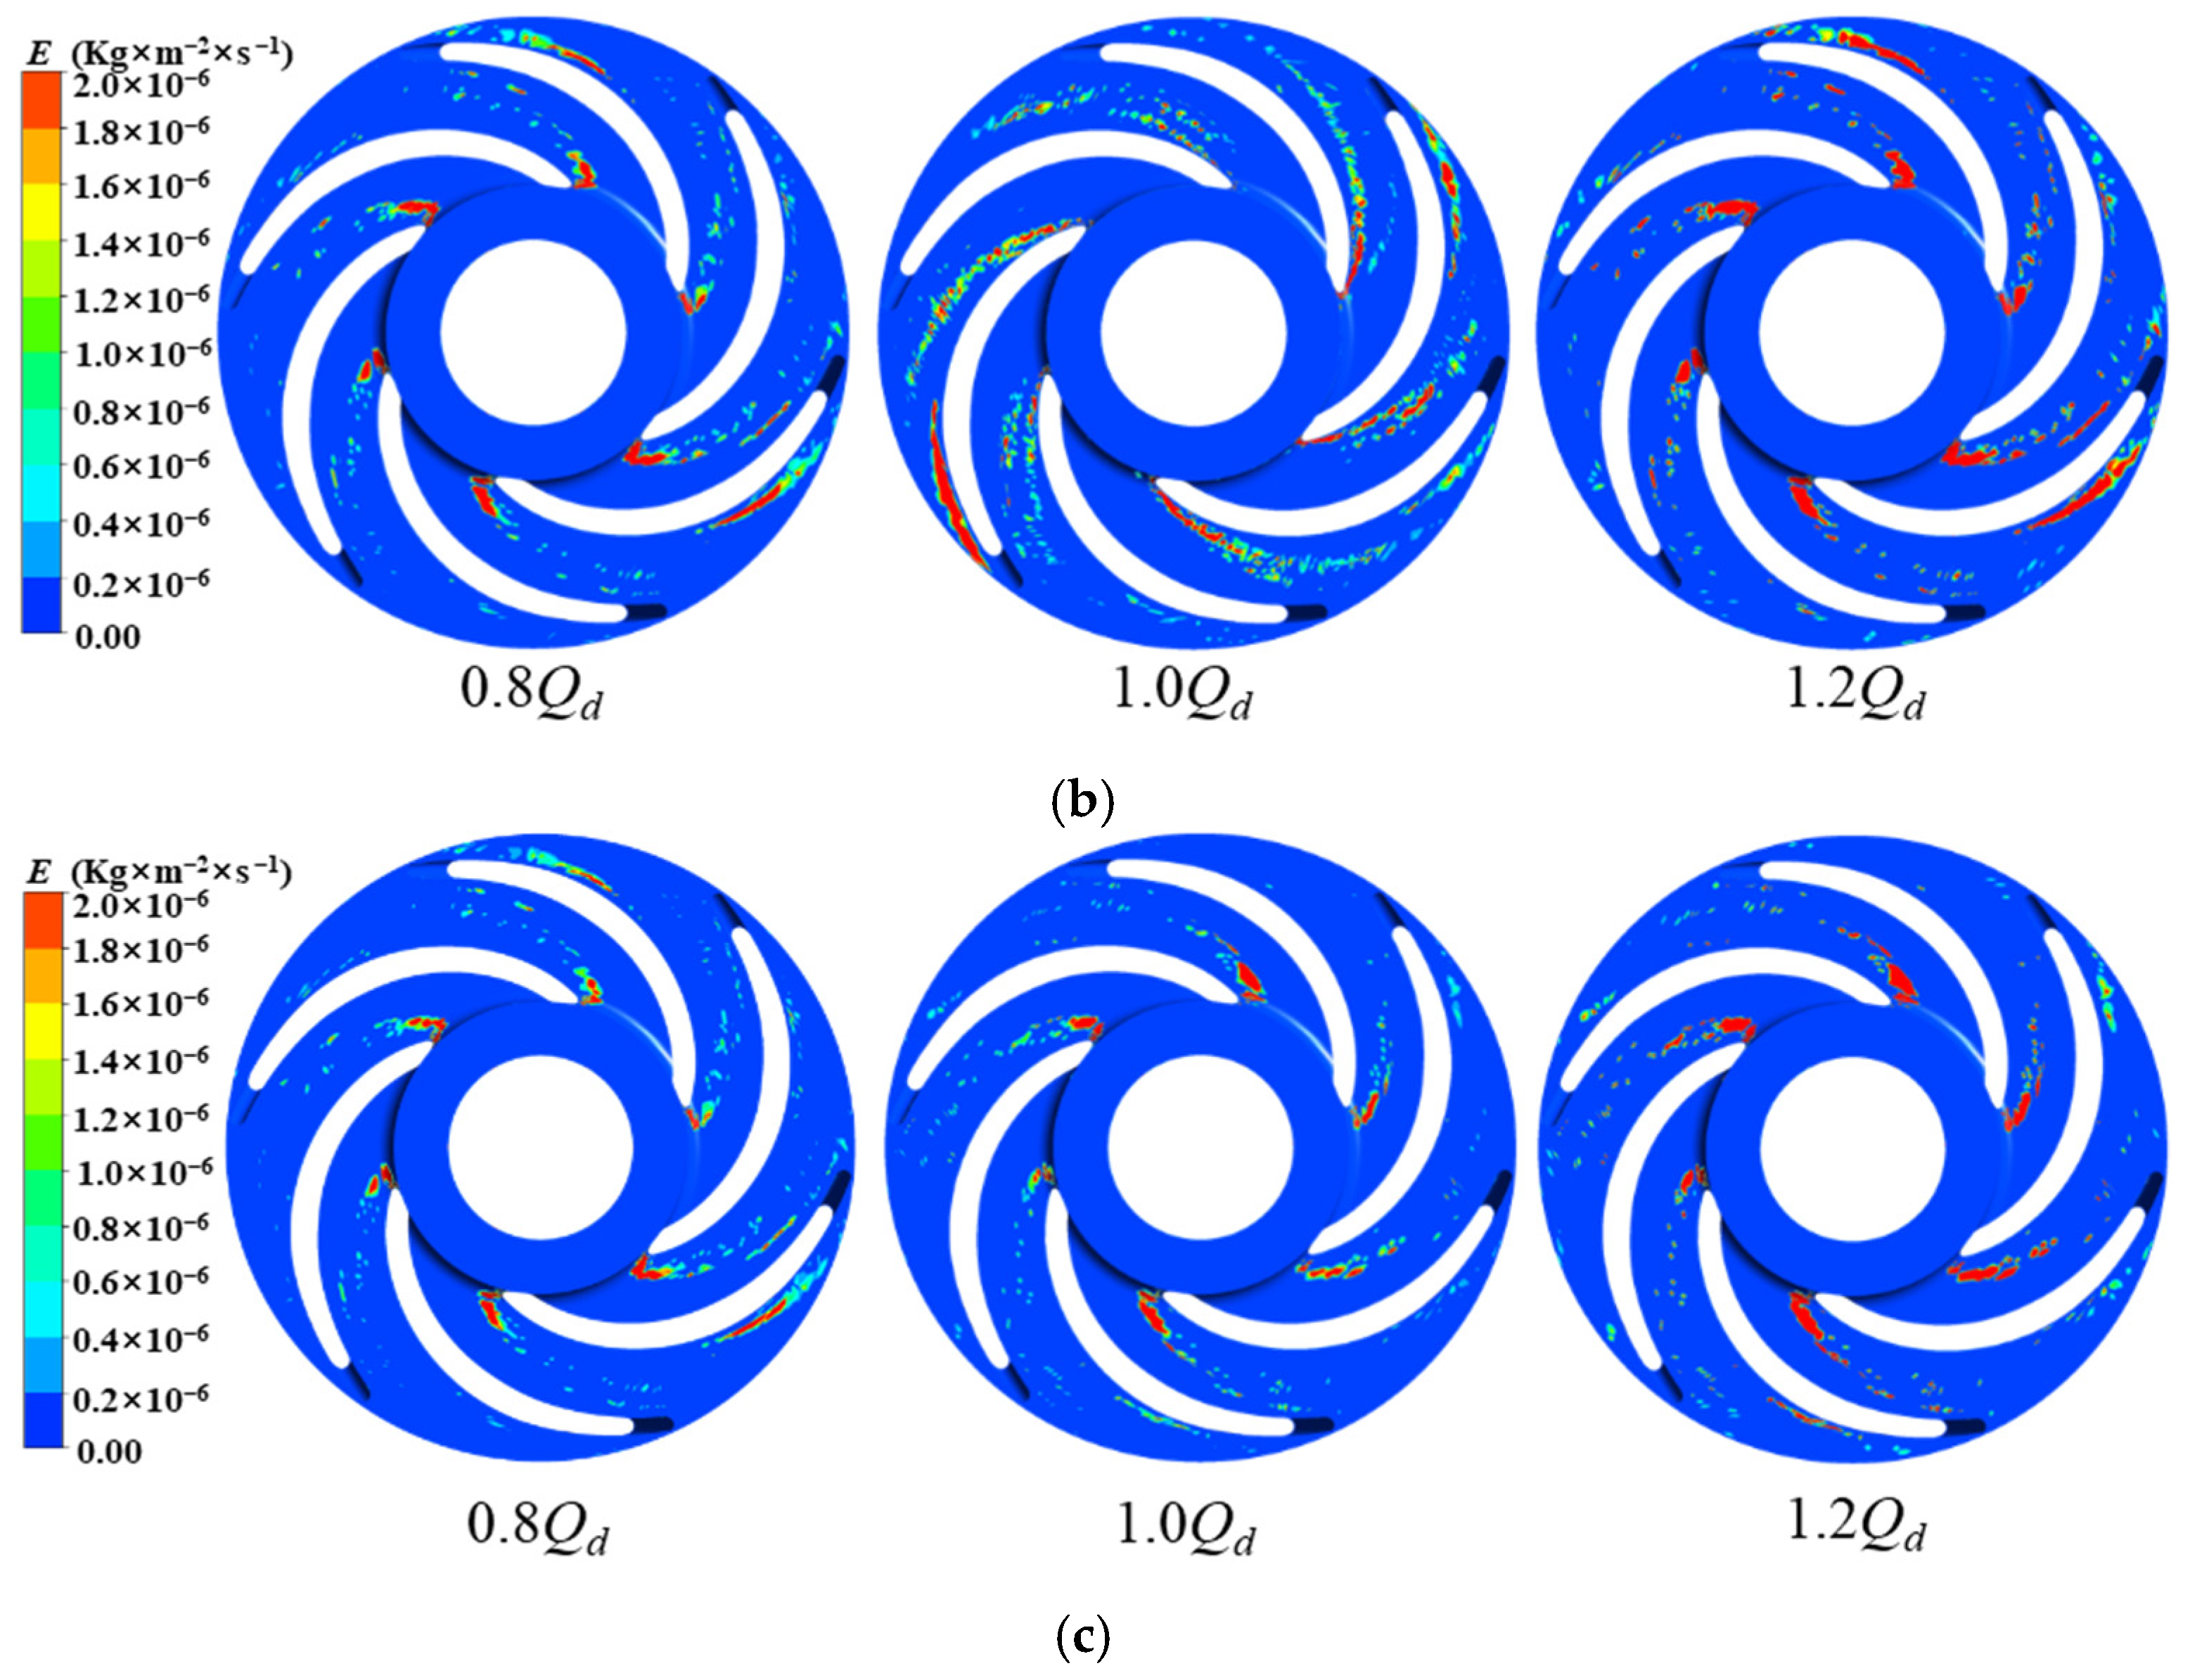
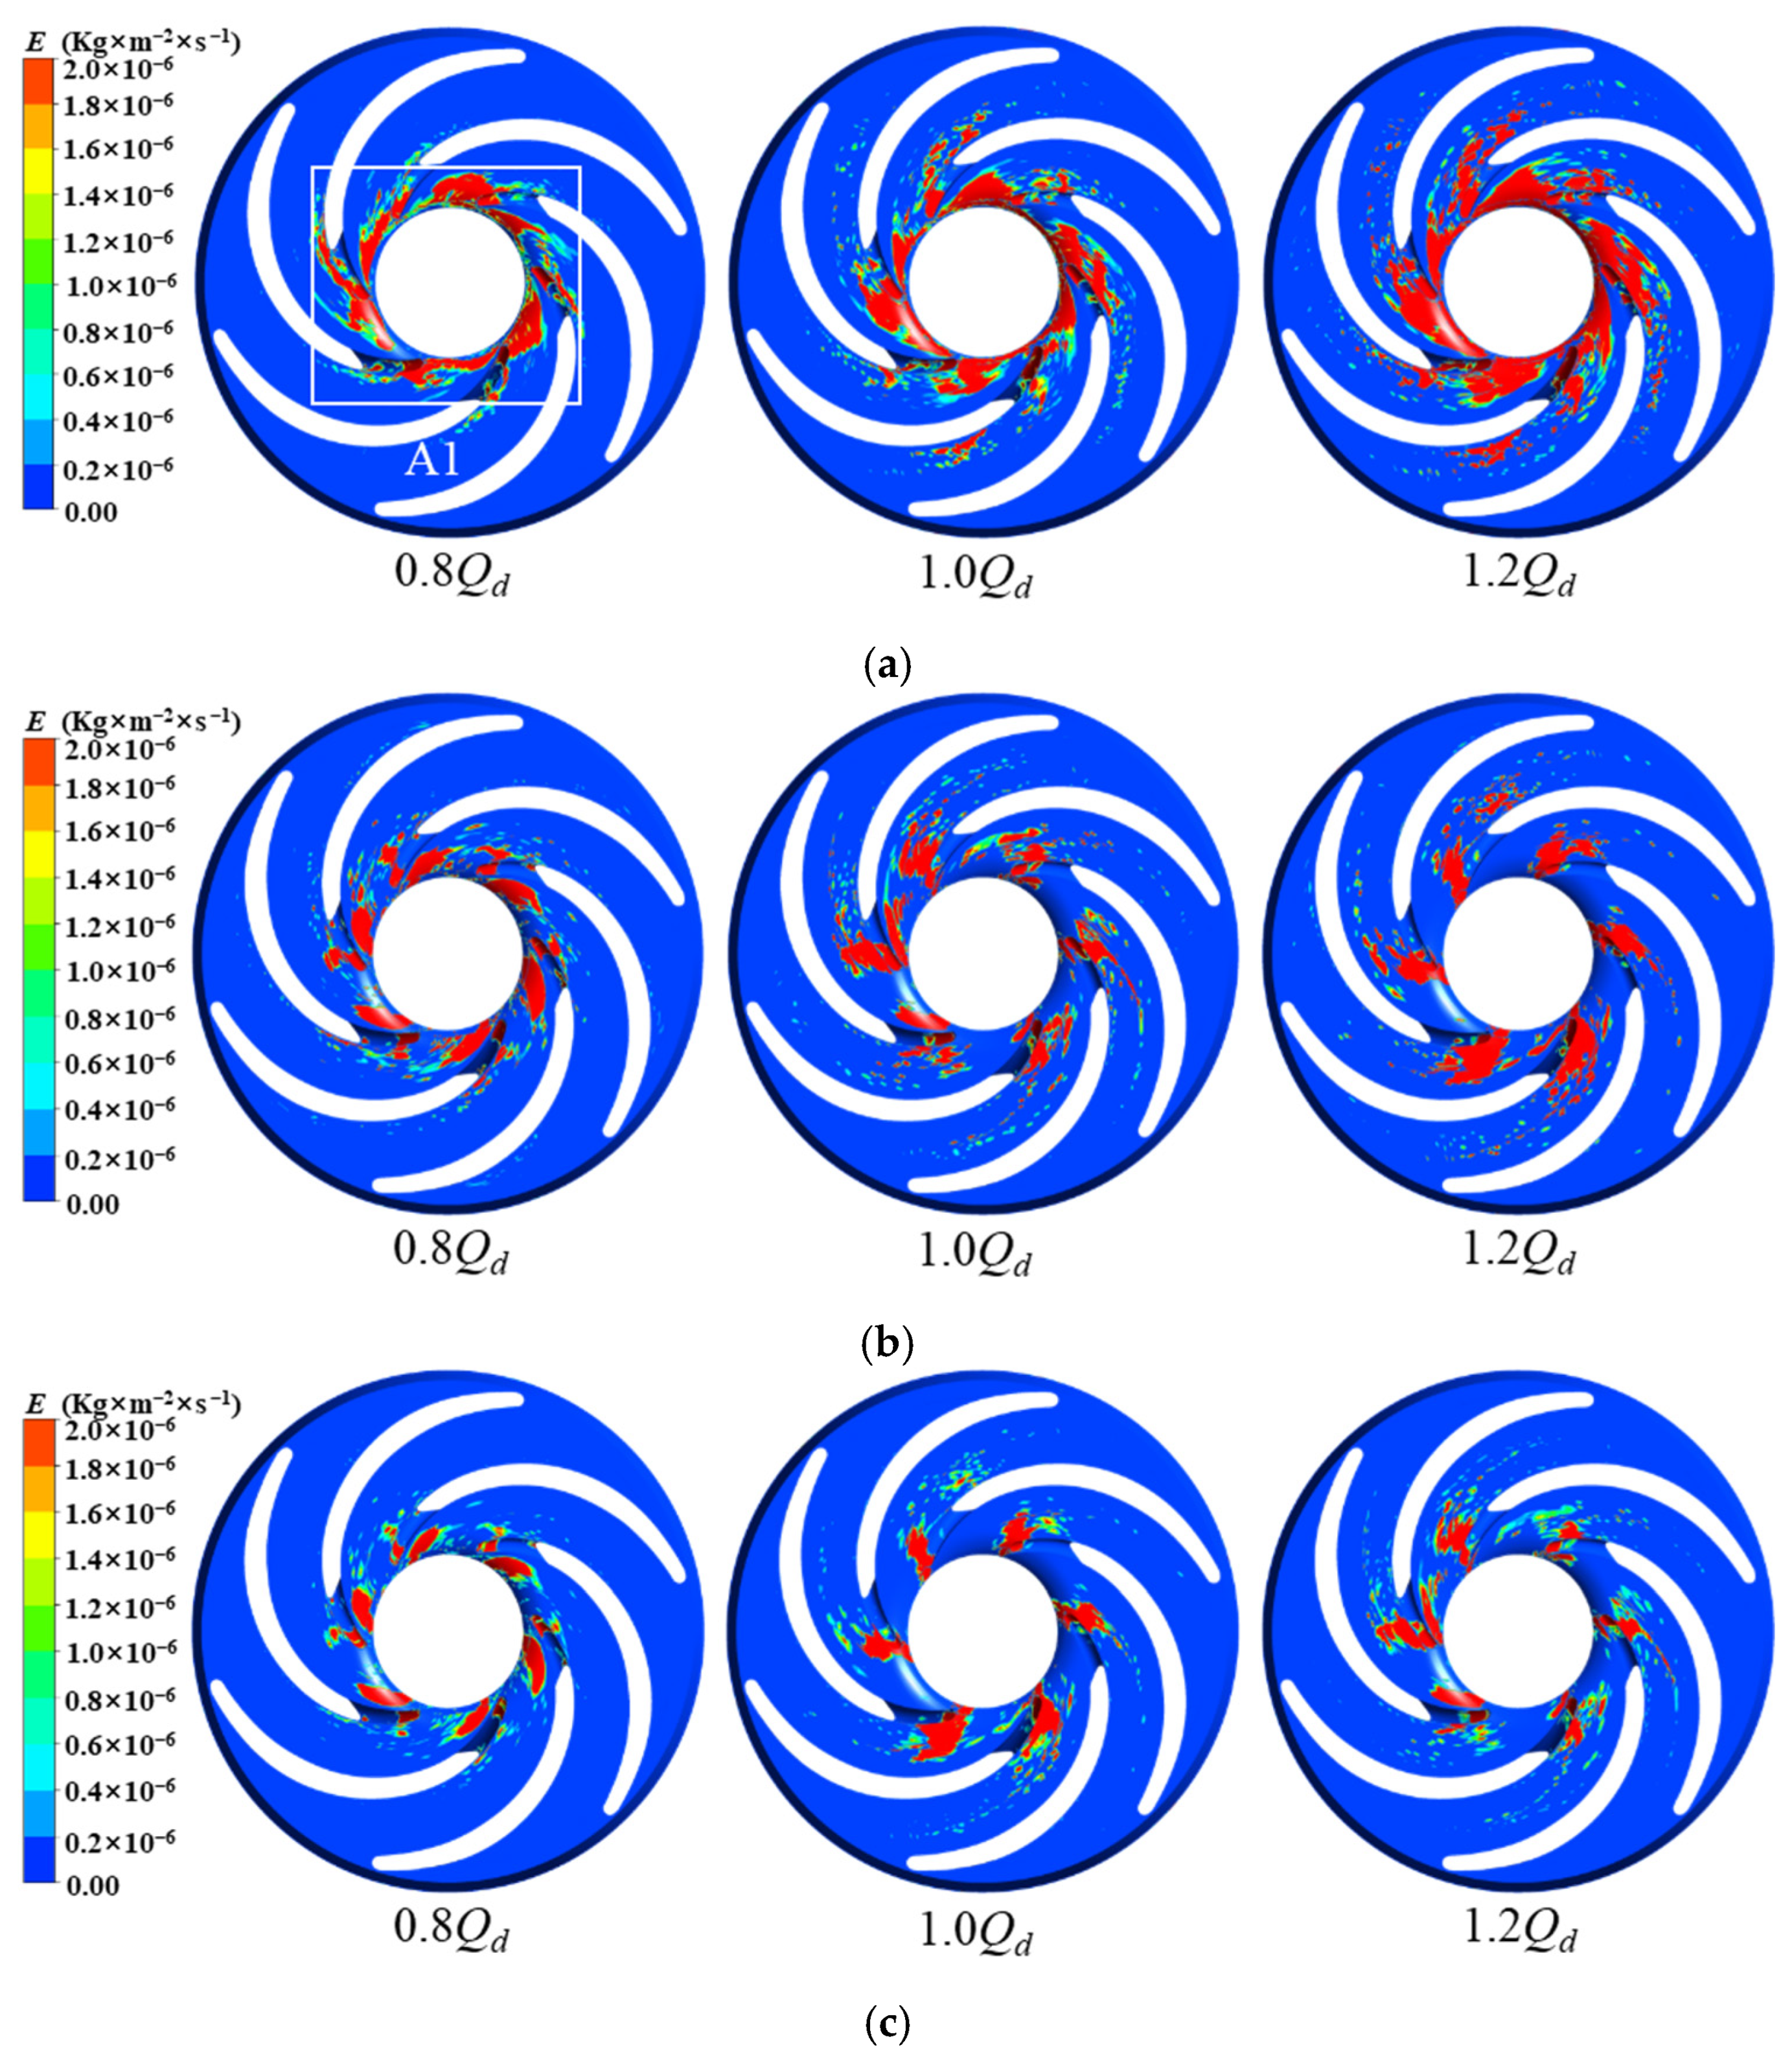
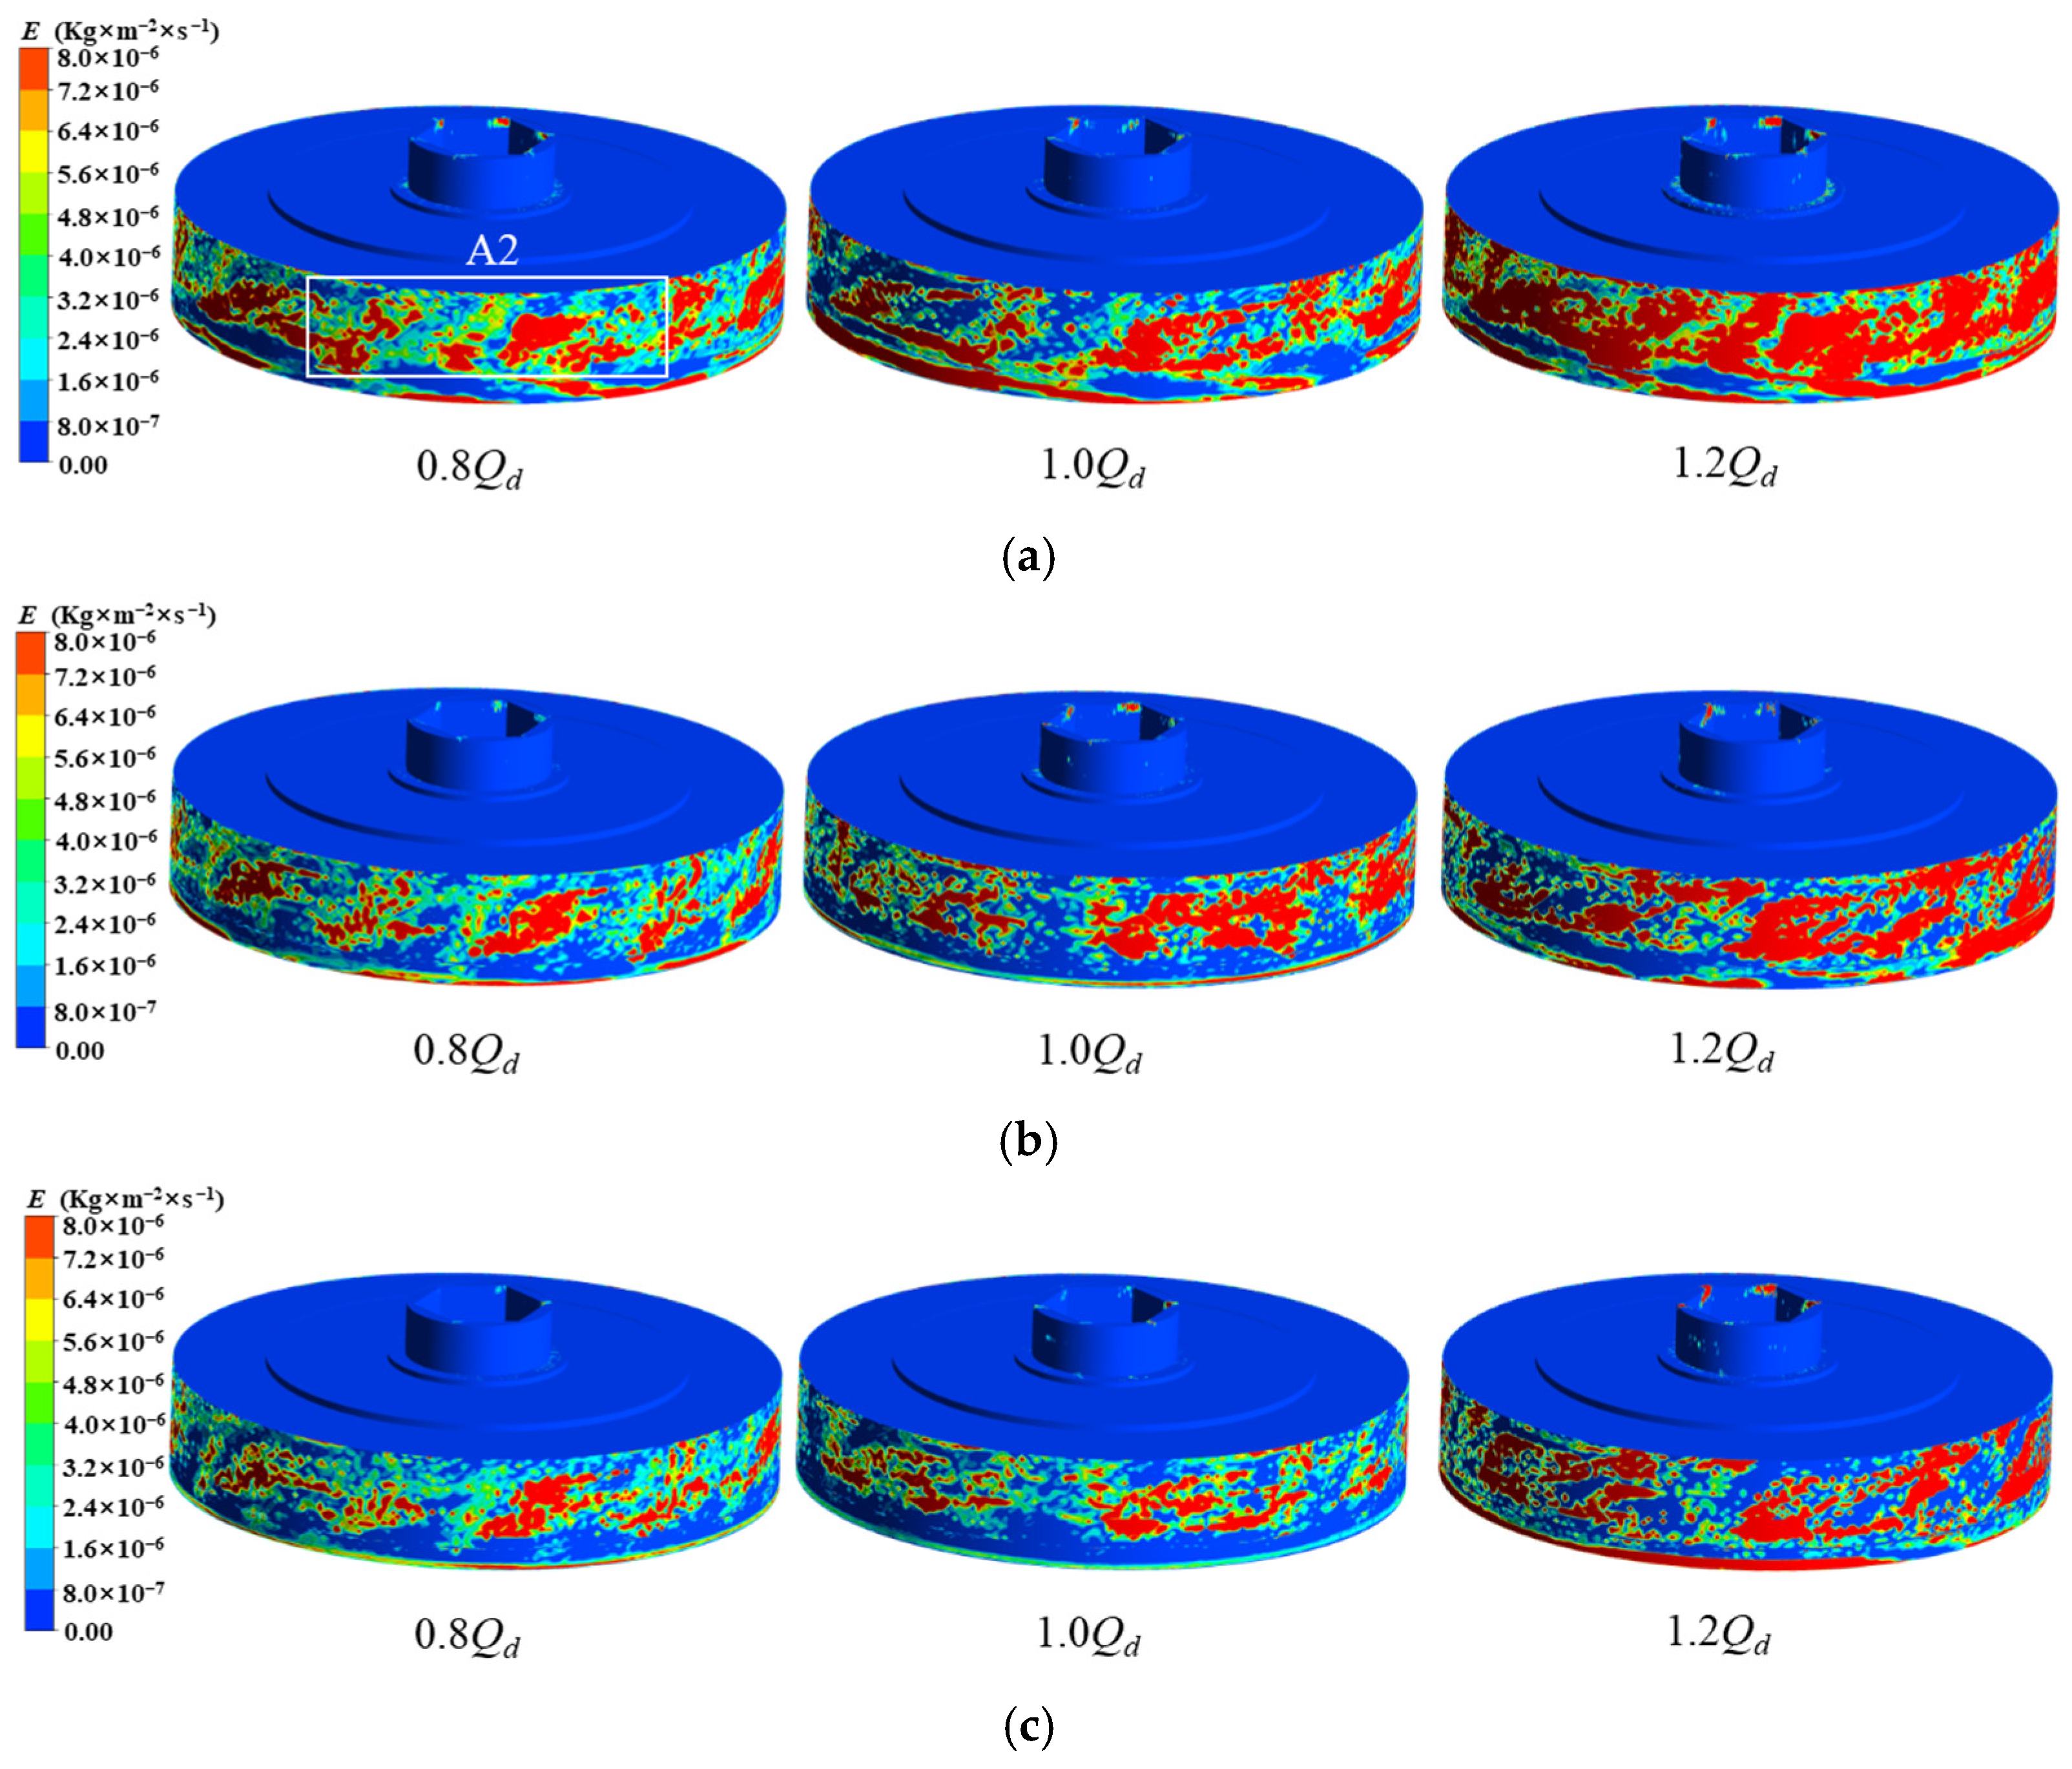
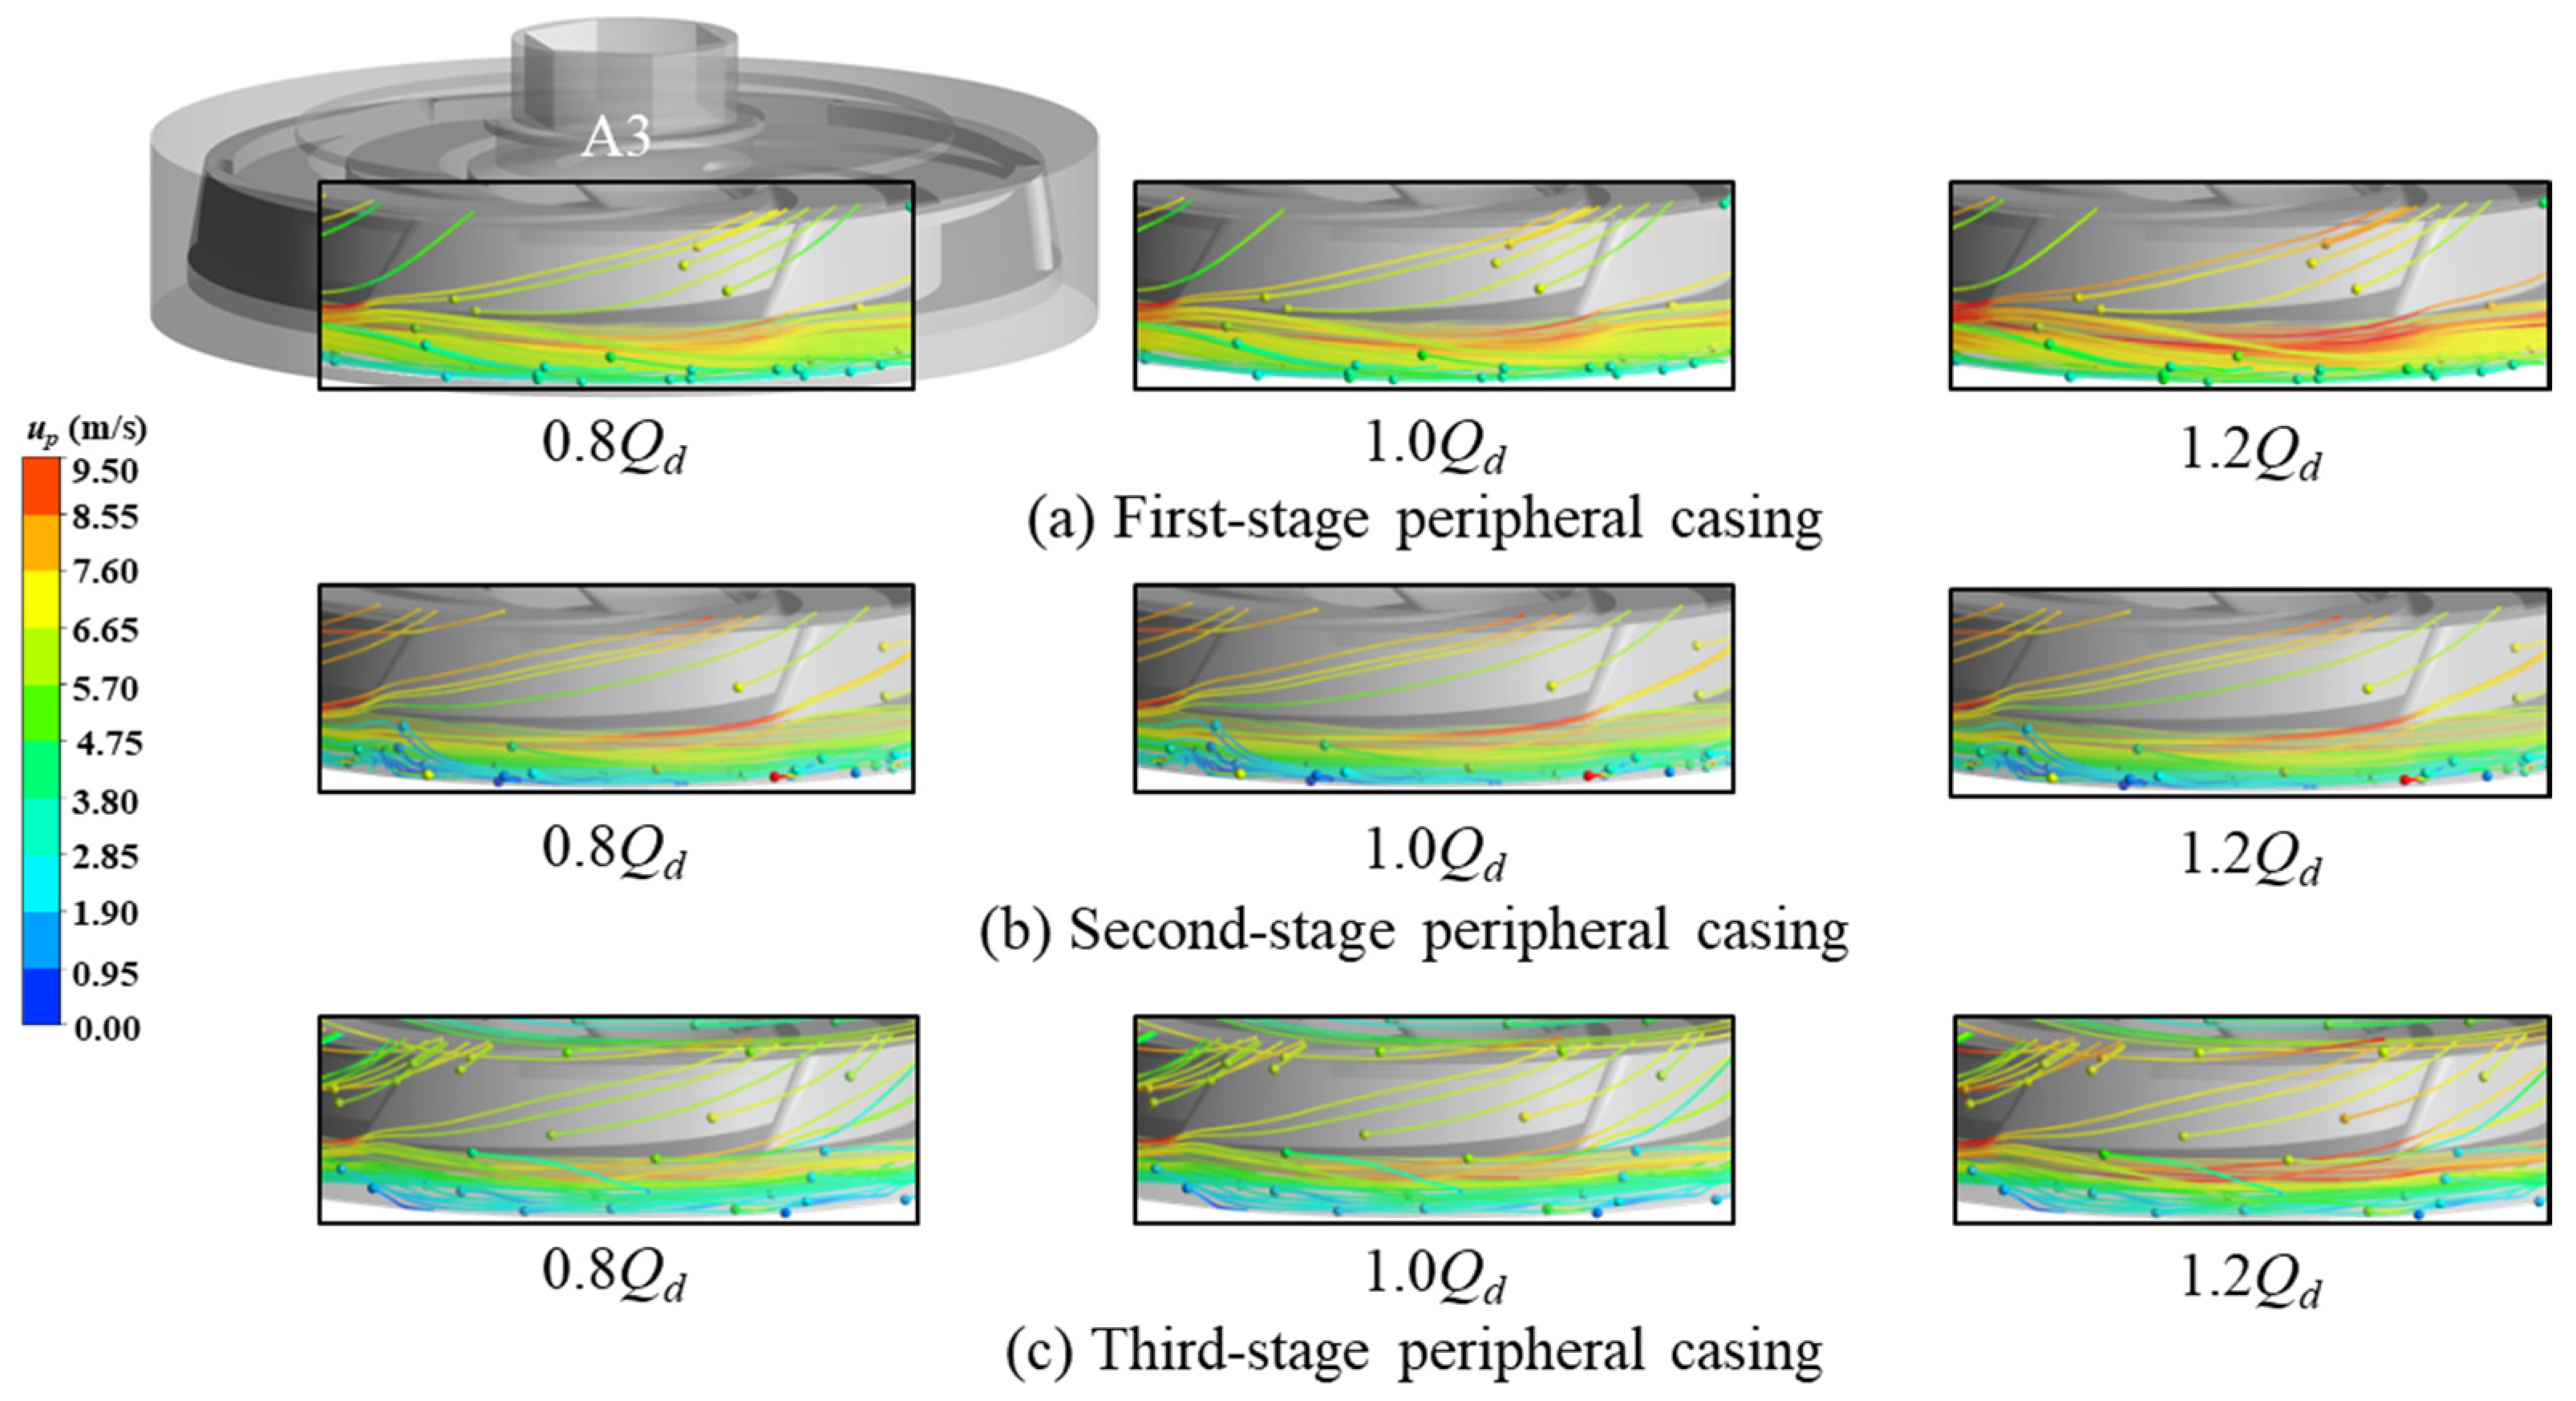
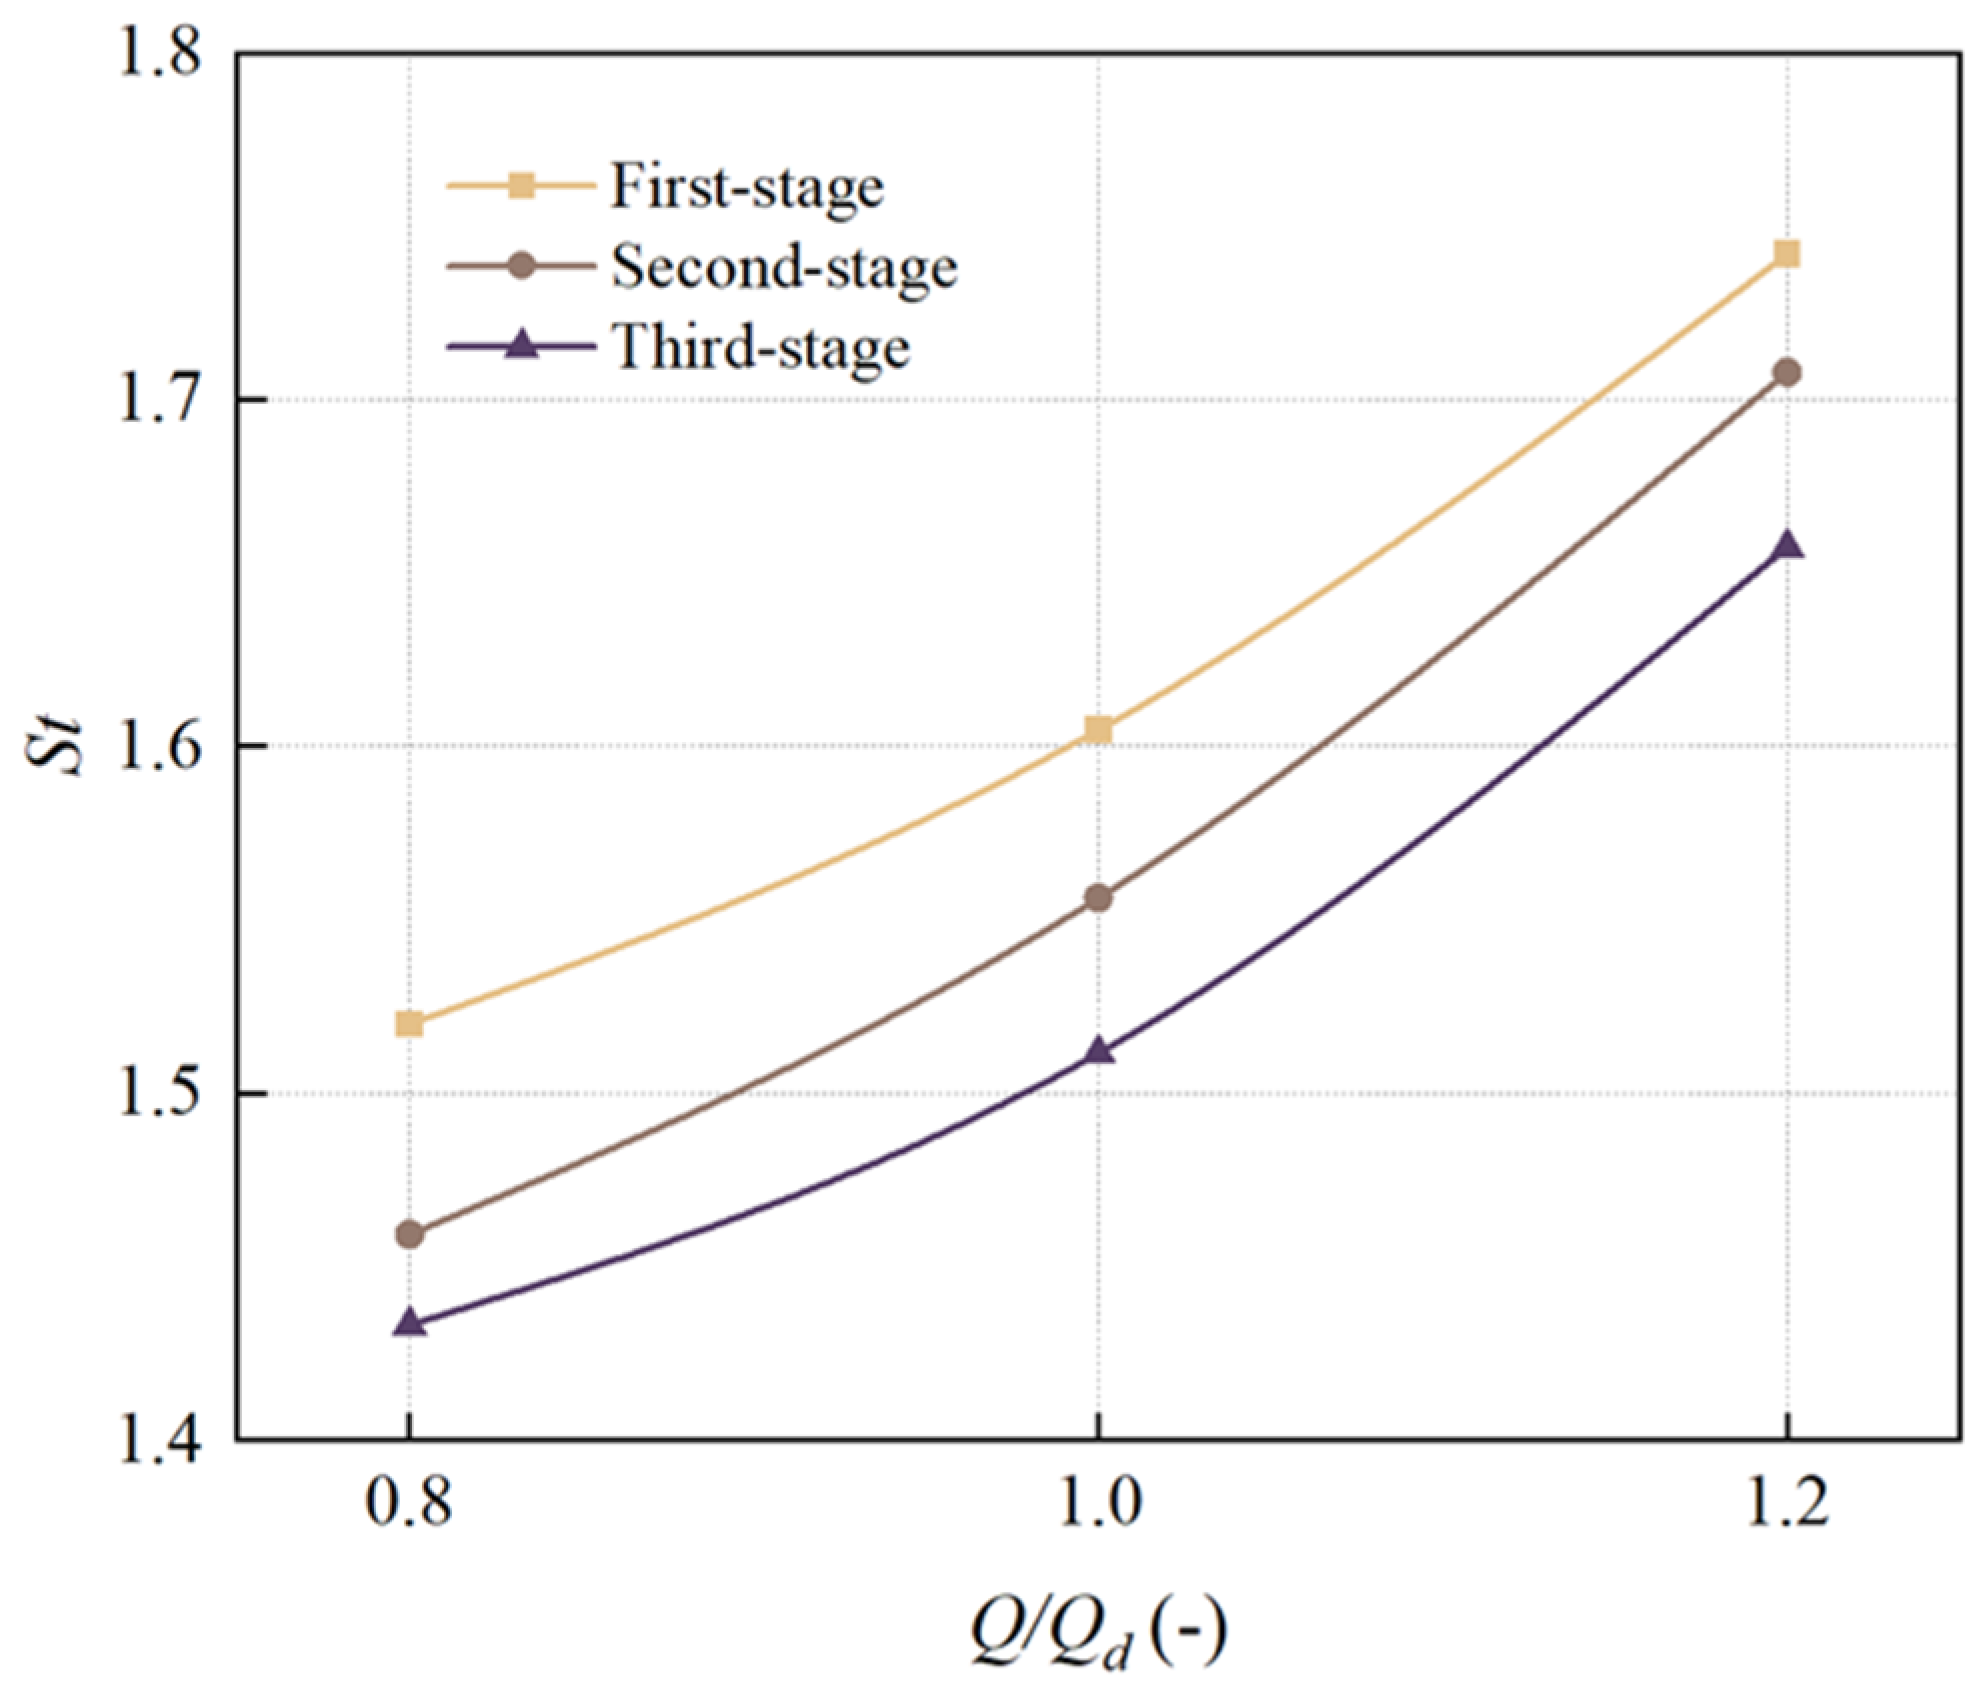
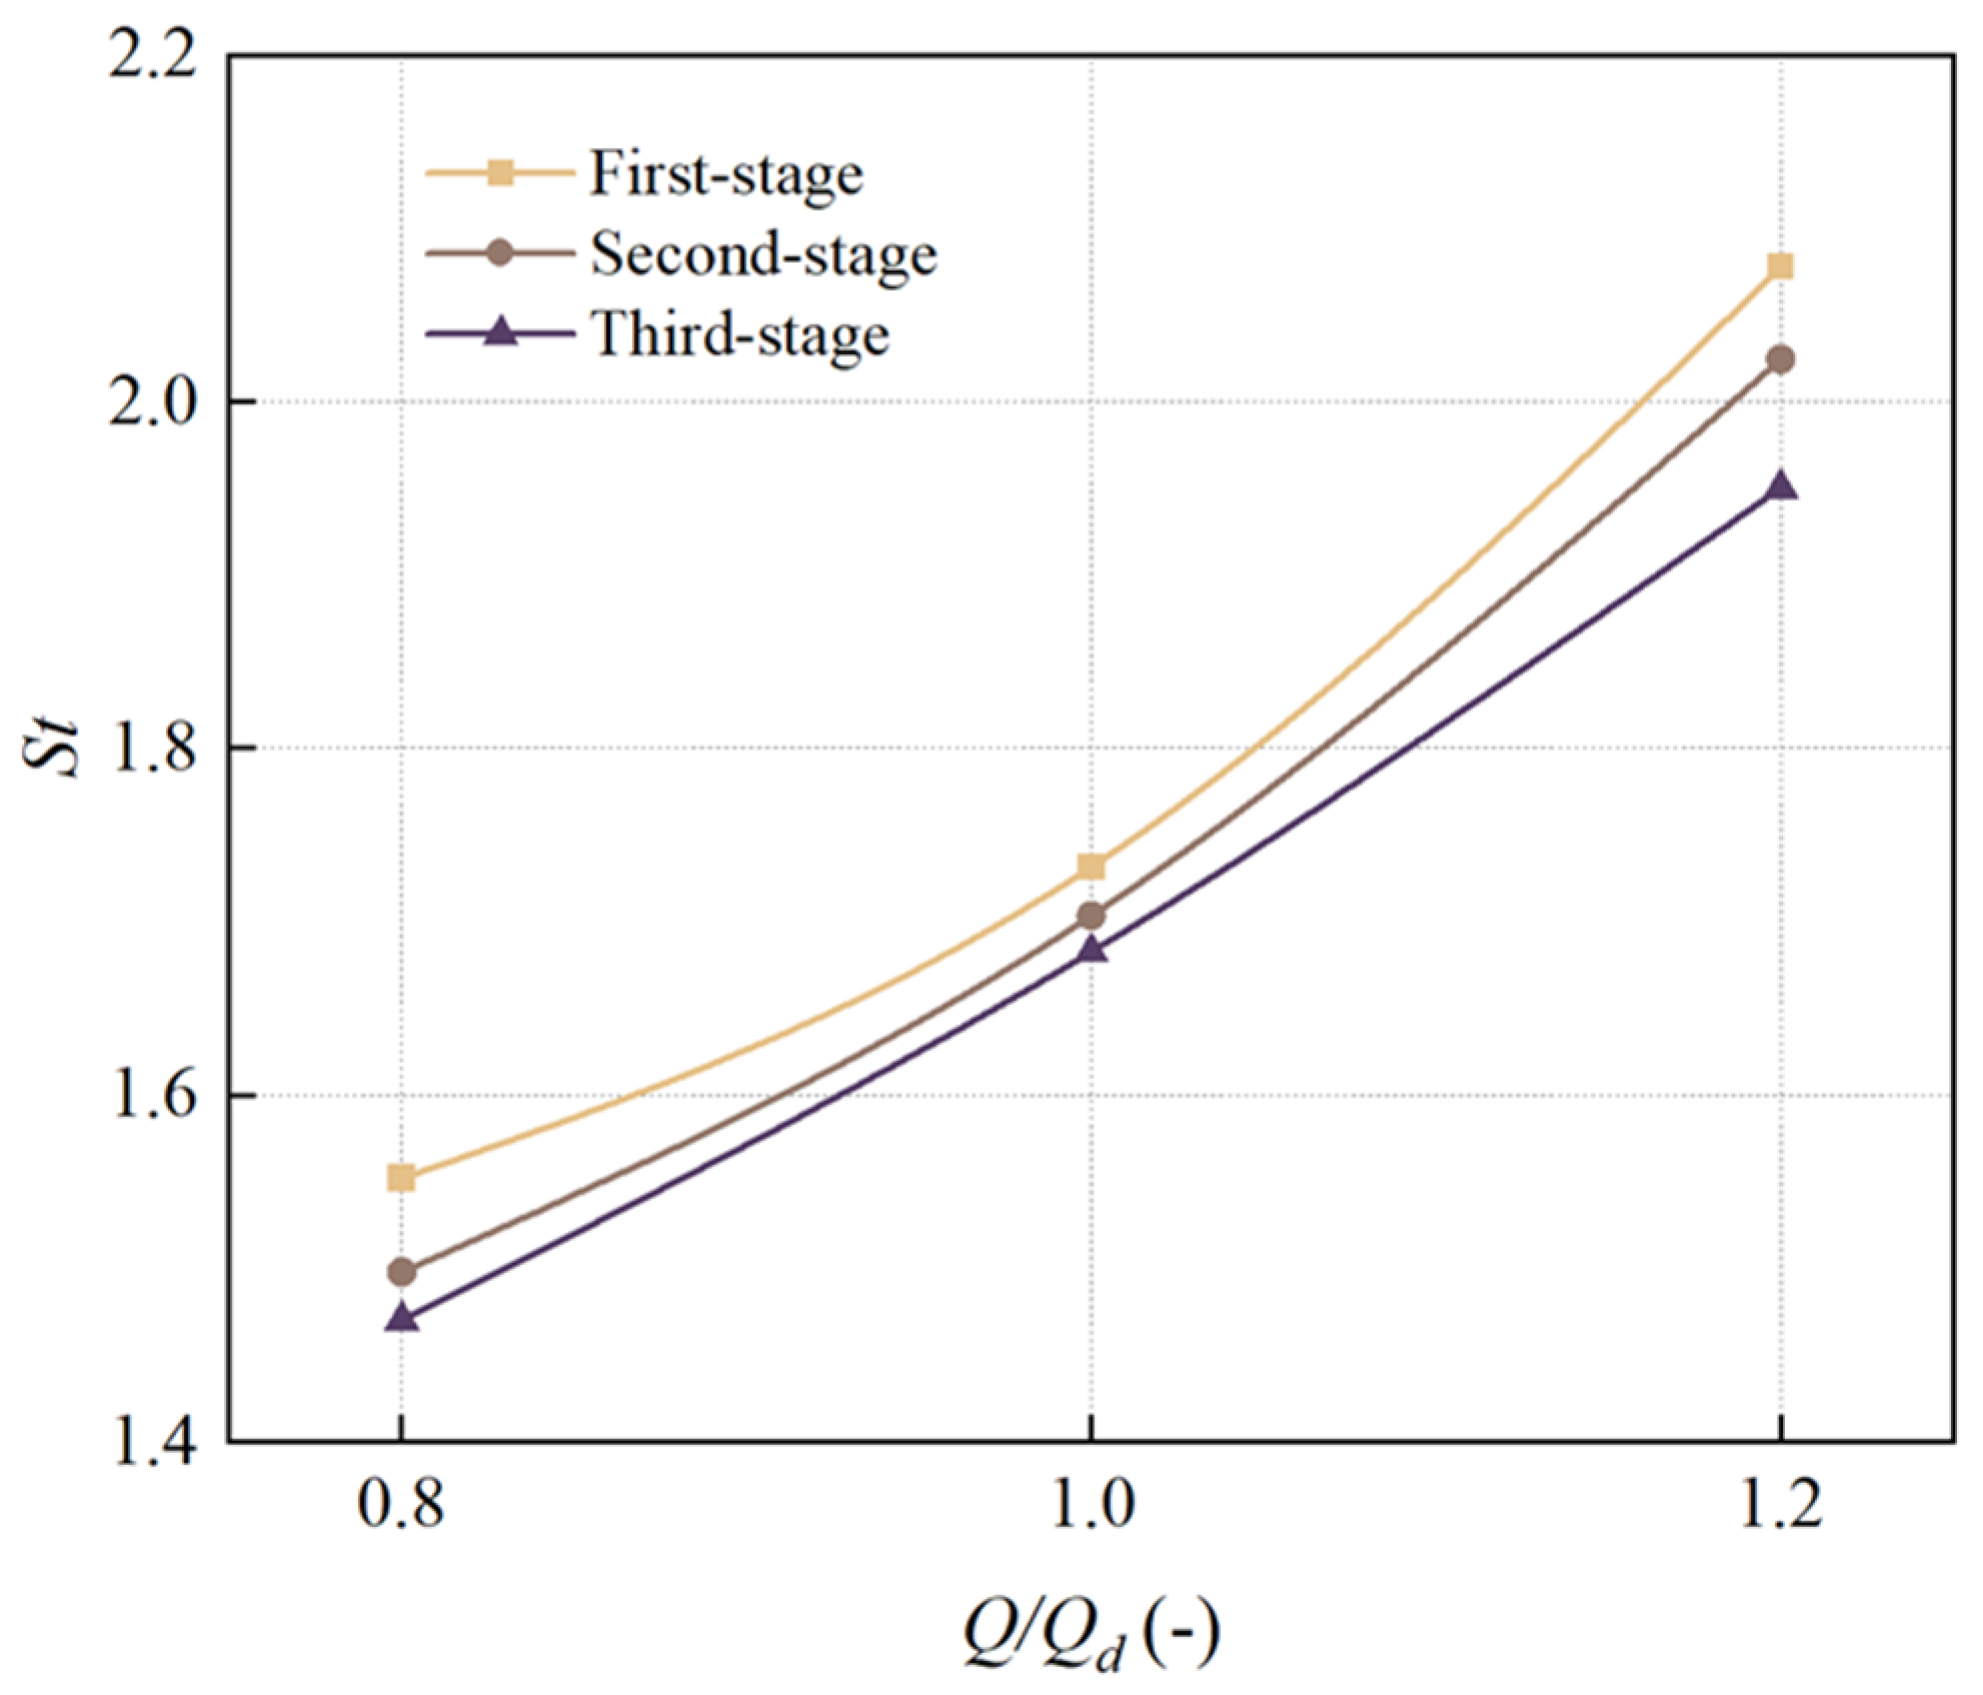
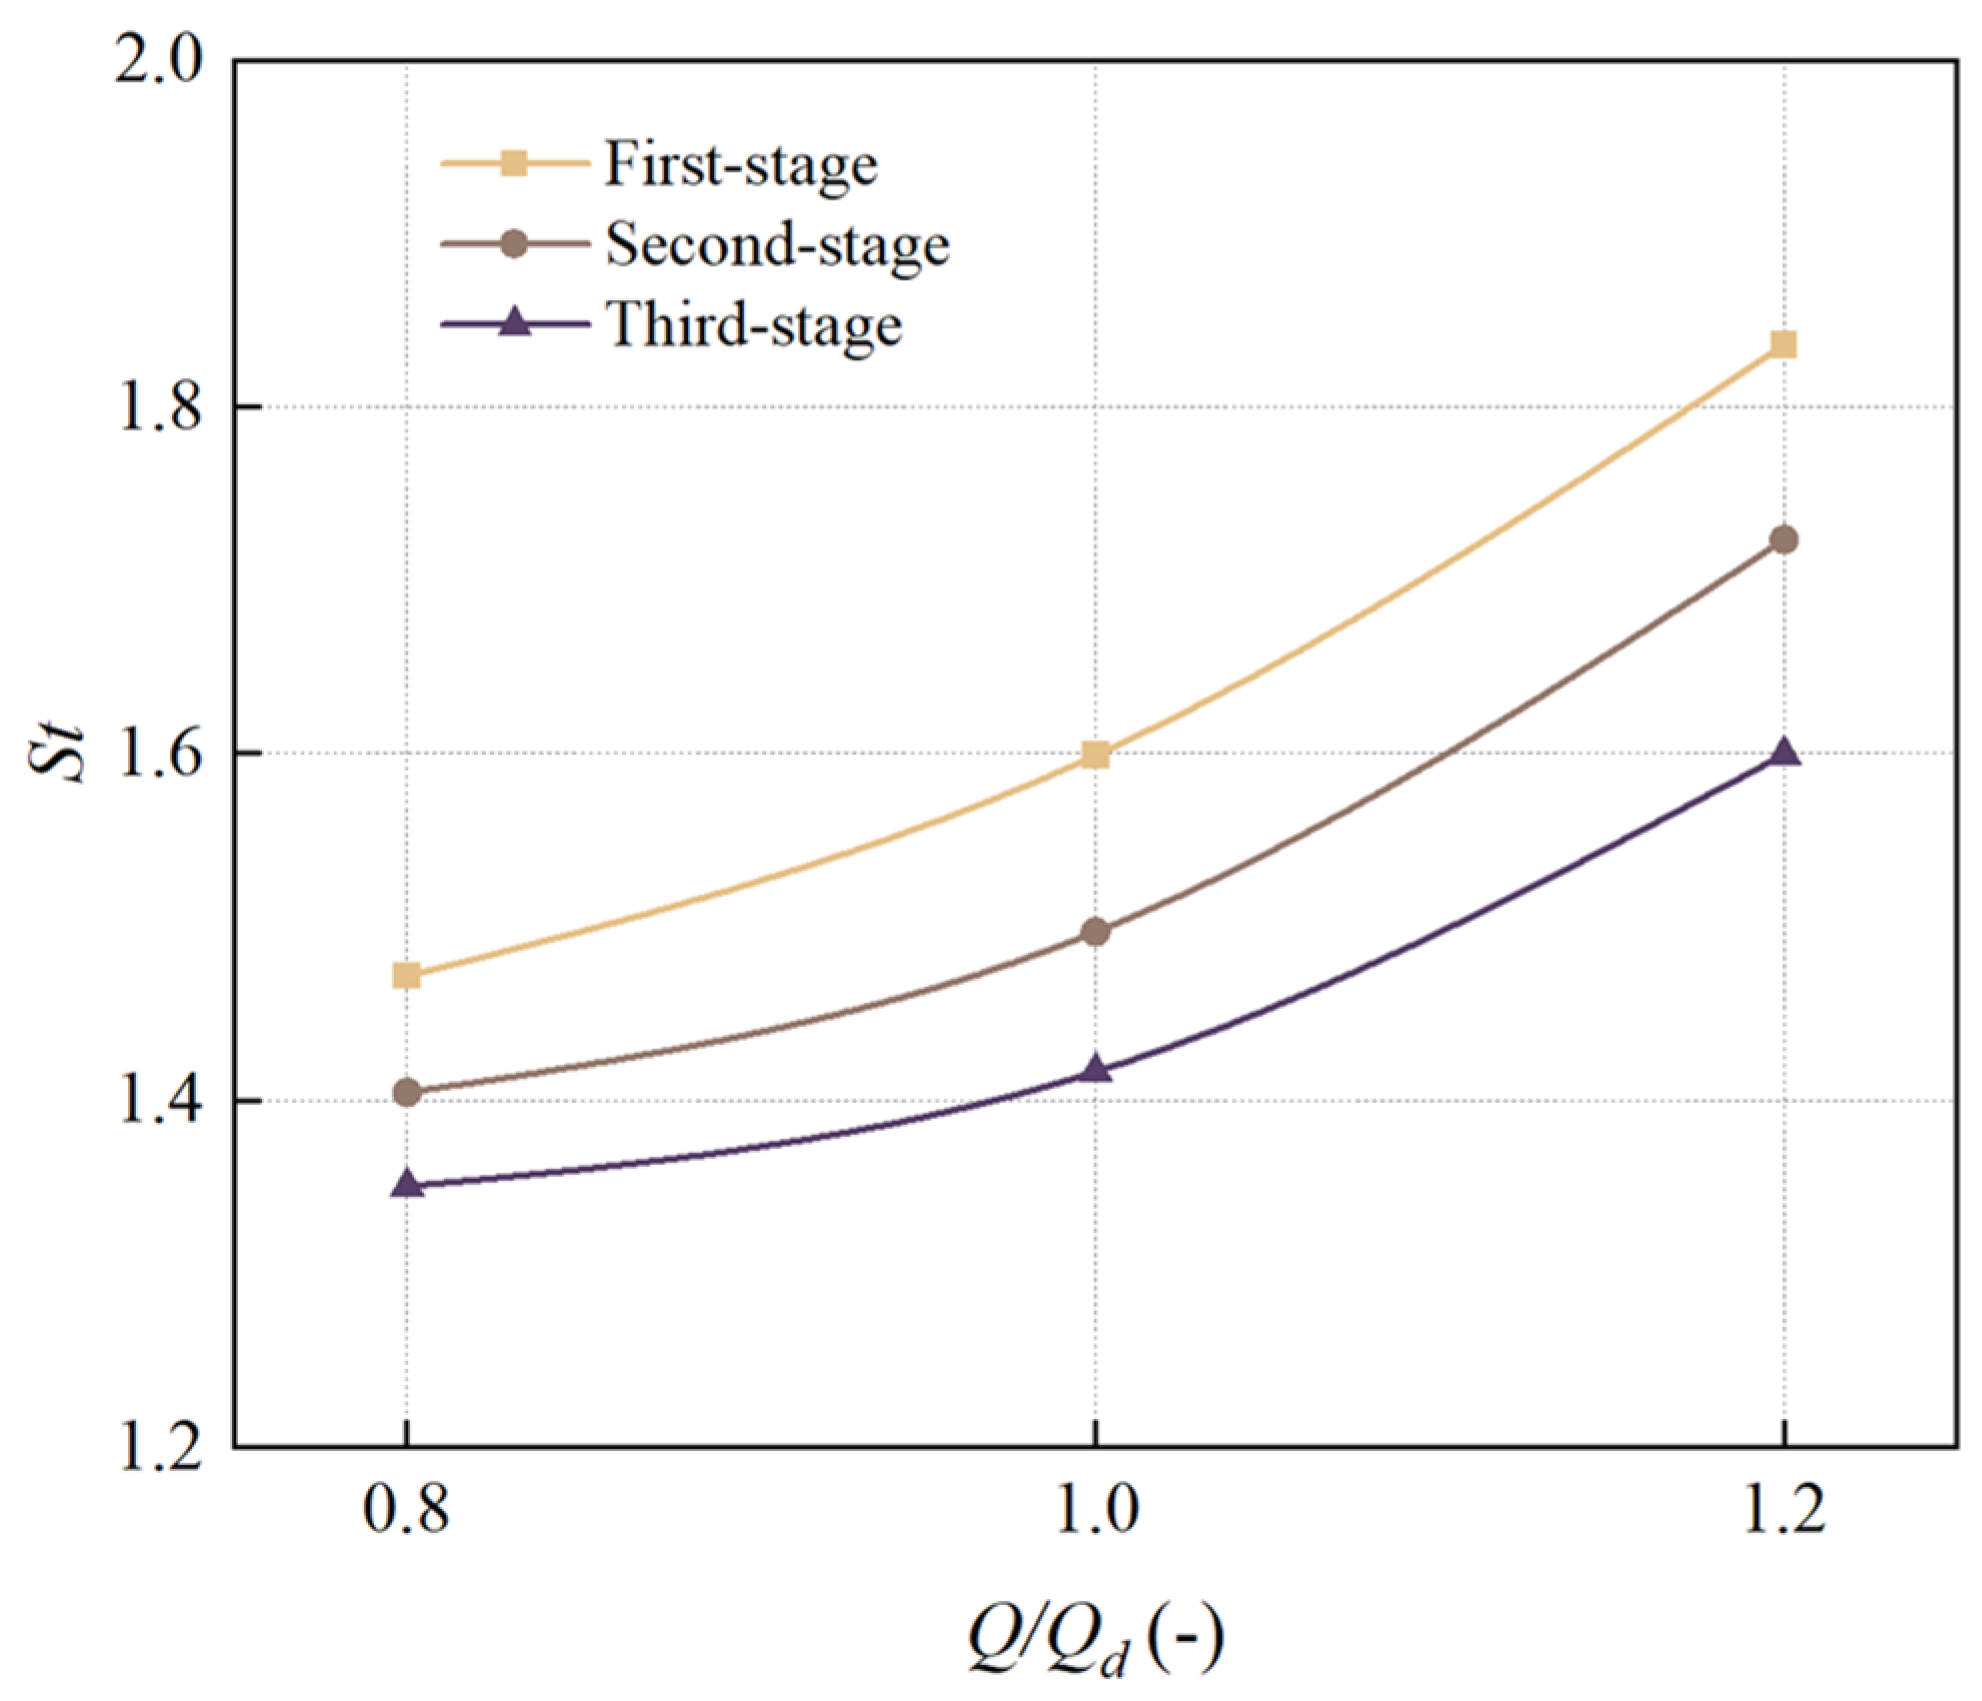
With increasing flow rate, the average wear rate and wear area of the impeller’s front shroud, rear shroud, pressure side, and casing all gradually increase. The highest wear rate among all components occurs at the first-stage rear casing under 1.2Qd operating conditions, with an average wear rate of 8.35 × 10⁻⁶ kg/m2/s. This phenomenon occurs because higher flow rates enhance particle momentum and Stokes number, strengthening inertial effects while weakening particle-fluid coupling. Consequently, the intensified impact forces on flow passage components lead to progressive enlargement of wear areas.
(3)
Under identical flow conditions, the wear areas and intensity on the front shroud, rear shroud, pressure side, and peripheral casing of the upstream impeller stage consistently exceed those of the downstream stage. This occurs because when particles transition from the upstream to downstream casing chambers, the flow becomes more uniform with reduced turbulence intensity after passing through the return guide vanes. Additionally, the particle Stokes numbers in the downstream region are lower than those upstream, resulting in weakened inertial effects and enhanced particle-fluid coupling. These factors collectively reduce impact forces on flow passage components, thereby mitigating wear severity in the downstream stage.
In future studies, we will conduct erosion experiments on multistage centrifugal pumps to validate numerical simulation results. Subsequently, we will systematically compare three widely recognized erosion models—the Finnie model, Tabakoff model, and E/CRC model—under identical operating conditions to evaluate their predictive accuracy for wear rate and spatial distribution characteristics, thereby establishing model selection criteria. Finally, based on these findings, we will focus on optimizing the pump’s geometric configuration to simultaneously reduce wear and enhance hydraulic efficiency.

Author Contributions

Methodology and validation, Z.Y. (Zhengyin Yang) and Y.G.; formal analysis, Z.Y. (Zhengyin Yang), Y.G. and Y.Z.; writing—review and editing, Z.Y. (Zhengyin Yang) and Z.Y. (Zhuoqing Yan). All authors have read and agreed to the published version of the manuscript.

Funding

This work was supported by the National Natural Science Foundation of China (grant number 52206055), Postgraduate Research & Practice Innovation Program of Jiangsu Province (grant number SJCX24_2241), and the Priority Academic Program Development of Jiangsu Higher Education Institutions (PAPD).

Data Availability Statement

Data are contained within the article.

Conflicts of Interest

The authors declare no conflicts of interest.

Nomenclature

Symbols
Aiper unit area
b2blade outlet width (mm)
b3vane inlet width (mm)
b4vane outlet width (mm)
bfaxial width of front side chamber (mm)
braxial width of rear side chamber (mm)
CDdrag coefficient
CVMadded mass coefficient
CVparticle volume concentration
d1blade inlet diameter (mm)
d2blade outlet diameter (mm)
d3vane inlet diameter (mm)
d4vane outlet diameter (mm)
d5pump casing inner diameter (mm)
d6pump casing outer diameter (mm)
drrear shroud diameter (mm)
dffront shroud diameter (mm)
dpparticle diameter (mm)
Enon-dimensional wear coefficient
Fimixing function
FDdrag force (N)
FGgravitational force (N)
FBbuoyant force (N)
FVMvirtual mass force (N)
Fppressure gradient force (N)
gacceleration due to gravity
Hhead (m)
k1model constants
k12model constants
Llcharacteristic length of the fluid (m)
mpparticle mass (kg)
nrotational speed
pinpump input power (w)
pstatic pressure (pa)
Qddesign flow rate (m3/s)
Qflow rate (m3/s)
Rereynolds number
sfaxial width at front seal (mm)
sraxial width at rear seal (mm)
ststokes number
Timpeller torque
ttime (s)
uvelocity of liquid (m/s)
upvelocity of particle inflow (m/s)
u0impeller outlet circumferential velocity (m/s)
u1model constants
u2model constants
u3model constants
Vpsolid particle impact velocity
zbnumber of blades
zvnumber of vanes
Greek letters
β2blade outlet angle (°)
μ l fluid viscosity (pa·s)
τ p dimensionless relaxation time of the particles (s)
ψ head coefficient
η e efficiency
ρ liquid phase density (kg/m3)
ρ p particle phase density (kg/m3)
μ dynamical viscosity (kg/(m s))
ω specific dissipation rate
γ the impact angle between the incident particle and the wall
γ 0 the angle of maximum erosion
Subscripts
ininlet
ii-direction component
jj-direction component
pparticle
lliquid
Abbreviations
SSTShear Stress Transport
CFDComputational Fluid Dynamics

References

  1. Li, X.; Cao, Z.; Wei, Z.; Ren, Q. Theoretical model of energy conversion and loss prediction for multi-stage centrifugal pump as turbine. Energy Convers. Manag. 2025, 325, 119379. [Google Scholar] [CrossRef]
  2. Meng, Q.; Li, G.; Mao, J.; Zhao, D.; Luo, Y.; Hou, T. Analysis of Flow Loss Characteristics of a Multistage Pump Based on Entropy Production. Water 2024, 16, 2974. [Google Scholar] [CrossRef]
  3. Gu, Y.; Sun, H.; Wang, C.; Lu, R.; Liu, B.; Ge, J. Effect of trimmed rear shroud on performance and axial thrust of multi-stage centrifugal pump with emphasis on visualizing flow losses. J. Fluids Eng. 2024, 146, 011204. [Google Scholar] [CrossRef]
  4. El-Emam, M.A.; Zhou, L.; Yasser, E.; Bai, L.; Shi, W. Computational methods of erosion wear in centrifugal pump: A state-of-the-art review. Arch. Comput. Methods Eng. 2022, 29, 3789–3814. [Google Scholar] [CrossRef]
  5. Chen, Z.; Gu, Y.; Lu, W.; Zhang, L.; Zhu, D.; Zhou, Z. Characterization of solid-liquid two-phase flow in a canned-motor pump for marine vehicles based on the Euler-Lagrange method. Ocean. Eng. 2025, 335, 121726. [Google Scholar] [CrossRef]
  6. Li, X.; Zhou, H.; Wei, Z.; Zhu, Z. Interstage transmission and differential analysis of pressure fluctuations in multistage centrifugal pump-as-turbine. Phys. Fluids 2024, 36, 055106. [Google Scholar] [CrossRef]
  7. Wang, H.; Wang, C.; Zhou, L.; Ji, L.; Yang, Y.; Agarwal, R.K. An entropy efficiency model and its application to energy performance analysis of a multi-stage electric submersible pump. Energy 2024, 288, 129741. [Google Scholar] [CrossRef]
  8. Wang, C.; Shi, W.; Wang, X.; Jiang, X.; Yang, Y.; Li, W.; Zhou, L. Optimal design of multistage centrifugal pump based on the combined energy loss model and computational fluid dynamics. Appl. Energy 2017, 187, 10–26. [Google Scholar] [CrossRef]
  9. Liu, M.; Tan, L.; Cao, S. Method of dynamic mode decomposition and reconstruction with application to a three-stage multiphase pump. Energy 2020, 208, 118343. [Google Scholar] [CrossRef]
  10. Maleki, A.; Ghorani, M.; Haghighi, M.; Riasi, A. Numerical study on the effect of viscosity on a multistage pump running in reverse mode. Renew. Energy 2020, 150, 234–254. [Google Scholar] [CrossRef]
  11. Pugliese, F.; Fontana, N.; Marini, G. Experimental assessment of the impact of number of stages on vertical axis multi-stage centrifugal PATs. Renew. Energy 2021, 178, 891–903. [Google Scholar] [CrossRef]
  12. Zhai, L.; Lu, C.; Guo, J.; Zhu, Z.; Cui, B. Flow characteristics and energy loss of a multistage centrifugal pump with blade-type guide vanes. J. Mar. Sci. Eng. 2022, 10, 180. [Google Scholar] [CrossRef]
  13. Gu, Y.; Bian, J.; Wang, Q.; Stephen, C.; Liu, B.; Cheng, L. Energy performance and pressure fluctuation in multi-stage centrifugal pump with floating impellers under various axial oscillation frequencies. Energy 2024, 307, 132691. [Google Scholar] [CrossRef]
  14. Sampedro, E.; Dazin, A.; Colas, F.; Roussette, O.; Coutier-Delgosha, O.; Caignaert, G. Multistage radial flow pump-turbine for compressed air energy storage: Experimental analysis and modeling. Appl. Energy 2021, 289, 116705. [Google Scholar] [CrossRef]
  15. Xu, H.; An, W.; Ke, E.; Ma, Y.; Geng, L.; Yang, G.; Zhang, D. Research on Internal Flow and Pressure Fluctuation Characteristics of Centrifugal Pumps as Turbines with Different Blade Wrap Angles. Water 2024, 16, 1861. [Google Scholar] [CrossRef]
  16. Gu, Y.; Bian, J.; Wang, C.; Sun, H.; Wang, M.; Ge, J. Transient numerical investigation on hydraulic performance and flow field of multi-stage centrifugal pump with floating impellers under sealing gasket damage condition. Phys. Fluids 2023, 35, 107123. [Google Scholar] [CrossRef]
  17. Ping, X.; Yang, F.; Zhang, H.; Zhang, J.; Zhang, W.; Song, G. Introducing machine learning and hybrid algorithm for prediction and optimization of multistage centrifugal pump in an ORC system. Energy 2021, 222, 120007. [Google Scholar] [CrossRef]
  18. Wu, T.; Wu, D.; Gao, S.; Song, Y.; Ren, Y.; Mou, J. Multi-objective optimization and loss analysis of multistage centrifugal pumps. Energy 2023, 284, 128638. [Google Scholar] [CrossRef]
  19. Zhao, J.; Pei, J.; Wang, W.; Gan, X. Blade redesign based on inverse design method for energy performance improvement and hydro-induced vibration suppression of a multi-stage centrifugal pump. Energy 2024, 308, 132862. [Google Scholar] [CrossRef]
  20. Bakhshesh, M.; Bahrainian, S.; Hajidavalloo, E.; Parsi, M. Developing a dimensionless number for solid particle erosion with gas-liquid-solid flow in standard elbows. Wear 2021, 478, 203769. [Google Scholar] [CrossRef]
  21. Novak, N.; Trajkovski, A.; Polajnar, M.; Kalin, M.; Majdič, F. Wear of hydraulic pump with real particles and medium test dust. Wear 2023, 532, 205101. [Google Scholar] [CrossRef]
  22. Dong, W.; Li, S.; He, F.; Fan, X.G.; Li, P.X. Effect of variable conditions on transient flow in a solid–liquid two-phase centrifugal pump. Phys. Fluids 2024, 36, 073340. [Google Scholar] [CrossRef]
  23. Shen, Z.; Chu, W.; Li, X.; Dong, W. Sediment erosion in the impeller of a double-suction centrifugal pump–A case study of the Jingtai Yellow River Irrigation Project. China. Wear 2019, 422, 269–279. [Google Scholar] [CrossRef]
  24. Peng, G.; Chen, Q.; Bai, L.; Hu, Z.; Zhou, L.; Huang, X. Wear mechanism investigation in a centrifugal slurry pump impeller by numerical simulation and experiments. Eng. Fail. Anal. 2021, 128, 105637. [Google Scholar] [CrossRef]
  25. Li, W.; Pu, W.; Ji, L.; Yang, Q.; He, X.; Agarwal, R. Mechanism of the impact of sediment particles on energy loss in mixed-flow pumps. Energy 2024, 304, 132166. [Google Scholar] [CrossRef]
  26. Shi, G.; Ye, X.; Xiao, Y.; Guo, X.; Qin, H.; Tang, M. Effect of the Vortex on the Movement Law of Sand Particles in the Hump Region of Pump-Turbine. J. Mar. Sci. Eng. 2024, 12, 2190. [Google Scholar] [CrossRef]
  27. Zhao, R.; Zhao, Y.; Zhang, D.; Li, Y.; Geng, L. Numerical investigation of the characteristics of erosion in a centrifugal pump for transporting dilute particle-laden flows. J. Mar. Sci. Eng. 2021, 9, 961. [Google Scholar] [CrossRef]
  28. Mendi, C.; Lei, T. Role of particle motion on pressure fluctuation and erosion for a centrifugal pump in energy storage pump station. J. Energy Storage 2024, 99, 113252. [Google Scholar] [CrossRef]
  29. Pu, W.; Ji, L.; Li, W.; Shi, W.; Tian, F.; Xiao, C.; Agarwal, R. Blade wear intensity of a centrifugal pump based on an improved four-way coupling method. Phys. Fluids 2025, 37, 043323. [Google Scholar] [CrossRef]
  30. Sun, S.; Wang, Z.; Guo, P.; Wu, P.; Ma, J. Motion characteristics and wear analysis of particles in the clearances of a twin-screw pump. Phys. Fluids 2024, 36, 023320. [Google Scholar] [CrossRef]
  31. Pu, W.; Ji, L.; Li, W.; Yang, Q.; Liu, Z.; Yang, Y.; Agarwal, R. Experimental study on the unsteady evolution mechanism of centrifugal pump impeller wake under solid–liquid two-phase conditions: Impact of particle concentration. Phys. Fluids 2024, 36, 119365. [Google Scholar] [CrossRef]
  32. Wang, Y.; Li, M.; Chen, J.; Xu, Q.; Wang, X.; Mao, Y.; Liu, H. Numerical investigation on the internal flow and wear characteristics of solid–liquid two-phase flow in a centrifugal pump under different stall levels. Phys. Fluids 2024, 36, 113367. [Google Scholar] [CrossRef]
  33. Pan, J.; Liu, Q.; Pang, J.; Zhang, F.; Tao, R.; Xiao, R.; Liu, W. Comparative evaluation of sand erosion in reversible turbine at pump mode and turbine mode. J. Energy Storage 2024, 79, 110185. [Google Scholar] [CrossRef]
  34. Gülich, J.F. Centrifugal Pumps; Springer: Cham, Switzerland, 2020. [Google Scholar] [CrossRef]
  35. BS EN ISO 9906:2012; Rotodynamic Pumps—Hydraulic Performance Acceptance Tests—Grades 1, 2 and 3 (ISO 9906:2012). BSI Standards Publication: London, UK, 2012.
  36. Chen, M.; Tan, L.; Fan, H.; Wang, C.; Liu, D. Solid-liquid multiphase flow and erosion characteristics of a centrifugal pump in the energy storage pump station. J. Energy Storage 2022, 56, 105916. [Google Scholar] [CrossRef]
  37. Lu, J.; He, Y.; Zhou, Y.; Zhang, C.; Pan, Y.; Li, J. Research on the Characteristics of Sediment Erosion in Pump-Turbine Runners Under Different Solid-Phase Conditions. Water 2025, 17, 1093. [Google Scholar] [CrossRef]
  38. Chang, H.; Yang, J.; Wang, Z.; Peng, G.; Lin, R.; Lou, Y.; Zhou, L. Efficiency optimization of energy storage centrifugal pump by using energy balance equation and non-dominated sorting genetic algorithms-II. J. Energy Storage 2025, 114, 115817. [Google Scholar] [CrossRef]
  39. Li, G.; Xia, Y.; Mao, J.; Zhao, D.; Meng, Q. Influence of Different Valve Openings on the Structural Dynamic Characteristics of a Multistage Pump. Water 2024, 16, 2964. [Google Scholar] [CrossRef]
  40. Xie, H.; Luo, X.; Feng, J.; Zhu, G.; Wang, L. Energy performance and flow characteristics of a pump-turbine under pump mode at different guide vane openings. J. Energy Storage 2024, 97, 112743. [Google Scholar] [CrossRef]
  41. Xu, D.; Shen, Y. A novel CFD-DEM-DPM modelling of fluid-particles-fines reacting flows. Chem. Eng. Sci. 2024, 292, 120014. [Google Scholar] [CrossRef]
  42. Wang, K.; Li, X.; Wang, Y.; He, R. Numerical investigation of the erosion behavior in elbows of petroleum pipelines. Powder Technol. 2017, 314, 490–499. [Google Scholar] [CrossRef]
  43. Wang, K.; Liu, H.; Wang, L.; Guo, P.; Wang, Y.; Yang, J. Effect of particle size on vortex structure and erosion behavior of semi-open centrifugal pump. Energy 2024, 293, 130576. [Google Scholar] [CrossRef]
  44. Aponte, R.; Teran, L.; Ladino, J.; Larrahondo, F.; Coronado, J.; Rodríguez, S. Computational study of the particle size effect on a jet erosion wear device. Wear 2017, 374, 97–103. [Google Scholar] [CrossRef]
  45. Li, Y.; Liu, D.; Cui, B.; Lin, Z.; Zheng, Y.; Ishnazarov, O. Studying particle transport characteristics in centrifugal pumps under external vibration using CFD-DEM simulation. Ocean. Eng. 2024, 301, 117538. [Google Scholar] [CrossRef]
  46. Phirommark, P.; Namchanthra, S.; Chaiyanupong, J.; Uapipatanakul, S.; Chookaew, W.; Suvanjumrat, C.; Promtong, M. CFD elucidation of microscopic particles in a low-volumetric classifier towards effects of Stokes number and density ratio. Int. J. Thermofluids 2023, 20, 100497. [Google Scholar] [CrossRef]
  47. Jin, Y.; Cai, Z.; Cui, J. The characteristics of coarse particle solid–liquid two-phase flow and wear properties in deep-sea multistage mining pumps. Phys. Fluids 2025, 37, 013339. [Google Scholar] [CrossRef]
  48. Lu, Y.; Liu, Z.; Zhang, Z.; Liao, W.; Li, X.; Presas, A. Analysis of unsteady flow and interstage interference of pressure pulsation of two-stage pump as turbine under turbine model. Water 2024, 16, 3100. [Google Scholar] [CrossRef]
  49. Gu, Y.; Zhu, Q.; Bian, J.; Wang, Q.; Cheng, L. Novel sealing design for high-speed coolant pumps: Impact on energy performance, axial thrust and flow field. Energy 2025, 321, 135511. [Google Scholar] [CrossRef]
  50. Jia, X.; Zhang, Y.; Lv, H.; Zhu, Z. Study on external performance and internal flow characteristics in a centrifugal pump under different degrees of cavitation. Phys. Fluids 2023, 35, 119367. [Google Scholar] [CrossRef]
  51. Chen, H.; Liu, X.; Lu, Y.; Fu, Q.; Zhu, R.; Li, H.; Su, H. Evolution mechanism of internal flow in the hump region and hump optimization of axial-flow reactor coolant pump. Energy 2024, 311, 133460. [Google Scholar] [CrossRef]
Figure 1. Three-stage centrifugal pump: (a) physical prototype; (b) 3D model.
Water 17 02271 g001
Figure 2. Multi-stage centrifugal pump test bench: (a) experimental principle; (b) experimental site.
Water 17 02271 g002
Figure 3. Hexahedral mesh: (a) three-stage; (b) return guide vane; (c) side chamber; (d) impeller.
Water 17 02271 g003
Figure 4. Mesh quality research. (a) Mesh sensitivity; (b) Distribution of y+ values on the impeller.
Water 17 02271 g004
Figure 5. Pump performance characteristics obtained from experiments and CFD simulations: (a) head coefficient versus flow rate; (b) efficiency versus flow rate.
Water 17 02271 g005
Figure 6. Energy performance with varying flow rates: (a) efficiency; (b) head coefficient.
Water 17 02271 g006
Figure 7. Erosion distribution of the impeller front shroud under varying flow rates: (a) first-stage impeller front shroud; (b) second-stage impeller front shroud; (c) third-stage impeller front shroud.
Water 17 02271 g007aWater 17 02271 g007b
Figure 8. Erosion distribution of the impeller rear shroud under varying flow rates: (a) first-stage impeller rear shroud; (b) second-stage impeller rear shroud; (c) third-stage impeller rear shroud.
Water 17 02271 g008
Figure 9. Erosion distribution of the impeller under varying flow rates: (a) first-stage impeller; (b) second-stage impeller; (c) third-stage impeller.
Water 17 02271 g009
Figure 10. Erosion distribution of the peripheral casing under varying flow rates: (a) first-stage peripheral casing; (b) second-stage peripheral casing; (c) third-stage peripheral casing.
Water 17 02271 g010
Figure 11. Particle trajectories on the impeller front shroud under varying flow rates: (a) first-stage impeller front shroud; (b) second-stage impeller front shroud; (c) third-stage impeller front shroud.
Water 17 02271 g011
Figure 12. Particle trajectories on the impeller rear shroud under varying flow rates: (a) first-stage impeller rear shroud; (b) second-stage impeller rear shroud; (c) third-stage impeller rear shroud.
Water 17 02271 g012
Figure 13. Particle trajectories on the impeller under varying flow rates: (a) first-stage impeller; (b) second-stage impeller; (c) third-stage impeller.
Water 17 02271 g013
Figure 14. Particle trajectories on the peripheral casing under varying flow rates: (a) first-stage peripheral casing; (b) second-stage peripheral casing; (c) third-stage peripheral casing.
Water 17 02271 g014
Figure 15. Particle trajectories on the impeller front shroud under varying flow rates.
Water 17 02271 g015
Figure 16. Particle trajectories on the impeller rear shroud under varying flow rates.
Water 17 02271 g016
Figure 17. Particle trajectories on the impeller under varying flow rates.
Water 17 02271 g017
Figure 18. Particle trajectories on the peripheral casing under varying flow rates.
Water 17 02271 g018
Table 1. Main geometrical parameters of the multi-stage centrifugal pump.
ParameterValue
ImpellerBlade inlet diameter d1 (mm)52
Blade outlet diameter d2 (mm)107
Blade outlet width b2 (mm)10
Blade outlet angle β2 (°)20
Front shroud diameter df (mm)112
Rear shroud diameter dr (mm)108
Number of blades zb (-)6
Return guide vaneVane inlet diameter d3 (mm)122
Vane inlet width b3 (mm)10
Vane outlet diameter d4 (mm)53
Vane outlet width b4 (mm)3.2
Number of vanes zv (-)6
Peripheral casingPeripheral casing inner diameter d5 (mm)126
Peripheral casing outer diameter d6 (mm)136
Table 2. Tabakoff model parameters.
Particle/Wall Materialk12u1 (m/s)u2 (m/s)u3 (m/s) γ 0 (deg)
Quartz-Steel0.293328123.72352.99179.2930
Table 3. Main settings in numerical simulation.
Parameter CategoryParameterValue/Description
Liquid phaseDensity (kg m−3)997
Viscosity (Pa·s)0.0008899
InletStatic pressure (1 atm)
OutletMass flow rate
WallNo-slip
Solver settingsTurbulence modelSST k-ω
Convergence criteria10−5 for residuals
Advection schemeHigh-resolution
Table 4. Average erosion rate of impeller front shroud (kg/m2/s).
0.8Qd1.0Qd1.2Qd
First-stage1.20 × 10−61.97 × 10−63.25 × 10−6
Second-stage4.45 × 10−76.78 × 10−78.29 × 10−7
Third-stage2.32 × 10−73.26 × 10−75.38 × 10−7
Table 5. Average erosion rate of impeller rear shroud (kg/m2/s).
0.8Qd1.0Qd1.2Qd
First-stage2.93 × 10−64.67 × 10−66.06 × 10−6
Second-stage1.26 × 10−62.54 × 10−64.28 × 10−6
Third-stage3.26 × 10−76.78 × 10−79.45 × 10−7
Table 6. Average erosion rate of impeller (kg/m2/s).
0.8Qd1.0Qd1.2Qd
First-stage2.85 × 10−63.58 × 10−65.39 × 10−6
Second-stage0.95 × 10−62.27 × 10−63.89 × 10−6
Third-stage2.25 × 10−75.78 × 10−77.68 × 10−7
Table 7. Average erosion rate of peripheral casing (kg/m2/s).
0.8Qd1.0Qd1.2Qd
First-stage4.26 × 10−66.15 × 10−68.35 × 10−6
Second-stage2.56 × 10−63.85 × 10−65.56 × 10−6
Third-stage1.35 × 10−62.67 × 10−64.03 × 10−6
Disclaimer/Publisher’s Note: The statements, opinions and data contained in all publications are solely those of the individual author(s) and contributor(s) and not of MDPI and/or the editor(s). MDPI and/or the editor(s) disclaim responsibility for any injury to people or property resulting from any ideas, methods, instructions or products referred to in the content.

