Article

Experimental Investigation of Flow Characteristics Inside a Venturi Tube Under Gas-Containing Conditions

College of Electrical, Energy and Power Engineering, Yangzhou University, Yangzhou 225127, China
*
Author to whom correspondence should be addressed.
Water 2025, 17(14), 2080; https://doi.org/10.3390/w17142080
Submission received: 13 June 2025 / Revised: 9 July 2025 / Accepted: 10 July 2025 / Published: 11 July 2025

Abstract

Gas–liquid two-phase flow is very common in fluid machinery and has complex multiphase flow characteristics. Under the gas-containing conditions, common issues in fluid machinery include the transport of liquid, bubble variations, and pressure drop characteristics; these can be analyzed using a simplified venturi tube. In order to investigate the influence of incoming gas on the gas–liquid flow, a venturi tube with the range of inlet gas volume fraction (IGVF) from 0 to 16% was used in this experiment. The development of a two-phase flow was recorded by using high-speed photography. Under different initial liquid flow rates and gas content conditions, the evolution of the two-phase flow was similar, with the main difference being the rate of evolution. The incoming gas mainly underwent a process from column shape to expansion and then to fragmentation passing through the venturi tube. In the experimental images, the projected area of the main bubble increased linearly with the increase in IGVF. Meanwhile, the transporting ability of the venturi tube was weakened due to the blockage caused by high gas content, especially when the IGVF exceeded 10%. The pressure drop characteristics indicated an increase in losses with the increase in gas content.

1. Introduction

Venturi tubes are widely used in various fields such as energy [1,2], environment [3], and medicine [4,5]. A venturi tube mainly includes a converging section, a throat section, and a diverging section. The structural characteristics determine its fluid dynamics effects, that is, the converging section accelerates the fluid to generate negative pressure, while the diverging section restores pressure. Utilizing these structure and flow characteristics, a venturi tube can be used for measuring the flow rate [6,7], generating cavitation [8,9] and pumping fluid [10,11]. In practical engineering, multiphase flow is more common inside the venturi tube, such as the oil–water [6], wet–gas [12], vapor–liquid [13,14], or gas–liquid [15] flow and so on. Research has shown that the proportion of different phases may alter the venturi effect, and the multiphase flow features inside the venturi tube need further investigation.
The gas–liquid two-phase flow is a typical multiphase flow phenomenon, and gas content has a significant impact on the flow field. Wu et al. [15] studied the flow patterns in a cross-section of the venturi diffusion section, and it was found that the flow patterns exhibited bubble flow, mist flow, transitional flow, and annular flow as the gas content increased. Song et al. [16] adopted the venturi tube to generate bubbles during the process of turbulent breakup and studied the mechanism of bubble breakup by experiments. This work presented the single bubble breakup process under different Reynolds numbers. Wang et al. [17] also used a venturi bubble generator to study the motion pattern between multiple bubbles and the bubble fragmentation process. They compared two situations with and without the presence of gas. The effects of gas on flow velocity and turbulent characteristics were discussed. The above literature provided theoretical and methodological references for the study of gas–liquid two-phase flow in venturi tubes. In current research, the venturi tubes are mostly used as bubble generators mainly to reveal the characteristics of microbubbles within the diverging section. The inlet for gas was almost located at the throat section [15,16,17,18], utilizing the low-pressure principle in the throat for inhalation of gas. Several studies [19,20] arranged the air injection hole upstream of the venturi tube and demonstrated that the position of the gas injection would directly impact bubble formation characteristics.
Gas containing is commonly encountered in many engineering scenarios of fluid machinery. Chai et al. [21] investigated a centrifugal pump as a turbine during the start-up process. They found that the higher the inlet gas volume fraction (IGVF) is, the more severely the blade load will fluctuate. Zhu et al. [22] emphasized that IGVF is one of the main factors that can influence the stability of multiphase pumps. Meanwhile, the images of internal flow field showed that the bubbles exhibit migration, accumulation, and other motion behaviors. Verde et al. [23] found that the gas influence on the tendency of pressure drop is inverted for the two-phase region in an electrical submersible pump. He et al. [24] observed the flow patterns in a centrifugal pump under different IGVF values and emphasized the influence of inlet gas content. The internal flow features involved in the above fluid machinery, including flow patterns, bubble variations and pressure drop characteristics, can be revealed through a simplified venturi tube with the advantages of simple design, low cost and ease of operation. In addition, a type of air-entrained flow may occur in the pump intake or hydro turbine intake [25,26]. This entrained air will undergo a channel of contraction followed by diffusion after entering the pump or turbine. Before entering the fluid machinery, the entrained air can develop and change under the action of force and water flow. The structural features and gas inflow conditions mentioned above can also be reflected in the venturi tube model.
To investigate the two-phase flow characteristics under gas-containing conditions, a venturi tube with upstream air injection was used in this experiment. Compared with the existing experiments in venturi tubes, this test selects a wider range of inlet gas content and higher Reynolds number conditions to be closer to the application scenarios of fluid machinery. The experimental system, equipment, and measurement methods are described in Section 2. The experimental results including the flow characteristics, bubble behavior, and pressure features are discussed in Section 3. Finally, Section 4 shows the conclusions in present work.

2. Experiments

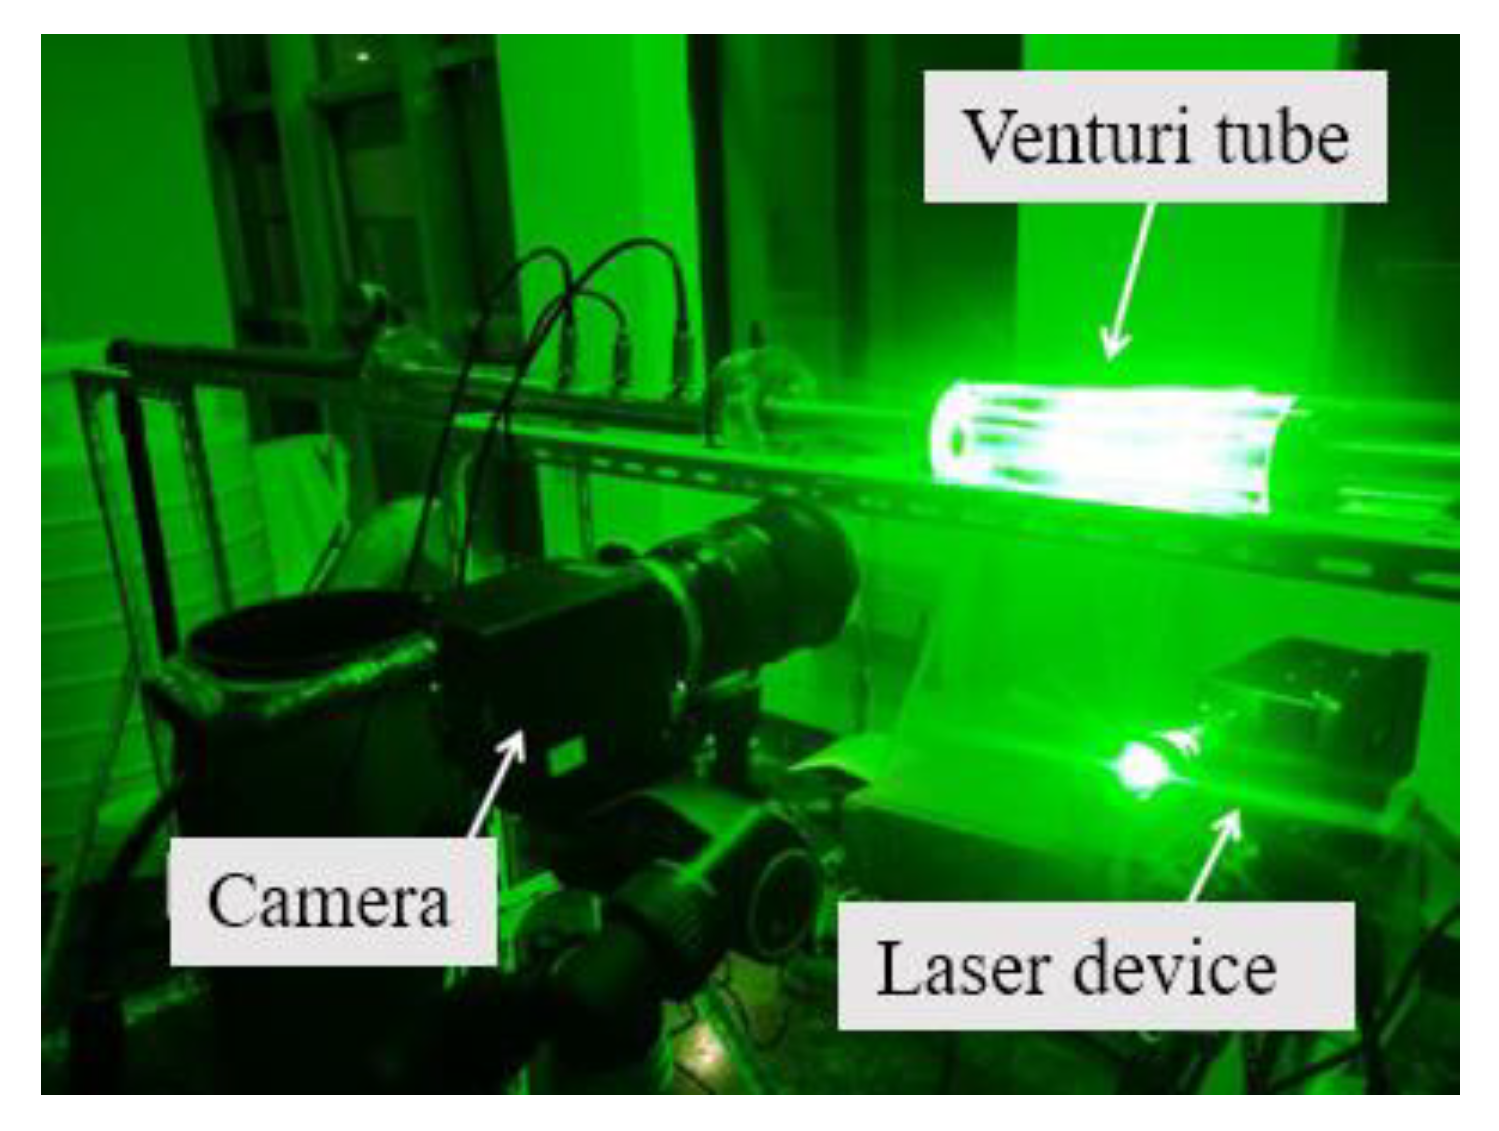
2.1. Experimental Setup

A venturi tube was designed and made of transparent organic glass for the visualization of the gas–liquid flow. Figure 1 shows the structural parameters and the processed test section of the venturi tube. The tube length L was 268 mm. The inlet diameter Din and the outlet diameter Dout of the tube were both 34 mm. The throat diameter dth and throat length lth were both 8 mm. The converging angle α was 41° and diverging angle β was 12°.
The experimental setup is illustrated in Figure 2, where the blue and yellow arrows indicates the flow direction in the test. The liquid medium was tap water and the gas medium was air. The water was driven by a centrifugal pump through the piping system from a water tank, which was left open to the atmosphere with a cooling water system to control the medium temperature. The medium temperature in this experiment was about 12 °C. The water flow rate was regulated by a ball valve and measured by an electromagnetic flowmeter. One pressure sensor was located upstream of the venturi tube and this pressure measurement result was recorded as pin. Three pressure sensors were located downstream of the venturi tube, and the measurement results were recorded as pout1, pout2, and pout3.
In order to create gas containing inflow condition, an air inlet pipeline was added upstream of the venturi tube. A check valve was installed to prevent water from flowing into the gas phase pipeline. The diameter of the air injection hole was 5 mm, which was approximately half of the throat diameter [15,20]. The air was compressed by an air compressor and then stored in an air tank after being dried and filtered. The air tank served to stabilize the pressure, and two valves were located on the inlet and outlet sides of the tank, respectively. The valves were regulated to change the gas content, and the air flow rate was measured by a gas flowmeter. The information for the measurement devices is listed in Table 1.

2.2. Experimental Conditions

The inlet gas volume fraction (IGVF) was used to describe the gas content with the following expression:
IGVF = Q g Q g + Q l
where Q is the flow rate, the subscripts g and l represent the gas and liquid phase, respectively.
The determination of liquid flow rate (Ql) values was considered from two perspectives. On the one hand, this experiment focused on higher Reynolds number conditions in consideration of the engineering background of fluid machinery. The Reynolds number is related to flow velocity and flow rate. In the present work, the Reynolds number at the throat section was defined as Reth with the following equation:
Re th = d th v th ρ l μ l
where dth is the throat diameter (m) and vth is the mean velocity (m/s) of a continuous phase though the throat section, ρl is the density (kg/m3) of liquid and μl is the dynamic viscosity (Pa∙s) of liquid phase. In the current research on venturi tubes, the range of Reynolds number was about 6.1 × 10⁴~1.7 × 10⁵ in the literature [16] and 7.0 × 10²~1.2 × 10⁴ in the literature [17]. Based on the venturi tube in this experiment, the highest possible liquid flow rate should be selected to meet conditions in most fluid machinery, where the range of Reynolds number was on the order of 104~106. However, an increase in liquid flow rate could lead to cavitation, which in turn affected the observation of two-phase flow. In the present experiment, when the flow rate was below 2.8 m3/h, it was non-cavitation condition. Therefore, three different liquid flow rate conditions with the initial values of Ql = 1.8 m3/h, 2.2 m3/h and 2.6 m3/h were conducted in the present experiment.
The range of gas flow rate (Qg) was based on the following considerations. According to Equation (1), the value of IGVF increased with the increasing Qg under the same liquid flow rate (Ql) conditions. Investigating the research of fluid machinery, the scope for IGVF was up to 10% [24], 15% [21] and 30% [22]. Higher gas content would influence the effectiveness of observations and the stability of the experimental system. The maximum IGVF was 16% in this experiment. Correspondingly, the gas flow rate was up to about 7 L/min. This article discussed the impact of gas and liquid flow rates on the two-phase flow characteristics.

2.3. Experimental Validation

Before the gas–liquid two-phase flow experiment, a single-phase flow experiment was conducted, and a high-frequency particle image velocimetry (PIV) system was used to show the flow features inside the venturi tube. The layout of the experimental site is shown in Figure 3. The high-speed camera had 1920 × 1080 pixel images, and the highest sampling rate was 25 kHz. Using the polyamide resin particles as tracer particles, and the observation time was 1.5 s with the sampling frequency of 10 kHz. Take the condition of Ql = 2.2 m3/h, for example; the mean velocity distribution on a vertical section in the venturi tube is shown in Figure 4. It can be seen that the mean value around the throat section was about 12 m/s. Based on the liquid flow rate (Ql = 2.2 m3/h) and the size of throat diameter (dth = 8 mm), the calculated mean velocity was 12.16 m/s. The deviation was less than 2%. In the diverging section, the mean velocity decreased gradually along the mainstream direction (from right to left in Figure 4), and at downstream locations, the mean velocity was lower near the wall. This velocity distribution was consistent with the results revealed in other venturi tubes [27]. After the single-phase flow test, the two-phase flow phenomena and flow parameters (flow rate and pressure) were recorded and analyzed at different conditions.

3. Experimental Results and Discussions

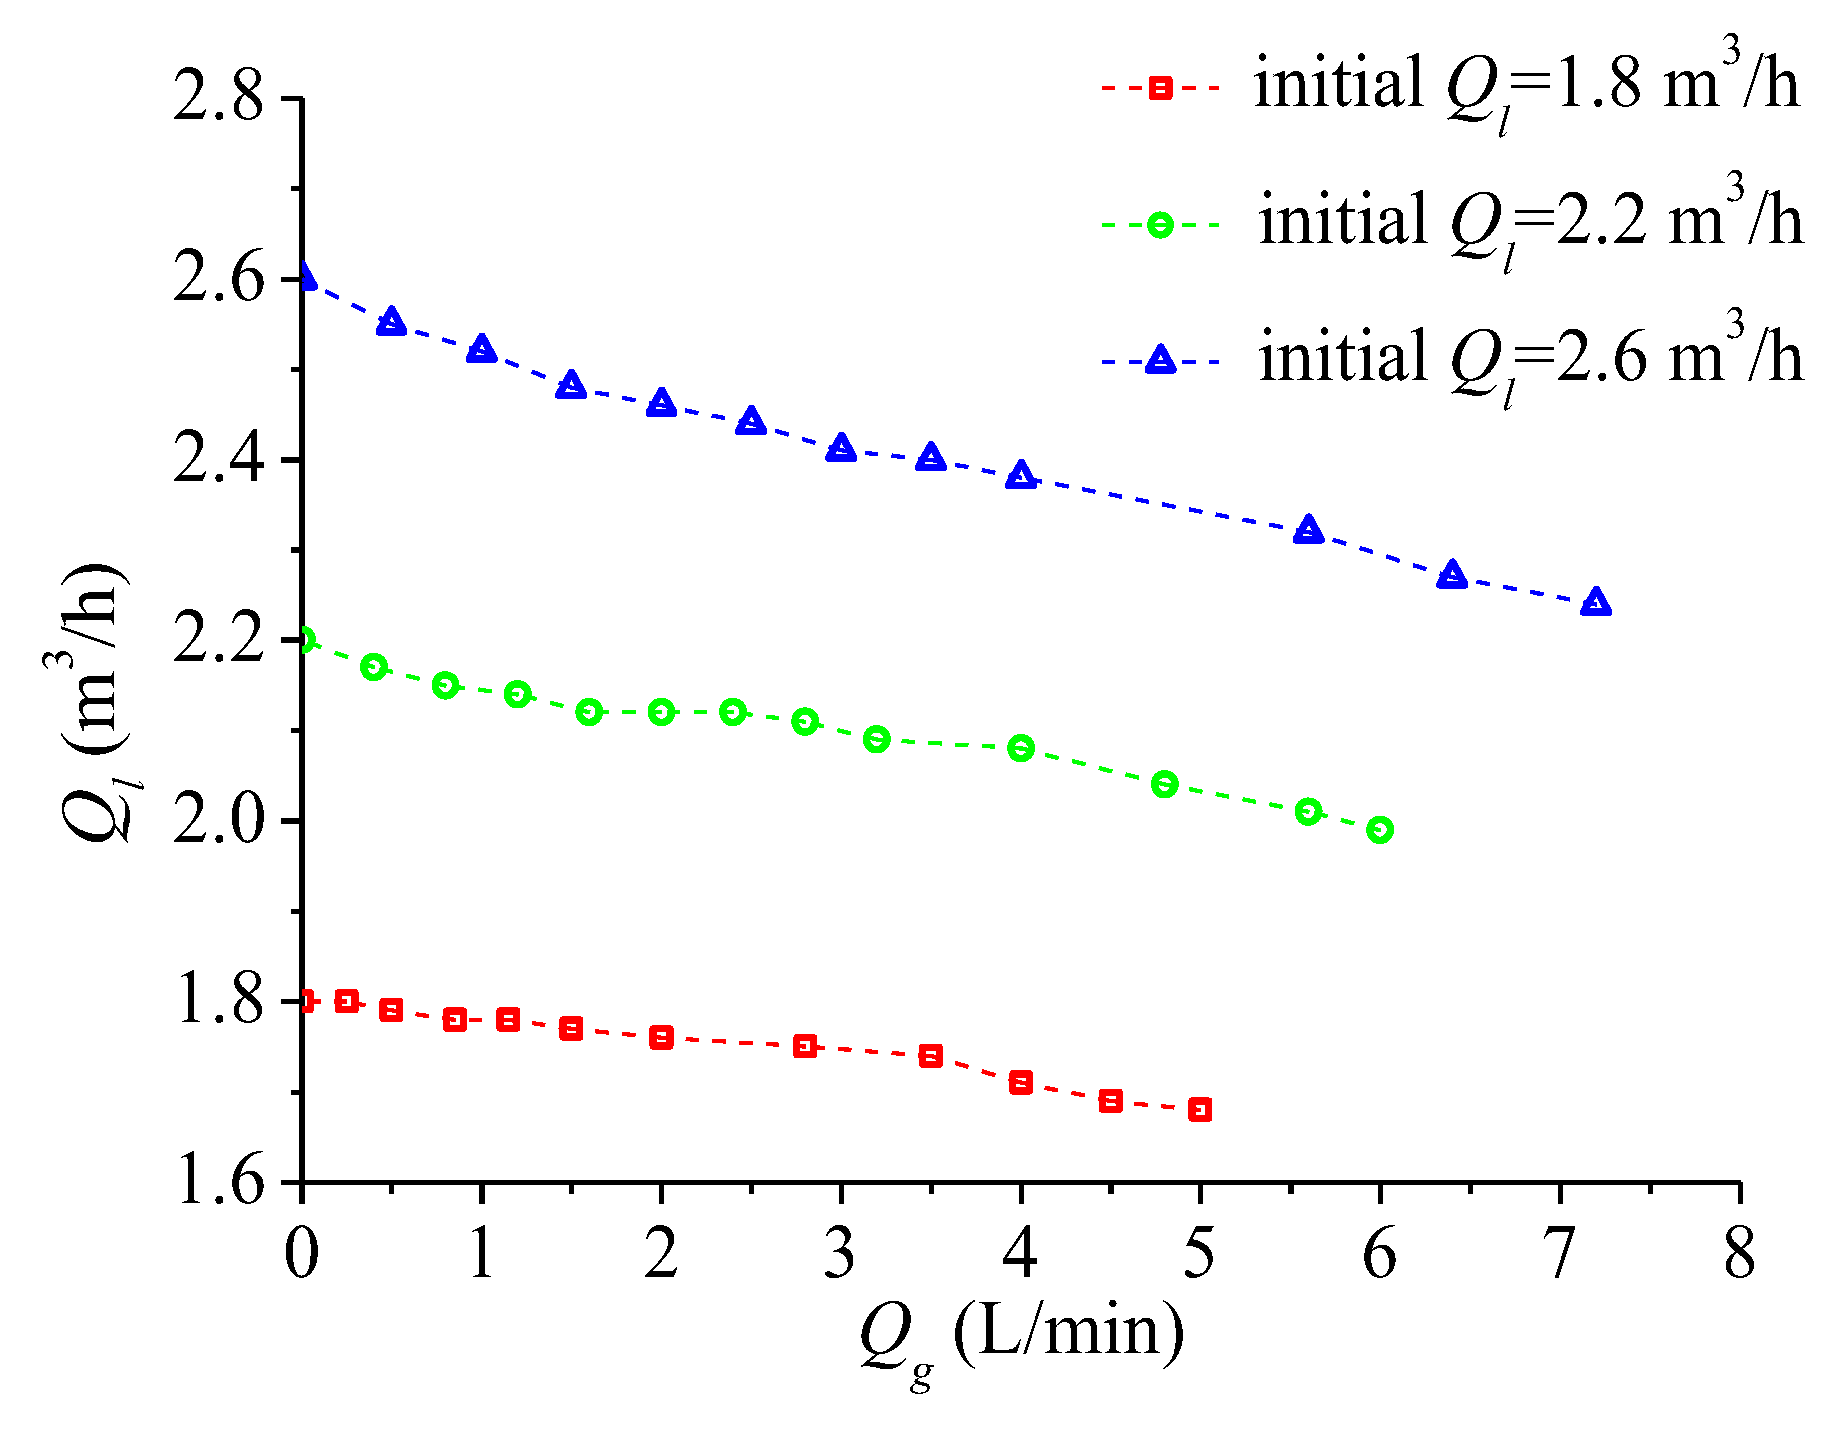
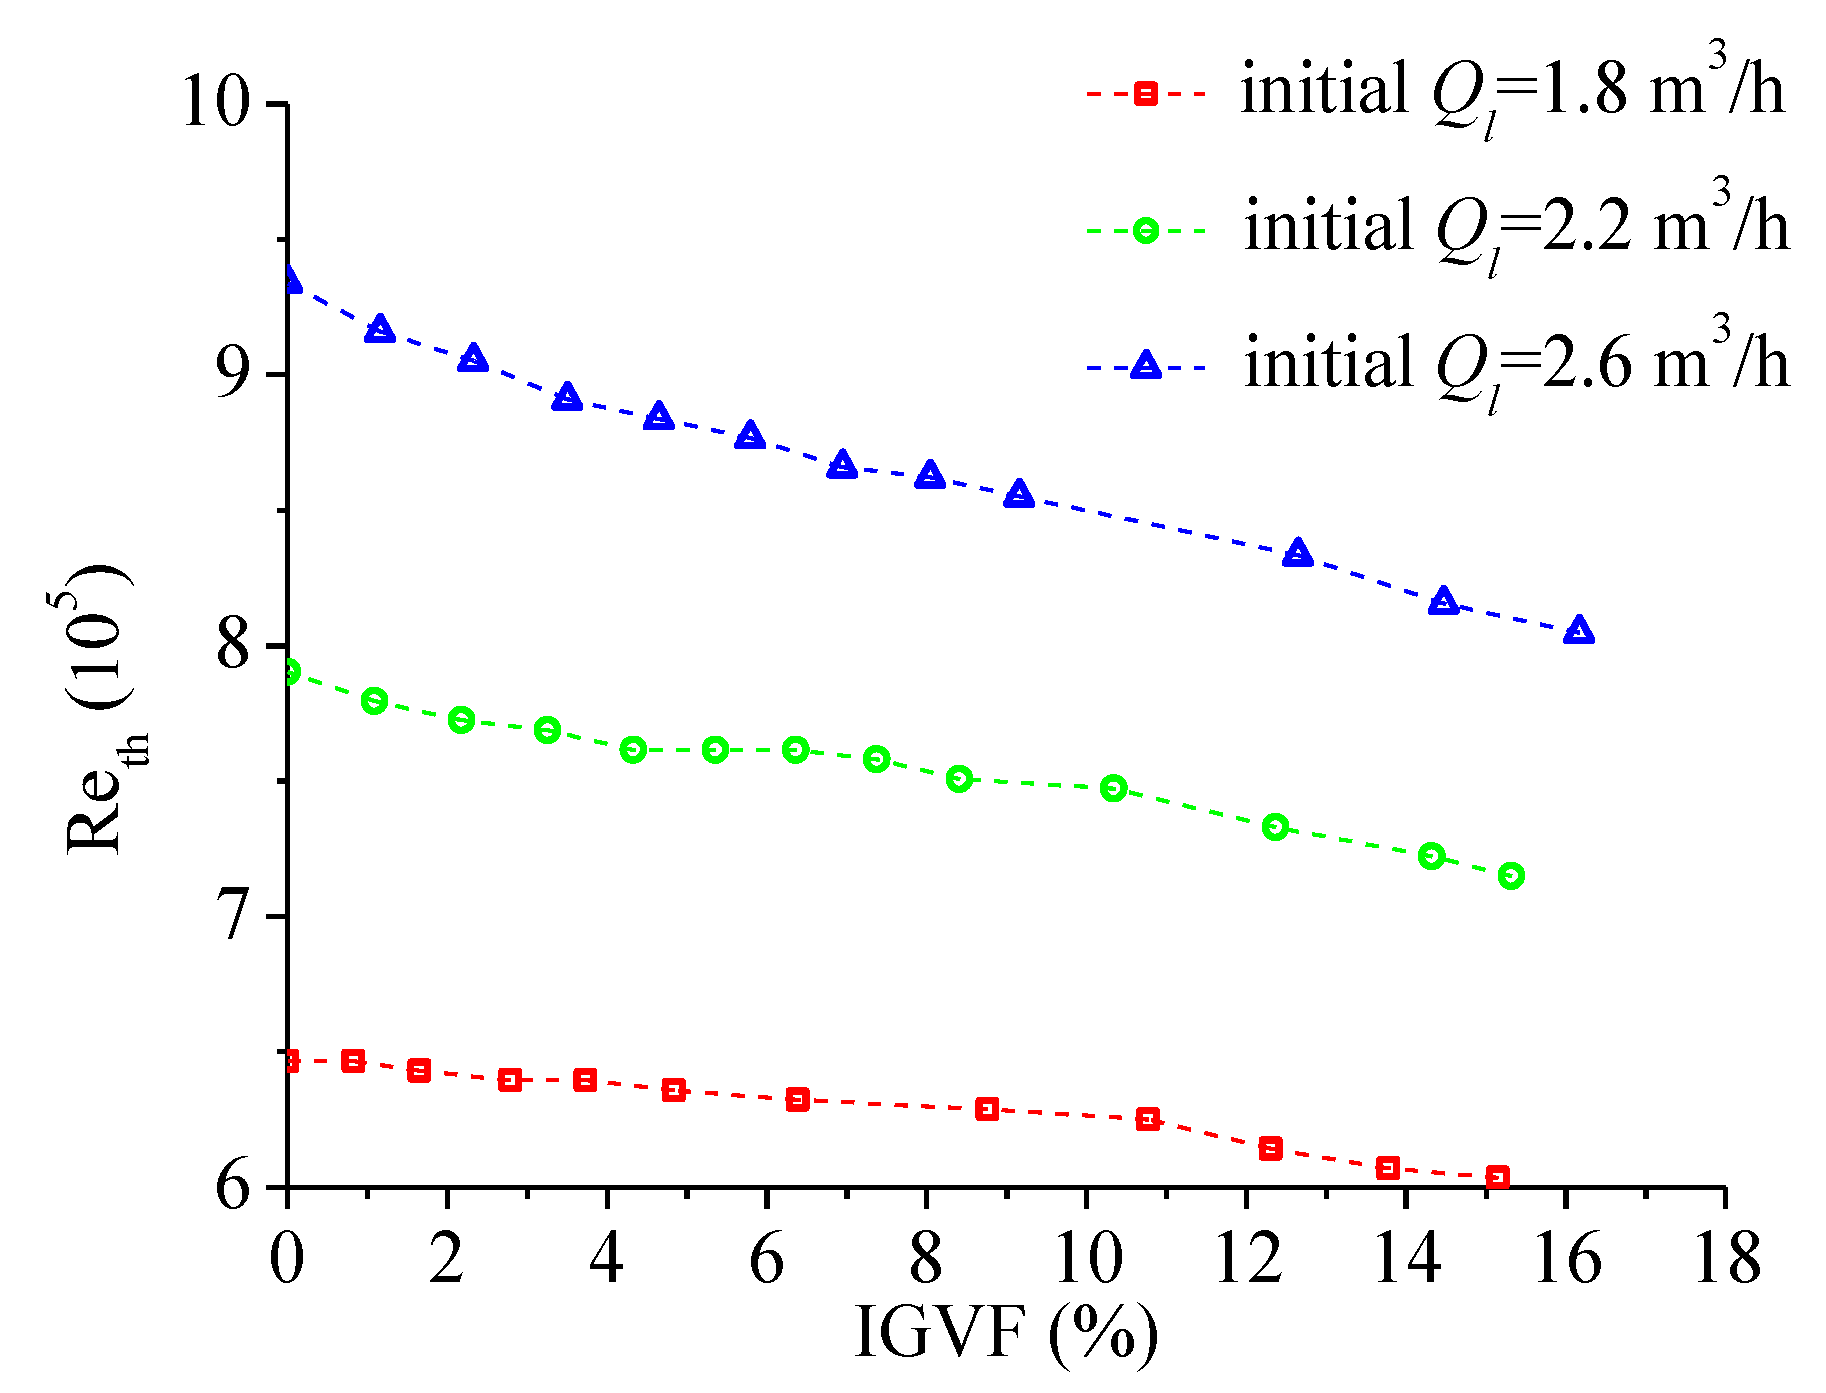
3.1. Variation of Ql Under Gas Containing Conditions

Based on the above analysis, three different liquid flow rate conditions with the initial values of Ql = 1.8 m3/h, 2.2 m3/h and 2.6 m3/h were conducted in the present experiment. With the increasing gas content, the actual liquid flow rate through the venturi tube is shown in Figure 5. It can be seen that the liquid flow rate Ql decreased with the increase in the gas flow rate Qg, which showed that the presence of gas in the inflow would weaken the ability to transport liquid in the venturi tube. When the gas content was higher, this influence was more significant.
Transferring Figure 5 to Figure 6 by using the IGVF as the horizontal coordinate and the Reynolds number as vertical coordinate, it can be seen that the Reynolds number at throat section Reth decreased with the increasing IGVF. This relationship reflected the influence of gas content on the velocity within the throat of the venturi tube. When the IGVF was below 10%, the Reth decreased slowly with the increasing IGVF. When the IGVF was higher than 10%, the Reth decreased significantly with the increasing IGVF. This variation was particularly significant at Ql = 1.8 m3/h. When the IGVF changed from 0 to 16% in the experiment, both the Reth and Ql decreased by 6.7%, 9.6%, and 13.9% at Ql = 1.8 m3/h, Ql = 2.2 m3/h and Ql = 2.6 m3/h, respectively. The decrease in flow rate and velocity was clearly related to the proportion of gas phase. It is necessary to further reveal the changes in external characteristics by analyzing the gas phase distribution.

3.2. Variation in Flow Structure Under Gas-Containing Conditions

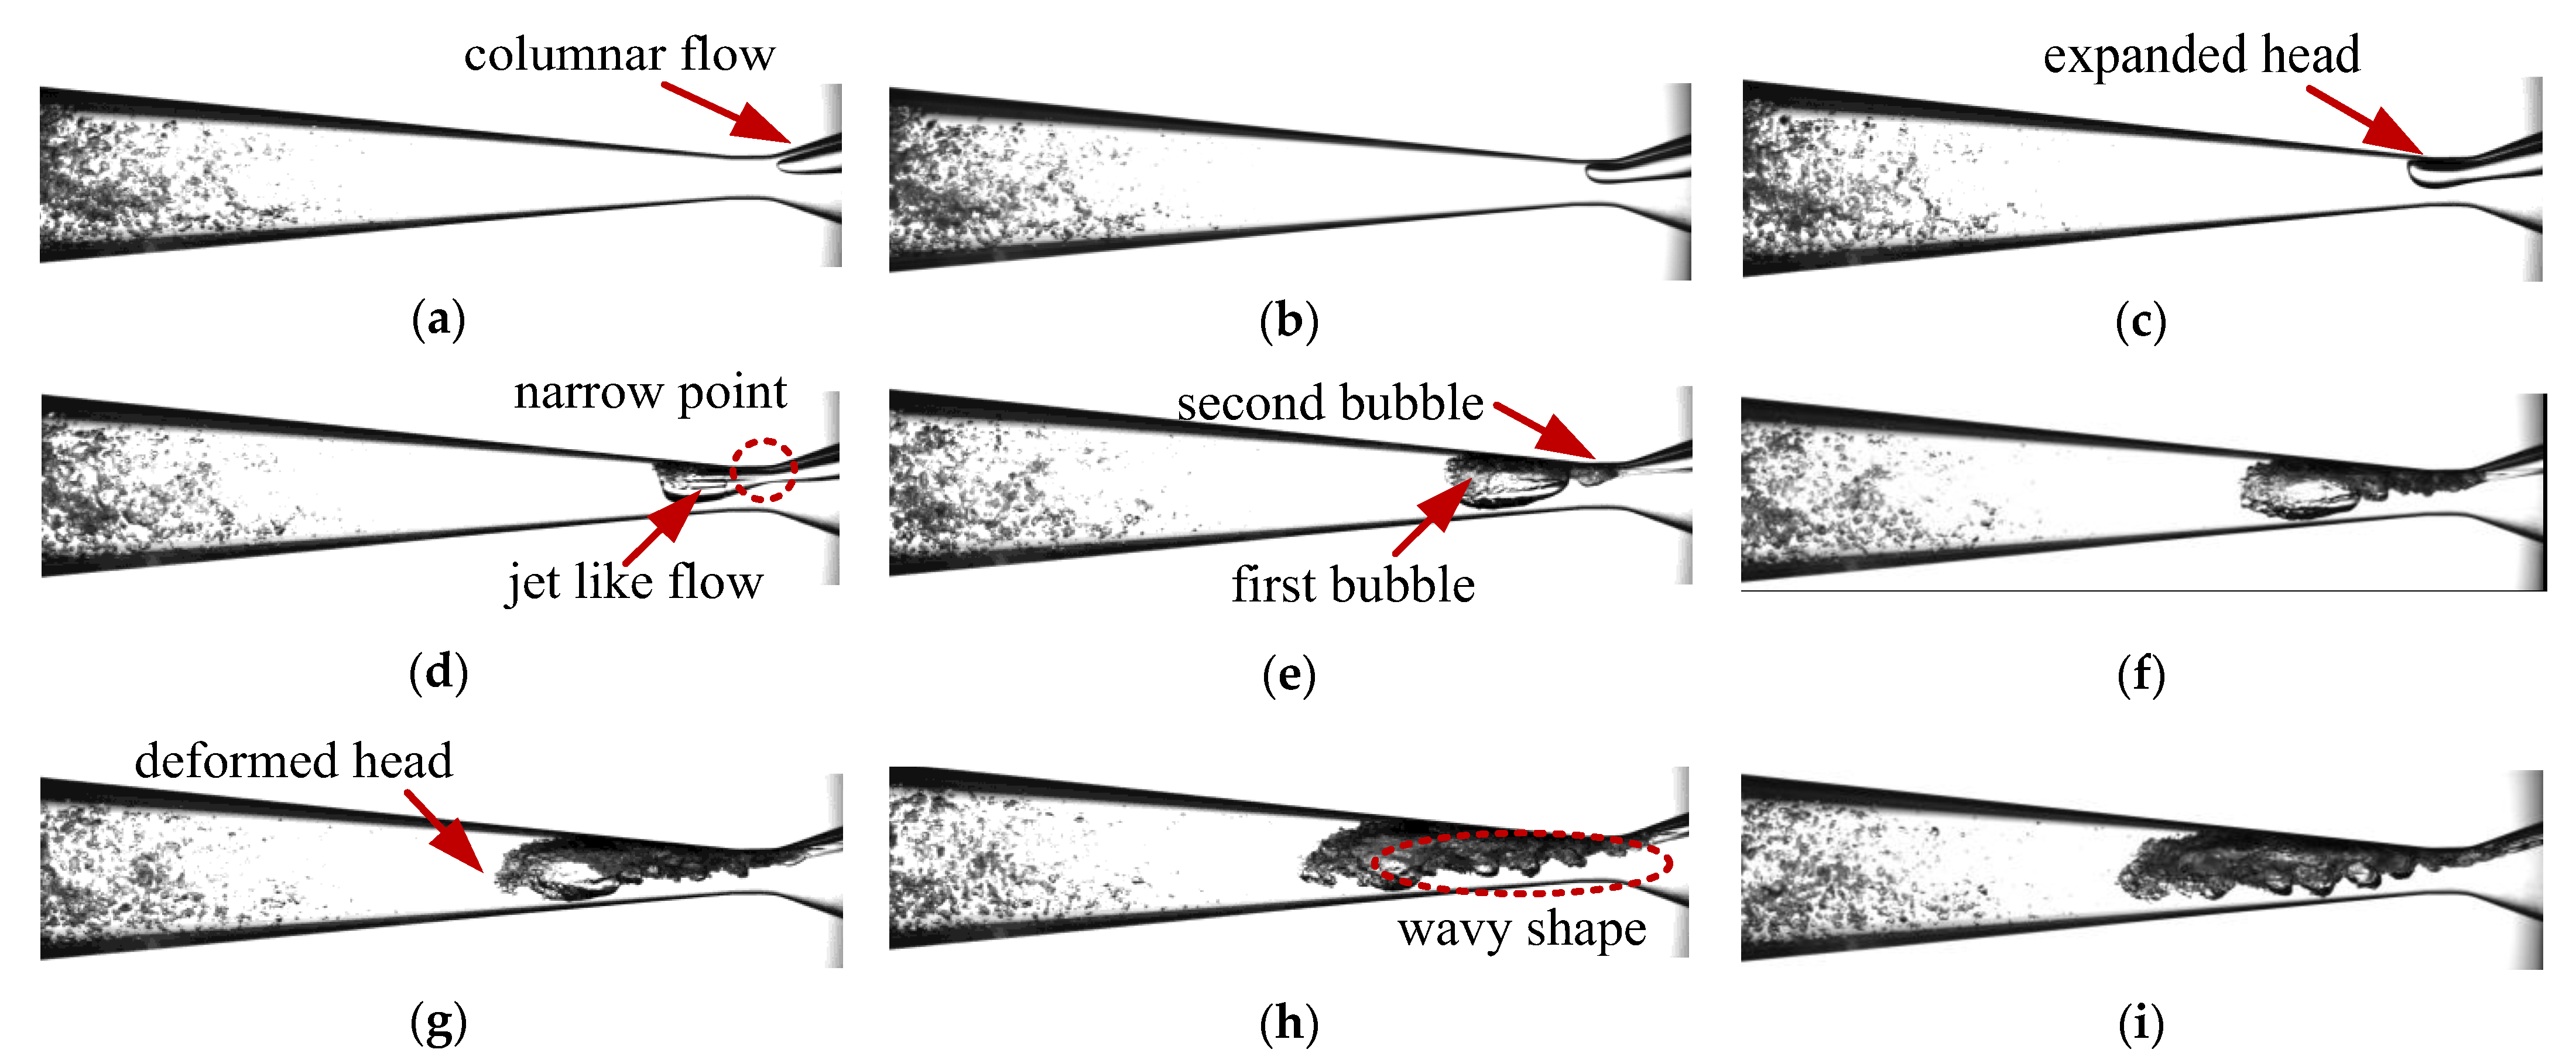
3.2.1. Evolution of the Two-Phase Flow

The flow structure inside the venturi tube was recorded through high-speed photography. A high-speed camera was used to capture the flow images whose size were 1472 × 364 pixels with 5000 frames per second. In order to increase the brightness of the image, an external light source with small heat dissipation and no stroboscopic was used. The phantom camera control application (PCC) software on the computer was matched with the camera to record, filter, and store the captured images.
On each condition in Figure 5, ten thousand pictures during two seconds of time were used to show the flow phenomena. Figure 7 shows the evolution of the two-phase flow on the condition of Ql = 1.8 m3/h and Qg = 2.0 L/min (IGVF = 6.38%). Under other conditions, similar phenomena could be found with different evolution rates.
When the incoming gas was located inside the converging section, as shown in Figure 7a, the bubble appeared as a columnar flow, which was attached to the upper wall within the converging section of venturi tube due to the buoyancy effect. The bubble head was defined as the position near the downstream (left) of the venturi tube, and the bubble tail was defined as the position near the upstream (right) of the venturi tube.
Once the bubble entered and passed through the throat section, the bubble head began to expand, as shown in Figure 7b,c. The expansion of the bubble head depended on two aspects. On the one hand, the gas phase developed in a bubble-like structure, similar to the teardrop-like bubble in a venturi tube study [19]. On the other hand, the increased flow velocity in the throat section promoted the forward movement of the gas phase.
When the bubble extended to the diverging section, a narrow point appeared near the entrance of the throat, as shown in Figure 7d. The bubble resembled a wedge shape, and there was a horizontal highlighted area in the middle position. Referring to the studies on the bubble breakup phenomena in a venturi tube [19], this type of horizontal flow was jet flow, which was formed due to the bubble tail being sucked into the interior toward the bubble head. This jet flow caused the bubble deformation and breakup, and the gas–liquid interface was unclear near the bubble head.
Subsequently, the bubble deformed gradually with the head collapsing and formed a smaller wedge-shaped bubble. The large bubble near the downstream was defined as the first bubble, and the following smaller bubble was defined as the second bubble in Figure 7e, and even the third and fourth gas regions were followed closely behind, as shown in Figure 7f. During the entire flow process, the first and second bubble regions had the most prominent wedge-shaped features.
As the gas phase developed downstream, the deformation of the bubble head was becoming significant, as shown in Figure 7g. Meanwhile, the number of broken small bubbles increased, some of which began to detach and move downstream with the water flow. The gas phase region was mainly concentrated near the inlet of the diverging section of the venturi tube, and the darkened area in the gas phase region indicated the aggregation of multi small bubbles. Under the combined action of incoming gas and the accumulation of gas phase inside the flow channel, the gas–liquid interface exhibited a wavy shape, as shown in Figure 7h,i.
Afterwards, the gas bubbles continued to collapse and move downstream for a relatively long time, and then repeated the process shown in Figure 7. Under every condition, multiple experimental phenomena were compared, and the overall change pattern was consistent with the pictures in Figure 7. The development process of this two-phase flow in the venturi tube was similar to the situation of the air-entrained flow from the pump intake [26], where the air-entrained vortex appeared intermittently over time and its period was uncertain. This indicated the complexity of gas–liquid two-phase flow. Fortunately, the evolution of the two-phase flow phenomena conformed to the above process, so the subsequent analysis was based on the scope shown in Figure 7.

3.2.2. Variation in Two-Phase Flow Under Different Liquid Flow Rates

Under the same gas flow rate condition, the impact of the liquid flow rate was mainly reflected in the evolution rate of the two-phase flow. In order to quantitatively analyze the development of gas phase inside the venturi tube, some parameters were defined as shown in Figure 8. The horizontal distance from the throat inlet section to the farthest point of gas phase was defined as the characteristic length (Lg) of the gas-phase region. The projected area enclosed by the gas–liquid interface was defined as the characteristic area (Ag) of the gas-phase region.
Figure 9 shows the variation in the characteristic length (Lg) and characteristic area (Ag) of the gas-phase region over time with different initial liquid flow rates. The gas flow rate was Qg = 2.0 L/min, and the initial Ql increased from 1.8 m3/h to 2.6 m3/h. The corresponding Reynolds number at the throat was Reth = 6.3 × 10⁵, 7.6 × 10⁵ and 8.8 × 10⁵. In Figure 9, t = 0 ms corresponds to the moment that the bubble arrived at the entrance of the throat section, as shown in Figure 7a. It can be seen that Lg increases over time and the growth rate slowed down.
In Figure 9, three special positions roughly divide the curves into several parts. When the bubble developed in the throat section, like the phenomena in Figure 7b,c, the value of Lg increased from 0 to 8 mm, which was equal to the venturi throat length. After the position of Lg = 8 mm, the bubble entered the diverging section. The diffusion structure determined the decreasing in flow velocity, but high-speed outflow continued from the throat so the velocity reduction was not significant. When the gas-phase region developed to a special position about Lg = 29 mm, the narrowest point appeared at the end of the first wedge-shaped bubble during the process from Figure 7d to Figure 7e. Subsequently, some smaller bubbles formed at the end of the previous bubble and the head of the first bubble deformed. Until the position near Lg = 47 mm, there was significant deformation on the head of the first bubble, as shown in Figure 7g, and some visible small bubbles began to detach from the head. In the process of the gas-phase transition, the initial liquid flow rate was larger, and the transition speed was faster.
Figure 10 shows the variation in the characteristic area (Ag) of the gas-phase region over time with different initial liquid flow rate. The vertical axis is dimensionless processed by the projection area (A) of venturi tube, as shown in Figure 7. In Figure 10, the relationship between the projected area and time shows a linear growth trend. As the initial liquid flow rate is larger, the slope of the curve is greater. Three special situations from Figure 9 can be reflected in Figure 10. When the gas-phase region entered the diverging section, the proportion of the characteristic area (Ag) inside the throat section was about 1%. When the narrowest point appeared at the end of the first wedge-shaped bubble, the proportion of Ag/A was around 6%, which corresponds to the condition of Lg = 29 mm. When the significant deformation on the head of the first bubble appeared, the proportion of Ag/A was around 11%.
Taking the condition at t = 2 ms for example, Figure 11 shows the phenomena with different initial liquid flow rates. After the same amount of time, the characteristic length (Lg) and area (Ag) of the gas-phase region increased when the liquid flow rate was larger. Combined with the quantitative results in Figure 9 and Figure 10, it is found that the variation of Lg and Ag from Ql = 1.8 m3/h to Ql = 2.2 m3/h was greater than that from Ql = 2.2 m3/h to Ql = 2.6 m3/h. Figure 11 shows that there are more small bubbles under high flow rate conditions. Due to the interaction of a large number of bubbles and their occupation of the flow channel, the gas phase transition in high flow conditions slowed down.

3.2.3. Variation in Two-Phase Flow Under Different Gas Flow Rates

Under the same initial liquid flow rate condition, the impact of gas flow rate is revealed in Figure 12. The initial Ql was 2.2 m3/h and the gas flow rate Qg increased from 2.0 L/min to 6.0 L/min. The corresponding inlet gas volume fraction was IGVF = 5.4%, 10.3% and 15.3%, respectively. In Figure 12, three special positions probably also appeared in these positions at Lg = 8 mm, Lg = 29 mm and Lg = 47 mm. With the increase in gas flow rate, the gas-phase region moves faster to the downstream. It can be seen that Lg increased over time, and the growth rate gradually slows down. This trend of change is influenced by the flow characteristics. Under the influence of the venturi tube structure features, the converging section leads to an increase in flow velocity until it reaches the throat outlet. After the gas phase region enters the diverging section, the flow velocity decreases and slows down the gas phase development. On the other hand, the two-phase flow structure features (as shown in Figure 7) have significant impact on the development process of flow. Especially after the collapse of bubbles, a large number of small bubbles interact with each other, including collision and constraint, which can slow down the forward speed.
Figure 13 shows the variation in Ag/A with time under different gas flow rate conditions. The curves generally show a linear variation, especially during the time in the first 5 s, where the three special positions mentioned above still correspond to the value of Ag/A about 1%, 6%, and 11%. With the development of deformation and detachment of the bubbles, the gas–liquid interface becomes blurred, which limits the accurate measurement of Lg and Ag.
Figure 14 shows the flow phenomena at t = 4 ms and t = 7 ms with different gas flow rates. In Figure 14a, the bubble region has relatively clear boundaries after entering the throat (labelled by the vertical dash line). According to the data from Figure 12 and Figure 13, it can be seen that the values of Lg and Ag increase proportionally with the increase of Qg at t = 4 ms. In Figure 14b, the downstream boundary (labelled by the tilted dash line) of the bubble region becomes unclear due to severe deformation of the bubble head. Meanwhile, the collapse of bubbles produce a large number of small bubbles, and their spatial distribution makes it difficult to identify the gas–liquid interface. When the Qg increases from 2.0 L/min to 4.0 L/min, the number of small bubbles in the downstream of venturi tube increases significantly. As Qg further increases to 6.0 L/min, the quantity change in small bubbles is not significant. With the increase of Qg, the corresponding inlet gas volume fraction is IGVF = 5.4%, 10.3% and 15.3%, respectively. According to the results in Figure 6, it can be inferred that the slowing down of the gas-phase process is due to the obstruction of a large number of small bubbles, especially when the IGVF exceeds 10%.

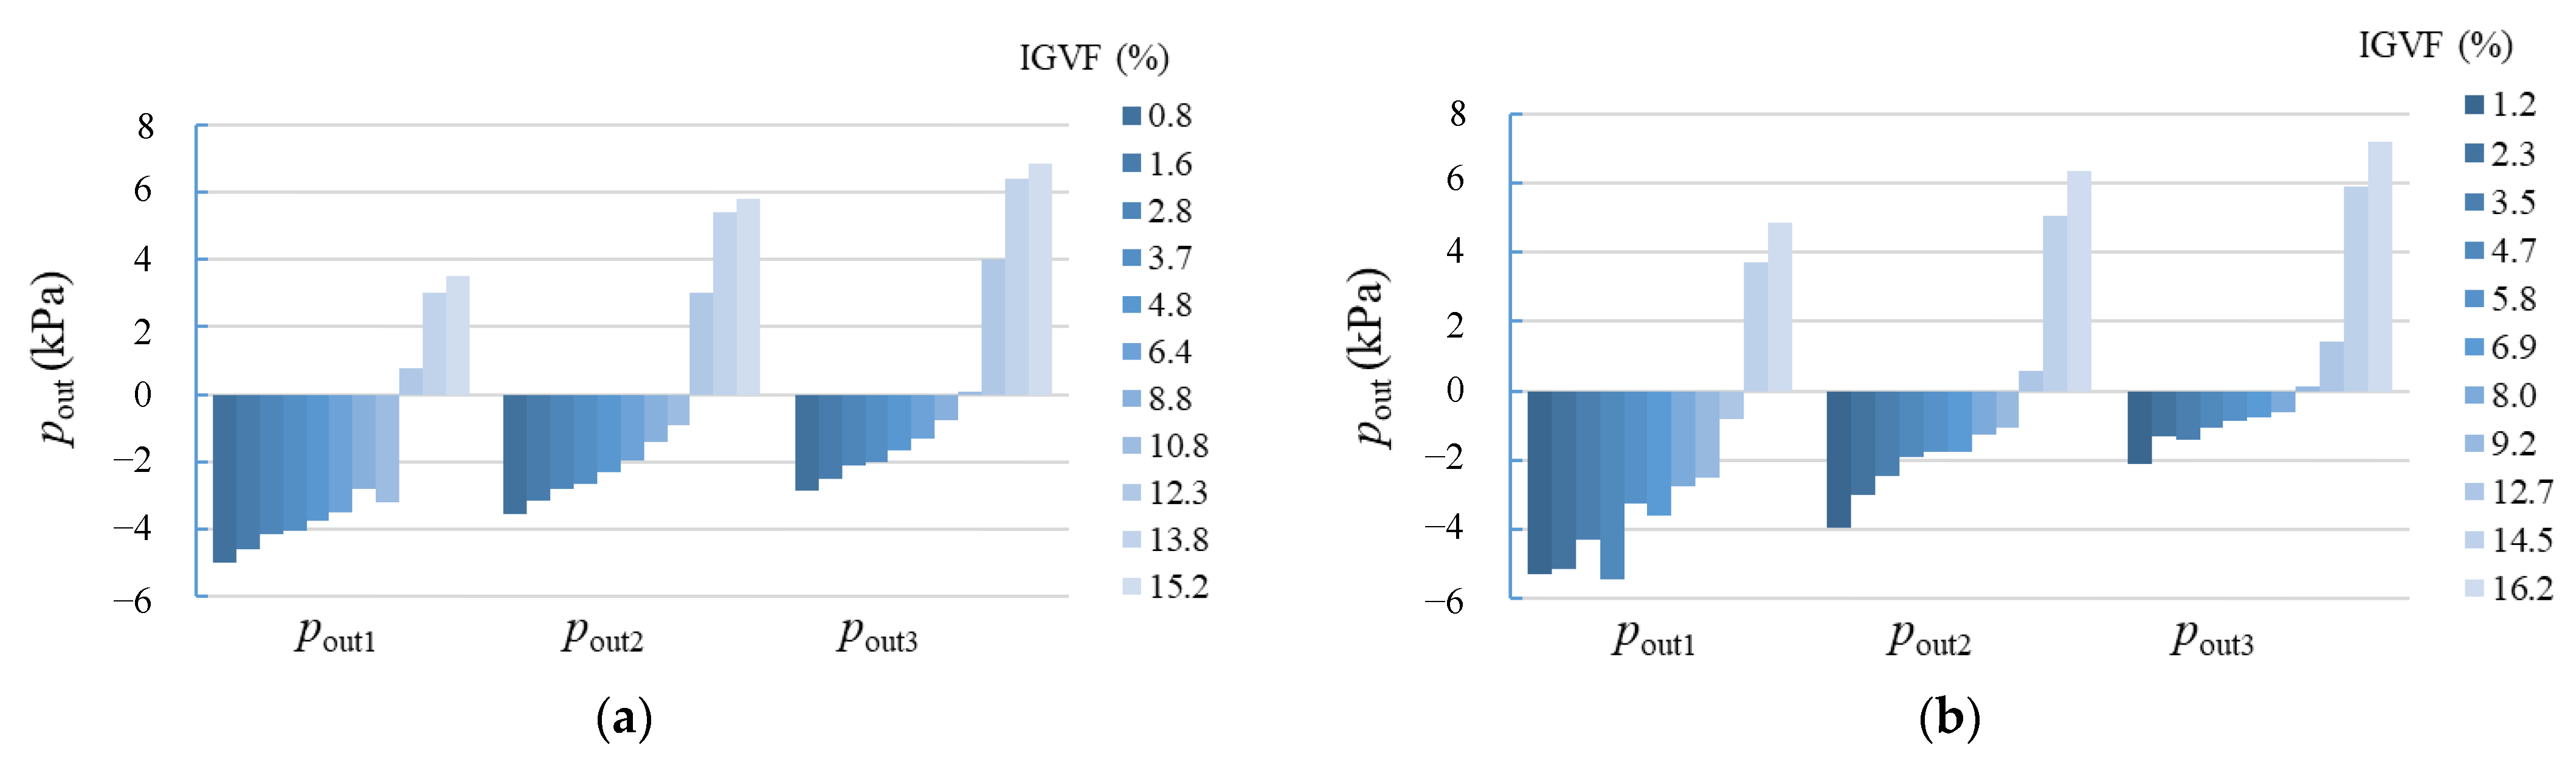
3.3. Variation in Pressure Characteristics Under Gas Containing Conditions

The pressure information was measured by four pressure sensors, as shown in Figure 2. The pressure measurement results at 368 mm position before and after the venturi tube were recorded as pin and pout1. The further downstream pressure was measured by two additional sensors spaced 100 mm apart as pout2 and pout3. The relative pressure values were recorded by a data acquisition unit with the sampling frequency of 5 kHz.
Figure 15 indicates the time-averaged pressure within two seconds for pin (solid plots) and pout1 (open plots). Under the same initial liquid flow conditions, the value of pin rises with the increasing IGVF; this is due to the effects of the incoming gas. When the value of IGVF is lower than 10%, the variations in pin present a linear growth trend approximately. When the IGVF exceeds 10%, the rate of change in pin has increased significantly. This kind of change is consistent with the changes in flow rate reflected in Figure 6. This rapid change in pressure around IGVF ≈ 10% is more pronounced in low flow rate conditions. The fluid transport capacity is weak at a low flow rate, and it is more susceptible to being blocked by high gas content.
In Figure 15, the values of pout1 among different Ql conditions are not significantly different. Under the same IGVF conditions, the two-phase flow characteristics at the outlet of the venturi tube are similar. The downstream pressure recording point is connected to the water tank which is open to the atmosphere. From the downstream pressure measuring point to the water tank, there is no significant difference in losses in the pipeline section under different operating conditions. When the value of IGVF exceeds 10%, there is a significant increase in the number of bubbles at the outlet of the venturi tube, as shown in Figure 14. The breakthrough of downstream bubble clusters introduces an increase in pressure. The overall value pout1 is lower than pin, reflecting the pressure drop characteristics of the venturi tube. The larger the pressure drop value, the more energy is consumed. Therefore, under high gas content conditions, the energy loss of the flow field in venture tube is greater.
The further downstream pressure of pout2 and pout3 are compared with pout1 shown in Figure 16. Under each condition, the relationship of pout3 > pout2 > pout1 indicates the pressure recovery. This is due to the liquid remaining with the trend of decreasing speed after leaving the diverging section. Comparing the downstream pressure, it can be found that the pressure difference value of pout3-pout2 is lower than the value of pout2-pout1. This indicates that the pressure recovery is gradually slowing down. With the increase in gas content, especially when the value of IGVF exceeds 10%, there is a significant increase in the rate of change in further downstream pressure. This is due to the accumulation of a large number of bubbles and their movement further downstream.

4. Conclusions

This study focuses on the gas–liquid two-phase flow inside a venturi tube. The objective was to investigate the influence of gas content on the flow field. The following conclusions were drawn:
1.
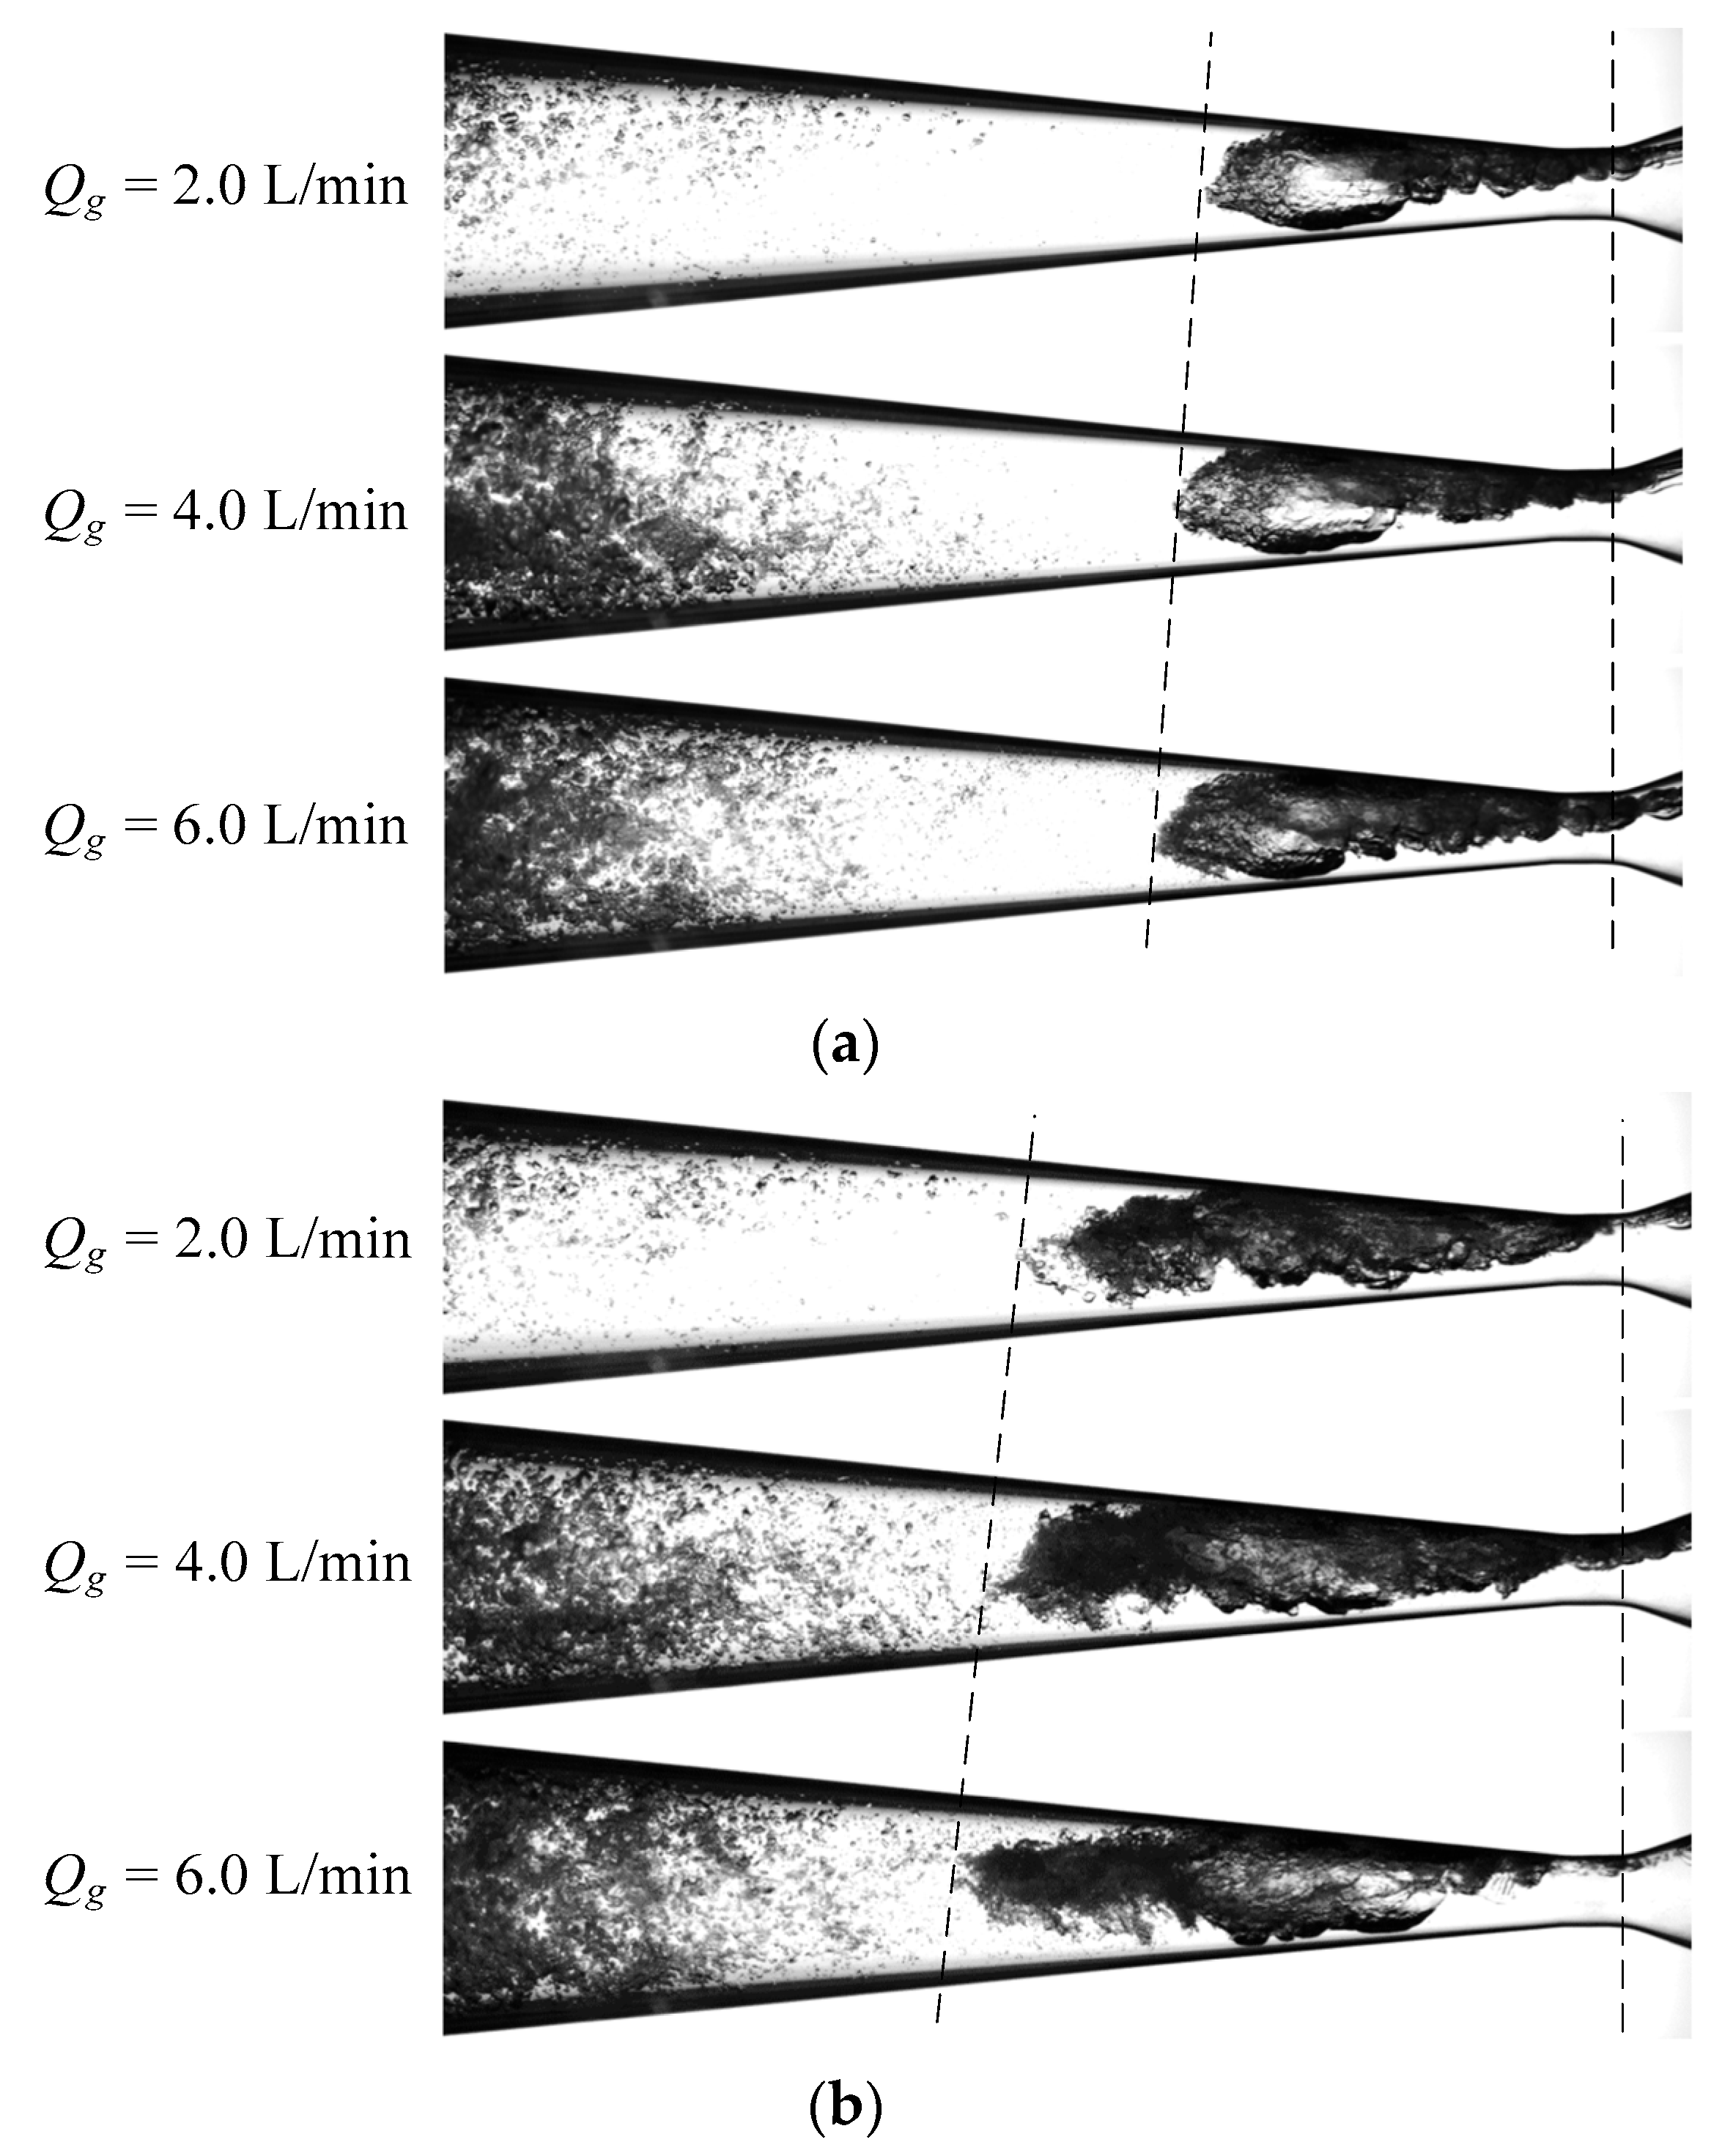
High-speed photography was used to record the development of an air–water two-phase flow inside a horizontal venturi tube. The variation in inlet gas volume fraction (IGVF) was from 0 to 16% due to the regulation of the upstream gas flow rate. When the gas flow entered the converging section of the venturi tube, the gas-phase region was in the form of a columnar bubble. When the bubble was moving into the throat section, there was an expansion on the bubble head. After the bubble entered the diverging section, the head of the bubble underwent further expansion and fragmentation, while smaller bubbles were generated.
2.
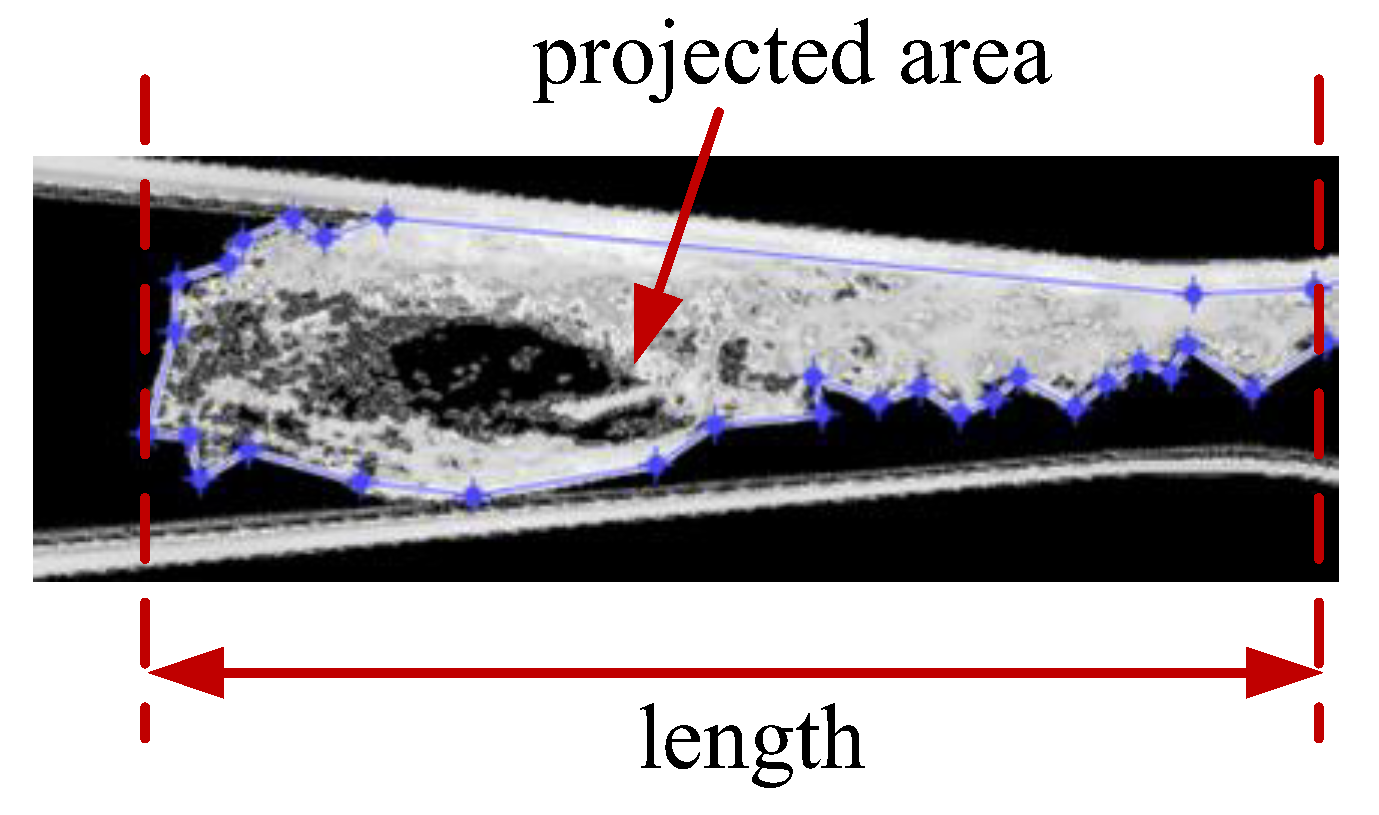
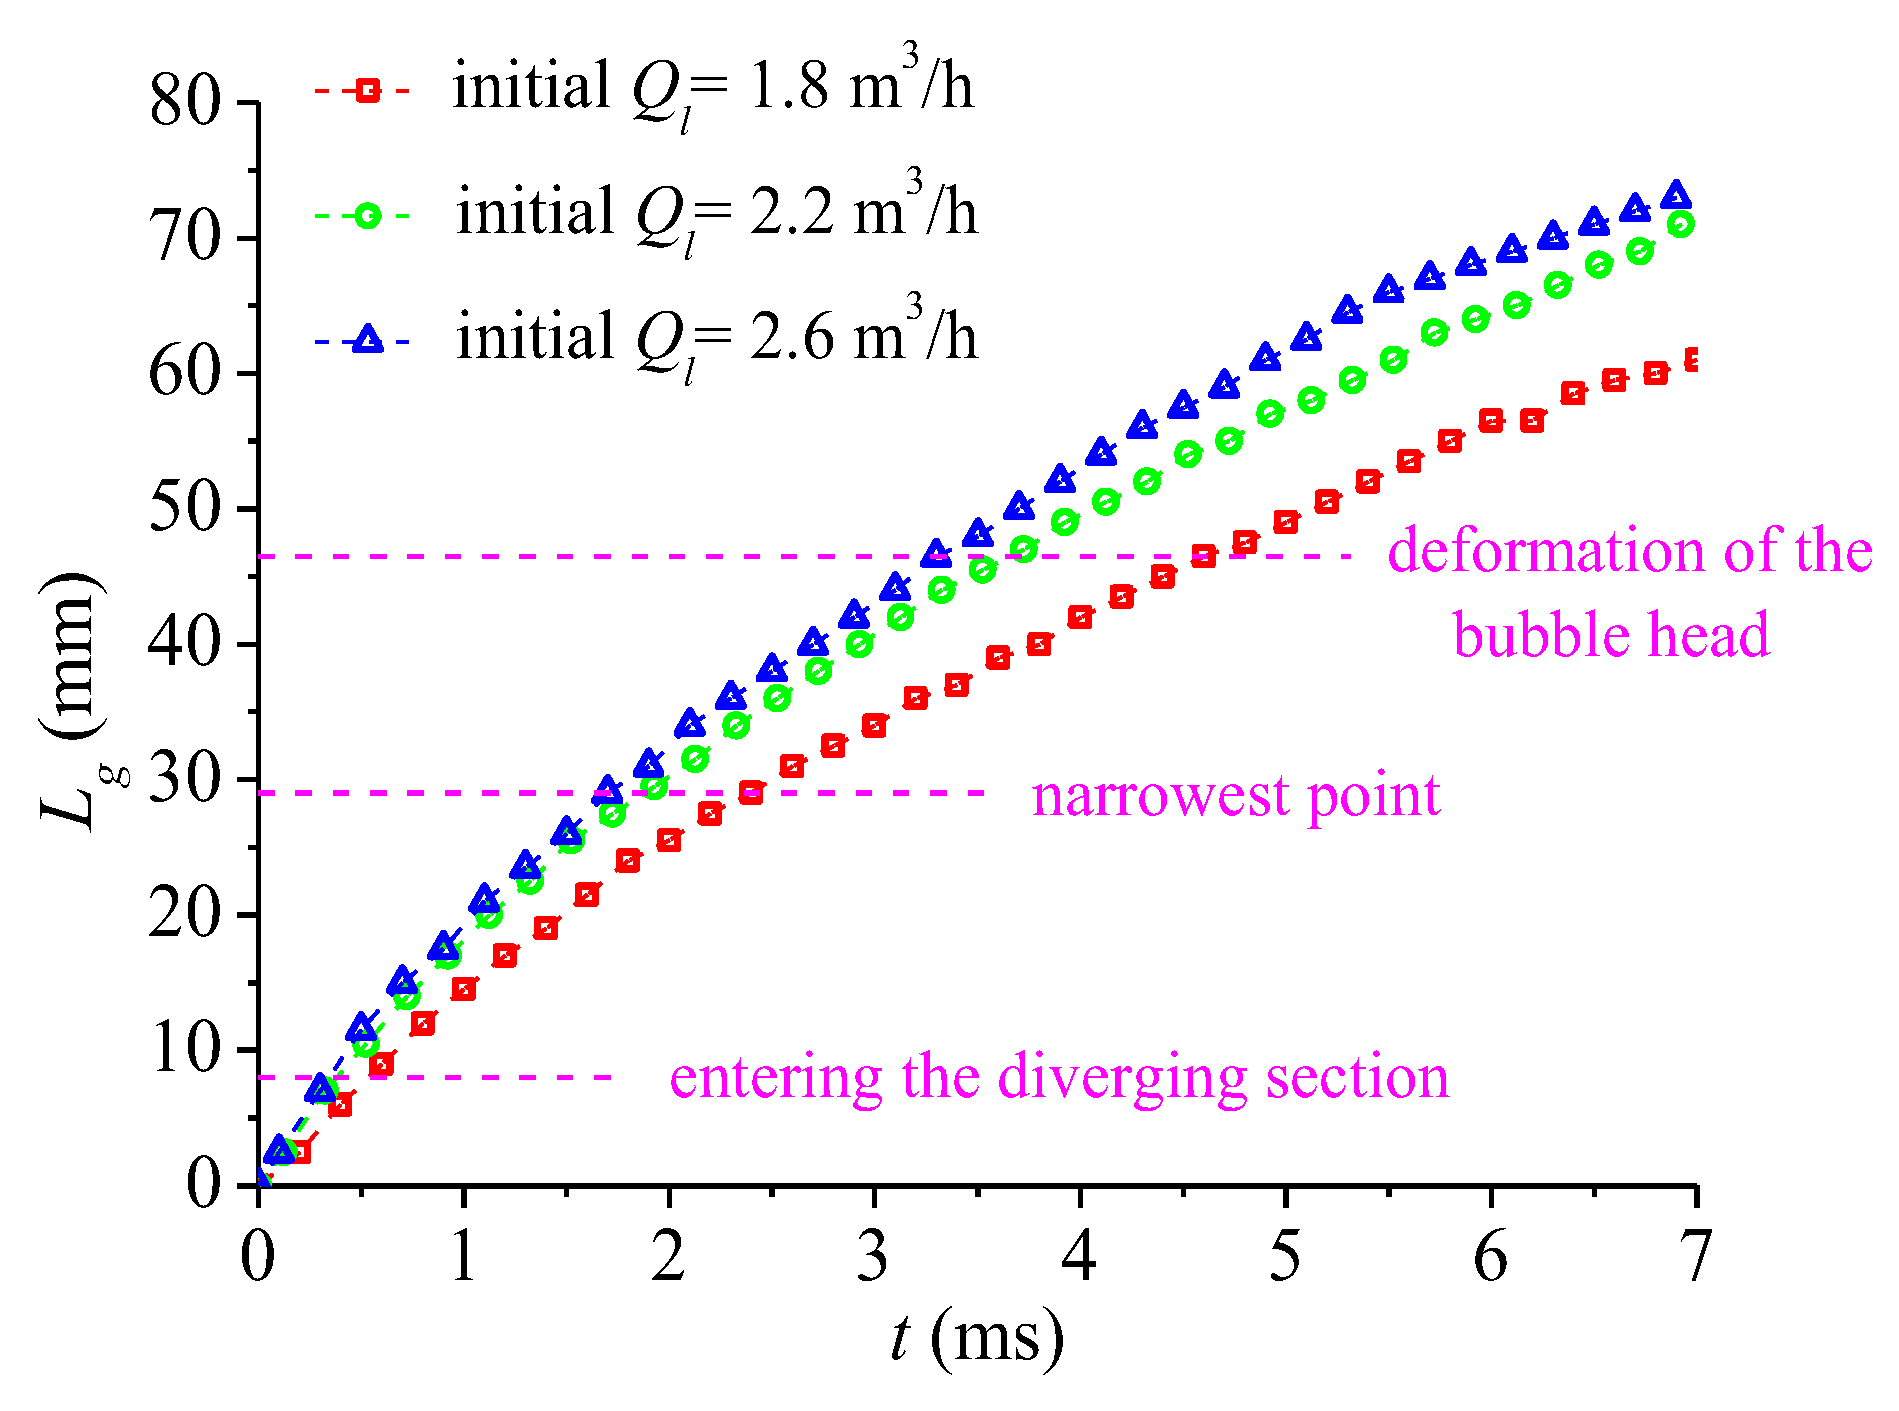
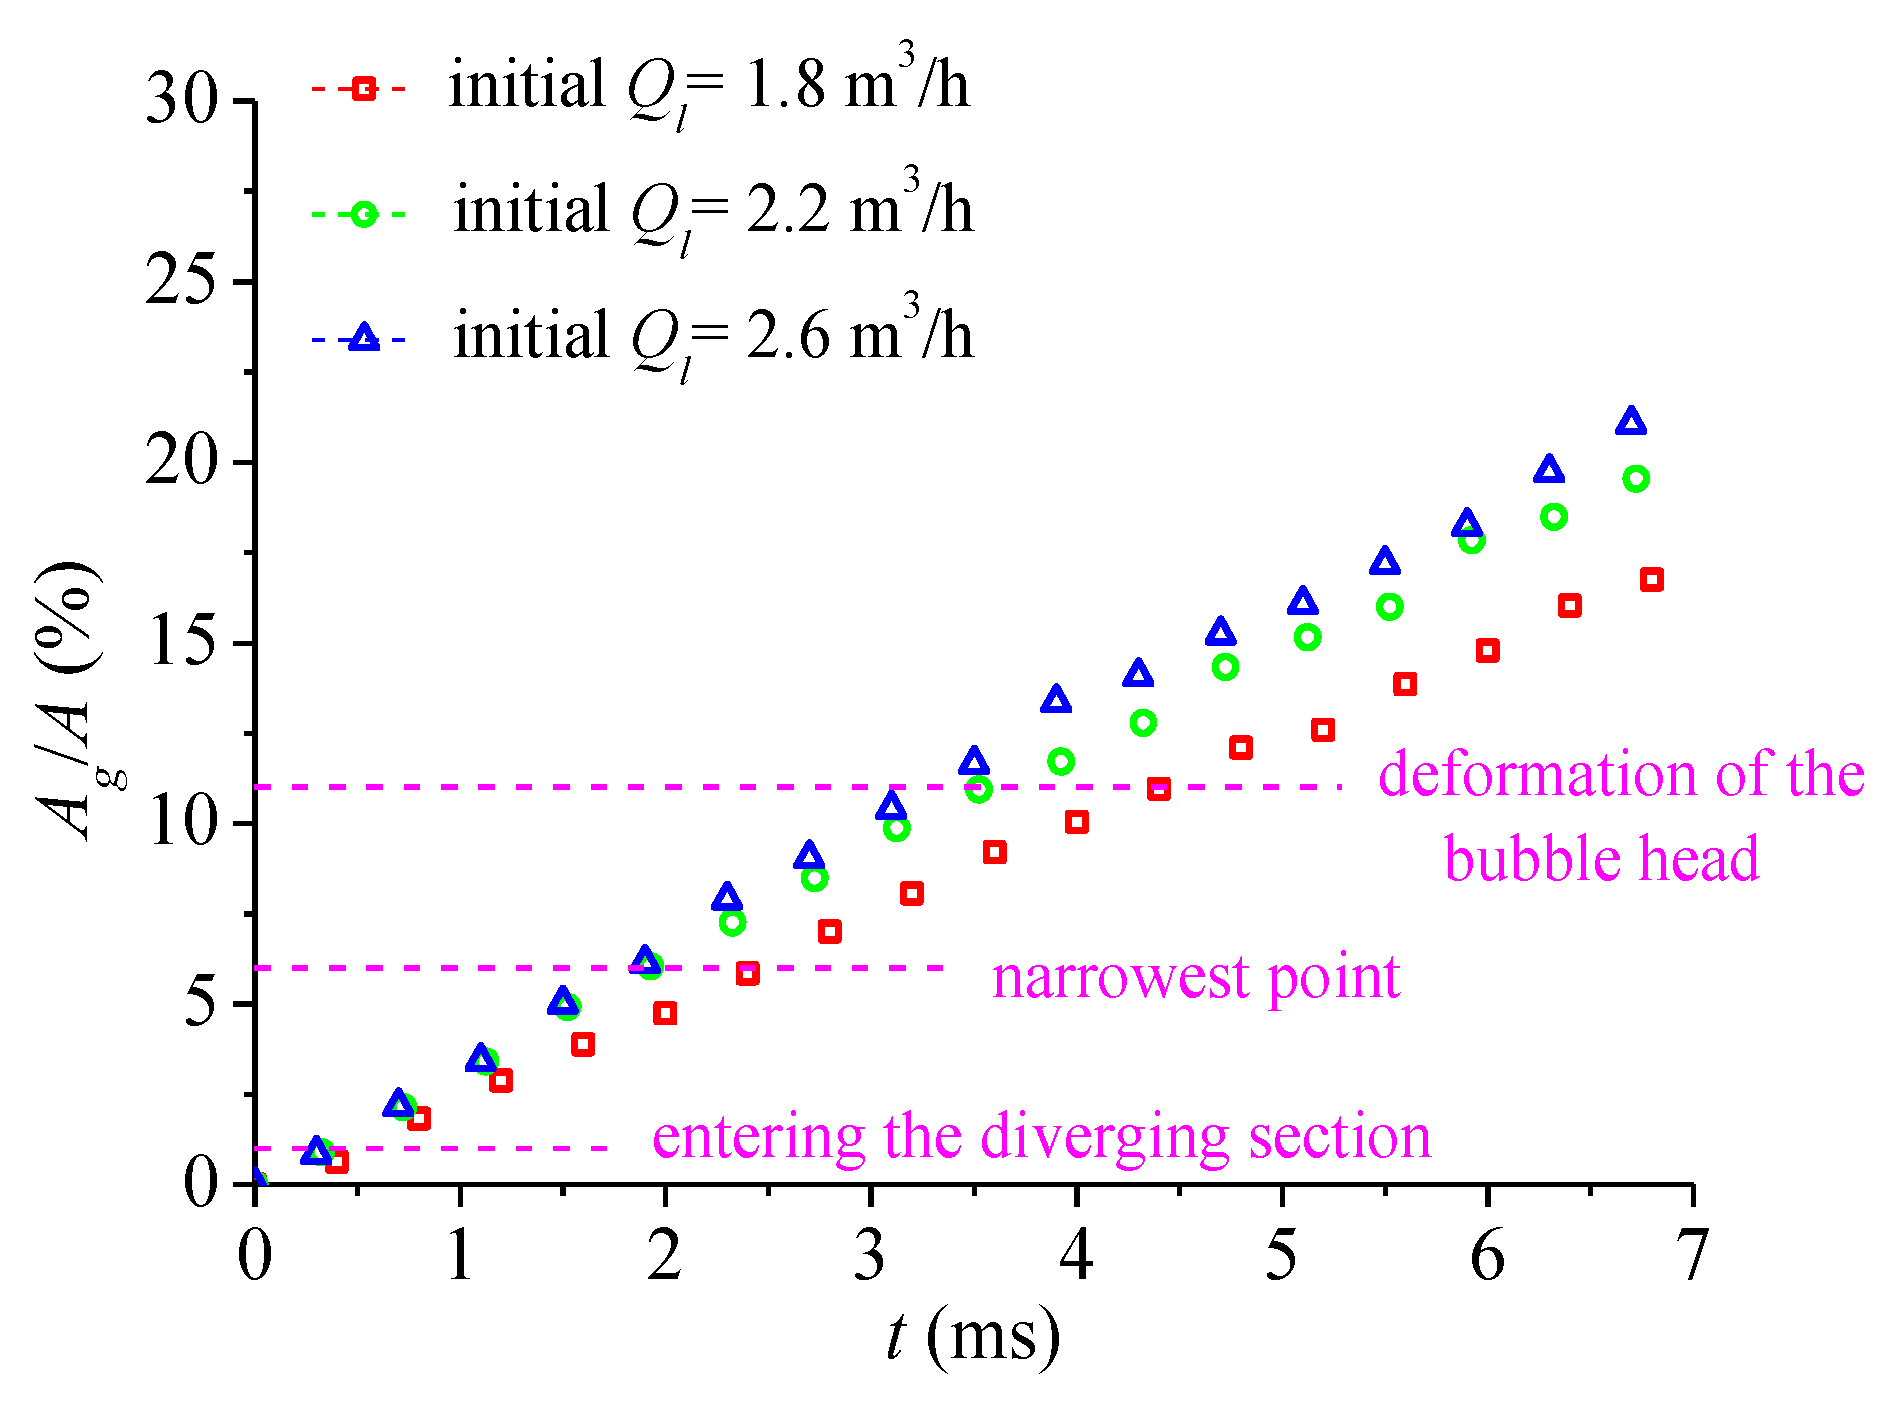
Under conditions with different gas contents, the evolution of the two-phase flow was similar, but the main difference was the rate of evolution. Two parameters, defined as characteristic length (Lg) and projected area (Ag), were used to quantitatively describe the bubble development process. With the increase in the IGVF, Lg of the gas-phase region increased but the growth rate was slowing down, which is due to the effects from downstream smaller bubbles. Based on the processing of experimental images, the projected area of the main bubble increased linearly with the increase in IGVF.
3.
By measuring the flow rate in the experiment system under different conditions, it could be seen that the liquid flow rate decreased with increasing gas content. When the value of IGVF exceeded 10%, the liquid flow rate decreased faster due to the blockage caused by high gas content. Time-averaged pressures upstream and downstream of the venturi tube were recorded, revealing that an IGVF of approximately 10% was also a critical point for significant changes in pressure characteristics. With the increase in gas content, the pressure drop indicated an increase in losses.
4.
This study has some limitations. As the flow of the experimental system was powered by a centrifugal pump, the instantaneous pressure would be affected by the operation of the pump. Further research could explore the pressure pulsation characteristics of the gas–liquid two-phase flow.

Author Contributions

Conceptualization, Q.G. and X.H.; methodology, Q.G. and X.H.; validation, Q.G., C.L. and X.L.; formal analysis, C.L. and A.J.; investigation, Q.G.; data curation, X.H.; writing—original draft preparation, Q.G. and X.H.; writing—review and editing, Q.G. and C.L.; visualization, A.J. and X.L.; supervision, X.H.; funding acquisition, Q.G., X.H. and X.L. All authors have read and agreed to the published version of the manuscript.

Funding

This research was funded by National Natural Science Foundation of China (Grant No. 52276041, 52379093 and 52409121).

Data Availability Statement

The data presented in this study are available upon request from the corresponding author upon reasonable request.

Conflicts of Interest

The authors declare no conflicts of interest.

References

  1. Wu, H.; Xu, Y.; Xiong, X.; Mamat, E.; Wang, J.; Zhang, T. Prediction of pressure drop in Venturi based on drift-flux model and boundary layer theory. Flow Meas. Instrum. 2020, 71, 101673. [Google Scholar] [CrossRef]
  2. Fang, L.; Zhang, T. Performance of a horizontally mounted venturi in low-pressure wet gas flow. Chin. J. Chem. Eng. 2008, 16, 320–324. [Google Scholar] [CrossRef]
  3. Nugraha, K.W.; Yuliati, L.; Winarto. The effect of venturi tube divergence angle geometry on wastewater treatment. J. Adv. Res. Fluid Mech. Therm. Sci. 2025, 128, 48–58. [Google Scholar] [CrossRef]
  4. Liu, Y. Utilization of the venturi effect to introduce micro-particles for epidermal vaccination. Med. Eng. Phys. 2007, 29, 390–397. [Google Scholar] [CrossRef] [PubMed]
  5. Tseng, T.M.; Chen, P.Y.; Tseng, H.; Lin, H.C.; Chang, C.Y.; Hung, S.H. An unexpected route for otolaryngology bacterial contamination with a venturi atomizer. Rhinology 2014, 52, 156–161. [Google Scholar] [PubMed]
  6. Li, X.; Huang, Z.; Meng, Z.; Wang, B.; Li, H. Oil-water two-phase flow measurement using a venturi meter and an oval gear flow meter. Chem. Eng. Commun. 2010, 197, 223–231. [Google Scholar] [CrossRef]
  7. Elperin, T.; Fominykh, A.; Klochko, M. Performance of a venturi meter in gas-liquid flow in the presence of dissolved gases. Flow Meas. Instrum. 2002, 13, 13–16. [Google Scholar] [CrossRef]
  8. Long, X.; Zhang, J.; Wang, J.; Xu, M.; Lyu, Q.; Ji, B. Experimental investigation of the global cavitation dynamic behavior in a venturi tube with special emphasis on the cavity length variation. Int. J. Multiph. Flow. 2017, 89, 290–298. [Google Scholar] [CrossRef]
  9. Wang, Z.; Zhao, Q.; Yang, Z.; Liang, R.; Li, Z. High-speed photography and particle image velocimetry of cavitation in a venturi tube. Phys. Fluids 2024, 36, 045147. [Google Scholar] [CrossRef]
  10. Zhang, Z.; Li, Y.; Gao, J.; Tang, P.; Huang, F. Structural optimization of the venturi fertilizer applicator using head loss calculation methods. Fluids 2025, 10, 87. [Google Scholar] [CrossRef]
  11. Tang, P.; Zhang, Z. Structural optimization based on response surface methodology for the venturi injector used in fertigation system. Horticulturae 2025, 11, 223. [Google Scholar] [CrossRef]
  12. Steven, R.N. Wet gas metering with a horizontally mounted venturi meter. Flow Meas. Instrum. 2002, 12, 361–372. [Google Scholar] [CrossRef]
  13. Yasuda, K.; Ako, D. Effect of venturi tube shape on reaction performance by hydrodynamic cavitation. J. Chem. Eng. Jpn. 2019, 52, 280–282. [Google Scholar] [CrossRef]
  14. Li, M.; Bussonnière, A.; Bronson, M.; Xu, Z.; Liu, Q. Study of venturi tube geometry on the hydrodynamic cavitation for the generation of microbubbles. Miner. Eng. 2019, 132, 268–274. [Google Scholar] [CrossRef]
  15. Wu, Y.; Zu, Y.; Xu, E.; Miao, Z.; Wu, D.; Hu, Y. The effect of swirling shear blade on gas-liquid flow pattern and mass transfer performance in venturi injector. Chem. Eng. Sci. 2024, 299, 120549. [Google Scholar] [CrossRef]
  16. Song, Y.; Wang, D.; Yin, J.; Li, J.; Cai, K. Experimental studies on bubble breakup mechanism in a venturi bubble generator. Ann. Nucl. Energy 2019, 130, 259–270. [Google Scholar] [CrossRef]
  17. Wang, W.; Zhang, X.; Li, C.; Zou, Y.; Li, G.; Chen, Y.; Chen, G.; Duan, J. Bubble behavior, flow characteristics, and mass transfer enhancement in self-priming Venturi tubes. Chem. Eng. Sci. 2023, 270, 118536. [Google Scholar] [CrossRef]
  18. Ozkan, F.; Ozturk, M.; Baylar, A. Experimental investigations of air and liquid injection by venturi tubes. Water Environ. J. 2006, 20, 114–122. [Google Scholar] [CrossRef]
  19. Fujiwara, A.; Okamoto, K.; Hashiguchi, K.; Peixinho, J.; Takagi, S.; Matsumoto, Y. Bubble breakup phenomena in a venturi tube. In Proceedings of the FEDSM2007, San Diego, CA, USA, 30 July–2 August 2007. [Google Scholar]
  20. Ding, G.; Li, Z.; Chen, J.; Cai, X. An investigation on the bubble transportation of a two-stage series venturi bubble generator. Chem. Eng. Res. Des. 2021, 174, 345–356. [Google Scholar] [CrossRef]
  21. Chai, B.; Yang, J.; Wang, X. Force Characteristics of centrifugal pump as turbine during start-up process under gas–liquid two-phase conditions. Actuators 2022, 11, 370. [Google Scholar] [CrossRef]
  22. Zhu, G.; Tang, Z.; Feng, J.; Yan, S.; Li, Y.; Cui, W. Effect of inlet gas volume fraction on shafting vibration of multiphase pumps under low discharge conditions. Ocean. Eng. 2024, 294, 116803. [Google Scholar] [CrossRef]
  23. Verde, W.M.; Biazussi, J.; Porcel, C.E.; Estevam, V.; Tavares, A.; Neto, S.J.A.; Rocha, P.S.D.M.V.; Bannwart, A.C. Experimental investigation of pressure drop in failed Electrical Submersible Pump (ESP) under liquid single-phase and gas-liquid two-phase flow. J. Petrol. Sci. Eng. 2021, 198, 108127. [Google Scholar] [CrossRef]
  24. He, D.; Zhao, L.; Chang, Z.; Zhang, Z.; Guo, P.; Bai, B. On the performance of a centrifugal pump under bubble inflow: Effect of gas-liquid distribution in the impeller. J. Petrol. Sci. Eng. 2021, 203, 108587. [Google Scholar] [CrossRef]
  25. Ahn, S.H.; Xiao, Y.; Wang, Z.; Zhou, X.; Luo, Y. Numerical prediction on the effect of free surface vortex on intake flow characteristics for tidal power station. Renew. Energ. 2017, 101, 617–628. [Google Scholar] [CrossRef]
  26. Huang, X.; Fang, T.; Pang, K.; Guo, Q.; Qiu, B.; Lu, J. Air-entrained vortex in open intake: Time–frequency analysis and the interaction with subsurface vortices. Phys. Fluids 2022, 34, 113313. [Google Scholar] [CrossRef]
  27. Song, Y.; Shentu, Y.; Qian, Y.; Yin, J.; Wang, D. Experiment and modeling of liquid-phase flow in a venturi tube using stereoscopic piv. Nucl. Eng. Technol. 2021, 53, 79–92. [Google Scholar] [CrossRef]
Figure 1. Physical drawing of the tested venturi tube. (a) Structural parameters of the tested venturi tube. (b) Transparent test section.
Water 17 02080 g001
Figure 2. Schematic of the experimental setup. (where the blue and yellow arrows indicates the flow direction in the test).
Water 17 02080 g002
Figure 3. Schematic of the PIV experimental layout.
Water 17 02080 g003
Figure 4. The mean velocity distribution on a vertical section in venturi tube.
Water 17 02080 g004
Figure 5. Variation in liquid flow rate with gas flow rate.
Water 17 02080 g005
Figure 6. Variation in Reynolds number at throat with inlet gas volume fraction.
Water 17 02080 g006
Figure 7. Evolution of the two-phase flow phenomena in the venturi tube. (a) t = 0 s; (b) t = 0.4 ms; (c) t = 0.8 ms; (d) t = 1.4 ms; (e) t = 2.6 ms; (f) t = 3.8 ms; (g) t = 5.0 ms; (h) t = 6.2 ms; (i) t = 7.4 ms.
Water 17 02080 g007
Figure 8. Schematic of the characteristic parameters of gas-phase region.
Water 17 02080 g008
Figure 9. Variation in characteristic length of gas-phase region over time (Qg = 2.0 L/min).
Water 17 02080 g009
Figure 10. Variation in the proportion of gas-phase region over time (Qg = 2.0 L/min).
Water 17 02080 g010
Figure 11. The experimental images under different initial Ql at t = 2 ms (Qg = 2.0 L/min).
Water 17 02080 g011
Figure 12. Variation in characteristic length of gas-phase region over time (initial Ql = 2.2 m3/h).
Water 17 02080 g012
Figure 13. Variation in the proportion of gas-phase region over time (initial Ql = 2.2 m3/h).
Water 17 02080 g013
Figure 14. The experimental images with different Qg. (a) t = 4 ms; (b) t = 7 ms.
Water 17 02080 g014
Figure 15. The time-averaged pressure with different inlet gas volume fraction.
Water 17 02080 g015
Figure 16. The time-averaged pressure in the downstream with different IGVF. (a) initial Ql = 1.8 m3/h; (b) initial Ql = 2.6 m3/h.
Water 17 02080 g016
Table 1. Measurement devices used in the experiment.
VariableDeviceMeasurement RangeUncertainty
Liquid flow rateelectromagnetic flowmeter0–10 m3/h±0.5%
Gas flow rategas flowmeter0–100 L/min±0.5%
Pressurepressure sensor−100–100 kPa±0.25%
Disclaimer/Publisher’s Note: The statements, opinions and data contained in all publications are solely those of the individual author(s) and contributor(s) and not of MDPI and/or the editor(s). MDPI and/or the editor(s) disclaim responsibility for any injury to people or property resulting from any ideas, methods, instructions or products referred to in the content.

