Next Article in Journal
Study on Solid-Liquid Two-Phase Flow and Wear Characteristics in Multistage Centrifugal Pumps Based on the Euler-Lagrange Approach
Next Article in Special Issue
Correction: Pérez Pérez et al. Transboundary Water–Energy–Food Nexus Management in Major Rivers of the Aral Sea Basin Through System Dynamics Modelling. Water 2025, 17, 2270
Previous Article in Journal
Adaptive Pluvial Flood Disaster Management in Taiwan: Infrastructure and IoT Technologies
Previous Article in Special Issue
Differentiated Optimization Policies for Water–Energy–Food Resilience Security: Empirical Evidence Based on Shanxi Province and the GWR Model
 
 
Correction published on 1 September 2025, see Water 2025, 17(17), 2578.
Article

Transboundary Water–Energy–Food Nexus Management in Major Rivers of the Aral Sea Basin Through System Dynamics Modelling

by
Sara Pérez Pérez
,
Iván Ramos-Diez
and
Raquel López Fernández
*
CARTIF Technology Centre, Energy Division, Parque Tecnológico de Boecillo, 205, 47151 Valladolid, Spain
*
Author to whom correspondence should be addressed.
Water 2025, 17(15), 2270; https://doi.org/10.3390/w17152270 (registering DOI)
Submission received: 20 June 2025 / Revised: 23 July 2025 / Accepted: 24 July 2025 / Published: 30 July 2025 / Corrected: 1 September 2025

Abstract

Central Asia (CA) faces growing Water–Energy–Food (WEF) Nexus challenges, due to its complex transboundary water management, legacy Soviet-era water infrastructure, and increasing climate and socio-economic pressures. This study presents the development of a System Dynamics Model (SDM) to evaluate WEF interdependencies across the Aral Sea Basin (ASB), including the Amu Darya and Syr Darya river basins and their sub-basins. Different downscaling strategies based on the area, population, or land use have been applied to process open-access databases at the national level in order to match the scope of the study. Climate and socio-economic assumptions were introduced through the integration of already defined Shared Socioeconomic Pathways (SSPs) and Representative Concentration Pathways (RCPs). The resulting SDM incorporates more than 500 variables interacting through mathematical relationships to generate comprehensive outputs to understand the WEF Nexus concerns. The SDM was successfully calibrated and validated across three key dimensions of the WEF Nexus: final water discharge to the Aral Sea (Mean Absolute Error, MAE, <5%), energy balance (MAE = 4.6%), and agricultural water demand (basin-wide MAE = 1.2%). The results underscore the human-driven variability of inflows to the Aral Sea and highlight the critical importance of transboundary coordination to enhance future resilience.

1. Introduction

The Aral Sea Basin (ASB) is a vast transboundary hydrological system that lies predominantly within the five Central Asian countries: Kazakhstan, Kyrgyzstan, Tajikistan, Turkmenistan, and Uzbekistan [1]. The ASB is primarily fed by the Amu Darya and Syr Darya Rivers, which originate in the Pamir and Tian Shan Mountain ranges, respectively. The Amu Darya, formed by the confluence of the Panj and Vakhsh rivers, is the longest river in the region, spanning 2540 km. In comparison, the Syr Darya, which originates from the Naryn River, takes its name after merging with the Kara Darya and flows for 3019 km [2].
Historically, these two rivers have sustained the region by supplying essential water resources for irrigation, energy production, and domestic use. However, the basin’s arid to semi-arid climate—characterized by low annual precipitation and high evaporation rates—poses significant challenges for effective water management [2]. Additionally, the rivers experience strong seasonal flow variability, depending heavily on snowmelt and glacial runoff. The ongoing retreat of glaciers due to global warming raises serious concerns about the long-term reliability of these water sources [3]. This seasonal variability, combined with increasing and often competing demands, has exacerbated tensions among the riparian states [4].
During the Soviet era, large-scale water diversion projects were launched to support intensive cotton cultivation—often referred to as the “white gold” strategy. This centralized approach prioritized economic goals over ecological sustainability, leading to the construction of extensive infrastructure, such as canals, reservoirs, and irrigation systems. Notable examples include the Karakum Canal in Turkmenistan and the expanded irrigation networks in Uzbekistan and Kazakhstan, which significantly increased water abstraction from the Amu Darya and Syr Darya rivers [5]. This overextraction had catastrophic consequences for the Aral Sea and its surrounding environment [6,7]. Since the 1960s, the sea has lost more than 90% of its original volume, leaving behind smaller saline lakes. This ecological collapse has triggered widespread desertification, as the exposed seabed has become a major source of wind-blown dust laden with pollutants, intensifying regional climate change impacts [8,9]. The socio-economic impacts have been equally devastating. The collapse of the fishing industry displaced thousands, leading to rising unemployment and food insecurity—particularly in Karakalpakstan, Uzbekistan, where soil salinization has severely reduced agricultural productivity [10,11].
In this context of persistent transboundary water management tensions and mounting environmental degradation, the Water–Energy–Food (WEF) Nexus approach offers a particularly relevant framework for defining integrated management strategies [12,13]. Yet despite external support—such as donor-led programmes by the World Bank, UNDP, and CAWEP—political friction and policy fragmentation continue to hinder meaningful cooperation [14]. Existing WEF Nexus studies in the ASB have revealed the profound upstream–downstream interdependencies and environmental stress, shaped by the post-Soviet fragmentation of resource management. Agriculture remains the dominant water consumer in the region, accounting for over 80% of total withdrawals [15], with key crops such as cotton and wheat depending on an extensive but inefficient irrigation system that loses up to 60% of water through evaporation and seepage [16]. Hydropower (HP) is another critical water use, especially in upstream countries like Tajikistan and Kyrgyzstan, where major hydroelectric plants release water in winter to meet energy demands—often at odds with the peak irrigation needs of downstream states in summer [17,18]. These seasonal mismatches underscore the need for coordinated transboundary governance, but national self-interest and diverging priorities have frequently obstructed joint action [19]. Moreover, the collapse of Soviet-era coordination mechanisms—which once linked upstream water releases with downstream energy supplies—has also facilitated the emergence of unilateral strategies. Climate change further complicates this landscape, with projections of reduced and more erratic water flows threatening both HP reliability and agricultural productivity [17,18]. In addition, although the WEF Nexus is conceptually holistic, empirical studies in the ASB have historically lacked comprehensive environmental integration—tending to emphasize social or economic outcomes while omitting basin-wide ecological considerations. Recent reviews call for broader adoption of systems-based models that incorporate environmental flows, land degradation, and ecosystem thresholds [13]. Ultimately, while regional scholars emphasize that sustainability in the ASB will depend on re-establishing trust and collaborative institutions, they also stress that even the most advanced Nexus modelling will remain ineffective unless embedded in cross-border governance frameworks and supported by shared investments and policy alignment [12,20,21].
System Dynamics (SD) offers a robust modelling approach to capture the complexity of such WEF interlinked systems. It represents systems through feedback loops, stock-and-flow structures, and time delays, allowing for simulations that reveal long-term effects of various interventions. Various System Dynamics Models (SDMs) have been applied to the WEF Nexus across diverse regions, integrating different sectoral scopes, climate assumptions, and participatory approaches. For example, in Andalusia (Spain) a participatory SDM was co-developed with stakeholders to capture WEF–land–climate interlinkages and evaluate coherent policies (e.g., irrigation water pricing) under IPCC-aligned climate projections [22]. In contrast, expert-driven SDM in China’s Hunan Province [23], Iran’s Khuzestan Province [24] or Urmia Lake basin in Iran [25], incorporated broader socio-economic and environmental subsystems to test government policy targets and resource management strategies, revealing that single-sector interventions can induce cross-sector trade-offs and identifying combined water-demand and food-management measures as the most sustainable policies, a conclusion reinforced by recent Monte Carlo-based SD analysis [26]. Similarly, a Nexus SDM in the water-scarce Ain Temouchent region of Algeria examined the implications of expanding irrigated agriculture and desalination. It found that further agricultural intensification would critically overdraw groundwater reserves and that while a new desalination plant significantly alleviates water shortages, its high energy consumption introduces major trade-offs—underscoring the need for integrated cross-sector management [27]. Several studies explicitly include climate change scenarios: Javan et al. [28] modelled Iran’s Ardabil Plain under RCP 2.6–8.5 to rank climate-resilient crops (using a hybrid SD and multi-criteria method) and found that shifting to barley cultivation best balances future water and energy constraints, while Bakhshianlamouki et al. [25] showed how more aggressive climate scenarios exacerbate trade-offs in Iran’s Urmia Lake basin, where an SDM tested lake restoration measures (enhanced irrigation efficiency, inter-basin transfers, crop land retirement, etc.) and uncovered unintended feedbacks (e.g., pumping energy spikes as water withdrawals are curtailed). Other Nexus SD modelling applications focus on sustainability indicator outcomes: Francisco et al. [29] examined peri-urban São Paulo’s WEF system using a multi-criteria indicator framework (water/carbon footprints, trophic state, social development indices) to compare conventional vs. agroecological farming, finding that innovative governance interventions—such as community-supported agriculture and payments for ecosystem services—can markedly improve integrated resource sustainability. Similarly, in Iran’s Gavkhuni wetland basin, an SDM assessed 10-year municipal, industrial, agricultural, and environmental policy scenarios, showing that only a coordinated policy mix (changing crop patterns and curbing groundwater use) significantly improves water supply security and wetland health, whereas isolated energy-sector measures had little effect [30]. Likewise, China’s Henan Province, a comprehensive WEF-Ecology SDM, simulated resource supply and demand trajectories under alternative development pathways. The model indicated that business-as-usual trends would intensify water and energy shortages (with supply-demand ratios remaining below 1.0) and nearly double CO2 emissions by 2035. In contrast, a coordinated “Green Development” scenario could improve the overall resource balance by over 38% and cut emissions by about 26% [31]. A more conceptual SD approach by Feng et al. [32] modelled the water–power–environment Nexus in China’s Hehuang region via coupled differential equations, illustrating long-term coevolutionary cycles (exploitation, deterioration, recovery) of resource use and environmental change—underscoring the value of dynamic feedback analysis even without an explicit food sector. Across all these studies, the SD modelling frameworks (implemented in tools like Vensim or Stella) facilitated scenario-based analysis of policy and management options against diverse sustainability metrics—from resource security indices [23,30] to ecosystem services and footprints [29]—thereby highlighting critical Nexus trade-offs and synergies. Overall, the literature demonstrates that Nexus-SDM (whether participatory or expert-built) serve as an effective decision-support tool for integrated WEF governance, helping policymakers anticipate how interventions in one domain (water, energy or food) propagate through coupled systems under socio-economic development and climate change conditions [25,28].
This manuscript presents the first SDM focus on the WEF Nexus specifically developed for the ASB. Unlike previous System Dynamics modelling applications that often operate at national or basin-wide scales, this model introduces a novel sub-basin (SB) spatial resolution—comprising 19 SBs for the Amu Darya and nine for the Syr Darya. This granularity enables disaggregated assessments across the entire ASB, individual river systems, and specific sub-catchments, thus significantly enhancing its capacity for transboundary analysis. Given that most available data were originally reported at the national level, transitioning to a river basin scale required extensive data harmonization and spatial downscaling efforts. Furthermore, the model incorporates climate change explicitly through hybrid scenario design, integrating both Representative Concentration Pathways (RCPs) and Shared Socioeconomic Pathways (SSPs), allowing dynamic simulation of Aral Sea inflows and WEF security trajectories through to 2050. In addition to the three core WEF components, the model also considers ecological aspects such as environmental flow requirements and land degradation. Although these are not treated as an additional subsystem, they are implicitly captured within certain equations through the interrelationships established among variables and subsystems. By enabling the exploration of trade-offs among HP production, irrigation demand, and downstream ecological flows, the model provides robust support for adaptive and evidence-based decision-making under uncertainty.

2. Materials and Methods

2.1. Study Area: Aral Sea Basin

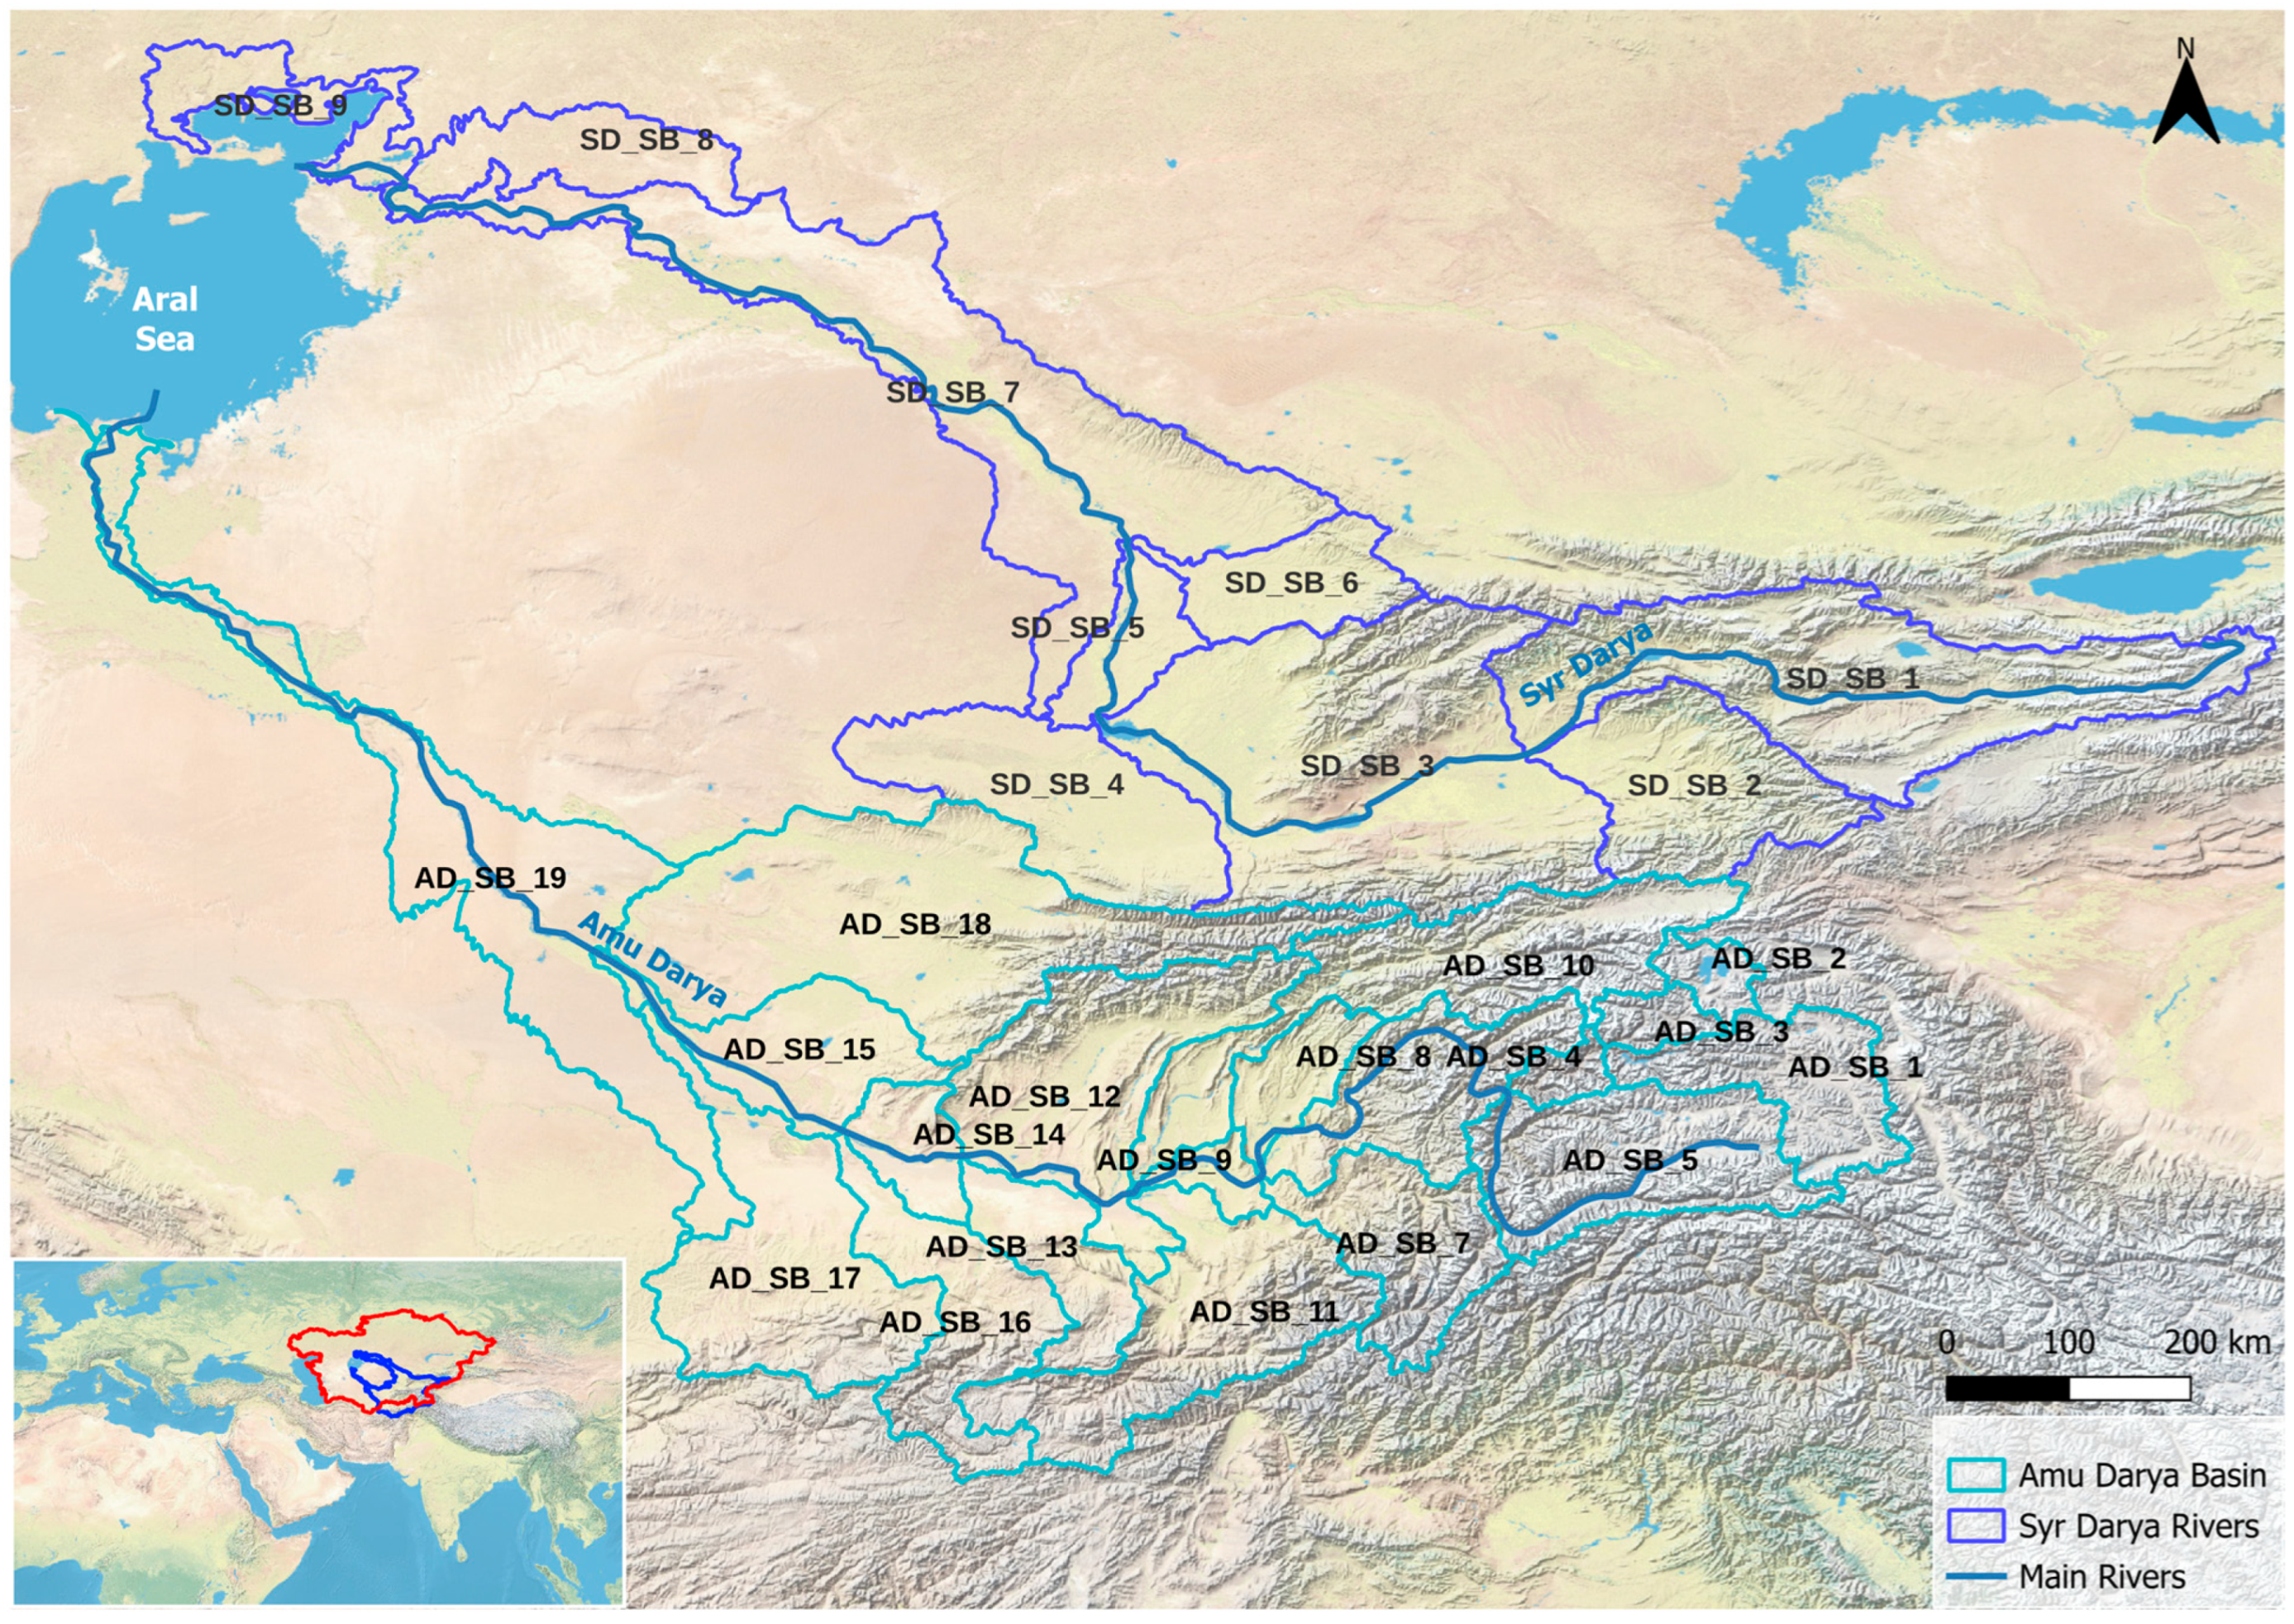
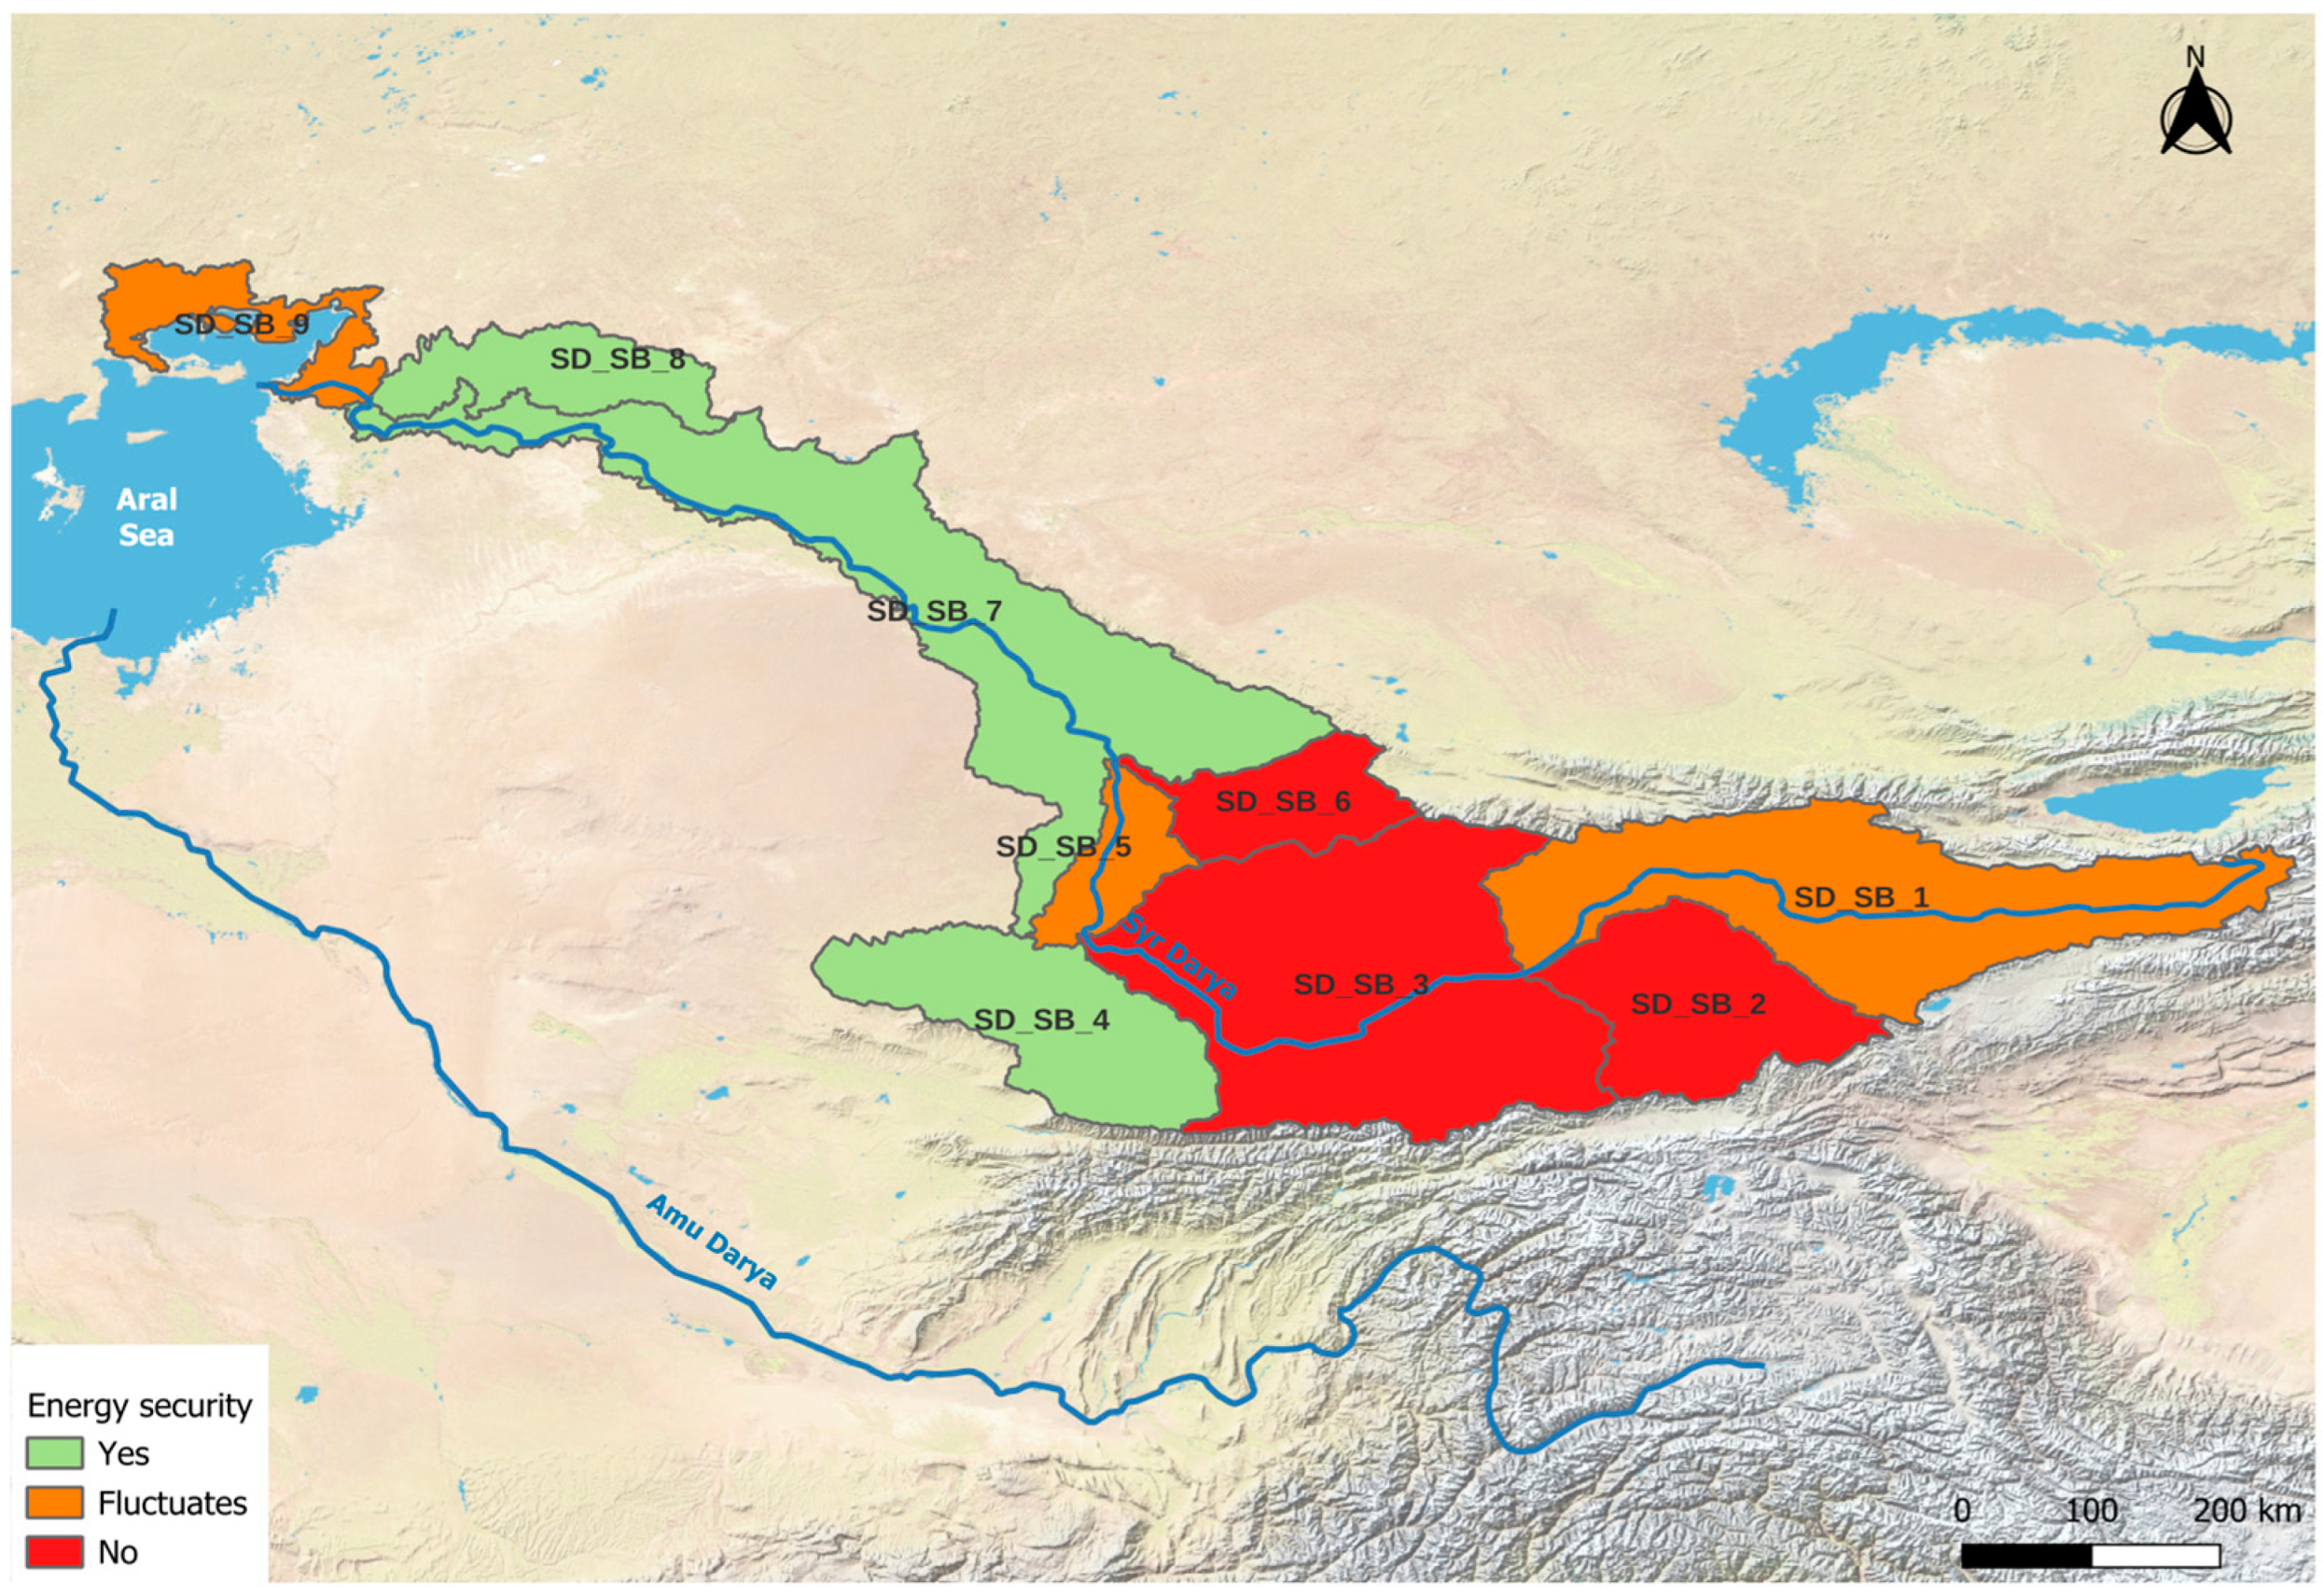
The WEF Nexus SDM has been developed for the ASB, a key hydrological unit across five countries in Central Asia region (Figure 1): Tajikistan (99% of territory within the basin), Turkmenistan (95%), Uzbekistan (95%), Kyrgyzstan (59%), and Kazakhstan (13%) [13,33].
Several key parameters related to the WEF Nexus have been computed using open-source GIS databases and reported in 2022 for the two principal transboundary river basins in the region: the Amu Darya and Syr Darya (Table 1). The ASB extends over approximately 786,528 km2 (based on HydroSHEDS) [34] and is home to an estimated 57.37 million people (based on the WorldPop database) [35]. According to the Copernicus Climate Change Service [36], the basin receives an average annual precipitation volume of 486,591 hm3, which constitutes a key input to its hydrological balance and underpins the availability of water resources for agricultural, energy, and domestic uses across the region. The Amu Darya River is larger, more densely populated, and receives higher levels of rainfall compared to the Syr Darya. Per capita water consumption is similar across the two basins (~1.3 × 10⁻³ hm3/inhab.) [37]. Notably, Syr Darya exhibits higher per capita energy consumption (4.0 vs. 1.8 GWh/inhab.) [38].
With respect to HP infrastructure, the ASB hosts a total capacity of 10,576 MW (based on the data from the Global Energy Observatory) [39]. According to the commonly used threshold of 10 MW for Small Hydropower (SHP), the basin has approximately 168 MW of installed SHP capacity. SHP plays an important role in supporting decentralized energy access, particularly in mountainous areas such as Tajikistan and Kyrgyzstan, where the topography is well-suited for small-scale hydro development. On the other hand, the ASB retains the majority of the untapped HP potential of the CA region. Recent studies have incorporated sustainability criteria into the geo-localized estimation of this potential—referred to as the “sustainable and remaining potential”—reporting aggregate values for the ASB of 28,130 MW for HP and 2428 MW for SHP, respectively [40]. Developing the SDM in this context offers the opportunity to evaluate infrastructure trade-offs and optimize existing resource use across the WEF Nexus, thereby supporting integrated and sustainable basin-level planning [33].
Agricultural activity can be assessed using the MapSPAM model [41], an open-access and geo-referenced dataset. Based on this information, the rainfed agricultural area in the ASB amounts to 56,115 km2, while the irrigated area covers 73,760 km2. The Amu Darya basin dominates both rainfed and irrigated agriculture, highlighting its crucial role in ensuring regional food security. The spatial distribution of agricultural water consumption is presented in Figure 1 and has been calculated following a previously published methodology [42], in which each pixel in the region is associated with a harvested irrigated area, a specific crop yield, and the corresponding water requirements for each crop type. In Figure 1, final annual water consumption has been categorized into five classes, indicating high-intensity consumption concentrated along the main river courses, particularly in the downstream sections of both basins. This spatial information provides essential context regarding hydrological boundaries and localized pressures on water resources.
This baseline characterization underscores both the asymmetries and complementarities within the ASB, providing a robust foundation for system-level modelling of water, energy, and food dynamics across the ASB.

2.2. SD Modelling

SD Modelling is a powerful approach used for analyzing and simulating complex systems characterized by feedback loops, delays, and nonlinear interactions. It is particularly effective for studying the WEF Nexus due to its capacity to integrate diverse factors affecting water, energy, and food security into a cohesive framework. The key elements of the SD approach used in this study include:
  • Feedback mechanisms: Identification of reinforcing and balancing loops that drive system behaviour.
  • Stock-and-flow representation: Visualization of water reservoirs, energy outputs, and agricultural production.
  • Time delays: Consideration of lag effects in policy implementation and resource availability.
  • Integrated scenario analysis: Simulation of different SSPs combined with RCPs interventions to evaluate their long-term impacts on resource sustainability [43].
By structuring the WEF Nexus as SDM, we can assess co-benefits, synergies, and trade-offs, not only among water allocation for agriculture, HP generation, and ecosystem conservation, but also in terms of their interactions across transboundary basins or subsystems. These include the balance between upstream HP production and downstream irrigation demands, the ecological implications of altered flow regimes on shared aquatic ecosystems, and the socio-economic consequences of shifting water priorities across national boundaries. It is, therefore, necessary to justify the focus on these three domains by demonstrating their representatives’ broader WEF Nexus and their centrality in shaping cross-border resource governance and system-wide feedbacks.

2.3. Software for SD Modelling

Vensim® DSS 9.4.2 (Decision Support System) software was selected for this study due to its advanced modelling capabilities tailored for complex systems [44]. It provides a user-friendly interface that facilitates the construction of causal loop diagrams and stock-and-flow models, allowing users to visualize dynamic system behaviour over time. The software includes powerful simulation tools that enable users to analyze different policy-action scenarios, assess long-term impacts and optimize resource allocation strategies. Additionally, Vensim DSS supports sensitivity analysis, which helps identify critical variables that influence system performance. Furthermore, the optimization and calibration tools within Vensim allow for parameter estimation and model validation using historical data, ensuring the reliability of the SDM [45,46,47]. The ability to test different policy interventions before implementation makes this software an essential tool for decision-makers aiming to develop sustainable management strategies in the WEF Nexus.

2.4. Design of the WEF Nexus SDM

The SDM is structured around three interconnected subsystems –water, energy, and food, which are described below [48,49]:
  • Water: Assesses the availability and consumption of water, considering its distribution for HP generation. It also accounts for other competing demands, including urban, industrial, and agricultural needs.
  • Energy: Concentrates on renewable energy development. The model analyses the transition from fossil fuels to RES, ensuring that energy requirements are met while maintaining environmental sustainability.
  • Food: Analyzes water usage in food production and incorporates it into the overall water management framework. It also evaluates irrigation techniques, agricultural policies, and compromises required to balance water demands.
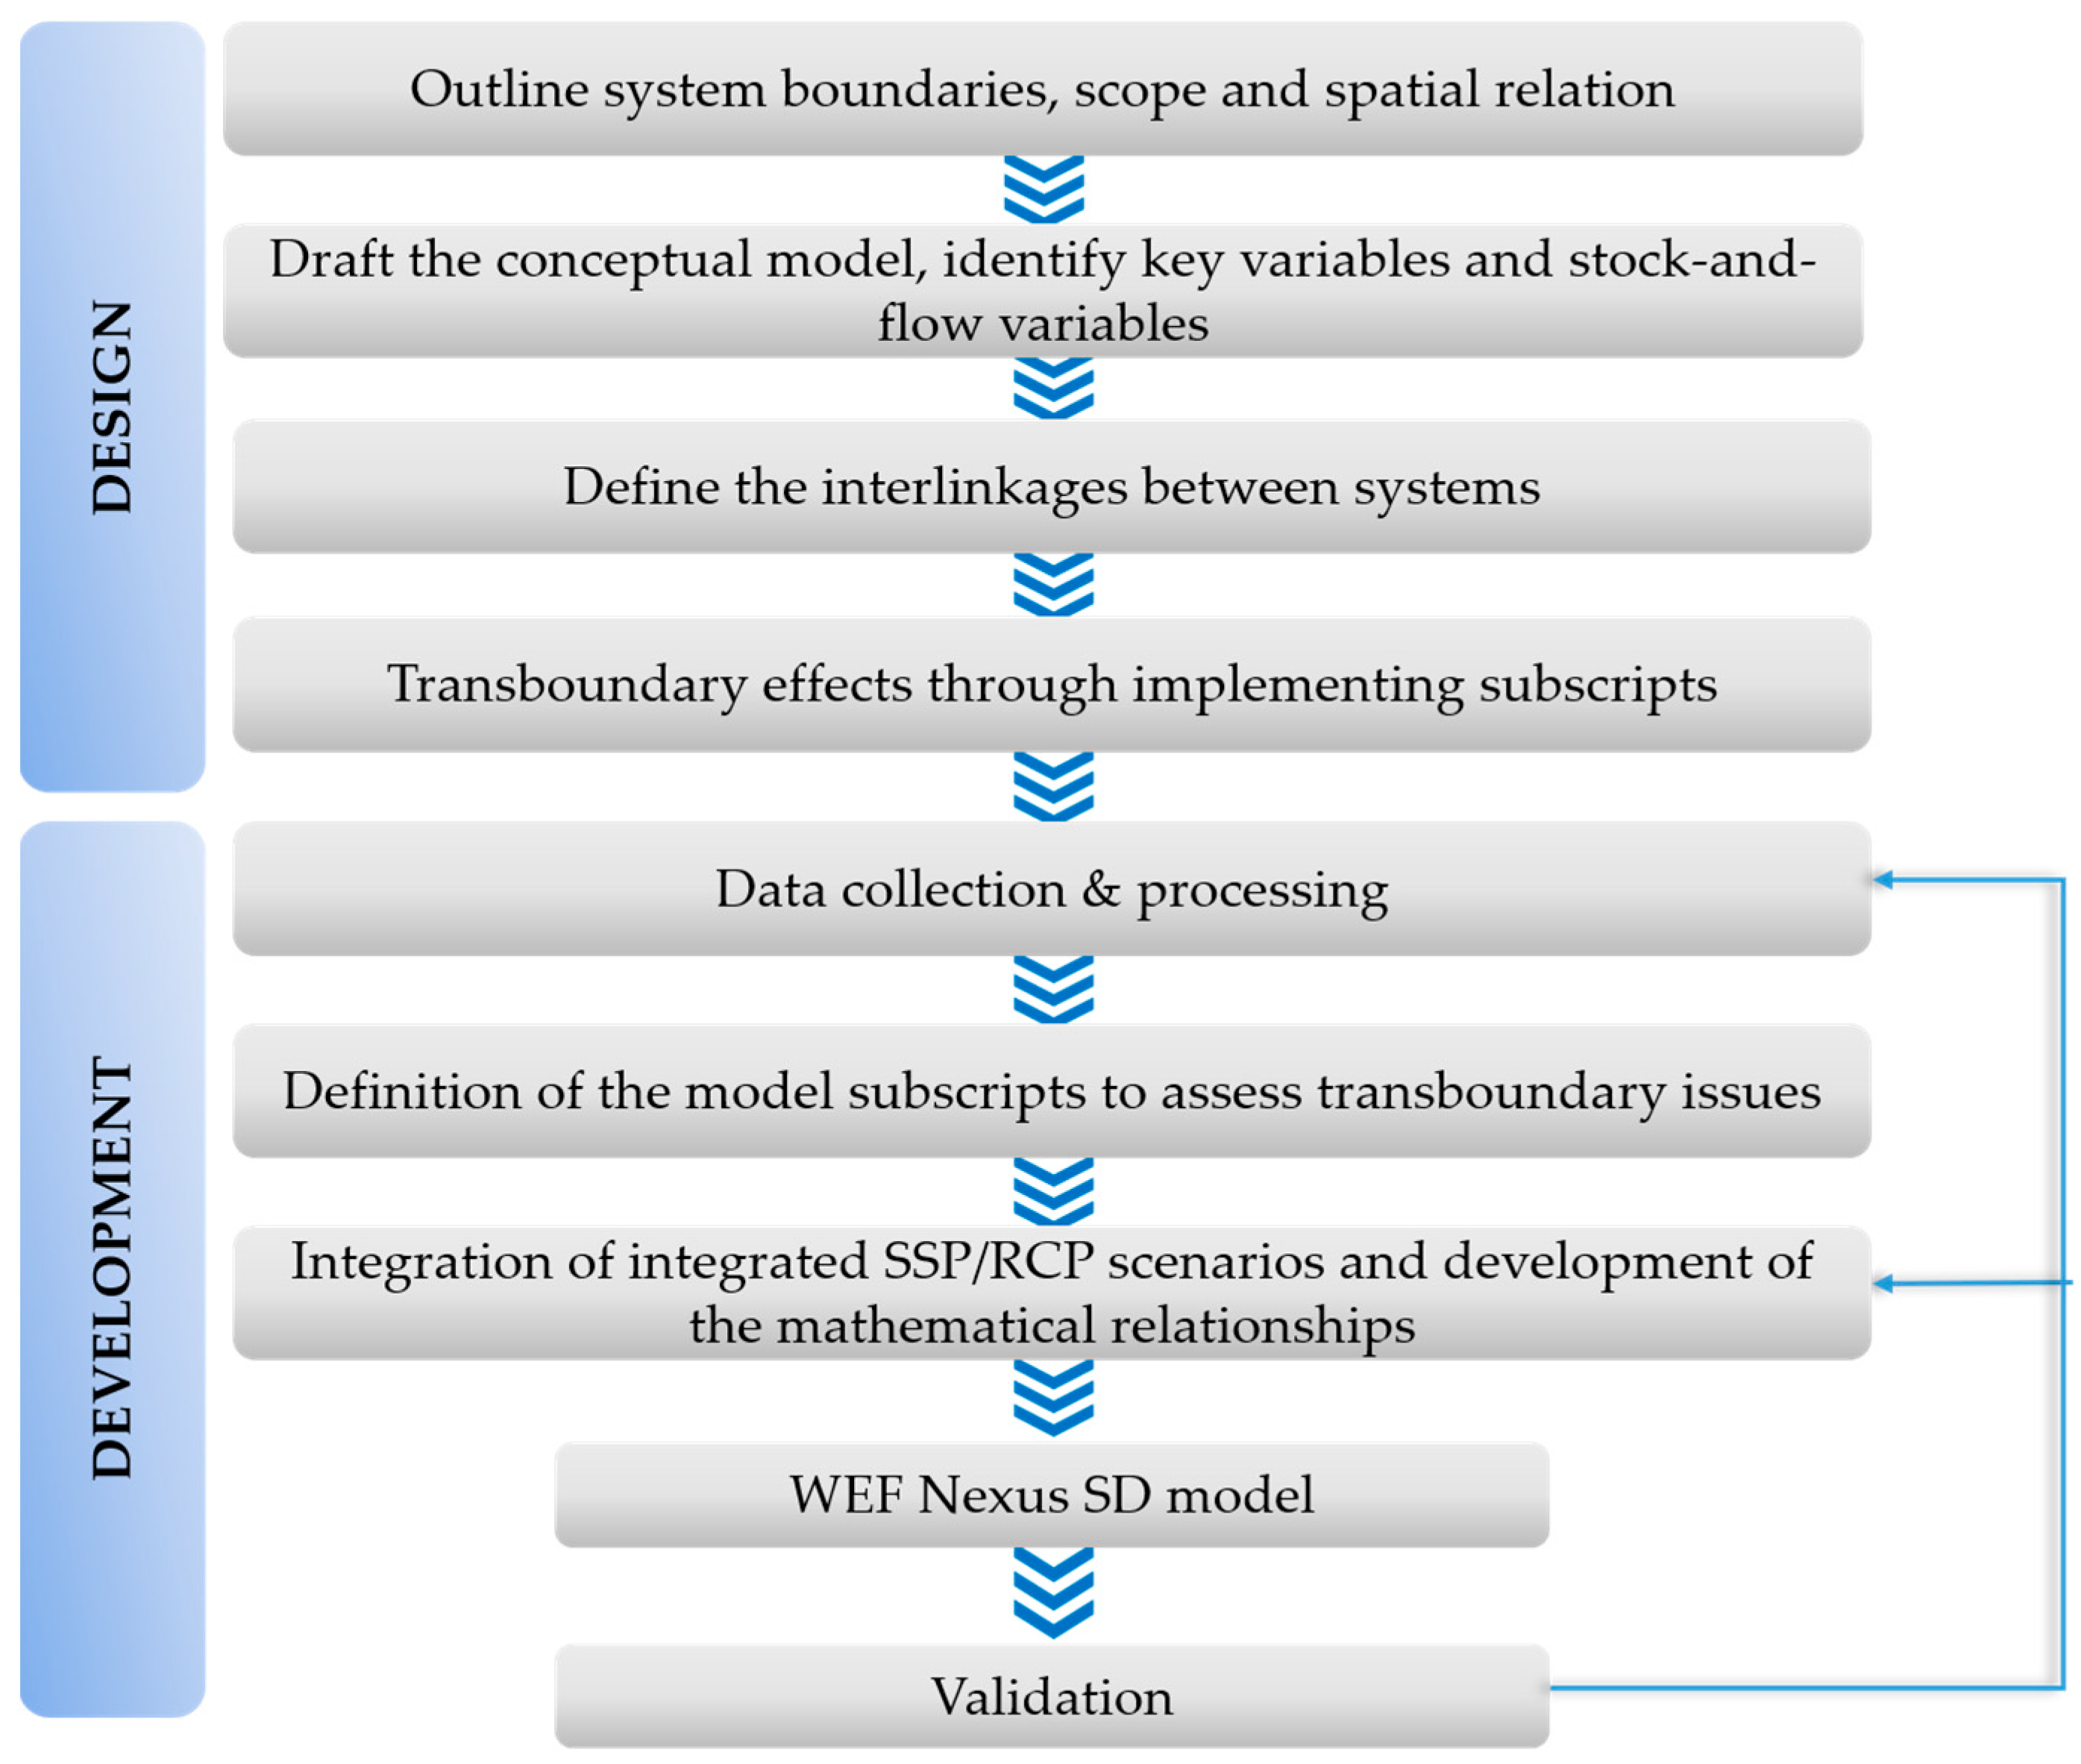
The WEF Nexus SDM covers the simulation period 2015 to 2050, using historical data from 2015 to 2023 for calibration. It operates on an annual time step, with calculations starting in 2015. The design and development of the SDM have followed different steps, as it is shown in Figure 2.

2.4.1. System Boundaries, Scope, and Spatial Relation

The system boundaries delineated in the SDM allow for an accurate assessment of water availability, which is essential for assessing the impacts. The transboundary nature of the basin complicates water management, requiring cooperation between upstream and downstream countries [50,51]. For detailed impact analysis, the SDM has been disaggregated at the SB level, using HydroSHEDS basins and SBs [34], so the Amu Darya has been disaggregated into 19 SBs and the Syr Darya nine SBs (Figure 3). These SBs enhance the SDM’s ability to analyze water flow, drainage networks, and regional hydropower potential, ensuring a comprehensive approach to sustainable resource management.

2.4.2. Conceptual Model, Key Variables, and Stock-and-Flow Variables

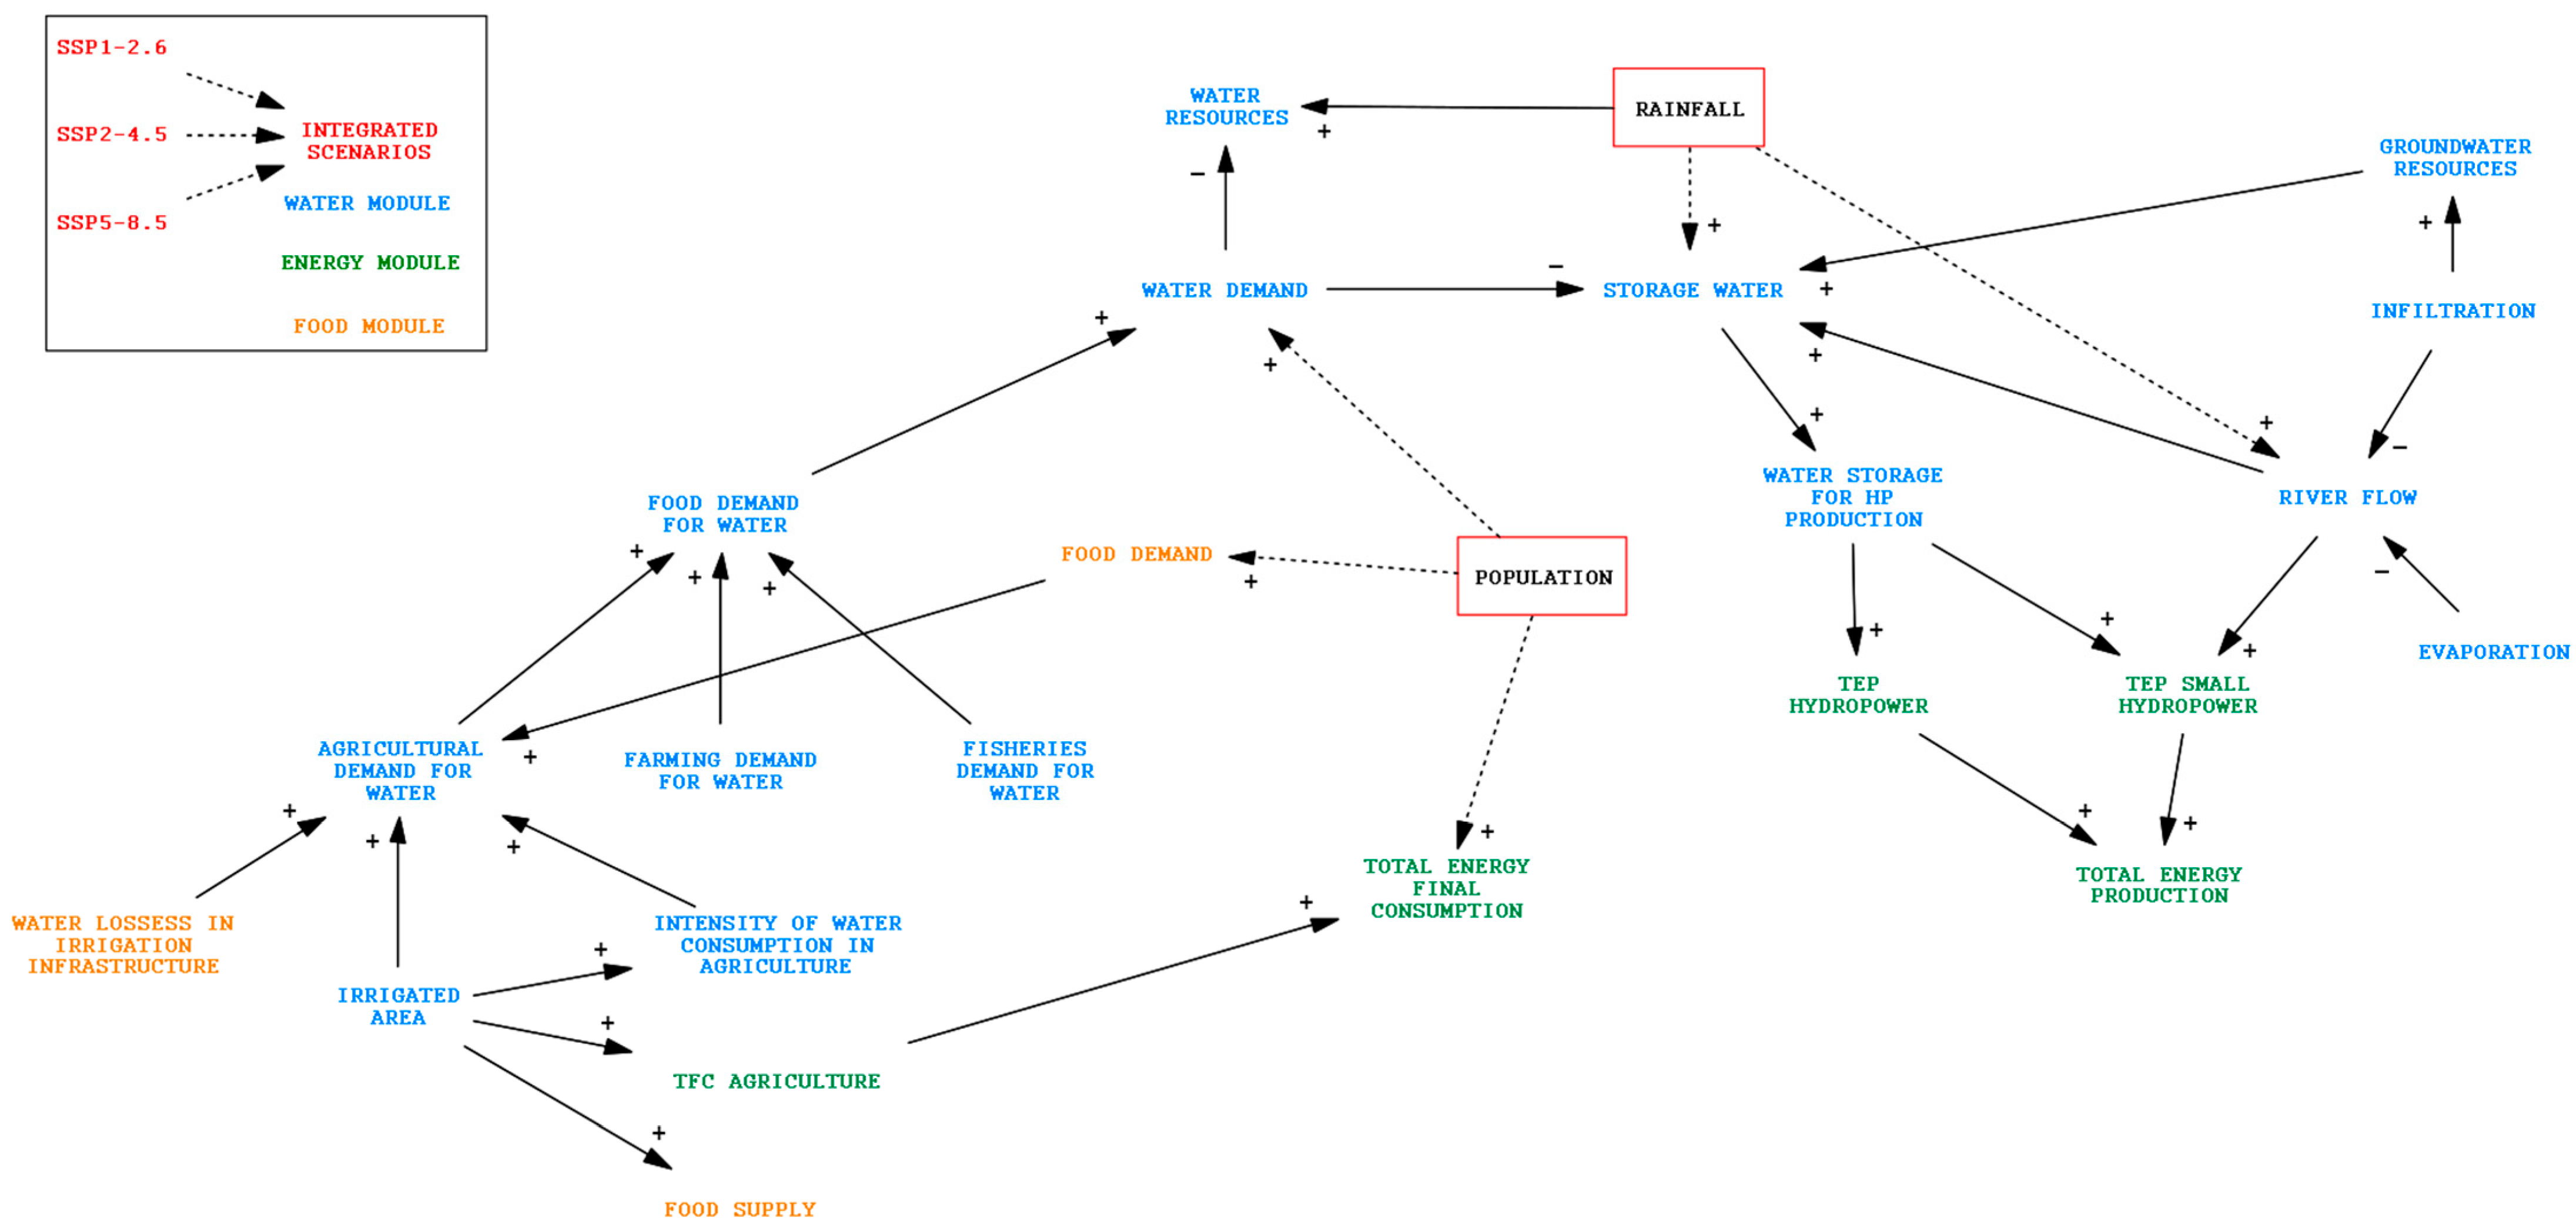
The WEF Nexus conceptual model (Figure 4) outlines the interlinkages between the water, energy, and food subsystems. Climate change is integrated as an exogenous factor through the use of three CMIP6 scenarios [36,52] (SSP126, SSP245 considered the Business as Usual in this study, and the SSP585), which influence precipitation, water availability, HP generation, and agricultural production. However, the model treats climate as an exogenous factor, meaning it is not influenced by the internal dynamics of the system [53]. This approach enables the assessment of external climate impacts without directly modelling climate processes and allows for the simulation of various futures based on these scenarios [54,55].
In the water subsystem, key variables include water resources, surface water, water storage, groundwater resources, water demand, and supply. Water resources are influenced by evaporation, runoff, and infiltration, while water storage depends on evaporation and reservoir capacity. Water demand is driven by industrial, urban, and agricultural needs, and transboundary water represents the flow of water between SBs in the system [37,56].
For the energy subsystem, variables include total energy production (TEP), total energy supply (TES), energy consumption, energy balance, energy losses, and the installed capacity of hydropower (HP) plants. TEP is affected by fossil, renewable, and hydropower sources, while energy consumption varies by sector. Energy balance accounts for the difference between imports and exports, while losses are the energy that does not reach final consumption. The HP capacity is determined by factors like flow and plant efficiency [38].
In the food subsystem, key variables include food resources, supply, demand, agricultural water demand, and food surplus. Food resources depend on food supply and demand, which, in turn, are influenced by agricultural production, livestock, and food imports. Agricultural water demand is related to irrigation needs and losses, while food surplus represents the excess available for export or other uses beyond local consumption [57,58].

2.4.3. Interlinkages Between Subsystems

The interlinkages between the subsystems in the WEF model are crucial for understanding how changes in one subsystem can impact the others [59]. The interlinkages defined in the WEF Nexus SDM can be found in Figure 5 and are highlighted in the final Water, Energy, and Food modules described in Figures 8, 11, and 12, presented in Section 3.
In the water–food interlinkages, agricultural and food water demand influence the total water demand. In the water–energy interlinkages, the amount of stored water impacts hydropower production [60,61]. These interconnections are essential for analyzing the direct and indirect effects of changes across the subsystems.

2.4.4. Transboundary Effects

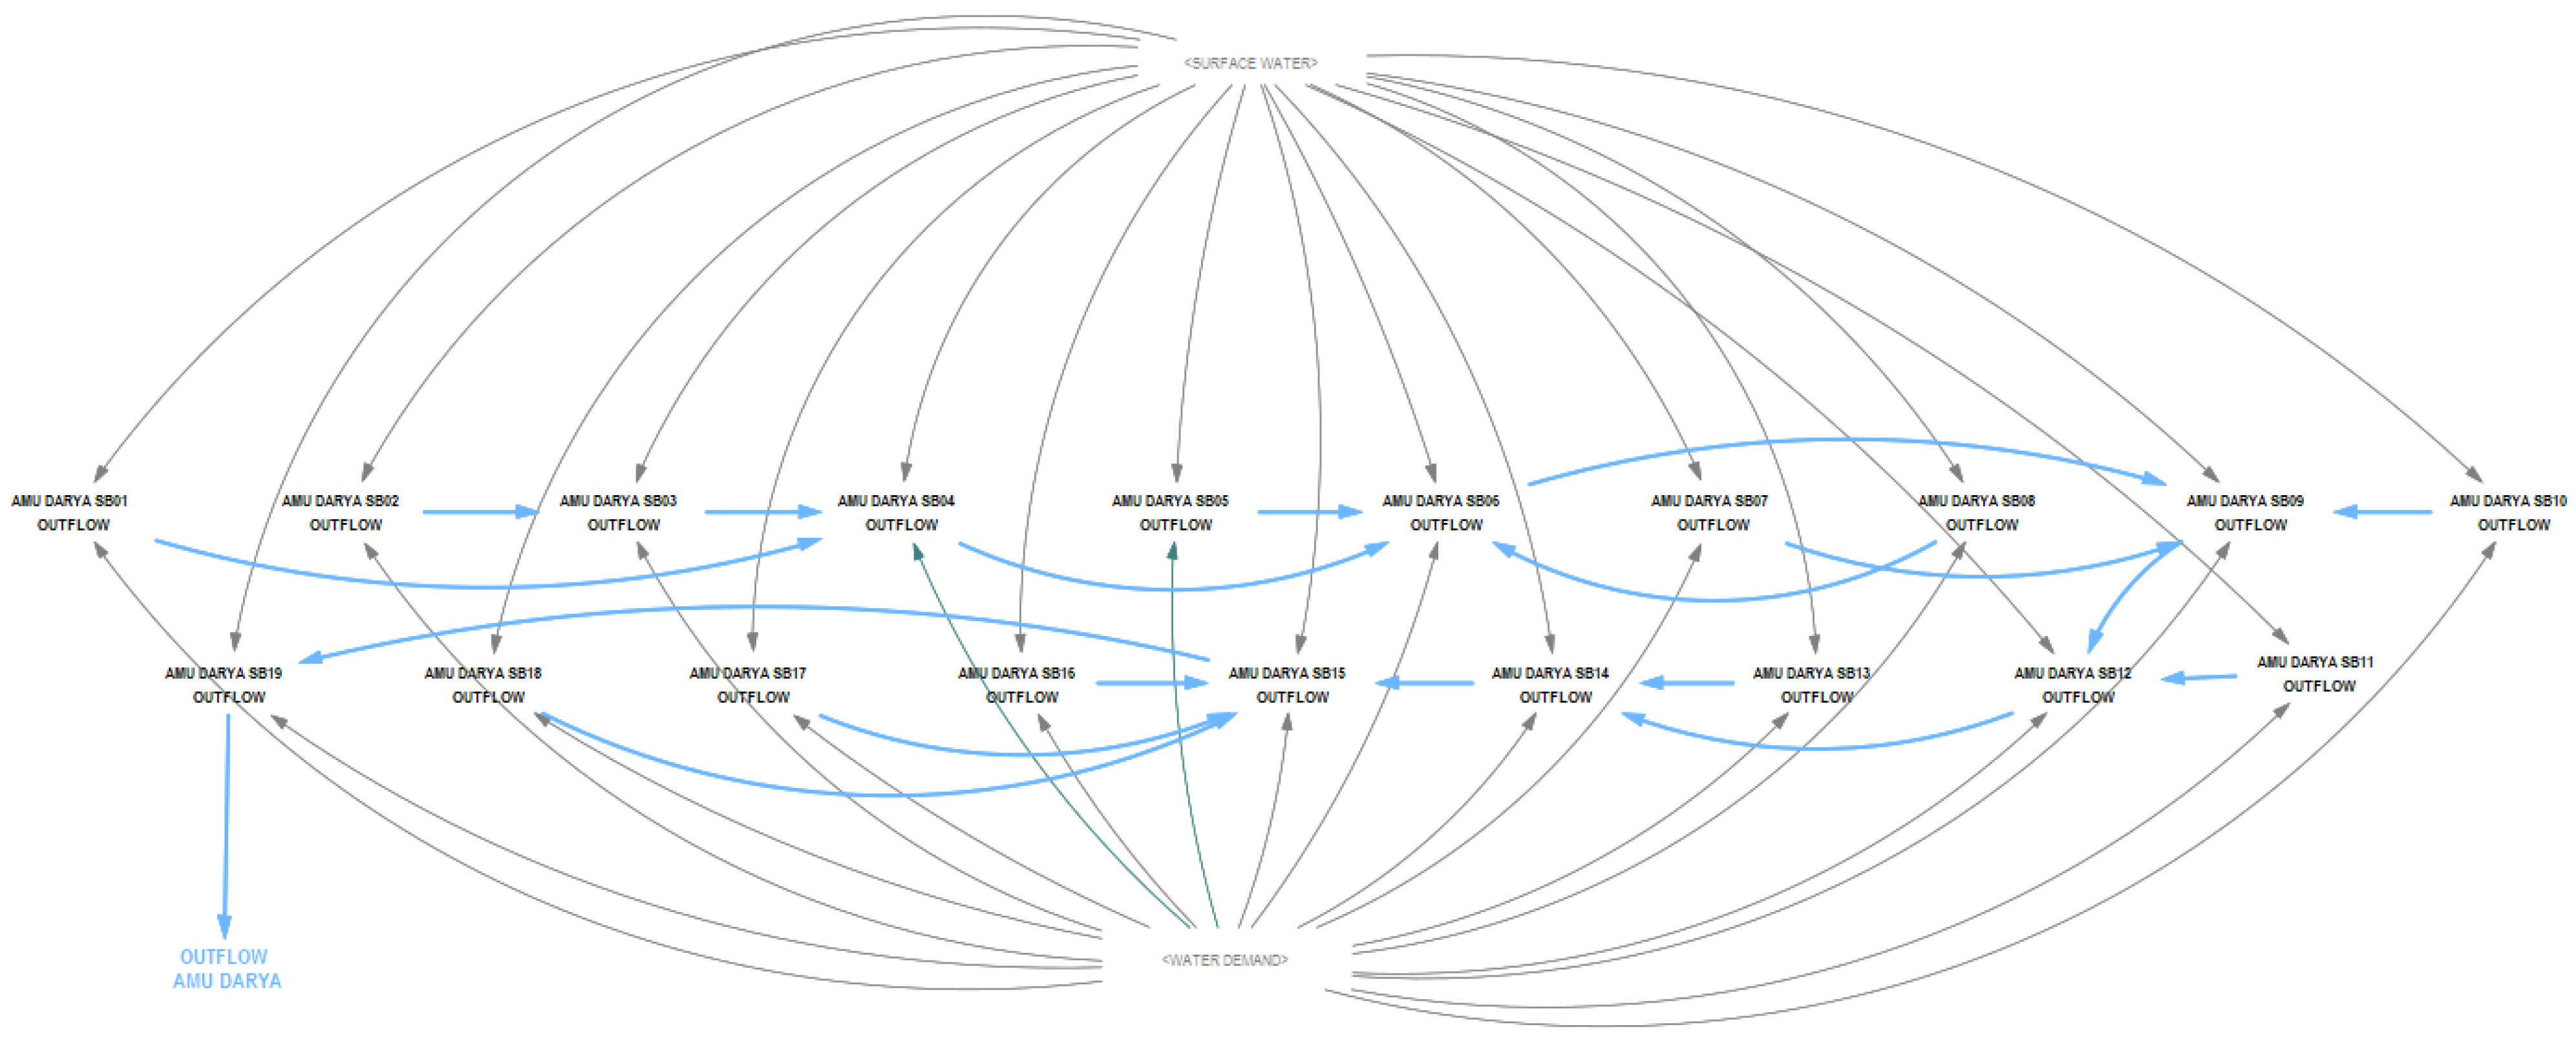
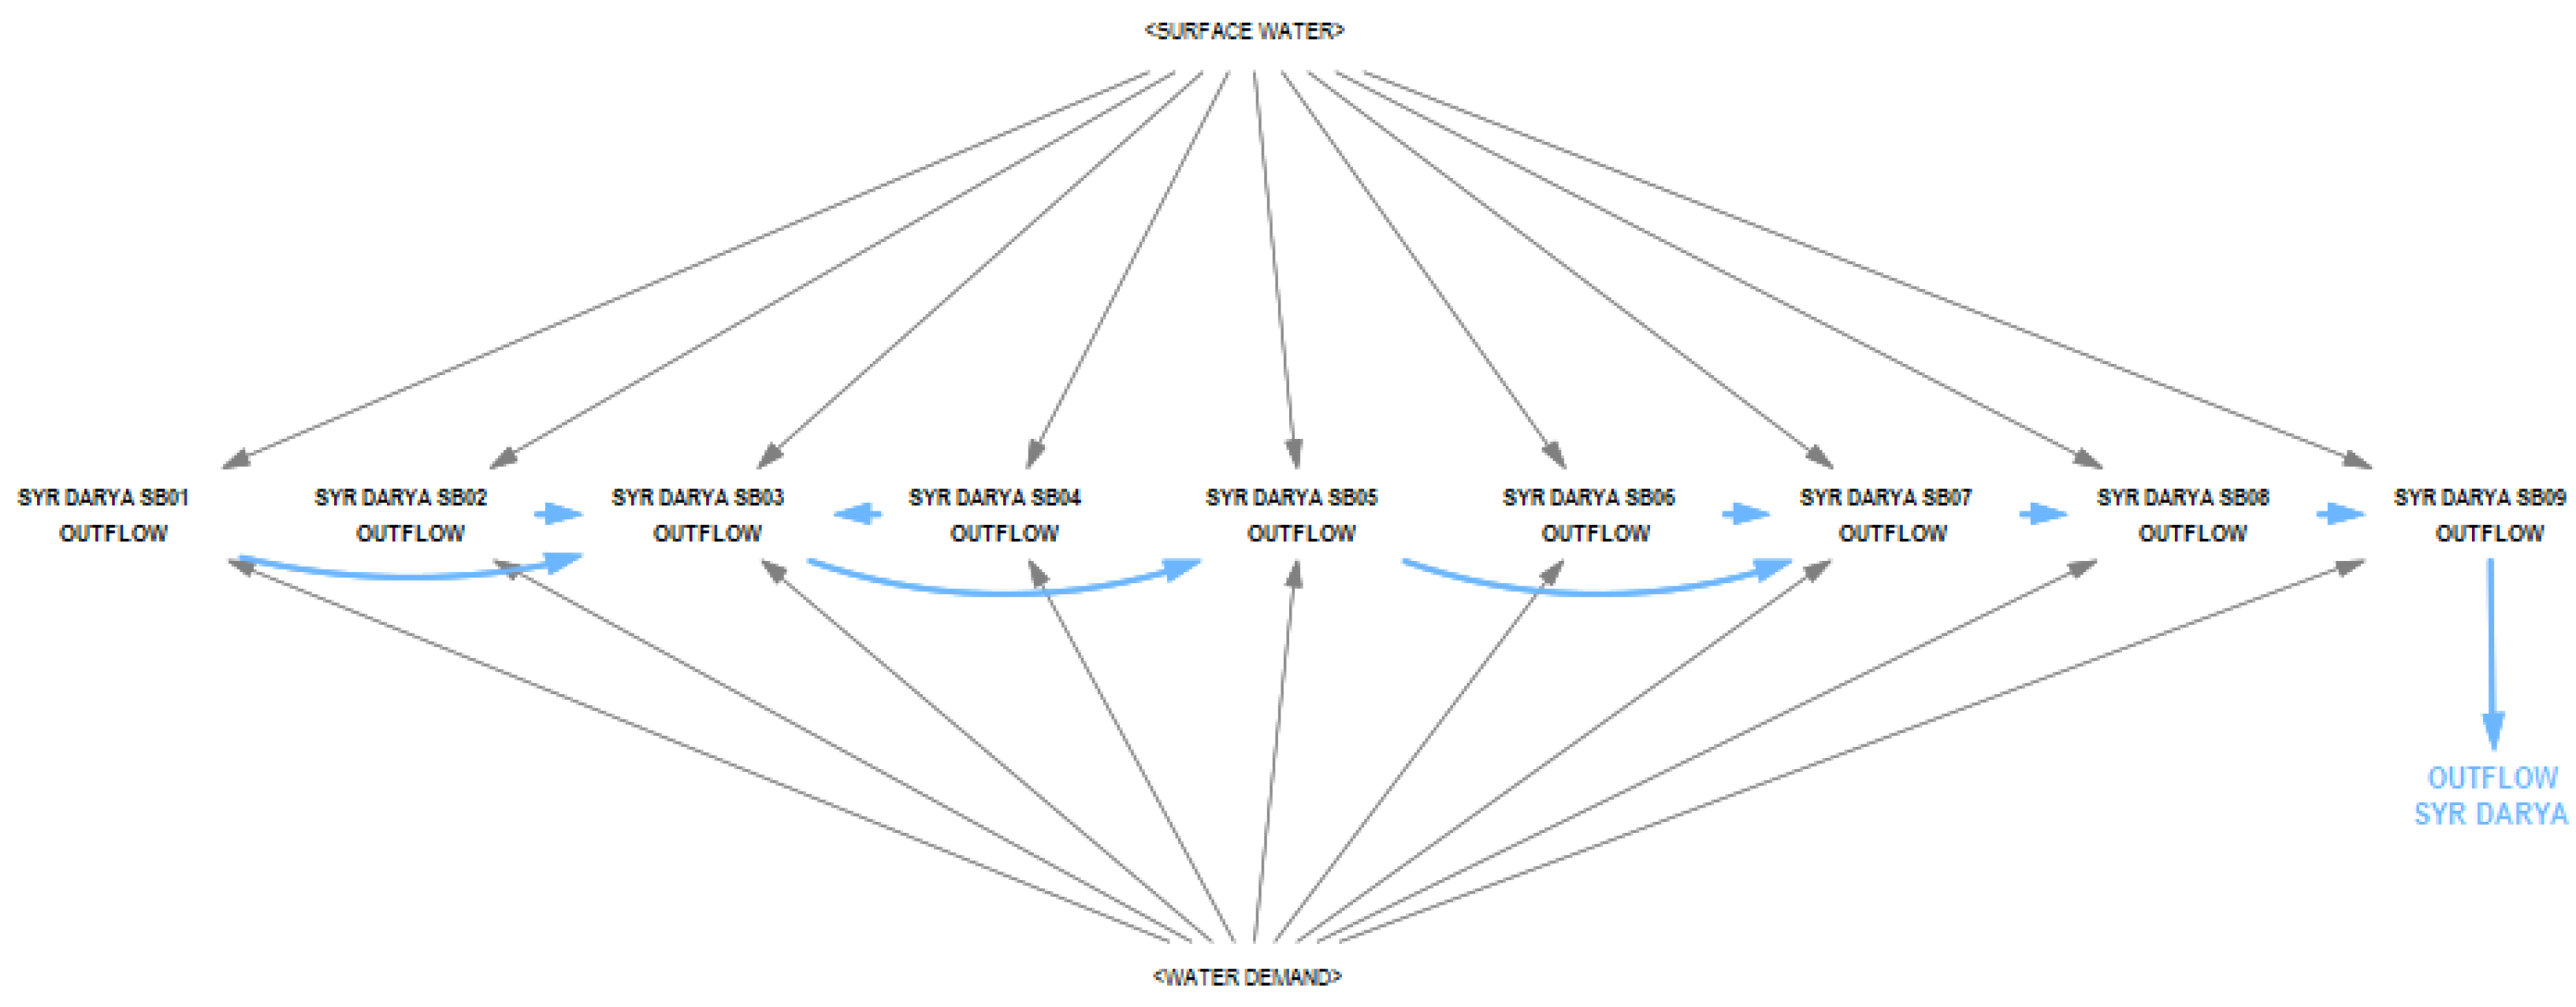
The spatial relations in the SDM define how the three subsystems interact across different geographical areas, ensuring spatial variability in resource availability, demand, and impacts is accurately represented. Both Figure 6 and Figure 7 illustrate the flow direction within the Amy Darya and Syr Darya, respectively, as well as the iterations between SBs.
To efficiently incorporate these transboundary complexities, the model uses subscripts in Vensim, which allow multiple spatial units to be represented without duplicating equations or variables [62,63]. Each SB has a dedicated subscript, enabling the system to differentiate and organize spatial data efficiently.

2.5. Development of the WEF Nexus SDM

2.5.1. Data Collection and Processing

One of the primary challenges in SDM is the construction of a structured and comprehensive database that integrates water, energy, food, and climate data at a consistent spatial resolution. In CA, data availability is limited and becomes even scarcer when disaggregated to the SB level, where information is virtually non-existent. To obtain data at the appropriate geographical resolution, various pre-processing steps were undertaken.
National-level data are primarily derived from open-access databases such as AQUASTAT [37], International Energy Agency (IEA) [38], Food and Agriculture Organization (FAO) [58], or the World Bank Data [64]. Where only country-level data are available, downscaling methods are applied to estimate values at the SB level [65]. The specific downscaling approach depends on the nature of the variable and the type of information it contains [66,67].
GIS-based data, by contrast, inherently includes spatial components and therefore does not require downscaling. Instead, spatial statistics techniques within QGIS 3.34 software [68] are used to extract SB-level data directly from these datasets [61]. Key geospatial data sources used in the model include WorldPop database [35], HydroSHEDS [34], HydroBASINS [69], Copernicus [36], MapSPAM [38], and FLO1K [70].
Some of the previously geolocated data have been used as drivers for downscaling national-level information through spatial aggregation techniques (e.g., mean, count, maximum) [71]:
  • Area-based downscaling: National-level data are proportionally distributed according to the relative area of each sub-basin (SB). This approach is applied to downscale total final consumption (TFC) for non-specified uses, thermal energy production (TEP) from renewable energy sources not included in GIS databases, and fossil energy sources, among others.
  • Population-based downscaling: Resources are allocated in proportion to the population density within each SB. This method is used, for example, to downscale TFC for the commercial and public services sectors, industrial energy use, urban water demand, and industrial water consumption.
  • Land use-based downscaling: Allocation is based on the extent of cropland, irrigated areas, or flood-prone regions within each SB. This method is applied to estimate the energy consumption of agricultural activities, particularly for irrigation systems powered by pumping.
  • HP capacity-based downscaling: Distribution considers the available and remaining hydropower capacity at the SB level. For instance, GIS data are used to disaggregate IEA hydropower figures and validate them against values derived through geospatial analysis.
This methodology undergoes a validation process to assess the accuracy of the downscaling [72]. Two validation methods have been employed.
  • Method 1: Forward Validation. Starting from national-level data, a proportional value is calculated for each sub-basin (SB). These values are then compared with those generated by the downscaling algorithms. If the results are consistent or the deviations are minimal, the data are considered valid. Otherwise, the downscaling procedure is repeated using an alternative method. This forward validation approach has been applied to verify the water discharge to the Aral Sea and the energy balance presented in Section 3.2.
  • Method 2: Reverse Validation. This method involves re-aggregating the downscaled SB-level data back to the national scale and comparing the results with the original national-level figures. If significant discrepancies are found, the downscaling method is re-evaluated and adjusted as needed. This reverse validation approach has been used to calibrate the two key variables discussed in Section 3.2: water discharge to the Aral Sea and the energy balance.
Upon successful validation, the final dataset is integrated into the model’s database and used as input for the WEF Nexus SDM.

2.5.2. Model Subscripts to Assess the Transboundary Issue of the Resources

Subscripts are a key feature in System Dynamics modelling, enabling efficient representation of multiple categories or regions without duplicating variables or equations [73]. In the WEF Nexus SDM, they have been used to structure data and behaviours across spatial units, improving the modelling of interactions between water, energy, and food systems at the SB level. Implemented through data arrays, subscripts support various modelling aspects such as resource distribution, inter-basin flows, crop types, policy and climate scenarios, and spatial-temporal dynamics [74]. For resource distribution, subscripts enable the modelling of WEF resources availability and demand tailored to each SB’s characteristics [75].
They also help simulate hydropower (HP) production, agricultural outputs, and regional demands based on climate and land use. Subscripts also allow accurate modelling of transboundary flows, including downstream water transfers and inter-regional energy and food trade. In climate and policy scenarios, they enable differentiated assessments across SBs and avoid repetitive equations, enhancing model adaptability [76]. They further support long-term and spatial analyses, such as HP infrastructure expansion by 2035 or the impacts of population growth on resource demand [77]. Integrating subscripts improves model clarity by reducing variable redundancy, increases flexibility for multi-scale simulations, and enhances computational performance through more efficient calculations [78].

2.5.3. Integration of Integrated SSP/RCP Scenarios

Sustainable decision-making relies on models that integrate various environmental and socio-economic factors to simulate future scenarios [79]. This model incorporates key assumptions to reflect realistic trajectories of climate and socio-economic change [80]. Assumptions provide a foundational basis for modelling, offering simplification while preserving accuracy.
In the WEF Nexus model, assumptions include climatic elements (e.g., precipitation, temperature) and socio-economic variables (e.g., population growth), organized under the Representative Concentration Pathways (RCPs) and Shared Socioeconomic Pathways (SSPs). The model integrates three combined SSP/RCP scenarios: SSP126 optimistic, SSP245 business as usual, and SSP585 pessimistic, each depicting distinct climate and socio-economic trajectories. The SSP126 scenario envisions a sustainable future marked by efficient water use, a strong shift toward renewable energy, and environmentally responsible food systems. In contrast, SSP245 represents a continuation of current global trends, leading to moderate progress in water management, gradual energy transition, and mixed outcomes for the three securities. SSP585 outlines a fossil fuel-intensive pathway characterized by high water and energy demand, delayed adoption of renewables, and resource-intensive food production, resulting in increased environmental stress across the WEF Nexus [81].
Modelling approaches often follow a baseline trend in which modifications to key variables serve to explore System Dynamics under different assumptions [82,83,84]. These modifications may be applied at defined points in the timeline to evaluate their influence on the system. This methodological framework ensures that the WEF Nexus SDM effectively captures real-world decision-making dynamics and their potential consequences on environmental and socio-economic systems. The specific variables of the SDM that are affected by these integrated SSP/RCP scenarios are highlighted in the final Water, Energy, and Food modules described in Figures 8, 11, and 12, as detailed in Section 3.

3. Results

This section presents the SDM developed for the WEF Nexus assessment in the major river basins of the ASB. The model integrates water, energy, and food sectors within a climate-sensitive framework, incorporating SSPs and RCPs to simulate socio-environmental dynamics. It captures intersectoral interactions and integrated scenarios’ impacts, particularly under transboundary water management. With approximately 515 variables (Table 2), it provides a quantitative basis for evaluating resource trade-offs and informing regional decision-making [22,23,24,25,26,27,28,29,30,31,32].
The model also differentiates between stock and flow variables. Stocks, represented as boxes, accumulate resources over time, for example, water stored in reservoirs, installed energy capacity, or agricultural production. Flows, depicted as arrows entering or exiting these stock variables, such as water losses due to evaporation or energy generation resulting from newly developed infrastructure. Across the three subsystems, the model incorporates a considerable number of stocks, flows, and auxiliary variables, presented in Table 2: the water subsystem includes two stock and four flow variables; the energy subsystem comprises two stock and four flow variables; and the food subsystem contains one stock and two flow variables—resulting in a total of five stocks and ten flows.
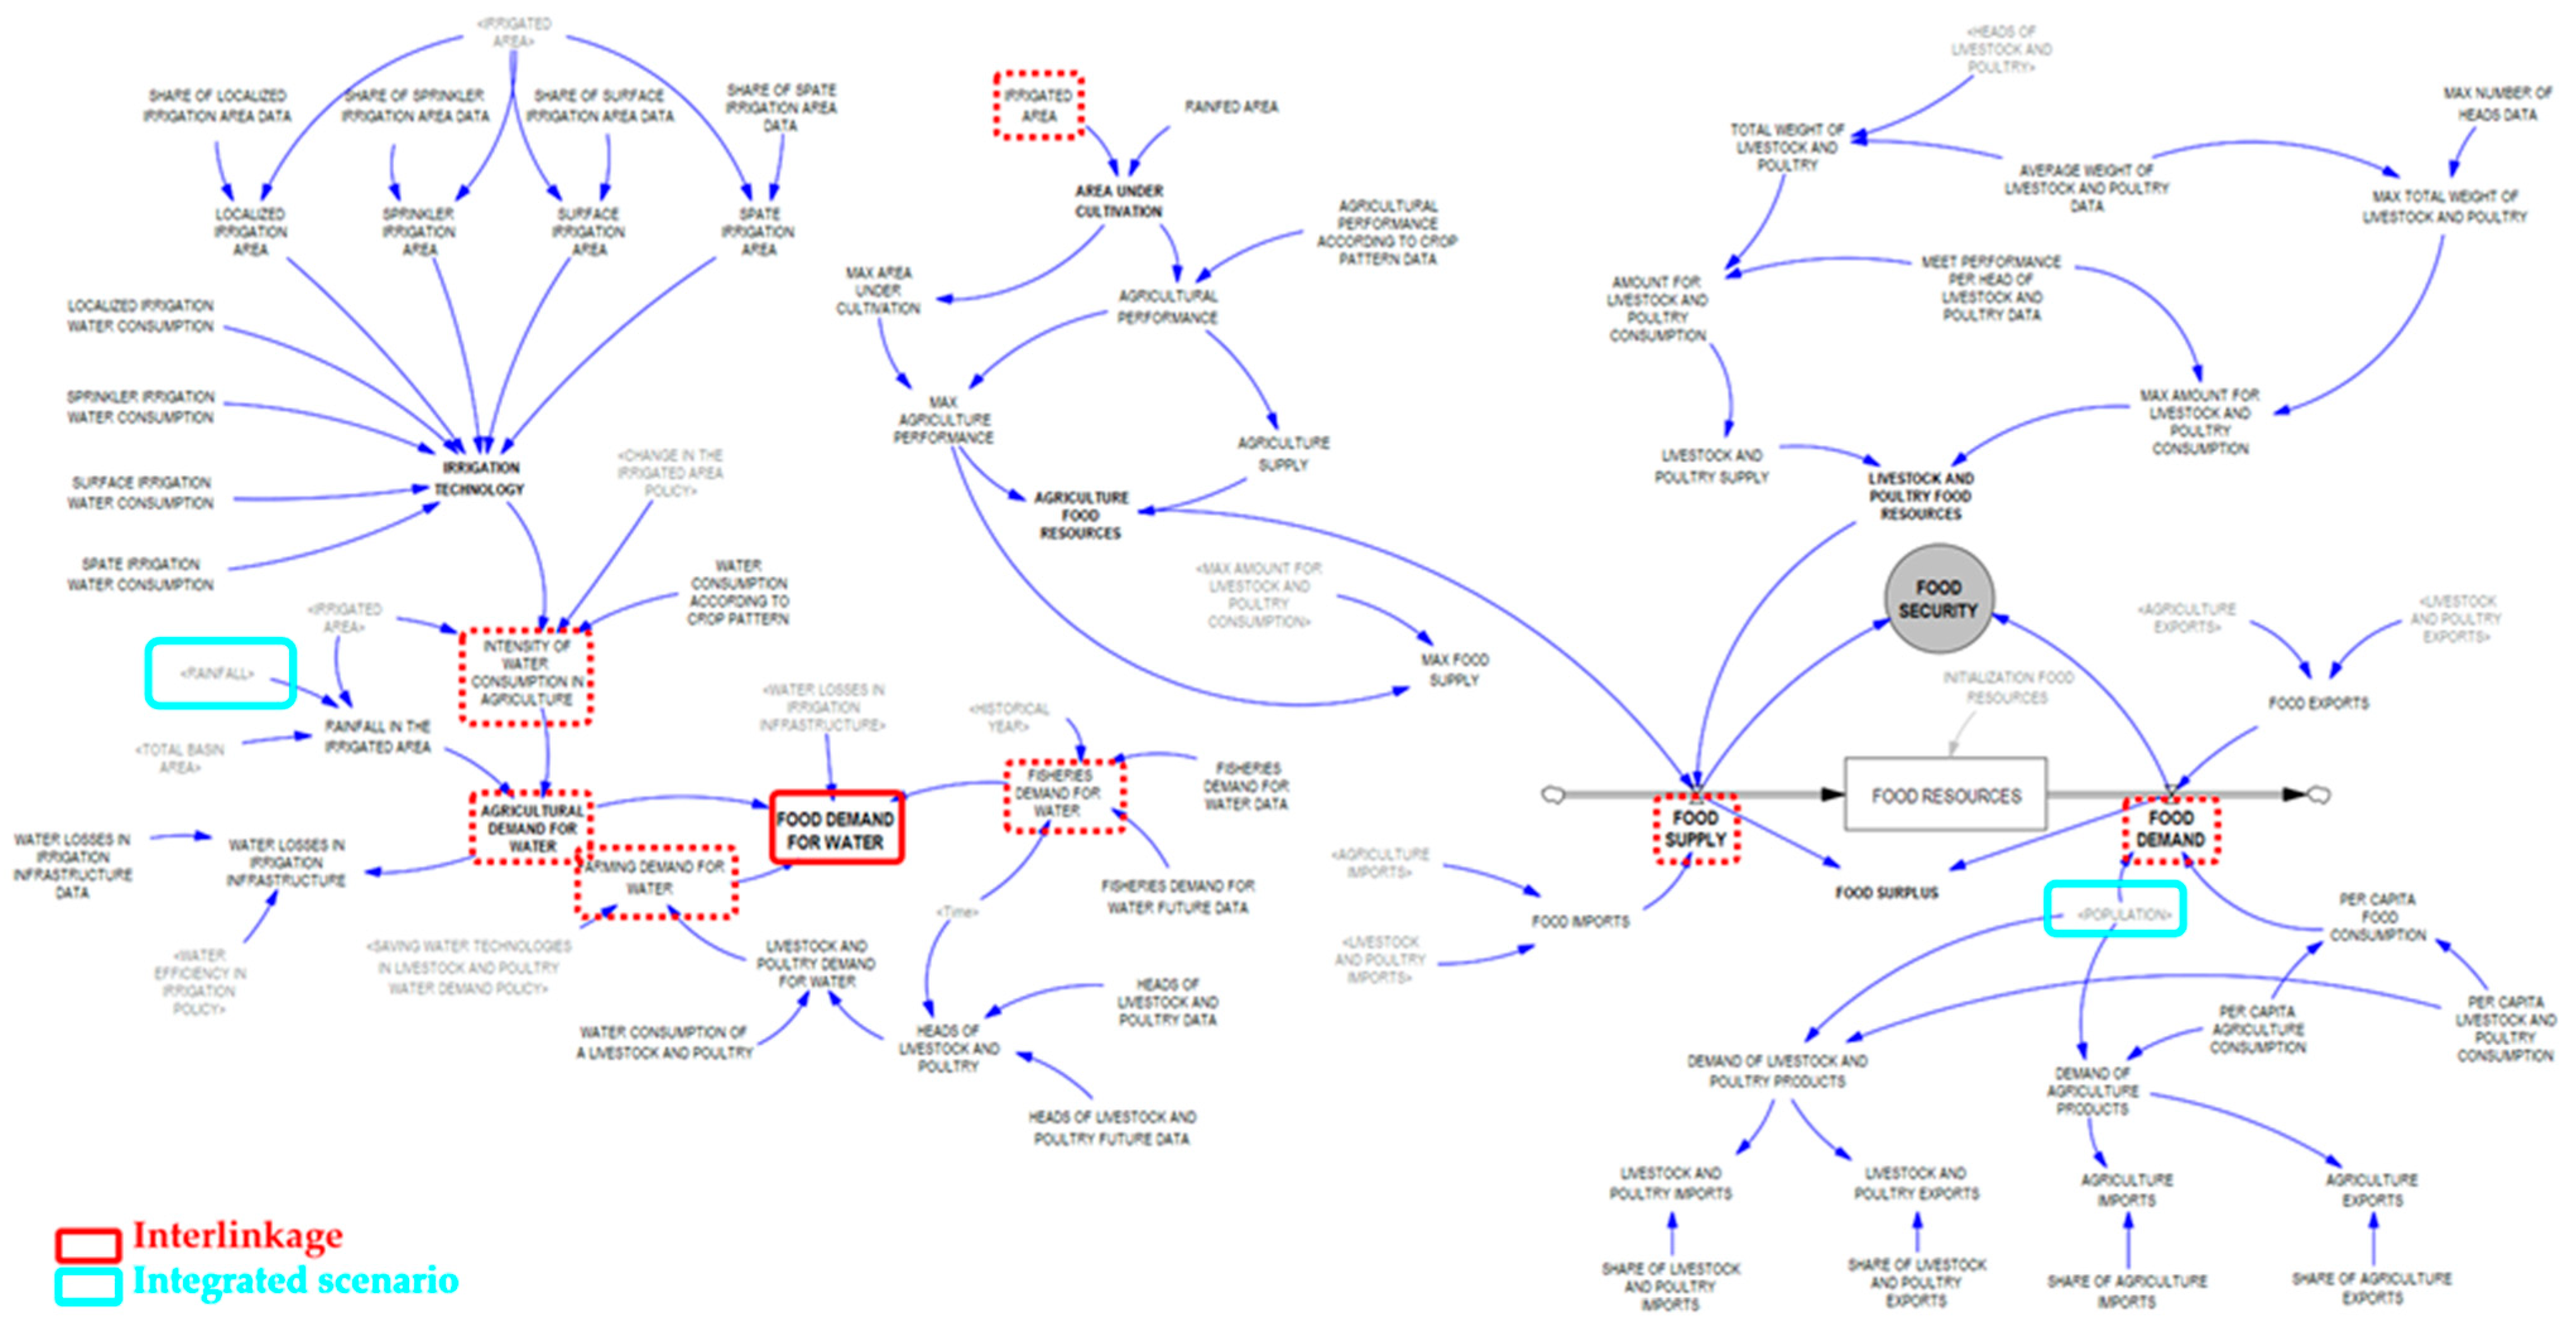
Figure 8, Figure 9, Figure 10, Figure 11 and Figure 12 provide a detailed visual representation of these subsystems. In these figures, variables enclosed in red boxes represent the key interlinkages between subsystems. Red dashed-line boxes indicate variables that directly influence these interlinkages. While variables highlighted in light blue denote the points at which integrated scenarios are introduced and where they exert their primary impact. The directional arrows connecting variables illustrate the directionality of influence or causality among them, thereby facilitating an understanding of system-wide feedback and interactions.

3.1. WEF Nexus SDM

3.1.1. Water Subsystem
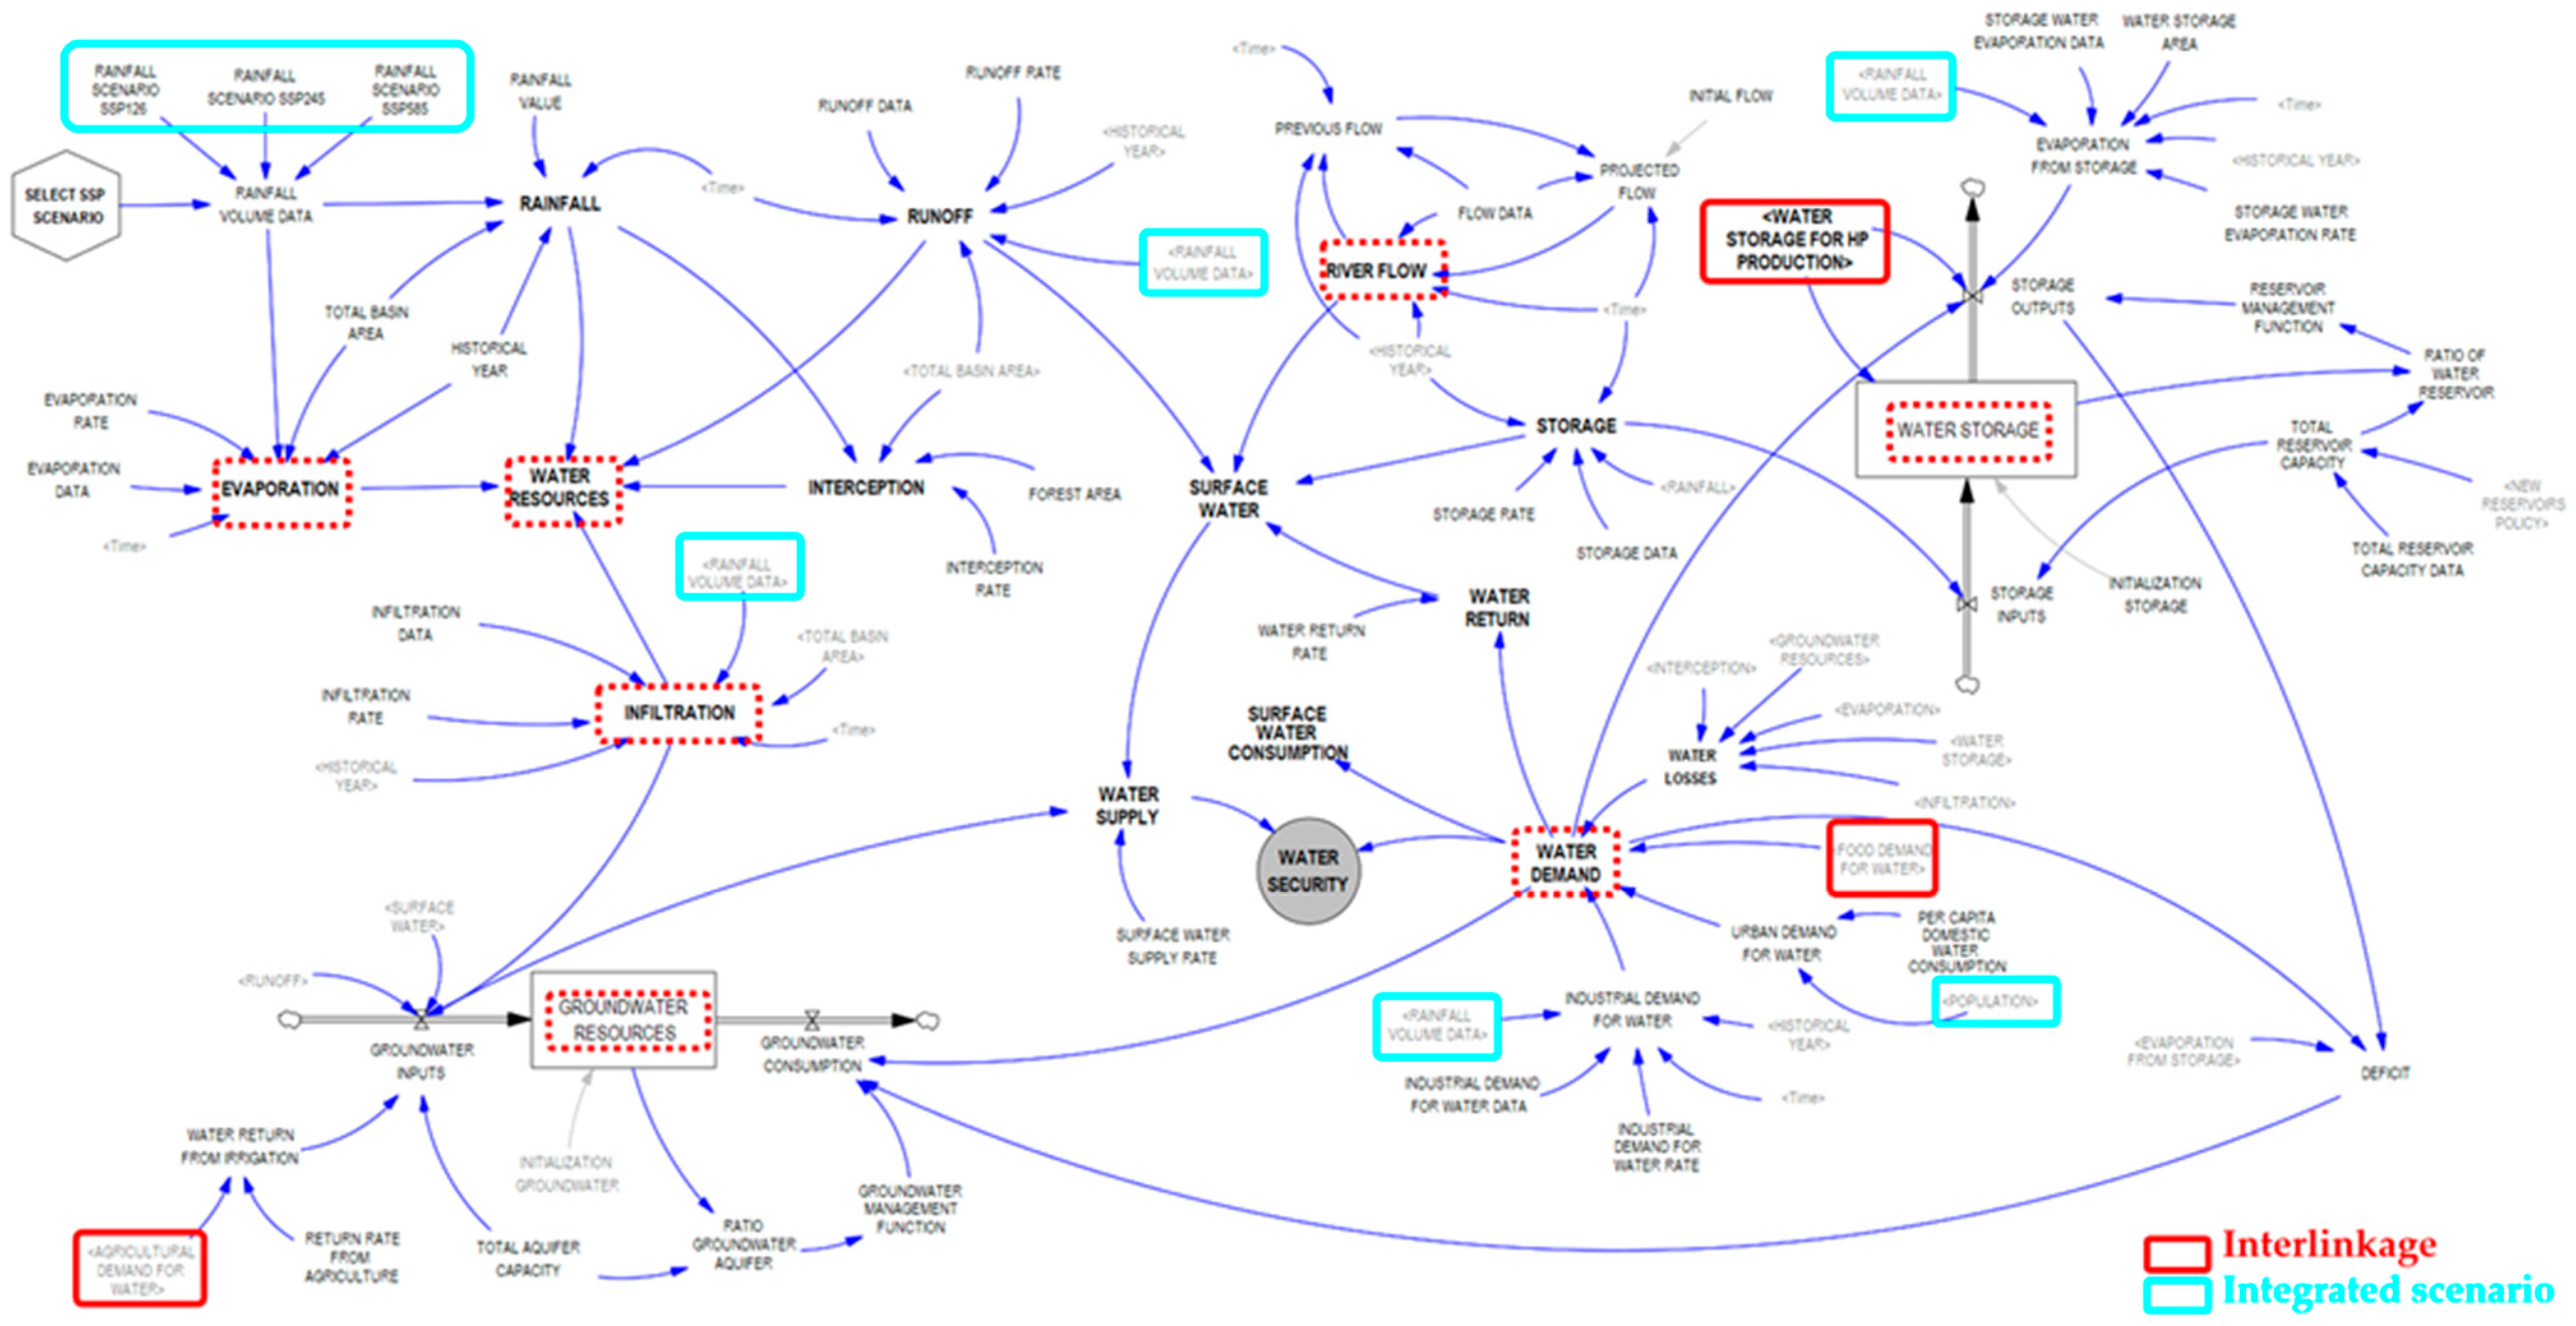
As illustrated in Figure 8, the water subsystem contributes a fundamental pillar of the WEF Nexus SDM, encapsulating the availability, distribution, and consumption of water resources within the major river basins of the ASB, the Amu Darya, and the Syr Darya. This subsystem integrates hydrological dynamics with sectoral demands, considering factors such as river inflows, precipitation, evaporation, and withdrawals for agricultural, industrial, and domestic use. Moreover, it incorporates transboundary water allocation, thereby reflecting the complex interdependencies among riparian states. By capturing water withdrawals across multiple sectors, it enables a detailed characterization of consumption patterns at both spatial and temporal scales.
Figure 8. Water subsystem in the WEF Nexus SDM.
Water 17 02270 g008
The diagram in Figure 8 provides a comprehensive representation of system components, distinguishing between stock variables, such as Water Storage and Groundwater Resources, and flow variables such as Evaporation, Infiltration, and Water Return. Directional arrows indicate the causal pathways and interrelationships among variables, facilitating the identification of key feedback mechanisms within the system.
Critically, the subsystem also addresses transboundary water allocation, reflecting the intricate interdependencies among riparian states. Interlinkages with other subsystems are explicitly highlighted in red-bordered boxes, such as Agricultural Demand for Water, Water Storage for HP Production, and Food Demand for Water, indicating points of cross-sectoral coupling. Variables enclosed in red dashed-line boxes, such as Evaporation and Infiltration, denote direct drivers of these interlinkages, emphasizing their functional role in shaping cross-sector dynamics. Furthermore, elements framed in light blue, such as Population, Rainfall Volume Data, and Per Capita Water Demand, identify the principal entry points and impact zones of integrated scenarios, such as climate and socio-economic pathways.
Overall, this subsystem supports the assessment of a range of water-related challenges, such as water stress, the effectiveness of policy interventions, and the implications of climate change. These evaluations are conducted across multiple governance levels, from sub-basin to basin and regional scales, thereby providing essential insights into the drivers and outcomes of water security in the ASB.
Appendix A.1 presents the primary mathematical formulations underlying this subsystem to ensure a rigorous and transparent understanding and replicability of the model. It includes the fundamental equations governing the dynamics of water resources, detailing key interactions with the energy and food sectors. Ecological considerations, such as environmental flow requirements, are also incorporated and are implicitly embedded within the governing equations of the water subsystem. In addition, the units of measurement and the rationale behind the selected parameters are provided to support the model’s implementation and validation in future research endeavours.

3.1.2. Transboundary Assessment

This subsystem explores the dynamics of water within the Nexus, focusing on SDM and its application to improve water governance in the major river basins of the Aral Sea [16,85]. The river flow has been represented in System Dynamics modelling, shown in Figure 9 and Figure 10, to assess water availability in each SB. As previously mentioned, each SB represented is assigned a subscript to evaluate the transboundary issues of these two rivers.
Figure 9. The river flow of the Amu Darya River represented in System Dynamics modelling.
Water 17 02270 g009
Figure 9 shows the river flow of the Amu Darya represented in System Dynamics modelling, where the interrelationship between SBs is depicted, following the river flow of its main river. Similarly, Figure 10 represents the river flow for the Syr Darya in the same manner.
Figure 10. River flow of the Syr Darya River represented in System Dynamics modelling.
Water 17 02270 g010
In each SB, a balance is made in which water demand is subtracted from water availability, and the inflow from the previous SB is added as an excess. This allows the evaluation of water availability in each SB at each time step (yearly).

3.1.3. Energy Subsystem

The energy subsystem of the WEF Nexus model, illustrated in Figure 11, captures the intricate interdependencies among energy production, supply, and demand, as well as their links to water availability and food production across the ASB. This subsystem encompasses the generation of energy from diverse sources, including fossil fuels, HP, and renewable alternatives such as wind and solar, and models how these sources contribute to the total energy production and supply in the region. It also incorporates energy consumption patterns across key socio-economic sectors.
Figure 11. Energy subsystem in the WEF Nexus SDM.
Water 17 02270 g011
This subsystem of the model, detailed in Figure 11, accounts for both energy demand and consumption, linking them to relevant drivers such as population growth, industrial activity, and agricultural expansion. This is particularly evident in the depiction of TFC in Agriculture, which is marked as an interlinkage variable reflecting the energy-food nexus, and is influenced by population dynamics and broader economic trends. Similarly, Water storage for HP production represents a key interlinkage with the water subsystem, highlighting the bi-directional dependency between HP production and water resource management.
HP potential is modelled through both SHP and HP installed potential, with flow variables simulating commissioning and decommissioning dynamics. The subsystem further integrates policy influences such as shifts toward renewable energy, fossil fuel reduction targets, and efficiency improvements, which shape both the energy production mix and its associated GHG emissions.
Causal pathways are represented via directional arrows that trace the flow of influence among variables, enabling the identification of feedback mechanisms, for instance, between Energy Supply, Energy Balance, and Energy Security. Red dashed-line boxes, such as TFC Agriculture, denote variables that exert direct influence on interlinkages, while light, blue-highlighted elements, e.g., Population, mark the principal entry points and impact nodes of integrated scenario narratives, such as SSPs and energy transition strategies.
Overall, this subsystem provides a comprehensive tool for evaluating the implications of climate variability, and socio-economic developments on the sustainability and resilience of energy systems in a transboundary setting, as well as sustainability aspects with the remaining and sustainable HP and SHP potential, which considers environmental aspects as the ecological flow calculated in the subsystem of water resources or aquatic ecosystem limitations among others. It facilitates the exploration of trade-offs, such as between energy expansion and water use for HP, while supporting the identification of synergies, particularly those involving renewable energy transition. The equations governing the relationships among the variables within this subsystem are presented in Appendix A.2.

3.1.4. Food Subsystem

The food subsystem of the WEF Nexus SDM, illustrated in Figure 12, explores the intricate relationship between the three resources, focusing on the sustainable management of food resources within the ASB. This subsystem is highly sensitive to the availability of water from the Amu Darya and Syr Darya rivers, as well as to the energy required for irrigation and food production processes. It integrates various components such as agricultural production, irrigation technology, livestock and poultry management, and food supply and demand, thereby offering a comprehensive depiction of food security dynamics in a transboundary context.
Figure 12. Food subsystem in the WEF Nexus SDM.
Water 17 02270 g012
In Figure 12 can be found water consumption for irrigation, governed by the type and efficiency of irrigation technologies, is a critical element in this model, directly affecting Agricultural Demand for Water, one of the key interlinkages with the water subsystem. Likewise, Food Demand for Water and Food Supply, also marked as interlinkages, capture the dependency of food availability on water and energy inputs. Variables such as Rainfall in the Irrigated Area and Population indicate the entry points of integrated scenario drivers that influence both supply and demand dimensions. The subsystem further accounts for livestock and poultry consumption, providing a robust framework to assess how demographic change and climate impacts may alter regional and food security. Causal arrows indicate the direction of influence among variables, facilitating a deeper understanding of how feedback loops and policy levers interact to shape system outcomes.
Through this modelling framework, it becomes possible to simulate the impacts of various scenarios on food sustainability, including those aiming to reduce environmental pressure or enhance resilience to shocks, considering land degradation or changes in crop patterns. The mathematical equations that define the relationships between these variables are provided in Appendix A.3.

3.2. Model Calibration and Validation

The model has been calibrated and validated against three key variables of the WEF Nexus: (i) water discharge to the Aral Sea, (ii) energy balance, and (iii) agricultural demand for water. These variables have not been selected arbitrarily. On the one hand, they are core indicators within their respective subsystems —water, energy, and food—meaning that their validation inherently ensures the consistency of related variables within each subsystem. On the other hand, reliable datasets are available for these indicators, which allow for rigorous comparison between model outputs and observed data, thereby verifying both the accuracy and the capacity of the model to reproduce interannual trends and fluctuations.
The calibration and validation processes differ depending on the nature and spatial resolution of the data available. In the case of water discharge to the Aral Sea, direct observations from CAWATER [86] were used, as they represent discharge points (SD_SB_9 and AD_SB_19) with sufficient spatial precision. By contrast, for both the energy balance and agricultural water demand, observed data were obtained from the IEA and AQUASTAT, respectively. These sources provide national-level data, and thus, a prior processing step was necessary. Specifically, a downscaling procedure based on area and land use drivers was applied to adapt the data to the SB level and enable meaningful comparison with the model outputs. The following subsections describe in detail the validation results for each of these three variables.

3.2.1. Water Discharge to the Aral Sea

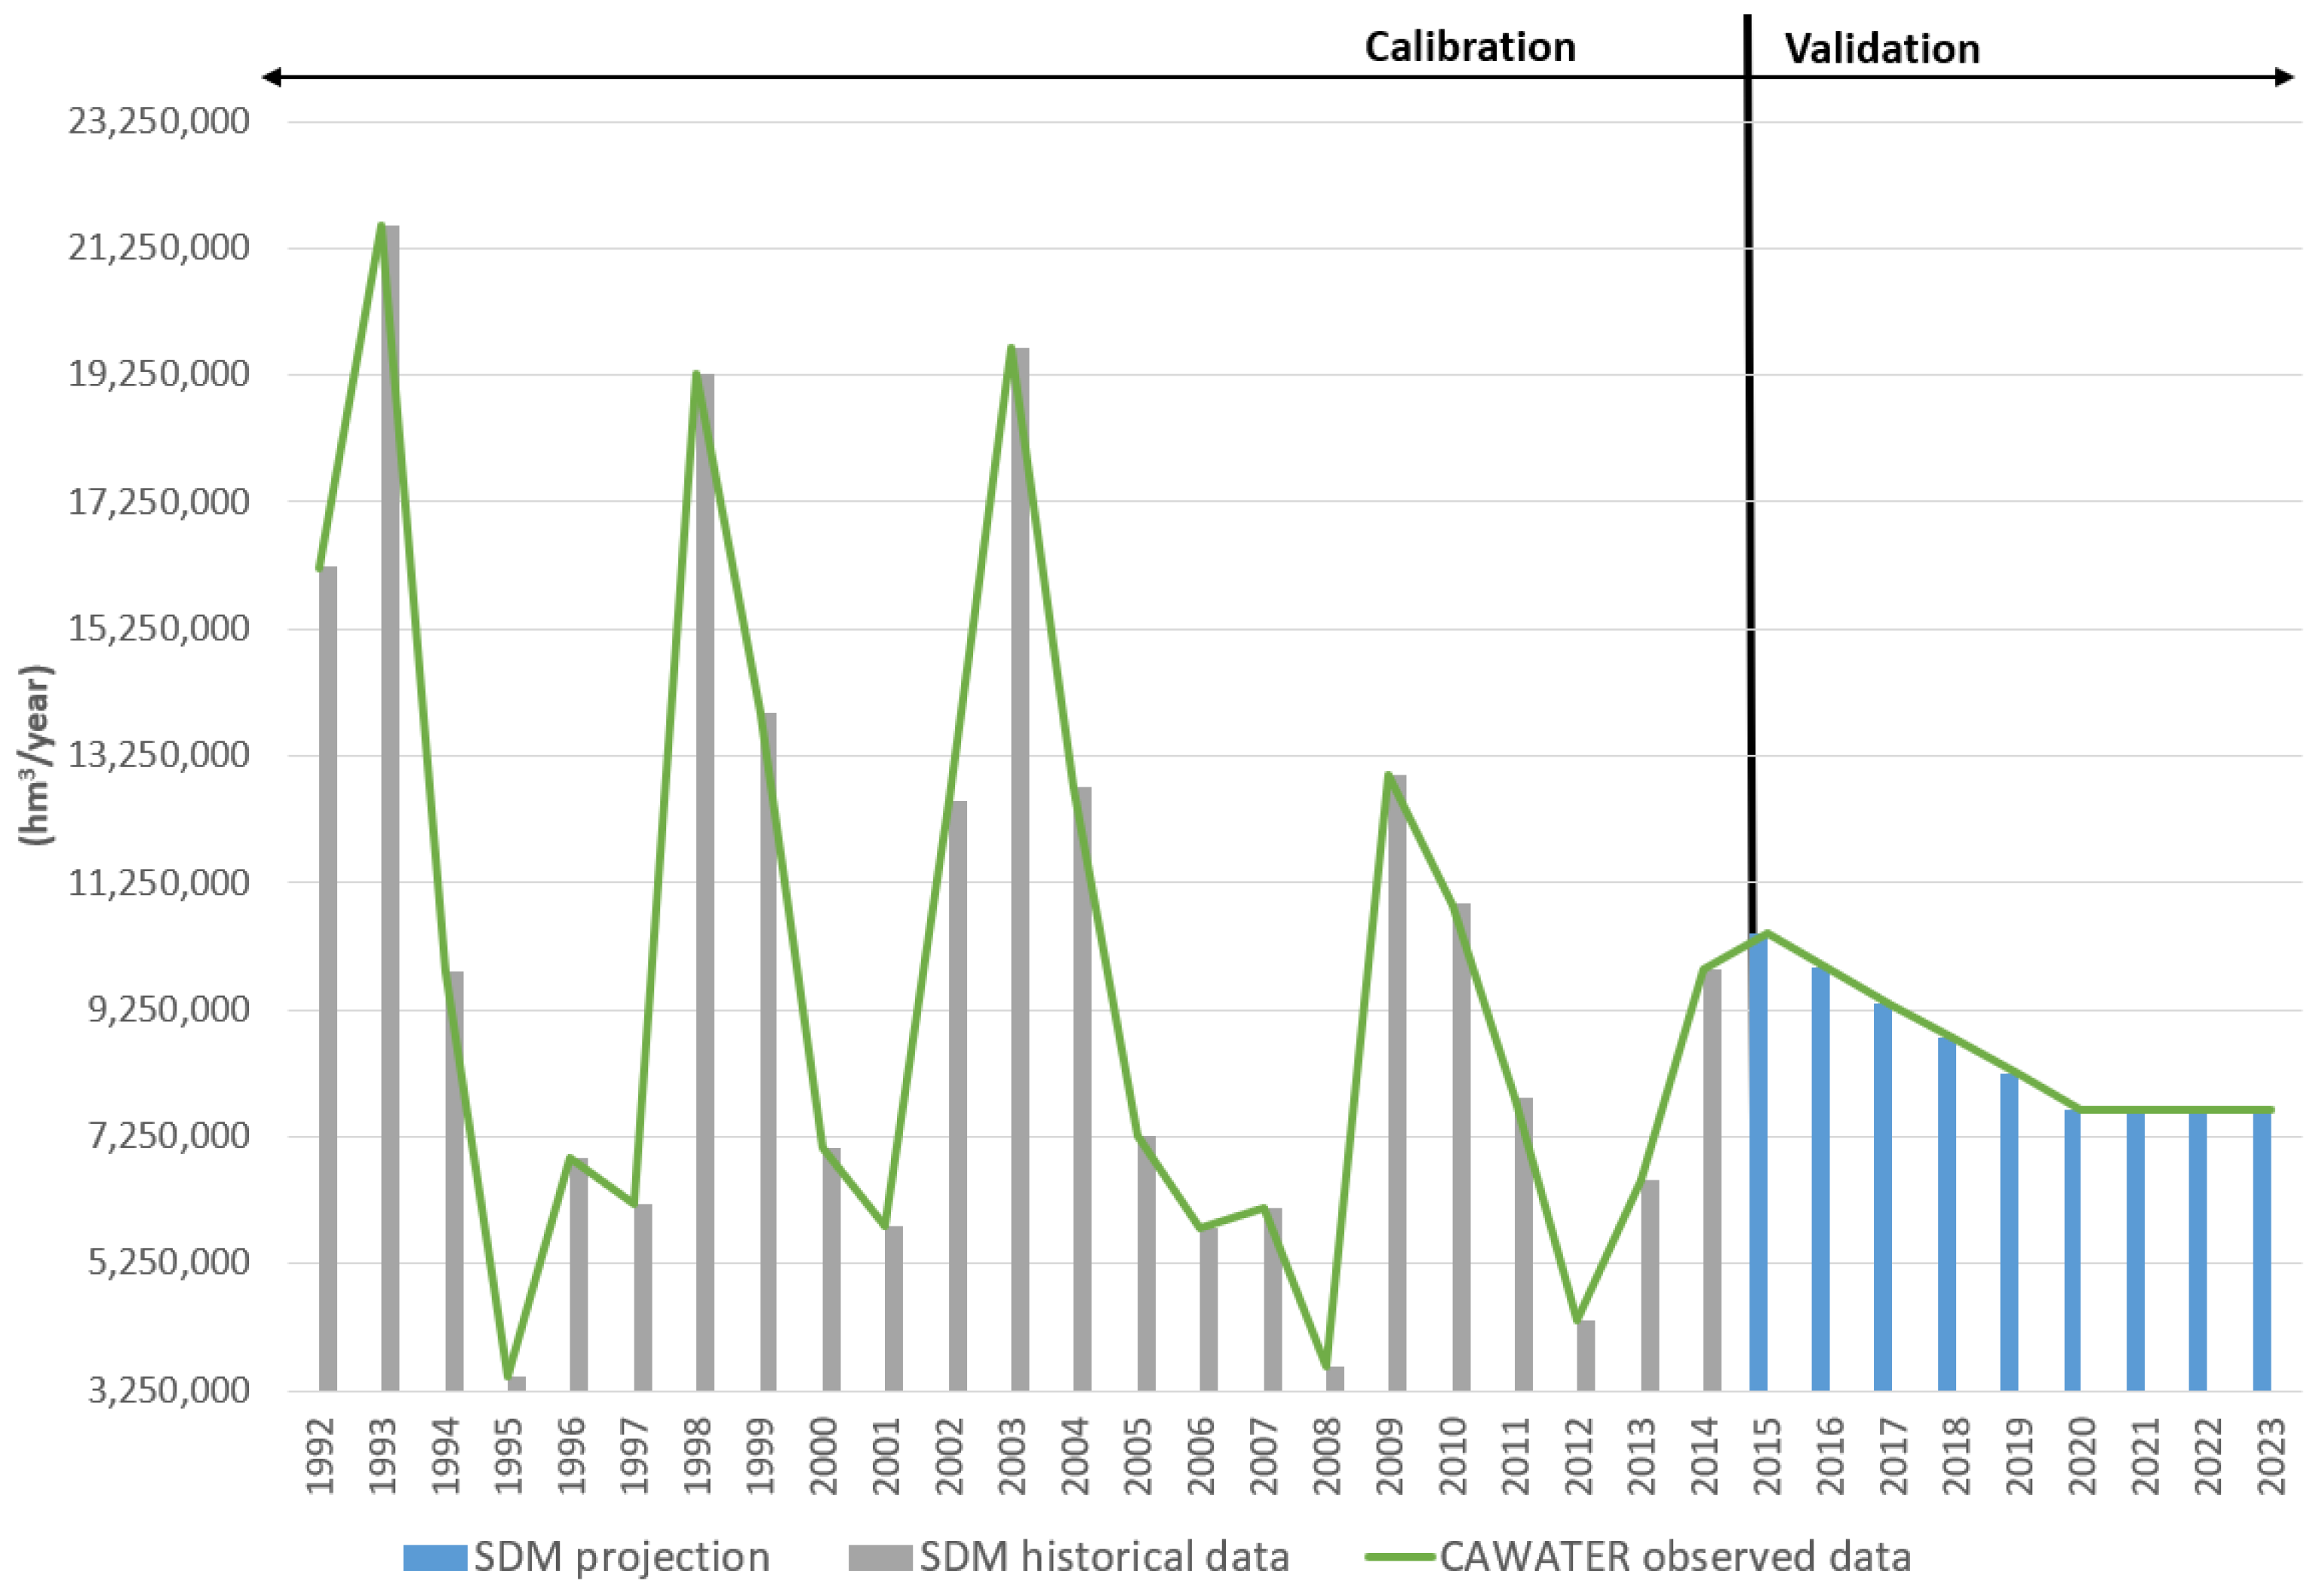
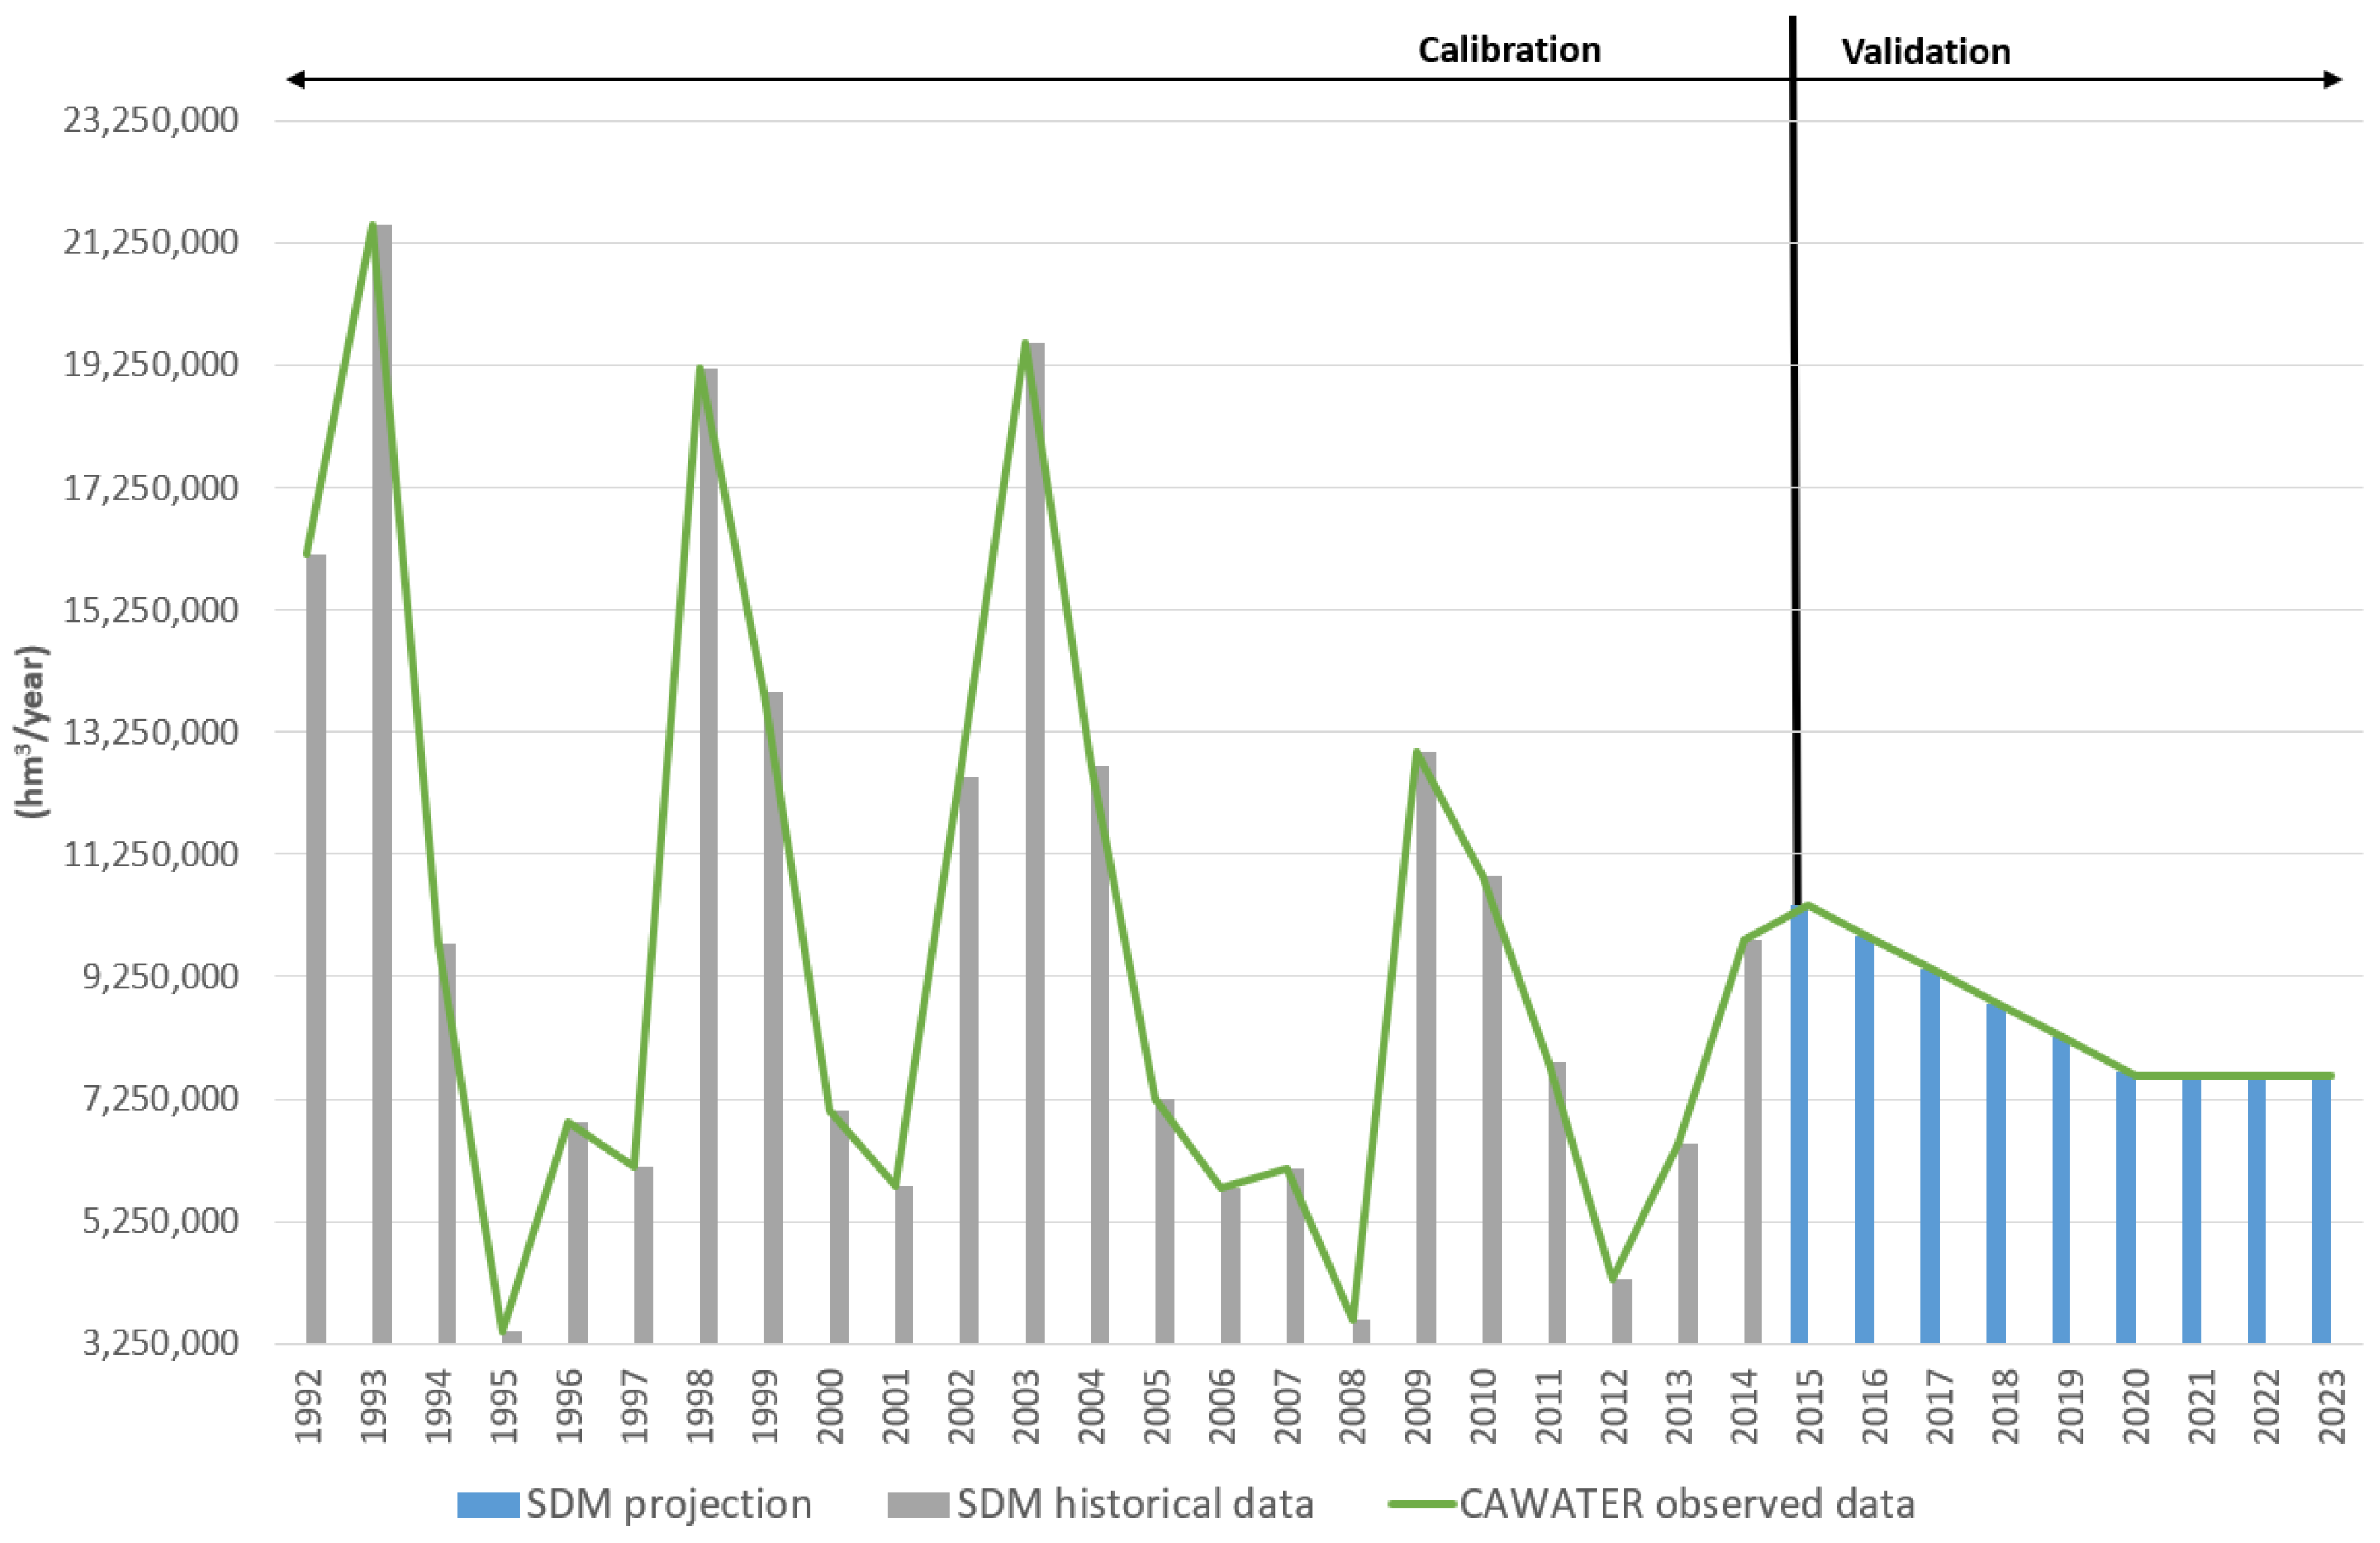
The SDM was calibrated using observed annual discharge data from CAWATER [86], which provides consistent records of river inflows to the Aral Sea (Figure 13) from both the Syr Darya (Figure 14) and Amu Darya (Figure 15) rivers starting in 1992. Historical monthly discharge values were aggregated into annual totals for the period 1992–2014, which served as the calibration window. Model validation was then performed over the subsequent period (2015–2023) using independent observed data, allowing for an assessment of the model’s predictive accuracy. Model development was further supported by georeferenced flow estimates from the FLO1K dataset [70], which offers global river flow conditions for the period 1985–2015. The calibration phase (1992–2014) was used to define the model’s internal structure, while the year 2015 served as the starting point for validation to test its forward simulation performance. To simulate annual discharge, the SDM applied a moving average algorithm that incorporates lagged flow values from preceding years, thereby embedding hydrological memory into the modelled time series.
Figure 13, Figure 14 and Figure 15 illustrate the comparison between modelled and observed data from total, Syr Darya, and Amu Darya discharge, respectively. These figures indicate that the SDM replicates the major hydrological patterns and interannual fluctuations observed in the data, particularly during the calibration period, using the Method 2 described in Section 2.5.1. The largest discharge originates from the Syr Darya River, accounting for 99% of the total flow. That is why Figure 13 and Figure 14 are very similar. During the validation phase (2015–2023), applying the Method 1 described in Section 2.5.1, the SDM achieved a relative error of approximately 1.3% for total inflow to the Aral Sea (Figure 13), confirming strong model agreement with observed values at the basin scale. This high level of accuracy is further supported by the results for the Syr Darya, which exhibited an even lower error of approximately 1% (Figure 14). These findings demonstrate the model’s capacity to reliably simulate river inflows across both wet and dry years, with clear alignment of peaks and troughs, and suggest that the hydrological processes governing the Syr Darya basin and SBs are well captured by the model’s structure.
In contrast, the Amu Darya basin presents greater challenges. The model’s relative error in this case is close to 10% (Figure 15), reflecting a reduced ability to simulate this river’s more complex and variable behaviour. The discrepancies may stem from a combination of factors, including more pronounced human intervention (e.g., irrigation withdrawals consequent of its approximately 11 km2 more of irrigated area), variable upstream regulation, and data uncertainty in this basin and its corresponding SBs. The Amu Darya’s observed discharge exhibits substantial variability and a declining trend in recent years, with sporadic peaks not consistently reproduced in the model outputs. This contributes to the larger observed simulation error and indicates potential limitations in how the SDM captures hydrological dynamics under complex and possibly non-stationary conditions.
Overall, the results of the calibration and validation process confirm the robustness of the SDM in simulating aggregate inflows to the Aral Sea, demonstrating its suitability for supporting integrated and strategic water resources management. The relatively low validation errors—particularly for total inflow and the Syr Darya basin—highlight the model’s reliability for long-term scenario analysis. These outcomes are consistent with findings from other System Dynamics modelling applications in semi-arid regions, such as the Ardabil Plain, where validation errors were similarly influenced by structural assumptions and limitations in spatial data availability [28].

3.2.2. Energy Balance

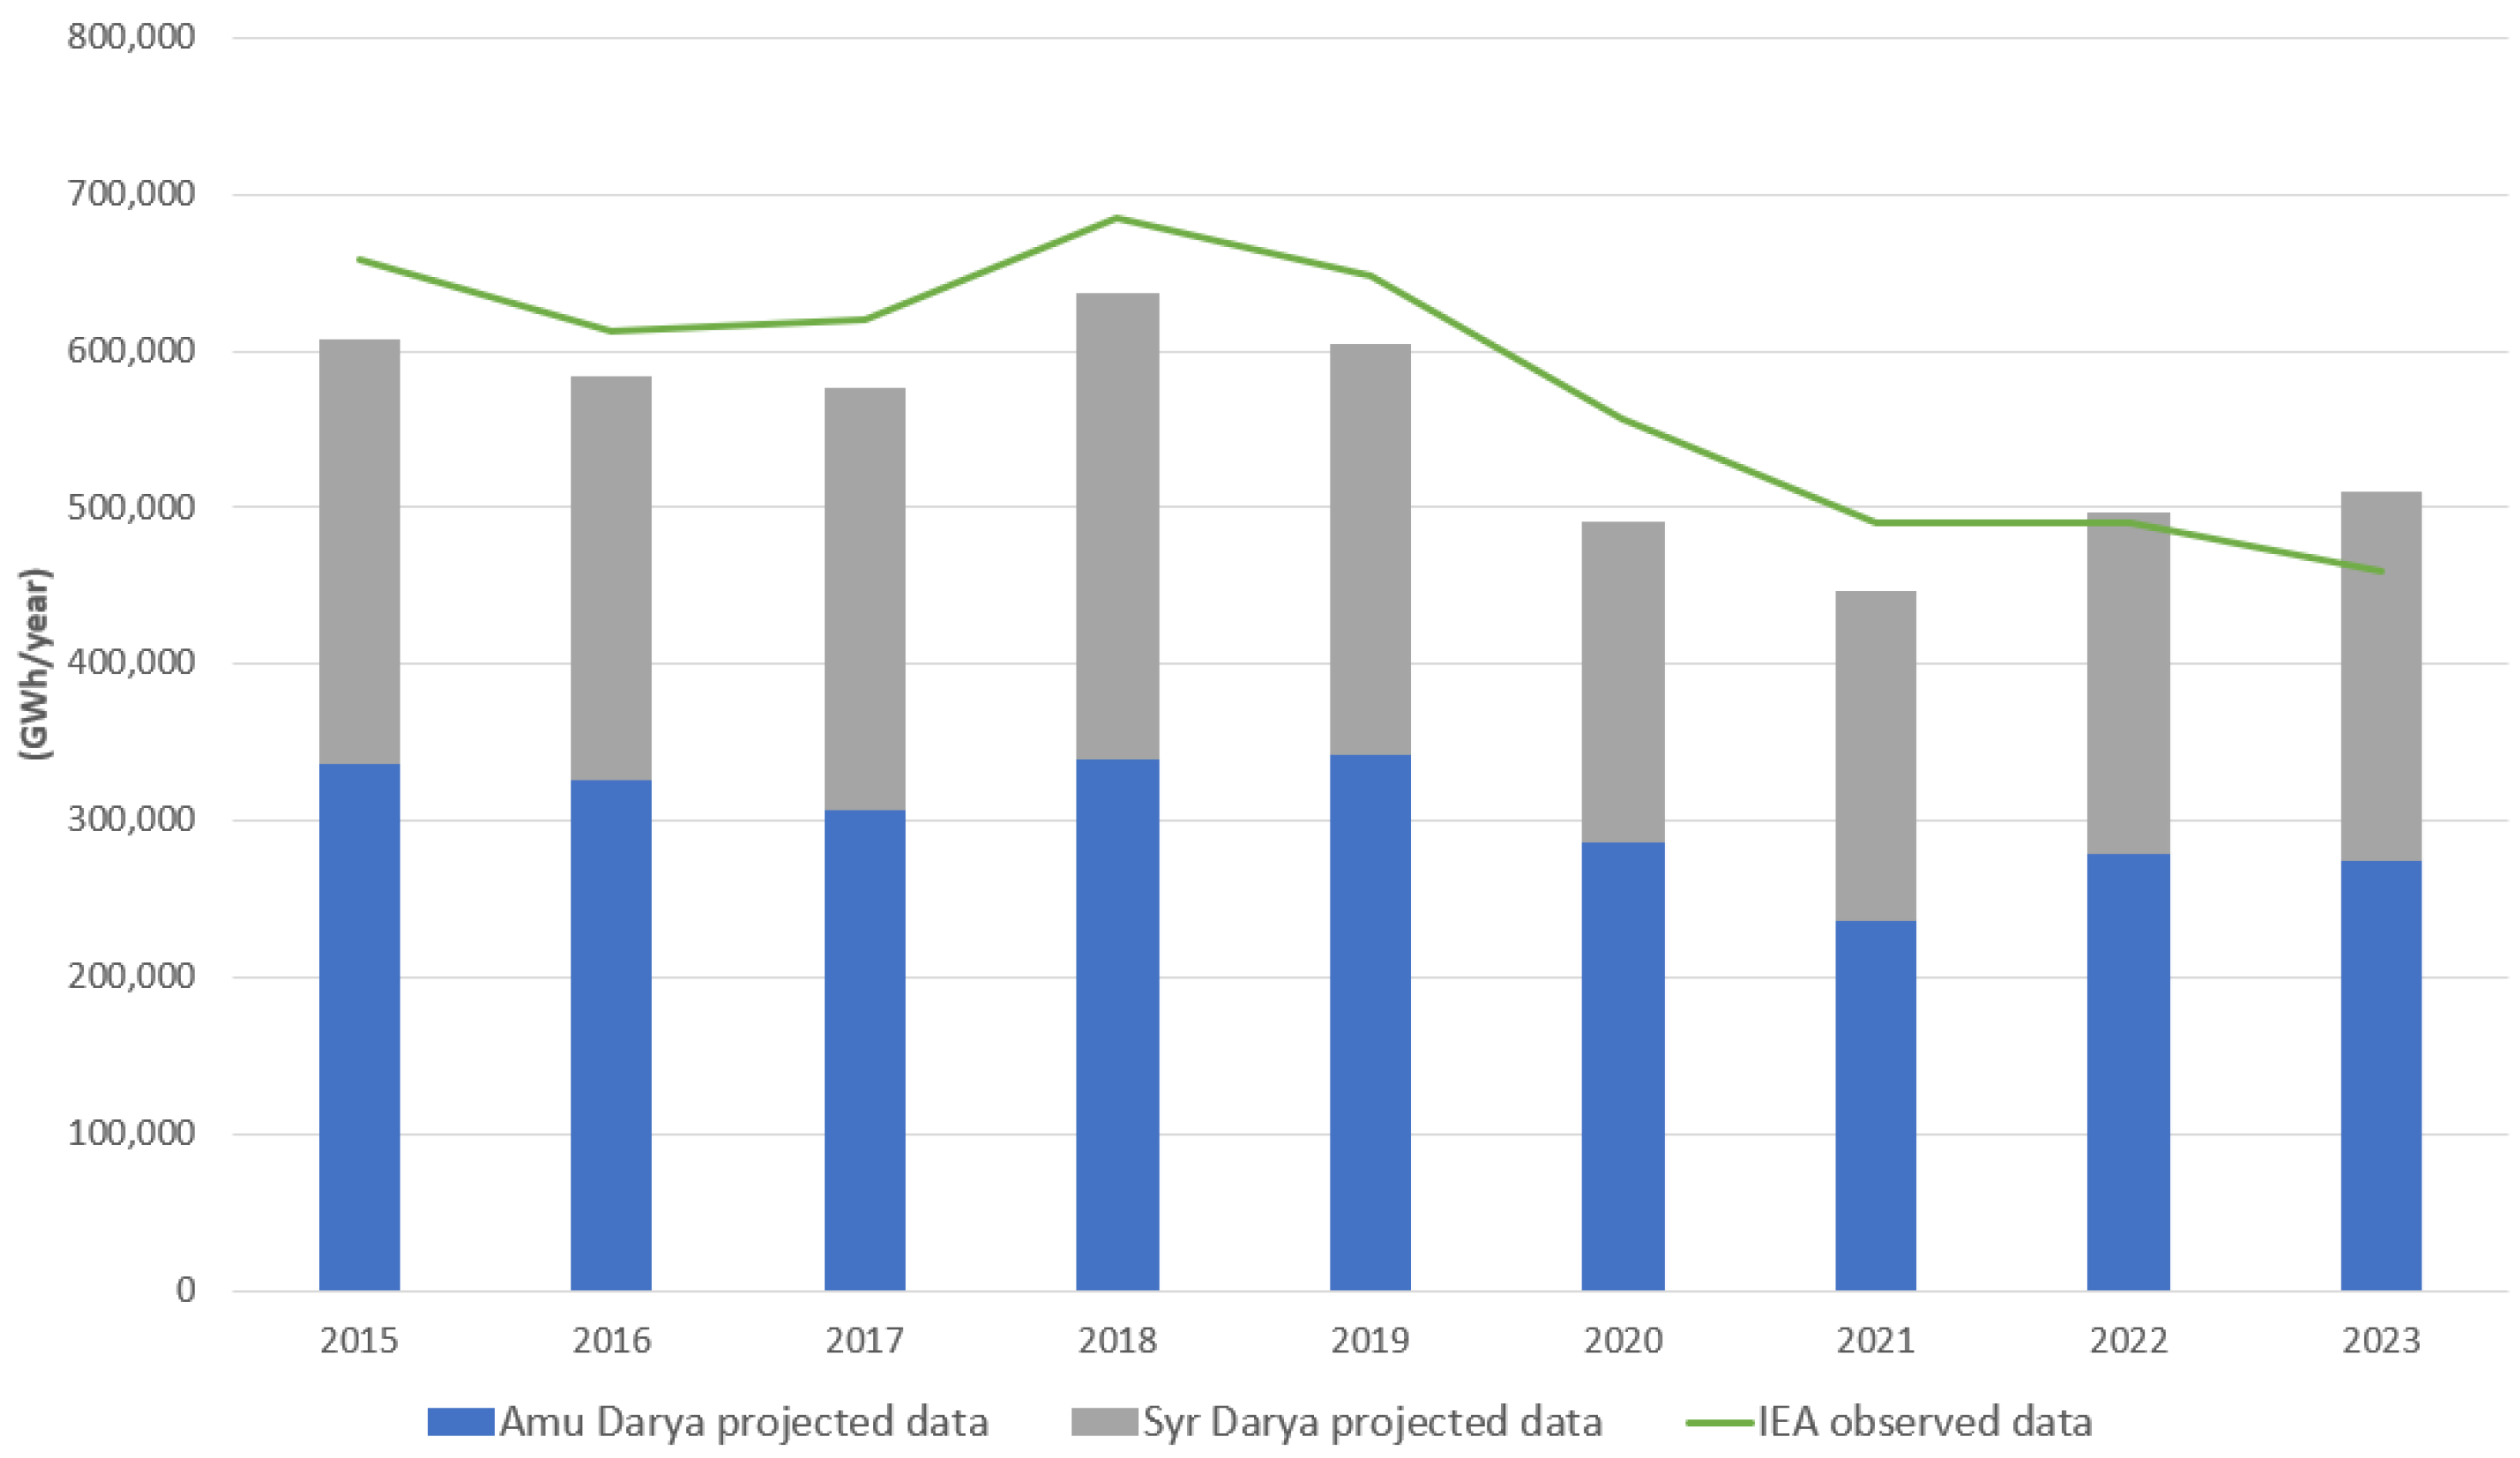
Figure 16 presents the validation of the energy balance within the Amu Darya and Syr Darya river basins, combining model-based estimates with observed data.
In Figure 16, the green line represents the downscaled IEA data, indicating the total energy consumption across both basins within the study area. These observed values serve as a reference to validate the model outputs, which are disaggregated into the Amu Darya (blue bars) and Syr Darya (grey bars) basins. The comparison demonstrates a strong alignment between the IEA-based reference and the aggregated modelled values for the period 2015–2023, with a mean absolute error of 4.62%. This validation confirms the model’s reliability in capturing basin-level energy demand and reinforces its relevance for integrated Nexus assessments in transboundary settings.

3.2.3. Agricultural Demand for Water

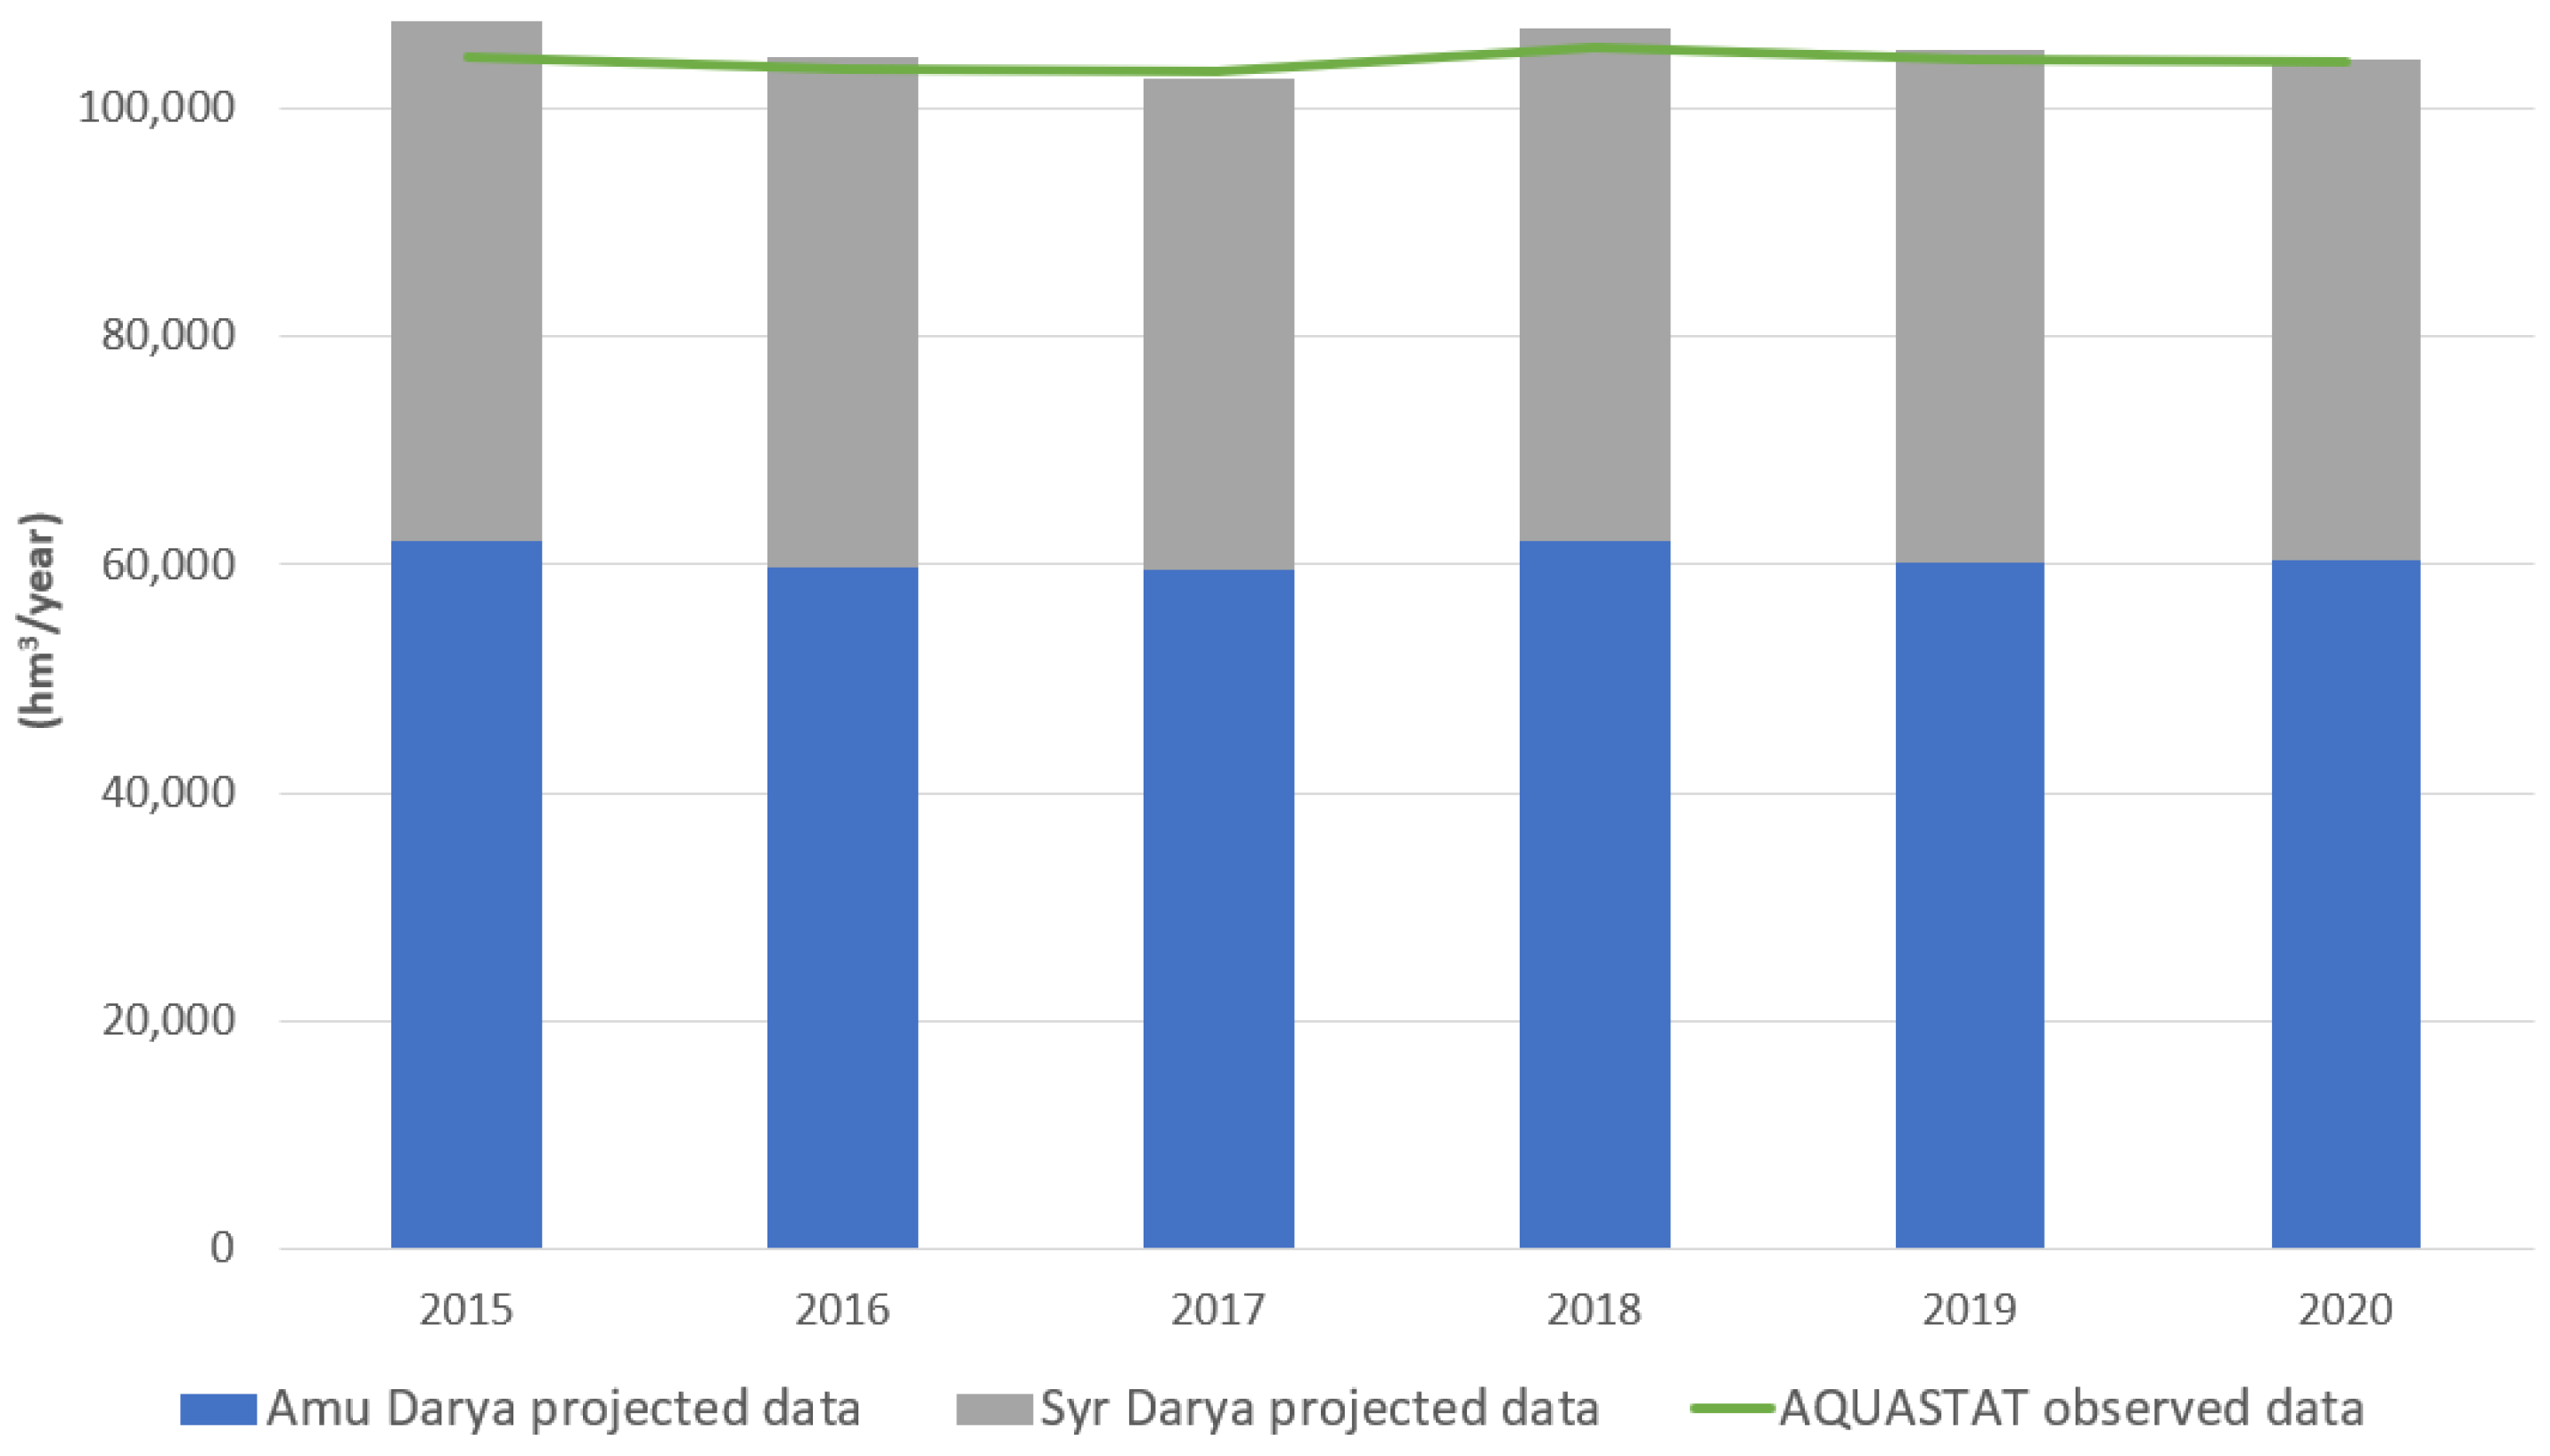
This validation supports the reliability of the model in reproducing a key variable within the food resources subsystem, namely, the agricultural demand for water. Moreover, since the estimation of this variable depends on crop-specific consumption coefficients, the validation also provides indirect confirmation of the model’s accuracy in capturing crop water use intensity. These findings reinforce the robustness of the model for integrated WEF assessments in transboundary river basins. Figure 17 presents the validation of agricultural water demand within the Amu Darya and Syr Darya, combining model-generated projections with observed data from AQUASTAT [37].
In Figure 17, the green line represents AQUASTAT observed data, which were processed using the land use-based downscaling method described in Section 2.5.1 to obtain values at the sub-basin level. These downscaled observations serve as a reference to validate the model outputs, which are disaggregated into the Amu Darya basin (blue bars) and the Syr Darya basin (grey bars).
The comparison shows a strong alignment between the AQUASTAT-based reference and the aggregated modelled values over the period 2015–2020. The mean absolute error is approximately 2% in the Amu Darya basin and 1.5% in the Syr Darya basin. When aggregated at the scale of the entire ASB, the error decreases to 1.2%, indicating a high degree of consistency at the regional level.

4. Discussion

4.1. Future Trends in the Amu Darya and Syr Darya Discharges to the Aral Sea

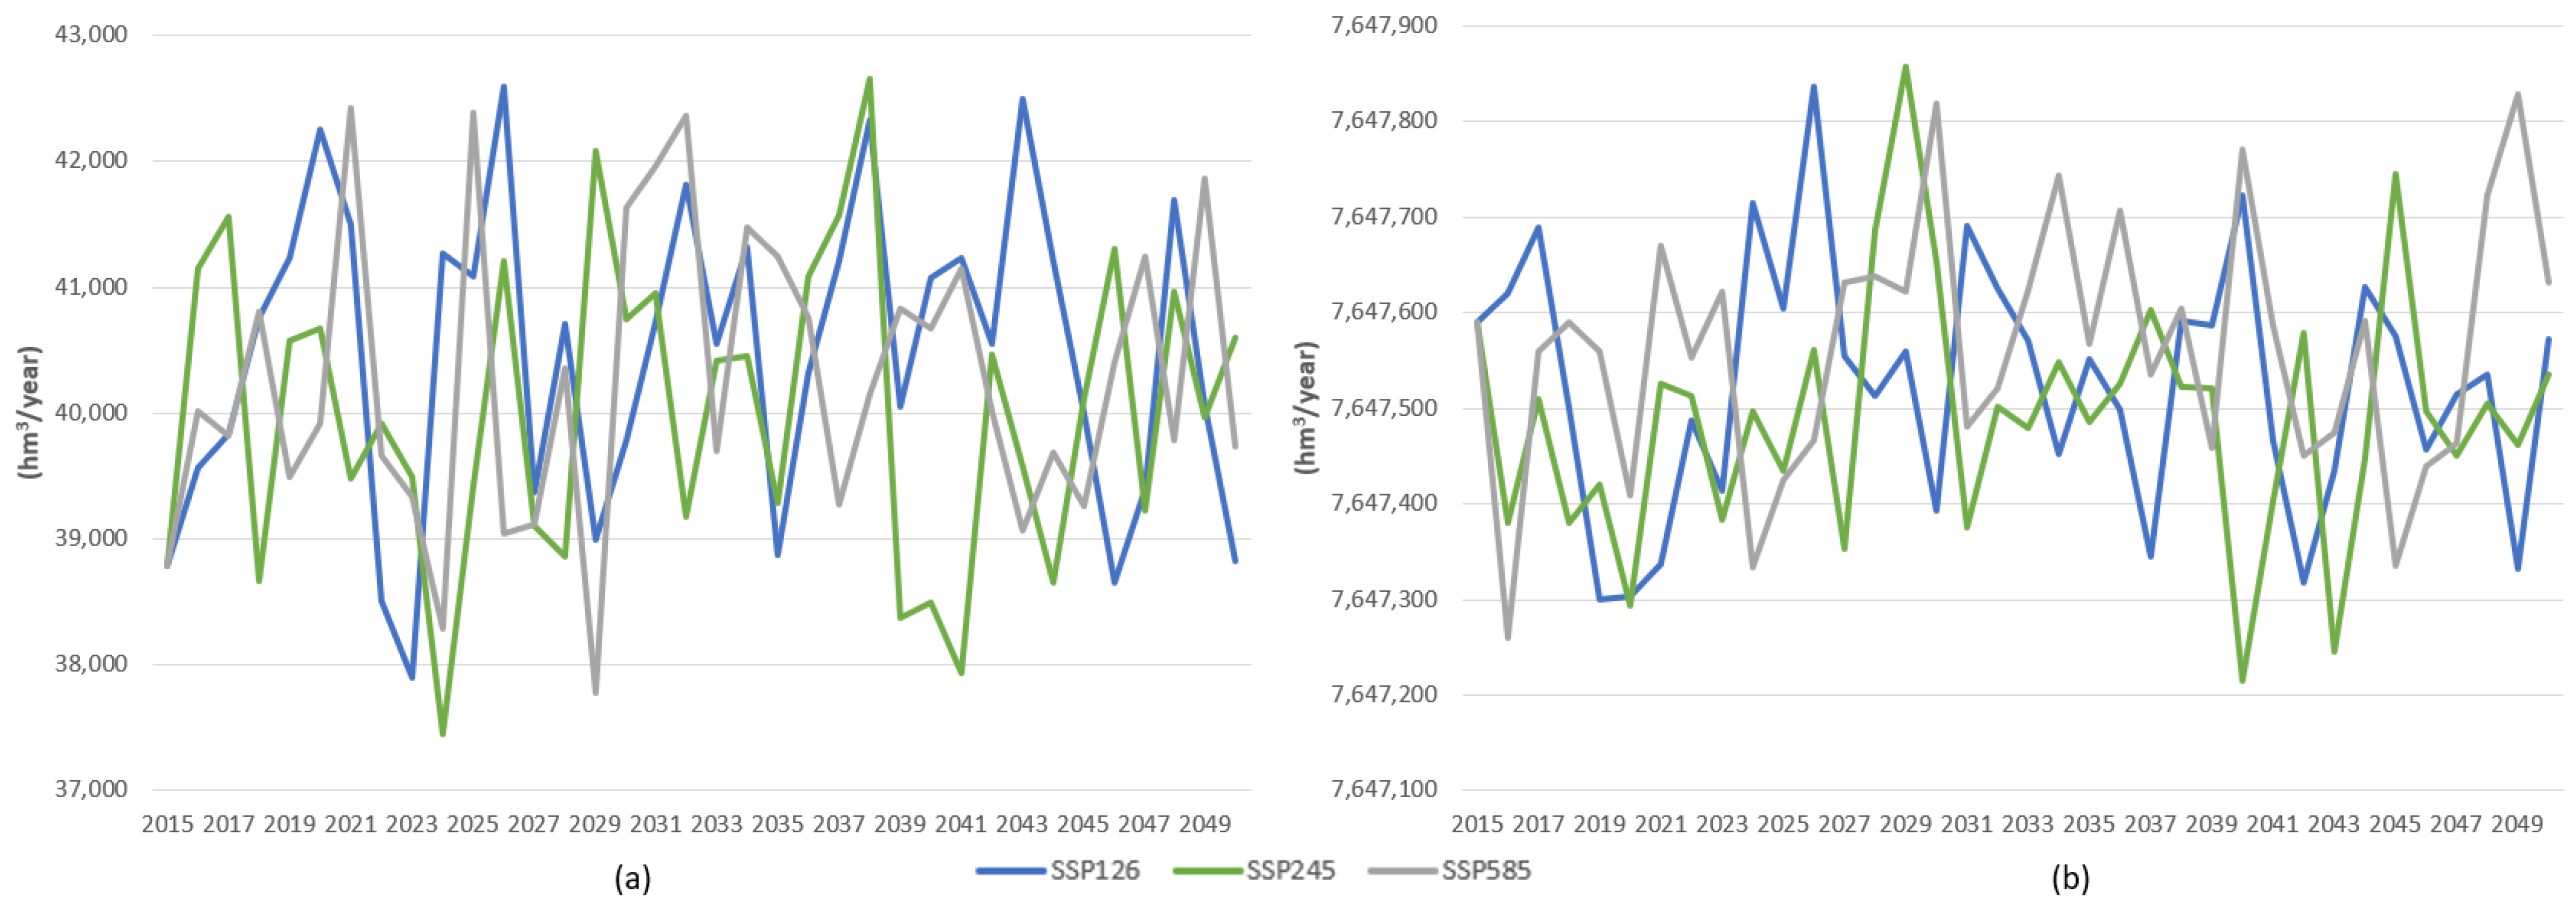
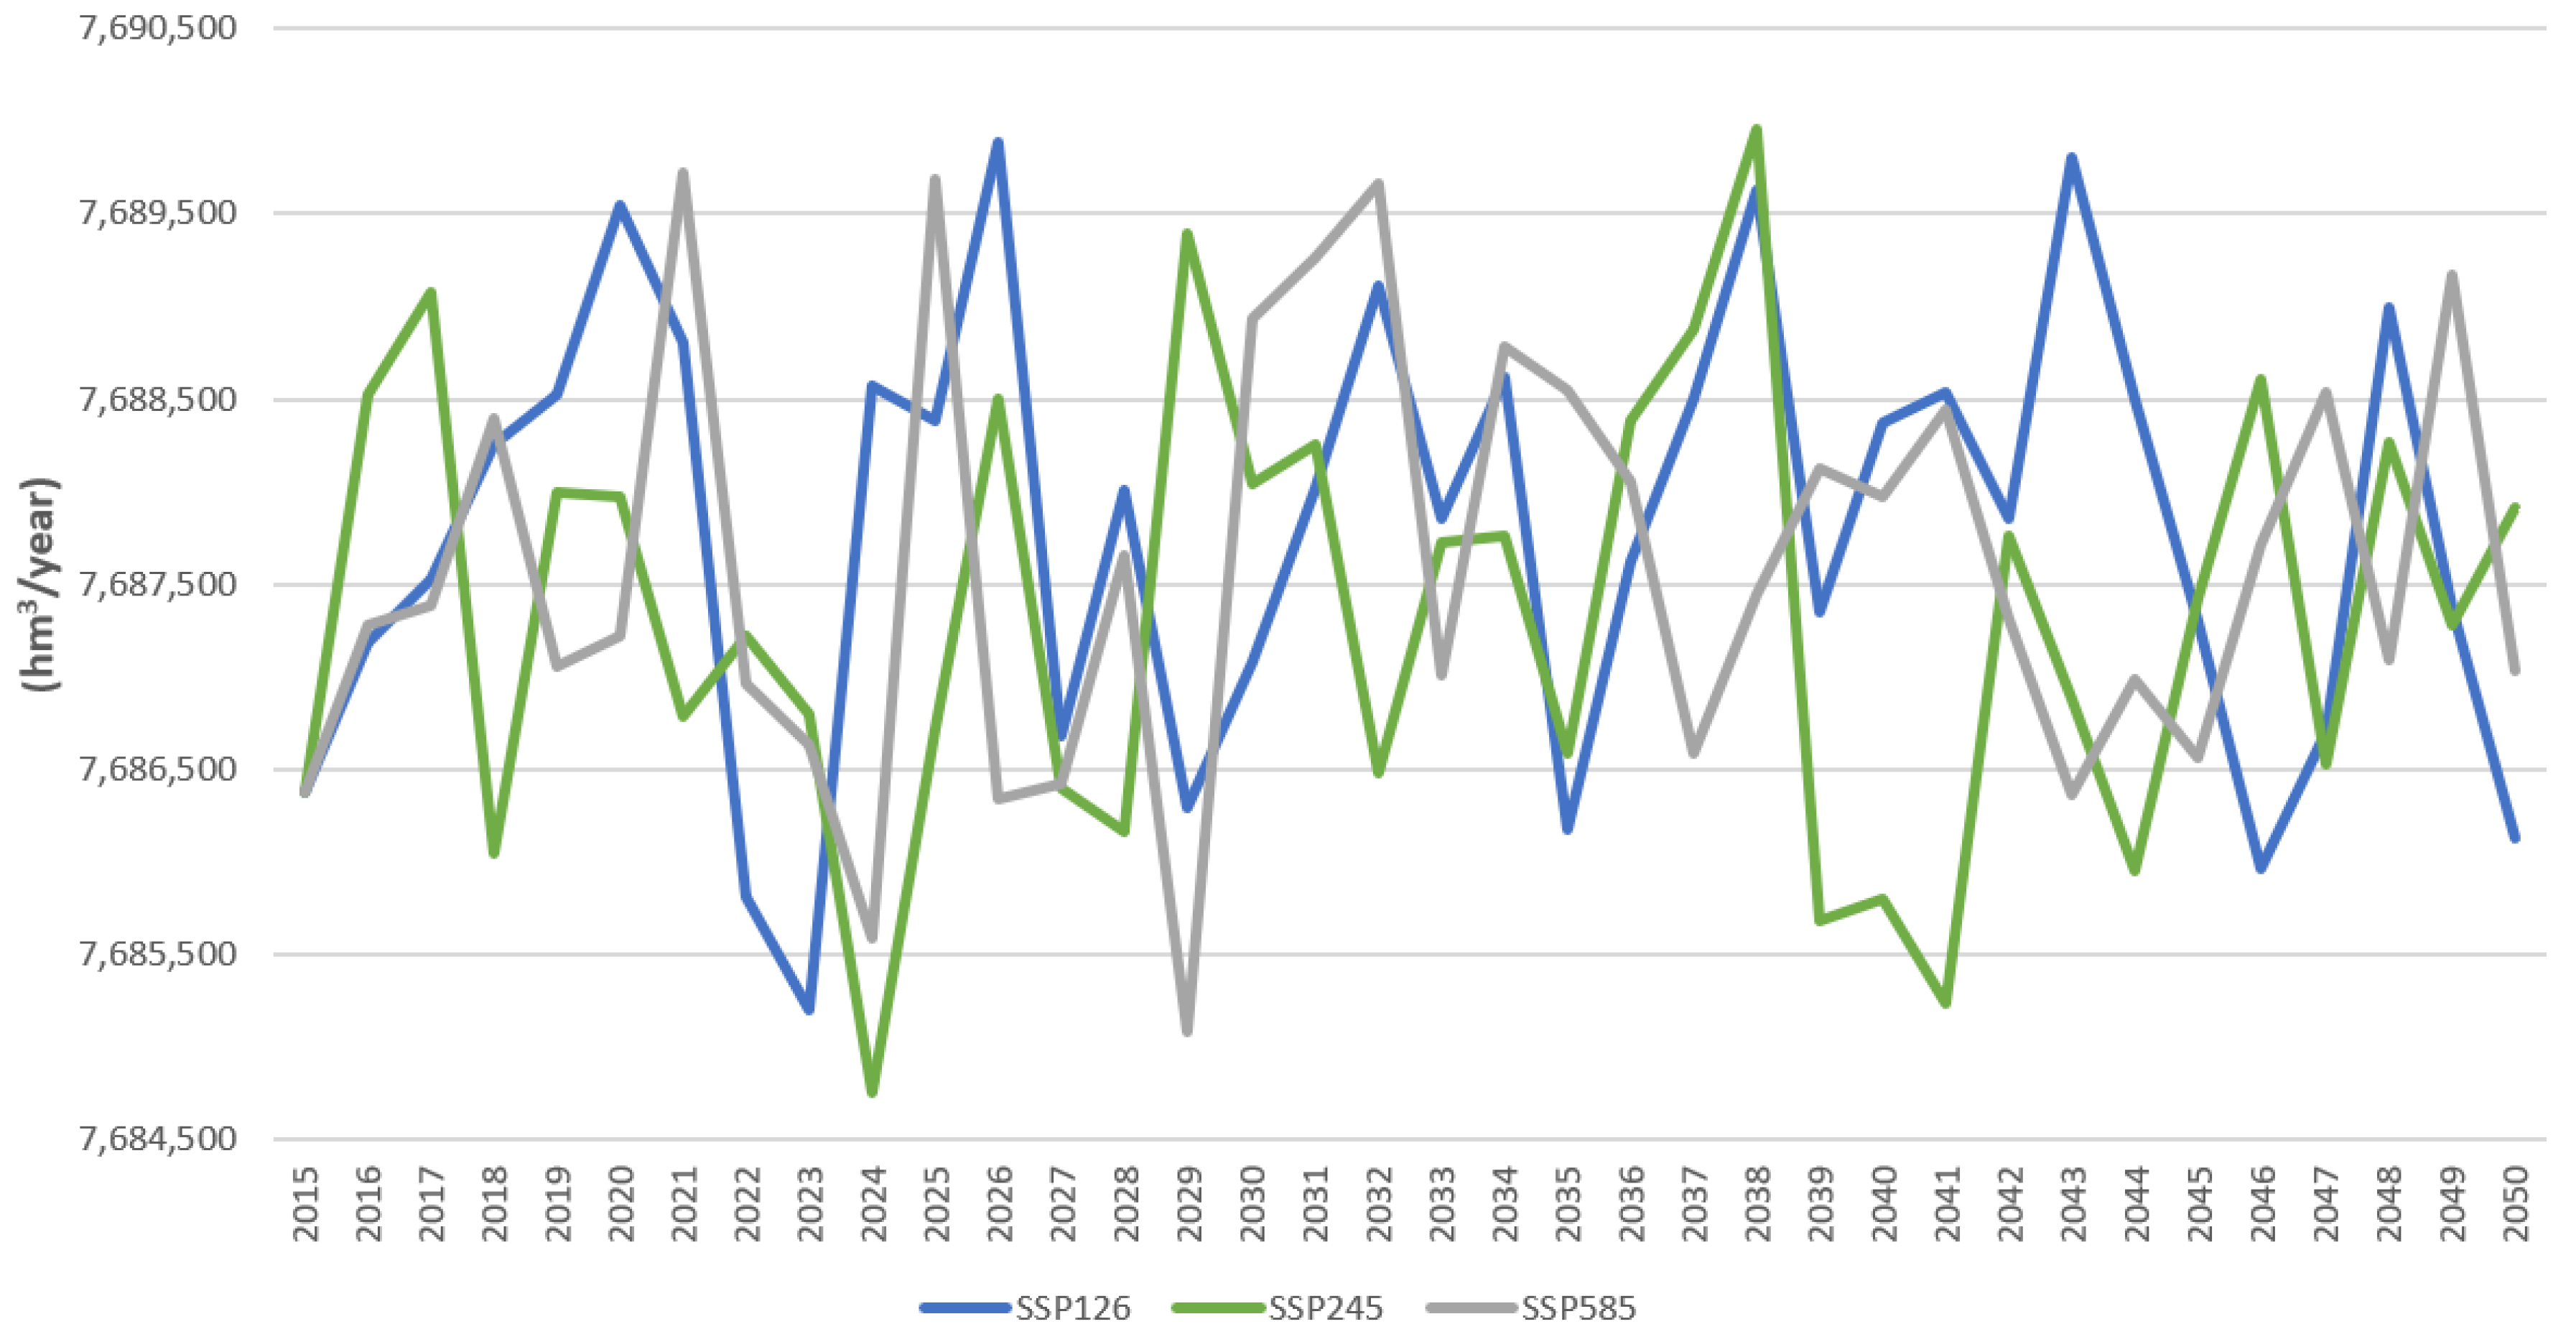
Long-term river discharges to the Aral Sea from the Amu Darya and Syr Darya have been modelled following different integrated SSP/RCP scenarios (Figure 18 and Figure 19). The model projections reveal a significant contrast between the historical variability of river discharges into the Aral Sea and the relative stability anticipated under future climate scenarios. From 1985 to 2020, annual inflows showed large fluctuations, particularly from the Syr Darya, reflecting major hydrological disturbances. In contrast, projected discharges for the period 2020–2050 remain within a relatively narrow range across the three climate scenarios (Figure A). Specifically, the Syr Darya discharge into the Aral Sea is expected to fluctuate between approximately 38,100 and 43,100 hm3/year (Figure 18b), suggesting enhanced stability compared to past decades. The Amu Darya, with an average projected discharge of around 7650 hm3/year (Figure 18a), shows both a smaller volume and reduced sensitivity to climatic scenarios. When combined (Figure 19), the total inflow remains between ~45,000 and 50,000 hm3/year, illustrating a compound pattern where the Syr Darya’s variability dominates but is modulated by the steadier contribution from the Amu Darya.
Historical fluctuations can be largely attributed to major changes in water management and land use policies implemented during the Soviet period. In the 1960s–1980s, a centrally planned agricultural expansion—known as the “Aral Sea Plan”—converted vast desert areas into irrigated cropland, with a heavy focus on cotton production. This shift dramatically increased water withdrawals from both rivers before they could reach the Aral Sea. It is estimated that over 90% of the total river flow was redirected for irrigation purposes during this time. Cotton, a highly water-demanding crop, became the centrepiece of this expansion. As highlighted by Qi et al. [7], the environmental collapse of the Aral Sea is directly linked to these policies, which prioritized economic output over sustainability.
This transformation was accompanied by the construction of large-scale hydraulic infrastructure, such as the Toktogul (Syr Darya) and Nurek (Amu Darya) dams, which served both irrigation and hydropower functions. While the Soviet-era integrated management allowed coordinated operation between upstream and downstream countries—facilitating water releases in summer for irrigation and energy exchanges in winter—this balance collapsed after 1991. Following the dissolution of the USSR, newly independent Central Asian republics adopted unilateral strategies to secure their national food and energy supplies, often at the expense of regional cooperation. Upstream states prioritized hydropower production and began releasing water during winter, which misaligned with the downstream irrigation needs during the summer growing season. This breakdown in coordination led to highly inefficient water use and erratic discharge regimes, resulting in years of near-zero inflow to the Aral Sea interspersed with short recovery episodes [12,21]. The post-Soviet period introduced political and institutional instability that exacerbated fluctuations in discharge volumes. For instance, national energy self-sufficiency goals altered reservoir operation rules and disrupted transboundary flow agreements. In this context, the future projections are notable for their relative smoothness. They suggest that, assuming continued or restored cooperation and more predictable climate trajectories, the hydrological input to the Aral Sea could stabilize within a narrower range. The Syr Darya remains more climate-sensitive due to its greater runoff and glacier-fed headwaters (Figure 18b), while the Amu Darya offers a smaller and more stable contribution (Figure 18a). The combined projections indicate that future inflows are unlikely to replicate the extreme interannual volatility of the historical period unless there are renewed political or institutional shocks (Figure 19). In summary, these results highlight that past inflow volatility to the Aral Sea has been largely driven by anthropogenic decisions—such as irrigation expansion, cotton-focused land use, and institutional disintegration—rather than climate alone. Future discharge patterns, as modelled, may be more resilient provided that coordinated water management mechanisms are maintained or strengthened. This underscores the critical role of governance and transboundary collaboration in ensuring sustainable water availability in the ASB, as emphasized in multiple reports [12,16,21].

4.2. Future Trends in WEF Security at the SB Level

The influence of the defined integrated SSP/RCP scenarios on WEF resource security has been examined. Water, energy, and food security are each represented on a binary scale, 0 or 1, where 0 indicates a lack of security —meaning the resource cannot meet its demand with available supply—and 1 indicates full security, where supply is sufficient to cover demand. This simplified representation supports consistent assessment across sectors. Figure 20 illustrates the WEF security outcomes in the Amu Darya and Syr Darya river basins, as well as their combined contribution to the Aral Sea.
The diagram in Figure 20 clearly shows that the Amu Darya basin achieves full security across all three sectors. Water availability, energy generation, and food production are all sustained under this scenario, reflecting the basin’s resilience and relative hydrological stability. In contrast, the Syr Darya basin exhibits a consistent lack of energy security, despite maintaining water and food security. This outcome is primarily driven by the energy-water trade-offs in upstream hydropower operations and may reflect structural dependencies on energy flows or limitations in autonomous generation capacity, as noted in historical analyses of the basin’s governance dynamics. When assessing the combined ASB, which integrates contributions from both rivers, full security is observed across all three sectors. This outcome is largely influenced by the stability of the Amu Darya’s performance, which compensates for the energy shortfall observed in the Syr Darya. This figure highlights the spatial heterogeneity of WEF outcomes under the same climate scenario and underscores the importance of basin-level integration to ensure balanced resource security across the region.

Energy Security in Syr Darya River Basin

Energy securities have been simulated with the WEF Nexus SDM, over 50 years (2020–2050), across the three scenarios at the nine SBs in the Syr Darya River basin. A single representative figure is presented for all simulations, given that the outcomes are identical for the three defined integrated scenarios (Figure 21).
In Figure 21, there are some SBs that maintain the energy security throughout the entire simulation period under all three scenarios. Those are located in Uzbekistan (SB4) and Kazakhstan (SB7 and SB8). Then, in three SBs located in Kyrgyzstan (SB1) and Kazakhstan (SB5 and SB9), the energy security fluctuates over time and is influenced by the selected integrated scenario. These SBs are characterized by arid and dry climates, leading to high energy consumption to meet irrigation and urban demands. It is important to highlight that in all three SBs and scenarios, energy security is achieved by the end of the simulation period in 2050. Finally, the energy security is not ensured in three SBs located in Kyrgyzstan (SB2), Uzbekistan (SB3), and Kazakhstan (SB6), respectively. According to the SDM, these insecurities may be attributed to the high energy demands for irrigation, as these are located regions with intensive agricultural activity as the Fergana Valley in SB3. Agriculture in these SB’s accounts for approximately 30% of total energy consumption in this SB, with 15% of that energy lost due to outdated energy and irrigation infrastructure.
These modelling results indicate that certain SBs within the Syr Darya River basin experience a lack of energy security, meaning that local energy consumption exceeds the energy generated within those areas. However, these findings should not be interpreted as absolute, since the presence of interconnected electrical grids ensures the overall energy supply. This WEF Nexus SDM does not account for transboundary energy dynamics due to the unavailability of reliable data in Central Asia. Overcoming this limitation would require further studies considering administrative perspectives beyond the current scope, along with a more detailed analysis to acquire data on regional electricity networks. Although it is well known that the region operates under the Central Asia Unified Energy System, the scarcity of data in the study region makes it challenging to find relevant GIS data, which constitutes a limitation of this WEF Nexus SDM.

4.3. Integrated Policy and Technical Recommendations for Sustainable WEF Nexus Management in the Aral Sea Basin

Based on the model results and analysis, the following technical recommendations are put forward for the ASB countries to enhance sustainable water, energy, and food management:
  • Modernize water efficiency in irrigation: Outdated irrigation infrastructure, especially in the Fergana Valley, leads to significant water and energy losses, up to 15% of energy input. Upgrading to modern systems (e.g., drip, sprinkler, efficient pumps) is essential to reduce water stress and improve agricultural efficiency. Regional cooperation among Uzbekistan, Kazakhstan, and Kyrgyzstan is recommended for infrastructure upgrades and knowledge exchange [87].
  • Sustainability harnesses HP potential: Kyrgyzstan and Tajikistan rely heavily on HP, yet vast HP and SHP resources remain untapped. UNIDO estimates an additional 33 GW potential, mostly in Tajikistan. Sustainable HP development, respecting ecological flows (as integrated in the model), should be prioritized [88].
  • Invest in diverse renewables for energy security: The Syr Darya basin suffers from energy insecurity due to HP dependence and climate sensitivity. Countries like Kyrgyzstan and Kazakhstan should expand solar, wind, and other renewables to diversify energy sources. Though the Amu Darya basin is more stable, renewable energy investment is also needed there for decarbonization. Model scenarios support this transition for reducing emissions and increasing system resilience across the ASB.
  • Shift to sustainable crops: Excessive cotton cultivation, especially during the Soviet “Aral Sea Plan”, caused major water depletion [89]. Replacing cotton with less water-intensive, climate-resilient crops like wheat or maize can improve sustainability. Kazakhstan’s grain-based agriculture shows this is feasible. All ASB countries should promote crop diversification and adopt efficient farming practices to protect water resources and ensure long-term food security [90].
A key recommendation derived from the model results is the need to strengthen and formalize transboundary agreements among CA countries to improve the sustainability of WEF Nexus management. Establishing standardized protocols for data sharing, coordinated reservoir operations, and seasonal water allocation—aligned with jointly defined sustainability indicators—could reduce inter-sectoral and inter-country trade-offs. Reviving and expanding existing frameworks, such as the Interstate Commission for Water Coordination (ICWC), while embedding Nexus principles into regional treaties, would facilitate adaptive management and enhance institutional resilience in the face of climate and socio-economic uncertainties.

5. Conclusions

This study demonstrates the relevance and applicability of System Dynamics modelling for addressing the complex interdependencies of the WEF Nexus, particularly in the transboundary context of CA. The model developed represents a significant advancement by explicitly incorporating both sectoral and spatial complexities. Its dynamic, integrated structure captures feedback loops, temporal delays, and trade-offs across sectors and among countries sharing the ASB.
A key innovation is the model’s capacity to simulate linkages not only between water and energy—through detailed representations of seasonal HP dynamics and reservoir operations—but also between water and food. Irrigation water use, a major driver of agricultural productivity and downstream availability, is explicitly included alongside other consumptive uses, allowing a more accurate reflection of system-wide pressures on shared water resources. This enables more realistic assessments of how decisions in one sector or country impact the entire region.
Crucially, the model accounts for the transboundary nature of river flows, a feature often oversimplified in previous Nexus models. By simulating upstream–downstream dynamics and inter-basin transfers, it enhances understanding of how national decisions affect regional water availability—particularly relevant in the Amu Darya and Syr Darya basins, where unilateral actions on storage, irrigation, or flow regulation have cross-border implications.
Another major strength is its spatial flexibility. Through a modular structure and the use of subscripts, the model can operate at multiple scales—from sub-basins to the entire ASB—making it suitable for both regional planning and localized assessments. This adaptability enhances its utility across diverse governance and institutional contexts.
To further strengthen the model for future policy applications, several improvements can be implemented. These include incorporating more granular and updated datasets, refining seasonal operation rules and feedback mechanisms (particularly for water–food interactions), and embedding relevant policy instruments such as cross-border agreements. The definition of key performance indicators (KPIs) reflecting water availability, agricultural output, energy reliability, and Nexus security will also be crucial to generate actionable insights.
Validation against historical data and existing studies is essential to ensure the model’s credibility. Once validated, the model can be used to simulate a range of policy scenarios, offering an evidence-based platform to assess feasibility, trade-offs, and synergies. The model’s architecture also supports replicability and transferability. With appropriate adjustments to data, structural relationships, and calibration, it can be applied to other regions facing similar WEF challenges, serving as a versatile decision-support tool.
Ultimately, this study helps fill a critical gap in both the literature and policy design: the lack of dynamic, spatially flexible, and transboundary-integrated WEF models. The model presented provides a foundational framework for more cooperative, adaptive, and evidence-based decision-making. In a context of growing resource pressures and geopolitical complexity—especially in CA—it represents a vital step toward integrated and forward-looking water governance.

Author Contributions

Conceptualization, S.P.P., R.L.F. and I.R.-D.; methodology, S.P.P. and I.R.-D.; investigation, S.P.P. and R.L.F.; validation, S.P.P. and R.L.F.; writing—original draft preparation, all authors; writing—review and editing, all authors; visualization, S.P.P. and I.R.-D.; supervision, I.R.-D.; project administration, R.L.F.; funding acquisition, R.L.F. All authors have read and agreed to the published version of the manuscript.

Funding

This research has received funding from the European Union’s Horizon 2020 research and innovation programme under grant agreement No. 101022905.

Data Availability Statement

Data will be made available upon request.

Acknowledgments

The authors would like to acknowledge the University of Natural Resources and Life Sciences, Vienna (BOKU), specifically Jan De Keyser and Daniel S. Hayes, for their valuable support in reviewing and discussing the results, as well as for providing the sustainable and remaining HP potential mentioned in this study..

Conflicts of Interest

The authors declare no conflicts of interest. The funders had no role in the design of the study; in the collection, analyses, or interpretation of data; in the writing of the manuscript; or in the decision to publish the results.

Abbreviations

The following abbreviations are used in this manuscript:
ADAmu Darya
ASBAral Sea Basin
CACentral Asia
CCSCarbon Capture and Storage
DmnlDimensionless
GHGGreenhouse Gas
GISGeographic Information System
GWhGigawatt hour
hm3Cubic hectometres
HPHydropower
kmKilometres
KPIKey Performance Indicator
QGISQuantum Geographic Information System
MAEMean Absolute Error
RCPRepresentative Concentration Pathways
RESRenewable Energy Sources
SBSub-basin
SDSyr Darya
SDGSustainable Development Goals
SDMSystem Dynamics Model
SHPSmall Hydropower
SSPShared Socioeconomic Pathways
TEPTotal Energy Production
TESTotal Energy Supply
TFCTotal Final Consumption
tonTonnes
WEFWater-Energy-Food Nexus

Appendix A. Main Mathematical Relationships

Appendix A.1. Water Subsystem

Deficit = Evaporation from storage + Water demand − Storage outputs; Units: hm3.
Evaporation = (IF THEN ELSE (Time ≤ Historical year, Evaporation data (Time), Rainfall volume data × Evaporation rate)) × Total basin area; Units: hm3.
Evaporation from storage = (IF THEN ELSE (Time ≤ Historical year, Storage water evaporation data (Time), Storage water evaporation rate × Rainfall volume data)) × Water storage area; Units: hm3.
Groundwater consumption = DELAY1 (Deficit + (Water demand × 0.3) × Groundwater management function, 10); Units: hm3.
Groundwater inputs = IF THEN ELSE ((Infiltration + (Runoff × 0.5) + (Surface water × 0.02) + Water return from irrigation) < Total aquifer capacity, Infiltration + (Runoff × 0.5) + (Surface water × 0.02) + Water return from irrigation), Total aquifer capacity); Units: hm3.
Groundwater management function (The function includes a lookup) = Ratio groundwater aquifer; Units: Dmnl.
Groundwater resources (It is a level type variable) = ∫ ((Groundwater resources − Groundwater consumption) > 0, Groundwater inputs − Groundwater consumption, 0); Units: hm3.
Infiltration = (IF THEN ELSE (Time ≤ Historical year, Infiltration data (Time), Infiltration rate × Rainfall volume data)) × Total basin area; Units: hm3.
Interception = (Interception rate × (Rainfall/Total basin area)) × Forest area; Units: hm3.
Outflow Amu Darya = IF THEN ELSE ((Surface water [ADSBn] − Water demand [ADSBn] + Outflow [ADSBn−1]) ≥ 0, Surface water [ADSBn] − Water demand [ADSBn] – Outflow [ADSBn−1], 0); Units: hm3.
Outflow Syr Darya = IF THEN ELSE ((Surface water [SDSBn] − Water demand [SDSBn] – Outflow [SDSBn−1]) ≥ 0, Surface water [SDSBn] − Water demand [SDSBn] – Outflow [SDSBn−1], 0); Units: hm3. Rainfall = (IF THEN ELSE (Time ≤ Historical year, Rainfall value (Time), Rainfall volume data)) × Total basin area; Units: hm3.
Ratio groundwater aquifer = zidz (Groundwater resources, Total aquifer capacity); Units: Dmnl.
Ratio water reservoir = zidz (Water storage, Total reservoir capacity); Units: Dmnl.
Reservoir management function (The function includes a lookup) = Ratio of water reservoir; Units: Dmnl.
River flow = (IF THEN ELSE (Time ≤ Historical year, SMOOTH (Flow data (Time), 5), Projected flow)); Units: hm3.
Runoff = (IF THEN ELSE (Time ≤ Historical year, Runoff data (Time), Runoff rate × Rainfall volume data)) × Total basin area; Units: hm3.
Storage = IF THEN ELSE (Time ≤ Historical year, Storage data (Time), Rainfall × Storage rate); Units: hm3.
Storage inputs = IF THEN ELSE (Storage > Total reservoir capacity, Total reservoir capacity, storage); Units: hm3.
Storage outputs = Evaporation from storage + Water demand × Reservoir management function; Units: hm3.
Surface water = IF THEN ELSE (((−Runoff × 0.5) + Water return + Storage + River flow) > 0, (−Runoff × 0.5) + Water return + Storage + River flow, 0); Units: hm3.
Surface water consumption = 0.7 × Water demand; Units: hm3.
Water demand = Food demand for water + Industrial demand for water + Urban demand for water + Water losses; Units: hm3.
Water losses = Evaporation + Groundwater resources + Infiltration + Interception + Water storage; Units: hm3.
Water resources = IF THEN ELSE ((Rainfall − Evaporation − Infiltration − Interception − Runoff) > 0, Rainfall − Evaporation − Infiltration − Interception − Runoff, 0); Units: hm3.
Water return = Water demand × Water return rate; Units: hm3.
Water return from irrigation = Agricultura demand for water × Return rate from agriculture; Units: hm3.
Water security (Water security is defined as 0 and 1, 0 if it does not have enough water resources to meet the demand and 1 otherwise) = IF THEN ELSE ((Water supply/Water demand) ≥ 1, 1, 0); Units: Dmnl.
Water storage (It is a level type variable) = ∫ ((Storage inputs − Storage outputs) > 0, Storage inputs − Storage outputs, 0); Units: hm3.
Water storage for HP production = (TEP hydropower × Water consumed by hydropower plants); Units: hm3.
Water supply = (Surface water × Surface water supply rate) + Groundwater inputs); Units: hm3.

Appendix A.2. Energy Subsystem

Active hours per year = Share of active hours of the power plants × Hours per year; Units: hours/year.
Decommissioned HP capacity = HP installed capacity × Decommissioning HP capacity rate; Units: GWh.
Decommissioned SHP capacity = SHP installed capacity × Decommissioning SHP capacity rate; Units: GWh.
Energy balance = ((Losses A slope + Total energy final consumption)/(1 − Losses B ordered at origin)) − Total energy production; Units: GWh.
Energy losses = IF THEN ELSE (((Losses A slope − (Losses B ordered at origin × Total energy supply)) > 0, (Losses A slope − Losses B ordered at origin) × Total energy supply, 0); Units: GWh.
Energy security (Energy security is defined as 0 and 1, 0 if it does not have enough TES to meet the TFC and 1 otherwise) = IF THEN ELSE ((Total energy supply/Total energy final consumption) ≥ 1, 1, 0); Units: Dmnl.
GHG emissions = GHG factor data × TEP fossil energy sources; Units: kg CO2/GWh.
HP installed potential (It is a level type variable) = ∫ (Hydropower − Decommissioned HP capacity); Units: GWh.
HP installed potential in 2022 = IF THEN ELSE (Time = 2022, (HP installed capacity in 2022 data × Active hours per year) × Units change MWh to GWh, 0); Units: GWh.
HP sustainable and remaining potential = IF THEN ELSE (Time ≤ Historical year, 0, (((HP and SHP sustainable and remaining capacity data − SHP sustainable and remaining capacity data) × Active hours per year) × Units change MWh to GWh) + HP potential in 2022); Units: GWh.
Hydropower = New HP potential; Units: GWh.
New HP potential = IF THEN ELSE (HP potential > HP sustainable and remaining potential, 0, HP potential); Units: GWh.
New SHP potential = IF THEN ELSE (SHP potential > SHP sustainable and remaining potential, 0, SHP potential); Units: GWh.
SHP installed potential (It is a level type variable) = ∫(Small hydropower − Decommissioned SHP capacity); Units: GWh.
SHP potential in 2022 = IF THEN ELSE (Time = 2022, (SHP installed capacity in 2022 data × Active hours per year) × Units change MWh to GWh, 0); Units: GWh.
SHP sustainable and remaining potential = IF THEN ELSE (Time ≤ Historical year, 0, ((SHP sustainable and remaining capacity data × Active hours per year) × Units change MWh to GWh); Units: GWh.
Small hydropower = New SHP potential; Units: GWh.
TEP fossil energy sources = TEP coal + TEP crude oil + TEP natural gas; Units: GWh.
TEP hydro = TEP hydropower + TEP small hydropower; Units: GWh.
TEP hydropower = IF THEN ELSE (HP installed potential < HP sustainable and remaining potential, HP installed potential, HP sustainable and remaining potential); Units: GWh.
TEP renewable energy sources = TEP biofuels and waste + TEP wind and solar; Units: GWh.
TEP small hydropower = IF THEN ELSE (SHP installed potential < SHP sustainable and remaining potential, SHP installed potential, SHP sustainable and remaining potential); Units: GWh.
Total energy final consumption = TFC agriculture + TFC commercial and public services + TFC industry + TFC non-energy use + TFC non-specified + TFC transport + TFC urban; Units: GWh.
Total energy production = TEP fossil energy sources + TEP hydro + TEP renewable energy sources; Units: GWh.
Total energy supply = Total energy production + Energy balance; Units: GWh.

Appendix A.3. Food Subsystem

Agricultural demand for water = Intensity of water consumption in agriculture − Rainfall in the irrigated area; Units: hm3.
Agricultural performance = Area under cultivation × Agricultural performance according to crop pattern; Units: ton.
Agriculture exports = Demand of agriculture exports × Share of agriculture exports; Units: ton.
Agriculture food resources = IF THEN ELSE (Agriculture food resources < Agriculture supply, Agriculture supply, Max agriculture performance); Units: ton.
Agriculture imports = Demand of agriculture products × Share of agriculture imports; Units: ton.
Agriculture supply = Agricultural performance; Units: ton.
Amount of livestock and poultry consumption = Total weight of livestock and poultry × Meet performance per head of livestock and poultry; Units: ton.
Area under cultivation = Irrigated area + Rainfed area; Units: km2.
Demand of agriculture products = Population × Per capita agriculture consumption; Units: ton.
Demand of livestock and poultry products = Population × Per capita livestock and poultry consumption; Units: ton.
Farming demand for water = Livestock and poultry demand for water; Units: hm3.
Food demand = (Population × Per capita food consumption) + Food exports; Units: ton.
Food demand for water = Agricultural demand for water + Farming demand for water + Fisheries demand for water + Water losses in irrigation infrastructure; Units: hm3.
Food exports = Agriculture exports + Livestock and poultry exports; Units: ton.
Food imports = Agriculture imports + Livestock and poultry imports; Units: ton.
Food resources (It is a level type variable) = ∫(Food supply − Food demand; Units: ton.
Food security (Food security is defined as 0 and 1, 0 if it does not have enough food supply to meet the demand and 1 otherwise) = IF THEN ELSE ((Food supply/Food demand) ≥ 1, 1, 0); Units: Dmnl.
Food supply = Agriculture food resources + Livestock and poultry food resources + Food Imports; Units: ton.
Food surplus = IF THEN ELSE (Food supply > Food demand, Food supply − Food demand, 0); Units: ton.
Intensity of water consumption in agriculture = Irrigated area × Water consumption according to crop pattern; Units: hm3.
Irrigation technology = Localized irrigation area × Localized irrigation water consumption + Spate irrigation area × Spate irrigation water consumption + Sprinkler irrigation area × Sprinkler irrigation water consumption + Surface irrigation area × Surface irrigation water consumption; Units: hm3.
Livestock and poultry demand for water = Heads of livestock and poultry × Water consumption of a livestock and poultry; Units: hm3.
Livestock and poultry exports = Demand of livestock and poultry products × Share of livestock and poultry exports; Units: ton.
Livestock and poultry food resources = IF THEN ELSE (Livestock and poultry supply ≤ Max amount for livestock and poultry consumption, Livestock and poultry supply, Max amount for livestock and poultry consumption); Units: ton.
Livestock and poultry imports = Demand of livestock and poultry products × Share of livestock and poultry imports; Units: ton.
Livestock and poultry supply = Amount of livestock and poultry consumption; Units: ton.
Max agricultural performance = Agricultural performance × Max area under cultivation; Units: ton.
Max area under cultivation = Area under cultivation + (0.2 × Area under cultivation); Units: km2.
Max total weight of livestock and poultry = Average weight of livestock and poultry data × Max number of heads data; Units: ton.
Per capita food consumption = Per capita agriculture consumption × Per capita livestock and poultry consumption; Units: ton/habitant.
Rainfall in the irrigated area = (Rainfall/Total basin area) × Irrigated area; Unit: hm3.
Total weight of livestock and poultry = Heads of livestock and poultry × Average weight of livestock and poultry data; Units: ton.
Water losses in irrigation infrastructure = Agricultural demand for water × Water losses in irrigation infrastructure data; Unit: hm3.

References

  1. Varis, O.; Kummu, M. The Major Central Asian River Basins: An Assessment of Vulnerability. Int. J. Water Resour. 2012, 28, 433–452. [Google Scholar] [CrossRef]
  2. Bank, E.D. Regulation of the Water and Energy Complex of Central Asia Reports and Working Papers 22/4. Available online: https://eabr.org/upload/iblock/43a/EDB_2022_Report-4_Water-and-Energy-Complex-of-CA_eng.pdf (accessed on 9 April 2025).
  3. Zhang, M.; Chen, Y.; Shen, Y.; Li, B. Tracking climate change in Central Asia through temperature and precipitation extremes. J. Geogr. Sci. 2019, 29, 3–28. [Google Scholar] [CrossRef]
  4. Touge, Y.; Kobayashi, G.; Khujanazarov, T.; Tanaka, K. Reproduction of historical water balance in the Aral Sea Basin: The physically-based framework to quantify water consumption components in endorheic lake. J. Hydrol. 2024, 640, 131711. [Google Scholar] [CrossRef]
  5. Şamlı, E. Problems of Water Management in Post-Soviet Central Asia. Mater’s Thesis, Social Sciences of Middle East Technical Univesity, Ankara, Turkey, 2017. [Google Scholar]
  6. The Aral Sea Crisis: Environmental Impacts. Available online: https://www.columbia.edu/~tmt2120/environmental%20impacts.htm (accessed on 27 March 2025).
  7. Qi, J.; Evered, K.T. Environmental Problems of Central Asia and Their Economic, Social and Security Impacts. 2008. Available online: https://pdfs.semanticscholar.org/092c/f0b4233124d3d6da72543220fbe658075692.pdf (accessed on 28 March 2025).
  8. Wang, X.; Zhang, J.; Wang, S.; Ge, Y.; Duan, Z.; Sun, L.; Meadows, M.E.; Luo, Y.; Fu, B.; Chen, X.; et al. Reviving the Aral Sea: A hydro-eco-social perspective. Adv. Earth Space Sci. 2023, 11, e2023EF003657. [Google Scholar] [CrossRef]
  9. Janobiddinov, A. The Shrinking of the Aral Sea: A Cascading Environmental Disaster. 2024. Available online: https://www.geopoliticalmonitor.com/shrinking-aral-sea-an-invisible-environmental-crisis/ (accessed on 28 March 2025).
  10. Ganguly, A. The Future of Water Management in Central Asia. 2014. Available online: https://www.idsa.in/wp-content/uploads/2024/05/IB-Anusua-Ganguly-02-May-2024.pdf (accessed on 27 March 2025).
  11. Anchita; Zhupankhan, A.; Khaibullina, Z.; Kabiyev, Y.; Persson, K.M.; Tussupova, K. Health impact of drying Aral Sea: One health and socio-economical approach. Water 2021, 13, 3196. [Google Scholar] [CrossRef]
  12. Saidmamatov, O.; Rudenko, I.; Pfister, S.; Koziel, J. Water-energy-food nexus framework for promoting regional integration in Central Asia. Water 2020, 12, 1896. [Google Scholar] [CrossRef]
  13. Mayar, M.A.; Hamidov, A.; Akramkhanov, A.; Helming, K. Consideration of the environment in water-energy-food nexus research in the Aral Sea Basin. Water 2024, 16, 658. [Google Scholar] [CrossRef]
  14. Kaddoura, S.; Khatib, S.E. Review of water-energy-food nexus tools to improve the nexus modelling approach for integrated policy making. Environ. Sci. Policy 2017, 77, 114–121. [Google Scholar] [CrossRef]
  15. Dankova, R.; Burton, M.; Salman, M.; Clark, A.K.; Pek, E. Modernizing Irrigation in Central Asia: Concept and Approaches; Directions in Investment; FAO: Rome, Italy, 2022. [Google Scholar]
  16. Granit, J.; Jägerskog, A.; Lindström, A.; Björklund, G.; Bullock, A.; Löfgren, R.; de Gooijer, G.; Pettigrew, S. Regional Options for Addressing the Water, Energy and Food Nexus in Central Asia and the Aral Sea Basin. Int. J. Water Resour. Dev. 2012, 28, 419–432. [Google Scholar] [CrossRef]
  17. Bernauer, T.; Siegfried, T. Climate change and international water conflict in Central Asia. J. Peace Res. 2012, 49, 227–239. Available online: https://journals.sagepub.com/doi/abs/10.1177/0022343311425843 (accessed on 13 June 2025). [CrossRef]
  18. Jalilov, S.-M.; Keskinen, M.; Varis, O.; Amer, S.; Ward, F.A. Managing the water-energy-food nexus: Gains and losses form new water development in Amu Darya river basin. J. Hydrol. 2016, 539, 648–661. [Google Scholar] [CrossRef]
  19. Jalilov, S.M.; Amer, S.A.; Ward, F.A. Water, food, and energy security: An exclusive search for balance in Central Asia. Water Resour. Manag. 2013, 27, 3959–3979. [Google Scholar] [CrossRef]
  20. Jalilov, S.-M.; Amer, S.A.; Ward, F.A. Managing the water-energy-food nexus: Opportunities in Central Asia. J. Hydrol. 2018, 557, 407–425. [Google Scholar] [CrossRef]
  21. Keskinen, M.; Guillaume, J.H.A.; Kattelus, M.; Porkka, M.; Räsänen, T.A.; Varis, O. The Water-Energy-Food nexus and the trans-boundary context: Insights from large Asian rivers. Water 2016, 8, 193. [Google Scholar] [CrossRef]
  22. González-Rosell, A.; Blanco, M.; Arfa, I. Integrating stakeholder views and system dynamics to assess the Water-Energy-Food Nexus in Andalusia. Water 2020, 12, 3172. [Google Scholar] [CrossRef]
  23. Wang, X.; Dong, Z.; Sušnik, J. System dynamics modelling to simulate regional water-energy-food nexus combined with the society-economy-environment system in Hunan Province, China. Sci. Total Environ. 2023, 863, 160993. [Google Scholar] [CrossRef]
  24. Keyhanpour, M.J.; Jahromi, S.H.M.; Ebrahimi, H. System dynamics model of sustainable water resources management using the nexus water-food-energy approach. Ain Shams Eng. J. 2021, 12, 1267–1281. [Google Scholar] [CrossRef]
  25. Bakhshianlamouki, E.; Masia, S.; Karimi, P.; van der Zaag, P.; Sušnik, J. A system dynamics model to quantify the impacts of restoration measures on the water-energy-food nexus in the Urmia lake Basin, Iran. Sci. Total Environ. 2020, 708, 134874. [Google Scholar] [CrossRef]
  26. Zahedi, R.; Yousefi, H.; Aslani, A.; Ahmadi, R. Sustainable dynamic planning and policy implementation for water, energy and food resources. Energy Strategy Rev. 2024, 54, 101455. [Google Scholar] [CrossRef]
  27. Mostefaoui, L.; Sušnik, J.; Masia, S.; Jewitt, G. A water-energy-food nexus analysis of the impact of desalination and irrigated agriculture expansion in the Ain Temouchent region, Algeria. Environ. Dev. Sustain. 2024. [Google Scholar] [CrossRef]
  28. Javan, K.; Altaee, A.; Darestani, M.; Mirabi, M.; Azadmanesh, F.; Zhou, J.L.; Hosseini, H. Assessing the Water-Energy-Food nexus and resource sustainability in the Ardabil Plain: A system dynamics and HWA approach. Water 2023, 15, 3673. [Google Scholar] [CrossRef]
  29. Francisco, É.C.; Ignácio, P.S.d.A.; Piolli, A.L.; Poz, M.E.S.d. Food-energy-water (FEW) nexus: Sustainable food production governance through system dynamics modelling. J. Clean. Prod. 2023, 386, 135825. [Google Scholar] [CrossRef]
  30. Ravar, Z.; Zahraie, B.; Sharifinejad, A.; Gozini, H.; Jafari, S. System dynamics modeling for assessment of water-food-energy resources security and nexys in Gavkhuni basin in Iran. Ecol. Indic. 2020, 108, 105682. [Google Scholar] [CrossRef]
  31. Ling, M.; Qi, T.; Li, W.; Yu, L.; Xia, Q. Simulating and predicting the development trends of the water-energy-food-ecology system in Henan Province, China. Ecol. Indic. 2024, 158, 111513. [Google Scholar] [CrossRef]
  32. Feng, M.; Liu, P.; Li, Z.; Zhang, J.; Liu, D.; Xiong, L. Modeling the nexus across water supply, power generation and environment systems using the system dynamics approach: Hehuang Region, China. J. Hydrol. 2016, 543, 344–359. [Google Scholar] [CrossRef]
  33. White, K.D. Nature and Economy in the Aral Sea Basin. In The Aral Sea; Springer: Berlin/Heidelberg, Germany, 2014; Volume 10178, pp. 301–335. [Google Scholar]
  34. HydroSHEDS. Available online: https://www.hydrosheds.org/ (accessed on 2 April 2025).
  35. Wang, X.; Meng, X.; Long, Y. Projecting 1 km-grid population distributions from 2020 to 2100 globally under shared socioeconomic pathways. Sci. Data 2022, 9, 563. [Google Scholar] [CrossRef]
  36. Service CCC. CMIP6 Climate Projections. 2020. Available online: https://www.wdc-climate.de/ui (accessed on 12 June 2025).
  37. (FAO) FaAOOotUN. AQUASTAT Rop Water Information. Available online: https://www.fao.org/land-water/databases-and-software/crop-information (accessed on 2 April 2025).
  38. IEA. International Energy Agency. Available online: https://www.iea.org/ (accessed on 3 April 2025).
  39. GEO. Global Energy Observatory. 2018. Available online: https://globalenergyobservatory.org/list.php?db=PowerPlants&type=Hydro (accessed on 3 April 2025).
  40. De Keyser, J.; Fuentes, P.O.; Hayes, D.S.; Habersack, H. A Review of Hydropower in Central Asia: Past, Present, and Future. Renew. Sustain. Energy 2025. in review. [Google Scholar]
  41. MapSPAM. Mapspam Data Center. 2020. Available online: https://www.mapspam.info/data/ (accessed on 15 April 2025).
  42. De Keyser, J.; Hayes, D.S.; Marti, B.; Siegfried, T.; Seliger, C.; Schwedhelm, H.; Anarbekov, O.; Gafurov, Z.; López Fernández, R.M.; Ramos Diez, I.; et al. Integrating open-source datasets to analyze the transboundary water-food-energy-climate nexus in Central Asia. Water 2023, 15, 3482. [Google Scholar] [CrossRef]
  43. Walters, J.P.; Archer, D.W.; Sassenrathc, G.F.; Hendricksond, J.R.; Hansond, J.D.; Hallorane, J.M.; Vadas, P.; Alarcon, V.J. Exploring agricultural production systems and their fundamental components with system dynamics modelling. Ecol. Model. 2016, 333, 51–65. [Google Scholar] [CrossRef]
  44. Vensim. Ventana System. 2024. Available online: https://vensim.com/ (accessed on 30 May 2025).
  45. Vensim Software. Available online: https://vensim.com/software/ (accessed on 31 May 2025).
  46. Pourfallah, H.; Moshtagh, R.; Mastouri, R.M. Water resources modelling using system dynamic in Vensim. J. Water Resour. Hydraul. Enfineering 2015, 4, 251–256. [Google Scholar]
  47. Jones, L. Vensim and the development of system dynamics. In Discrete-Event Simulation and System Dynamics for Management Decision Making; Wiley: Hoboken, NJ, USA, 2014. [Google Scholar] [CrossRef]
  48. Peña-Torres, D.; Boix, M.; Montastruc, L. Multi-objective optimization and demand variation analysis on a water energy food nexus system. Comput. Chem. Eng. 2024, 180, 108473. [Google Scholar] [CrossRef]
  49. Albrecht, T.R.; Crootof, A.; Scott1, C.A. The water-energy-food nexus: A systematic review of methods for nexus assessment. Environ. Res. Lett. 2018, 13, 043002. [Google Scholar] [CrossRef]
  50. UNECE. Handbook on Water Allocation in a Transboundary Context. 2021. Available online: https://unece.org/sites/default/files/2021-12/ECE_MP.WAT_64_Handbook%20on%20water%20allocation%20in%20a%20the%20transboundary%20context.pdf (accessed on 12 June 2025).
  51. UNECE, Organizations INoB. Water and Climate Change Adaptation in Transboundary Basins: Lessons Learned and Good Practices. 2015. Available online: https://www.gwp.org/globalassets/global/toolbox/references/adaptation-in-transboundary-basins.pdf (accessed on 12 June 2025).
  52. Tebaldi, C.; Debeire, K.; Eyring, V.; Fischer, E.; Fyfe, J.; Friedlingstein, P.; Knutti, R.; Lowe, J.; O’NEill, B.; Sanderson, B.; et al. Climate model projections from the Scenario Model Intercomparasion Project (ScenarioMIP) of CMIP6. Earth Syst. Dyn. 2021, 12, 253–293. [Google Scholar] [CrossRef]
  53. Farjad, B.; Gaputa, A.; Sartipizadeh, H.; Cannon, A.J. A novel approach for selecting extreme climate change scenarios for climate change impact studies. Sci. Total Environ. 2019, 678, 476–485. [Google Scholar] [CrossRef]
  54. NGFS. Guide to Climate Scenario Analysis for Central Banks and Supervisors. 2020. Available online: https://www.ngfs.net/system/files/import/ngfs/medias/documents/ngfs_guide_scenario_analysis_final.pdf (accessed on 15 May 2025).
  55. IPCC. Future Global Climate: Scenario-Based Projections and Near-Term Information. 2021. Available online: https://www.ipcc.ch/report/ar6/wg1/downloads/report/IPCC_AR6_WGI_Chapter04.pdf (accessed on 14 May 2025).
  56. Vogel, R.M.; Lall, U.; Cai, X.; Rajagopalan, B.; Weiskel, P.K.; Hooper, R.P.; Matalas, N.C. Hydrology: The interdisciplinary science of water. Water Resour. Res. 2015, 51, 4409–4430. [Google Scholar] [CrossRef]
  57. FAO. Climate-Smart Agriculture Sourcebook. 2013. Available online: https://openknowledge.fao.org/server/api/core/bitstreams/b21f2087-f398-4718-8461-b92afc82e617/content (accessed on 6 June 2025).
  58. FAO. Food and Agriculture Organization of the United Nations. Available online: https://www.fao.org/home/en (accessed on 5 June 2025).
  59. Daohan, H.; Li, G.; Sun, C.; Qian, L. Exploring interactions in the local water-energy-food nexus (WEF-Nexus) using a simultaneous equations model. Sci. Total Environ. 2020, 703, 135034. [Google Scholar]
  60. Javan, K.; Darestani, M.; Ibrar, I.; Pignatta, G. Interrelated issues within the water-energy-food nexus with a focus on environmental pollution for sustainable development: A review. Environ. Pollut. 2025, 368, 125706. [Google Scholar] [CrossRef] [PubMed]
  61. Lee, S.-H.; Choi, J.-Y.; Hur, S.-O.; Taniguchi, M.; Masuhara, N.; Kim, K.S.; Hyun, S.; Choi, E.; Sung, J.-H.; Yoo, S.-H. Food-centric interlinkages in agricultural food-energy-water nexus under climate change and irrigation management. Resour. Conserv. Recycl. 2020, 163, 105099. [Google Scholar] [CrossRef]
  62. Vensim. Vensim Subscripting. Available online: https://vensim.com/subscripting/ (accessed on 29 May 2025).
  63. Vensim. Vensim Help. Available online: https://www.vensim.com/documentation/ref_subscripts.html (accessed on 30 May 2025).
  64. World Bank Data. Available online: https://data.worldbank.org/country (accessed on 9 June 2025).
  65. Copernicus Climate Change Service—Global Impacts. Available online: https://climate.copernicus.eu/sites/default/files/2021-01/infosheet8.pdf (accessed on 10 June 2025).
  66. Jain, S.K. Downscaling Methods in Climate Change Studies. Available online: https://nihroorkee.gov.in/sites/default/files/uploadfiles/Downscaling-Climate-ChangeStudies.pdf (accessed on 30 May 2025).
  67. Essa, Y.H.; Ahrens, B. Distender: Downscaling Techniques. Available online: https://distender.eu/wp-content/uploads/2025/04/DIS_Info-Pack_03.pdf (accessed on 14 May 2025).
  68. QGIS. Available online: https://qgis.org/ (accessed on 4 June 2025).
  69. HydroBASINS. Available online: https://www.hydrosheds.org/products/hydrobasins (accessed on 3 June 2025).
  70. Barbarossa, V.; Huijbregts, M.A.J.; Beusen, A.H.W.; Beck, H.E.; King, H.; Schipper, A.M. FLO1K: Global maps of mean, maximum and minimum annual streamflow at 1 km resolution from 1960 through 2015. Sci. Data 2018, 5, 180052. [Google Scholar] [CrossRef]
  71. Rashidi, P.; Patil, S.D.; Schipper, A.M.; Alkemade, R.; Rosa, I. Downscaling global land-use scenario data to the national level: A case of study for Belgium. Land 2023, 12, 1740. [Google Scholar] [CrossRef]
  72. Ghorbanpour, A.K.; Hessels, T.; Moghim, S.; Afshar, A. Comparison and assessment of spatial downscaling methods for enhancing the accuracy of satellite-based precipitation over Lake Urmia Basin. J. Hydrol. 2021, 596, 126055. [Google Scholar] [CrossRef]
  73. Helfrich, N.D.; Schade, W. Bringing Distributed Software Development to SD Modelling with Vensim. 2008. Available online: https://proceedings.systemdynamics.org/2008/proceed/papers/HELFR324.pdf (accessed on 8 May 2025).
  74. Neuwirth, C. System dynamics simulation for data-intensive applications. Environ. Model. Softw. 2017, 96, 140–145. [Google Scholar] [CrossRef]
  75. Momblanch, A.; Papadimitriou, L.; Jain, S.K.; Kulkarni, A.; Ojha, C.S.; Adeloye, A.J.; Holman, I.P. Untangling the wa-ter-food-energy-environment nexus for global change adaptation in a complex Himalayan water resource system. Sci. Total Environ. 2019, 655, 35–47. [Google Scholar] [CrossRef]
  76. Marques, A.C.; Veras, C.E.; Rodrigez, D.A. Assessment of water policies contributions for sustainable water resources managment under climate change scenarios. J. Hydrol. 2022, 608, 127690. [Google Scholar] [CrossRef]
  77. Azimov, U.; Avezova, N. Sustainable small-scale hydropower solutions in Central Asian countries for local and cross-border energy/water supply. Renew. Sustain. Energy Rev. 2022, 167, 112726. [Google Scholar] [CrossRef]
  78. Lei, H.; Li, H.; Hu, W. Enhancing the streamflow simulation of a process-based hydrological model using machine learning and multi-source data. Ecol. Inform. 2024, 82, 102755. [Google Scholar] [CrossRef]
  79. Hariram, N.P.; Mekha, K.B.; Suganthan, V.; Sudhakar, K. Sustainalism: An integrated socio-economic-environmental model to address sustainable development and sustainability. Sustainability 2023, 15, 10682. [Google Scholar] [CrossRef]
  80. Frame, B.; Lawrence, J.; Ausseil, A.G.; Reisinger, A.; Daigneault, A. Adapting global shared socio-economic pathways for national and local scenarios. Clim. Risk Manag. 2018, 21, 39–51. [Google Scholar] [CrossRef]
  81. Gütschow, J.; Jeffery, M.L.; Günther, A.; Meinshausen, M. Country-Resolved Combined Emission and Socio-Economic Pathways Based on Representative Concentration Pathway (RCP) and Shared Socio-Economy Pathway (SSP) Scenarios. 2021. Available online: https://essd.copernicus.org/articles/13/1005/2021/essd-13-1005-2021.pdf (accessed on 30 May 2025).
  82. EcoCommons. SDMs and Climate Change Projections. 2022. Available online: https://support.ecocommons.org.au/support/solutions/articles/6000162177-sdms-and-climate-change-projections (accessed on 29 May 2025).
  83. Visconti, P.; Bakkenes, M.; Baisero, D.; Brooks, T.; Butchart, S.H.M.; Joppa, L.; Alkemade, R.; Di Marco, M.; Santini, L.; Hoffmann, M.; et al. Projecting global biodoversity indicators under future development scenarios. J. Soc. Conserv. Biol. 2015, 9, 5–13. [Google Scholar]
  84. Yupanqui, C.; Dias, N.; Goodarzi, M.R.; Sharma, S.; Vagheei, H.; Mohtar, R. A review of water-energy-food nexus frameworks, models, challenges and future opportunities to create an integrated, national security-based development. Energy Nexus 2025, 18, 100409. [Google Scholar] [CrossRef]
  85. Kehl, J.R. Hydropolitical complexes and asymmetrical power: Conflict, cooperation, and governance of international global river systems. J. World-Syst. Res. 2011, 17, 218–235. [Google Scholar] [CrossRef]
  86. CAWATER. Database of the Aral Sea Basin. 2024. Available online: http://www.cawater-info.net/aral/data/index_e.htm (accessed on 5 June 2025).
  87. Ibragimov, M. Uzbekistan to Modernize Its Irrigation Infrastructure with World Bank Support. 2025. Available online: https://www.worldbank.org/en/news/press-release/2025/05/21/uzbekistan-to-modernize-its-irrigation-infrastructure-with-world-bank-support (accessed on 10 June 2025).
  88. UNIDO. World Small Hydropower Development Report; United Nations Industrial Development Organization and the In-ternational Center on Small Hydro Power: 2022. Available online: https://www.unido.org/WSHPDR2022 (accessed on 10 June 2025).
  89. FAO. Managing landscapes for Climate-Smart Agriculture systems. Scenario thinking and the water-energy-food nexus in Central Asia. In Climate Smart Agriculture Sourcebook; FAO: Rome, Italy, 2025. [Google Scholar]
  90. Rustamova, I.; Primov, A.; Karimov, A.; Khaitov, B.; Karimov, A. Crop diversification in the Aral Sea Region: Long-term situation analysis. Sustainability 2023, 15, 10221. [Google Scholar] [CrossRef]
Figure 1. Overview of Central Asia region, the Aral Sea Basin (red line), Syr Darya River Basin (brown line), Amu Darya River Basin (black line) and the spatial distribution of annual agricultural water consumption (green). Source: own elaboration.
Water 17 02270 g001
Figure 2. Steps for the development of the WEF Nexus SDM.
Water 17 02270 g002
Figure 3. SBs included in the study among the ASB, including the drainage network. The red line indicates the extent of the ASB. Source: own elaboration. Disclaimer: As the maps used in this figure are sourced from open access datasets, the representation of the Aral Sea does not accurately reflect its current size or condition. Source: Own elaboration.
Water 17 02270 g003
Figure 4. Conceptual model of the WEF main relationships, as well as with Hydropower (HP) and Small Hydropower (SHP), and key variables of each subsystem of the SDM. Source: own elaboration.
Water 17 02270 g004
Figure 5. Causal loop diagram for the interlinkages of the WEF Nexus SDM.
Water 17 02270 g005
Figure 6. Flow directions of the Amu Darya’s SBs: from upstream (left) to downstream SBs (right).
Water 17 02270 g006
Figure 7. Flow directions of the Syr Darya’s SBs: from upstream (left) to downstream SBs (right).
Water 17 02270 g007
Figure 13. Comparison of simulated and observed total river discharge to the Aral Sea during the calibration (1992–2014) and validation (2015–2023) periods.
Water 17 02270 g013
Figure 14. Comparison between simulated and observed Syr Darya River discharge to the Aral Sea during the calibration (1992–2014) and validation (2015–2023) periods.
Water 17 02270 g014
Figure 15. Comparison between simulated and observed Amu Darya River discharge to the Aral Sea during the calibration (1992–2014) and validation (2015–2023) periods.
Water 17 02270 g015
Figure 16. Validation of the energy balance in the Amu Darya and Syr Darya river basins.
Water 17 02270 g016
Figure 17. Validation of the agricultural demand for water in the Amu Darya and Syr Darya river basins.
Water 17 02270 g017
Figure 18. Impact of integrated scenarios on (a) Amu Darya and (b) Syr Darya discharge to the Aral Sea.
Water 17 02270 g018
Figure 19. Impact of integrated scenarios on total river discharge to the Aral Sea.
Water 17 02270 g019
Figure 20. WFE securities under three integrated scenarios in the ASB.
Water 17 02270 g020
Figure 21. Energy security in the Syr Darya river basin for all integrated scenarios. Source: Own elaboration.
Water 17 02270 g021
Table 1. Baseline WEF Nexus key parameters in the Aral Sea Basin in 2022.
Key Parameter *Syr DaryaAmu DaryaAral Sea Basin
Area (km2) [34] 320,106466,422786,528
Population (mill. inhab.) [35]26.8630.5157.37
Rainfall (hm3) [36]202,307284,284486,591
Per capita water consumption (hm3/inhab.) [37]1.32 × 10−31.39 × 10−31.36 × 10⁻³
Per capita energy consumption (GWh/inhab.) [38].4.01.82.9
HP installed capacity (MW) [39]5097548010,576
SHP installed capacity (MW) [39]8979168
HP sustainable and remaining capacity (MW) [40]11,71816,41228,130
SHP sustainable and remaining capacity (MW) [40]91015182428
Rainfed area (km2) [41]27,67628,44056,115
Irrigated area (km2) [41] 31,44342,31773,760
* Note: The data comprising the table were obtained from open-source GIS databases. These parameters were employed in the application of the downscaling methodologies described in Section 2.5.1. There may be discrepancies with other published papers due to the processing of the data (open data sources and QGIS have been used for processing).
Table 2. Variables of the WEF Nexus SDM.
SubsystemN. of Stock VariablesN. of Flow VariablesRest of Variables
Water24129
Energy2482
Food1273
Others--231
Total510515
Disclaimer/Publisher’s Note: The statements, opinions and data contained in all publications are solely those of the individual author(s) and contributor(s) and not of MDPI and/or the editor(s). MDPI and/or the editor(s) disclaim responsibility for any injury to people or property resulting from any ideas, methods, instructions or products referred to in the content.