Article

Differentiated Optimization Policies for Water–Energy–Food Resilience Security: Empirical Evidence Based on Shanxi Province and the GWR Model

by
Ruopeng Huang
* and
Yue Han
School of Economics and Management, Taiyuan Normal University, Jinzhong 030619, China
*
Author to whom correspondence should be addressed.
Water 2025, 17(10), 1540; https://doi.org/10.3390/w17101540
Submission received: 2 April 2025 / Revised: 17 May 2025 / Accepted: 19 May 2025 / Published: 20 May 2025

Abstract

:
Shanxi Province, a key energy base and water source in China, has long borne the responsibility of supplying external resources. Ensuring the security of its water–energy–food (WEF) resilience has remained a persistent challenge for local authorities. Conventional WEF nexus optimization policies often overlook the heterogeneity of influencing factors arising from geographic variability, leading to generalized approaches that lack precision and efficiency in resource governance. To address these limitations, this study employed the Moran’s I index, exploratory regression analysis, and the geographically weighted regression (GWR) model to investigate the spatial patterns of factors influencing WEF resilience across 11 cities in Shanxi Province from 2014 to 2023. Based on these analyses, the study proposes targeted policy recommendations that account for regional heterogeneity and prioritize differentiated strategies, thereby avoiding the pitfalls of a one-size-fits-all framework. This tailored approach aims to support Shanxi in managing the enduring pressures of external resource supply. The main findings are as follows: (1) WEF resilience in Shanxi exhibited significant spatial autocorrelation, with Moran’s I values ranging from 0.013 to 0.043, confirming the influence of spatial geographic factors on the studied variables and supporting the applicability of the GWR model; (2) key factors influencing WEF resilience included population density, technological innovation, industrial structure, and resource mismatch, with effect sizes ranging from −0.90 to −0.48, 0.68 to 1.01, 0.43 to 0.79, and −0.45 to −0.22, respectively; (3) drawing on the spatially variable impact of these factors, the study offers optimization strategies that emphasize regional specificity and multi-policy prioritization to enhance WEF resilience across Shanxi Province.

1. Introduction

Water, energy, and food are the basic and strategic resources on which human beings depend for their survival and social development, and there are many complex interrelationships and mutual feedback among the three in the processes of production, consumption, and management. Since the conceptual framework of the water–energy–food system (i.e., the WEF nexus system) was first proposed at the Bonn Conference, Germany, in 2011 [1], research on the WEF nexus system has been acknowledged by academics as having an important organizing and facilitating role for global sustainable development and guaranteeing the security of water, energy, and food [2].
Contemporary academic research on the WEF nexus can be broadly categorized into three main perspectives. The first is the management perspective, which underscores the pivotal role of diverse stakeholders in the governance and integrated management of the WEF nexus system [3,4,5]. The second is the functional perspective, which focuses on the operational roles and interdependencies within the system, positioning the WEF nexus as a vital pathway for human societies to adapt to environmental changes and address resource scarcity [6,7,8,9]. This perspective complements the management view by emphasizing the security perspective, which emerged earliest and remains the most extensively applied in WEF nexus research [10]. This foundational approach highlights the imperative of enhancing the coordination among water, energy, and food resources—termed ‘coordination security’—as well as improving the internal efficiency of the system—referred to as ‘efficiency security’—to ensure the overall stability and sustainability of the WEF nexus [11,12,13,14,15,16,17]. However, as the two most common security perspectives, they do not consider the impact of internal shocks to the system when the objective environment of the WEF nexus system changes, nor do they have the ability to resist external shocks. To compensate for these two shortcomings, academics have focused on the new perspective of resilience. Specifically, Li et al. argued that increased resilience can effectively reduce the potential supply risk of these three resources [18]. Núez-López et al. proposed an optimization scheme for the resilience of the WEF nexus system based on a macroscopic perspective to meet the increasing level of resource demand [19]. Ioannou et al. emphasized that, within the broader context of global climate change, enhancing the resilience of the WEF nexus system is essential for safeguarding the security of its foundational resources [20]. Huang et al. defined WEF nexus system resilience security as the system’s capacity to maintain stable supply–demand dynamics of core resources in the face of external shocks [21]. This notion of resilience security thus centers on sustaining long-term equilibrium in the interrelationships among water, energy, and food, offering a more integrative metric for assessing the security, stability, and sustainability of the WEF nexus system. As such, resilience security holds significant academic value due to its holistic approach to resource governance under uncertainty. The conceptual framework summarizing the various research perspectives within the WEF nexus is presented in Figure 1. The red section denotes where the perspective of resilient security fits into the total WEF nexus research.
Despite its conceptual promise, research on WEF nexus resilience security is still in the early stage, and lacks sufficient empirical studies to substantiate its theoretical system, which means that there is a large research gap [22]. Existing research primarily concentrates on the conceptual definition of key terms [18,19,20,23], the quantification of relevant indicators [24], and the exploration of both internal and external influencing factors [15,21,25]. However, empirical methodologies remain underrepresented in the current literature. Given the spatial interdependence inherent in resource elements such as water, energy, and food [26], scholars frequently employ spatial analytical methods to examine their determinants [15,21,25]. Traditional spatial econometric models, however, are limited in that they capture only the potential spatial effects among neighboring regions, without accounting for the spatial heterogeneity in the magnitude and direction of these effects. This limitation results in the oversight of regional variability and challenges related to policy prioritization. To address these gaps, this study applies the geographically weighted regression model to analyze the external influencing factors, leveraging the spatial variation in regression coefficients to more accurately identify and interpret regional disparities.
With respect to the structural composition of the WEF nexus system, the more widely recognized view in the academic community is the core–peripheral structure, as shown in Figure 2.
The WEF nexus system is composed of a core system and a peripheral system, each playing distinct but interrelated roles. The core system comprises the water resources, energy, and food subsystems, encapsulating the dynamic interdependencies, correlations, and mutual feedback mechanisms among these three essential resources. In contrast, the peripheral system includes the broader social, economic, and environmental subsystems, which exert significant external influences on the WEF nexus. Environmental and climatic changes, for example, directly affect the quality and availability of water resources and the stability of food supplies [27,28,29], while factors such as economic development, technological advancement, and urbanization reshape patterns of human energy consumption and demand [30]. These external drivers interact with the internal dynamics of the WEF nexus, initiating changes within the core system that subsequently feed back into the peripheral systems, creating complex and often unpredictable long-term effects [18,31]. Given the critical role of external influences on the water–energy–food (WEF) nexus [19,32], this study aims to investigate the underlying mechanisms through which these external factors impact WEF resilience security. Furthermore, it seeks to offer empirical evidence and policy recommendations to support the optimization of WEF nexus governance within the study area.
In summary, with the goal of enhancing the relevance, rationality, and efficiency of regional resource management policymaking, this study employs the Moran index, exploratory regression analysis, and the geographically weighted regression (GWR) model to establish an empirical research framework that captures regional differences and supports multi-policy prioritization. It analyzes the spatial patterns of influencing factors on water–energy–food resilience security across cities in Shanxi Province from 2014 to 2023, serving as the basis for formulating targeted optimization policies. These strategies aim to avoid uniform approaches, improve local resource management efficiency, and support the government in addressing long-term supply pressures. On one hand, this study contributes to the diversification of empirical methodologies in analyzing external influences on WEF nexus resilience security, offering a representative case for quantifying inter-regional variations in impact. On the other hand, it introduces a novel perspective for improving the rationality and effectiveness of related resource governance strategies.

2. Research Area and Data Sources

2.1. Overview of the Research Area

China’s total consumption of water, energy, and food is the highest in the world, and it has long faced tensions between supply and demand for resources. Shanxi Province, as China’s most important energy base, has prioritized the task of supplying coal resources close to one-third of the country’s total and emergency security, while its outgoing power reaches one-third of that of the province, supporting the high power consumption of one of China’s two major economic zones, the Beijing–Tianjin–Hebei region. At the same time, Shanxi Province is located in the middle of China’s Yellow River Basin, and with 37% of the total area made up of the sea and the river, it is rich in innate water resources. Its rivers are typical self-produced outflow-type water systems, known as the ‘Water Tower of North China’, an important water resource source in North China. Shanxi’s WEF nexus system therefore has a very important impact on the resources and economic security of North China. Shanxi Province has historically experienced an over-concentration of capital and development within the energy subsystem, leading to the marginalization of the agricultural subsystem and heightened vulnerability within the water subsystem. These imbalances stem from a longstanding reliance on a relatively outdated resource exploitation model, compounded by historical deficiencies in environmental governance and management [33]. As a result, the province’s unsustainable resource supply dynamics have persistently challenged and constrained broader development planning efforts across the North China region. With the aim of assisting local governments in enhancing the efficiency of resource management and addressing the sustained pressure on energy and water resource supply, Shanxi Province and its 11 prefecture-level cities—namely Taiyuan, Datong, Yangquan, Changzhi, Jincheng, Shuozhou, Jinzhong, Yuncheng, Xinzhou, Linfen, and Lvliang—were selected as the research sample. The region’s structural characteristics and resource-related challenges render it a particularly suitable case for examining the resilience and security of the WEF nexus. The geographic distribution of Shanxi Province within China is illustrated in Figure 3.

2.2. Data Sources and Processing

The basic data used in this paper are derived from publicly available data from the China Urban Statistical Yearbook, the Shanxi Statistical Yearbook, and the statistical yearbooks of the prefecture-level cities in Shanxi Province for the years from 2015–2024. To address issues of missing or inaccessible data, appropriate imputation techniques were employed based on the specific context and availability of information. The mean value method and interpolation were applied to estimate missing data points in accordance with observed temporal patterns and actual regional conditions. Additionally, outliers identified for specific years were adjusted to align with historical trends, ensuring the continuity and reliability of the dataset. During the empirical modeling process, any negative values that could not be incorporated into the analytical framework were corrected through non-negative translation techniques, thereby preserving the model’s validity while maintaining the integrity of the original data structure. All empirical analyses and spatial visualizations in this study were conducted using geographic information system (GIS) technology, specifically employing the advanced functionalities of ArcGIS 10.6. This software offers a comprehensive suite of tools, including spatial statistical analysis, exploratory regression, spatial relationship modeling, and cartographic symbolization.

3. Description of Research Variables
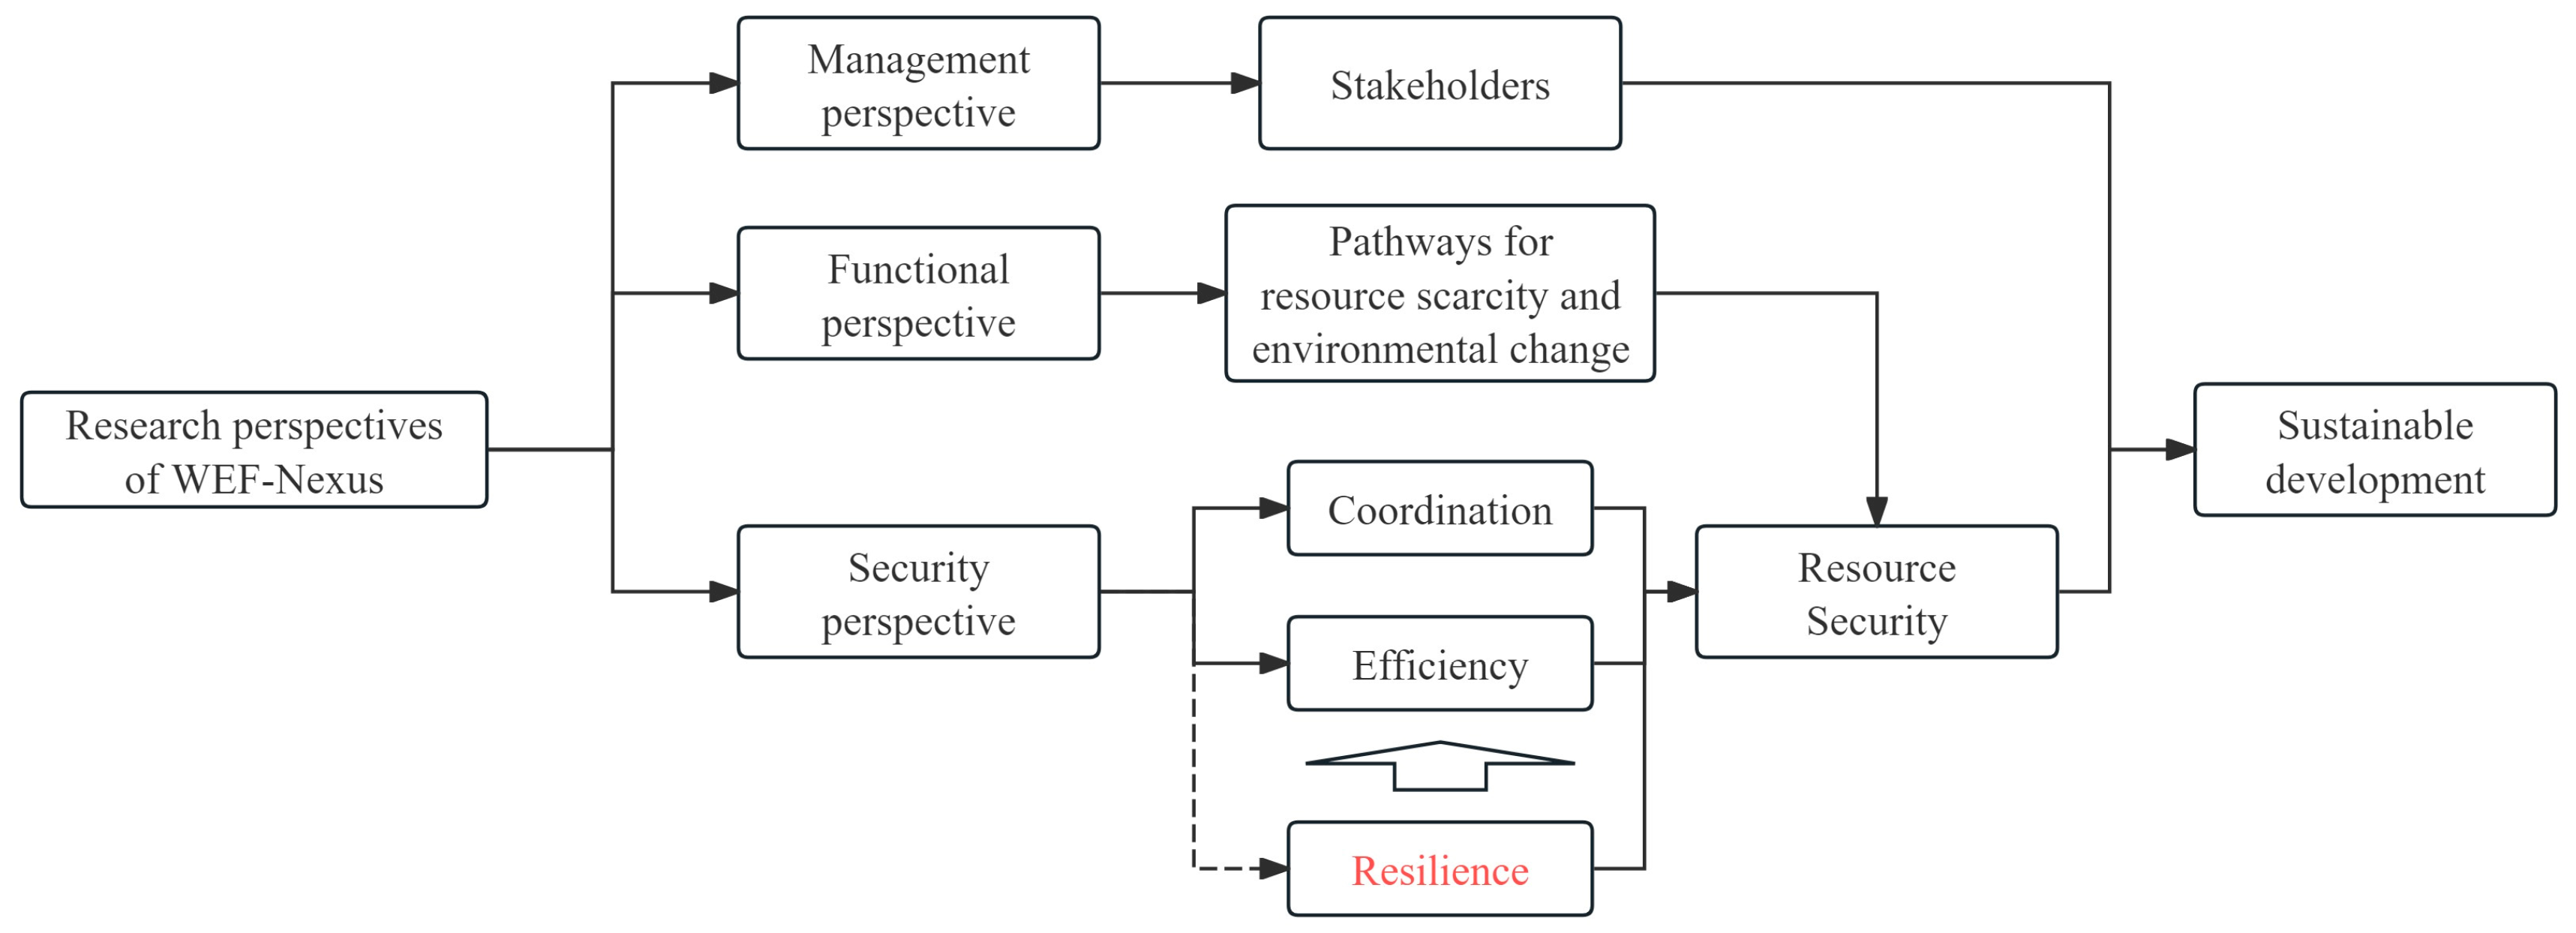
3.1. Core Variables

We considered WEF nexus system resilience security as the core variable of the empirical model, denoted as RESit, which represents the value of WEF nexus system resilience security in year t of region i. Based on the indicator evaluation framework and measurement methodology proposed by Huang et al. [21], this study decomposed the research object into four key dimensions: preparation capacity, absorption capacity, recovery capacity, and adaptive capacity. Each of these dimensions was used to independently assess the resilience security of the water, energy, and food subsystems. The entropy weighting method was employed to calculate the resilience security scores for each subsystem, ensuring objectivity in the weighting process. Subsequently, a coupling coordination model was applied to integrate these scores and derive the overall WEF nexus resilience security values for the 11 prefecture-level cities in Shanxi Province over the period from 2014 to 2023. The specific calculations were as follows [21]:
Step 1: All data were standardized by applying the extreme variance method to ensure consistency in the measurement of all the indicators, and Xij was used as the standardized value of indicator j of city i;
Step 2: For each subsystem, there were m samples to be evaluated, and each sample corresponded to n evaluation indicators, resulting in an m × n data matrix (Xij)m×n;
Step 3: The information entropy ej for indicator j was calculated as:
e j = 1 ln m i = 1 m P i j ln P i j
where Pij is the weight of indicator j of city i, which was calculated as:
P i j = X i j / i = 1 m X i j
Step 4: Weights wj for indicator j was calculated:
w j = ( 1 e j ) / j = 1 n ( 1 e j )
Step 5: Combined evaluation value Ri was calculated for each subsystem:
R i = j = 1 n w j X i j
Step 6: The coordination of each subsystem is an important link in determining its overall security resilience level, so we used a coupled coordination model to comprehensively measure the WEF nexus security resilience level with the following formula:
R W E F = C W E F [ α 1 R w + α 2 R E + α 3 R F ]
C W E F = n f W ( x ) f E ( x ) f F ( x ) f W ( x ) + f E ( x ) + f F ( x ) n 1 n
where RWEF represents the comprehensive evaluation value of the WEF nexus system’s security resilience in a region. RW, RE, and RF correspond to the security resilience levels of the water resource subsystem, the energy subsystem, and the food subsystem, respectively, derived from Ri in step 6. The coefficients α1, α2, and α3 were each assigned a value of 1/3, based on the principle of equal weighting in WEF nexus system theory. CWEF denotes the coupling index reflecting the interaction among the security resilience levels of each subsystem. As the study considers three subsystems, the value of n was set to 3 (references [12,13]). The measurement results of the WEF nexus system’s security resilience in the study area for several years are presented in Table 1.

3.2. Influencing Factor Variables

When regression models for influencing factors are constructed, the different combinations of explanatory variables available usually need to be evaluated to obtain a regression model that provides the best explanation of the explanatory variables. Therefore, we summarized the factor variables mentioned in the literature that might affect the WEF nexus system and identified the most suitable combination of variables for the research area.
Population density (PD) is the most direct factor affecting the overall demand for resources in human societies [34], and the population provides the labor force for the industries related to the WEF nexus system and ensures its supply capacity; however, overly rapid population growth undoubtedly increases the burden on the supply side of the system, which is usually expressed by the number of people per unit of land area.
Urbanization (URB) is broadly defined as the migration of the population from rural areas to urban centers, a process that entails significant transformations in employment patterns, land use, and industrial structure [35]. As a strategic approach to addressing rural development and agricultural challenges [36], the rational advancement of the urbanization process is conducive to the coordination of resources in the total region, which will have a far-reaching impact on the supply–demand dynamics of the WEF Nexus. Urbanization is typically quantified by the ratio of the urban population to the total population within a given region.
Technological innovation (TI), meanwhile, serves as an indicator of a region’s capacity for scientific and technological advancement. It directly enhances the efficiency of resource production, utilization, and transportation, while mitigating environmental constraints associated with resource-intensive industries. However, the influence of technological innovation on the WEF nexus system is inherently dynamic: while it bolsters supply capabilities, it may concurrently stimulate increased resource demand [37]. In this study, technological innovation was measured by the number of authorized invention patent applications per 10,000 people.
Marketization (MAR) is a market-based mechanism that ensures each resource in the WEF nexus system is allocated rationally and efficiently on the demand side by commoditizing water, energy, and food [38], which is usually expressed by total local retail sales of consumer goods per capita. However, under the domination of the market mechanism, the principle of fairness may appear to be ignored, reducing the accessibility of resources for the bottom group of society; at this time, administrative forces (GOV) in the form of the government need to intervene to provide access to resources for this group [39,40]. We used administrative power to reflect local government intervention in the marketplace, usually expressed as total local public expenditure as a share of regional gross domestic product.
Reachability (REA) refers to each resource’s ability to be physically delivered to the consumer once the allocation is complete [41]. The distribution forms of water, energy, and food are different, and the transportation and geographic conditions of different regions are also significantly different. For empirical feasibility, we used the regional cargo turnover to reflect resource turnover capacity. This was calculated by multiplying the regional grade highway mileage by the total amount of freight transported at the end of the year.
Industrial structure (IS) determines the exploitation of regional resources, which affects the supply and demand of the WEF nexus system. Referring to Zhang et al. [42], the industrial structure of a region is measured from two dimensions, industrial rationalization (IR), and industrial advancement (IA), and the entropy weight method was used to assign weights to each of them to arrive at a comprehensive index of industrial structure. To measure industrial advancement, we used the ratio of the added value of the tertiary industry to the added value of the secondary industry in the region. Industrial rationalization can reflect the rational allocation of resource factors among production sectors, as reflected by the difference between 1 and the Theil index, with the following formula:
I S = α 1 I R + α 2 I A I R = 1 T L = 1 i = 1 n ( Y i / Y ) ln ( Y i / L i ) / ( Y / L )
where IR is the industrial rationalization index of the region, and a larger RI indicates a higher degree of industrial rationalization of the region; TL is the Theil index of the region, which is in the range of 0–1; the smaller its value is, the more balanced the distribution of industry and labor in the region; Y is the gross regional product; L is total regional employment; Yi is denotes the sum of the variances of all the elements i, Li is the value of people employed in industry i.
Environmental protection efforts (EPs). Water, energy, food, land, etc., are natural resources in the WEF nexus system, and their supply capacity is closely related to the quality of the environment. Under the premise of rational use, fossil energy has renewable capacity; however, if the environment is contaminated and damaged, it will directly affect the regeneration channels and the quality of the supply of water, food, and land resources [43], which will affect WEF nexus system resilience security. It is usually expressed as the ratio of environmental protection expenditure to government public expenditure.
Resource mismatch (RM) represents a critical constraint within the WEF nexus, as it disrupts the efficient flow and allocation of regional resource factors, thereby reducing marginal productivity and impeding optimal system performance. In the context of the WEF nexus, resource mismatches typically manifest as imbalances in labor and capital investment across the energy, agricultural, and water sectors; discrepancies in land use allocation between industrial and agricultural purposes; and misalignments between resource exploitation activities and environmental regulatory efforts [44]. Referring to Bai et al., the capital factor mismatch index (RMki) and the labor mismatch index (RMLi) of the research area are measured, and the results were nonnegatively processed to take the average value. Then, we obtained the resource mismatch index of the area, and the larger the value was, the more serious the mismatch. The specific formula is as follows [45]:
R M = 1 2 ( R M K i + R M L i ) R M K i = 1 γ K i 1 , R M L i = 1 γ L i 1
where γki and γLi are the absolute factor price distortion coefficients, which indicate the additive case where resources are not distorted. They can usually be replaced by the relative price distortion coefficients γKi and γLi:
γ K i = K i / K / s i β K i / β K , γ L i = L i / L / s i β L i / β L
where si = piyi/Y denotes the share of output yi in region i in the total economy-wide output Y, and we used regional gross domestic product to denote output; βK = ΣsiβKi denotes the output-weighted capital contribution value; Ki/K denotes the actual proportion of capital used in area i to total capitalization; and siβKi/βK denotes the theoretical proportion of capital used by region i when capital is efficiently allocated.
The data sources involved in the calculation of the above variables are given in Table 2.

4. Method

4.1. Global Spatial Autocorrelation Analysis

According to the principles of new economic geography, the spatial distribution of resource elements often exhibits strong autocorrelation, as regional clustering and spillover effects are common in the allocation and utilization of such resources. Therefore, before analyzing the spatial heterogeneity in the effects of influencing factors on the resilience and security of the WEF nexus system, it was essential to first determine whether significant spatial autocorrelation existed. To this end, the global Moran’s Index I was employed to evaluate the presence and degree of spatial autocorrelation in WEF nexus system resilience security across the study area. The formula for calculating Moran’s Index was as follows [46]:
I = i = 1 n j = 1 n w i j ( x i x ¯ ) ( x j x ¯ ) S 2 i = 1 n ( x i x ¯ ) 2
S 2 = 1 n i = 1 n ( x i x ¯ ) 2 , x ¯ = 1 n i = 1 n x i
w i j = 1 d i j , i j w i j = 0 , i = j
where I denotes the global Moran’s index I; xi and xj are the observed values of WEF nexus resilience security in regions i and j, respectively; n denotes the sample capacity of this research; S2 is the sample variance; wij represents the combination of (i, j) elements in the spatial weight matrix, which is used to indicate the distance between regions ij, which is defined by using the inverse of the geographic distance, i.e., Equation (11); and dij denotes the surface distance of the geographic unit on the basis of latitude and longitude.
The global Moran’s Index I typically ranges from –1 to 1, providing insight into the spatial autocorrelation of a given variable. A value greater than 0 indicates positive spatial autocorrelation, signifying that regions with high (or low) values of the core variable tend to be adjacent to regions with similarly high (or low) values. Conversely, a value less than 0 reflects negative spatial autocorrelation, where high-value regions are adjacent to low-value regions and vice versa. A value equal to 0 denotes a random spatial distribution, indicating the absence of spatial autocorrelation. To assess the statistical significance of the observed spatial autocorrelation in the entire study region, the standardized statistic Z was used to conduct a significance test for the global Moran’s Index, with the corresponding test formula presented as follows [46]:
Z = 1 E ( I ) V A R ( I )
where E(I) and VAR(I) are the theoretical expectation and variance of the global Moran’s index I, respectively, and the significance level of the Z value is taken as 0.05, with a critical value of 1.96. If Z is greater than 1.96, it indicates that the research object has a significant positive spatial autocorrelation; if Z is less than –1.96, it indicates that the research object has a significant negative spatial autocorrelation; and if the absolute value of Z is less than 1.96, the spatial autocorrelation of the core variables is not significant and is randomly distributed.

4.2. Geographically Weighted Regression (GWR) Model

4.2.1. Description of the GWR Model

In a conventional multivariate, normally distributed linear regression model, it is typically assumed that the variables exhibit no spatial correlation, an assumption referred to as spatial homogeneity. Under this assumption, the model coefficients are estimated using the ordinary least squares (OLS) method, which relies on the principles of calculus to minimize the sum of squared residuals. However, in the actual situation, the spatial geographic factors affecting the supply, demand, and flow of resource elements have obvious organizational and promotional roles, and for our research object, WEF nexus system resilience security and its external influencing factors are subject to the role of spatial geographic factors and show regional differences; thus, continuing to use the traditional coefficient estimation method of the OLS model will lead to a large deviation from the real situation, which lacks authenticity and scientific validity. In contrast to the traditional OLS regression model, which assumes spatial homogeneity, the GWR model incorporates spatial heterogeneity by embedding the geographic coordinates of sample points directly into the estimation process through a spatial weight matrix, which makes the regression coefficients of the GWR model meet the first law of geography, that things or variables in close proximity have a stronger impact than those at a distance [47]. Thus, the estimated coefficients of the variables are closer to the real situation, and the GWR model is more reasonable for our research. The general formulations of the OLS and GWR models are presented as follows [48]:
y = β 0 + β 1 x 1 + β 2 x 2 + + β n x n
y i = β 0 ( u i , v i ) + k = 1 n β k ( u i , v i ) x i k + ε i
where Equation (13) is the traditional OLS regression model and Equation (14) is the GWR model; βk (ui, vi) denotes the kth regression coefficient for the ith research sample; and εi denotes the random perturbation term for research sample i. If β1k = β2k == βnk, in Equation (14), then the GWR model degenerates into an OLS regression model.

4.2.2. Screening of Explanatory Variables (Based on Exploratory Regression Method)

This study employed the exploratory regression function in ArcGIS to evaluate all explanatory variables outlined in Section 3.2 across various scenario combinations, with the goal of identifying the most optimized regression model for the study area. The exploratory regression tool in ArcGIS 10.6 integrates the least squares method, global spatial autocorrelation analysis, and a predefined spatial weighting matrix to systematically assess all possible combinations of explanatory variables. This process aims to identify a model that simultaneously satisfies multiple optimization criteria: a minimum acceptable R2, the highest allowable p-value for statistical significance, a VIF below a critical threshold, and the lowest possible Jarque–Bera p-value, each of which is defined in Table 3. The overall exploratory regression workflow is illustrated in Figure 4. It is important to emphasize that variables excluded during this process are not necessarily without influence; rather, their exclusion reflects their incompatibility with the specific statistical and spatial requirements of the model constructed for this study.

4.2.3. Construction of the GWR Model

On the basis of the results of exploratory regression, population density (PD), technological innovation (TI), industrial structure (IS), and resource mismatch (RM) were selected as explanatory variables in this study; also, to avoid possible heteroskedasticity problems with cross-sectional data, all variables were logarithmized. The GWR model of the factors affecting WEF nexus resilience security was constructed with the following formula:
ln R E S i = β 0 ( u i , v i ) + j = 1 k β 1 ( u i , v i ) ln P D + j = 1 k β 2 ( u i , v i ) ln T I + j = 1 k β 3 ( u i , v i ) ln I S + j = 1 k β 4 ( u i , v i ) ln R M + ε i
where RESi is the explanatory variable of the model and denotes the measure of WEF nexus resilience security in region i; β0 is a constant term; (ui,vi) denotes the geographic location coordinates (latitude and longitude) of the ith prefecture-level city; βj (ui,vi) indicates the jth regression coefficient of the ith prefecture-level city, which is estimated in this study by the locally weighted least squares method using the software ArcGIS 10.6; εi is the random error in region i that satisfies the assumption of spherical perturbations such as homoskedasticity and mutual independence.
Regarding the spatial weight matrix selection for GWR, we employed the property of a continuous monotonic decrease in the Gaussian kernel to reflect the continuous monotonic decrease relationship between the geographic distance and weight of two sample points. The equation for this relation can be given as:
W i j = exp ( d i j / b ) 2
where Wij is the spatial weight matrix based on the geographic distance of two sample points i and j; dij denotes the geographic distance between i and j and b denotes the bandwidth, which is a parameter used to measure the attenuation relationship between Wij and dij. Normally, b ≥ 0. If the value of b is larger, Wij decreases more slowly with increasing dij and vice versa. The bandwidth parameter plays a critical role in the GWR model, as it directly influences the spatial weighting matrix and, consequently, the estimation of model coefficients. The value of the bandwidth determines the extent of spatial geographic information incorporated into the regression analysis, thereby affecting the sensitivity of the model to local variations. Several methods are available for determining the optimal bandwidth, with the most commonly used being the cross-validation method and the Akaike information criterion (AIC). In this study, the AIC criterion was adopted to determine the bandwidth parameter b, as it balances model fit and complexity, thereby enhancing the overall robustness and reliability of the GWR model.

4.3. Nature Breaks Method

In this study, the regression coefficients of the GWR model were ranked following the natural breaks method.
A time series typically contains several naturally occurring and statistically significant turning points or breakpoints, which serve as optimal boundaries for grouping research subjects with similar characteristics. The formula used to identify these breakpoints is as follows [49]:
S D i j = A k m e a n i j 2 , ( 1 i j N )
where ΣSDi-j denotes the sum of the variances of all the elements of an array in the study series; meani-j denotes the average of all the elements of each categorized array; and N denotes the total length of the array. The breakpoints used to identify the research array were determined by first establishing the number of categories and then adjusting the categorization thresholds to minimize the internal variance within each category while maximizing the variance between different categories [49]. This study implemented the method using ArcGIS 10.6.

5. Results and Analysis

5.1. Global Spatial Autocorrelation Test Results and Analysis

The spatial autocorrelation of WEF nexus resilience security in 11 prefecture-level cities in Shanxi Province was tested via the global Moran’s I index, and the results obtained are shown in Table 4.
As shown in Table 3, Moran’s I index for WEF nexus system resilience security in Shanxi Province was negative and statistically insignificant for the years 2014, 2015, and 2019. This suggests a pronounced spatial fragmentation of WEF nexus components during these years, indicating a lack of spatial clustering. In contrast, Moran’s I values for the remaining years were positive and statistically significant, implying a clear positive spatial autocorrelation. This denotes that regions with high resilience security tend to be spatially proximate to other high-value regions, while low-value regions similarly exhibit clustering. These findings underscore a strong spatial dependency in the distribution of WEF nexus resilience security, whereby its intensity decreases with increasing geographic distance.
The global Moran’s I index during the 10-year period shows a fluctuating upward trend, and the spatial correlation of the regional WEF nexus resilience security is gradually enhanced, reaching a maximum value of 0.043 in 2023, indicating that during the research period, the barrier of regional division of resource elements of the WEF nexus system in Shanxi Province has been gradually alleviated, and the linkage of elements within the region has been gradually enhanced.
In summary, two main conclusions can be drawn. First, the impact of geographic distance must be thoroughly considered when analyzing the influencing factors of WEF nexus resilience security, which further validates the application of geographically weighted regression models in this study. Second, the aggregation and diffusion mechanisms of the fundamental elements within the WEF nexus system should be fully accounted for when designing optimization strategies.

5.2. Results and Analysis of the Regression Parameters

Using the GWR model in Section 4.2.3, the cross-sectional data of WEF nexus resilience security and its influencing factor variables in 11 prefecture-level cities in Shanxi Province from 2014–2023 were analyzed via regression, and the parameters of the GWR model for the calendar year were obtained, as shown in Table 5.

5.2.1. Robustness Test of the Model

As Table 5 shows, all VIF values were well below 10, indicating the absence of multicollinearity in the model. Additionally, based on the t-test results, all p-values for the residuals are greater than 10%, suggesting that the differences between the residual distribution and a random pattern across the years were not statistically significant. This implies that the residuals of the spatial model are spatially randomly distributed, thereby confirming that the model meets the robustness requirements for spatial modeling.

5.2.2. Analysis of the Effect of Data Fitting for Variables

The goodness-of-fit R2 of the GWR model for all years ranged from 0.49–0.66, indicating that the explanatory variables selected in our research have strong explanatory power for WEF nexus resilience security in the research area. The residual squares values were small overall, ranging between 0.0778 and 0.1460, with the smallest value for this parameter in the 2022 model, indicating that the GWR model in 2022 best fit the observed data for each variable.

5.2.3. Analysis of the Optimization Degree of the Model

Typically, the bandwidth, AIC, and sigma determine the degree of optimization of the GWR model. Specifically, sigma denotes the standard deviation of the model’s residual estimates and affects the value of the AIC, which determines the value of the bandwidth. According to the table, the bandwidth values of the GWR model were relatively large for all years, which indicates that the spatial weight matrix defined by the Gaussian kernel is relatively flat and that the trend of change in the effect of each influencing factor variable on the regional WEF nexus resilience security is relatively flat. The bandwidths from 2016 to 2018 were the same at 12,736,278.59 and had the highest values, indicating that the influencing factor variables of the regional WEF nexus resilience security were the least sensitive to spatial geographic factors when spatial heterogeneity was assumed. The model bandwidth for 2021 was 786,803.15, which is the smallest value, indicating that the influencing factor variables of WEF nexus resilience security in 2021 were the most sensitive to spatial geographic factors and had the greatest regional differences. For the AIC criterion, models with lower AIC values fit the current year’s data better and were more optimized. According to the table, the AIC values of the GWR models for different years were generally lower, ranging from –111.27 to –78.13, indicating that the models developed in our study are more optimized.
In conclusion, the 2022 model had the largest AIC value and the smallest sigma value, which proves that the model was the most optimized in all years and was closer to the latest available data year; therefore, we focused on the GWR model regression results for 2022.

5.3. Results and Analysis of GWR Model Regression (Year 2022)

To avoid the influence of subjective factors, we used the natural breaks method in ArcGIS to classify the coefficient regression results of each influencing factor variable of WEF nexus resilience security in 11 prefecture-level cities in Shanxi Province.
We used the method to classify the coefficient regression results of each influence factor variable of WEF nexus resilience security in 11 prefecture-level cities in Shanxi Province in 2022 into level 1, level 2, and level 3, which represent the low influence level, medium influence level, and high influence level, respectively. The spatial differentiation statistics are plotted in Figure 5, Figure 6, Figure 7 and Figure 8 as follows, where the value n in the right bar chart indicates that a one-percentage-point increase in the corresponding variable will increase or decrease the WEF nexus resilience security by n percentage points each.

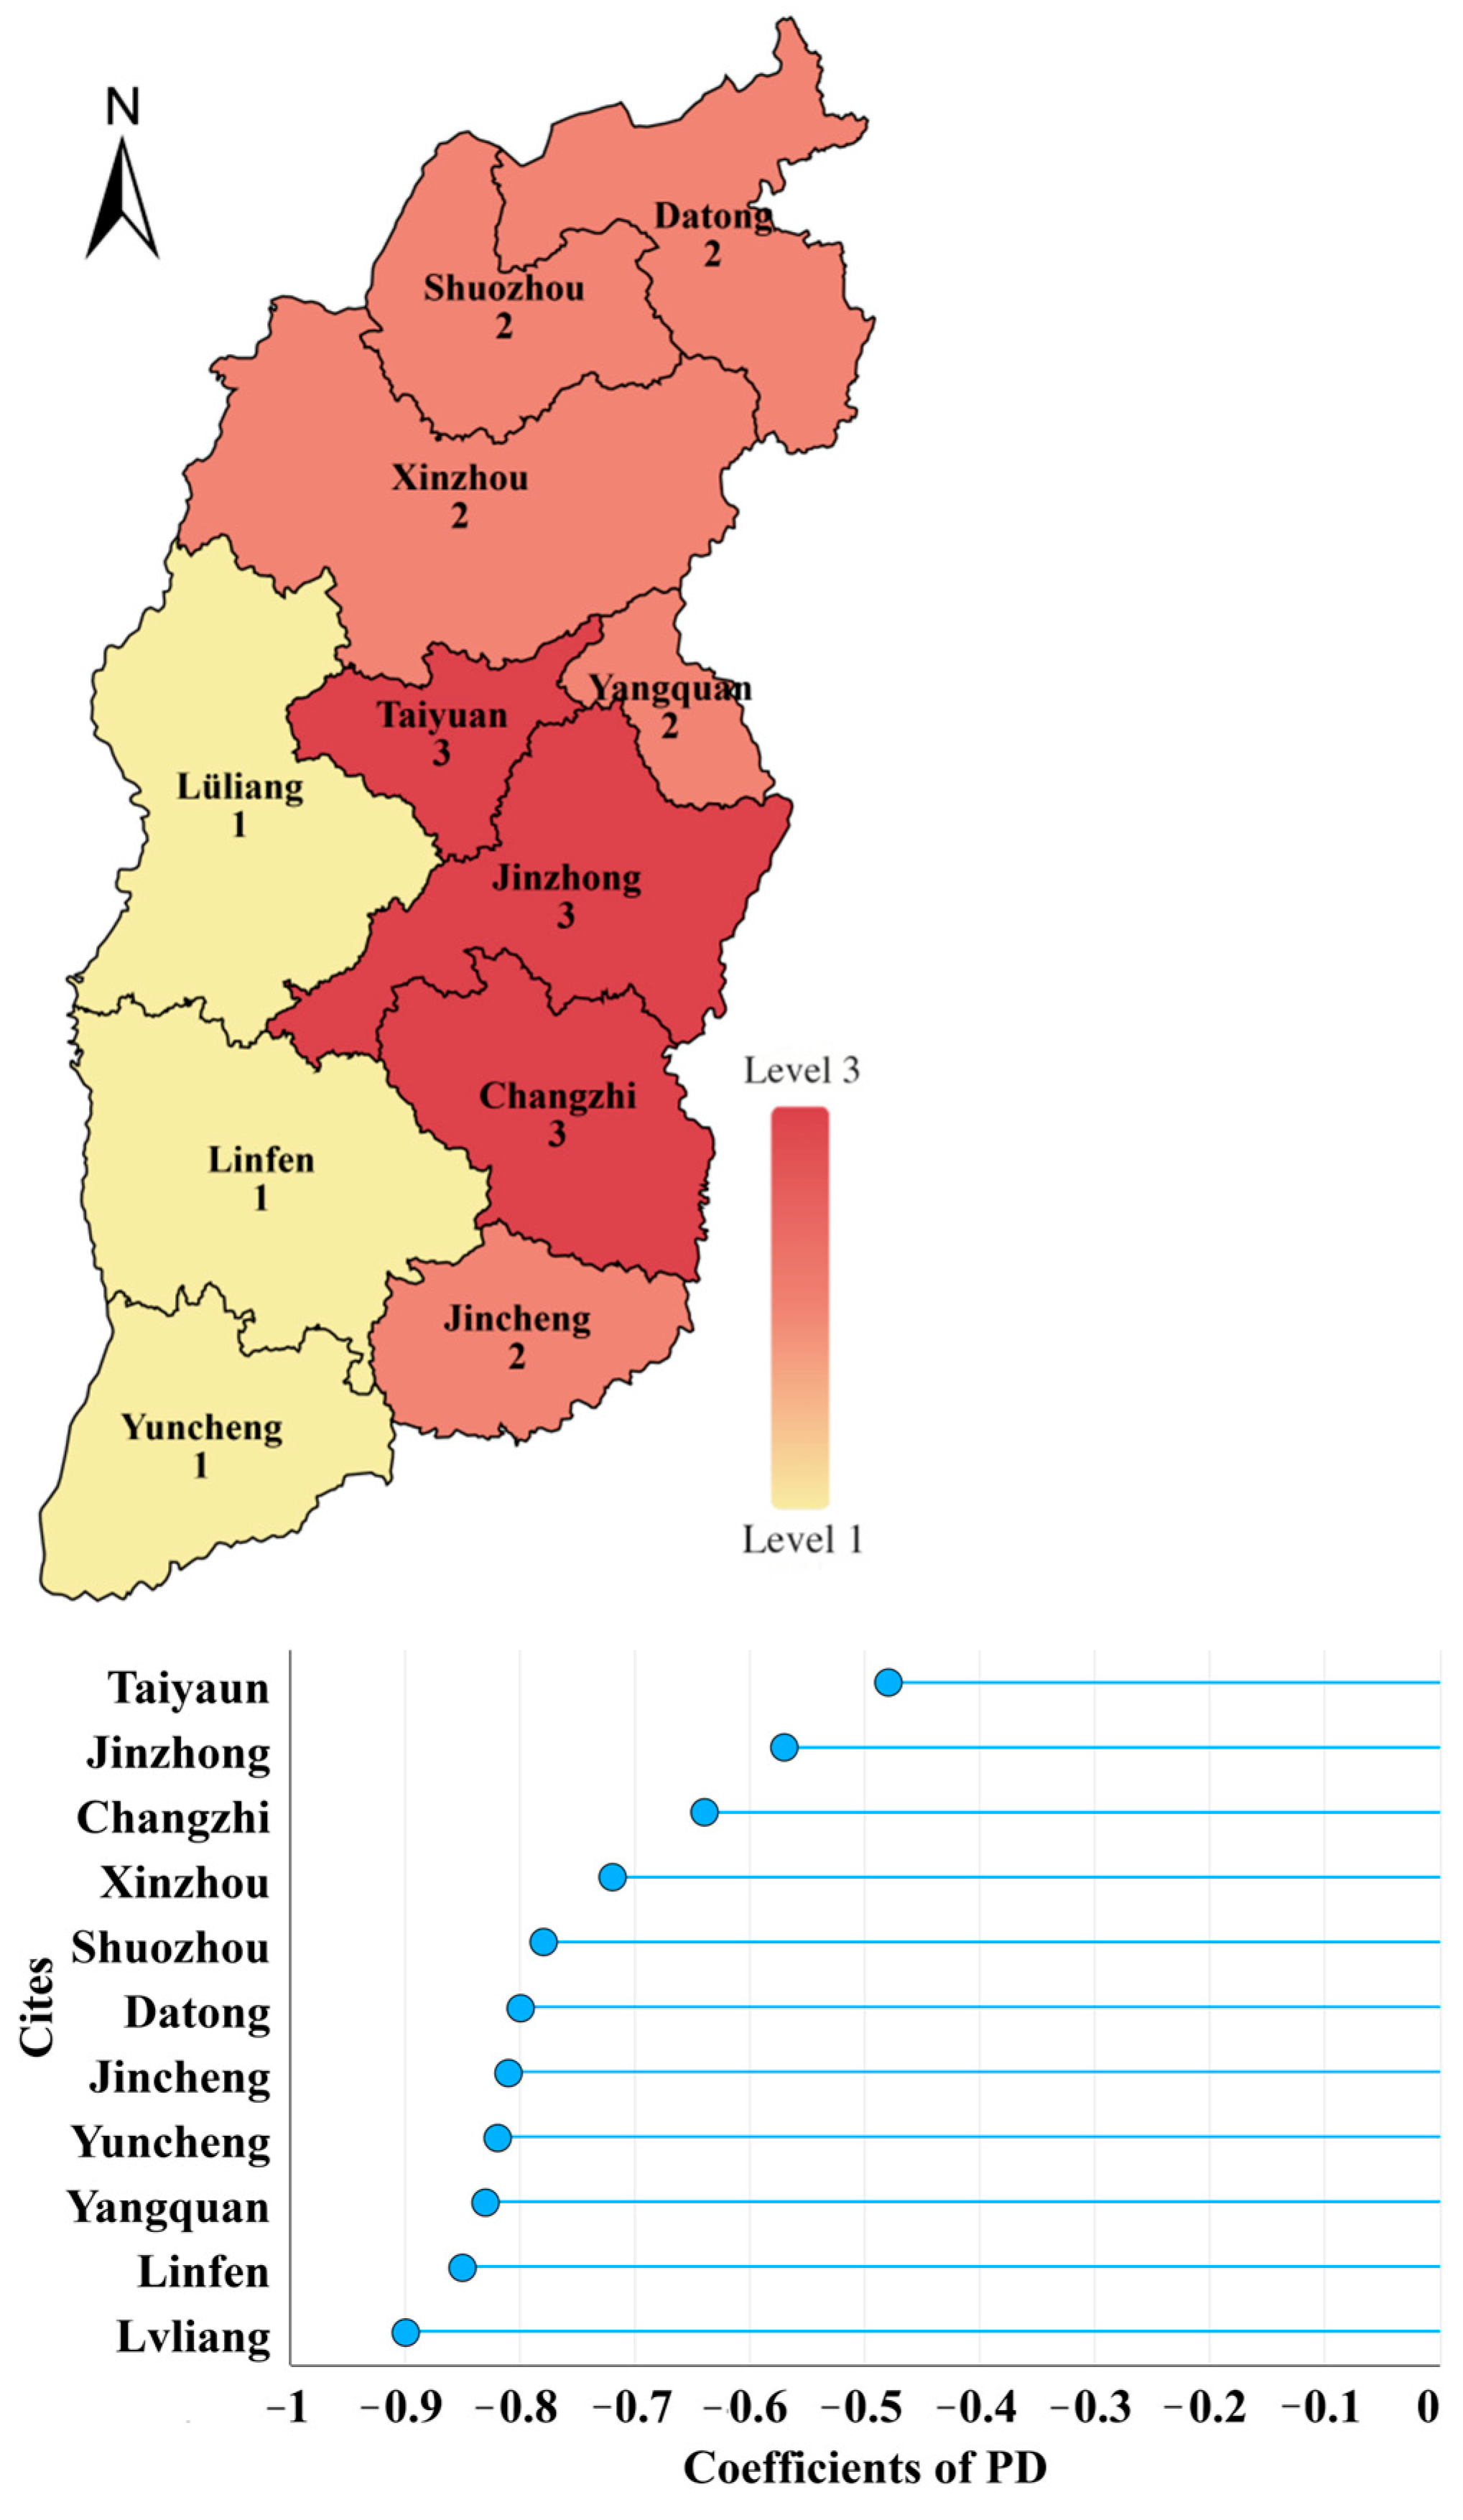
5.3.1. Analysis of Regional Differences in Population Density (PD) Regression Coefficients

Figure 5 shows the influence coefficients of the population density variable on WEF Nexus resilience security in all cities of Shanxi Province were negative, indicating that in the case of 2022, as the baseline, the increase in population density produced significantly more pressure than support on the supply side of the regional WEF nexus system, intensifying the contradiction between the supply and demand of various resources, which had a negative effect on WEF nexus resilience security.
The spatial distributions of the coefficient levels of population density were characterized by clear clustering. High-level regions were concentrated in the east-central part of Shanxi Province, indicating that these cities had the weakest negative effects due to population growth, suggesting that Taiyuan, Jinzhong, and Changzhi have a greater accumulation of human capital, which strengthens the efficiency of transforming the region’s basic resources and enhances the region’s carrying capacity of the population. Despite Taiyuan demonstrating the strongest overall performance, its negative effect remained close to –0.5, indicating a considerable gap from achieving a positive driving force. In contrast, the relative advantage of human capital in higher-level regions exhibited significantly greater spillover effects toward the northern and southern regions compared to the western region. This is further underscored by the presence of stark disparities: cities with the highest and lowest values are geographically adjacent, with coefficient differences exceeding 0.4. Such findings reveal a pronounced fragmentation in the distribution of human capital elements between cities like Taiyuan and Lvliang. This segmentation severely impedes the coordinated development of WEF nexus resilience security in Shanxi Province, and warrants increased policy and research attention.

5.3.2. Analysis of Regional Differences in Technology Innovation (TI) Regression Coefficients

Figure 6 shows that the influence coefficients of the technological innovation variables on WEF nexus resilience security in all cities of Shanxi Province in 2022 were positive, and the overall value was large, indicating that technological innovation can provide strong support for WEF nexus resilience security. The generally high impact coefficient of technological innovation may be attributed to Shanxi Province’s functional role as a key production region for the WEF nexus systems in North China. This regional functional positioning has led to a concentration of local technological innovation projects within the domains of energy, water conservancy engineering, and environmental governance. Consequently, these innovations have exerted a more direct and targeted optimization effect on the region’s WEF nexus resilience security.
In terms of specific outcomes, Taiyuan registered the highest coefficient value at 1.01, reflecting its superior capacity to effectively translate technological advancements into practical improvements within the WEF nexus framework. In contrast, Linfen exhibited the lowest value at 0.68, indicating a substantial disparity in technological transformation efficiency when compared to Taiyuan.
The spatial distribution of the coefficient level shows the characteristic of high- and medium-level influence regions dividing the low-level influence regions, indicating that the spatial division of technical elements in Shanxi Province is serious and that the external radiation capacity of high-value cities such as Taiyuan and Jinzhong needs to be improved.

5.3.3. Analysis of Regional Differences in Industrial Structure (IS) Regression Coefficients

Figure 7 shows that the influence coefficients of industrial structure variables on WEF nexus resilience security in all cities of Shanxi Province in 2022 are positive, indicating that the rationalization and advancement of the industrial structure positively promote local WEF nexus resilience security. In terms of the influence level of the coefficients in each region, four cities, Datong, Shuozhou, Lvliang, and Yangquan, had the highest number of level 3 regions among the regression results of all the influence factor variables, and these regions are where Shanxi Province’s coal resources are concentrated. Shanxi Province is a typical resource-dependent region, and its early resource utilization pattern was rather crude, with low resource utilization and transformation efficiency. Shanxi Province did not make use of the short-term high input-return rate of the resource industry to upgrade production technology in a timely manner, which led to long-term backwardness of the modernization of the resource industry chain and slow improvement; therefore, the marginal benefit of industrial structure optimization was greater at this time. When this situation is reflected in our model, the value of the regression coefficient of the cities with poor industrial foundations and irrational structures will be greater, which also implies that the priority of the need for optimization of the industrial structure is greater in these cities.
From the spatial distribution of coefficient levels, low influence level regions are concentrated in southern Shanxi Province, indicating that their industrial structure is relatively reasonable, whereas a larger range of medium- and high-level regions are clustered in the central and northern parts of Shanxi Province, which are the major regions of Shanxi Province’s economic contribution, and targeted regional industrial structure optimization programs urgently need to be developed.

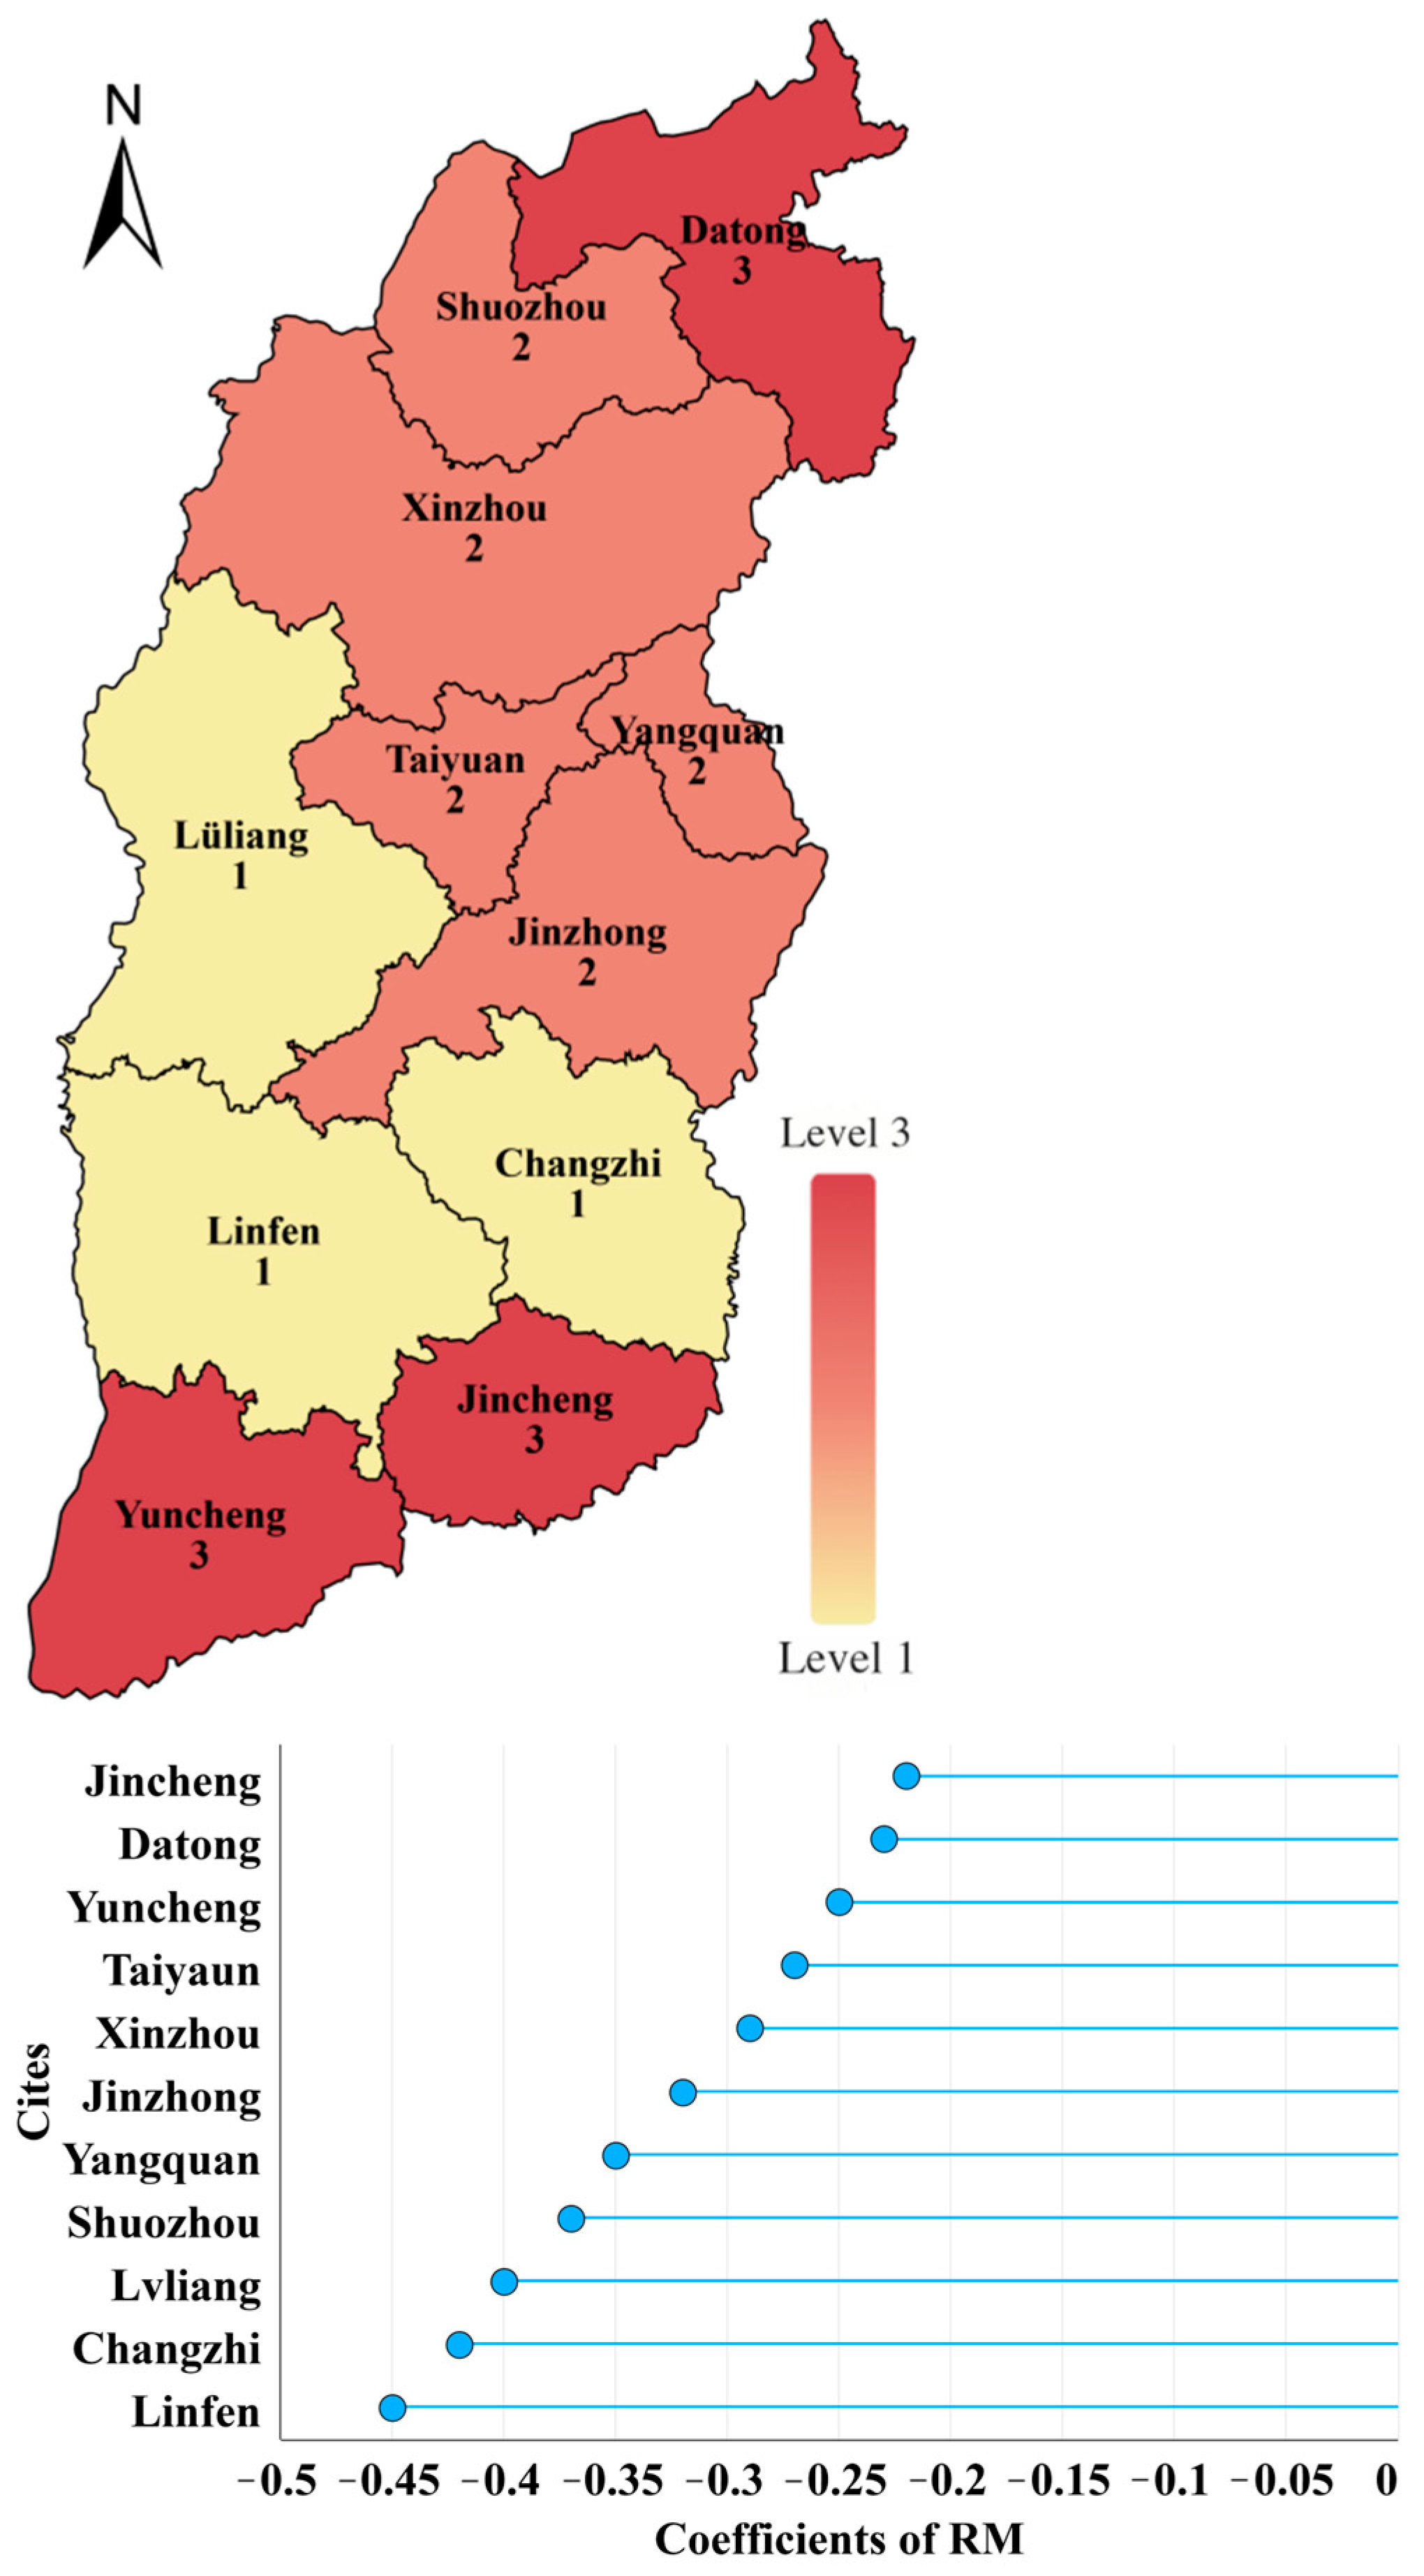
5.3.4. Analysis of Regional Differences in the RM Regression Coefficients

As shown in Figure 8, the influence coefficients of the resource mismatch variables on WEF nexus resilience security in all cities of Shanxi Province in 2022 were negative, indicating that the resource mismatch severely reduces the operational efficiency of the WEF nexus system and places downward pressure on the stability of its supply–demand relationship.
Based on the coefficient values across various cities, the maximum value was –0.22 in Jincheng, while the minimum was –0.45 in Linfen, yielding a difference of only 0.23. This represents the smallest regional variation among all variables, suggesting that resource mismatch is the least sensitive to spatial geographic factors.
Regarding the spatial distribution of the coefficients’ influence levels, the high-value areas are concentrated along the northern and southern peripheries of Shanxi Province, regions characterized by fewer neighboring areas, limited connectivity of resource elements, and comparatively weaker negative impacts from resource mismatches. In contrast, other regions displayed a marked clustering pattern, with the northern part of the province exhibiting a greater tolerance for resource mismatches compared to the southern region.

6. Suggestions

6.1. Differentiated Optimization Policies

Since the same factor exerts varying degrees of influence across different cities in Shanxi Province, this study first formulated targeted optimization recommendations for water–energy–food (WEF) resilience security based on the classification of regression coefficient magnitudes. The regression coefficients for population density (PD) ranged from −0.9 to −0.48, all indicating a negative effect. This suggests that increases in population density exert more pressure than support on the regional WEF nexus system’s supply side.
According to the results, level 1 regions exhibited the strongest negative impact, with coefficients ranging from −0.9 to −0.82, highlighting a clear and direct pressure on WEF resilience security. These areas should prioritize controlling population growth and facilitating labor outflow. In contrast, level 3 regions showed the weakest negative effect, which is likely attributable to the higher quality of their labor force, resulting in a less detrimental impact. These regions should capitalize on their comparative advantages, continue to invest in improving population quality, and focus on becoming hubs for the diffusion of human capital. Level 2 regions, which had moderate and large numbers of negative influence effects, should aim to adjust the age and quality structure of the labor force and act as regional mediators of population policy excesses.
The regression coefficients for technological innovation (TI) ranged from 0.68 to 1.01, all reflecting a positive impact, which indicates that technological advancement provides substantial support for enhancing WEF nexus resilience security at the local level. According to the findings, level 1 regions exhibited the weakest effect, suggesting a low transformation rate of technological innovation outcomes. Therefore, these regions should focus on improving the practical applicability and implementation of technological advancements.
Level 3 regions demonstrated the strongest positive influence, indicating effective integration of technological innovation into the WEF system. In addition to increasing investment in technology, these regions should work to mitigate the risk of locational lock-in effects, enhance the spillover of technological and resource development into adjacent areas, and assume a leading role in driving overall technological innovation across Shanxi Province. The level 2 regions with moderate and the greatest number of impact effects should be committed to constructing technological innovation platforms to facilitate the aggregation of their own technological elements while reducing the spatial attenuation rate of technological spillovers within Shanxi Province.
The regression coefficients for industrial structure (IS) ranged from 0.43 to 0.79, consistently indicating a positive effect. In this study, the IS variable reflects both the advancement and rationalization of the industrial structure. A higher regression coefficient thus signifies a more advanced and rational industrial configuration within the corresponding region. Regions classified as Level 1 exhibited the weakest impact effects and were predominantly characterized as typical coal resource-dependent areas, where the energy sector holds a disproportionately large share. Consequently, these regions should focus on improving the rationalization of their industrial structure and promoting the extension of the energy industry value chain.
The level 2 regions had a medium influence effect, and are mostly high gross domestic product contributing regions in Shanxi Province. Therefore, these cities should prioritize the upgrading of their industrial structures to improve the efficiency of resource transformation. The level 3 regions had the best influence effect and should assume the role of optimizing and driving regional industry and leading the regional industrial division of labor and linkages.
The regression coefficients of resource mismatch (RM) were in the range of [−0.9, −0.48]; all influence coefficients were negative, indicating that resource mismatch can seriously affect WEF nexus resilience security. Level 3 regions exhibited the weakest impact, suggesting a comparatively higher tolerance for resource mismatches. These regions are predominantly characterized by a concentrated distribution of energy enterprises and should therefore prioritize the development of mechanisms linking local energy enterprises with regional agricultural support systems. Such mechanisms may include the implementation of preferential pricing policies for energy and industrial consumer goods in rural areas, as well as the establishment of enterprise-rural coordination departments to mediate the interests between resource development activities and the surrounding rural communities.
The level 1 regions had the greatest impact effect, indicating that they have the lowest tolerance for resource mismatch and should start from the resource allocation mechanism by refining the classification pricing mechanism for water, electricity, and gas, as well as the program for the qualitative supply of land and water resources, to reduce the incidence of resource mismatch from a micro point of view. The level 2 regional impact effects were moderate and distributed in the core region of Shanxi, which should pay attention to the coordinated development status of the WEF nexus subsystems and transfer excess labor and capital from the energy subsystem to the water and food subsystems.

6.2. Prioritization of Policies Across Cities

Given the limited self-regulatory capacity of individual cities, it is essential to prioritize optimization policies across different domains according to their relative importance and urgency. Rational policy prioritization can significantly improve the efficiency of resource management. From the perspective of Shanxi Province as a whole, we propose that variables with higher absolute values of regression coefficients should be assigned higher policy priority. Accordingly, based on the regression outcomes derived from the GWR model, we ranked the absolute values of the regression coefficients for the four influencing variables across the 11 cities. Policy priorities were then determined in alignment with these rankings, as detailed in Table 6.
Taking Taiyuan as a representative case, the absolute value of the regression coefficient for its TI variable ranked first among the 11 cities analyzed, indicating a relatively strong influence compared to the rankings of the other three variables—population density, industrial structure, and resource mismatch—which ranked 6th, 8th, and 11th, respectively. Based on this result, we argue that Taiyuan should be assigned the highest policy priority with respect to technological innovation. Accordingly, local government resources should be strategically directed toward policies targeting this domain. At the same time, Taiyuan is categorized as a level 3 region in the regression classification of population density (see Figure 5), and thus, the corresponding policy interventions should follow the guidelines outlined in Section 6.1 of this article.

7. Discussion

First, as previously discussed, the impact coefficients of external factors influencing water–energy–food resilience security—namely, population density, technological innovation, industrial structure, and resource mismatch—vary with spatial distance and exhibit characteristics of clustered distribution. This indicates that, although these factors exert influence in a consistent directional manner across different cities in Shanxi Province, the magnitude of their effects differs substantially. While several scholars, such as Sun et al. [15], Huang et al. [21], and Li et al. [25], have emphasized the importance of accounting for spatial dependencies in resource management, most of their work has remained at the level of qualitative analysis or has only examined spatial effects among neighboring regions. In contrast, this study quantitatively captures the spatial heterogeneity introduced by geographic factors through the application of a geographically weighted regression (GWR) model, representing the first key advancement over previous research. The second major contribution lies in translating these spatial differences into differentiated optimization policy recommendations. By ranking the impact strengths of the four influencing variables across cities, we determined the priority of policy interventions specific to each location. This approach enhances the precision and effectiveness of local resource governance and offers a novel framework for integrating spatial variability into policy design, potentially enriching academic discourse in this field.
Despite these findings, this article does have some limitations.
First, the traditional GWR model relies on cross-sectional data, which limits its ability to systematically capture the temporal trends of individual influencing factors. Comparing regression results across a 10-year span introduces scientific limitations, increases workload, reduces spatial clarity, and risks confusing the reader. Although enhanced versions of the GWR model capable of handling panel data do exist [50,51], this study did not apply such techniques due to methodological constraints. Future researchers are encouraged to utilize these improved models and compare their outcomes with those of this study to uncover more information.
Second, the exploratory regression method used in this study serves to strengthen the robustness and optimization of the GWR model. However, its variable selection process may inadvertently exclude influential factors such as climate [52,53] and political elements [54], which could introduce bias into the analysis. For instance, the model’s goodness-of-fit (R2), which ranged from 0.49 to 0.66 as shown in Table 4, reflects this limitation. Future studies are encouraged to refine the GWR model to better accommodate a broader range of explanatory variables and improve model accuracy.
Third, the data employed in this study are sourced from China’s Statistical Yearbook, which contains some missing values. Due to constraints in article length and workload, this study did not address estimation methods for missing data or potential biases inherent in the Yearbook. It is recommended that future studies work toward improving data precision and completeness.
Fourth, the study lacks a sensitivity analysis regarding the stability of the GWR model, due to limitations in research conditions. Future scholars are encouraged to develop approaches—such as integrating machine learning techniques—to enhance the sensitivity and spatial adaptability of such models.
Fifth, this study did not establish specific criteria for evaluating the success of proposed policy interventions, which raises concerns about the practical assessment of their feasibility. Future research could address this gap through comparative case studies of similar resource-dependent regions, such as Inner Mongolia, to evaluate and enhance the applicability of the proposed strategies.
Finally, critical academic research has examined the theory of the water nexus. For instance, while the WEF nexus—upon which this article is based—has garnered substantial support due to its conceptual flexibility, its practical application remains challenging. This is primarily because the policies derived from the nexus framework often lack institutional coordination mechanisms, are difficult to implement across spatial and temporal scales, and face persistent sectoral silos that hinder integration [55,56]. In response to these challenges, Hssein et al. [57] conducted a comprehensive literature on the WEM(Water-Employment-Migration) nexus and found no concrete examples of its implementation at the policy level. Advancing methods for translating water nexus theory into practice should therefore constitute a central research agenda for the field moving forward.

8. Conclusions

The main objectives and innovations of this study are concentrated in three key areas. First, the study quantitatively analyzed the geographically variable formation mechanisms of factors influencing water–energy–food resilience security through the construction of a GWR model, thereby contributing to the methodological diversity in empirical research within this domain. Second, it established a linkage between spatial heterogeneity in influencing factors and policy optimization, aiming to enhance the rationality and efficiency of policy formulation. This approach offers a novel perspective for developing resource management strategies. Finally, the study proposes practical solutions to mitigate the long-term pressures of resource management in Shanxi Province.
The research process undertaken in this study is structured as follows. First, the level of water–energy–food resilience security in 11 cities within Shanxi Province was assessed using established methodologies from prior literature. A spatial autocorrelation test as then conducted using the Moran’s I index, confirming the presence of spatial dependence in WEF resilience security across the province. This result validated the application of the geographically weighted regression (GWR) model.
Second, variables potentially influencing WEF resilience security were identified, and exploratory regression analysis was employed to select those suitable for inclusion in the GWR model—namely, population density, technological innovation, industrial structure, and resource mismatch. Finally, regionally differentiated policy recommendations are proposed based on the GWR model’s outcomes. These recommendations consider two main dimensions of differentiation: (1) ranking the regression coefficients of each variable to formulate tailored strategies for regions at different levels, and (2) ranking the absolute values of the coefficients across the 11 cities to determine policy priorities based on the relative urgency and importance of each influencing factor. This dual approach aims to enhance the effectiveness and efficiency of policy implementation.
The key findings of this study are as follows. First, WEF resilience security in Shanxi Province exhibited significant spatial autocorrelation, with Moran’s I values ranging from 0.013 to 0.043. This indicates the influence of spatial geographic factors on the studied variables and allows for the quantification of spatial heterogeneity. Second, population density, technological innovation, industrial structure, and resource mismatch significantly affected WEF resilience security, with coefficient ranges of −0.48 to −0.90, 0.68 to 1.01, 0.43 to 0.79, and −0.45 to −0.22, respectively. These effects display varying patterns of spatial aggregation and dispersion. Lastly, based on the geographically heterogeneous effects observed, the study proposes optimization strategies that reflect regional variability and prioritize interventions according to the differential influence of key variables.

Author Contributions

R.H. performed the conceptualization, software, validation, formal analysis, investigation, resources, data curation, writing—original draft preparation, project administration and funding acquisition; Y.H. performed methodology and writing—review and editing. All authors have read and agreed to the published version of the manuscript.

Funding

This study was supported by the Science and Technology Innovation Programme for Higher Education Institutions in Shanxi Province in 2023 (No. 2023W110).

Data Availability Statement

The data in the present study can be available from the corresponding author upon reasonable request.

Conflicts of Interest

The authors declare no conflicts of interest.

References

  1. Hoff, H. Understanding the nexus. In Proceedings of the Background Paper for the Bonn 2011 Conference: The Water Energy and Food Security Nexus, Stockholm, Sweden, 16–18 November 2011. [Google Scholar]
  2. Gai, D.H.B.; Shittu, E.; Ethan Yang, Y.; Li, H.-Y. A comprehensive review of the nexus of food, energy, and water systems: What the models tell us. J. Water Resour. Plan. Manag. 2022, 148, 04022031. [Google Scholar] [CrossRef]
  3. Javan, K.; Altaee, A.; BaniHashemi, S.; Darestani, M.; Zhou, J.; Pignatta, G. A review of interconnected challenges in the water–energy–food nexus: Urban pollution perspective towards sustainable development. Sci. Total Environ. 2024, 912, 169319. [Google Scholar] [CrossRef] [PubMed]
  4. Fan, X.; Zhang, W.; Chen, W.; Chen, B. Land–water–energy nexus in agricultural management for greenhouse gas mitigation. Appl. Energy 2020, 265, 114796. [Google Scholar] [CrossRef]
  5. Lu, S.; Zhang, X.; Peng, H.; Skitmore, M.; Bai, X.; Zheng, Z. The energy-food-water nexus: Water footprint of Henan-Hubei-Hunan in China. Renew. Sustain. Energy Rev. 2021, 135, 110417. [Google Scholar] [CrossRef]
  6. Zhou, Y.; Wei, B.; Zhang, R.; Li, H. Evolution of water–energy–food–climate study: Current status and future prospects. J. Water Clim. Change 2022, 13, 463–481. [Google Scholar] [CrossRef]
  7. Srigiri, S.R.; Dombrowsky, I. Analysing the water-energy-food nexus from a polycentric governance perspective: Conceptual and methodological framework. Front. Environ. Sci. 2022, 10, 725116. [Google Scholar] [CrossRef]
  8. Fleischmann, J.; Blechinger, P.; Ribbe, L.; Nauditt, A.; El Achkar, J.H.; Tiwari, K.; Kuleape, R.; Platzer, W. OWEFE—Open modeling framework for integrated water, energy, food, and environment systems. Environ. Res. Infrastruct. Sustain. 2023, 3, 015006. [Google Scholar] [CrossRef]
  9. Naderi, M.M.; Mirchi, A.; Bavani, A.R.M.; Goharian, E.; Madani, K. System dynamics simulation of regional water supply and demand using a food-energy-water nexus approach: Application to Qazvin Plain, Iran. J. Environ. Manag. 2021, 280, 111843. [Google Scholar] [CrossRef]
  10. Li, W.; Jiang, S.; Zhao, Y.; Li, H.; Zhu, Y.; He, G.; Xu, Y.; Shang, Y. A copula-based security risk evaluation and probability calculation for water-energy-food nexus. Sci. Total Environ. 2023, 856, 159236. [Google Scholar] [CrossRef]
  11. Wang, S.; Yang, J.; Wang, A.; Liu, T.; Du, S.; Liang, S. Coordinated analysis and evaluation of water–energy–food coupling: A case study of the Yellow River basin in Shandong Province, China. Ecol. Indic. 2023, 148, 110138. [Google Scholar] [CrossRef]
  12. Cheng, Y.; Wang, J.; Shu, K. The coupling and coordination assessment of food-water-energy systems in China based on sustainable development goals. Sustain. Prod. Consum. 2023, 35, 338–348. [Google Scholar] [CrossRef]
  13. Qi, Y.; Farnoosh, A.; Lin, L.; Liu, H. Coupling coordination analysis of China’s provincial water-energy-food nexus. Environ. Sci. Pollut. Res. 2022, 29, 23303–23313. [Google Scholar] [CrossRef]
  14. Yin, D.; Yu, H.; Lu, Y.; Zhang, J.; Li, G.; Li, X. A comprehensive evaluation framework of water-energy-food system coupling coordination in the Yellow River Basin, China. Chin. Geogr. Sci. 2023, 33, 333–350. [Google Scholar] [CrossRef]
  15. Sun, C.; Yan, X.; Zhao, L. Coupling efficiency measurement and spatial correlation characteristic of water–energy–food nexus in China. Resour. Conserv. Recycl. 2021, 164, 105151. [Google Scholar] [CrossRef]
  16. Chen, Y.; Chen, W. Simulation study on the different policies of Jiangsu Province for a dynamic balance of water resources under the water–energy–food nexus. Water 2020, 12, 1666. [Google Scholar] [CrossRef]
  17. Mu, Y.-Q.; Wu, Y.-J.; Tian, P.; WANG, Y.-Q.; Jin, G. The adaptability of “water-energy-food” system and urban green transformation in the middle reaches of the Yangtze River Economic Zone. J. Nat. Resour. 2024, 39, 2140–2154. [Google Scholar] [CrossRef]
  18. Li, G.J.; Huang, D.; Li, Y.L. Water-energy-food nexus: New perspective on regional sustainable development. J. Cent. Univ. Financ. Econ. 2016, 12, 76–90. [Google Scholar]
  19. Núñez-López, J.M.; Rubio-Castro, E.; Ponce-Ortega, J.M. Involving resilience in optimizing the water-energy-food nexus at macroscopic level. Process Saf. Environ. Prot. 2021, 147, 259–273. [Google Scholar] [CrossRef]
  20. Ioannou, A.E.; Laspidou, C.S. Resilience analysis framework for a water–energy–food nexus system under climate change. Front. Environ. Sci. 2022, 10, 820125. [Google Scholar] [CrossRef]
  21. Huang, R.; Liu, H. Evaluation and External Driving Factors Analysis of Water–Energy–Food Resilience Security—Based on Spatial Durbin Model and Four Provinces Along the Yellow River. Sustainability 2024, 16, 10126. [Google Scholar] [CrossRef]
  22. Herrera-Franco, G.; Bollmann, H.A.; Lofhagen, J.C.P.; Bravo-Montero, L.; Carrión-Mero, P. Approach on water-energy-food (WEF) nexus and climate change: A tool in decision-making processes. Environ. Dev. 2023, 46, 100858. [Google Scholar] [CrossRef]
  23. Chen, S.; Nie, R.; Ding, Y.; Gao, K. Research progress and application exploration of energy system resilience. Sci. Technol. Manag. Res. 2020, 40, 233–242. [Google Scholar]
  24. Zhou, T. New risks and new logics of energy security: From the perspective of system resilience concurrently discussing problem of energy security and strategic thinking under the new logic in China. J. Technol. Econ. 2023, 42, 1–10. [Google Scholar]
  25. Gang, L.; Di, K.; Ming, H.; Liutao, L.; Laixi, H. Spatial-Temporal Characteristics and Driving Factors of Collaborative Security of Water-Energy-Food Linkage System in the Yellow River Basin. Geogr. Geogr. Inf. Sci. 2024, 40, 84. [Google Scholar]
  26. Abulibdeh, A.; Zaidan, E. Managing the water-energy-food nexus on an integrated geographical scale. Environ. Dev. 2020, 33, 100498. [Google Scholar] [CrossRef]
  27. Kurian, M.; Ardakanian, R. Governing the Nexus; Springer: Berlin/Heidelberg, Germany, 2015. [Google Scholar]
  28. Conway, D.; Van Garderen, E.A.; Deryng, D.; Dorling, S.; Krueger, T.; Landman, W.; Lankford, B.; Lebek, K.; Osborn, T.; Ringler, C. Climate and southern Africa’s water–energy–food nexus. Nat. Clim. Change 2015, 5, 837–846. [Google Scholar] [CrossRef]
  29. Bahri, M. Analysis of the water, energy, food and land nexus using the system archetypes: A case study in the Jatiluhur reservoir, West Java, Indonesia. Sci. Total Environ. 2020, 716, 137025. [Google Scholar] [CrossRef]
  30. Niva, V.; Cai, J.; Taka, M.; Kummu, M.; Varis, O. China’s sustainable water-energy-food nexus by 2030: Impacts of urbanization on sectoral water demand. J. Clean. Prod. 2020, 251, 119755. [Google Scholar] [CrossRef]
  31. Jones, J.L.; White, D.D. Understanding barriers to collaborative governance for the food-energy-water nexus: The case of Phoenix, Arizona. Environ. Sci. Policy 2022, 127, 111–119. [Google Scholar] [CrossRef]
  32. Liu, L.; Chen, J.; Wang, C. Spatiotemporal evolution and trend prediction of regional water–energy–food–ecology system vulnerability: A case study of the Yangtze River Economic Belt, China. Environ. Geochem. Health 2023, 45, 9621–9638. [Google Scholar] [CrossRef]
  33. Zhao, Z.M.; Cao, Y.Q.; Chang, Z.D. Coupling coordination analysis of ecological carrying capacity of water and land resources in nine provinces along the Yellow River. Water Resour. Prot. 2023, 39, 121–129. [Google Scholar]
  34. Li, C.; Zhang, S. Chinese provincial water-energy-food coupling coordination degree and influencing factors research. China Popul. Resour. Env. 2020, 30, 120–128. [Google Scholar]
  35. Zhou, Y.; Yang, Y.; Song, Z.; He, Z.; Xia, S.; Ren, Y. Dynamic transition mechanism analysis of the impact of energy development on urbanization in Central Asia. J. Geogr. Sci. 2020, 30, 1825–1848. [Google Scholar] [CrossRef]
  36. Liu, Y.; Ou, C.; Li, Y.; Zhang, L.; He, J. Regularity of rural settlement changes driven by rapid urbanization in North China over the three decades. Sci. Bull. 2023, 68, 2115–2124. [Google Scholar] [CrossRef]
  37. Saray, M.H.; Baubekova, A.; Gohari, A.; Eslamian, S.S.; Klove, B.; Haghighi, A.T. Optimization of Water-Energy-Food Nexus considering CO2 emissions from cropland: A case study in northwest Iran. Appl. Energy 2022, 307, 118236. [Google Scholar] [CrossRef]
  38. Springmann, M.; Clark, M.; Mason-D’Croz, D.; Wiebe, K.; Bodirsky, B.L.; Lassaletta, L.; De Vries, W.; Vermeulen, S.J.; Herrero, M.; Carlson, K.M. Options for keeping the food system within environmental limits. Nature 2018, 562, 519–525. [Google Scholar] [CrossRef]
  39. Bruns, A.; Meisch, S.; Ahmed, A.; Meissner, R.; Romero-Lankao, P. Nexus disrupted: Lived realities and the water-energy-food nexus from an infrastructure perspective. Geoforum 2022, 133, 79–88. [Google Scholar] [CrossRef]
  40. Li, X.; Yang, Y.; Liu, Y.; Liu, H. Impacts and effects of government regulation on farmers’ responses to drought: A case study of North China Plain. J. Geogr. Sci. 2017, 27, 1481–1498. [Google Scholar] [CrossRef]
  41. Sharifi, A.; Yamagata, Y. Principles and criteria for assessing urban energy resilience: A literature review. Renew. Sustain. Energy Rev. 2016, 60, 1654–1677. [Google Scholar] [CrossRef]
  42. Zhang, X.-Y.; Xie, L.-H.; Xiao, J.-H. Government procurement, digital economy development and industrial structure upgrading. Contemp. Financ. Econ. 2024, 43–55. [Google Scholar]
  43. Hua, E.; Han, X.; Bai, Y.; Engel, B.A.; Li, X.; Sun, S.; Wang, Y. Synergy of water use in water-energy-food nexus from a symbiosis perspective: A case study in China. Energy 2023, 283, 129164. [Google Scholar] [CrossRef]
  44. Petrariu, R.; Constantin, M.; Dinu, M.; Pătărlăgeanu, S.R.; Deaconu, M.E. Water, energy, food, waste nexus: Between synergy and trade-offs in Romania based on entrepreneurship and economic performance. Energies 2021, 14, 5172. [Google Scholar] [CrossRef]
  45. Bai, J.; Liu, Y. Can outward foreign direct investment improve the resource misallocation of China. China Ind. Econ 2018, 1, 60–78. [Google Scholar]
  46. Lv, Q.; Liu, H.; Yang, D.; Liu, H. Effects of urbanization on freight transport carbon emissions in China: Common characteristics and regional disparity. J. Clean. Prod. 2019, 211, 481–489. [Google Scholar] [CrossRef]
  47. LeSage, J.; Pace, R.K. Introduction to Spatial Econometrics; Chapman and Hall/CRC: Boca Raton, FL, USA, 2009. [Google Scholar]
  48. Wang, S.; Fang, C.; Ma, H.; Wang, Y.; Qin, J. Spatial differences and multi-mechanism of carbon footprint based on GWR model in provincial China. J. Geogr. Sci. 2014, 24, 612–630. [Google Scholar] [CrossRef]
  49. de Smith, M.J.; Goodchild, M.F.; Longley, P. Geospatial Analysis: A Comprehensive Guide to Principles, Techniques and Software Tools, 6th ed.; The Winchelsea Press: Leicester, UK, 2018. [Google Scholar]
  50. Yu, H.; Fotheringham, A.S.; Li, Z.; Oshan, T.; Wolf, L.J. On the measurement of bias in geographically weighted regression models. Spat. Stat. 2020, 38, 100453. [Google Scholar] [CrossRef]
  51. Chen, F.; Mei, C.-L. Scale-adaptive estimation of mixed geographically weighted regression models. Econ. Model. 2021, 94, 737–747. [Google Scholar] [CrossRef]
  52. Wang, K.; Liu, J.; Xia, J.; Wang, Z.; Meng, Y.; Chen, H.; Mao, G.; Ye, B. Understanding the impacts of climate change and socio-economic development through food-energy-water nexus: A case study of mekong river delta. Resour. Conserv. Recycl. 2021, 167, 105390. [Google Scholar] [CrossRef]
  53. Rasul, G.; Sharma, B. The nexus approach to water–energy–food security: An option for adaptation to climate change. Clim. Policy 2016, 16, 682–702. [Google Scholar] [CrossRef]
  54. Pastor, A.V.; Palazzo, A.; Havlik, P.; Biemans, H.; Wada, Y.; Obersteiner, M.; Kabat, P.; Ludwig, F. The global nexus of food–trade–water sustaining environmental flows by 2050. Nat. Sustain. 2019, 2, 499–507. [Google Scholar] [CrossRef]
  55. Allouche, J.; Middleton, C.; Gyawal, D. Nexus Nirvana or Nexus Nullity? A Dynamic Approach to Security and Sustainability in the Water–Energy–Food Nexus; STEPS Working Paper No. 63; STEPS Centre: Brighton, UK, 2014. [Google Scholar]
  56. Shannak, S.d.; Mabrey, D.; Vittorio, M. Moving from theory to practice in the water–energy–food nexus: An evaluation of existing models and frameworks. Water-Energy Nexus 2018, 1, 17–25. [Google Scholar] [CrossRef]
  57. Hussein, H.; Ezbakhe, F. The water–employment–migration nexus: Buzzword or useful framework? Dev. Policy Rev. 2023, 41, e12676. [Google Scholar] [CrossRef]
Figure 1. Framework diagram of the WEF nexus research perspectives.
Water 17 01540 g001
Figure 2. Core–peripheral structure diagram of the WEF nexus system.
Water 17 01540 g002
Figure 3. Research area in China with map content approval number GS(2024)065.
Water 17 01540 g003
Figure 4. The flowchart of exploratory regression.
Water 17 01540 g004
Figure 5. Coefficients and level classification of the PD regression results.
Water 17 01540 g005
Figure 6. Coefficients and level classification of the TI regression results.
Water 17 01540 g006
Figure 7. Coefficients and level classification of the IS regression results.
Water 17 01540 g007
Figure 8. Coefficients and level classification of the RM regression results.
Water 17 01540 g008
Table 1. Measurement results of WEF nexus resilience security.
Year
City
2014201520162017201820192020202120222023
Taiyuan0.5050.5020.5200.5040.5020.52205430.5720.5910.600
Datong0.3300.3490.3610.3040.3190.3300.3540.3640.3740.384
Yangquan0.3950.3830.4340.3820.4010.4120.4090.4420.4540.460
Changzhi0.3970.3730.4180.4140.3830.3900.3960.4400.4420.479
Jincheng0.4170.4130.4770.4270.4080.4270.4580.4560.4860.490
Shuozhou0.3720.3780.4140.3360.4060.4280.4380.4590.4650.468
Jinzhong0.4170.3640.4530.4350.4140.4200.4370.4600.5020.511
Yuncheng0.3430.3380.3540.3620.3530.3590.3720.3850.3910.396
Xinzhou0.4260.4260.4320.4350.4520.4530.4240.4600.4660.471
Linfen0.4010.3510.3550.3740.3510.3440.3270.3460.3610.364
Lvliang0.2430.2480.3230.3470.3210.3170.3460.3490.3550.357
Table 2. Indicators data sources.
IndicatorsData Sources
Invention patent applications authorized per 10,000 peopleThe China Urban Statistical Yearbook
Total regional grade highway mileage
Total regional employment
Environment protection expenditure
Total regional populationThe Shanxi Statistical Yearbook
Total regional land area
Total regional urban population
Total regional public expenditure
Value of the tertiary industry and secondary industry
Value of the people employed tertiary industry and secondary industry
Amount of freight transported at the end of the yearThe statistical yearbooks of the prefecture-level cities in Shanxi Province
Regional gross domestic product
Retail sales of consumer goods per capitaThe Shanxi Statistical Yearbook and the statistical yearbooks of the prefecture-level cities in Shanxi Province
Table 3. Meaning of the test parameters.
Parameter NamesMeanings
R2Measures the acceptability of the model’s goodness-of-fit.
p-criticality valueMeasures whether each explanatory variable is significant under t-tests.
VIF boundary valueMeasures the presence of multicollinearity across the explanatory variables.
Jarque–Bera p-valueA measure of whether the regression residuals of the model remain spatially autocorrelated.
Table 4. Global Moran’s I from 2014–2023.
Year20142015201620172018
Moran’s I−0.021−0.0070.013 *0.024 *0.019 **
Z value0.4300.6041.9771.9822.352
p value0.4270.7830.0710.0790.011
Year20192020202120222023
Moran’s I−0.0120.023 **0.029 **0.041 ***0.043 ***
Z value0.4822.1042.2272.3903.213
p value0.6300.0410.0260.0010.004
Note: *, **, and *** indicate that Moran’s I holds at the 10%, 5%, and 1% significance levels, respectively.
Table 5. Parameters related to the GWR model in different years.
YearBandwidthAICSigmaResidual
Squares
R2Jarque–Bera
p-Value
VIF
2014869,376.36−98.640.05460.08760.540.62311.42
20151,367,290.04−78.160.06920.08130.520.59041.26
201612,736,278.59×−83.230.0747×0.07940.640.60331.26
201712,736,278.59×−99.650.05610.1460×0.630.60151.33
201812,736,278.59×−107.460.05120.13240.640.69941.41
2019844,656.31−105.430.06340.13380.49×0.70851.40
20201,723,217.34−111.27×0.04780.07950.66√0.74331.29
2021786,803.15√−107.540.05200.08630.630.59781.26
20221,768,734.20−78.13√0.0436√0.0778√0.630.69671.24
202312,367,632.83−96.230.06830.12310.640.72061.23
Note: ‘√’ and ‘×’ indicate that the values are the optimal and worst case parameters for all years, respectively.
Table 6. Ranking of variables regression coefficients and policy prioritization of 11 cities.
Variable
City
PD
(Negative)
TI
(Positive)
IS
(Positive)
RM
(Negative)
Policy Priorities
Taiyuan11168TI > IS > RM > PD
Datong69210IS > PD > TI > RM
Yangquan3845PD > IS > RM > TI
Changzhi9382RM > TI > IS > PD
Jincheng54911TI > PD > IS > RM
Shuozhou7734IS > RM > PD,TI
Jinzhong10276TI > RM > IS > PD
Yuncheng46119PD > TI > RM > IS
Xinzhou8557TI,IS > PD > RM
Linfen211101RM > PD > IS > TI
Lvliang11013PD,IS > RM > TI
Note: The numbers in the table represent the ranking of the absolute values of the regression coefficients of the variables for the corresponding cities. Further, > indicates that derivative policies for the left-hand side variable are prioritized over the right-hand side.
Disclaimer/Publisher’s Note: The statements, opinions and data contained in all publications are solely those of the individual author(s) and contributor(s) and not of MDPI and/or the editor(s). MDPI and/or the editor(s) disclaim responsibility for any injury to people or property resulting from any ideas, methods, instructions or products referred to in the content.

