Abstract
In Taiwan, hydro-meteorological data are fragmented across multiple agencies, limiting the effectiveness of coordinated flood response. To address this challenge and the increasing uncertainty associated with extreme rainfall, a real-time disaster prevention platform has been developed. This system integrates multi-source data and geospatial information through a cluster-based architecture to enhance pluvial flood management. Built on a Service-Oriented Architecture (SOA) and incorporating Internet of Things (IoT) technologies, AI-based convolutional neural networks (CNNs), and 3D drone mapping, the platform enables automated alerts by linking sensor thresholds with real-time environmental data, facilitating synchronized operational responses. Deployed in New Taipei City over the past three years, the system has demonstrably reduced flood risk during severe rainfall events. Region-specific action thresholds and adaptive strategies are continually refined through feedback mechanisms, while integrated spatial and hydrological trend analyses extend the lead time available for emergency response.
1. Introduction
Taiwan faces a variety of natural and man-made hazards, which are further exacerbated by frequent extreme climatic events. Over the years, public organizations, private sectors, and academic researchers on this disaster-prone island have established numerous monitoring stations to collect geological, hydrological, and hydraulic data while also developing a wide range of simulation models and applications. Additionally, web-based informatics infrastructures [1,2,3] have been created to meet the needs of multi-hazard forecasting, preparation, prevention, and mitigation. A cluster of disaster prevention informatics platforms has been constructed across individual districts, cities, and counties. For instance, a real-time prototype of these platforms, covering various regional districts on the island, has been showcased at the Disaster Prevention and Water Environment Research Center (DPWE) (URL: 140.113.136.108, available in Traditional Chinese). Furthermore, the New Taipei City platform (https://www.wrsntpc.ntpc.gov.tw/new_taipei_web/work/login.html, accessed on 1 May 2025), a fully developed commercial product, serves as an example of this autonomous SOA-based, AI plus IoT pluvial flooding system, operating over wireless and wired networks.
The problems faced include the fact that hydrometeorological data in Taiwan are managed by separate agencies: rainfall by the Weather Research and Forecasting Agency, river system water levels by the Water Resources Agency, and stormwater drainage pipeline water depths by the National Land Management Agency, Ministry of the Interior. This fragmentation hinders coordinated flood management. Integrating these datasets with geospatial information is essential for effective flash flood response. Furthermore, in remote/rural areas, data are transmitted via 4G and/or NB-IoT networks, though NB-IoT may introduce delays. To support timely action, transmissions are generally required to be completed within 10 min.
As addressed previously, in the infrastructure, the essential techniques and methodologies employed include Service-Oriented Architecture (SOA), various networking protocols, communication mechanisms, Artificial Intelligence (AI) algorithms, and Internet of Things (IoT) sensing devices with alert warning capabilities [4]. Moreover, this infrastructure is organized as a distributed, hierarchical network both horizontally and vertically. It features a centralized Data Center or cloud that aggregates and integrates engineering parameters and services from distributed cloudlets located in individual cities, districts, or regional counties. Each cloudlet, or Micro Data Center, has its own localized measurements and specialized applications [5,6,7,8].
Researchers and organizations have formed a coalition to seamlessly explore decision-making functionalities and edge computing simulation capabilities for real-time prediction of pluvial flooding events. This initiative involves tasks such as developing machine learning models for flood recognition and classification using CCTV images [9], dynamically allocating and remotely operating pumping machinery [10], and issuing water level warnings through 3-D drone models over river basins and floodplains. In essence, the study has focused on creating a real-time flood prediction management system using SOA-based, AI-integrated Smart IoT devices with alert capabilities [11,12,13]. The study significantly contributes to and plays a crucial role in maintaining and sustaining the livelihoods of people on the island. The overall architecture of the paper, its constituent components, including communication mechanisms, methodologies, applications implemented, and experimental results, are summarized and presented in Figure 1.
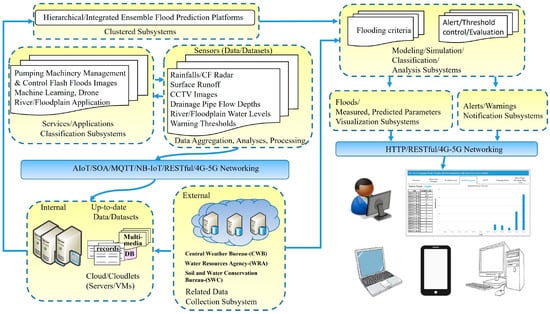
Figure 1.
Overall architecture of the study.
The subsequent sections detail the implementation of the proposed methodology, encompassing comprehensive data acquisition, intelligence integration, and the composability of hydraulic algorithms for real-time flood strategy evaluation. The study is structured around five core components: (1) the collection and preprocessing of relevant datasets; (2) the development of a computational platform, including its architectural design, constituent modules, and inter-module communication protocols; (3) the automation of pump control systems in flood-prone regions; (4) flood condition classification utilizing street-level CCTV imagery of road cross-sections; (5) the measurement and forecasting of water levels within three-dimensional riverine systems. The preliminary findings suggest that this integrative, multi-dimensional framework enhances system resilience to extreme hydrological events, thereby improving public safety and reducing the potential impact of future flooding events [14]. Furthermore, the platform supports adaptive early warning capabilities and configurable threshold-based alert mechanisms [15].
2. Methodologies
The methodologies of the study are illustrated in the following two sections: (1) Three Phases of Water Flow and (2) Skeleton and Components.
2.1. Three Phases of Water Flow
The technologies applied to develop the flooding platform have been designed in three phases [16,17], with a focus on the flow of “water”, as depicted in Figure 2. For example, rainfall is predicted and measured as input into the platform during the First Stage (before a potential flooding phase). The “water” then flows into subsurface, underground stormwater/rainwater drainage networks during the Second Stage (during a potential flooding phase). When these drainage channels reach their capacity or are saturated, the water flows onto the surface, accumulating as surface runoff and potentially leading to a pluvial flooding event in the Third Stage (after the flooding phase).
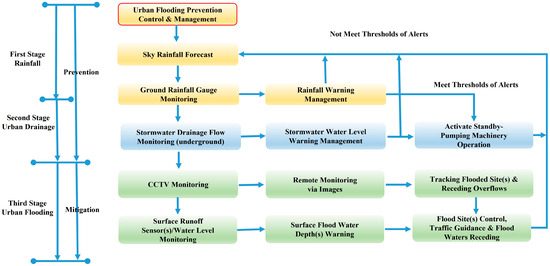
Figure 2.
Stages of water flow, including phases of intelligent inundation events and activities.
Throughout this process, various sensors and monitoring stations, particularly in flood-prone areas, are installed across the regions or counties. The aggregated data, including rainfall amounts, water level depths, pumping machinery operating statuses, and CCTV image datasets, as mentioned in the previous section, are utilized for data analysis, modeling, simulation, or classification to predict, control, and manage urban pluvial flood events. At each stage, flooding thresholds are evaluated, and if the threshold values reach warning levels, real-time flood alerts are issued. The platform provides one-stop access to flood-related information. The key components for reducing the losses from flooding include adequate preparation and lead time, an effective warning system, information communication, and a timely public response [1].
Furthermore, during the process of water flow stages involving data generation and preparation, the platform acts autonomously, which can effectively reduce man-machine interactions and dependence on human experience. These qualities assist decision-makers in satisfying the need for timeliness and reliability during emergency responses [1,2,4,12]. The platform provides an intuitive, clear, highly visual display of information to allow rapid assessment and interpretation of forecast information by a wide range of users with different technical backgrounds.
2.2. Skeleton and Components
The skeleton of this study comprises several key components: (1) data generation and collection encompassing both data creation and dataset compilation; (2) an experimental, clustered, real-time, and interactive web-based flood detection and prevention platform (DPWE) designed to monitor and mitigate flooding events according to individual cities or districts; (3) an integrated, interactive, and commercial web-based flood management system incorporating modules based on SOA, AI, and IoT technologies; (4) flood-related applications and services, including the following modules: (a) Static and Dynamic Control and Management of Pumping Machinery; (b) Multiple Machine Learning Models for Flood Classification Using CCTV Imagery, and (c) Measurement and Forecasting of River/Floodplain System Water Levels. Therefore, advancements in information and earth observation technologies have created new opportunities to improve the management, analysis, modeling, and visualization of disaster-related data within dedicated flood disaster reduction systems [4,12].
The exploration and deployment of the architecture has been emerging, which integrates ensemble techniques, remote sensing of hydrological parameters, translating forecasts into warnings, and disseminating warnings to the public. In addition, the infrastructure has been modified and brings together practical guidance from a “cluster” of research projects in order to adapt or convert climate-induced urban flooding to climate resilience [18,19].
3. Data and Datasets
This study established a framework for systematically evaluating and predicting urban flooding by combining monitored engineering parameters via various sensors, such as rainfall gauges, surface runoff and roadside water level sensors, street cross-section CCTV cameras, and sensors of underground measured stormwater/rainwater pipe flow depths, as well as forecasted water levels in drainage networks or along river basins and floodplains by SOBEK modeling and simulations. These measured/predicted parameters have been used to identify and optimize real-time forecasting and mitigation of extreme flooding events in urban areas of Taiwan.
Moreover, a big data or cloud-based module integrates both existing and newly updated scientific data collected from various sub-modules or regional infrastructure components. In Taiwan, these datasets incorporate but do not solely rely on aggregated ground-based measurements and/or Composite Reflectivity (radar-echo) data [20] while also integrating multiple additional data sources to enable real-time flood monitoring and forecasting. These resources include the following:
- (1)
- QPESUMS (Quantitative Precipitation Estimation and Segregation Using Multiple Sensors);
- (2)
- WRF (Weather Research and Forecasting);
- (3)
- NOAA (National Oceanic and Atmospheric Administration);
- (4)
- WRA (Water Resources Agency);
- (5)
- RMO (River Management Office);
- (6)
- EPA (Environmental Protection Agency);
- (7)
- SWC (Soil and Water Conservation Bureau);
- (8)
- WRPI (Water Resources Planning Institute);
- (9)
- NCDR (National Science and Technology Center for Disaster Reduction).
Detailed data sources provided by the organizations are shown in Table 1.

Table 1.
Data sources provided by the organizations.
This integration enhances real-time flood forecasting and decision-making, providing critical insights for disaster prevention and water resource management. For example, utilizing measured and QPESUMS data, a previous study developed and deployed datasets comprising rainfall intensity hyetographs and simulated inundation depths for a designated area—the Nantun River Basin in Taoyuan City, Taiwan. The approach enabled real-time prediction of potential pluvial flood events [21]. Building upon this foundation, the current study advances the previous work by developing, deploying, and implementing integrated disaster management platforms that offer a one-stop informatics solution for flood response and decision support.
4. A Cluster of Real-Time Interactive Web-Based Flooding Detection and Prevention Platform
At National Yang Ming Chiao Tung University (NYCU), Taiwan, the Disaster Prevention and Water Environment (DPWE) team has developed a prototype disaster forecasting and early warning platform (accessible at 140.113.136.108 in Traditional Chinese). This platform comprises a real-time informatics cluster that spans multiple regional districts across the island. It is currently centered on three major categories of city- and county-specific disaster informatics, with a strong emphasis on water-related science, data, applications, and events. (1) An Urban Flood Forecasting System provides predictions of flash floods in urban areas across cities and counties. (2) Real-Time Rainfall Forecasting utilizes a combination of weather radar-echo estimates and ground-based sensor measurements to forecast rainfall up to 72 h in advance. This information supports the operation and strategic allocation of pumping systems to mitigate, predict, and prevent pluvial flooding during peak rainfall events. It also includes real-time monitoring of river system water levels and alert statuses in urban catchments. (3) Landslide Dam Monitoring observes and evaluates the potential risks associated with landslide dam formation and failure. (4) Hydrological Data Aggregation compiles rainfall statistics, river basin water levels, and real-time sensor data (e.g., QPESUMS). All datasets utilized within the platform are sourced (originated) from open-access databases or official government organizations, as presented and illustrated in Section 3.
As previously introduced, the DPWE platform consists of a network of real-time informatics units, referred to as cloudlets, which are distributed across various regions, districts, and cities throughout the island. Each cloudlet is uniquely configured with functionalities, parameters, and measurement capabilities tailored to the specific needs of its local environment [8]. The platform is primarily designed, deployed, and implemented using web-based RESTful APIs [22], with communication facilitated through JSON-based message exchange mechanisms [23], and data storage and management are supported by a Cassandra time series database at the DPWE as shown in Figure 3.
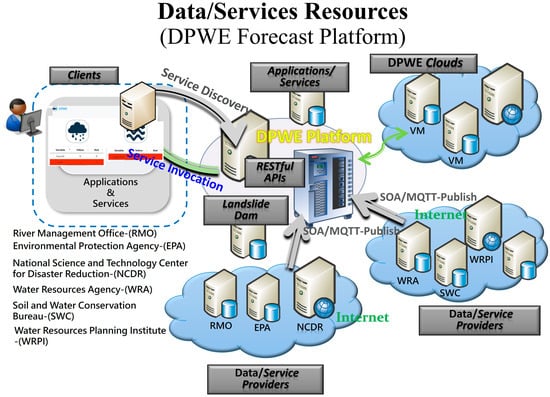
Figure 3.
DPWE disaster forecasting and early warning platform with data and service resources.
5. A Real-Time Commercial and Interactive Web-Based Flooding Detection and Prevention Platform
An interactive, web-based, and multi-stage flood informatics system has been developed and deployed for the New Taipei City environment. It leverages Service-Oriented Architecture (SOA), the Internet of Things (IoT), Artificial Intelligence (AI), and edge computing, interconnected via the Internet and 4G/5G networks. The platform integrates multiple hazardous data sources, machine learning models, and tools for data processing, forecasting, and visualization. Its overall architecture, illustrated in Figure 4, is designed to acquire, manage, transform, analyze, and visualize hydrological datasets through low-coupling modules [24]. Additionally, it incorporates open-source web tools and packages, ensuring accessibility for users regardless of their technical expertise [3]. In other words, this Net-centric framework supports plug-in tools and services, such as hydrological and hydraulic simulation models, enabling runtime composability of coupled systems via SOA [25].
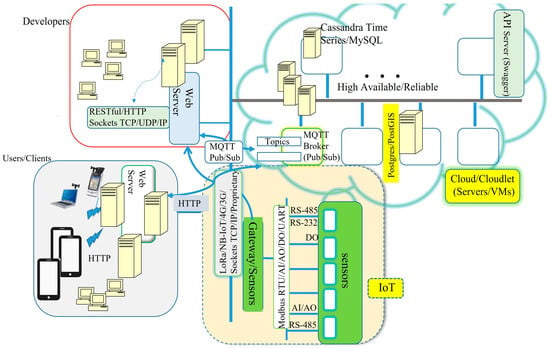
Figure 4.
The overall architecture of New Taipei City’s interactive web-based flooding prevention platform.
The platform consists of four major modules. (1) Users/Clients—This module allows users to access, review, and retrieve engineering parameters, their statuses, charts, and early warning alerts/signals. Users include both civilians and authorized decision-makers. (2) Developers—Developers may come from internal R&D teams or external public/private organizations or sectors. Internal developers can build specific applications using the platform’s data and services, while external developers can integrate or plug in their own services or products into the platform. (3) Micro Data Center—The platform’s data repository is hosted on Microsoft Azure Storage, utilizing multiple Virtual Machines (VMs) to ensure data consistency, reliability, and availability. It interfaces with external applications through Swagger and a set of open-source tools, primarily RESTful APIs [22], using JSON messages [23]. (4) IoT Sensing and Gateway—This module aggregates engineering parameters via multiple communication mechanisms, as shown in the system diagram.
The communication mechanisms among the platform modules are illustrated as follows:
- (1)
- Between sensors (devices) and the gateway (data logger): Communication occurs via RS-232, RS-485, Analog I/O, Digital I/O, or Ethernet, primarily using the Modbus Remote Terminal Unit (Modbus RTU) protocol [26,27].
- (2)
- Between the gateway (data logger) and back-end servers/data repository (Azure Cloud).
- (3)
- Wireless communication via 4G/5G NB-IoT [28] and/or LoRa [29] modules.
- (4)
- Wired communication through TCP/IP Ethernet socket interfaces (TCP/IP socket APIs).
- (5)
- Between developers/users and back-end servers: Interaction is facilitated through TCP/IP socket interfaces, RESTful/HTTP, or MQTT (Message Queuing Telemetry Transport) pub/sub APIs [30].
In this architecture, the developer’s module publishes data into MQTT topics, and the back-end servers subscribe to these topics. MQTT is a lightweight protocol widely used in SOA/IoT applications, enabling efficient system integration. Once the servers receive the data, they are stored in the database server, either in the Data Center or the Azure Cloud. Clients can retrieve the data by accessing the web services RESTful (HTTP) using a request/response communication mechanism [31].
In addition to the Microsoft Azure Cloud’s existing architecture, to increase the performance of the platform in the near future, a cluster of identical servers can be deployed and dispatched dynamically. All the servers are configured to run under load-balancing and failover modes to ensure the platform’s availability, concurrency, and scalability. Firewalls should also be installed to enhance the security of the architecture.
A detailed design and implementation of the overall architecture for this New Taipei City platform, consisting of vertical applications/services, a horizontal communication mechanism among the comprised modules, and networking protocol stacks, is presented in Figure 5. The vertical applications supported by the platform can be categorized into several types. (1) The first type is application servers, e.g., pumping machinery control and management. (2) Web servers handle web accessibility. (3) The third type is API servers (internal/external). The internal API server provides API interfaces for internal developers and engineers, while the external API server offers interfaces for other vendors or government entities. In essence, the external API server enables data sharing and application integration, creating a comprehensive module for disaster prevention and mitigation services in Taiwan. (4) A data upload server aggregates data monitored, measured, and obtained by different vendors or government organizations, further supporting data sharing. (5) A TCP server enables the application’s networking connectivity via socket establishment. (6) An MQTT broker facilitates loosely coupled message exchanges between various clients, services, or application modules [14]. (7) A CCTV server provides real-time video imagery classification displayed in a 3D environment. The communication mechanism, i.e., protocols utilized between or among components/modules, is clearly depicted in this infrastructure diagram, including its associated protocol stacks.
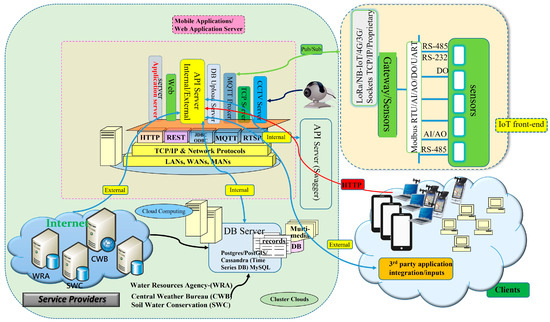
Figure 5.
New Taipei City platform’s detailed architecture with components and communication mechanisms.
The diagram also contains data providers from external entities, for example, data aggregated from the Water Resource Agency (WRA), etc., or internal ones collected by IoT sensors. The IoT engineering parameters of the New Taipei City platform for sensors and monitoring stations includes (1) a water gate controller for irrigation (wireless); (2) rainfall monitoring stations (wireless); (3) CCTV surveillance stations (internet/wired); (4) surface and drainage water levels (wireless); (5) mobile pumping machine stations (wireless); (6) static pumping machine stations (wired); and (7) floodwater level sensors along river basins or floodplains (wireless).
In summary, this platform integrates SOA, AI, and IoT into a multi-layered and multi-stage system with intricately connected components. The process begins with sensors, which collect raw data. This data is then transmitted to an adjacent edge device (gateway), where it is converted into readable digital values and temporarily stored. Once the edge device detects a suitable wireless network or Internet connection, it pushes the locally stored data to a cloud server. The cloud server processes, analyzes, stores, and forwards the data to the end-user device, which is represented by an application software interface. All design considerations and challenges revolve around these interconnected layers and stages, i.e., sensors, edge devices/gateway, cloud servers, and end-user applications [32].
In the platform, the applications have been designed and implemented as a real-time, multi-layered, autonomous control management system [33,34,35,36]. The involved applications are presented from the users’ perspectives in the following sections. In other words, this paper illustrates these applications in practice, while detailed algorithms and design methodologies are reserved for a companion paper [37].
5.1. Pumping Machinery Control and Management Application
Urban flood losses have surged in recent years due to extreme rainfall, inadequate drainage, and rapid urbanization [11,38]. Climate change has increased the frequency of intense storms, overwhelming outdated drainage systems, and making urban flooding increasingly inevitable [19,39]. Conventional infrastructure upgrades alone are insufficient to meet these growing challenges.
This study aims to investigate potential methodologies to mitigate the effects of extreme rainfall and their influence on the drainage infrastructure in New Taipei City [38]. To address this, the study proposes a real-time pumping machinery cyberinfrastructure that integrates AI and IoT technologies for proactive peak flow management [11,19]. Implemented as a service within the platform’s application server, the system leverages IoT sensors, protocol stacks, and modular communication for dynamic control of pump operation remotely. It also includes GPS-enabled location services to manage the deployment of static and mobile pumps in real-time. Additional features support emergency routing and evacuation guidance during flood events.
The sensors monitoring pipe flow depths in subsurface stormwater/rainwater drainage networks are installed at the entrances of manholes. Initially, when the pipe flow depth is low, data is transmitted every 10 min. However, as the flow depth increases, the transmission frequency accelerates to every minute, ensuring timely monitoring and response. This adjustment improves the maintenance of continuous operation of the pumping machinery or triggers preemptive activation of standby equipment. As a result, the urban rainwater drainage network acts as a detention basin, accommodating additional rainwater and reducing the risk of roadside flooding in New Taipei City.
The monitoring strategies of the pipe flow depths (PDs) in stormwater/rainwater drainage systems for automated pumping machines’ operation can be summarized as follows:
- (1)
- If the PD is less than half, continue tracking the pipe flow depth.
- (2)
- If the PD is more than half, the pumping machinery is on standby, or by referring to historical flooding records, start the pumping operation, and predict and estimate the rainfall in 72 h.
- (3)
- If the PD is more than 2/3, continue pumping in order to increase or temporarily maintain subsurface, underground detention storage space; be aware of overflowing from manholes.
According to the status of the water level depth of the drainage system, this autonomous application is focused on exploiting IoT capabilities to monitor, control, and manage pumping machinery allocation and operation automatically and precisely in real time.
5.2. Flood Image Classification Application
Real-time access to environmental visuals is a key component of flood monitoring. The application features a live view function that streams video from cameras installed in flood-prone areas. Users can view up to six camera feeds simultaneously, as shown in Figure 6, and switch between feeds by selecting an available address from a combo box in each view. To ensure smooth performance, the application employs separate threads to handle each camera feed, preventing interference between streams. These live camera views provide immediate insights into current conditions, such as surface, roadside water levels, and other critical flood indicators, allowing users to monitor the environmental situation in real time.
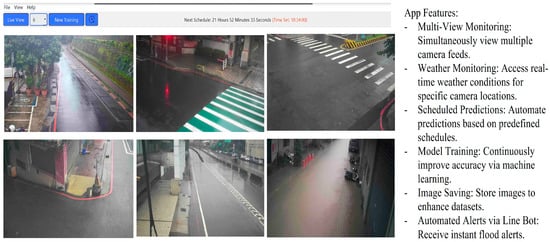
Figure 6.
Real-time CCTV monitoring with support for up to 6 channels.
In addition, the application enhances flood image classification by leveraging CNN architectures (VGG-19, ResNet101v2, InceptionV3, and InceptionResNetV2) on a diverse CCTV image dataset [40,41,42]. It accurately detects floods by integrating backbone models into a desktop tool, including real-time monitoring of live CCTV feeds, and flooding image classification and prediction, as well as automated potential flood alerts via Line Bot. Furthermore, through deep learning backbone classifications, flooding feature parameters are detected and extracted. These trained features are then used to predict potential flooding events, identify inundated images, and generate real-time flooding maps.
Key features of the application include the following:
- Multi-View Monitoring: Simultaneously view multiple camera feeds.
- Weather Monitoring: Access real-time weather conditions for specific camera locations.
- Scheduled Predictions: Automate predictions based on predefined schedules.
- Model Training: Continuously improve accuracy through machine learning.
- Image Saving: Store newly collected images to enhance the dataset.
- Automated Alerts via Line Bot: Receive instant flood alerts.
As illustrated previously, this study developed a user-friendly desktop-based flood classification and detection application with web interactive access, as indicated in Figure 7, to monitor road and street intersection CCTVs, particularly in flood-prone areas. The application provides real-time road condition updates to assist in preventing traffic congestion and support proactive decision-making when flooding occurs [40,41,42]. Moreover, the application continuously integrates newly collected datasets into trained CNN models to improve prediction accuracy.
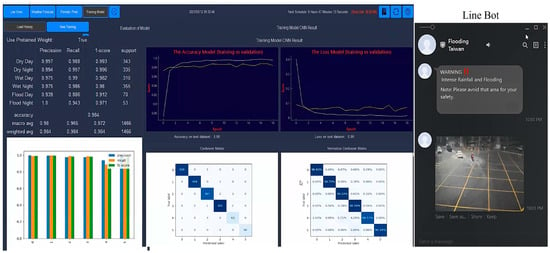
Figure 7.
An example of a web interactive flood classification application with automatic Line message generation based on predicted results.
5.3. River System UAV Technology Application
Unmanned Aerial Vehicles (UAVs), commonly known as drones, offer exciting new perspectives for monitoring and measuring in rivers and streams. For the recent drone application, the DJI Phantom is incorporated with a new real-time kinematics (RTK) system to maintain positional accuracy and deliver survey-grade data to the platform, establish a three-dimensional (3D) numerical model of the river course(s), and manage river systems, including investigation, evaluation, and variance analysis of the two river systems in New Taipei City. Moreover, based upon the aggregated historical data, the platform can further analyze, plan, layout, and install adequate or additional sensors covering locations in river basins in order to detect possible flaws of the Bridge Piers and forecast future 24 h measured/observed water levels of the river systems, as well as issue warnings if necessary. Understanding exactly what is happening and where the need is most urgent in the city via air can be of great assistance to estimate and issue early warnings of river basin and floodplain inundation, as presented in Figure 8.
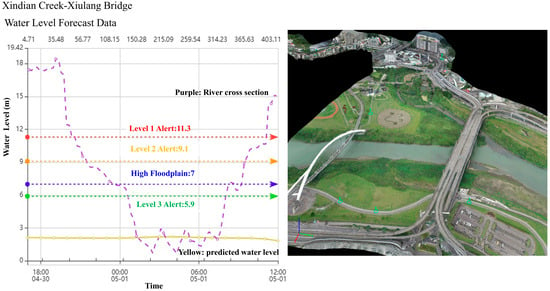
Figure 8.
Forecasting future 72 h measured/observed and predicted water levels in Tamsui River System.
In the diagram, the colored water levels are indicated as follows: yellow—measured/predicted data (because there is no rainfall, the measured and predicted data are identical); purple—cross-section of the river; blue—floodplain water level, 7 m above the sea level; red—first degree alert, 11.3 m above the sea level; orange—second degree alert, 9.1 m above the sea level; green—third degree alert, 5.9 m above the sea level; x-coordinate: time; y-coordinate: elevation (sea level elevation = 0) in meters.
6. Results and Discussion
Urban environments increasingly face climate-related risks, particularly extreme precipitation events that surpass traditional drainage capacity. In Taiwan, intense convective rainfall during summer frequently results in short-term urban flooding. Given the limitations of structural solutions in rapidly mitigating such events, government agencies have integrated non-structural, IoT-enabled approaches to improve drainage performance and flood resilience.
6.1. Adaptive Strategies and IoT Integration for Urban Flood Risk Management in Response to Climate Change
This study has developed and implemented an adaptive, intelligent urban flood management platform for New Taipei City, which is presented in Figure 9 and Figure 10. In Figure 9, there are three main components, as illustrated in the diagram, and in Figure 10, the visualized results are displayed interactively.
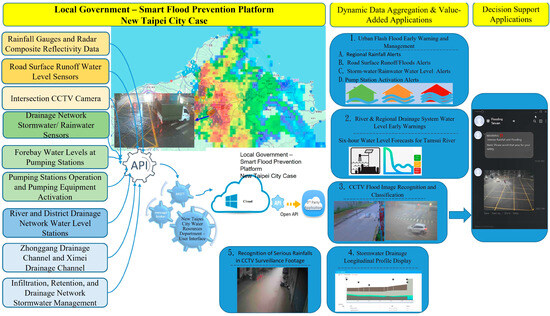
Figure 9.
Adaptive urban flood management platform and technologies in New Taipei City.
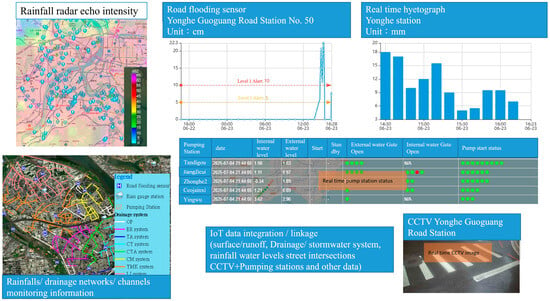
Figure 10.
Interactively visualized displays of New Taipei City’s urban flood platform.
- IoT-Based Hydrological Data Infrastructure
In the diagram, the frontend system collects and aggregates real-time environmental and hydrological data from (1) rainfall gauges and Composite Reflectivity (radar-echo) data; (2) ensemble precipitation forecasts; (3) water levels in rivers, regional drains, and stormwater pipelines; (4) pump station forebay water levels; (5) road surface inundation sensors; (6) intersection CCTV feeds; and (7) mobile pumping equipment statuses and locations. These data sources provide comprehensive situational awareness of rainfall intensity, runoff conditions, local inundation, and pumping equipment operations.
- 2.
- Interactive Flood Monitoring and Response Interface
The mid-tier platform features a web-based dashboard that visualizes real-time monitoring data using synchronized spatial and temporal displays. A six-panel layout (Figure 11, Figure 12 and Figure 13) links associated hydrological data, allowing users to quickly assess and respond to flood conditions. This interface facilitates real-time coordination of emergency measures, such as pump activation, traffic control, and resource allocation. The six-panel layout is illustrated in the following section.
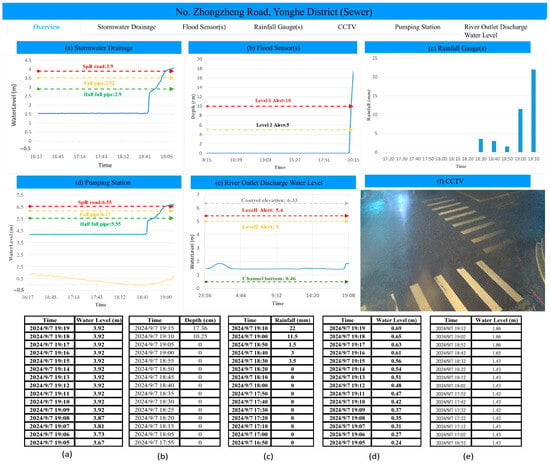
Figure 11.
Scenario 1: Six-panel dashboard layouts and real-time adaptive responses.
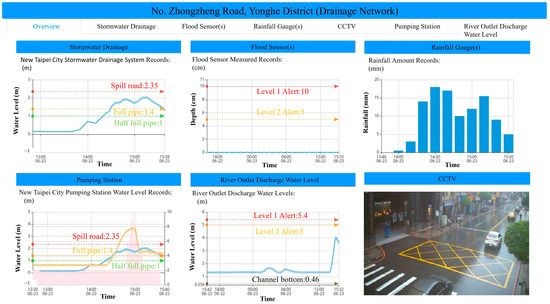
Figure 12.
Scenario 2: Six-panel dashboard layouts and real-time adaptive responses.
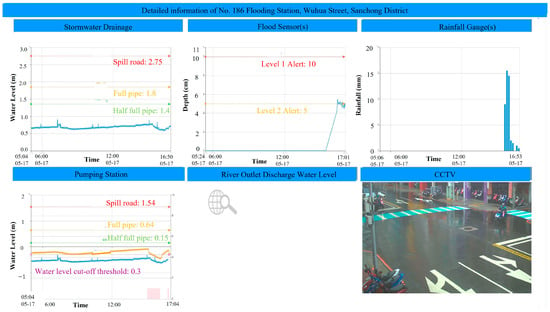
Figure 13.
Scenario 3: Six-panel dashboard layouts and real-time adaptive responses.
- 3.
- Backend Intelligent Alert and Warning System
This module defines alert thresholds for various monitored parameters. For instance, if rainfall exceeds 10 mm within 10 min, an early warning notification is triggered. If rainfall exceeds 40 mm in 30 min, automated alerts are sent to activate pump equipment operation and close lateral sliding floodgates. Correlated alert thresholds are also established for water levels in rivers and roadside drains, stormwater/rainwater network pipe flow depths, and intersection camera data, thereby enabling real-time situational awareness and responsive flood mitigation actions. Integrated thresholds across rainfall, water levels, and sensor imagery enable a rule-based decision system that initiates appropriate responses and communicates alerts to frontline personnel.
6.2. Operation Case Study
A six-panel system includes six real-time sensing and monitoring engineering measures: (1) stormwater drainage network pipe flow depths at the top-left panel; (2) surface runoff water levels at the top-center panel; (3) histogram of rainfall amounts at the top-right panel; (4) pumping machinery statuses and water levels of forebay at the bottom-left panel; (5) river outlet water levels at the bottom-center panel, and (6) CCTV images at the bottom-right panel. This six-panel layout presents synchronized multi-source data, supporting the coordination of traffic control, emergency deployment, and dewatering operations during flooding events in the city. There are three scenarios presented as follows:
6.2.1. Scenario 1: Six-Panel Dashboard Layouts and Real-Time Adaptive Responses
In a real event on a summer evening, rainfall at the Yonghe station exceeded 10 mm/10 min at 19:00, prompting alerts and the pump station to stand by. By 19:09, stormwater pipe flow depths at Guoguang Rd exceeded overflow thresholds, followed by inundation sensor alerts and visual inundation confirmation via CCTV. The system automatically escalated the situation, guiding local personnel to implement road closures and deploy mobile pumps. Despite rainfall intensities exceeding designed drainage standards (22 mm/10 min), early pump operation and control prevented widespread flooding. The detailed real rainfall scenario and response process in Figure 11, with tables of real-time sensing engineering measures (1)–(5) accordingly, are illustrated clearly as follows:
- Early warning of histogram of rainfall amounts (top-right panel): At 19:00, rainfall at Yonghe Station exceeded 10 mm/10 min, triggering an early warning. Rising water levels prompted downstream pumping stations to enter standby.
- Overflow alert of pipe flow depths (top-left panel): At 19:09, water in the Yonghe Guoguang Rd No. 16 pipeline surpassed the overflow threshold, indicating possible surface flooding and triggering a warning.
- Surface flood alert of surface runoff water levels (top-center panel): At 19:10, a surface water level sensor at No. 35 Guoguang Rd detected a water depth of 10.25 cm, exceeding the flood alert level. A flood response alert was issued.
- Visual inundation confirmation (bottom-right panel): CCTV at 19:10 showed visible surface flooding on Guoguang Rd.
- Rainfall persistence (top-right panel, continued): Rainfall remained above 10 mm/10 min at 19:10. Composite Reflectivity (radar-echo) data confirmed continued heavy rainfall, justifying ongoing standby at pumping stations.
- Outfall load of river outlet water levels (bottom-center panel): Rising water levels at the stormwater outfall indicated increased discharge demand downstream.
- Pump activation (bottom-left panel): At Wayao Pumping Station, upstream inflow raised the forebay level. Once it reached the threshold, pumps were activated to reduce water levels.
6.2.2. Scenario 2: Six-Panel Dashboard Layouts and Real-Time Adaptive Responses
In Figure 12, without tables of sensing engineering measures, the adaptive response unfolded and is summarized as follows:
- At 14:00, rainfall began at the Yonghe Rain Gauge Station (top-right panel), and within 20 min, the 10 mm/10 min warning threshold was exceeded. Composite Reflectivity (radar-echo) data indicated continued rainfall. Meanwhile, the Wayao Pumping Station (bottom-left panel) had already executed pre-rainfall drawdown measures and continued monitoring water level trends.
- By 14:20, the stormwater drainage channel under Zhongzheng Road in Yonghe exceeded 50% capacity. Real-time water level monitoring was switched to 1 min intervals. By 14:30, the system reached full-pipe (pressurized) conditions. The Wayao Pumping Station received instructions to activate additional pumping units within 5 min. Full deployment was achieved within 10 min to expedite reducing internal drainage.
- By 15:00, rainfall intensity slightly decreased, though another rainband followed shortly. Pumping operations continued uninterrupted to handle this second wave.
- This second rainfall event persisted for approximately 30 min. Full-pipe conditions in the stormwater drainage system remained for about one hour before a noticeable drop in drainage pipe flow depth was observed. Although the pumping station forebay water level began to decline, it maintained a high-capacity operation. As shown in the bottom-center panel, preemptive pump operations created additional storage capacity within the drainage system, helping maintain lower surface water levels in the area.
- Despite total accumulated rainfall exceeding the allowed threshold of the stormwater drainage system and the system remaining at full capacity for an extended period, the adaptive operational strategy prevented any surface flooding or overflow. It successfully achieved the objectives of water-level reduction and flood disaster prevention during this high-intensity rainfall event.
6.2.3. Scenario 3: Six-Panel Dashboard Layouts and Real-Time Adaptive Responses
As described earlier, the six-panel (hexapanel) monitoring interface is based on the spatial and hydraulic connectivity of monitored locations. Each panel dynamically presents historical trend data from the nearest and most relevant monitoring locations within the same drainage system. If no upstream or downstream connections exist (i.e., the location is hydraulically independent and discharges directly into a river or channel), the corresponding panel is left blank, as illustrated in Figure 13 (without tables of sensing engineering measures). For instance, in the bottom-center panel of Figure 13, the absence of data indicates that no adjacent monitoring equipment is available for that section. Under actual rainfall events, the six-panel dashboard facilitates a comprehensive situational overview and supports a staged adaptive response, which is exemplified as follows:
- The top-right panel shows a rainfall event exceeding the predefined warning threshold, triggering a system alert to prepare the downstream pumping station by draining its forebay in anticipation of increased inflow.
- The bottom-right panel displays live video footage of the site, showing no significant surface flooding.
- The top-center panel indicates water accumulation from the surface water level sensor. However, since the top-left panel shows that the adjacent stormwater drainage has not reached full capacity, the system infers localized ponding—likely due to clogged inlets—which can be resolved by clearing nearby drainage inlets manually.
By dynamically displaying water-related data collected from various sensors in real time, this six-panel layout can enhance the coordination of disaster response resources and the implementation of flood hazard mitigation in inundated zones.
6.3. Platform Uncertainty and Limitations
- Uncertainty in IoT Systems
There are uncertainties associated with IoT devices. During heavy rainfall or typhoons, data transmission may be delayed or interrupted, making real-time processing impossible. Human-induced uncertainties, such as vandalism, may also lead to damaged monitoring equipment. This study utilizes surrounding information and radar-echo data to assist in validating and improving data accuracy.
- On-Site Limitations
During heavy rainfall or typhoons, on-site repairs are generally not possible within 1–6 h (with a target of completing repairs within 24 h), resulting in incomplete information. Backup power systems can only support operations for 6 to 12 h during a power outage. Additionally, 4G network issues cannot be resolved immediately and require repair by telecommunications providers.
6.4. Discussion
In this study, the DPWE platform is a prototype disaster forecasting and early warning system designed to support flood and/or typhoon response across multiple districts in Taiwan, including Hsinchu City, Hsinchu County, Chiayi County, etc. Accessible via a web interface (http://140.113.136.108, accessed on 1 May 2025 in Traditional Chinese), the platform integrates real-time data from various governmental agencies to assist both research and operational decision-making. Physically hosted and managed by the DPWE, the system consolidates open data to provide localized services—termed “cloudlets”—for each participating city or county, with the exception of Taipei and New Taipei City. While the platform has not undergone stress testing and lacks inter-cloudlet communication, the DPWE serves as the central node supplying the software and hardware infrastructure. The system is particularly targeted at supporting remote or resource-constrained regions in central and southern Taiwan and continues to expand its coverage and capabilities. In contrast, the New Taipei City platform is a fully developed commercial product. It requires authentication and authorization for access and is primarily used by high-ranking government officials during flood disaster events.
This adaptive flood management platform demonstrates the effectiveness of IoT-enabled systems in enhancing urban resilience to flash floods. By integrating real-time monitoring, visual analytics, and automated alert–response mechanisms, the system reduces flood duration and improves emergency responsiveness. Using New Taipei City, Taiwan, as an example, the results from three years of implementation show that under similar extreme rainfall events, the adaptive strategies developed for each drainage region have effectively improved outcomes and reduced flood risk. As a result, data collection and professional judgment can be completed approximately 30–60 min earlier than before, thus gaining valuable lead time for emergency response and reducing the impact of disasters.
Each monitoring device is assigned alert and action threshold values. When these thresholds are reached, the system automatically sends notifications to both management authorities and on-site personnel to facilitate timely follow-up and emergency response. In general, for different types of monitoring instruments, two threshold levels are defined: one for alert and one for action. For example, rainfall of 10 mm within 10 min triggers an alert, while 40 mm within 30 min triggers action. For roadside/surface runoff sensors, water levels of 5 cm and 10 cm correspond to alert and action thresholds, respectively. For stormwater drainage pipes, a half-full pipe triggers an alert, while a full pipe triggers action. In low-lying areas, site-specific thresholds are adjusted based on hydrologic and hydraulic modeling. This adaptive approach assists in reducing the likelihood of flooding.
Based on monitoring data and the implementation of adaptive human intervention strategies over approximately three years, the system has demonstrated effective flood mitigation performance in New Taipei City. During rainfall-induced flooding events, the following occurred:
- Approximately 80% of localized water accumulation cases receded within 10–20 min after the rainfall intensity decreased.
- An additional 15% receded within 30 min.
The other cases, mostly involving large-scale drainage systems, were resolved within 1–2 h.
Moreover, the AI agent is used for forecasting and disaster resource allocation. AI algorithms are applied to real-time early warning and decision-making processes. Based on specified rainfall thresholds, the system identifies events requiring attention, estimates allowable response times, and guides corresponding action decisions, for example, pumping equipment operation. Additionally, it focuses on leveraging CNN models to classify CCTV images, specifically aiming to detect urban flash floods. By analyzing the features within an image, the CNN models determine whether flooding has occurred.
Prior to this study, the “IoT monitoring and adaptive operations for flash floods” approach did not exist. It was developed in response to severe flooding caused by intense rainfall events. Since its implementation, no flooding events have occurred under similar rainfall conditions in New Taipei City. This demonstrates that adaptive strategies, informed by big data analysis, can effectively prevent flooding under comparable rainfall intensities.
7. Conclusions
A three-stage water flow framework (Figure 2) has been developed in Taiwan to enhance urban flash flood response and management. Stage 1 involves monitoring atmospheric parameters and initiating pre-alert actions. Stage 2 focuses on real-time measurement of water levels within subsurface stormwater and rainwater drainage pipelines, assessed against predefined alert thresholds. Stage 3 addresses surface flooding, detected via water level sensors and/or CCTV-based image classification. In this stage, response strategies are based on two scenarios: (a) If nearby drainage systems retain capacity, the flooding is likely due to local inlet blockage and can be resolved by debris removal; (b) If surrounding areas are saturated, systemic overload is inferred, prompting on-site control and reporting. These insights are visualized through a six-panel monitoring interface that integrates upstream rainfall, surface runoff, drainage system status, and pumping machinery operation, as well as real-time CCTV imagery, as detailed in Section 6. If both surface flooding and full-capacity conditions in the adjacent stormwater drainage network are reached, this indicates a systemic drainage issue. On-site personnel are required to manage traffic and prevent the flooded area from expanding, which could result in further damage. These conditions must be reported back to the platform for system-level diagnosis and delineation of the affected area.
Previously, data were dispersed across various agencies. This study is the first time a system-wide data integration has been implemented. For example, prior to system implementation, collecting rainfall, water level, and drainage data required significant time and effort across multiple sources. Data integration time is reduced by approximately one hour, and the accuracy of spatial water condition information is improved. For data transmitting, in remote/rural areas, data are transmitted via 4G and/or NB-IoT networks, though NB-IoT may introduce delays. To support timely action, transmissions are generally required to be completed within 10 min.
The study aims to improve flood mitigation outcomes and reduce risk during extreme rainfall events. Action thresholds and adaptive strategies are regionally defined and continuously refined through data integration and system feedback. The primary focus is on prioritizing flood-prone areas, where appropriate monitoring instruments are installed to meet disaster prevention needs. In addition, supplementary data—such as radar-echo or simplified rainfall gauges—are used to support on-site monitoring/measurement requirements. Across all 22 counties and cities in Taiwan at present, there are a total of 16,653 surface water level sensors and 2090 subsurface stormwater drainage pipeline sensors, including 250 located in New Taipei City alone. Additionally, New Taipei City has 1173 rainfall monitoring stations (URL: https://iotmanage.wra.gov.tw/, accessed on 1 May 2025 in Traditional Chinese).
Furthermore, the uncertainties caused by incremental climate change are addressed through IoT monitoring data and operational measures. During a high-intensity rainfall event, cumulative rainfall exceeded the design capacity of the stormwater drainage system. However, proactive water level reduction, supported by real-time monitoring and adaptive pumping strategies, kept the system operating at low internal water levels. Although the drainage system remained at full capacity for an extended period, these coordinated measures prevented overflow and surface flooding, achieving effective flood mitigation. In conclusion, the system has demonstrated improved flood mitigation outcomes and reduced risk during similar extreme rainfall events. Action thresholds and adaptive strategies are regionally defined and continuously refined through data integration and system feedback.
Author Contributions
Conceptualization, S.-H.Y., X.-J.W. and S.-L.H.; methodology, S.-L.H., X.-J.W. and S.-H.Y.; software, X.-J.W., S.-T.W. and S.-L.H.; validation, S.-L.H., D.-L.C. and X.-J.W.; writing—original draft preparation, S.-L.H., X.-J.W., D.-L.C. and S.-H.Y.; writing—review and editing, S.-L.H. and D.-L.C.; supervision, S.-H.Y., D.-R.S., J.-H.P. and K.-C.Y. All authors have read and agreed to the published version of the manuscript.
Funding
This research received no external funding.
Data Availability Statement
The data presented in this study are available on request from the corresponding author.
Conflicts of Interest
The authors declare no conflicts of interest.
References
- Demir, I.; Krajewski, W.F. Towards an integrated Flood Information System: Centralized data access, analysis, and visualization. Environ. Model. Softw. 2013, 50, 77–84. [Google Scholar] [CrossRef]
- Demir, I.; Yildirim, E.; Sermet, Y.; Sit, M.A. FLOODSS: Iowa flood information system as a generalized flood cyberinfrastructure. Int. J. River Basin Manag. 2018, 16, 393–400. [Google Scholar] [CrossRef]
- Mohanty, M.P.; Karmakar, S. WebFRIS: An efficient web-based decision support tool to disseminate end-to-end risk information for flood management. J. Environ. Manag. 2021, 288, 112456. [Google Scholar] [CrossRef] [PubMed]
- Qiu, L.; Du, Z.; Zhu, Q.; Fan, Y. An integrated flood management system based on linking environmental models and disaster-related data. Environ. Model. Softw. 2017, 91, 111–126. [Google Scholar] [CrossRef]
- Xu, D.; Li, T.; Li, Y.; Su, X.; Tarkoma, S.; Jiang, T.; Crowcroft, J.; Hui, P. Edge Intelligence: Architectures, Challenges, and Applications. Proc. IEEE 2021, 109, 1778–1837. [Google Scholar] [CrossRef]
- Li, S.; Xu, L.D.; Zhao, S. 5G Internet of Things: A survey. J. Ind. Inf. Integr. 2018, 10, 1–9. [Google Scholar] [CrossRef]
- Hasko, R.; Shakhovska, N.; Vovk, O.; Holoshchuk, R. A Mixed Fog/Edge/AIoT/Robotics Education Approach Based on Tripled Learning. 2020, CEUR-WS, Volume 2616, p. 19. Available online: https://ceur-ws.org/Vol-2616/ (accessed on 1 May 2025).
- Nobert, S.; Demeritt, D.; Cloke, H. Informing operational flood management with ensemble predictions: Lessons from Sweden. J. Flood Risk Manag. 2010, 3, 72–79. [Google Scholar] [CrossRef]
- Taye, M.M. Theoretical Understanding of Convolutional Neural Network: Concepts, Architectures, Applications, Future Directions. Computation 2023, 11, 52. [Google Scholar] [CrossRef]
- Kuo, Y.-W.; Wen, W.-L.; Hu, X.-F.; Shen, Y.-T.; Miao, S.-Y. A LoRa-Based Multisensor IoT Platform for Agriculture Monitoring and Submersible Pump Control in a Water Bamboo Field. Processes 2021, 9, 813. [Google Scholar] [CrossRef]
- Goyal, H.R.; Ghanshala, K.K.; Sharma, S. Post flood management system based on smart IoT devices using AI approach. Mater. Today Proc. 2021, 46, 10411–10417. [Google Scholar] [CrossRef]
- Chang, L.-C.; Chang, F.-J.; Yang, S.-N.; Kao, I.-F.; Ku, Y.-Y.; Kuo, C.-L.; Amin, I.M.Z.b.M. Building an Intelligent Hydroinformatics Integration Platform for Regional Flood Inundation Warning Systems. Water 2019, 11, 9. [Google Scholar] [CrossRef]
- Rahman, M.S.; Ghosh, T.; Aurna, N.F.; Kaiser, M.S.; Anannya, M.; Hosen, A.S.M.S. Machine learning and internet of things in industry 4.0: A review. Meas. Sens. 2023, 28, 100822. [Google Scholar] [CrossRef]
- Doll, B.A.; Kurki-Fox, J.J.; Line, D.E. A Framework for Planning and Evaluating the Role of Urban Stream Restoration for Improving Transportation Resilience to Extreme Rainfall Events. Water 2020, 12, 1620. [Google Scholar] [CrossRef]
- Martina, M.L.V.; Todini, E.; Libralon, A. A Bayesian decision approach to rainfall thresholds based flood Warning. Hydrol. Earth Syst. Sci. 2006, 10, 413–426. [Google Scholar] [CrossRef]
- Sun, W.; Bocchini, P.; Davison, B.D. Applications of artificial intelligence for disaster management. Nat. Hazards 2020, 103, 2631–2689. [Google Scholar] [CrossRef]
- Abid, S.K.; Sulaiman, N.; Chan, S.W.; Nazir, U.; Abid, M.; Han, H.; Ariza-Montes, A.; Vega-Muñoz, A. Toward an Integrated Disaster Management Approach: How Artificial Intelligence Can Boost Disaster Management. Sustainability 2021, 13, 12560. [Google Scholar] [CrossRef]
- Todini, E.; Alberoni, P.; Butts, M.; Khatibi, C.C.R.; Samuels, P.; Weerts, A. ACTIF Best Practice Paper—Understanding and Reducing Uncertainty in Flood Forecasting. In Proceedings of the International Conference on Innovation, Advances and Implementation of Flood Forecasting Technology, Tromsø, Norway, 17–19 October 2005. [Google Scholar]
- Dharmarathn, G.; Waduge, A.O.; Bogahawaththa, M.; Rathnayake, U.; Meddage, D.P.P. Adapting cities to the surge: A comprehensive review of climate-induced urban flooding. Results Eng. 2024, 22, 102123. [Google Scholar] [CrossRef]
- Todini, E. A Bayesian technique for conditioning radar precipitation estimates to rain-gauge measurements. Hydrol. Earth Syst. Sci. 2001, 5, 187–199. [Google Scholar] [CrossRef]
- Chang, D.-L.; Yang, S.-H.; Hsieh, S.-L.; Wang, H.-J.; Yeh, K.-C. Artificial Intelligence Methodologies Applied to Prompt Pluvial Flood Estimation and Prediction. Water 2020, 12, 3552. [Google Scholar] [CrossRef]
- RESTful Web API Design. Available online: https://learn.microsoft.com/en-us/azure/architecture/best-practices/api-design (accessed on 4 April 2025).
- Introducing JSON. Available online: https://www.json.org/json-en.html (accessed on 4 April 2025).
- Erazo, C.; Sermet, Y.; Molkenthin, F.; Demir, I. HydroLang: An Open-Source Web-Based Programming Framework for Hydrological Sciences. July. 2021. Available online: https://eartharxiv.org/repository/view/2515/ (accessed on 1 May 2025).
- Mittal, S.; Risco-Martín, J.L.; Zeigler, B.P. DEVS/SOA: A Cross-Platform Framework for Net-centric Modeling and Simulation in DEVS Unified Process. arXiv 2024, arXiv:2407.03686. [Google Scholar] [CrossRef]
- Modbus Protocol Overview. Available online: https://www.rtautomation.com/technologies/modbus-rtu/ (accessed on 24 June 2023).
- Modbus Manual. Available online: https://www.rtaautomation.com/technologies-2/modbus-rtu/ (accessed on 24 June 2023).
- AT Commands Examples for u-blox Cellular Modules Application Note, UBX-13001820-R12. Available online: www.u-blox.com (accessed on 1 May 2025).
- LoRa. Available online: https://lora.readthedocs.io/en/latest/ (accessed on 4 April 2025).
- OASIS Standard. MQTT Version 5.0. Available online: https://www.oasis-open.org/standard/mqtt-v5-0-os/ (accessed on 1 May 2025).
- Chen, X.; Ye, X.; Carroll, M.C.; Li, Y. Online Flood Information System: REST-Based Web Service. Int. J. Appl. Geospat. Res. 2014, 5, 10. [Google Scholar] [CrossRef][Green Version]
- NRT0401, Understanding IoT Architecture: Layers and Components. Available online: https://medium.com/@teja.ravi474/understanding-iot-architecture-layers-and-components-1d86ef433706 (accessed on 5 October 2024).
- Wei, C.-C.; Hsu, N.-S.; Huang, C.-L. Two-Stage Pumping Control Model for Flood Mitigation in Inundated Urban Drainage Basins. Water Resour. Manag. 2013, 28, 425–444. [Google Scholar] [CrossRef]
- Li, K.; Wang, Y.; Fan, X. Control system design of the pumping station. IOP Conf. Ser. Mater. Sci. Eng. 2018, 394, 032129. [Google Scholar] [CrossRef]
- Karar, M.E.; Al-Rasheed, M.F.; Al-Rasheed, A.F.; Reyad, O. IoT and Neural Network-Based Water Pumping Control System for Smart Irrigation. Inf. Sci. Lett. 2020, 9, 107–112. [Google Scholar] [CrossRef]
- Liu, Y.; Xia, Z.; Deng, H.; Zheng, S. Two-Stage Hybrid Model for Efficiency Prediction of Centrifugal Pump. Sensors 2022, 22, 4300. [Google Scholar] [CrossRef]
- Yang, S.-H.; Hsieh, S.-L.; Wang, X.-J.; Chang, D.-L.; Song, D.-R.; Pan, J.H.; Yeh, K.-C. Adaptive Urban Stormwater Strategies by AI-Based Pumping Machinery Management and Image Recognition. Remote Sens. 2025; in preparation. [Google Scholar]
- Xiong, L.; Yan, L.; Du, T.; Yan, P.; Li, L.; Xu, W.T. Impacts of Climate Change on Urban Extreme Rainfall and Drainage Infrastructure Performance: A Case Study in Wuhan City, China. Irrig. Drain. 2018, 68, 152–164. [Google Scholar] [CrossRef]
- Arnbjerg-Nielsen, K.; Willems, P.; Olsson, J.; Beecham, S.; Pathirana, A.; Gregersen, I.B.; Madsen, H.; Nguyen, V.-T.-V. Impacts of climate change on rainfall extremes and urban drainage systems. Water Sci. Technol. 2013, 68, 16–28. [Google Scholar] [CrossRef]
- Mosaffa, H.; Sadeghi, M.; Mallakpour, I.; Jahromi, M.N.; Pourghasemi, H.R. Application of machine learning algorithms in hydrology. In Computers in Earth and Environmental Sciences, Artificial Intelligence and Advanced Technologies in Hazards and Risk Management; Elsevier: Amsterdam, The Netherlands, 2022; pp. 585–591. [Google Scholar]
- Alam, M.; Wang, J.-F.; Cong, G.; Lv, Y.; Chen, Y. Convolutional Neural Network for the Semantic Segmentation of Remote Sensing Images. Mob. Netw. Appl. 2021, 26, 200–215. [Google Scholar] [CrossRef]
- Hashi, A.O.; Abdirahman, A.A.; Elmi, M.A.; Hashi, S.Z.M.; Rodriguez, O.E.R. A Real-Time Flood Detection System Based on Machine Learning Algorithms with Emphasis on Deep Learning. Int. J. Eng. Trends Technol. 2021, 69, 249–256. [Google Scholar] [CrossRef]
Disclaimer/Publisher’s Note: The statements, opinions and data contained in all publications are solely those of the individual author(s) and contributor(s) and not of MDPI and/or the editor(s). MDPI and/or the editor(s) disclaim responsibility for any injury to people or property resulting from any ideas, methods, instructions or products referred to in the content. |
© 2025 by the authors. Licensee MDPI, Basel, Switzerland. This article is an open access article distributed under the terms and conditions of the Creative Commons Attribution (CC BY) license (https://creativecommons.org/licenses/by/4.0/).