Article

The Mobility and Distribution of Lead and Cadmium in the Ecosystems of Two Lakes in Poland and Their Effect on Humans and the Environment

by
Monika Rajkowska-Myśliwiec
,
Mikołaj Protasowicki
and
Agata Witczak
*
Department of Toxicology, Dairy Technology and Food Storage, Faculty of Food Science and Fisheries, West Pomeranian University of Technology in Szczecin, 71-459 Szczecin, Poland
*
Author to whom correspondence should be addressed.
Water 2025, 17(15), 2255; https://doi.org/10.3390/w17152255
Submission received: 24 June 2025 / Revised: 24 July 2025 / Accepted: 25 July 2025 / Published: 29 July 2025

Abstract

The presence of lead (Pb) and cadmium (Cd) can have considerable effects on the environment and on humans. The present study examines their levels in two lakes with different trophic levels located in northwestern Poland; their concentrations were determined in water and the bottom sediments, in common reed and in the organs of pike, bream and roach. The work also evaluates Pb and Cd bioavailability in bottom sediments, their potential for biomagnification, their bioaccumulation in the food chain and risk to human consumers. Metal concentrations were determined by graphite furnace atomic absorption spectrometry (GFAAS). The geochemical fractions of the metals were isolated by sequential extraction. Both Pb and Cd demonstrated low bioavailability, with the carbonate fraction playing a key role in their bioconversion. The concentrations of Pb and Cd in some organs and tissue types of fish and reeds correlated with their levels in water and sediments. No biomagnification was observed between the studied fish species. Calculations based on BMDL, TWI and THQ concentrations found Pb and Cd levels in the edible parts of fish to be within permissible limits and not to pose any threat to consumer health.

1. Introduction

Much of the pollution produced by human activity eventually accumulates in aquatic environments [1,2]. Among these, metals such as cadmium (Cd) and lead (Pb) are particularly persistent and can present a threat to both water-based environments and human well-being [3,4,5]. Pb and Cd are regarded as particularly problematic, since like arsenic, chromium (VI) and mercury, they can have harmful effects even in trace amounts and are therefore categorized as non-threshold toxins [6].
Together with mercury (Hg) and nickel (Ni), Pb and Cd are among the 45 priority substances included on a European Directive concerning water policy [7]. Moreover, together with mercury, Pb and Cd are considered as priority persistent, bioaccumulative and toxic (PBT) chemicals under the Resource Conservation and Recovery Act (RCRA) Waste Minimization Chemicals List [8,9,10,11].
Metals are not degraded in the aquatic environment, so they can accumulate in large quantities in bottom sediments [12]. Metal sediment concentration may reflect water concentrations and, thus, their bioaccumulation in fish [13]. However, the movement of metals between different phases is a complex arrangement and is influenced by a range of abiotic and biotic factors such as surface runoff or various physicochemical properties, although these correlations are typically small. The exchange of trace elements between sediments and water plays an important role in estimating the potential pollution of the environment and hydrobionts [12,13,14]. It has been stated that fewer than 1% of potentially toxic elements (PTEs) stay dissolved in water, suggesting that their studies in water indicate only temporary contamination of the aquatic ecosystem [15]. Indeed, typically, metals bind 1000 to 100,000 times more readily to the solid phase than to how they occur in water [13]. Nevertheless, the concentrations of metals in both water and sediment do not indicate the potential danger linked to their bioaccumulation or biomagnification [16,17]. While many pollutants can be controlled naturally by inter alia biotransformation or biodegradation, many other potentially toxic elements (PTEs) remain a concern [18].
Since Pb and Cd are widespread in the environment, people, plants and animals are regularly exposed to them. Neither element performs any important function in living organisms and can accumulate in the food chain, negatively impacting health [19,20]. Furthermore, their potential to bioaccumulate can pose a threat to ecosystems due to the possibility of transfer between trophic levels in the food chain. Ultimately, such accumulation of Pb can lead to a range of health problems for the end consumer, and their presence has been linked to cancer and organ damage, among other things [21]. Interestingly, while Pb has been found to occur in plants, it does not appear to have an obvious metabolic function, and excessive amounts can disrupt various processes such as photosynthesis, cell division and nitrogen metabolism [22]. In water bodies, both Pb and Cd and their compounds are able to enter their biota as water-soluble or sediment forms [23].
The common reed is a popular type of grass that is found commonly in lakes [24]. Numerous fish species use it as a nursery habitat, and it is often home to larvae and juveniles of the pike [25]. This plant effectively gathers metals because of its fibrous roots, which have extensive contact surfaces, along with its ability to produce a significant amount of biomass above the ground [26]. Consequently, it may serve as a bioindicator of trace element pollution in both water and sediments [24,26]. Metal pollution is a particularly important concern in fishery management [27]. Fish readily take up metals from water through the skin and gills and via imbibing, as well as from food. Furthermore, metals are able to bioaccumulate and biomagnify through food webs to higher trophic levels, which could be detrimental to human health [12,28].
Fish play a uniquely important role in the aquatic ecosystem, being one of its largest animals and occupying different levels of the trophic pyramid [29]. Also, by accumulating toxic metals from the environment, they can also act as a direct link between metal pollution and human health.
Exposure to metals impairs cytokine production together with both the cellular and humoral immune responses [8]. Among these, Pb has a toxic effect on almost all parts of the body, particularly the nervous system, and exposure to low levels of Pb can lead to inter alia behavioral changes and reduced IQ in young children [30]. In humans, Cd exhibits significant toxicity, particularly affecting the kidneys, lungs and bones [31,32]. Exposure to the element Pb can lead to various toxic effects on the cardiovascular, immune, reproductive and nervous systems, which depend on the degree of exposure [8,9,10]. Such effects may result in inter alia nausea, diarrhea, renal failure, muscle weakness and even pulmonary edema and death [21]. Furthermore, prolonged Cd exposure has been associated with chronic health problems such as anemia, elevated blood pressure and gastrointestinal issues, especially in the elderly. Exposure to Pb is known to cause blood disorders and nervous system damage, as well as reduced male fertility [30]. Cd exposure increases apoptosis and exacerbates oxidative stress, DNA methylation and DNA damage. It is also a potent carcinogen, particularly in the kidneys, lungs, pancreas and prostate. In the human body, the levels of metals are maintained by GSH and cysteine-rich peptides called metallothioneins [33].
The toxic effects of metals in aquatic environments can be evaluated based on their ability to transfer between different ecosystem components, i.e., between bottom sediments and plants and animals; in addition, it is also possible to determine their bioaccumulation potential [34]. Due to the accumulation of metals in fish muscle tissue, there is an urgent need to determine the risk of exposure to Pb and Cd in fish consumers.
The aim of this study was to assess the degree of Pb and Cd pollution in two trophically diverse lakes in northwestern Poland based on their presence in selected diverse abiotic and biotic elements: the common reed (Phragmites australis), pike (Esox lucius), bream (Abramis brama) and roach (Rutilus rutilus). More specifically, it examines the relationship between the content of Pb and Cd in water and sediments and their distribution in the tissues of the common reed and fish. It also determines the effect of selected water and sediment parameters on the accumulation of Pb and Cd in biota. The study attempts to determine whether the biomagnification of Pb and Cd occurs between fish species representing different trophic levels (predator: pike; non-predatory fish: bream (bentophagus) and roach (omnivore)). Moreover, as the studied fish species are popular foods among Polish consumers, the intake of Pb and Cd from the diet was also assessed based on EDI (estimated daily intake), EWI (tolerable weekly intake) and THQ (target hazard quotient).

2. Materials and Methods

2.1. Study Area

Lakes Ińsko and Wisola (Stubnica) are located in the West Pomerania Lake Region, northwestern Poland (Figure 1), within the Ińsko Landscape Park and the Ostoja Ińska special bird protection area of the Natura 2000 program (PLB320008), with these being areas of particular importance for the preservation of biodiversity. Natura 2000 areas include the most valuable and endangered species and habitats in Europe. Over 140 species of birds nest in Ostoja Ińska, including at least 29 species from Annex I of Council Directive 79/409/EEC and 7 species from the Polish Red Data Book. Lake Ińsko has a catchment area of 5.20 km2 and Lake Wisola of 1.73 km2 [35]. Lake Ińsko has been characterized by a moderate susceptibility to deterioration and class II water purity [36]. The lake has been classified as eutrophic, which was certainly influenced by the inflow of untreated municipal sewage from the town of Ińsko [37]. Lake Ińsko has been described as an α-mesotrophic subtype (oxygen saturation > 20%) [35].
Lake Wisola is fed by the Iński Canal (W7) (Figure 1). Periodically, water flow in the canal ceases, leading to a drop in water level in the lake. Given the water’s oxygen saturation of <20%, the lake has been classified as β-mesotrophic [35].

2.2. Materials

The test material consisted of surface (n = 192) and bottom waters (n = 114) and bottom sediments (n = 294). In addition, samples of common reed (Phragmites australis) (n = 147) and three species of fish were taken; the fish included the non-predatory roach (Rutilus rutilus) (n = 160) and bream (Abramis brama) (n = 160) and the predatory pike (Esox lucius) (n = 160). The locations of the sampling stations for water, sediments and common reed are presented in Figure 1. Representative samples of water were collected in acid-washed polyethylene (PE) bottles and other materials in PE bags.
Samples of surface and bottom waters were collected directly into clean polyethylene containers (2.5 L) that had been thoroughly rinsed with lake water. Bottom water samples were taken using a weighted PE bottle, which was lowered on a graduated line: at a depth of about 0.5 m from the bottom, the cork was pulled out and the bottle was filled. Water transparency was measured on site using a Secchi disk, temperature using a mercury thermometer (±0.5 °C; Thermco Products, Inc., Lafayette, NJ, USA) and oxygen concentration using an CO-411 oxygen meter (±0.2 mg·L−1; ELMETRON, Zabrze, Poland). Water pH was measured using a pHScan BNC meter (Eutech Cybernetics Pte. Ltd., Singapore) with an accuracy of ±0.1 pH.
A van Veen dredge (KC Denmark A/S, Silkeborg, Denmark) was used to collect bottom sediments, with each sample weighing 2000 g. After thorough mixing, the collected sediments were packaged in labeled Ziplock bags and transported to the laboratory in a portable refrigerator. The pH of the sediments was determined later in the laboratory (pHScan BNC pH meter; Eutech Cybernetics Pte. Ltd., Singapore). The sediment samples were then frozen and freeze-dried in a Heto LyoLab 3000 apparatus (Heto-Holten A/S, Allerød, Denmark). The dried sediments were ground in an agate mortar and then sieved through a 350 μm nylon sieve. The homogeneous sediments were placed in PE containers and stored in a desiccator until analysis.
Samples of common reed were collected whole from the water, just off the shore of the lakes (Figure 1). In order to remove the remains, the plants were immersed entirely in the water of a given lake. In the laboratory, plants were divided into roots, rhizomes, stems and leaves. All tissues were then crushed with stainless-steel tools and frozen (20 °C). Similarly to the bottom sediments, the frozen plant material was freeze-dried (Heto LyoLab 3000; Heto-Holten A/S, Allerød, Denmark) and homogenized and then packed and stored in a desiccator for further analysis. The fish were caught by fishermen employed by the Fisheries Farm, located in the town of Ińsko, which manages these lakes. An ichthyologist employed by the farm supervised the species selection and their assignment to the studied lakes. The collection of fish was always combined with sampling of other materials for testing. The fish were individually packaged in PE bags and transported to the laboratory in a portable refrigerator. After morphometric measurements (Table 1), the fish were frozen whole (−20 °C). In total, 480 individuals were collected in eight sets of samples, with each set including 10 fish of each species (5 females and 5 males).
For the analysis of Pb and Cd, the fish were thawed, and the body cavity was opened with a stainless-steel knife. The sex was determined based on the gonads, and the following materials were collected for testing: muscles from the dorsal part, skin, gonads, kidneys, liver, spleen, gill lobes, digestive tract and digestive content. In pike, the digestive tract was divided between stomach and intestines, while in bream, into anterior and posterior parts. Fish organs and tissues were stored (−20 °C) in PE bags until analysis.

2.3. Methods

2.3.1. Sample Preparation for Pb and Cd Analysis

The samples of bottom sediments, plant organs and fish were digested using a CEM MDS 2000 microwave oven (MDS 2000, CEM Corp., Matthews, NC, USA). Before digestion, the tested materials ware homogenized in an agate mortar and weighed. Appropriate amounts of material and 65% HNO3 (Suprapur, Merck KGaA, Darmstadt, Germany) were added into Teflon microwave oven vessels (Table 2). In each digestion series, nine samples of the tested material were prepared. These were accompanied by two blanks (HNO3) and one sample of standard reference materials as controls to determine the accuracy and precision of the results. After the process, the samples were quantitatively transferred to volumetric flasks and made up to a volume of 25 mL with ultrapure water (0.05 μS cm−1; Barnstead™ GenPure™ Pro, Thermo Scientific, Langenselbold, Germany).

2.3.2. Determination of Moisture and Organic Matter Contents

Moisture content was determined in accordance with the AOAC Standard Method [38]. Determining the moisture content of the tested material enables comparison with previous studies, regardless of whether the results were given in dry or wet mass. The content of organic matter in the sediments was determined by the gravimetric method based on the loss on ignition (LOI) [39].

2.3.3. Pb and Cd Determination

Total Metal Concentrations in Examined Materials
The Pb and Cd contents of the tested samples were determined by graphite furnace atomic absorption spectrometry (GF-AAS) with electrothermal atomization and Zeeman background correction (4110 ZL, Ueberlingen, Perkin Elmer). Calibration was performed against five working standards prepared by serial dilutions of Pb and Cd calibration standards (1000 mg·L−1) with 0.2% HNO3 (Merck KGaA, Darmstadt, Germany). The amounts of the elements were determined by external standard curves. A correlation coefficient (r) higher than 0.999 indicated acceptable linearity (obtained levels for Pb and Cd were ≥0.9997). The LOD (limit of detection) for Pb and Cd was achieved at 0.08 µg·L−1 (Pb) and 0.02 µg·L−1 (Cd).
The levels of Pb and Cd in the tested solid material were given as mg·kg−1 wet weight (ww) for fish and in mg·kg−1 dry weight (dw) for sediments and plants. Water concentrations were presented in µg·L−1. The following GF-AAS operating parameters were adopted: five furnace temperature stages, with atomization at 1600 °C and 1550 °C for Pb and Cd, respectively; absorption lines: Pb 283.3 nm and Cd 228.8 nm; slit width: 0.7 mm; and lamp current: 10 mA (Pb) and 4 mA (Cd). In addition, to minimize the influence of the sample matrix on the obtained results, two modifiers were dosed to each sample: magnesium modifier (20 g·L−1 Mg(NO3)2, 99.999% in H2O) and ammonium dihydrogen phosphate (10% NH4H2PO4 in 2% HNO3).
Sequential Extraction of Elements from Bottom Sediments
Elements were sequentially extracted from bottom sediments using a modified method based on Calmano and Förstner [12] and Calmano et al. [13]. Subsequent fractions (I–VI) were obtained using the following extractants: I (exchangeable)—1 M NH4OAc (at pH 7); II (carbonates)—1 M NaOAc (pH 5); III (readily reducible)—1 M NH2OH·HCl (pH 2); IV (moderately reducible)—0.2 M (NH4)2C2O4 + 0.2 M H2C2O4 (pH 3); V (organic/sulfidic bound)—30% H2O2 + HNO3 (pH 2) NH4OAc (pH 7); and VI (residual)—65% HNO3 (using microwave digestion). The mass ratio of the sediment to the extractant used was I (1:20), II (1:20); III (1:100); IV (1:100) and V (1:100). The residue after the five extractions was subjected to microwave digestion using 5 mL of 65% HNO3.

2.3.4. Analytical Quality Control

To confirm the accuracy and precision of the methods, parallel determinations of Pb and Cd were performed in certified reference materials. MESS-3 (Marine Sediment; National Research Council of Canada, Ottawa, Canada) was used for bottom sediments, INCT-MPH-2 (Mixed Polish Herbs; Institute of Nuclear Chemistry and Technology, Warsaw, Poland) was used for the common reed and DOLT-3 (Dogfish Liver; National Research Council Canada, Ottawa, Canada) for fish. To calculate the recovery value, the results were compared with the certified values (Table 3).

2.3.5. Pb and Cd Accumulation and Pollution in Bottom Sediments

Accumulation Factors (AFs)
Accumulation factors (for Pb and Cd) in bottom sediments were calculated for each sampling point (Figure 1) separately, according to Equation (1):
AF = C s × 10 3 C w
where AF—accumulation factor in bottom sediments; Cs—metal content in bottom sediment (mg·kg−1 dw); and Cw—mean concentration of metal in surface and bottom waters (µg·L−1).
Calculations of Sediment Pollution with Pb and Cd
The overall level of toxicity in a particular sample or location is represented by the PLI (pollution load index), i.e., the number of times the sediment metal concentrations exceed background concentrations [40,41]. The PLI of a site is calculated by taking the root n of the n-CF obtained for all metals. The PLI is based on the contamination factors (CFs) calculated for each of the analyzed metals and is given by Equation (2). PLI < 1 indicates mean perfection; PLI = 1 means that only baseline levels are available; and PLI > 1 represents a decline in site quality.
P L I = ( C F 1 × C F 2 × C F 3 × C F 4 × C F n ) 1 / n
Here, n—the number of metals studied; and CF—the contamination factor.
The contamination factor (CF) can be calculated from Equation (3) based on metal accumulation (Mc) in the tested bottom sediments (mg·kg dw−1) and background metal concentration (Bc). In this study, the geochemical background for Polish sediments was used; the values adopted were 10 mg·kg−1 for Pb and 0.5 mg·kg−1 for Cd [42].
C F = ( M c × B c )

2.3.6. Pb and Cd Bioaccumulation in Bottom Sediments

Bioaccumulation factors (BAFs) of Pb and Cd were calculated for common reed and fish organs (Equations (4) and (5)) [43]. For the common reed tissues, calculations were performed for each site (Figure 1) separately. For fish, the mean content in each season (spring, summer, autumn and winter) and the total mean content for a given species and lake were taken into account.
B A F w = C o × 10 3 C w
Here, Co—element content in selected tissues of common reed (mg·kg−1 dw) or fish (mg·kg−1 ww); and Cw—mean concentrations of Pb and Cd in surface and bottom waters (μg·L−1).
B A F s = C o C s
Here, BAFs—bioaccumulation factor in the tissues/organs of common reed/fish; Co—content of the element in part of the common reed (µg·g−1 dw) or in fish organ (µg·g−1 ww); and Cs—content of the element in mineral bottom sediments (common reed) and mean content in both organic and mineral bottom sediments (for fish; µg·g−1 dw).

2.3.7. Consumer Risk Calculations

The results of Pb and Cd concentrations in fish muscles were compared to the highest permissible levels, specified in Commission Regulation (EU) 2023/915 repealing Regulation (EC) No 1881/2006 [44].
The potential health impacts related to eating fish were evaluated. The following were calculated based on United States Environmental Protection Agency guidelines [43,45]: EDI (estimated daily intake), THQ (target hazard quotient) and HI (hazard index).
The EDI was calculated (Equation (6)) to allow for comparison with other BMDL values (benchmark dose lower confidence limit). These define the effects of Pb on the cardiovascular system (BMDL01 1.5 µg·kg−1 bw·day−1) and nephrotoxicity (BMDL10 0.63 µg·kg−1 bw·day−1) in adults. These are regarded as potential critical adverse health effects [46]. All calculations, using Equations (6)–(8), assumed the recommended two 150 g servings of fish per week (i.e., 42.9 g per day) [46].
EDI = C × I R B W
Here, C—metal content in fish muscles (mg·kg−1 ww); IR—daily ingestion rate (g/day); and BW—body weight (bw) (70 kg).
The estimated weekly intake (EWI) was calculated by multiplying the EDI by seven. EWI results were related to the tolerable weekly intake (TWI) determined for Cd at 2.5 µg·kg−1 bw [47].
The target hazard quotient (THQ) [43,45] is the ratio of exposure to the hazardous element at the dose at which adverse health effects are expected to occur (Equation (7)). The reference dosage is the highest level at which these effects are predicted.
THQ = C × I R × E F × E D R f D × B W × A T × 10 3
Here, C—metal concentration in fish muscles (mg·kg−1 ww); IR—food ingestion rate (g·day−1); EF—exposure frequency (365 days·year−1); ED—exposure duration (70 years); RfD—reference oral dose (mg·kg·day−1) for Pb (0.0036), Cd (0.001); BW—body weight (70 kg); and AT—average exposure time to non-carcinogens (365 days·year−1 × ED).
The cumulative non-carcinogenic effect was assessed based on the hazard index (HI), calculated as a sum of the THQ (Equation (8)).
H I = i = 1 n T H Q
A result < 1 signified a non-obvious risk. Conversely, a dose equal to or greater than the RfD indicates a health risk in the exposed human population.

2.3.8. Statistical Methods

All measurements were carried out in triplicate. The Shapiro–Wilk test was used to confirm whether the Pb and Cd contents followed a normal distribution. The differences between samples were evaluated using a one-way analysis of variance (ANOVA) (p < 0.05). Duncan’s multiple range test was used to confirm differences between means. Pearson’s correlation analysis was used to examine the relationship between Pb and Cd bioaccumulation in the selected tissues of the common reed and the studied fish and their levels in water and bottom sediments. In addition, the relationships between the levels of metals in plant or fish organs and water and sediment parameters were examined, including temperature, O2, transparency, pH and organic matter level. The calculations were verified at a significance level of α < 0.05. All analyses were performed using Statistica version 13.3 (StatSoft, Krakow, Poland).

3. Results and Discussion

3.1. Pb and Cd in Water and Bottom Sediments

3.1.1. Pb and Cd Concentrations

Selected physicochemical parameters of the waters of Lakes Ińsko and Wisola are given in the Appendix A (Table A1).
Generally speaking, in both lakes, the Pb and Cd concentrations decreased in the order tributaries > bottom waters > outflows > surface waters, which may indicate a gradual accumulation of metals in the accompanying ecosystems. In Lake Ińsko, the Pb concentration did not differ significantly between surface water (0.04 µg·L−1) and bottom water (0.05 µg·L−1); however, in Lake Wisola, significantly higher levels were found in the bottom water (0.17 µg·L−1 and 0.42 µg·L−1) (Table 4).
Similar trends were found by Kubiak et al. [37] in the waters of other lakes in the West Pomeranian Voivodeship (Poland). In the case of Cd, increasing concentrations up to 0.543 μg·L−1 were periodically observed in Lake Wisola.
The mean concentrations differed significantly between the different types of lake waters, especially in Lake Wisola (Table 4). Higher mean concentrations of both Pb and Cd were recorded in Lake Wisola (Pb < 0.02–1.81 μg·L−1; Cd 0.012–0.709 μg·L−1) than in Lake Ińsko (Pb < 0.02–0.25 μg·L−1; Cd 0.001–0.128 μg·L−1). Despite the above differences, even the maximum Pb concentrations in the waters of the studied lakes and their inflows and outflows were significantly below the permissible value [48]. The average Cd concentrations corresponded to the highest first class of purity (0.45 μg·L−1), while the maximum values found in the inflows and outflows to Lake Wisola corresponded to the third class (0.6 μg·L−1). Much higher Pb (13.0–16.7 μg·L−1) and Cd (1.5–1.8 μg·L−1) concentrations were detected in the selected five Polish lakes located in an area without any significant source of anthropogenic pressure [49].

3.1.2. Bottom Sediments of Lakes Ińsko and Wisola

Organic Matter Content and Bottom Sediments
Throughout the study period, Lake Wisola demonstrated significantly higher levels of organic matter in the bottom sediment than Lake Ińsko (Table 5); in addition, comparable organic matter levels were found in sediment collected from below 6 m at all tested sites. In Lake Ińsko, significant differences were observed between sediments from sites I3 and I5 (Figure 1). Among the mineral sediments from Lake Wisola, the highest levels of organic matter were observed at sites W2 and W6.
Pb and Cd Contents in Bottom Sediments and Accumulation Factors
Higher mean Pb and Cd levels were noted in the bottom sediments in Lake Wisola compared to Lake Ińsko, which was mainly due to the higher share of organic matter (Table 6 and Table 5). Moreover, in this lake, the average visibility was low (2.6 m) and periodically dropped to 1.5 (Table A1). Oxygenation of useful waters was also poor (mean 3.8 mg L−1; range 1.0–10.6 mg L−1). The above-mentioned parameters in Lake Ińsko were as follows: visibility (mean 5.1 m; range 4.0–6.0 m) and oxygenation of bottom waters (mean 7.4 mg∙L−1; range 3.6–10.0 mg∙L−1) (Table A1). In both lakes, sediment Pb and Cd contents correlated positively with organic matter content; of the two, Lake Wisola was characterized by a higher trophic level [35], exhibiting a stronger correlation (r = 0.755 for Pb; r = 0.860 for Cd) than Lake Ińsko (r = 0.695 for Pb; r = 0.560 for Cd). Previous studies have found metal enrichment of the lake environment to be associated with a higher trophic level [34].
Regarding the mean Cd content in the organic sediments, both Lake Ińsko (0.97 mg·kg−1 dw) and Lake Wisola (1.12 mg·kg−1 dw) (Table 6) exceeded the value of the TEL (threshold effect level) = 0.7 mg·kg−1, which indicates the possibility of harmful effects on aquatic organisms [50]. This parameter provides valuable information to decision makers aiming to improve pollution management in the studied region [40,41]. Higher total Cd concentrations, i.e., from 1.2 to 5.2 mg·kg−1 (mean value 3.4 mg·kg−1), have been reported in sediments from Lake Goreckie in western Poland [51].
The bottom sediments of Lake Ińsko contained higher levels of Pb compared to those in Lake Wisola. This was indicated by significantly higher Pb accumulation factors (AFs) in both organic (570,000–2,500,000) and mineral sediments (24,500–267,000) compared to those from Lake Wisola (125,000–624,000 and 3200–48,000) (Table 7). In both lakes, the pollutant load indices (PLIs) obtained for organic sediments exceeded the safe value of 1 [40,41], by 9 times (Lake Ińsko) and 13 times (Lake Wisola), which indicates a deterioration in their quality (Table 7). The situation was different for mineral sediments, with an organic matter content of less than 10%, where the PLIs were 0.04 and 0.09, respectively. However, the authors note that the calculated PLI values may be overestimated or underestimated; this may be due to the use of mean Pb and Cd geochemical background values for lake sediments in Poland as a reference point.
The bioavailability of Pb and Cd accumulated in bottom sediments was determined by sequential extraction of their individual fractions. The findings indicate that in both lakes, Pb was mainly bound (53 to 78%) to the semi-reducible fraction (IV) of the sediment (Figure 2). To a large extent, this metal was also bound in the residual fraction (VI). Pb was also found mainly in the residual fraction in sediments from Goczałkowice reservoir (Poland), with a significant amount bound to hydrated iron and manganese oxides and organic matter [52].
According to the US EPA [53], metal sorption is influenced by a variety of factors, including pH, alkalinity, clay silicate and exchangeable carbonate fractions. The presented results indicate that for Pb, a significant share was taken by the most mobile exchangeable fraction (I), i.e., 3.5–9.6% in Lake Ińsko and 2.9–8.4% in Wisola Lake. The smallest share was taken by carbonate (II). Much smaller amounts were found to bind to exchangeable forms (0.8%) in sediments from Lake Goreckie, western Poland [51].
The opposite was the case with Cd, where in both lakes, a significant share was found in the carbonate fraction (II) and the lowest in the exchangeable (I) and organic sulfide (V) fractions. Moreover, in bottom sediments from Lake Ińsko, Cd was usually associated with the residual fraction (21–67%), followed by the easily and medium-reducible fractions (IV) depending on the season and sampling site (Figure 2).
In the organic sediments of Lake Wisola, decreases in surface water pH and temperature were accompanied by an increase in the share of Pb in the easily reducible fraction (r = −0.66). In addition, changes from oxidizing to reducing conditions were accompanied by an increase in the share of the medium-reducible fraction (r = −0.53). Indeed, these fractions were found to exhibit negative correlations between Pb content and the physicochemical factors of surface water. Moreover, a negative correlation was observed between the Pb concentration in surface water with its content in the easily reducible fraction (r = −0.54), which may indicate the transfer of Pb from sediment to water.
The mobility of Pb in the sediment–water system can be further confirmed by the increased values of the CF coefficient, obtained by dividing the Pb concentration in sediments by the background value determined for Polish lakes [42] (Table 7).
In Lake Wisola, Cd was mostly associated with the medium-reducible fraction (IV) (40–54%) of bottom sediments. The share of this fraction in sediments depended on the sampling site and the season. These fluctuations were accompanied by changes in the levels of mainly the residual fraction or the residual and easily reducible fraction. The carbonate fraction accounted for up to 6% of the total amount of Cd, while the least Cd was found in the exchangeable and sulfide–organic fractions. Elsewhere, a study of lake sediments in western Poland found Cd to mainly be in the forms bound to organic matter (43%), followed by the fraction bound to hydrated iron and manganese oxides (28%), the fraction bound to carbonates (18%) and then the residual one (5.9%) [52].

3.2. Distribution of Pb and Cd in Common Reed (Phragmites australis) and Bioaccumulation Factors

As aquatic macrophytes play a key role in metal uptake and their accumulation, they are of significant value in natural water purification [24]. Both Pb and Cd demonstrated considerable variation with regard to their accumulation in different plant parts (Table 8), with some seasonal variation observed in all organs apart from the roots. In both lakes, Pb bioaccumulation fell from root > stems ≥ leaves > rhizomes and Cd from root > rhizomes > leaves ≥ stems (Table 8). A comparable trend of decreasing bioaccumulation in P. australis with respect to metals was also observed by other researchers [26]. Therefore, because of its unique ability to accumulate both metals, this part of the plant may be used in biomonitoring the pollution status of the ecosystems of the examined lakes.
In common reed, the Pb content of ranged widely, but the values were comparable between lakes. Significantly higher mean Pb levels were noted in the roots (Lake Ińsko: 4.41 mg·kg−1dw; Lake Wisola: 4.47 mg·kg−1dw) than in the remaining tissues (Lake Ińsko: 0.16–0.20 mg·kg−1dw; Lake Wisola: 0.18–0.24 mg·kg−1dw). Indeed, Bąkowski et al. [22] report that more than 90% of Pb accumulates in roots due to its very limited mobility. Similarly, Rahman et al. [54] note significantly lower Pb levels outside the roots of the studied reeds, again indicating very poor translocation to the leaves; they also report that plant leaves can take up Pb ions from the air through stomatal and cuticular pathways, resulting in leaf chlorosis. Other authors reported that in the aboveground parts of plants not affected by pollution, Pb values have been found to range from 5 to 10 mg/kg dw, ranging from 30 to 300 mg·kg−1 dw in those subjected to excessive (toxic) values [24]. Another reference in the literature indicates that the usual Pb concentration in plants varies from 0.1 to 10 mg·kg−1 [55]. While the mean Pb concentrations in the aboveground tissues were low according to previous data [24,55] and do not indicate contamination, the high root content may indicate contamination. Bioaccumulation factors from water (BAFws) were obtained in a very wide range, i.e., 31-212.444 for Pb and 42-69.083 for Cd, depending on the part of the plant and the place of their collection (Table 9). In contrast to BAFws, bioaccumulation factors from mineral sediments (BAFs) were very low. Only the average and maximum BAFs calculated for roots and the maximum BAFs for stems of common reed from Lake Ińsko were above 1. Bioaccumulation factors (BAFs) higher than 1 were also obtained by other authors [24] for Pb, Cd and other metals in the roots of common reed. Moreover, they noted that their levels increased in relation to the quantities of their readily available forms found in the related sediments.

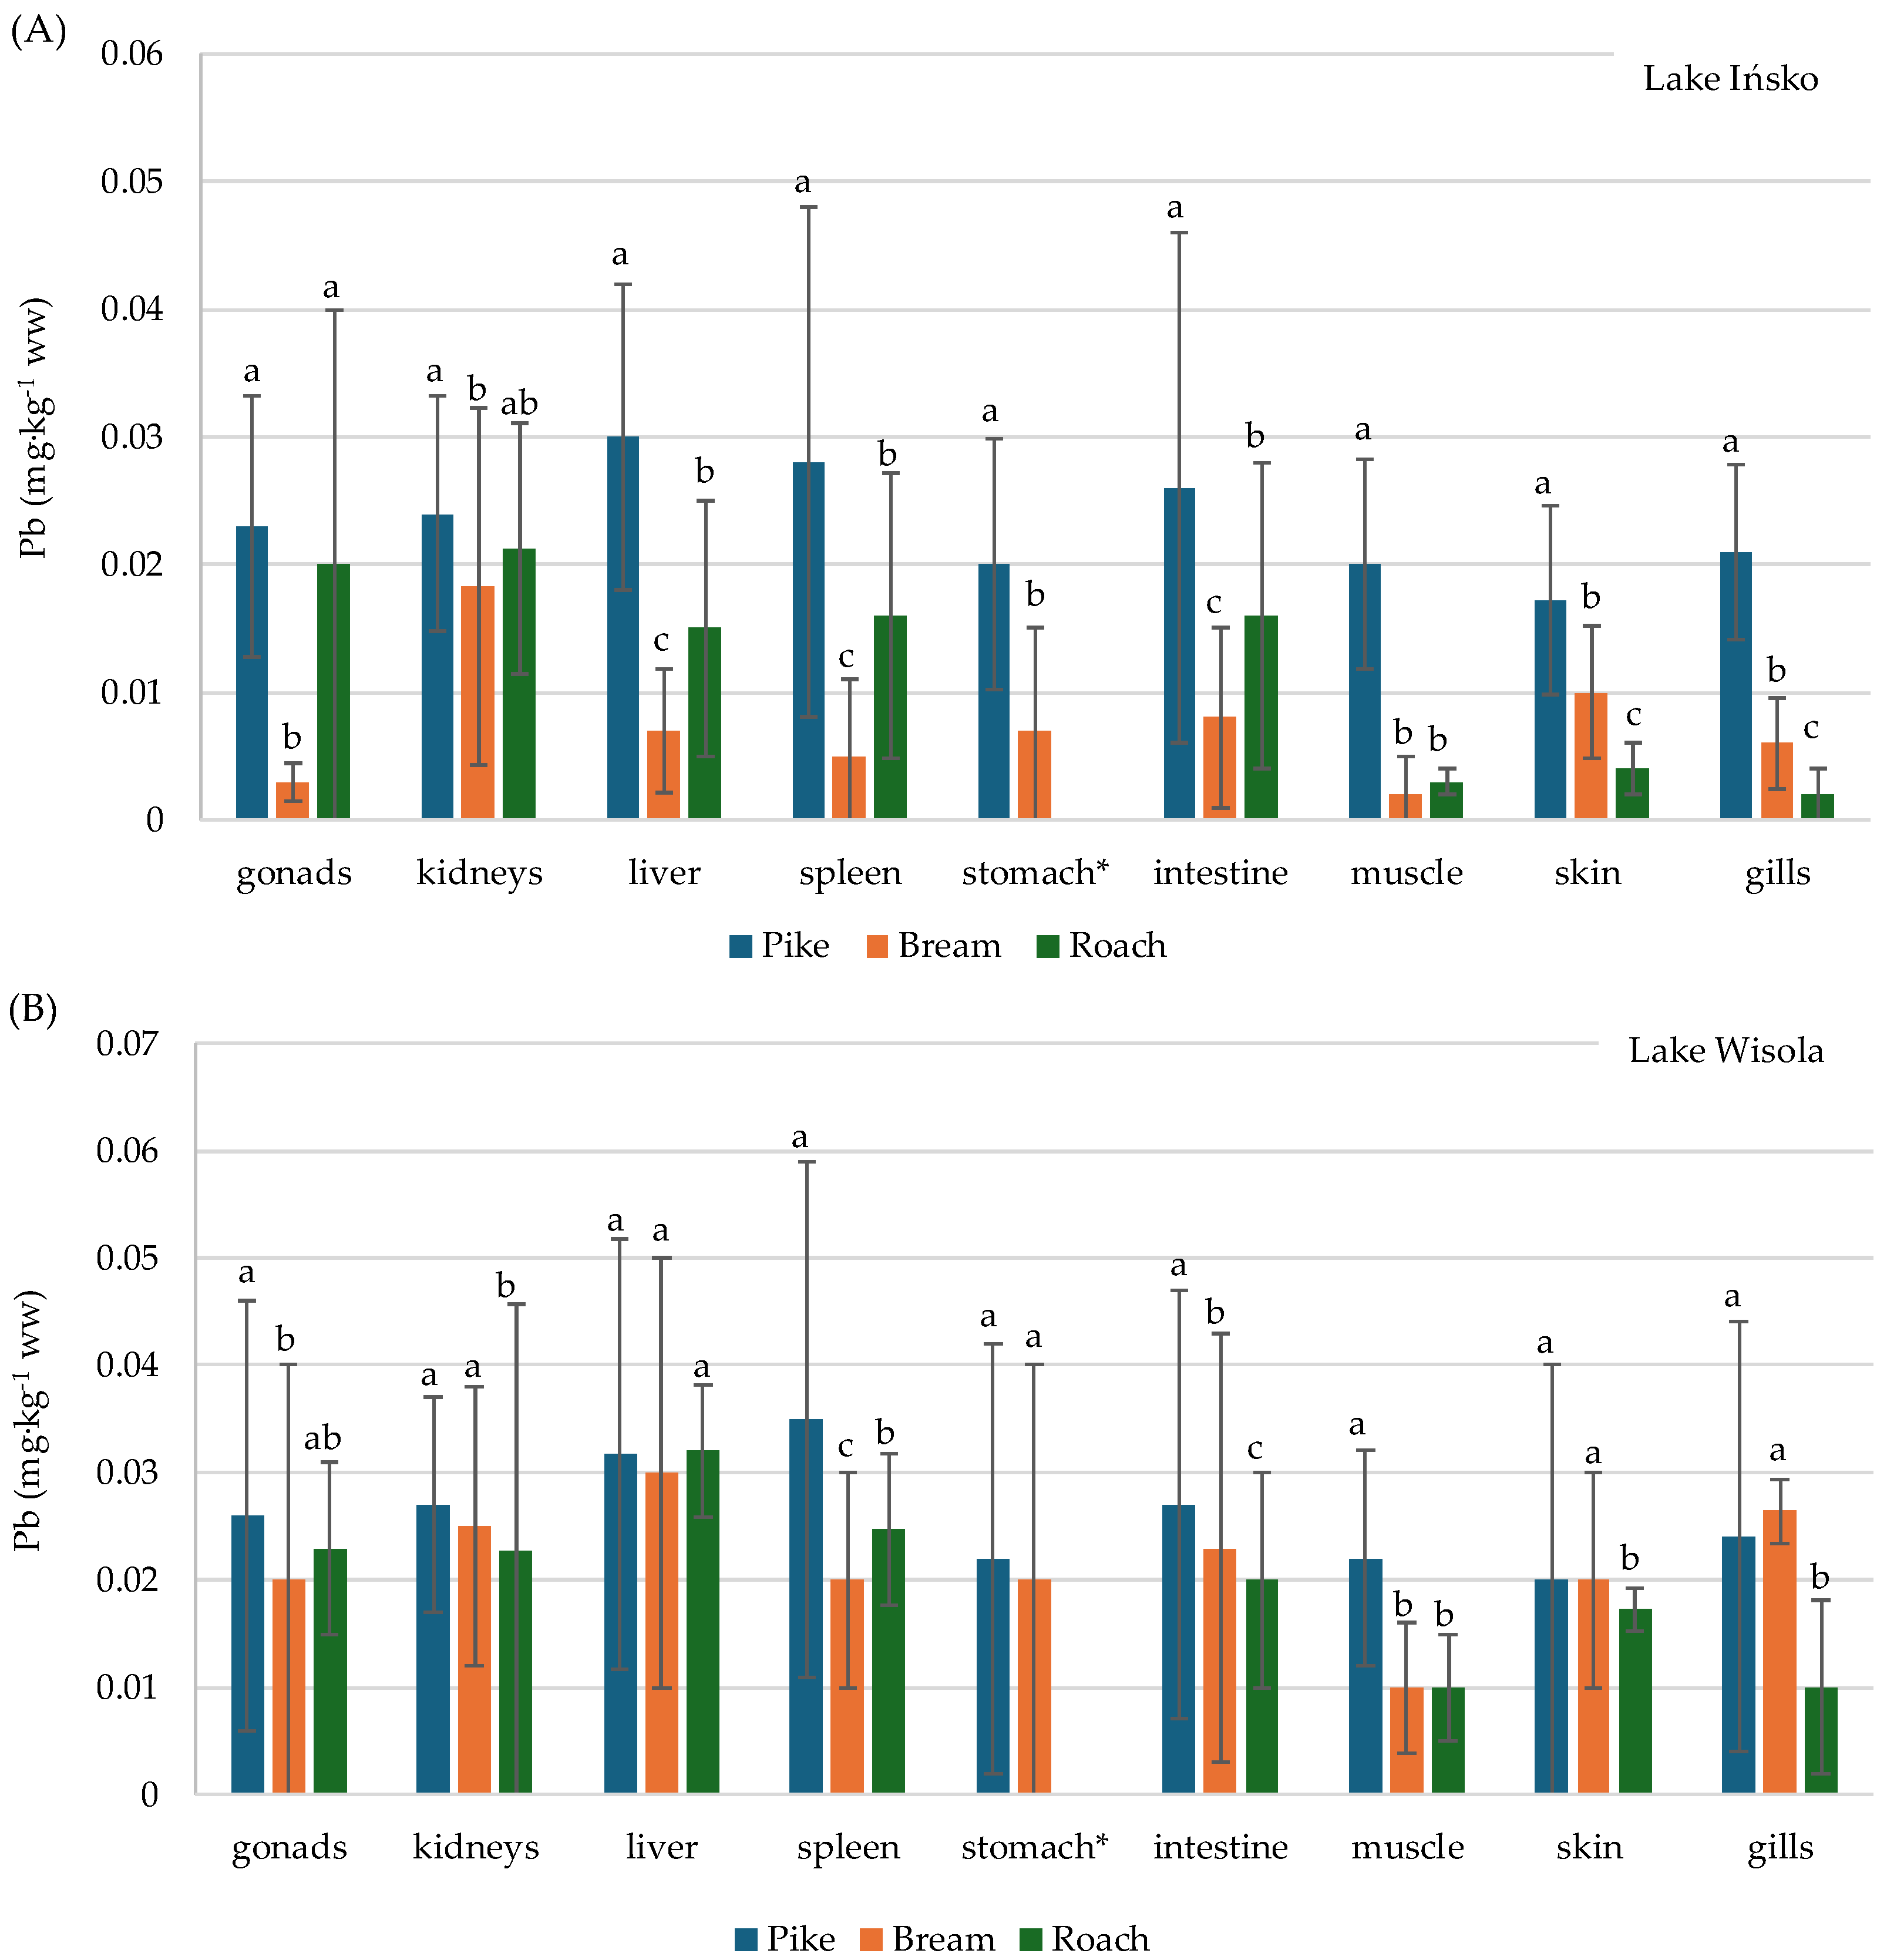
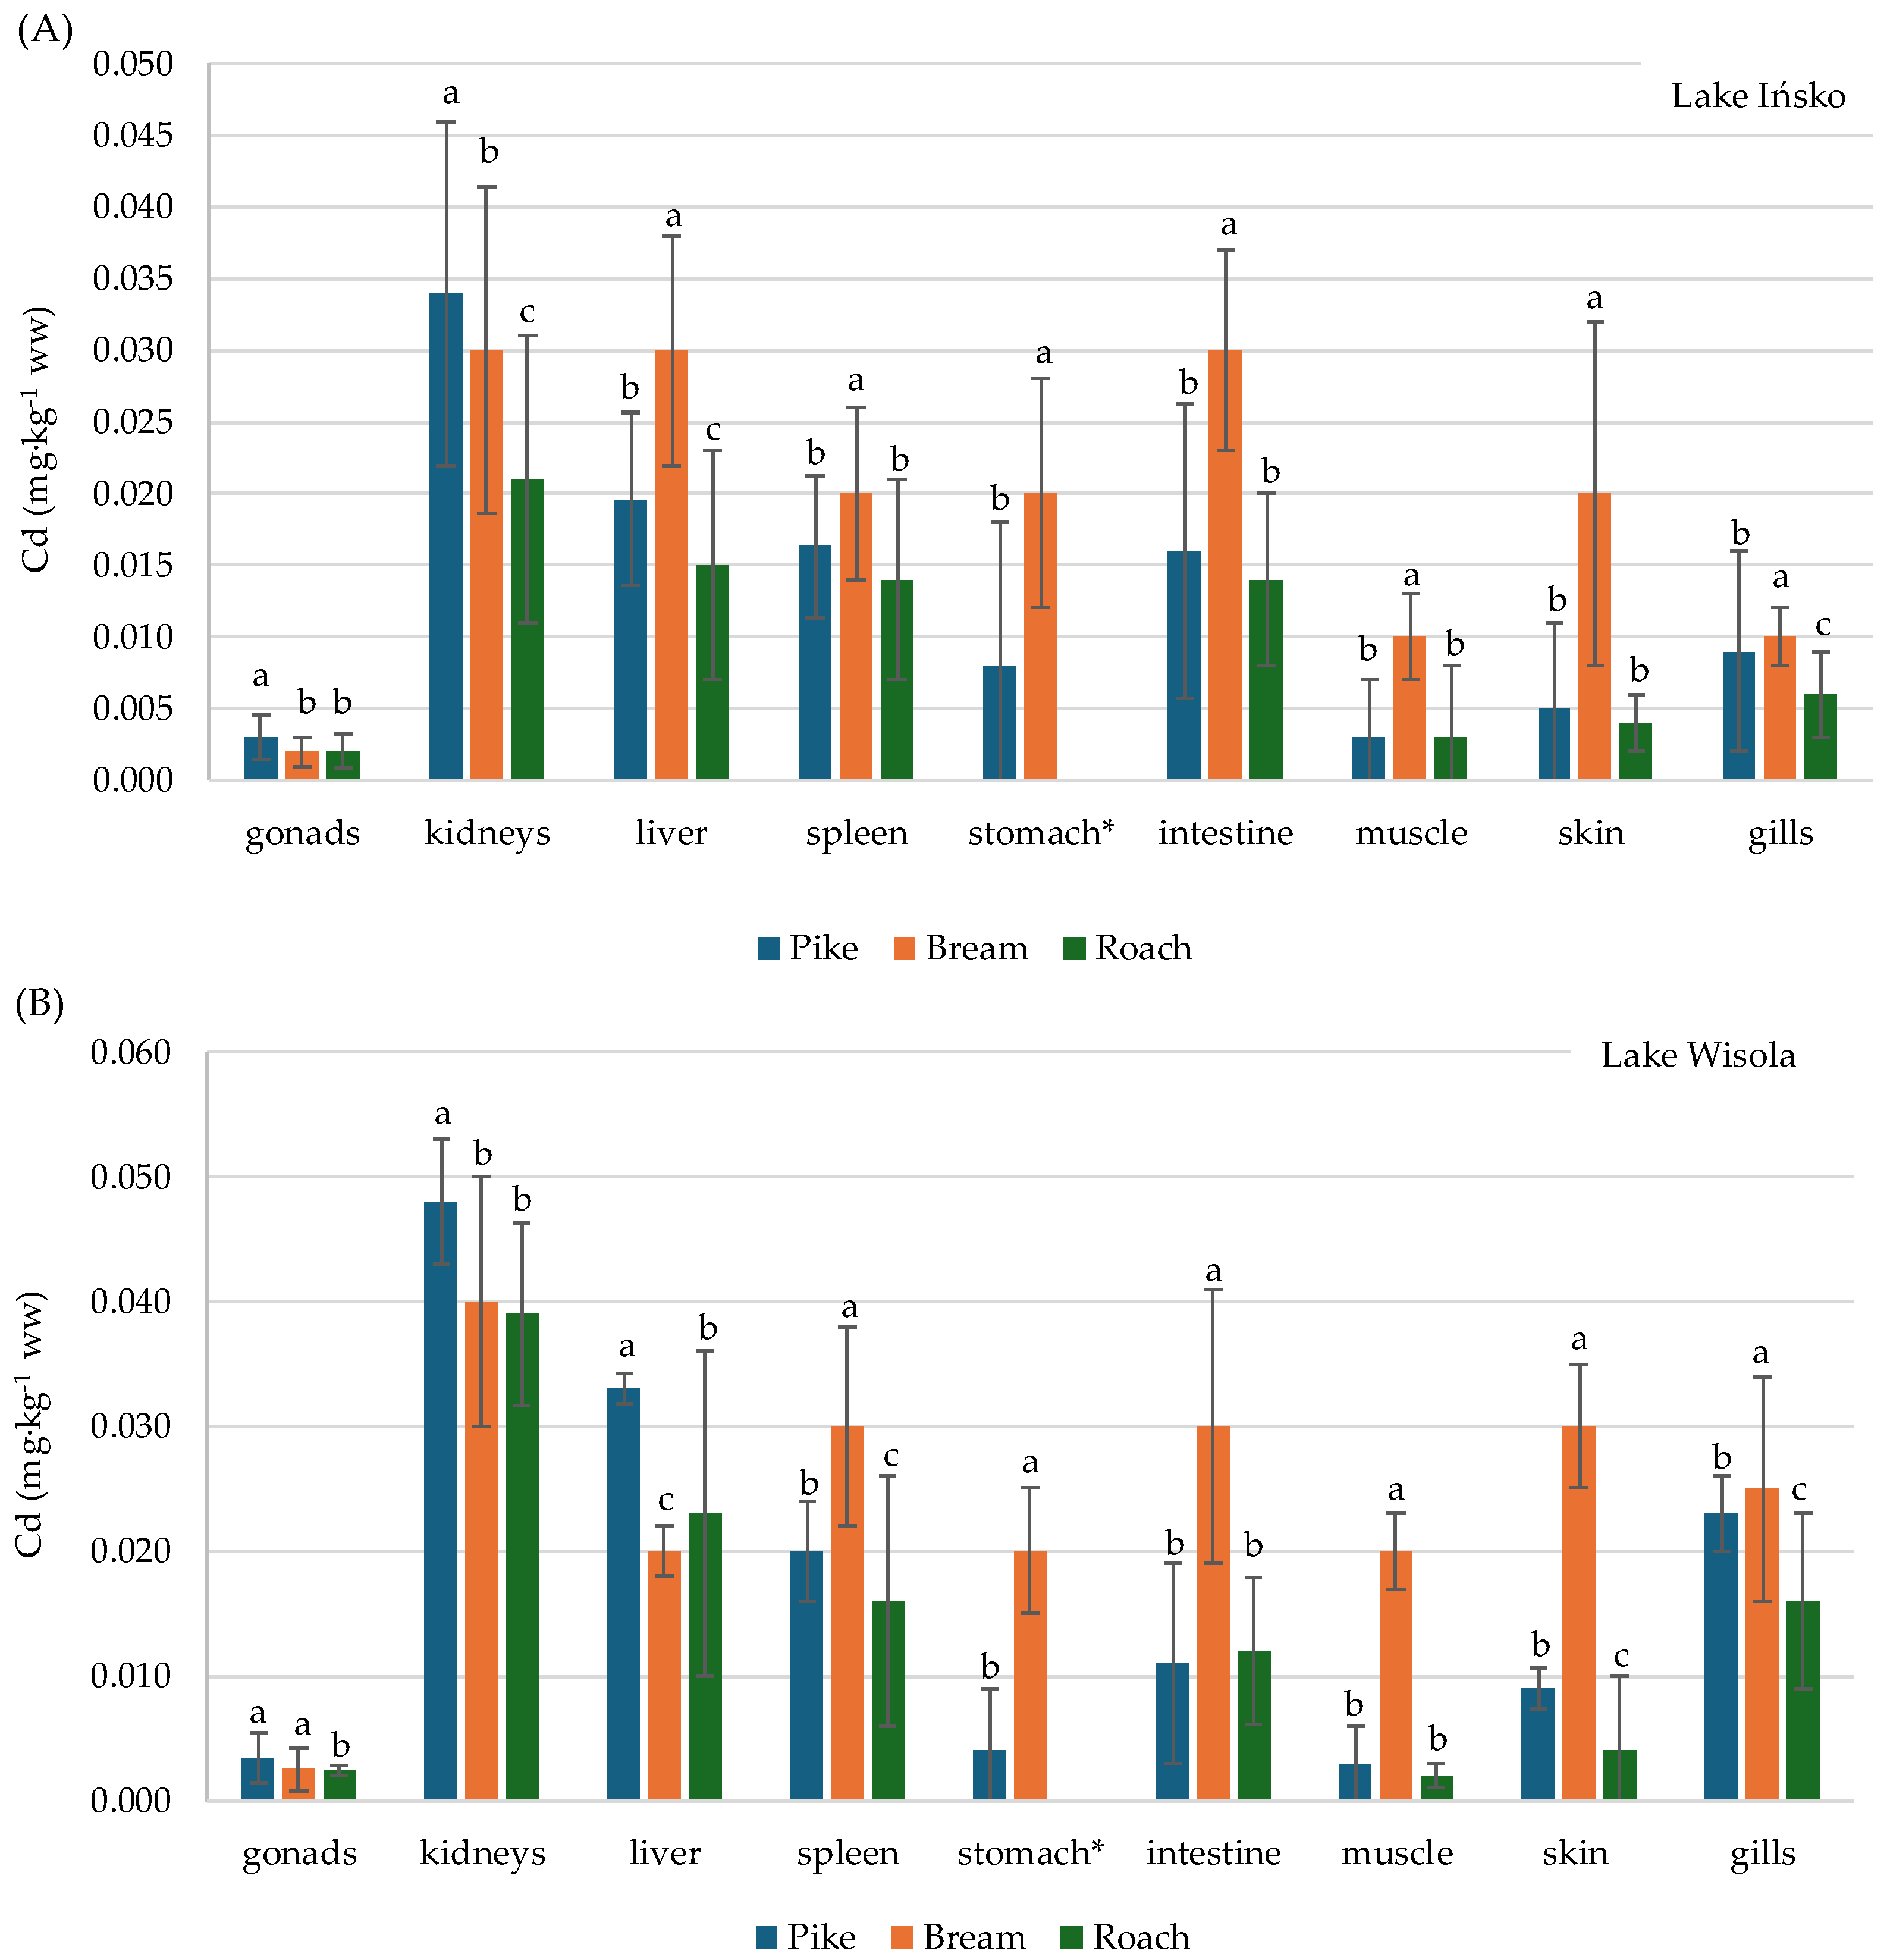
3.3. Distribution of Pb and Cd in the Organs of Fish—Pike (Esox lucius), Bream (Abramis brama) and Roach (Rutilus rutilus)—And Bioaccumulation Factors

In the studied pike, the populations in the two lakes demonstrated comparable Pb levels for most organs (Figure 3), with the highest accumulation observed in the liver, spleen, intestine, kidneys and gills. In addition, pike accumulated more Pb in the muscles than bream or roach, with comparable levels observed in the latter two. Pike from Lake Ińsko also showed significantly higher levels of Pb (p < 0.05) in all organs and tissues compared to the other two species, although the level in the kidneys was comparable to that of roach.
In both lakes, roach had comparable levels of Pb in muscles to bream but significantly lower levels in organs such as gills and skin. In the remaining organs, the roach from Lake Ińsko exhibited significantly higher Pb levels than bream (Figure 3).
Among all species from both lakes, bream contained significantly less Pb in the gonads and spleen. In Lake Ińsko, this species showed also the lowest Pb accumulation in most of the remaining organs (p > 0.05), although it demonstrated greater Pb accumulation in the skin and gills compared to roach (p > 0.05). Perhaps this exception was due to the nutrition and behavior of bream, which are benthivorous fish [56]. In Lake Wisola, the levels of lead (Pb) found in the kidneys, gills and skin of bream were similar to those found in pike; however, these levels were higher than those observed in roach. In contrast, roach presented higher Pb levels in the gonads and spleen compared to bream.
The distribution of metal in fish from Lake Wisola is not indicative of biomagnification in the predatory fish–benthophagous fish–planktonophagous fish system. However, in Lake Ińsko, a clear predator (pike)–prey (bream and roach) dependency was noted. The Pb content in pike was significantly higher in most organs compared to bream and roach (Figure 3).
Comparable Pb concentrations were found in the muscles of pike from the two lakes (approx. 0.02 mg kg−1 ww). However, for bream and roach, significantly higher levels (p < 0.05) were found in those from Lake Wisola. Other researchers [57] found higher mean Pb concentrations in the muscles of both pike (0.0305–0.0920 mg kg−1) and roach (0.0399–0.1595 mg kg−1) from lakes located on Polesie Lubelskie in Poland. On the other hand, lower levels for bream and roach were reported by other authors [10].
Previous studies on fish have reported the greatest Pb bioaccumulation to occur in the liver, spleen, kidney and gills [19]. Similarly, our present findings indicate the greatest accumulations in the liver (0.007 mg·kg−1 ww–0.03 mg·kg−1 ww), spleen (0.005 mg·kg−1 ww–0.035 mg·kg−1 ww), digestive tract (0.007 mg·kg−1 ww–0.027 mg·kg−1 ww) and kidneys (0.02 mg·kg−1 ww–0.027 mg·kg−1 ww). The highest Cd accumulation was observed the in organs and tissues of bream from both lakes (Figure 4). Similarly, lower Cd contents in pike than in bream were found in studies conducted with different water bodies in Russia [2]. Moreover, in both lakes, pike demonstrated higher bioaccumulation of Cd in tissues and organs than roach; most of these differences were statistically significant (p > 0.05) (Figure 4).
In the present study, fish from both lakes demonstrated the highest mean Cd level in the kidneys (0.021 mg·kg−1 ww–0.048 mg·kg−1 ww), livers (0.015 mg·kg−1 ww–0.033 mg·kg−1 ww) and spleens (0.014 mg·kg−1 ww–0.030 mg·kg−1 ww); in addition, in Lake Wisola, high levels were also observed in the gills (0.016 mg·kg−1 ww–0.025 mg·kg−1 ww) (Figure 4). A similar pattern of Cd distribution in fish organs, regardless of species, was obtained in different water bodies of the European part of Russia: kidneys > liver > gills > skeleton > muscles [2]. Comparable mean Cd muscle concentrations were found in the examined pike and roach (0.002–0.003 mg·kg−1 ww). A slightly higher mean for total Cd concentration was found in raw fish samples from Masuria (Poland), with the highest in breams and the lowest in roaches [10].
Organisms mainly take up metals from the dissolved phase [12]. In this study, the highest level of Pb and Cd accumulation from water was observed in the organs and tissues of pike in Lake Ińsko. The bioaccumulation factors (BAFws) were found to be 7778 (mean 517) for Pb and 14,583 (mean 969) for Cd compared to water (Table A3 and Table A4). The lowest BAFw values for Pb and Cd were found in roach from Lake Wisola (Pb: mean 68 and maximum 359; Cd: mean 239 and maximum 1269). The bioaccumulation factor indicates the degree of transfer of a chemical from water into sediment or organisms; as such, it also reflects the potential of biomagnification [58].
Generally speaking, in the present study, the non-predatory roach were found to accumulate lower levels of Cd than the predatory pike; however, the highest level was found in the bentophagus (Figure 4) bream. Other authors do not note any differences in Cd concentrations between predatory and non-predatory fish [2].

3.4. Fish Safety Assessment for Consumers

Due to their varied diet, humans are subject to exposure to toxic metals from various food items; this risk is increased by the chance of biomagnification in aquatic organisms or plants [59]. Interestingly, in Europe, according to the EFSA, fish are believed to be lower dietary sources of Cd [60] than cereals, grains, vegetables, nuts, pulses and animal fat.
The assessment of exposure to Pb and Cd was carried out for a healthy adult weighing 70 kg. In addition, a weekly intake of fish muscles of two portions of 150 g was assumed, which is in line with EFSA recommendations [46]. Finally, the risk price associated with Pb intake was based on the calculation of the estimated daily intake (EDI), which was then related to two BMDL (lower confidence limit of the reference dose) dose values [46] (Table 10). The EDI level calculated for Pb depended on the species and fishing location and ranged from <0.001 (bream muscles from both lakes) to 0.067 (pike muscles from Lake Ińsko) (Table 10). The obtained EDI values for Pb accounted for <0.01% to 4.49% of the BMDL01 dose and from <0.01 to 10.69 of the BMDL10 dose. Based on the presented results, it can be concluded that the recommended fish consumption is not associated with the risk of lead-related cardiovascular problems (BMDL01 1.5 µg·kg−1 bw.·day−1) or nephrotoxicity (BMDL10 0.63 µg·kg−1 bw.·day−1) [46]. In similar fish species, other authors obtained even lower results of dietary exposure to Pb, which accounted for 0.4% of BMDL01 and 1.0% of BMDL10 [10].
The lead concentrations in the examined fish were found to be below the maximum safe levels (0.30 mg·kg−1 ww) [44]. Hence, the consumption of fish muscle does not appear to pose a risk to humans.
The assessment of exposure to Cd was based on the EWI (estimated daily intake), which was compared with the established level of tolerable weekly intake (TWI; 2.5 µg·kg−1 bw) [45]. According to JECFA [60], the total average monthly exposure of adults to Cd ranges from 2.2 to 12 µg·kg−1 bw. Taking into account the obtained results (Table 11), the intake of Pb and Cd from the consumption of the tested fish would constitute 0.2 to 1.5% of their total monthly intake. This indicates a low share of the tested fish in the dietary Cd supply. Depending on the country, the dominant sources of Cd in the diet include, for example, fish, crustaceans, spices and cereals in Chile; cereals, grains, vegetables, meat and seafood in China; and rice, vegetables, seaweed and seafood in the Republic of Korea [60]. High dietary Cd exposures in Europe, Lebanon and the USA for adults were reported to range from 6.9 to 12.1 µg/kg bw per month. These values represent a range of 28–48% of the Provisional Tolerable Monthly Intake (PTMI) for Cd [60].
Assuming that the maximum permitted level of Cd in fish is 0.05 mg·kg−1 ww, specified in the EU regulations [56], the muscles of the tested fish are safe for the consumer.
The target hazard quotient (THQ) for Pb and Cd and hazard indexes (HIs) calculated for both metals’ values were found to be within permissible limits (<1), indicating no carcinogenic health risk for consumers (Table 11 and Table 12). Other authors also reported THQ and HI < 1 for breams and roaches [10].

4. Conclusions

Our findings indicate that the water in the examined lakes has low levels of Pb and Cd. However, in both lakes, in bottom sediments containing more than 10% organic matter, their quality was found to be worse than the background. In sediments with a lower content of organic matter (<10%), no deterioration was shown.
Due to the high constant between-season capacity to bioaccumulate Pb and Cd in its roots, common reed can be a good bioindicator of contamination with these metals in the studied lakes. Our results suggest the possibility of analyzed metal bioaccumulation in the organs and tissues of pike (predator) and roach (omnivorous; prey) from Lake Ińsko. However, this needs to be confirmed in further studies that account for age differences between the studied fish species and exclude the influence of other factors. Furthermore, eating the fish meat of the species studied does not seem to pose a health risk to European consumers in terms of Pb and Cd intake. In the muscles of pike, bream and roach from both lakes, the levels of Pb and Cd were significantly below the requirements specified in European Union (EU) regulations.

Author Contributions

Conceptualization, M.R.-M. and M.P.; methodology, M.R.-M. and M.P.; software, M.R.-M.; validation, M.R.-M. and A.W.; formal analysis, M.R.-M.; investigation, M.R.-M.; resources, M.P.; data curation, M.R.-M.; writing—original draft preparation, M.R.-M.; writing—review and editing, A.W.; visualization, M.R.-M.; supervision, M.P.; project administration, M.R.-M.; funding acquisition, A.W. All authors have read and agreed to the published version of the manuscript.

Funding

This research received no external funding.

Data Availability Statement

The raw data supporting the conclusions of this article will be made available by the authors on request.

Acknowledgments

The authors are grateful to the Fisherman Holding Ińsko for their help in obtaining the research material.

Conflicts of Interest

The authors declare no conflicts of interest.

Appendix A

Table A1. Selected physicochemical parameters of the waters of the lakes Ińsko and Wisola.
ParameterLake Ińsko Lake Wisola
Surface WaterBottom WaterInflowsOutflowsSurface WaterBottom WaterInflowsOutflows
Visibility
(m)/sampling depth (m) *
5.1 ± 0.6
(4.0–6.0)
9.7 ± 2.2
(7.3–14.0)
--2.6 ± 1.2
(1.5–5.5)
9.8 ± 2.5
6.0–14.0
--
temperature (°C)12.1 ± 7.1
(3.6–21.0)
8.8 ± 5.2
(3.4–18.6)
11.8 ± 7.4
(3.2–20.7
10.9 ± 6.1
3.7–18.0
12.5 ± 7.3
(3.7–21.0)
7.9 ± 3.7
(4.2–15.3)
11.8 ± 6.5
(1.6–19.4)
13.0 ± 6.9
(3.5–19.9)
pH8.0 ± 0.3
(7.3–8.8)
7.9 ± 0.5
(7.1–9.)2
7.2 ± 0.2
(6.9–7.6)
8.1 ± 0.1
8.0–8.2
8.3 ± 0.6
(7.4–9.4)
7.6± 0.5
(7.1–8.)9
7.5 ± 0.4
(6.8–7.9)
8.2 ± 0.8
(6.4–9.2)
Oxygen concentration
(mg∙L−1)
9.0 ± 1.7
(6.5–12.6)
7.4 ± 1.9
(3.6–10.0)
7.4 ± 2.0
(5.1–10.0)
8.8 *9.6 ± 3.9
(7.6–12.5)
3.8 ± 2.8
(1.0–10.6)
7.1 ± 2.1
(2.0–10.4)
15.5 ± 10.1
(2.8)
- not applicable. * The sample was collected only once in 8 dates due to a dried-up tributary.
Table A2. Percentage of dry weight in organs and tissues of pike, bream and roach.
Dry Weight (%, Mean ± SD; Range)
Organ/PIKE BREAM Roach
TissueLake IńskoLake WisolaLake IńskoLake WisolaLake IńskoLake Wisola
gonads23.2 ± 7.1
(14.4–36.3)
24.1 ± 7.7
(15.5–36.4)
23.2 ± 6.3
(13.4–35.8)
22.2 ± 5.2
(10.0–36.7)
24.7 ± 8.6
(18.3–33.4)
24.9 ± 5.6
(14.8–35.5)
kidney18.7 ± 1.1
(13.7–21.0)
18.6 ± 1.5
(16.0–20.7)
19.3 ± 2.2
(17.1–23.6)
20.0 ± 1.4
(15.0–24.2)
21.5 ± 2.4
(16.0–23.1)
19.9 ± 2.1
(19.2–27.3)
liver27.5 ± 5.3
(18.9–34.7)
28.2 ± 4.2
(18.0–39.2)
22.5 ± 2.6
(17.4–27.3)
22.6 ± 1.8
(18.2–29.1)
23.0 ± 1.9
(19.528.9)
23.1 ± 2.8
(19.8–25.7)
spleen24.5 3.7
(21.5–26.7)
23.7 1.5
(20.5–41.7)
20.3 1.0
(18.1–23.9)
20.4 1.3
(17.9–22.5)
23.6 1.0
(20.5–25.6)
22.7 1.9
(22.6–25.0)
stomach *22.8 ± 4.0
(18.8–25.8)
21.8 ± 1.7
(17.0–43.5)
23.0 ± 1.4
(20.4–26.6)
23.5 ± 1.4
(19.8–27.2)
--
intestine24.6 ± 3.3
(21.2–27.6)
(18.7–40.0)23.5 ± 2.3
(18.8–28.8)
23.7 ± 1.7
(18.8–30.4)
21.3 ± 2.7
(18.4–24.4)
21.6 ± 1.6
(15.6–23.9)
muscle21.0 ± 2.1
(18.8–24.0)
20.7 ± 1.0
(18.7–35.6)
21.6 ± 2.5
(17.2–38.3)
21.5 ± 2.9
(17.8–37.1)
22.9 ± 5.3
(18.3–21.6)
20.7 ± 0.7
(20.4–39.6)
skin34.3 ± 2.7
(29.6–38.0)
34.6 ± 2.1
(28.3–40.8)
37.3 ± 3.1
(31.8–42.4)
37.4 ± 2.5
(29.6–43.2)
45.1 ± 5.0
(38.3–49.5)
42.2 ± 2.4
(37.1–50.6)
gills20.9 ± 2.8
(19.2–29.6)
22.5 ± 1.7
(15.2–25.5)
23.0 ± 1.8
(20.3–26.5)
23.6 ± 1.4
(17.4–26.1)
24.4 ± 3.5
(24.1–26.4)
25.2 ± 0.8
(17.4–27.5)
- not applicable. * Roach lacks a clearly defined stomach. Breams also lack a stomach, but the intestine is clearly divided into two parts, with the portion immediately behind the esophagus being noticeably larger (here, the “stomach”) and palpably separated from the remainder (here, the “intestine”).
Table A3. Lead bioaccumulation factors (BFAws) by fish from Lake Ińsko and Lake Wisola.
Fish SpeciesBioconcentration Factors (BAFws), Mean (Range)
GonadsKidneysLiverSpleenStomach *Intestine *MuscleSkinGillsTotal
Lake Ińsko
Pike511
(nd-31,11)
533
(nd-3,556)
667
(nd-7,778)
622
(nd-3,556)
444.4
(nd-2,000)
577.8
(nd-2,888)
444
(nd-2,444)
382
(nd-2,444)
467
(nd-1,778)
517
(nd-7,778)
Bream66.7
(nd-1,556)
407
(nd-2,444)
156
(nd-1,333)
111
(nd-1,111)
156
(nd-2889)
178
(nd-2,222)
44
(nd-889)
222
(nd-1,111)
133
(nd-1,778)
164
(nd-2,889)
Roach667
(nd-1,778)
444
(nd-2,222)
444
(nd-1,111)
889
(nd-1,333)
-444
(nd-1,556)
222
(nd-889)
667
(nd-5,556)
889
(nd-4,889)
583
(nd-5,556)
Lake Wisola
Pike
88
(nd-305)
92
(nd-203)
108
(nd-271)
119
(nd-542)
75
(nd-305)
92
(nd-305)
75
(nd-203)
68
(nd-305)
81
(nd-237)
88
(nd-542)
Bream169
(nd-1.254)
136
(nd-576)
68
(nd-339)
102
(nd-441)
68
(nd-305)
102
(nd-271)
68
(nd-237)
102
(nd-508)
169
(nd-1.458)
109
(nd-1,254)
Roach78
(nd-271)
77
(nd-237)
108
(nd-359)
84
(nd-203)
-68
(nd-237)
34
(nd-136)
59
(nd-271)
34
(nd-1,153)
68
(nd-359)
- not applicable. * The digestive tract of bream was divided into the anterior and posterior parts, and in the table, the anterior part is included in the column “stomach”; the digestive tract of roach was analyzed in its entirety, and in the table, it appears as “intestine”.
Table A4. Cadmium bioaccumulation factors (BFAws) by fish from Lake Ińsko and Lake Wisola.
Fish SpeciesBioconcentration Factors (BAFws), Mean (Range)
GonadsKidneysLiverSpleenStomach *Intestine *MuscleSkinGillsTotal
Lake Ińsko
Pike958
(nd-5,833
1,000
(nd-6,667)
1,250
(nd-14,583)
1,167
(nd-6,667)
833
(nd-3,750)
1,083
(nd-5,417)
833
(nd-4,583)
717
(nd-4,583)
875
(nd-3,333)
969
(nd-14,583)
Bream125
(nd-2,917)
763
(nd-4,583)
292
(nd-2,500)
208
(nd-2,083)
292
(nd-5,417)
333
(nd-4,167)
83
(nd-1,667)
417
(nd-2,083)
250
(nd-3,333)
307
(nd-5,417)
Roach1250
(nd-3,333)
833
(nd-4,167)
833
(nd-2,083)
1667
(nd-2,500)
-833
(nd-2,917)
417
(nd-1,667)
1250
(nd-1,0417)
1667
(nd-9,167)
1094
(nd-10,417)
Lake Wisola
Pike311
(<nd-1,078)
323
(<nd-719)
381
(<nd-958)
419
(<nd-1,916)
263
(<nd-1,078)
323
(<nd-1,078)
263
(<nd-719)
240
(<nd-1.078)
287
(<nd-838)
312
(<nd-1,916)
Bream599
(<nd-4,431)
479
(<nd-2,036)
240
(<120-1,198)
359
(<nd-1,557)
240
(<nd-1,078)
359
(<nd-958)
240
(<nd-838)
359
(<nd-1,796)
599
(<nd-5,150)
386
(<nd-5,150)
Roach275
(<nd-958)
273
(<nd-838)
383
(<nd-1,269)
296
(<nd-719)
240
(<nd-838)
120
(<nd-479)
207
(<nd-958)
120
(<nd-4072)
239
(<nd-1,269)
- not applicable. * The digestive tract of bream was divided into the anterior and posterior parts, and in the table, the anterior part is included in the column “stomach”; the digestive tract of roach was analyzed in its entirety, and in the table, it appears as “intestine”.

References

  1. Rahman, M.S.; Molla, A.H.; Saha, N.; Rahman, A. Study on heavy metals levels and its risk assessment in some edible fishes from Bangshi River, Savar, Dhaka, Bangladesh. Food Chem. 2012, 134, 847–854. [Google Scholar] [CrossRef]
  2. Moiseenko, T.I.; Gashkina, N.A. Distribution and bioaccumulation of heavy metals (Hg, Cd and Pb) in fish: Influence of the aquatic environment and climate. Environ. Res. Lett. 2020, 15, 115013. [Google Scholar] [CrossRef]
  3. Al-Rudainy, A.J.; Al-Samawi, S.M. Determination of lead concentration in water and in different organs of Carrasobarbus luteus and Cyprinus carpio Tigris River. Iraqi J. Vet. Med. 2017, 41, 43–48. [Google Scholar] [CrossRef]
  4. Badawi, A.; Magdy, S. Evaluation of the pollution extent of heavy metals in the sediment of the Nile Delta, Mediterranean Coast, Egypt. Egypt. J. Aquat. Res. 2023, 49, 221–228. [Google Scholar] [CrossRef]
  5. Protasowicki, M.; Niedźwiecki, E. Ecological Threats in the Countries of the Oder Estuary Due to the Use of Metals (Zagrożenia Ekologiczne w Strefie Ujścia Odry ze Szczególnym Uwzględnieniem Metali Ciężkich). In Materiały Sympozjum „Substancje toksyczne w środowisku”; Drabent, Z., Smoczyński, L., Eds.; ART, Katedra Chemii: Olsztyn, Poland, 1991; pp. 3–6. (In Polish) [Google Scholar]
  6. Rahman, Z.; Singh, V.P. The relative impact of toxic heavy metals (THMs) (arsenic (As), cadmium (Cd), chromium (Cr)(VI), mercury (Hg), and lead (Pb)) on the total environment: An overview. Environ. Monit. Assess. 2019, 191, 419. [Google Scholar] [CrossRef] [PubMed]
  7. Directive 2000/60/EC of the European Parliament and of the Council of 23 October 2000 Establishing a Framework for Community Action in the Field of Water Policy (OJ L 327, 22.12.2000, p. 1), Amended by Commission Directive 2014/101/EU of 30 October 2014 (OJ L 311, 31.10.2014). Available online: https://eur-lex.europa.eu/legal-content/EN/TXT/PDF/?uri=CELEX:02000L0060-20141120 (accessed on 12 April 2025).
  8. Zhang, Y.; Xu, X.; Sun, D.; Cao, J.; Zhang, Y.; Huo, X. Alteration of the number and percentage of innate immune cells in preschool children from an e-waste recycling area. Ecotoxicol. Environ. Saf. 2017, 145, 615–622. [Google Scholar] [CrossRef]
  9. Satarug, S.; Garrett, S.H.; Sens, M.A.; Sens, D.A. Cadmium, environmental exposure, and health outcomes. Environ. Health Perspect. 2010, 118, 182–190. [Google Scholar] [CrossRef] [PubMed]
  10. Mielcarek, K.; Nowakowski, P.; Puścion-Jakubik, A.; Gromkowska-Kępka, K.J.; Soroczyńska, J.; Markiewicz-Zukowska, R.; Naliwajko, S.K.; Grabia, M.; Bielecka, J.; Żmudzińska, A.; et al. Arsenic, cadmium, lead and mercury content and health risk assessment of consuming freshwater fish with elements of chemometric analysis. Food Chem. 2022, 379, 132167. [Google Scholar] [CrossRef]
  11. Environmental Fact Sheet: EPA Releases RCRA Waste Minimization PBT Chemical List; National Service Center for Environmental Publications (NSCEP): Cincinnati, OH, USA, 1998.
  12. Calmano, W.; Förstner, U. Chemical extraction of heavy metals in polluted river sediments in Central Europe. Sci. Total Environ. 1982, 28, 77–90. [Google Scholar] [CrossRef]
  13. Calmano, W.; Ahlf, W.; Förstner, U. Exchange of Heavy Metals Between Sediment Component and Water. In Metal Speciation in the Environment; NATO ASI G23; Springer: Berlin/Heidelberg, Germany, 1990; pp. 503–520. [Google Scholar]
  14. Wardas, M.; Budek, L.; Helios Rybicka, E. Variability of heavy metals in bottom sediments of the Wilga River, a tributory of the Vistula River (Kraków area, Poland). Appl. Geochem. 1996, 11, 197–202. [Google Scholar] [CrossRef]
  15. Girolametti, F.; Fanelli, M.; Ajdini, B.; Truzzi, C.; Illuminati, S.; Susmel, S.; Celussi, M.; Šangulin, J.; Annibaldi, A. Dissolved Potentially Toxic Elements (PTEs) in Relation to Depuration Plant Outflows in Adriatic Coastal Waters: A Two Year Monitoring Survey. Water 2022, 14, 569. [Google Scholar] [CrossRef]
  16. Ricart, M.; Guasch, H.; Barceló, D.; Brix, R.; Conceicao, M.H.; Geiszinger, A.; López de Alda, M.J.; López-Doval, J.C.; Munoz, I.; Postigo, C.; et al. Primary and complex stressors in polluted Mediterranean rivers: Pesticide effects on biological communities. J. Hydrol. 2010, 383, 52–61. [Google Scholar] [CrossRef]
  17. Maceda-Veiga, A.; Monroy, M.; Navarro, E.; Viscor, E.; de Sostoa, A. Metal concentrations and pathological responses of wild native fish exposed to sewage discharge in a Mediterranean river. Sci. Total Environ. 2013, 449, 9–19. [Google Scholar] [CrossRef] [PubMed]
  18. Khan, A.H.I.; Kiyani, A.; Santiago-Herrera, M.; Ibáñez, J.; Yousaf, S.; Iqbal, M.; Martel-Martín, S.; Barros, R. Sustainability of phytoremediation: Post-harvest stratagems and economic opportunities for the produced metals contaminated biomass. J. Environ. Manag. 2023, 326, 116700. [Google Scholar] [CrossRef] [PubMed]
  19. Garai, P.; Banerjee, P.; Mondal, P.; Saha, N.C. Effect of Heavy Metals on Fishes: Toxicity and Bioaccumulation. J. Clin. Toxicol. 2021, S18, 001. [Google Scholar]
  20. Hama Aziz, K.H.; Mustafa, F.S.; Omer, K.M.; Hama, S.; Hamarawf, R.F.; Rahman, K.O. Heavy metal pollution in the aquatic environment: Efficient and low-cost removal approaches to eliminate their toxicity: A review. RSC Adv. 2023, 13, 17595. [Google Scholar] [CrossRef] [PubMed]
  21. Singh, J.; Kalamdhad, A.S. Effects of Heavy Metals on Soil, Plants, Human Health and Aquatic Life. Int. J. Res. Chem. Environ. 2011, 1, 15–21. [Google Scholar]
  22. Bąkowski, M.; Winiarska-Mieczan, A.; Kwiecień, M.; Krusiński, R.; Jachimowicz-Rogowska, K.; Twarużek, M.; Grobelska, D. Effect of cadmium and lead on living organisms—Transport, accumulation, metabolism. J. Elem. 2024, 29, 311–328. [Google Scholar] [CrossRef]
  23. Perera, P.; Kodithu, P.S.; Sundara, V.T.; Edirisingh, U. Bioaccumulation of Cadmium in Freshwater Fish: An Environmental Perspective. Insight Ecol. 2015, 4, 1–12. [Google Scholar] [CrossRef]
  24. Prica, M.; Andrejić, G.; Šinžar-Sekulić, J.; Rakić, T.; Dželetović, Ž. Bioaccumulation of heavy metals in common reed (Phragmites australis) growing spontaneously on highly contaminated mine tailing ponds in Serbia and potential use of this species in phytoremediation. Bot. Serbica 2019, 43, 85–95. [Google Scholar] [CrossRef]
  25. Niemi, N.; Hansen, J.P.; Eklöf, J.S.; Eriksson, B.K.; Andersson, H.C.; Bergström, U.; Östman, Ö. Influence of reed beds (Phragmites australis) and submerged vegetation on pike (Esox Lucius). Fish. Res. 2023, 261, 106621. [Google Scholar] [CrossRef]
  26. Bonanno, G. Comparative performance of trace element bioaccumulation and biomonitoring in the plant species Typha domingensis, Phragmites australis and Arundo donax. Ecotoxicol. Environ. Saf. 2013, 97, 124–130. [Google Scholar] [CrossRef]
  27. Marek, J. Heavy Metals in the Aquatic Environment of the Barycz Valley—Assessment of Threats to Fisheries Management (Metale ciężkie w środowisku wodnym Doliny Baryczy ocena zagrożeń gospodarki rybackiej); 1991/wPol/1/4; Wyd; Akademii Rolniczej we Wrocławiu: Wrocław, Poland, 1991. (In Polish) [Google Scholar]
  28. Ali, H.; Khan, E. Trophic Transfer, Bioaccumulation, and Biomagnification of Non-Essential Hazardous Heavy Metals and Metalloids in Food Chains/Webs—Concepts and Implications for Wildlife and Human Health. Hum. Ecol. Risk Assess. Int. J. 2019, 25, 1353–1376. [Google Scholar] [CrossRef]
  29. Jamil Emon, F.; Rohani, M.F.; Sumaiya, N.; Tuj Jannat, M.F.; Akter, Y.; Shahjahan, M.; Abdul Kari, Z.; Tahiluddin, A.B.; Goh, K.W. Bioaccumulation and Bioremediation of Heavy Metals in Fishes-A Review. Toxics. 2023, 11, 510. [Google Scholar] [CrossRef] [PubMed]
  30. Ab Latif Wani, A.L.; Ara, A.; Usmani, J.A. Lead toxicity: A review. Interdiscip. Toxicol. 2015, 8, 55–64. [Google Scholar] [CrossRef] [PubMed]
  31. Briffa, J.; Sinagra, E.; Blundell, R. Heavy metal pollution in the environment and their toxicological effects on humans. Heliyon 2020, 6, e04691. [Google Scholar] [CrossRef]
  32. Valko, M.; Morris, H.; Cronin, M. Metals, toxicity and oxidative stress. Curr. Med. Chem. 2005, 12, 1161–1208. [Google Scholar] [CrossRef]
  33. Witkowska, D.; Słowik, J.; Chilicka, K. Heavy metals and human health: Possible exposure pathways and the competition for protein binding sites. Molecules 2024, 26, 6060. [Google Scholar] [CrossRef]
  34. Linnik, P.M.; Zubenko, I.B. Role of bottom sediments in the secondary pollution of aquatic environments by heavy-metal compounds. Lakes Reserv. Res. Manag. 2000, 5, 11–21. [Google Scholar] [CrossRef]
  35. Filipiak, J.; Raczyński, M. West Pomeranian Lakes (Outline of Factography); Akademia Rolnicza w Szczecinie: Szczecin, Poland, 2000. (In Polish) [Google Scholar]
  36. Trojanowski, J.; Parzych, A.; Trojanowska, C.; Bruski, J. The trophic condition of Lake Ińsko. Arch. Environ. Prot. 2004, 30, 85–100. (In Polish) [Google Scholar]
  37. Kubiak, J.; Machula, S.; Czerniejewski, P.; Brysiewicz, A.; Wawrzyniak, W. Long term changes in the quality and water trophy of Lake Ińsko—The effect of the re-oligotrophication? J. Water Land Dev. 2021, 51, 30–37. [Google Scholar] [CrossRef]
  38. AOAC. Official Methods of Analysis, 17th ed.; Method 950.46; AOAC International: Gaithersburg, MD, USA, 2000. [Google Scholar]
  39. ASTM D3174-12(2018); Standard Test Method for Ash in the Analysis Sample of Coal and Coke from Coal. ASTM: West Conshohocken, PA, USA, 2020. Available online: https://store.astm.org/d3174-12r18e01.html (accessed on 12 April 2025).
  40. Chakravarty, M.M.; Patgiri, A.D. Metal pollution assessment in sediments of the Dikrong River, NE India. J. Hum. Ecol. 2009, 27, 63–67. [Google Scholar] [CrossRef]
  41. Seshan, B.R.R.; Natesan, U.; Deepthi, K. Geochemical and statistical approach for evaluation of heavy metal pollution in core sediments in southeast coast of India. Int. J. Environ. Sci. Technol. 2010, 7, 291–306. [Google Scholar] [CrossRef]
  42. Bojakowska, I.; Sokołowska, G. Geochemiczne klasy czystości osadów wodnych. Geochem. Purity Cl. Aqueous Sediments Przegląd Geol. 1998, 46, 49–54. (In Polish) [Google Scholar]
  43. US EPA. Risk-Based Concentration Table; United States Environmental Protection Agency: Washington, DC, USA, 2000. Available online: https://www.epa.gov/risk/regional-screening-levels-rsls-generic-tables (accessed on 10 May 2025).
  44. Commission Regulation (EU) 2023/915 of 25 April 2023 on Maximum Levels for Certain Contaminants in Food and Repealing REGULATION (EC) No 1881/2006. Off. J. Eur. Union 2023, 119, 103–157.
  45. US EPA. Quantitative Risk Assessment Calculations; Environmental Protection Agency: Washington, DC, USA, 2015. Available online: https://www.epa.gov/sites/default/files/2015-05/documents/13.pdf (accessed on 10 May 2025).
  46. European Food Safety Authority (EFSA). Lead dietary exposure in the European population. EFSA J. 2012, 10, 2831. [Google Scholar] [CrossRef]
  47. European Food Safety Authority (EFSA). Cadmium dietary exposure in the European population. EFSA J. 2012, 10, 2551. [Google Scholar] [CrossRef]
  48. Rozporządzenie Ministra Infrastruktury z Dnia 25 Czerwca 2021 r. w Sprawie Klasyfikacji Stanu Ekologicznego, Potencjału Ekologicznego i Stanu Chemicznego Oraz Sposobu Klasyfikacji Stanu Jednolitych Części Wód Powierzchniowych, a Także Środowiskowych Norm Jakości dla Substancji Priorytetowych. Dz.U. 2021 poz. 1475. Available online: https://isap.sejm.gov.pl/isap.nsf/DocDetails.xsp?id=WDU20210001475 (accessed on 10 May 2025).
  49. Gwoździński, K.; Mazur, J.; Pieniążek, A. Concentrations of Metals in Water of Unmonitored Lakes Near a Landscape Park. Pol. J. Environ. Stud. 2014, 23, 1317–1321. [Google Scholar]
  50. CCME. Summary of Existing Canadian Environmental Quality Guidelines. 2002. Available online: https://ccme.ca/en/current-activities/canadian-environmental-quality-guidelines (accessed on 12 April 2025).
  51. Zerbe, J.; Sobczyński, T.; Elbanowska, H.; Siepak, J. Speciation of Heavy Metals in Bottom Sediments of Lakes. Pol. J. Environ. Stud. 1999, 8, 331–339. [Google Scholar]
  52. Kwapulinski, J.; Wiechula, D. Forms of Selected Heavy Metals in the Bottom Sediments of Goczalkowice Reservoir; Chemistry and Environmental Protection; Polytechnic University of Lublin: Lublin, Poland, 1993; Volume 142. [Google Scholar]
  53. Environmental Protection Agency (EPA). Emissions of Arsenic Compounds. In Technology Transfer Network, National Air Toxics Assessment 2005, Pollutant-Specific Data Tables, US; EPA: Washington, DC, USA, 2005. [Google Scholar]
  54. Rahman, S.U.; Qin, A.; Zain, M.; Mushtaq, Z.; Mehmood, F.; Riaz, L.; Naveed, S.; Ansari, M.J.; Saeed, M.; Ahmad, I.; et al. Pb uptake, accumulation, and translocation in plants: Plant physiological, biochemical, and molecular response: A review. Heliyon 2024, 10, e27724. [Google Scholar] [CrossRef] [PubMed]
  55. Allaway, W.H. Agronomic Controls Over the Environmental Cycling of Trace Elements. In Advances in Agronomy; Norman, A.G., Ed.; Academic Press: Cambridge, MA, USA, 1968; Volume 20, pp. 235–274. [Google Scholar]
  56. Szarek-Gwiazda, E.; Amirowicz, A. Bioaccumulation of trace elements in roach, silver bream, rudd, and perch living in an inundated opencast sulphur mine. Aquat. Ecol. 2006, 40, 221–236. [Google Scholar] [CrossRef]
  57. Chałabis-Mazurek, A.; Rechulicz, J.; Pyz-Łukasik, R.A. Food-Safety Risk Assessment of Mercury, Lead and Cadmium in Fish Recreationally Caught from Three Lakes in Poland. Animals 2021, 11, 3507. [Google Scholar] [CrossRef]
  58. Burkhard, L.P. Evaluation of published bioconcentration factor (BCF) and bioaccumulation factor (BAF) Data for per- and polyfluoroalkyl substances across aquatic species. Environ. Toxicol. Chem. 2021, 40, 1530–1543. [Google Scholar] [CrossRef] [PubMed]
  59. Has-Schön, E.; Bogut, I.; Strelec, I. Heavy metal profile in five fish species included in human diet, domiciled in the end flow of river Neretva (Croatia). Arch. Environ. Contam. Toxicol. 2006, 50, 545–551. [Google Scholar] [CrossRef]
  60. Evaluation of Certain Food Additives and Contaminants: Seventy-Third Report of the Joint FAO/WHO Expert Committee on Food Additives; FAO/WHO Technical Report Series 960—JECFA 73; WHO: Geneva, Switzerland, 2011.
Figure 1. Location of sampling sites on Lakes Ińsko and Wisola (northwest Poland) (based on maps downloaded from: geoportal.gov.pl and TUBS, Wikimedia Commons).
Water 17 02255 g001
Figure 2. Percentage of Pb and Cd in individual geochemical fractions of bottom sediments. Sampling sites: Lake Ińsko I1 and I2; Lake Wisola W1 and W5 (Figure 1).
Water 17 02255 g002
Figure 3. Pb concentration (mean ± SD; mg·kg−1 ww) in organs and tissues of fish from Lakes Ińsko and Wisola. abc Different lowercase letters indicate significant interspecies differences in metal bioaccumulation in the same organ or tissue (p < 0.05). Furthermore, a expresses the significantly highest and c the lowest value. * The roach lacks a clearly separated stomach in its digestive system. To convert metal content to dry weight (μg g−1 dw), use Table A2 (Appendix A).
Water 17 02255 g003
Figure 4. Cd concentration (mean ± SD; mg·kg−1 ww) in organs and tissues of fish from the lakes Ińsko and Wisola. abc Different lowercase letters indicate significant interspecies differences in metal bioaccumulation in the same organ or tissue (p < 0.05). Furthermore, a expresses the significantly highest and c the lowest value. * The roach lacks a clearly separated stomach in its digestive system. To convert metal content to dry weight (μg·g−1 dw), use Table A2 (Appendix A).
Water 17 02255 g004
Table 1. Length and weight of the tested fish.
LakeFish SpeciesNo. of FishBody Weight (g)Total Length (cm)
Mean ± SD(Range)Mean ± SD(Range)
IńskoPike80683 ± 134.6487.4–943.546.8 ± 3.242.1–53.1
Bream80707.9 ± 160.3409.9–931.939.4 ±2.735.5–43.1
Roach80120.6 ± 21.589.4–154.525.7 ± 11.719.8–56.3
WisolaPike80665.1 ± 224.0450.5–1180.146.5 ± 4.541.1–55.9
Bream80599.3 ± 136.5407.4–820.937.7 ± 2.733.7–232.9
Roach80101.5 ± 22.176.4–141.421.2 ± 1.719.0–24.2
Table 2. Technical details of microwave mineralization of the tested material.
MaterialAmount (g)Reagents *Parameters of Digestion Process (Step Number) **
Bottom sediments0.2 ± 0.001 (dw)3 mL(I) 90 PSI, 20 min; (II) 100 PSI, 30 min; (III) 150 PSI, 35 min; (IV) 160 PSI, 10 min
Common reed 0.3 ± 0.001 g dw6 mL HNO3; 2 mL H2O2 *(I) 65 PSI, 20 min; (II) 70 PSI, 20 min
Fish1 ± 0.001 g ww5 mL HNO3(1) 20 PSI, 5 min; (2) 40 PSI, 10 min; (3) 85 PSI, 10 min; (4) 135 PSI, 10 min; (5) 175 PSI, 5 min
* H2O2 30% and HNO3 65% (EMSURE®, Merck KGaA, Darmstadt, Germany); Abbreviations: dw—dry weight; ww—wet weight. ** In every step of the digestion process, 100% power was applied.
Table 3. Analysis of certified materials MESS-3 and INCT-MPH-2.
Certificate MATERIALPb (mg·kg−1 ± SD) Cd (mg·kg−1 ± SD)
Certified
Value
Obtained
Value
Recovery
(%)
Certified
Value
Obtained ValueRecovery
(%)
MESS-321.1 ± 1.020.0 ± 1.294.80.24 ± 0.010.23 ± 0.0295.8
INCT-MPH-22.16 ± 0.232.08 ± 0.1096.30.199 ± 0.0150.203 ± 0.030102.0
DOLT-30.32 ± 0.050.31 ± 0.0697.419.4 ± 0.618.5 * ± 0.1095.4
* The certified range of Cd content in DOLT-3 does not coincide with the average values obtained in the tested fish.
Table 4. Metal concentrations in the waters of the lakes Ińsko and Wisola and their tributaries and outflows (μg·L−1).
LakeWaternPb (μg·L−1)
Mean ± SD (Range)
Cd (μg·L−1)
Mean ± SD (Range)
Ińskosurface1200.04 aA ± 0.03 (<0.02–0.16)0.020 aA ± 0.018 (0.001–0.071)
bottom480.05 aA ± 0.04 (<0.02–0.25)0.028 acA ± 0.023 (0.006–0.089)
tributaries180.10 bA ± 0.05 (0.04–0.19)0.030 cA ± 0.030 (0.004–0.128)
outflow90.06 aA ± 0.05 (<0.02–0.17)0.014 dA ± 0.009 (0.007–0.031)
Wisolasurface720.17 aB ± 0.11 (<0.02–0.54)0.059 aB ± 0.043 (0.012–0.253)
bottom660.42 bB ± 0.36 (0.05–1.81)0.108 bB ± 0.112 (0.018–0.543)
tributaries390.44 bB ± 0.23 (0.14–1.03)0.257 cB ± 0.201 (0.027–0.709)
outflow390.26 cB ± 0.24 (<0.02–1.20)0.122 bB ± 0.101 (0.015–0.545)
Superscripts: a,b,c,d—different lowercase letters indicate significant intra-group differences in metal concentrations between surface, bottom, tributaries and outflow waters of a given lake. AB—Capital letters in superscripts signify the differences between groups, i.e., between the same types of waters from different lakes.
Table 5. The share of organic matter in the bottom sediments of the lakes Ińsko and Wisola.
Bottom SedimentsOrganic Matter (%)
Lake IńskoLake Wisola
nMean ± SD (Range)nMean ± SD (Range)
organic (muddy) 16619.4 aA ± 3.8 (14.9–28.1)4836.4 aB ± 8.2 (12.5–47.9)
mineral (sandy) 2661.2 bA ± 0.9 (0.3–3.6)1141.6 bA ± 1.3 (0.2–5.1)
1 organic (muddy) sediments—organic matter content > 10%; 2 mineral (sandy) sediments—organic matter content < 10%. ab Different lowercase letters indicate significant differences (p < 0.05) between organic and mineral bottom sediments in a given lake; uppercase AB letters in superscript indicate significant differences (p < 0.05) between Pb and Cd accumulation in the same sediment types from different lakes.
Table 6. The contents of Pb and Cd (mg·kg−1 dw) in bottom sediments from the examined lakes.
MetalBottom
Sediments
Lake IńskoLake Wisola
Mean ± SD
(Range)
Mean ± SD
(Range)
Pborganic (muddy) *47.6 aA ± 13.3
(13.3–78.5)
59.4 aB ± 24.4
(12.1–108.0)
mineral (sandy) **3.5 b ± 1.5
(1.1–6.5)
4.4 b ± 3.1
(0.5–11.4)
Cdorganic (muddy) *0.97 aA ± 0.42
(0.06–1.90)
1.12 aB ± 0.86
(0.03–3.42)
mineral (sandy) **0.05 b ± 0.03
(0.02–0.14)
0.10 b ± 0.19
(0.01–1.30)
* Organic bottom sediment collection points (Figure 1): Lake Ińsko I1, I2 and I5 (n = 48); Lake Wisola W1, W2 and W5 (n = 48); ** mineral bottom sediment: Lake Ińsko I4, I7 and I8 (n = 72); Lake Wisola W3, W4, W6 and W7 (n = 120); ab significant differences (p < 0.05) between organic and mineral bottom sediments in a given lake; AB significant differences (p < 0.05) between Pb and Cd accumulation in the same sediment types from different lakes.
Table 7. Pb and Cd accumulation factors (AFs) and contamination factors (CFs) in bottom sediments from examined lakes.
Metal/BottomLake IńskoLake Wisola
PLISedimentsAFCFAFCF
Pborganic1,057,7774.8201,3565.9
(muddy)(29,555–1,744,444)(41,017–366,102)
Cdorganic40,4171.940,4172.2
(muddy)(2500–179,167)(2500–179,167)
PLI 9.2 13.3
Pbmineral77,7770.414,9150.4
(sandy)(24,444–144,444)(1695–38,644)
Cdmineral20830.11190.2
(sandy)(833–5833)(119–15,476)
PLI 0.04 0.09
PLI—the number of times by which the metal concentrations in the sediment exceeds the background concentration; AF—accumulation factor, calculated with respect to the concentration of metals in water; CF—contamination factor, with the quotient obtained by dividing the concentration of each metal with the background value of the metal [40,41]; PLI—pollution load index.
Table 8. Pb and Cd contents (mean ± SD (range); mg·kg−1 dw) in tissues of common reed from the lakes Ińsko and Wisola.
Plant OrganLake Ińsko, n = 72 Lake Wisola, n = 75
PbCdPbCd
Leaves0.17 aA ± 0.110.015 aA ± 0.0100.18 aA ± 0.130.021 aB ± 0.005
(0.06–0.55)(0.001–0.042)(0.01–0.86)(0.002–0.029)
Stems0.20 bA ± 0.200.015 abA ± 0.0150.24 bB ± 0.130.019 bB ± 0.013
(0.01–0.94)(0.002–0.087)(0.03–0.60)(0.002–0.069)
Rhizomes0.16 aA ± 0.060.016 bA ± 0.0190.18 aA ± 0.120.057 cB ± 0.022
(0.03–0.34)(0.001–0.090)(0.04–0.58)(0.004–0.041)
Roots4.41 cA ± 1.720.494 cA ± 0.3404.65 cA ± 1.640.455 dA ± 0.361
(1.54–9.56)(0.087–1.569)(1.64–7.51)(0.045–1.658)
a,b,c,d Differences in lowercase letters indicate significant differences in Pb and Cd accumulation between tissues of common reed in a given lake (p < 0.05); uppercase AB letters in superscript indicate significant differences (p < 0.05) between Pb and Cd contents in the same part of plants from different lakes.
Table 9. Bioaccumulation factors of Pb and Cd in tissues of common reed.
LakePlant
Organs
Pb, Mean (Range)Cd, Mean (Range)
BAFwBAFsBAFwBAFs
IńskoLeaves3777
(1333–12,222)
0.05
(0.02–0.16)
625
(42–1750)
0.3
(0.02–0.84)
Stems4444
(222–20,888)
0.06
(<0.01–0.27)
625
(83–3625)
0.30
(0.04–1.74)
Rhizomes 3555
(667–7556)
0.05
(0.01–0.10)
667
(42–3750)
0.32
(0.02–1.8)
Roots98,000
(34,222–212,444)
1.26
(0.44–2.7)
20,583
(3625–65,375)
9.88
(1.74–31.38)
WisolaLeaves610
(31–2915)
0.04
(0.01–0.13)
875
(83–1208)
0.19
(0.02–0.69)
Stems814
(102–2034)
0.05
(<0.01–0.14)
792
(83–2875)
0.1
(0.02–0.21)
Rhizomes610
(136–1966)
0.041
(<0.01–0.13)
2375
(167–1708)
0.57
(0.04–0.41)
Roots15,763
(5559–25,458)
1.05
(0.37–1.71)
18,958
(1875–69,083)
4.55
(0.45–16.58)
BAFw—bioaccumulation factor referring to the mean concentration of Pb/Cd in surface and bottom waters; BAFs—bioaccumulation factor referring to the content of an element in mineral bottom sediments.
Table 10. Assessment of dietary exposure to Pb for adults (mean and range).
LakeFish SpeciesEDI
(µg∙kg−1 bw)
EWI
(µg∙kg−1 bw)
Percentage of BMDL01Percentage of BMDL10THQ
IńskoPike0.012
(0.006–0.067)
0.052
(0.026–0.289)
0.82
(0.41–4.49)
1.94
(0.97–10.69)
0.003
(0.002–0.019)
Bream0.006
(<0.001–0.024)
0.026
(<0.001–0.105)
0.41
(<0.01–1.63)
0.97
(<0.01–3.89)
0.002
(<0.001–0.007)
Roach0.006
(0.006–0.024)
0.026
(0.026–0.105)
0.41
(0.41–1.63)
0.97
(0.97–3.89)
0.002
(0.002–0.007)
WisolaPike0.012
(0.006–0.037)
0.052
(0.026–0.157)
0.82
(0.41–2.45)
1.94
(0.97–5.83)
0.003
(0.002–0.010)
Bream0.012
(<0.001–0.043)
0.052
(<0.001–0.184)
0.82
(<0.01–2.86)
1.94
(<0.01–6.80)
0.003
(<0.001–0.012)
Roach0.012
(0.006–0.024)
0.052
(0.026–0.105)
0.82
(0.41–1.63)
1.94
(0.97–3.89)
0.003
(0.002–0.007)
Calculations were made for an adult with a body mass of 70 kg; EDI, estimated daily intake; EWI, estimated weekly intake; BMDL01 and BMDL10 refer to cardiovascular problems and nephrotoxicity associated with Pb exposure, respectively; THQ, target hazard quotient.
Table 11. Assessment of adult consumer exposure to Pb and Cd related to fish consumption (mean and range).
LakeFish SpeciesEDI
(µg∙kg−1 bw)
EWI
(µg∙kg−1 bw)
Percentage of TWITHQ
IńskoPike0.002
(0.001–0.013)
0.008
(0.003–0.055)
0.31
(0.10–2.20)
0.002
(0.001–0.013)
Bream0.001
(<0.001–0.010)
0.005
(<0.001–0.045)
0.21
(<0.01–1.78)
0.001
(<0.001–0.010)
Roach0.002
(0.001–0.013)
0.008
(0.003–0.055)
0.31
(0.10–2.20)
0.002
(0.001–0.013)
WisolaPike0.002
(0.001–0.010)
0.008
(0.003–0.045)
0.31
(0.10–1.78)
0.002
(0.001–0.010)
Bream0.001
(<0.001–0.013)
0.005
(<0.001–0.058)
0.21
(<0.01–2.31)
0.001
(<0.010–0.013)
Roach0.001
(0.001–0.004)
0.005
(0.003–0.016)
0.21
(0.10–0.63)
0.001
(0.001–0.004)
Calculations were made for an adult with a body mass of 70 kg; EDI, estimated daily intake; EWI, estimated weekly intake; BMDL (benchmark dose lower confidence limit); THQ, target hazard quotient; HI, tolerable weekly intake.
Table 12. Assessment of the potential risk of non-cancer health effects resulting from exposure to Pb and cadmium (Cd) based on the hazard index (HI).
Lake IńskoLake Wisola
PikeBreamRoachPikeBreamRoach
HI0.0050.0030.0040.0050.0050.005
(0.002–0.032)(<0.001–0.017)(0.002–0.020)(0.002–0.021)(<0.001–0.025)(0.002–0.010)
HI—hazard index.
Disclaimer/Publisher’s Note: The statements, opinions and data contained in all publications are solely those of the individual author(s) and contributor(s) and not of MDPI and/or the editor(s). MDPI and/or the editor(s) disclaim responsibility for any injury to people or property resulting from any ideas, methods, instructions or products referred to in the content.

