Abstract
As a fundamental element of nature, water determines the existence of life on Earth. The physicochemical and biological composition of natural waters is closely correlated with the state of the environment through which they flow. The main threat is municipal wastewater, but also nonpoint source pollution from agriculture, which has a major impact on the state of the aquatic environment. The main objective of this study was to analyse selected heavy metals in surface waters and bottom sediments of the Świder River. Given the intricate nature of how heavy metals interact and move between water and sediment, the study also aimed to show whether bottom sediments of surface waters may pose an environmental risk—particularly through the potential release of toxic metals and the development of tourism on the Świder River. The obtained values of the concentrations of the analysed metals were below the permissible standards. The highest concentrations were found in the lower reaches of the Świder River, where a tourist and more urbanised area is located. The obtained results allowed us to assess the bioavailability of these metals, and will be used by local government units to improve the management of this area in order to minimise anthropogenic pollution.
1. Introduction
The growing awareness of the threats posed by environmental pollution has resulted in the need to regular monitoring of different toxic and carcinogenic substances in its various components and food [1,2,3,4].
The rapid development of industry worldwide has led to an increase in environmental pollution with heavy metals [5,6,7]. Heavy metals are elements with a specific mass of more than 4.5 g/cm3, which tend to donate electrons in redox reactions to form cations. In their liquid and solid states, metals have a sheen and are opaque. In addition, they show good electrical and thermal conductivity, and are malleable and ductile.
The toxicity of heavy metals in natural waters is determined by the form in which they occur and by their concentration, water pH and temperature, dissolved oxygen, redox potential, total and carbonate hardness, the presence of organic ligands and other toxic substances. The strongest toxic effects are exhibited by heavy metal combinations that are soluble in water and body fluids and by compounds that dissociate. Thus, the best protection against the toxicity of heavy metals present in water is to precipitate them in the form of insoluble precipitates. In oxygenated surface waters, a considerable proportion of metals are precipitated as carbonates and hydroxides. On the other hand, in waters containing sulphur and devoid of dissolved oxygen, heavy metals are precipitated in the form of sulphides [8].
The pH of natural waters is the main factor influencing the form of heavy metals. However, the safe concentration limits of hydrogen ions vary for different heavy metals. In aqueous solutions at pH levels above the optimum, hydroxycomplexes of metals are formed, which increase their solubility and thus their toxicity [9]. However, this is not usually the case in surface waters, as waters with such a high concentration of hydroxyl ions (OH−) are not found. On the other hand, precipitated, sparingly soluble heavy metal compounds fall with suspended matter of natural waters into the bottom sediments.
Depending on the degree of risk to organisms and the environment, heavy metals are divided into four groups: (1) those with a very high degree of potential hazard (e.g., mercury, cadmium, lead, copper), (2) those with a high degree of potential hazard (e.g., manganese, molybdenum, iron), (3) those with a medium degree of potential hazard (e.g., cobalt, nickel), and (4) those with a low degree of potential hazard (e.g., zirconium, strontium) [10]. The movement of heavy metals into individual links of the food chain, and consequently into the human body, is limited by the action of biological barriers. At the same time, with excessive concentrations of these elements, the action of biological barriers is limited, which is associated with increased risk to public health and ecological balance.
The risk of heavy metal poisoning results from their direct movement in the trophic chain: soil–plant–animal–human and from the possibility of accumulation in the human body. The primary origins of heavy metals in the soil include: bedrock, transport and industrial emissions, municipal services and agriculture (high-dose use of contaminated mineral fertilisers, use of waste lime for soil deacidification, plant protection products, sludge fertilisation). Depending on the terrain, these metals can enter surface waters along with runoff from fields [11,12,13,14,15,16].
High concentrations of heavy metals, including lead, cadmium, arsenic, mercury, copper, zinc, and selenium in the human body can affect the risk of developing cancer [17]. Many experts (medical oncologists and geneticists) indicate that in the future, heavy metals could be used as markers of the risk of developing these diseases. Scientific studies conducted in various centres confirm the connection between contact with heavy metals (Cd, As, Ni and Cr) and the development of oxidative stress [18,19,20]. Exposure to these elements also enhances the production of free radicals and impairs defence mechanisms, thus triggering the cancerous process.
Heavy metals usually penetrate the bodies of human and animal by means of the oral or inhalation route (by inhaling volatile compounds or as pure metal vapours) [21]. The health effects of the regular consumption of products containing even small amounts of these elements may take many years to become apparent, because some of them accumulate in the body [22]. Minerals are excreted from the body in the faeces (most components), in the urine (sodium, chlorine, potassium, calcium, phosphorus, magnesium, fluorine, iodine and selenium) or in the bile (iron, zinc, copper, manganese). An adequate and varied diet provides a healthy body with all the necessary micronutrients [23,24,25].
Heavy metals can also be absorbed through the skin [26]. This process occurs through the skin appendages, mainly the sebaceous glands and hair follicles, and to a lesser extent through the sweat glands. Heavy metals in the human body primarily cause changes in, among others, protein synthesis [27,28,29]. The extent of the disorders depends on the amount of the element introduced into the body, the duration of exposure of the body, the degree of toxicity of a given substance, its chemical form, its solubility in body fluids and lipids, as well as the immunity of the organism concerned [30].
The toxic effects of heavy metals on living organisms are far-reaching. The most toxic metals include lead, mercury and cadmium [31,32,33,34]. These metals easily accumulate, and carcinogenic effects occur when the level of an element in the body exceeds a threshold dose. The organs most exposed to the effects of heavy metals are those involved in metal detoxification or elimination, mainly the liver and kidneys [35,36,37,38]. In addition, metal accumulation can occur in the bones, brain, and muscles [39,40,41]. Heavy metals can cause immediate acute poisoning or chronic conditions that remain latent for a long time. After an extended period, however, very dangerous changes can occur, often resulting in genetic mutations or damage to the central nervous system. The resulting mutagenic changes can subsequently lead to cancerous conditions [42,43].
Heavy metals are not biologically degradable [44,45,46]. Their detoxification by organisms involves ‘hiding’ active metal ions within proteins, e.g., toxic lead and radioactive radon accumulate in bone tissue, while the kidneys and liver accumulate cadmium and mercury.
The primary purpose of the study was to evaluate the level of heavy metal contamination of the surface waters of the Świder River and to analyse its seasonal variability. The research aimed to determine whether the concentrations of selected heavy metals (Cd, Mn, Ni, Zn, Cu, Pb) are within acceptable standards and what factors may affect their dynamics. In addition, an attempt was made to identify potential sources of pollution, both natural and anthropogenic, and to assess their impact on the quality of the aquatic ecosystem. The analysis of the literature data indicates that no research has been conducted in this area. No publications were found on the water status of this river.
2. Materials and Methods
2.1. Research Area
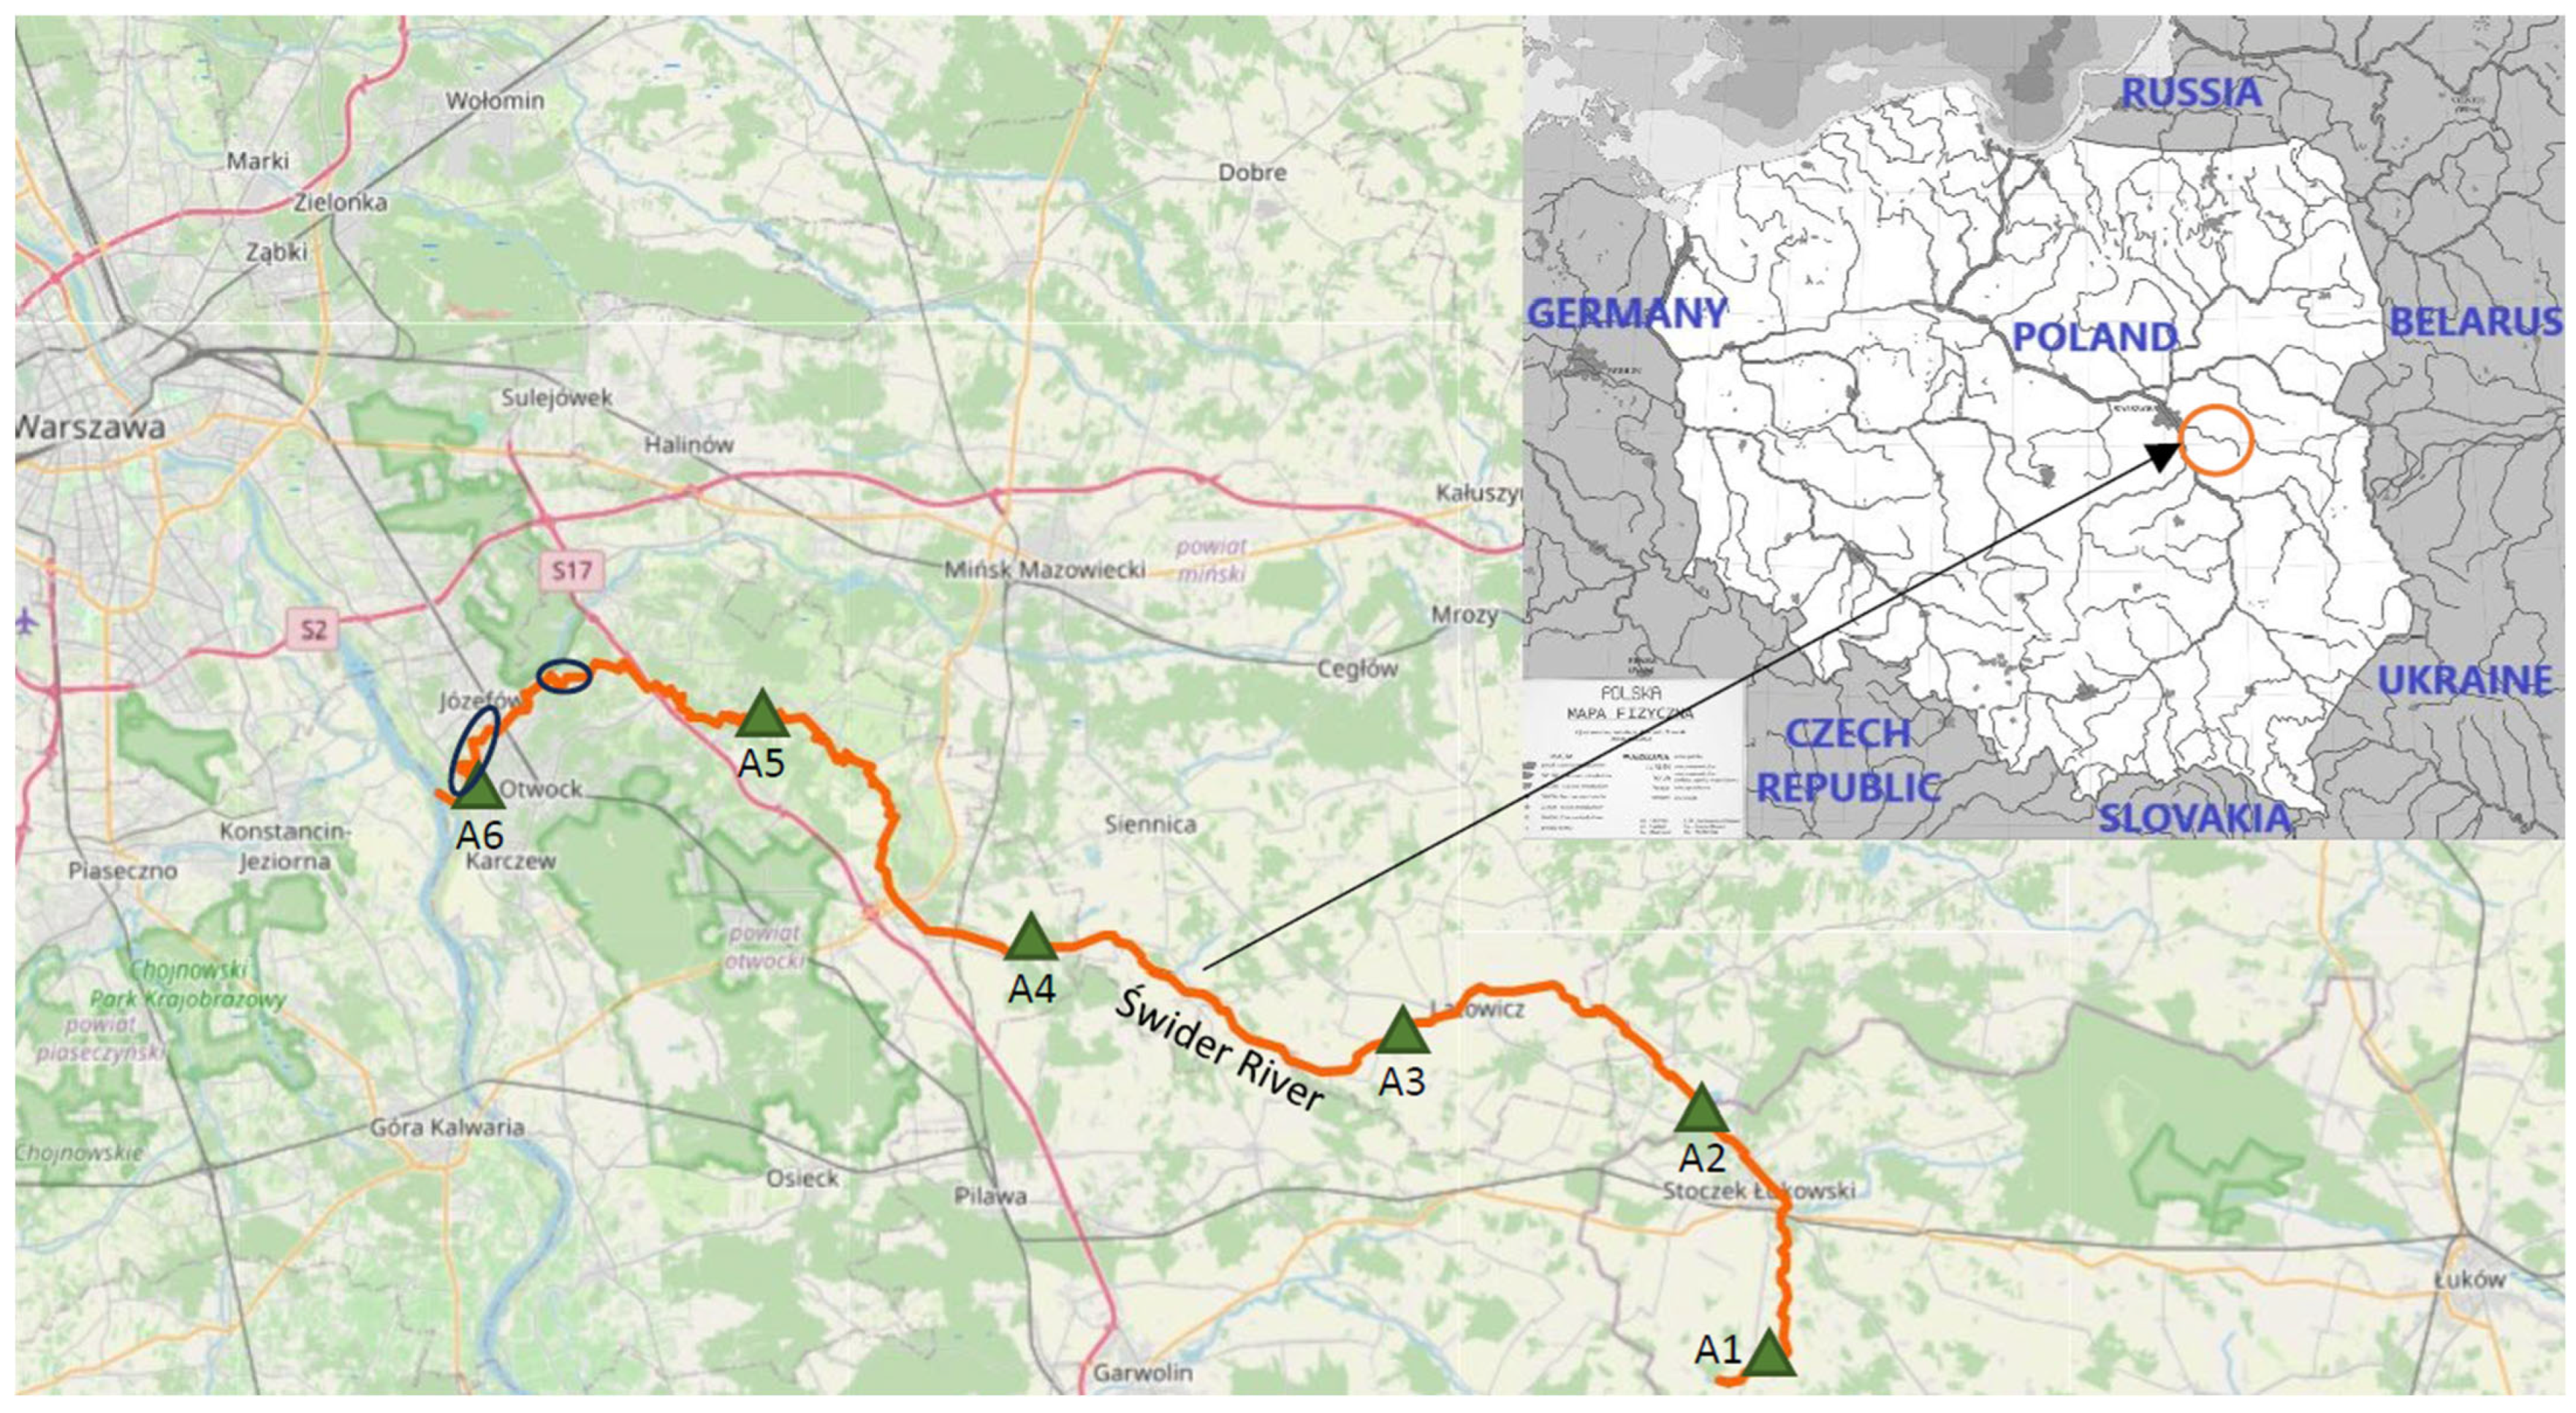
A total of 72 samples of surface water and bottom sediments were collected for the analysis from the Świder River. The Świder is a 89 km long river and a right-bank tributary of the Vistula River. It is the longest river in Poland with a direct outlet to the Baltic Sea (Figure 1). The sources of the Swider River are located in the vicinity of the town of Stoczek Łukowski, and it flows into the Vistula near the municipal borders of the towns of Józefów and Otwock. The area of its entire basin is 1300 km2. The course of the river is very winding. The Świder is a river whose source is situated 178 m above sea level, while its mouth is 85 m above sea level. The amount of water in the Świder fluctuates seasonally. There are periods when the water level is considered to be critically low. At the same time, when the water level is high, the Vistula River retreats. The course of the Świder River slows down and the water level rises. When this happens, pollution runoff from the Vistula River is likely.
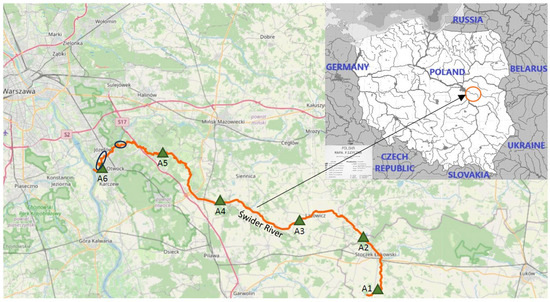
Figure 1.
Location of bottom sediment and surface water sampling A1–A6. The most popular swimming spots are marked with circles.
The Świder River is a typical lowland river. The area along the river features a nature reserve, agricultural land and numerous small towns. The Świder River is also intersected by expressway S17. A section of the Świder River lies within the Świder Aquatic Nature Reserve. The total area of the reserve is 238 ha. The reserve covers 41 km of the Świder River and 5 km of the Mieni River (a right tributary of the Świder), as well as a 20 m strip of land on both sides of the river. The reserve is distinguished by its wealth of aquatic and littoral fauna. Some 25 species of fish, 120 species of birds and many mammals occur there. The identified plants include yellow (Nuphar lutea) and white water lilies (Nymphaea alba L.), snowdrops (Galanthus nivilis L.), kokorich (Corydalis sp.) and primrose (Primula veris L.). The upper Świder River valley is protected as a Natura 2000 site. In addition, the Świder Nature Reserve lies within the buffer zone of the Mazovian Landscape Park. Another nature reserve, called Wyspy Świderskie, is located at the mouth of the Świder River near Karczew, Otwock and Józefów. It was established to protect natural or near-natural aquatic ecosystems in the middle Vistula riverbed. The reserve belongs to the ECONET-POLSKA national ecological network, a system of core areas that are best preserved in terms of nature.
The Świder River is one of the most popular recreation spots for residents of the city of Otwock, especially during the holiday season. However, there is no officially approved bathing site in its area. On a one-off basis, on 12 July 2024, at the request of the Mayor of Otwock, GBA Polska Sp. z o.o. (an accredited laboratory) collected water samples near the former narrow-gauge railway bridge to analyse the water quality in the Świder River for the presence of Escherichia coli, enterococci, as well as cyanobacterial and macroalgal blooms. The results indicated good water quality on the day of testing. No other contaminants were analysed.
In addition, a sewage treatment plant was built in the town of Józefów. The location of its discharge pipe and the odour nuisance exclude this site from recreational use. The construction of the treatment plant also involved cutting down trees, which was an irreversible interference with the landscape along the Świder River. In the event of a failure, it is only possible to keep wastewater in the system for 36 h. When the failure is not remedied, untreated sewage will be discharged into the Świder River. In addition, the condition of the Świder River is affected by pollution from nearby agricultural fields, as well as the ongoing urbanisation of neighbouring areas. Despite this, however, the Świder River is an attractive tourist area. Canoeing, hiking and cycling trails, agritourism, as well as bathing and recreation places are becoming increasingly popular. The sustainable development of tourism contributes to raising the ecological awareness of local communities and generates funds for the protection of the Świder River environment. Due to its picturesque meanders and sandy beaches, the Świder River Valley area has high potential for tourism.
2.2. Sampling and Preparation of Samples
Samples were taken along the Świder River at 15 km intervals (six sampling locations A1–A6 along the entire river course) in May and August 2024 (Table 1).

Table 1.
Basic data on water and bottom sediment sampling sites, according to the Institute of Meteorology and Water Management—National Research Institute of Poland.
Due to the sedimentation processes and the highest concentrations of heavy metals, water and sediment samples were collected on both sides of the river from the littoral zone. Bottom sediment specimens were collected from below the water’s surface at a depth of around 15–20 cm. To ensure representativeness, they were combined into a single sample weighing approximately 0.3 kg. A total of 72 specimens were collected on both sides of the river (36 surface water and 36 bottom sediment) in each of the two months (May and August).
2.3. Laboratory Procedure
Test materials of bottom sediments were initially dried at 40 °C before filtration, using a nylon sieve with a mesh size of 0.2 mm. A 0.5 g sample was weighed and mineralised with a mixture of 30% H2O2 and concentrated HNO3 (8:2). After processing, all samples were filtered and placed into 50 mL volumetric flasks. Heavy metal analyses in all environmental samples were conducted simultaneously in three separate batches. All analyses were performed using flame atomic absorption spectrometry with a Varian AA-20 spectrometer (Varian, Sydney, Australia). The accuracy of the test findings was verified against the certified reference material NCSDC 73376 (POCh, Gliwice, Poland, Table 2).
Table 2.
Characterization of NCSDC 73376 reference material obtained by AAS technique (p = 95%, n = 4, mg/kg).
As a result of measurements performed using the AAS technique with reference substances, the measurement error was calculated and found not to exceed 5% of the certified value. According to ISO 10523:2008, the acidity of the tested surface water samples was determined [47]. On the other hand, the acidity of bottom sediment samples in aqueous suspension was determined in accordance with the accepted standard for the determination of water and wastewater using a pH electrode (Merck, Poland) [48]. The characteristics of the selected parameters for the quantitative analysis of heavy metals in bottom sediments and surface waters by the AAS technique are presented in Table 3.
Table 3.
Selected parameters of AAS analysis: Pb, Cd, Cu, Zn, Ni, Mn (POCh, Gliwice, Poland).
Qualitative and quantitative analysis of selected metals in the sampled bottom sediments was performed for fractions with particle sizes smaller < 0.2 mm. Classification of the analysed sediments studied was based on geochemical criteria described in the literature (Table 4).
Table 4.
Geochemical criteria for the classification of water sediments in Poland (grain fraction < 0.2 mm) [49].
Heavy metals are most analysed as environmental contaminants. Their content in soil is usually analysed in relation to the geochemical background, whereas, if they occur in other environmental compartments, it is then interpreted interpreted on the basis of relevant standards and regulations. The results of the surface water analysis obtained in this study were benchmarked against the 2019 ordinance in force in Poland (Table 5) as well as the results of studies by other authors.
Table 5.
Permissible content of selected heavy metals in surface water [mg/L], according to the 2019 order [50].
Using the equation Cfi = Ci/C0, where Ci is the metal content of the sediment and C0 is the geochemical background value, the pollution index for a given metal was calculated.
2.4. Statistical Analysis
Statistica program (ver. 13.3, StatSoft, Poland) was used to perform the necessary statistical analyses. The following descriptive statistics were included in the calculations: minimum, median, maximum, arithmetic mean, standard deviation, T confidence. Statistical significance was defined at p < 0.05. Conducting statistical analyses made it possible to identify the point most exposed to heavy metal pollution and to compare the content of analytes in water and bottom sediments in May and August.
3. Results and Discussion
The results obtained for the content of the studied heavy metals in bottom sediments and surface waters of the Świder River are summarized in Table 6, Table 7, Table 8 and Table 9. Unfortunately, no specific studies on the content of heavy metals in the Świder River were found in available sources for direct comparison with the spatiotemporal results of other authors. However, general studies indicate that heavy metals, mainly lead, cadmium, mercury, zinc, or chromium, can enter the river’s waters from various anthropogenic sources, such as industrial waste, service activities (workshops, car washes, craft workshops) and surface runoff from roads and urbanised areas. Regular monitoring of water quality status in other rivers indicates low to moderate levels of heavy metals [51,52,53]. Although their concentrations are below acceptable standards, incidental exceedances may occur, especially near industrial areas or larger towns.
Table 6.
Concentrations of tested heavy metals in surface waters of the Swider River (n = 36).
Table 7.
The content of individual metals in the tested waters (mg/L) in May and August.
Table 8.
The content of individual metals in the bottom sediments (mg/kg) in May and August.
Table 9.
Concentrations of tested heavy metals in bottom sediments in Świder River (n = 36).
Natural pollutants in the Świder River primarily include materials from the processes of erosion of the banks and bed of the river, especially during high water levels after precipitation. These pollutants include mineral suspended solids (sand, silt), plant residues (leaves, branches), humic substances originating from the decomposition of organic matter and naturally occurring bacteria and microorganisms originating from wild animals. However, the most serious threat to the water quality of the Świder River is pollution of anthropogenic origin. Despite meeting wastewater treatment standards, municipal wastewater treatment plants may introduce excess nutrients into the river, such as nitrates and phosphates, contributing to eutrophication. The locations of the treatment plants in the towns of Otwock, Józefów and Wiązowna are of key importance for the quality of water in downstream section of the Świder River. As a result of intensive agriculture, mineral fertilisers (mainly nitrogenous and phosphorus) are discharged into the waters of the Świder River. This results in algae growth, reduced water transparency and reduced dissolved oxygen content in the water, which has a negative impact on aquatic organisms. In addition, heavy metals such as mercury, cadmium, lead, zinc or chromium are mainly introduced by surface runoff from roads, car parks, industrial and service areas.
3.1. Heavy Metal Concentrations in Surface Waters
Of all environmental elements, water, as one of the main components of the environment, is most exposed to human impact [54,55]. Hence, the urgent need to protect and monitor water resources Heavy metals are among the most hazardous contaminants in aquatic ecosystems, which are distinguished from other toxic pollutants by the fact that they are not biodegradable, but only biotransformed and show high mobility in the trophic chain. Concentrations of metals in water correlate exceptionally well with pollutants of other elements of the environment located in the same geographical space. Table 6 shows the results of studies on the content of heavy metals in the surface waters of the Świder River.
The pH of the surface waters tested ranged from 6.70 to 7.03, and was very close to neutral. The analysis of heavy metal content in the surface waters of the Świder River conducted in May and August showed significant differences in the concentrations of individual elements. The analysed metals included cadmium, manganese, nickel, zinc, copper, and lead (Table 7). In May, cadmium concentrations ranged from 0.01 to 0.07 mg/L, with a mean value of 0.04 mg/L. In August, on the other hand, its values were slightly lower (0.01–0.06 mg/L), with an average of 0.03 mg/L. The comparison of the cadmium content determined in the water of the Świder River (Table 6) with the permissible content of this metal indicated in the Ministerial Order (Table 5) [45] shows that the studied waters belong to unclassified waters. Possible reasons for the decrease in concentration could be due to the dilution of water in the summer, especially after heavy rainfall.
The second element analysed was manganese. Manganese usually occurs together with iron, and its presence in water is mostly of natural origin. It showed significant variability between May and August. In May, its levels ranged from 0.01 mg/L to 1.2 mg/L (mean 0.49 mg/L), while a slight decrease was recorded in August (0.01–1.1 mg/L, mean 0.40 mg/L). The observed trend may suggest natural processes of manganese sorption on mineral suspensions or temperature effects on its solubility. The presence of manganese in water often leads to the growth of manganese and iron-oxidising bacteria, which alter the taste and odour of the water and cause clogging of water supply equipment. Iron removal and chlorination methods are used to reduce the content of manganese.
Quantitative analyses of nickel were also conducted for the surveyed waters. The nickel content in May fluctuated in the range of 0.02–0.11 mg/L (average 0.06 mg/L), while in August its maximum content increased slightly (0.01–0.12 mg/L, the average remained at 0.06 mg/L). The reason for the increase in the content of this element may be due to the erosion of rocks containing nickel or pollution from industry and transport. Benchmarking with the data in the Regulation of the Minister indicates low nickel content in the studied water samples from the Świder River and therefore the river waters should be classified as quality category I (A1).
The list of the analysed heavy metals included zinc. This element showed high seasonal variability. In May, its concentration ranged from 0.2 mg/L to 8.7 mg/L (mean 3.2 mg/L), while in August there was a significant increase in maximum values (0.3–9.5 mg/L, mean 4.68 mg/L). Possible causes of the increase in zinc in August include the leaching of contaminants from soils and bottom sediments during periods of heavy rainfall, and the increased use of fertilisers and plant protection products containing zinc. When comparing the obtained concentrations of zinc with the values given in the Regulation of the Minister, it appears that the studied waters can still be classified in quality category A1.
The research conducted also included analyses of copper content in surface waters. Copper showed relatively stable concentrations in both months. In May, its content was 0.01–0.06 mg/L (average 0.03 mg/L), similarly to August: 0.01–0.05 mg/L (average 0.03 mg/L). The values obtained for copper content are lower than the permissible limits stipulated in the Regulation of the Minister for water quality category I. The lack of significant seasonal differences suggests that copper originates mainly from constant sources, such as natural geochemical processes or ongoing anthropogenic emissions. The effects of anthropogenic activities were also observed for lead in the analysed water samples. Lead concentrations in May were in the range of 0.01–0.04 mg/L (mean 0.03 mg/L), while slightly elevated maximum content was recorded in August (0.01–0.05 mg/L, mean 0.03 mg/L). However, the values obtained were below the permissible values contained in the Regulation of the Minister (Table 5). Possible sources of lead may include pollution from road transport, as well as residuals from past industrial emissions and the use of leaded fuels.
The results indicate seasonal variations in heavy metal concentrations in the Świder River (Table 7 and Table 8). The increase in zinc concentrations and slight changes in nickel and lead in August may result from meteorological and hydrological factors, such as heavy rainfall and soil erosion. Relatively stable concentrations of copper suggest that its presence in water comes mainly from natural sources or sustained emissions.
3.2. Heavy Metal Concentrations in Bottom Sediments
Heavy metals are introduced into surface waters in dissolved and undissolved forms with suspended particles. The final link, on the other hand, is bottom sediments, where they accumulate and provide a protective barrier for living organisms against excessive exposure to these pollutants. Concentrations of heavy metals in surface waters do not fully reflect the actual degree of pollution of the aquatic environment, as they can occur in various forms, including those other than the dissolved form [56]. This occurrence depends on the physicochemical conditions of sediments and water. The primary form of the heavy metal migrating into water is also important, as some metals are retained on particulate matter in suspension. On the other hand, sparingly soluble forms of metals adsorb on the surface of solid particles and, as a consequence of sedimentation, sink to the bottom, retaining in bottom sediments [57].
It should be noted, however, that the available resources lack information on the content of heavy metals in both the bottom sediments and surface water of the Świder River. Heavy metals such as cadmium, lead, zinc, copper, chromium and nickel are important indicators of pollution of the aquatic environment. Studies conducted in other regions of Poland, for example in urban water bodies of the Wałbrzych area, have shown varying concentrations of these metals in different types of environmental samples [58].
The water classification was applied to determine the level of heavy metal contamination in the examined bottom sediments. The findings of the analysis of heavy metals contained in the sediments of the Świder River are shown in Table 7, Table 8 and Table 9.
Table 9 shows the findings of the research of heavy metals in the bottom sediments of the Świder River, focusing on six elements: cadmium, manganese, nickel, zinc, lead, and copper, in the same way as for surface waters. These data enables the evaluation of the contamination level in bottom sediments and the potential sources of these metals in the river’s ecosystem. To better interpret the results, comparisons were made with geochemical values for river sediments (Table 4), permissible values for river sediments in Poland (Table 5), as well as the results of other national and international studies (Table 10).
Table 10.
Comparison of the content of heavy metals (mg/kg) in the bottom sediments of the Swider River with the results of other authors.
The analysis of the seasonal variability of heavy metals in the bottom sediments of the Świder River shows that cadmium concentrations ranged from 0.05 mg/kg to 0.3 mg/kg in May, and from 0.04 mg/kg to 0.4 mg/kg in August. The average values were low (0.2 mg/kg in both months), and, according to Polish standards, were within sediment quality class I. Cadmium is often associated with industrial activities and urban runoff, but its low values indicate that these sources have little impact on the bottom sediments of the Świder River. In contrast, Mn concentrations in May ranged from 0.03 mg/kg to 2.1 mg/kg (mean 1.17 mg/kg), but increased to 1.69 mg/kg in August. Manganese, derived from erosion of natural rocks and urban pollution, reached levels indicating sediment quality class II at some locations.
Nickel concentrations of 1.3–5.9 mg/kg in May and 1.3–5.4 mg/kg in August suggest relatively stable levels. The average values (2.8 mg/kg in May, 3.2 mg/kg in August) were below the permissible limits, but suggest the possibility of its accumulation in the lower reaches of the river. The greatest seasonal variability was observed for zinc, with values ranging from 1.4 mg/kg to 8.5 mg/kg in May and 1.4 mg/kg to 7.7 mg/kg in August. Mean values were 5.1 mg/kg in May and 4.8 mg/kg in August, suggesting that the bottom sediments of the Świder River may have moderate zinc contamination, especially in the lower reaches of the river, where anthropogenic impacts are stronger.
Significantly lower levels, compared to zinc, were found for lead and copper. Lead content ranged from 0.03 mg/kg to 0.2 mg/kg in May and from 0.04 mg/kg to 0.4 mg/kg in August. The average Pb values (0.1 mg/kg in May, 0.2 mg/kg in August) suggest that the bottom sediments are not significantly loaded with this metal, even though it might have originated from past industrial emissions and transport. Copper concentrations, on the other hand, with a mean value of 0.04 mg/kg in May and 0.03 mg/kg in August, were within the lowest range of values for river sediments.
The obtained results were also compared with those of other authors, both in Poland and worldwide (Table 10). The observations made indicate that the average Pb content in the bottom sediments of the Świder River (0.1–0.2 mg/kg) was much lower than in other rivers such as the Vistula (28–122 mg/kg), the Oder (1–2 mg/kg) or the Elbe in Germany (40–172 mg/kg). These rivers are characterised by much greater industrialisation, indicating that the Świder River is not severely loaded with lead. In contrast, the zinc content in the bottom sediments of the Świder River (1.4–8.5 mg/kg) was lower than that of the Vistula (180–860 mg/kg), the Tisza River in Hungary (130–570 mg/kg) and the Mojiguaçu River in Brazil (17–92 mg/kg). These differences may be due to the lesser influence of industry and the lack of large urban centres in the Świder River basin. On the other hand, cadmium content in the Świder River (0.04–0.4 mg/kg) was comparable to the results from the Liwiec (0.2–0.7 mg/kg), but much lower than in the Vistula (1–8 mg/kg) and the Elbe (3–6 mg/kg). This means that the Świder River is not heavily contaminated with this toxic metal.
The studied bottom sediments of the Świder River contained relatively small amounts of Cu (0.01–0.06 mg/kg), which were significantly lower than in the Vistula, the Tisza and the Morava in the Czech Republic, where values exceeded 20 mg/kg. Similarly, the nickel content in the Świder River (1.3–5.9 mg/kg) was lower compared to the Tisza River (64–88 mg/kg). These values suggest that nickel in the Świder River is mainly of natural origin.
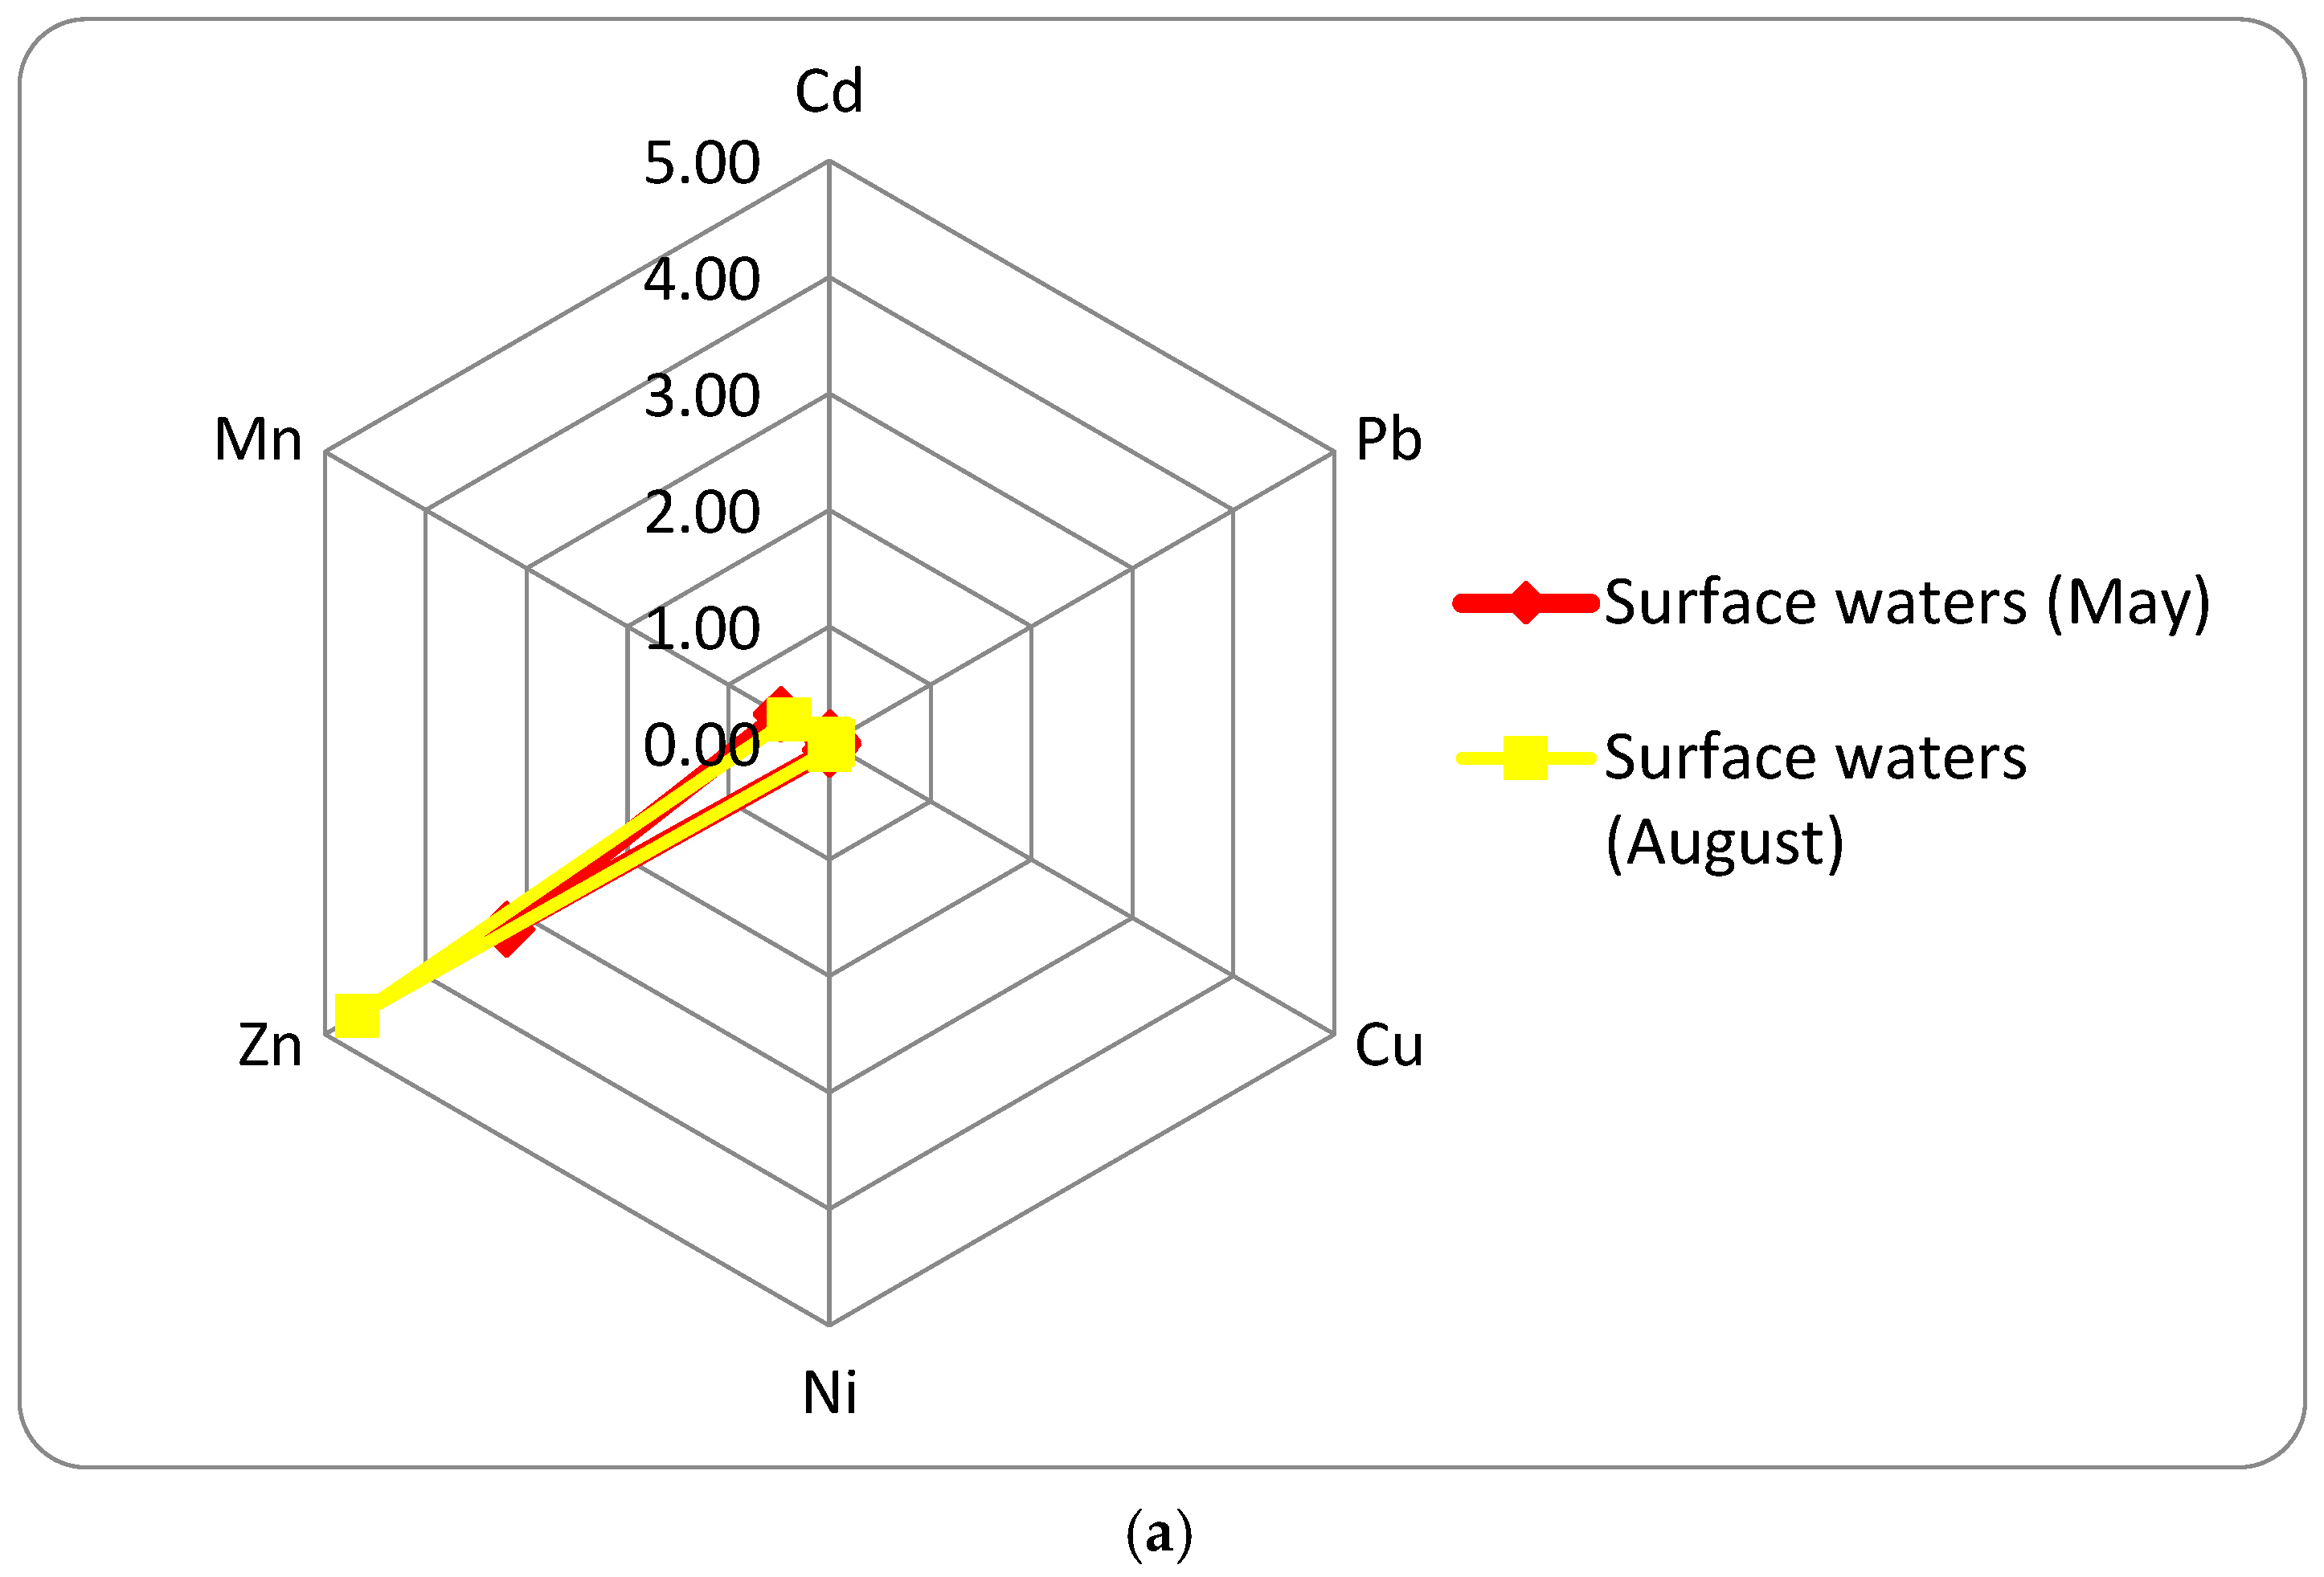
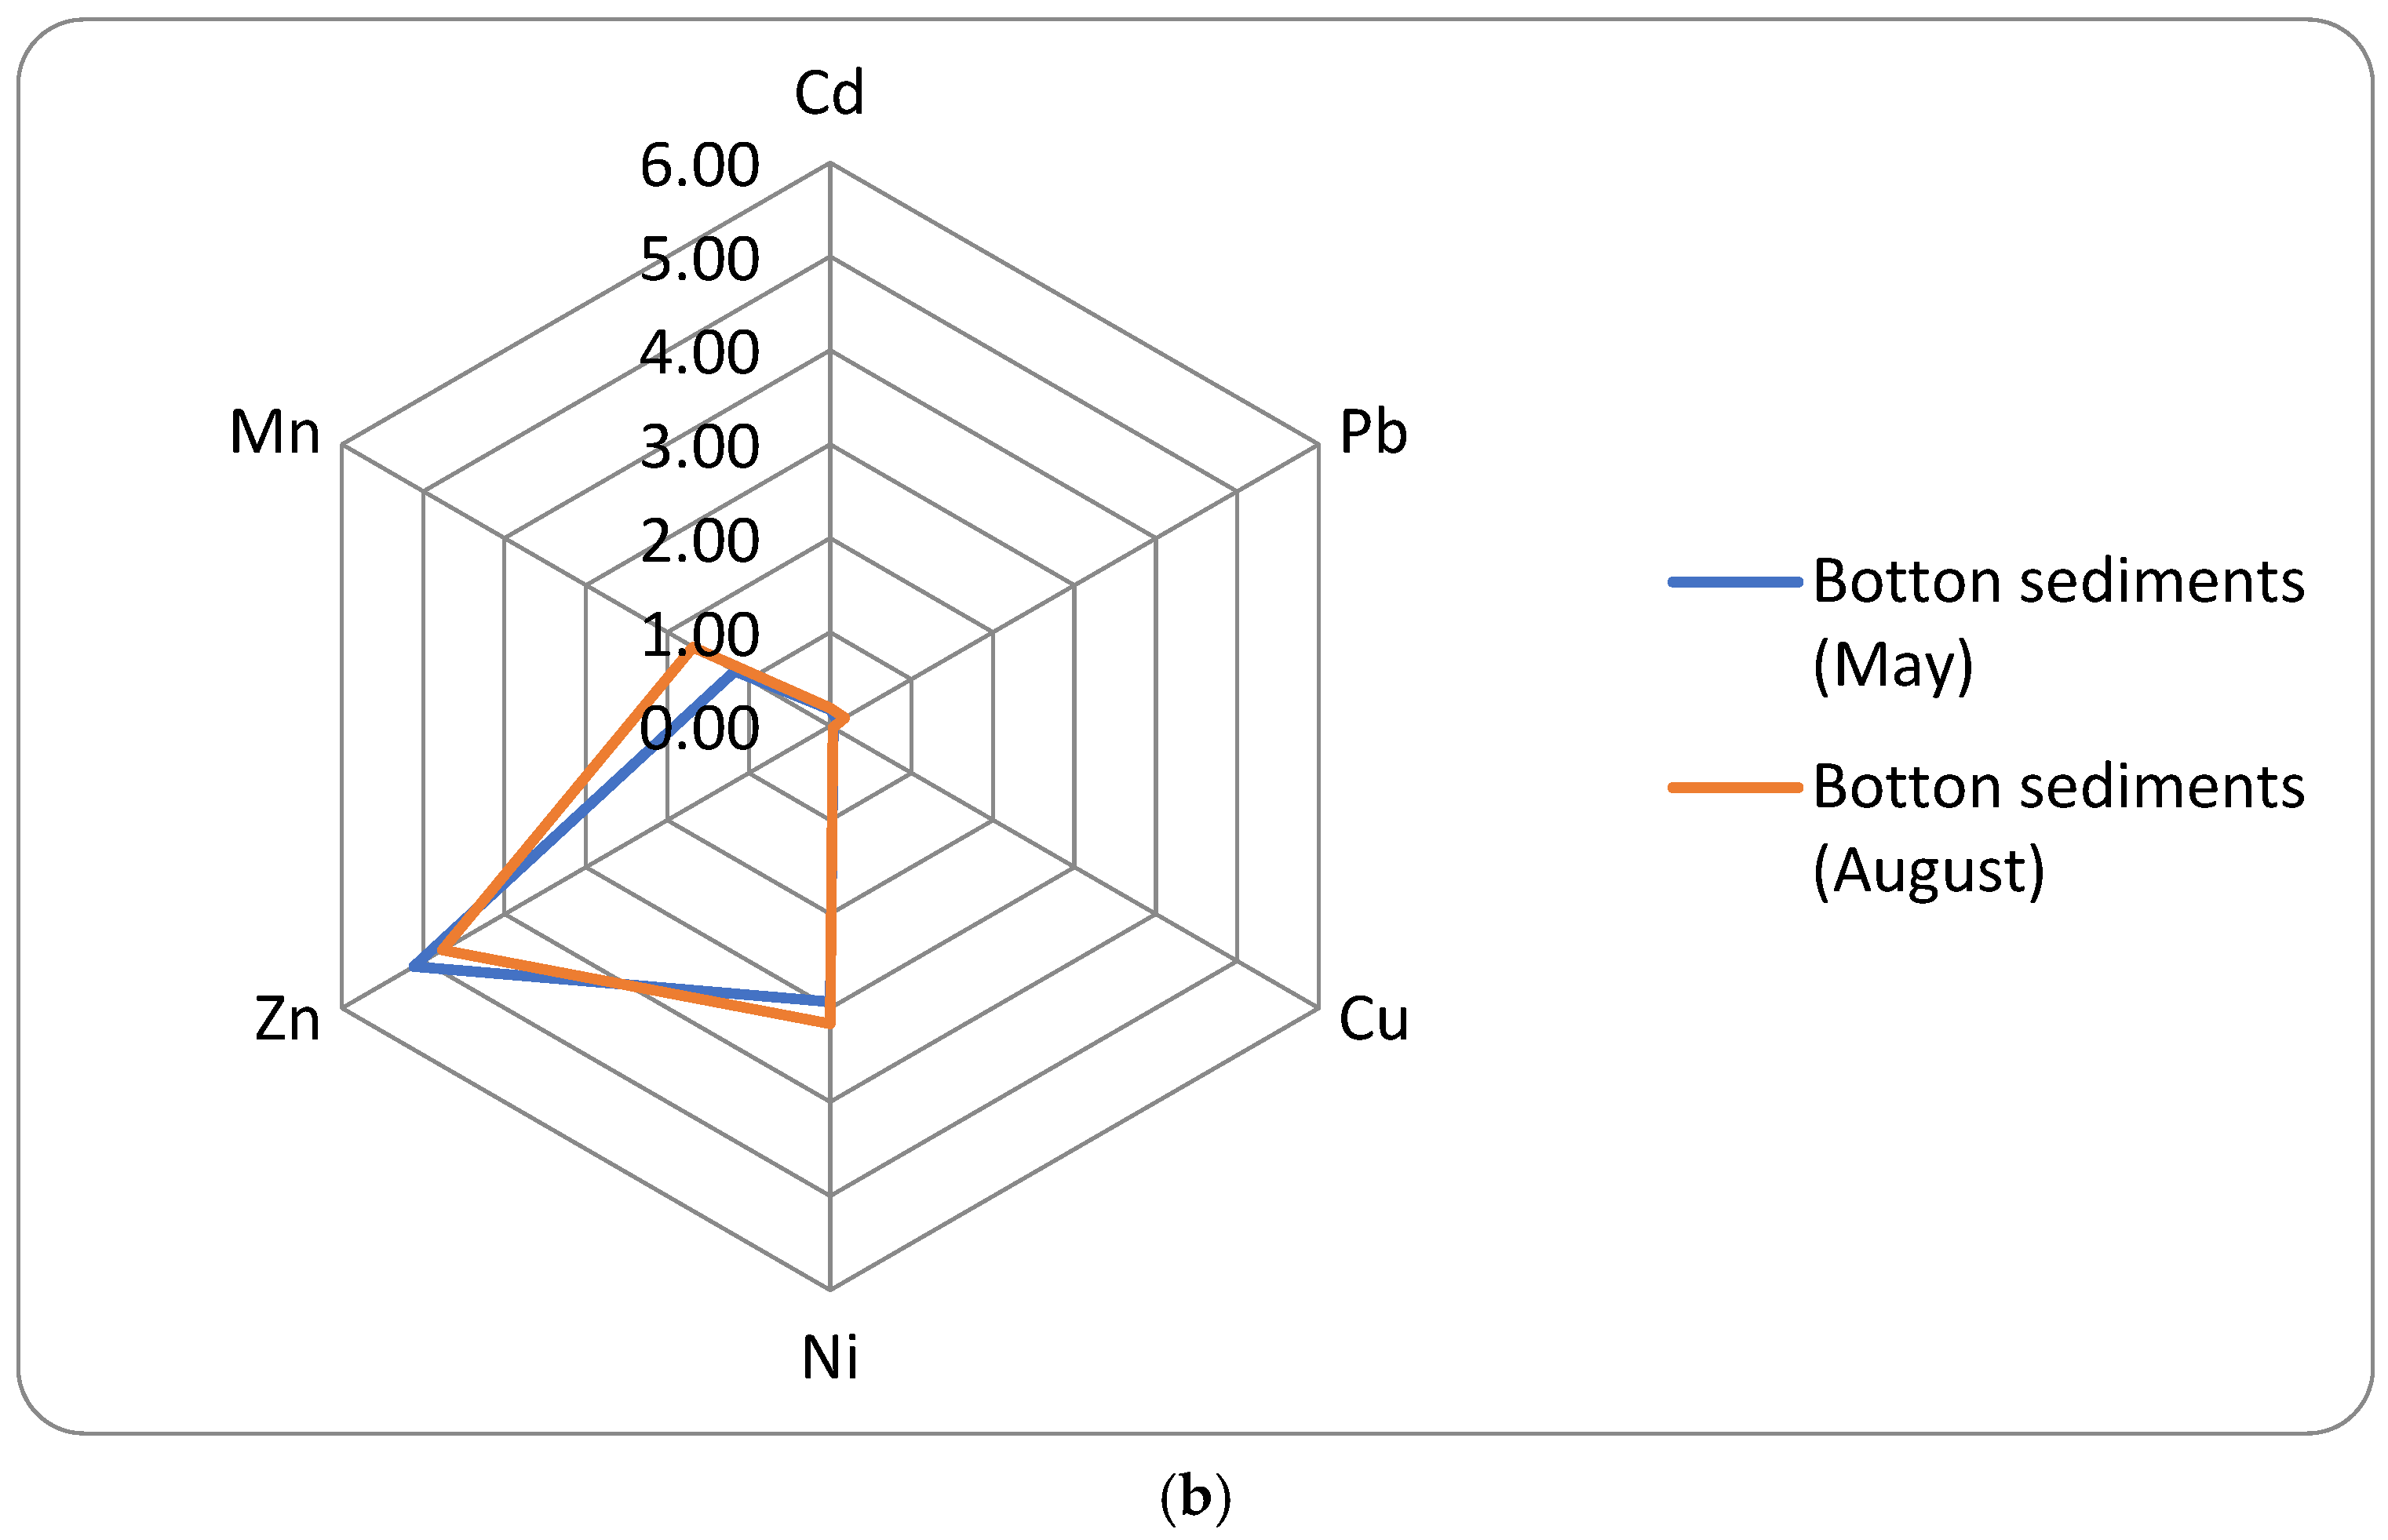
When comparing the amounts of heavy metals in the tested environmental matrices (Figure 2), it reveals that the sediment samples exhibited higher values. Regardless of the type of sample, zinc was present in the largest amounts, while cadmium was present in the smallest amounts. For both bottom sediment and surface water samples, slightly higher content of lead was found relative to cadmium.
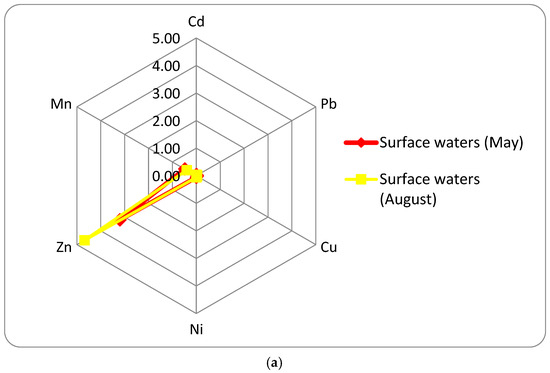

Figure 2.
Comparison of mean contents of analysed heavy metals in: (a) surface waters [mg/L] and (b) bottom sediments [mg/kg d.m.] of the Świder River.
The comparison of the geochemical background values in Table 4 with the obtained results shows that the concentrations of all heavy metals, except for manganese and zinc, were low and the analysed sediments fall into quality class I. Only in terms of zinc and manganese were the analysed sediments classified into quality class II. The index and degree of contamination were then calculated for the studied sediments using the method proposed by Hakanson (Table 11).
Table 11.
Degrees and indicators of sediment contamination [68].
The results obtained (Table 9) define the presence of various contents of the analysed heavy metals along the Swider River depending on the date of sampling. The highest content was determined for manganese, the average concentration of which was 1.2 mg/kg in May and increased to 1.7 mg/kg in August. Other elements, such as zinc and nickel, also showed seasonal variation, with zinc concentrations of 5.1 mg/kg in May and 4.8 mg/kg in August, and nickel concentrations of 2.8 mg/kg and 3.2 mg/kg, respectively. The comparison of the results from Table 9 to Hakanson’s classification (Table 11) shows that the level of heavy metal contamination of bottom sediments in the Świder River mostly corresponds to the ‘low pollution’ category (Cfi < 1). Values of Cd, Pb and Cu did not exceed the limits of moderate pollution, suggesting a limited anthropogenic impact on these elements. However, in the case of manganese and zinc, in some places their concentrations indicated moderate pollution (1 < Cfi < 3), especially in the downstream sections of the river.
According to Hakanson’s classification, the total cadmium contamination index (Cfi) indicates that the bottom sediments in the Świder River fall into the ‘slightly contaminated’ category. The degree of Cd contamination for individual metals indicates that some areas are more prone to metal accumulation, especially those with more intensive agricultural and industrial operations. These data indicate the need for further monitoring, especially in the context of hydrodynamic changes and the possibility of the secondary release of heavy metals into surface waters under conditions of changing pH and redox potential.
The degree of Cd contamination was calculated as the sum of the pollution indices for individual metals (Table 12).
Table 12.
Degree of contamination (Cd) of the studied sediments of the Świder River and calculated contamination rates (Cf).
The information in Table 12 show a low level of contamination of the studied sediments of the Świder River. All values of the pollution indices were below 1. The level of contamination of bottom sediments with cadmium in the Świder River was 0.784 in May and 0.169 in August, clearly indicating a low level of pollution, with values much lower than in rivers heavily polluted by industry (e.g., the Vistula, the Elbe). The index of contamination with individual metals (Cf) ranged from 0.004 for Cu to 0.40 for Cd, indicating that none of the analysed metals exceeded the limits of moderate pollution (Cf < 1).
To protect the water quality of the Świder River, local authorities, in particular, are taking extensive measures. Regular inspections and upgrades of local wastewater treatment plants and the introduction of new treatment technologies are aimed at reducing biogenic emissions. Educational activities were conducted by local authorities and environmental organizations on the rational use of inorganic fertilisers among farmers. In addition, social campaigns are also carried out, such as the annual cleaning of the Świder River banks. Protected areas have also been established to limit investments that have a negative impact on the environment of the Świder River Valley.
The existence of heavy metals in the bottom sediments and surface waters of the Świder River, although generally below permissible standards, poses potential risks for tourism development. Elevated concentrations—especially of zinc and manganese—were detected in the downstream sections of the river, which coincide with areas of increased tourism and urbanization. These contaminants may degrade water quality and ecological conditions, affecting the appeal of the river for recreational activities such as swimming, kayaking, and fishing. Moreover, infrastructure like sewage treatment plants, despite their benefits, carry risks of accidental discharge, which could further harm water quality and deter tourists. While current pollution levels are low, continued monitoring and environmental protection measures are necessary to support sustainable tourism and maintain the river’s attractiveness.
4. Conclusions
Surface waters are an important element in maintaining the balance in the natural environment. In recent decades, as a result of increasing environmental pollution, elevated concentrations of heavy metals have been observed in surface water bodies, including those toxic to aquatic biocenosis such as Cd and Pb. The Świder River is becoming increasingly exposed to both natural and anthropogenic sources of pollution that affect the quality of its waters. Despite the occurrence of periodic problems related to sewage discharge or fertiliser runoff, the implemented protective measures have yielded positive results. Further sustainable tourism development can support the protection of this naturally valuable river. The heavy metals analysed in environmental samples of the Świder River showed seasonal variations, suggesting the effect of both natural geochemical processes and anthropogenic factors. The content of heavy metals compared with Hakanson’s classification indicated that bottom sediments were mostly classified as ‘slightly polluted’, although in some places manganese and zinc reached levels indicating moderate pollution. It is advisable to continue monitoring and assess possible changes in hydrodynamic conditions that could affect the mobility of heavy metals in the river’s ecosystem. The findings will undoubtedly be valuable and meaningful to the residents of the areas surrounding the Świder River, local authorities and scientists studying water systems.
Author Contributions
Conceptualization, M.K.; methodology, J.J. and M.K.; validation, M.K.; formal analysis, J.J.; investigation, J.J.; resources, M.K.; writing—original draft preparation, M.K. and J.J.; writing—review and editing, M.K. and J.J.; supervision, M.K.; funding acquisition, M.K. All authors have read and agreed to the published version of the manuscript.
Funding
Ministry of Science and Higher Education: number—142/B/23.
Data Availability Statement
Data are contained within the article.
Conflicts of Interest
The authors declare no conflicts of interest.
References
- Qi, Y.; He, K. Science and Technology for Water Purification: Achievements and Strategies. Water 2025, 17, 91. [Google Scholar] [CrossRef]
- Campos, L.C. A Review of the Most Concerning Chemical Contaminants in Drinking Water for Human Health. Sustainability 2024, 16, 7107. [Google Scholar] [CrossRef]
- Singh, P.K.; Kumar, U.; Kumar, I.; Dwivedi, A.; Singh, P.; Mishra, S.; Seth, C.S.; Sharma, R.K. Critical review on toxic contaminants in surface water ecosystem: Sources, monitoring, and its impact on human health. Environ. Sci. Pollut. Res. 2024, 31, 56428–56462. [Google Scholar] [CrossRef] [PubMed]
- Krasnopyorova, M.; Gorlachev, I.; Kharkin, P.; Severinenko, M.; Zheltov, D. Study of the Trace Element Composition of Drinking Water in Almaty City and Human Health Risk Assessment. Int. J. Environ. Res. Public Health 2025, 22, 560. [Google Scholar] [CrossRef]
- Zhang, W. Water Treatment Technology for Emerging Contaminants. Water 2025, 17, 644. [Google Scholar] [CrossRef]
- Hange, K.; Awofolu, O.R. Assessment of Anthropogenic Influence on the Level of Selected Heavy Metals (Cu, Zn, Cd and Pb) in Soil. J. Soil Sci. Environ. Manag. 2017, 8, 113–121. [Google Scholar] [CrossRef]
- Jabłońska, J.; Kluska, M. Dynamics of mercury content changes in snow in the heating season on the example of the city of Siedlce. Ochr. Srodowiska Zasobow Nat. 2019, 30, 19–24. [Google Scholar] [CrossRef]
- Namieśnik, J.; Rabajczyk, A. The speciation and physicochemical forms of metals in surface waters and sediments. Chem. Speciat. Bioavailab. 2010, 22, 1–24. [Google Scholar] [CrossRef]
- Briffaa, J.; Sinagrab, E.; Blundell, R. Heavy metal pollution in the environment and their toxicological effects on humans. Heliyon 2020, 6, e04691. [Google Scholar] [CrossRef]
- Chemielewski, J.; Gworek, B.; Florek-Łuszczki, M.; Nowak-Starz, G.; Wójtowicz, B.; Wójcik, T.; Żeber-Dzikowska, I.; Strzelecka, A.; Szpringer, M. Heavy metals in the environment and their impact on human health. Przem. Chem. 2020, 1, 52–59. [Google Scholar] [CrossRef]
- El-Sharkawy, M.; Alotaibi, M.O.; Li, J.; Du, D.; Mahmoud, E. Heavy Metal Pollution in Coastal Environments: Ecological Implications and Management Strategies: A Review. Sustainability 2025, 17, 701. [Google Scholar] [CrossRef]
- González-Díaz, R.L.; de Anda, J.; Shear, H.; Padilla-Tovar, L.E.; Lugo-Melchor, O.Y.; Olvera-Vargas, L.A. Assessment of Heavy Metals in Surface Waters of the Santiago–Guadalajara River Basin, Mexico. Hydrology 2025, 12, 37. [Google Scholar] [CrossRef]
- Meng, Z.; Bai, X.; Tang, X. Short−Term Assessment of Heavy Metals in Surface Water from Xiaohe River Irrigation Area, China: Levels, Sources and Distribution. Water 2022, 14, 1273. [Google Scholar] [CrossRef]
- Kluska, M. An application of aryl stationary phases for separation of select organogermanium compunds. J. Liq. Chromatogr. Relat. Technol. 2008, 31, 210–218. [Google Scholar] [CrossRef]
- Matei, E.; Râpă, M.; Mateș, I.M.; Popescu, A.-F.; Bădiceanu, A.; Balint, A.I.; Covaliu-Mierlă, C.I. Heavy Metals in Particulate Matter—Trends and Impacts on Environment. Molecules 2025, 30, 1455. [Google Scholar] [CrossRef]
- Moldovan, A.; Török, A.I.; Kovacs, E.; Cadar, O.; Mirea, I.C.; Micle, V. Metal Contents and Pollution Indices Assessment of Surface Water, Soil, and Sediment from the Arieș River Basin Mining Area, Romania. Sustainability 2022, 14, 8024. [Google Scholar] [CrossRef]
- Pietrzak, S.; Wójcik, J.; Baszuk, P.; Marciniak, W.; Wojtyś, M.; Dębniak, T.; Cybulski, C.; Gronwald, J.; Alchimowicz, J.; Masojć, B.; et al. Influence of the Levels of Arsenic, Cadmium, Mercury and Lead on Overall Survival in Lung Cancer. Biomolecules 2021, 11, 1160. [Google Scholar] [CrossRef]
- Pizent, A.; Anđelković, M.; Tariba Lovaković, B.; Živković Semren, T.; Buha Djordjevic, A.; Gamulin, M.; Bonderović, V.; Aćimović, M.; Bulat, Z. Environmental Exposure to Metals, Parameters of Oxidative Stress in Blood and Prostate Cancer: Results from Two Cohorts. Antioxidants 2022, 11, 2044. [Google Scholar] [CrossRef]
- Srnovršnik, T.; Virant-Klun, I.; Pinter, B. Heavy Metals and Essential Elements in Association with Oxidative Stress in Women with Polycystic Ovary Syndrome—A Systematic Review. Antioxidants 2023, 12, 1398. [Google Scholar] [CrossRef]
- Killian, B.; Yuan, T.-H.; Tsai, C.-H.; Chiu, T.H.T.; Chen, Y.-H.; Chan, C.-C. Emission-related Heavy Metal Associated with Oxidative Stress in Children: Effect of Antioxidant Intake. Int. J. Environ. Res. Public Health 2020, 17, 3920. [Google Scholar] [CrossRef]
- Munir, N.; Jahangeer, M.; Bouyahya, A.; El Omari, N.; Ghchime, R.; Balahbib, A.; Aboulaghras, S.; Mahmood, Z.; Akram, M.; Ali Shah, S.M.; et al. Heavy Metal Contamination of Natural Foods Is a Serious Health Issue: A Review. Sustainability 2022, 14, 161. [Google Scholar] [CrossRef]
- Abd Elnabi, M.K.; Elkaliny, N.E.; Elyazied, M.M.; Azab, S.H.; Elkhalifa, S.A.; Elmasry, S.; Mouhamed, M.S.; Shalamesh, E.M.; Alhorieny, N.A.; Abd Elaty, A.E.; et al. Toxicity of Heavy Metals and Recent Advances in Their Removal: A Review. Toxics 2023, 11, 580. [Google Scholar] [CrossRef] [PubMed]
- Gómez, G.; Previdelli, Á.N.; Fisberg, R.M.; Kovalskys, I.; Fisberg, M.; Herrera-Cuenca, M.; Sanabria, L.Y.C.; García, M.C.Y.; Rigotti, A.; Liria-Domínguez, M.R.; et al. Dietary Diversity and Micronutrients Adequacy in Women of Childbearing Age: Results from ELANS Study. Nutrients 2020, 12, 1994. [Google Scholar] [CrossRef]
- Cena, H.; Calder, P.C. Defining a Healthy Diet: Evidence for the Role of Contemporary Dietary Patterns in Health and Disease. Nutrients 2020, 12, 334. [Google Scholar] [CrossRef]
- Mahfouz, R.; Akiki, M.-T.; Ndayra, V.; El Khoury, R.; Chawi, M.; Hatem, M.; Hanna-Wakim, L.; Sacre, Y.; Hoteit, M. Energy, Macronutrients and Micronutrients Intake Among Pregnant Women in Lebanon: Findings from the Updated Lebanese National Food Consumption Survey (LEBANON-FCS). Nutrients 2024, 16, 4059. [Google Scholar] [CrossRef]
- Lotrecchiano, N.; Montano, L.; Bonapace, I.M.; Giancarlo, T.; Trucillo, P.; Sofia, D. Comparison Process of Blood Heavy Metals Absorption Linked to Measured Air Quality Data in Areas with High and Low Environmental Impact. Processes 2022, 10, 1409. [Google Scholar] [CrossRef]
- Witkowska, D.; Słowik, J.; Chilicka, K. Heavy Metals and Human Health: Possible Exposure Pathways and the Competition for Protein Binding Sites. Molecules 2021, 26, 6060. [Google Scholar] [CrossRef]
- Kluska, M.; Pypowski, K. Sepration of tribenzylhydrogermanium nitrile derivatives by means of HPLC with participation of Π-Π interactions. J. Liq. Chromatogr. Relat. Technol. 2007, 30, 2059–2067. [Google Scholar] [CrossRef]
- Jan, A.T.; Azam, M.; Siddiqui, K.; Ali, A.; Choi, I.; Haq, Q.M.R. Heavy Metals and Human Health: Mechanistic Insight into Toxicity and Counter Defense System of Antioxidants. Int. J. Mol. Sci. 2015, 16, 29592–29630. [Google Scholar] [CrossRef]
- Jaishankar, M.; Tseten, T.; Anbalagan, N.; Mathew, B.B.; Beeregowda, K.N. Toxicity, mechanism and health effects of some heavy metals. Interdiscip. Toxicol. 2014, 7, 60–72. [Google Scholar] [CrossRef]
- Pelić, M.; Mihaljev, Ž.; Živkov Baloš, M.; Popov, N.; Gavrilović, A.; Jug-Dujaković, J.; Ljubojević Pelić, D. Health Risks Associated with the Concentration of Heavy Metals in Sediment, Water, and Carp Reared in Treated Wastewater from a Slaughterhouse. Water 2024, 16, 94. [Google Scholar] [CrossRef]
- Tamele, I.J.; Vázquez Loureiro, P. Lead, Mercury and Cadmium in Fish and Shellfish from the Indian Ocean and Red Sea (African Countries): Public Health Challenges. J. Mar. Sci. Eng. 2020, 8, 344. [Google Scholar] [CrossRef]
- Marfo, A.; Obeng-Gyasi, E. The Effect of Physical Activity on Combined Cadmium, Lead, and Mercury Exposure. Med. Sci. 2024, 12, 71. [Google Scholar] [CrossRef] [PubMed]
- Milanković, V.; Tasić, T.; Leskovac, A.; Petrović, S.; Mitić, M.; Lazarević-Pašti, T.; Novković, M.; Potkonjak, N. Metals on the Menu—Analyzing the Presence, Importance, and Consequences. Foods 2024, 13, 1890. [Google Scholar] [CrossRef]
- Davidova, S.; Milushev, V.; Satchanska, G. The Mechanisms of Cadmium Toxicity in Living Organisms. Toxics 2024, 12, 875. [Google Scholar] [CrossRef]
- Smereczański, N.M.; Brzóska, M.M. Current Levels of Environmental Exposure to Cadmium in Industrialized Countries as a Risk Factor for Kidney Damage in the General Population: A Comprehensive Review of Available Data. Int. J. Mol. Sci. 2023, 24, 8413. [Google Scholar] [CrossRef]
- Jota Baptista, C.; Seixas, F.; Gonzalo-Orden, J.M.; Patinha, C.; Pato, P.; Ferreira da Silva, E.; Casero, M.; Brazio, E.; Brandão, R.; Costa, D.; et al. High Levels of Heavy Metal(loid)s Related to Biliary Hyperplasia in Hedgehogs (Erinaceus europaeus). Animals 2023, 13, 1359. [Google Scholar] [CrossRef]
- Kusak, R.; Nasiadek, M.; Stragierowicz, J.; Hanke, W.; Kilanowicz, A. Changes in Endogenous Essential Metal Homeostasis in the Liver and Kidneys during a Six-Month Follow-Up Period after Subchronic Cadmium Exposure. Int. J. Mol. Sci. 2024, 25, 3829. [Google Scholar] [CrossRef]
- Filipoiu, D.C.; Bungau, S.G.; Endres, L.; Negru, P.A.; Bungau, A.F.; Pasca, B.; Radu, A.-F.; Tarce, A.G.; Bogdan, M.A.; Behl, T.; et al. Characterization of the Toxicological Impact of Heavy Metals on Human Health in Conjunction with Modern Analytical Methods. Toxics 2022, 10, 716. [Google Scholar] [CrossRef]
- Tahity, T.; Islam, M.R.U.; Bhuiyan, N.Z.; Choudhury, T.R.; Yu, J.; Noman, M.A.; Hosen, M.M.; Quraishi, S.B.; Paray, B.A.; Arai, T.; et al. Heavy Metals Accumulation in Tissues of Wild and Farmed Barramundi from the Northern Bay of Bengal Coast, and Its Estimated Human Health Risks. Toxics 2022, 10, 410. [Google Scholar] [CrossRef]
- Ijomone, O.K.; Ukwubile, I.I.; Aneke, V.O.; Olajide, T.S.; Inyang, H.O.; Omotosho, O.I.; Oyerinde, T.O.; Anadu, V.E.; Gbayisomore, T.J.; Okeowo, O.M.; et al. Glial Perturbation in Metal Neurotoxicity: Implications for Brain Disorders. Neuroglia 2025, 6, 4. [Google Scholar] [CrossRef]
- Górska, A.; Markiewicz-Gospodarek, A.; Trubalski, M.; Żerebiec, M.; Poleszak, J.; Markiewicz, R. Assessment of the Impact of Trace Essential Metals on Cancer Development. Int. J. Mol. Sci. 2024, 25, 6842. [Google Scholar] [CrossRef] [PubMed]
- Koyama, H.; Kamogashira, T.; Yamasoba, T. Heavy Metal Exposure: Molecular Pathways, Clinical Implications, and Protective Strategies. Antioxidants 2024, 13, 76. [Google Scholar] [CrossRef] [PubMed]
- Zavrtnik, S.; Loborec, J.; Kapelj, S.; Grčić, I. Environmental Biomonitoring of Heavy and Toxic Metals Using Honeybees and Their Products—An Overview of Previous Research. Sustainability 2024, 16, 8526. [Google Scholar] [CrossRef]
- Hovhannisyan, V.; Vaseashta, A.; Avanesyan, L.; Sadoyan, R.; Gasparyan, A.; Shogheryan, S.; Harutyunova, L.; Mirumyan, L.; Gevorgyan, G. Ecological Characterization and Bio-Mitigation Potential of Heavy Metal Contamination in Metallurgically Affected Soil. Appl. Sci. 2022, 12, 6312. [Google Scholar] [CrossRef]
- Janaszek, A.; Kowalik, R. Analysis of Heavy Metal Contaminants and Mobility in Sewage sludge-soil Mixtures for Sustainable Agricultural Practices. Water 2023, 15, 3992. [Google Scholar] [CrossRef]
- ISO 10523:2008; Water Quality—Determination of pH, 2nd ed. Technical Committee ISO/TC 147/SC 2 Physical, Chemical and Biochemical Methods. ISO: Geneva, Switzerland. Available online: https://www.iso.org/standard/51994.html (accessed on 22 March 2025).
- Michalski, R. Test Procedure No. PB 2. Measurement of pH in Sediments, 5th ed.; Internal Laboratory Procedure of the Institute of Environmental Engineering, Polish Academy of Sciences: Zabrze, Poland, 2016. [Google Scholar]
- Siebelec, S.; Siebelec, G.; Smreczak, B. Pollution of bottom sediments of rivers and reservoirs. Stud. Rap. IUNG-PIB 2015, 46, 163–181. (In Polish) [Google Scholar]
- Regulation of the Regulation Minister of maritime economy and inland navigation of 29 August 2019 on the on the requirements to be met by surface water used for supplying the public with in water intended for human consumption. J. Laws 2019, 1747. (In Polish). Available online: https://isap.sejm.gov.pl/isap.nsf/DocDetails.xsp?id=WDU20190001747 (accessed on 22 March 2025).
- Jabłońska, J.; Kluska, M. Determination of mercury content in surface waters using an environmentally non-toxic terminating electrolyte. Bull. Environ. Contam. Toxicol. 2020, 105, 626–632. [Google Scholar] [CrossRef]
- Kluska, M.; Jabłońska, J. Variability and Heavy Metal Pollution Levels in Water and Bottom Sediments of the Liwiec and Muchawka Rivers (Poland). Water 2023, 15, 2833. [Google Scholar] [CrossRef]
- Kluska, M.; Jabłońska, J. Pollution Assessment and Spatial Distribution of Heavy Metals in Surface Waters and Bottom Sediments of the Krzna River (Poland). Water 2024, 16, 1008. [Google Scholar] [CrossRef]
- Han, G.; Liu, X. Environmental Effects of Natural Processes and Human Activities on the Water Environment in Watershed. Water 2024, 16, 2929. [Google Scholar] [CrossRef]
- Babuji, P.; Thirumalaisamy, S.; Duraisamy, K.; Periyasamy, G. Human Health Risks due to Exposure to Water Pollution: A Review. Water 2023, 15, 2532. [Google Scholar] [CrossRef]
- He, L.; Chen, G.; Wang, X.; Shen, J.; Zhang, H.; Lin, Y.; Shen, Y.; Lang, F.; Gong, C. Pollution Characteristics and Risk Assessment of Heavy Metals in the Sediments of the Inflow Rivers of Dianchi Lake, China. Toxics 2024, 12, 322. [Google Scholar] [CrossRef]
- Ismukhanova, L.; Choduraev, T.; Opp, C.; Madibekov, A. Accumulation of Heavy Metals in Bottom Sediment and Their Migration in the Water Ecosystem of Kapshagay Reservoir in Kazakhstan. Appl. Sci. 2022, 12, 11474. [Google Scholar] [CrossRef]
- Szarłowicz, K.; Baran, A.; Wójs, K.; Wójcik, S. Estimation of the level of anthropogenic impact based on the determination of radionuclides and heavy metals in sediments taken from Rybnik reservoir, Poland. Environ. Sci. Pollut. Res. Int. 2024, 31, 37356–37365. [Google Scholar] [CrossRef]
- Obolewski, K.; Glinska-Lewczuk, K. Distribution of heavy metals in bottom sediments of floodplain lakes and their parent river—A case study of the Słupia. J. Elem. 2012, 18, 673–682. [Google Scholar] [CrossRef]
- Nguyen, H.L.; Braun, M.; Szaloki, I.; Baeyens, W.; Van Grieken, R.; Leermakers, M. Tracing the metal pollution history of the Tisza river through the analysis of a sediment depth profile. Water Air Soil Pollut. 2009, 200, 119–132. [Google Scholar] [CrossRef]
- Gatti, L.V.; Mozeto, A.; Artaxo, P. Trace elements in lake sediments measured by the PIXE technique. Nucl. Instrum. Methods Phys. Res. Sect. B 1999, 150, 298–305. [Google Scholar] [CrossRef]
- Ciszewski, D.; Czajka, A. Human-induced sedimentation patterns of a channelized lowland river. Earth Surf. Process. Landf. 2015, 40, 783–795. [Google Scholar] [CrossRef]
- Menounou, N.; Presley, B.J. Mercury and other trace elements in sediment cores from central Texas lakes. Arch. Environ. Contam. Toxicol. 2003, 45, 11–29. [Google Scholar] [CrossRef]
- Bábek, O.; Hilscherová, K.; Nehyba, S.; Zeman, J.; Famera, M.; Francu, J.; Holoubek, I.; MacHát, J.; Klánová, J. Contamination history of suspended river sediments accumulated in oxbow lakes over the last 25 years: Morava River (Danube catchment area),Czech Republic. J. Soils Sediments 2008, 8, 165–176. [Google Scholar] [CrossRef]
- Ciążela, J.; Siepak, M.; Wojtowicz, P. Tracking heavy metal contamination in a complex river-oxbow lake system: Middle Odra Valley, Germany/Poland. Sci. Total Environ. 2017, 616, 996–1006. [Google Scholar] [CrossRef] [PubMed]
- He, J.; Lü, C.; Fan, Q.; Xue, H.; Bao, J. Distribution of AVS-SEM, transformation mechanism and risk assessment of heavy metals in the Nanhai Lake in China. Environ. Earth Sci. 2011, 64, 2025–2037. [Google Scholar] [CrossRef]
- Adamiec, E.; Helios-Rybicka, E. Distribution of pollutants in the Odra River system part V. Assessment of total and mobile heavy metals content in the suspended matter and sediments of the Odra River system and recommendations for river chemical monitoring. Pol. J. Environ. Stud. 2002, 11, 675–688. [Google Scholar]
- Hakanson, L. An ecological risk index for aquatic pollution control. A sedimentological approach. Water Res. 1980, 14, 975–1001. [Google Scholar] [CrossRef]
Disclaimer/Publisher’s Note: The statements, opinions and data contained in all publications are solely those of the individual author(s) and contributor(s) and not of MDPI and/or the editor(s). MDPI and/or the editor(s) disclaim responsibility for any injury to people or property resulting from any ideas, methods, instructions or products referred to in the content. |
© 2025 by the authors. Licensee MDPI, Basel, Switzerland. This article is an open access article distributed under the terms and conditions of the Creative Commons Attribution (CC BY) license (https://creativecommons.org/licenses/by/4.0/).