Article

Linking Life History Traits to the Threat Level of European Freshwater Fish

Laboratory of Ichthyology, Department of Zoology, School of Biology, Aristotle University of Thessaloniki, P.O. Box 134, GR54124 Thessaloniki, Greece
*
Author to whom correspondence should be addressed.
Water 2025, 17(15), 2254; https://doi.org/10.3390/w17152254
Submission received: 11 June 2025 / Revised: 20 July 2025 / Accepted: 27 July 2025 / Published: 29 July 2025
(This article belongs to the Section Biodiversity and Functionality of Aquatic Ecosystems)

Abstract

Over 40% of freshwater fish species in Europe are currently at risk of extinction, highlighting the need for improved conservation planning. This study examines whether the threat status is associated with life-history and ecological traits across 580 autochthonous (native and endemic) freshwater fish species in European inland waters. Using data from FishBase and the IUCN Red List, we assessed associations between threat level and both categorical (e.g., migratory behavior, commercial importance, reproductive guild, and body shape) and numerical traits (e.g., maximum length, weight, age, growth parameters, and maturity traits). Significant, though modest, associations were identified between species threat level and migratory behavior and reproductive guild. Non-migratory species exhibited higher median threat levels, while amphidromous species showed a non-significant trend toward higher threat, suggesting that limited dispersal ability and dependence on fragmented freshwater networks may increase extinction vulnerability. Species with unclassified reproductive strategies also showed elevated threat levels, possibly reflecting both actual risk and underlying data gaps. In contrast, body shape and trophic level were not significantly associated with threat status. Critically Endangered species tend to be larger, heavier, and mature later—traits characteristic of slow life history strategies that limit population recovery. Although length at maturity and maximum age did not differ significantly among IUCN categories, age at maturity was significantly higher in more threatened species, and growth rate (K) was negatively correlated with threat level. Together, these patterns suggest that slower-growing, later-maturing species face elevated extinction risk. Overall, the findings underscore that the threat level in European freshwater fish is shaped by complex interactions between intrinsic biological traits and external pressures. Trait-based approaches can enhance extinction risk assessments and conservation prioritization, especially in data-deficient freshwater ecosystems facing multifaceted environmental challenges.
Key Contribution: This study demonstrates that life history and ecological traits—particularly slow growth, delayed maturity, and limited dispersal—are associated with elevated threat levels in European freshwater fish. It reinforces the value of trait-based approaches for conservation prioritization and provides a comprehensive, continent-wide analysis focused on autochthonous species.

1. Introduction

Freshwater ecosystems, although covering less than 1% of the Earth’s surface, support nearly 10% of all described species [1]. Among them, freshwater fish represent one of the most diverse and ecologically significant vertebrate groups [1]. These ecosystems are hotspots of endemism but also rank among the most threatened worldwide [2,3,4]. In Europe, inland waters host a rich diversity of autochthonous (native and endemic) fish species that contribute to ecological stability, regional biodiversity, and a wide array of essential ecosystem services.
However, freshwater fish across Europe face escalating threats from a range of anthropogenic stressors [5,6]. Over 40% of species are currently listed as threatened with extinction [6]. Key drivers include river fragmentation due to dams and water regulation, invasive alien species and associated diseases, prolonged droughts, pollution from agriculture and forestry, and unsustainable fishing practices [6]. These threats are further compounded by the accelerating impacts of climate change [5,7], particularly in southern Europe, where freshwater systems are especially vulnerable to hydrological instability and water scarcity [8].
Conserving these species is vital—not only for maintaining biodiversity but also for preserving the functional integrity of freshwater ecosystems. Effective conservation planning requires a better understanding of the factors that make certain species more susceptible to decline. Life history traits have been shown to play a key role in determining species’ resilience to environmental change [9]. As a result, trait-based approaches are increasingly being integrated into extinction risk assessments to identify vulnerable taxa and guide conservation priorities [8,9,10,11].
One of the most widely used tools for assessing extinction risk is the International Union for Conservation of Nature (IUCN) Red List, which classifies species into threat categories based on population trends, range size, and the nature and intensity of threats [12]. Categories range from Extinct (EX) to Least Concern (LC), with intermediate statuses such as Critically Endangered (CR), Endangered (EN), Vulnerable (VU), and Near Threatened (NT). Two additional categories refer to species with limited or no data (DD—Data Deficient) and that have not yet been evaluated (NE—Not Evaluated).
Despite its utility, the Red List does not always capture the underlying biological traits that predispose species to extinction, especially in complex freshwater environments where multiple threats interact. There is thus a growing need to incorporate life history and ecological traits into risk evaluation frameworks to improve species prioritization and develop targeted conservation strategies [5,6].
This study addresses this need by examining the relationship between extinction risk and life history traits in 580 autochthonous freshwater fish species in Europe, aiming to evaluate the intrinsic vulnerability of its natural freshwater ichthyofauna. Drawing on previous research and theoretical expectations, we hypothesize that specific life history traits are significantly associated with species’ threat levels. By quantitatively linking multiple trait dimensions to IUCN threat categories across a large and taxonomically diverse dataset, our study aims to generate new insights to inform data-driven conservation strategies and support the prioritization of vulnerable taxa within Europe’s increasingly imperiled freshwater ecosystems.

2. Materials and Methods

The study utilized the rFishBase package, an R interface to the global FishBase database [13], to extract data for autochthonous—defined here as native (naturally occurring in European inland waters without human introduction) and endemic (native and restricted to specific regions within Europe)—fish species in European inland waters as defined in this study by the region bounded by the Ural Mountains, Ural River, Caspian Sea, Greater Caucasus, Black Sea, and Bosporus Strait.
The extracted dataset encompassed species taxonomy and economic importance, along with a comprehensive set of traits categorized as life history traits (i.e., biological characteristics related to growth, reproduction, and survival, such as maximum reported length [Max Length], weight [Max Weight], age [Max Age], length at maturity [Lm], age at maturity [tm], and growth rate [K] of the von Bertalanffy equation) and ecological traits (i.e., characteristics related to species–environment interactions, such as body shape, reproductive guild, migratory behavior, and trophic level). These traits were either categorical (qualitative traits with discrete categories, e.g., body shape, reproductive guild, migratory behavior) or numerical (quantitative traits measured on a continuous scale, e.g., Max Length, Max Age, K, and tm) and were analyzed accordingly in the statistical procedures.
Migratory behavior categories follow definitions provided in the FishBase glossary and the established ichthyological literature [14,15,16]. Anadromous species live in the sea and migrate into freshwater to spawn (e.g., Salmo salar), while catadromous species inhabit freshwater and migrate to marine environments to reproduce (e.g., Anguilla anguilla). Amphidromous species migrate between fresh and salt water not for reproductive purposes, but as part of their life cycle [15]; however, this classification remains under scientific debate. Potamodromous species migrate exclusively within freshwater systems [16].
Each species’ classification into an IUCN Red List was accessed in February 2025, to ensure the most recent information. For analytical purposes, each IUCN category was assigned an ordinal numeric value ranging from 1 (LC) to 6 (EX).
Descriptive statistics were performed to assess differences in life history traits across IUCN categories. Kruskal–Wallis non-parametric tests were used to evaluate the distribution of threat level across trait categories. Post hoc pairwise comparisons between groups were conducted using Dunn’s test with Benjamini–Hochberg correction for multiple comparisons. Effect sizes for Kruskal–Wallis tests were estimated using eta-squared (η2), providing a measure of the magnitude of trait–threat level associations. To explore associations between extinction risk and numerical life history traits, Spearman’s rank correlation was performed among Threat_level, Max_Length, Lm, tm, and K. Only species with a complete data set (n = 72) were retained for the correlation analysis. All analyses were conducted with R (version 4.0.5) and relevant R packages, including rFishBase [17], dplyr [18], ggplot2 [19], ggcorrplot [20], and rstatix [21].

3. Results

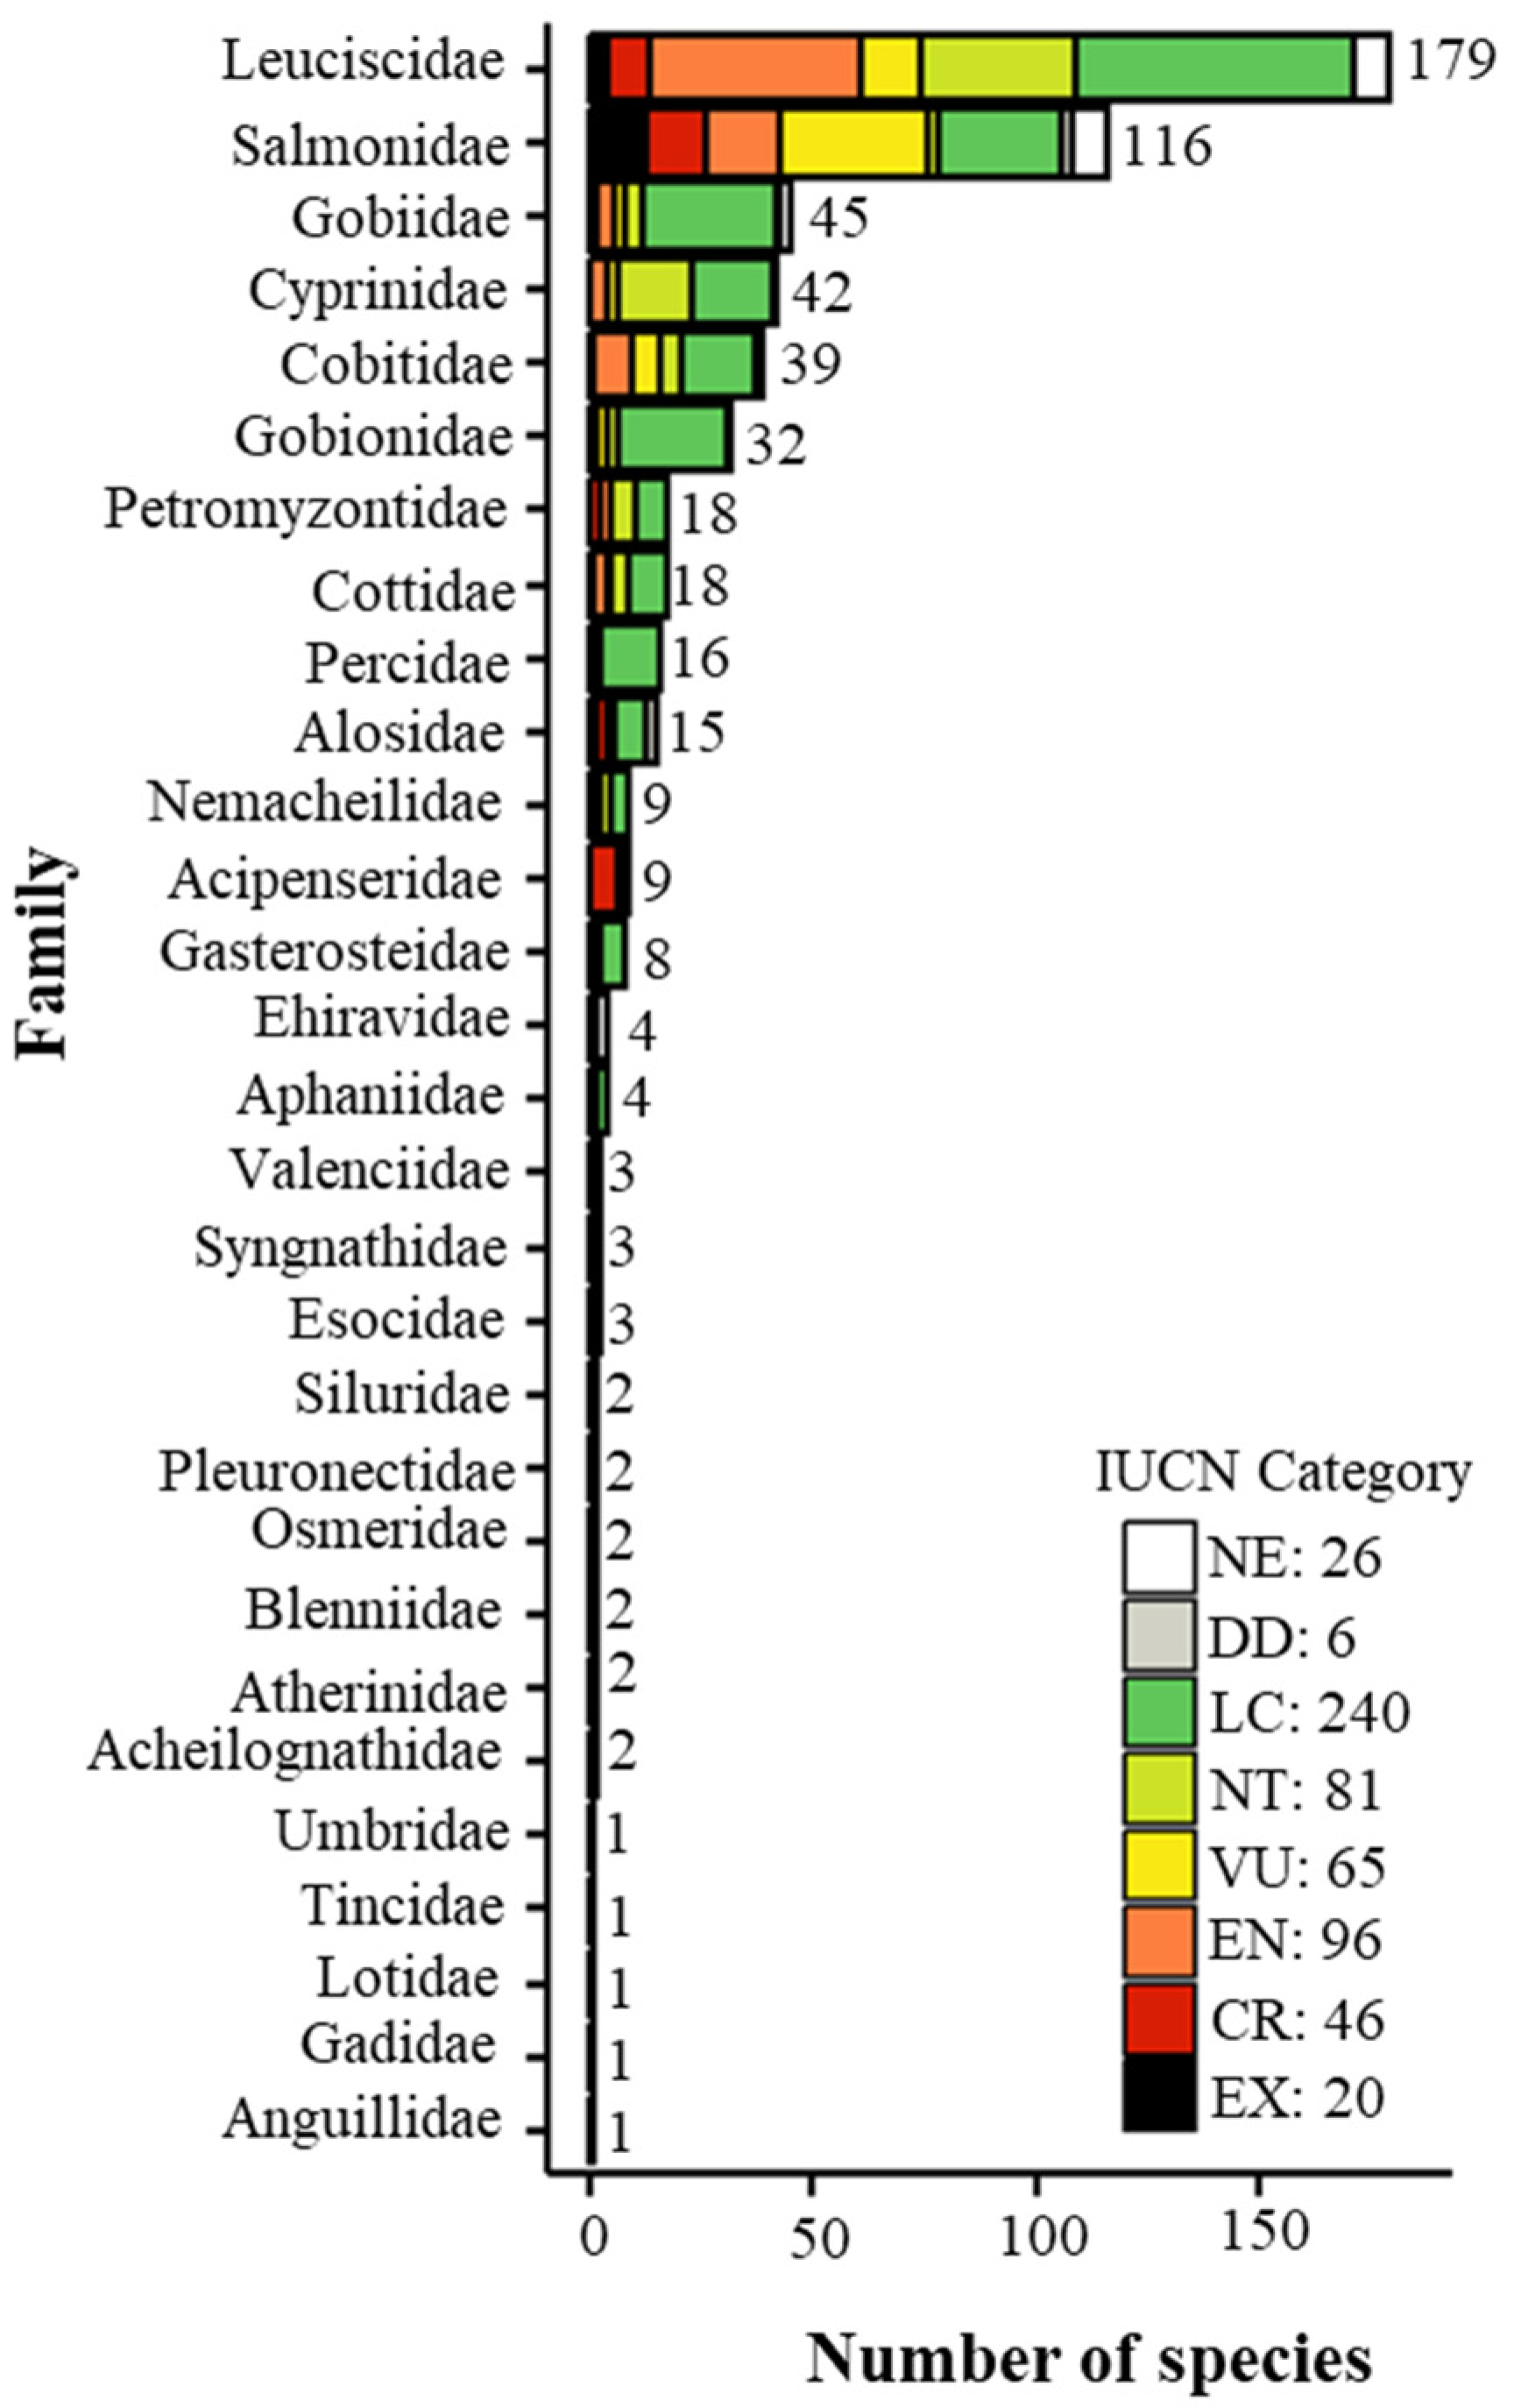
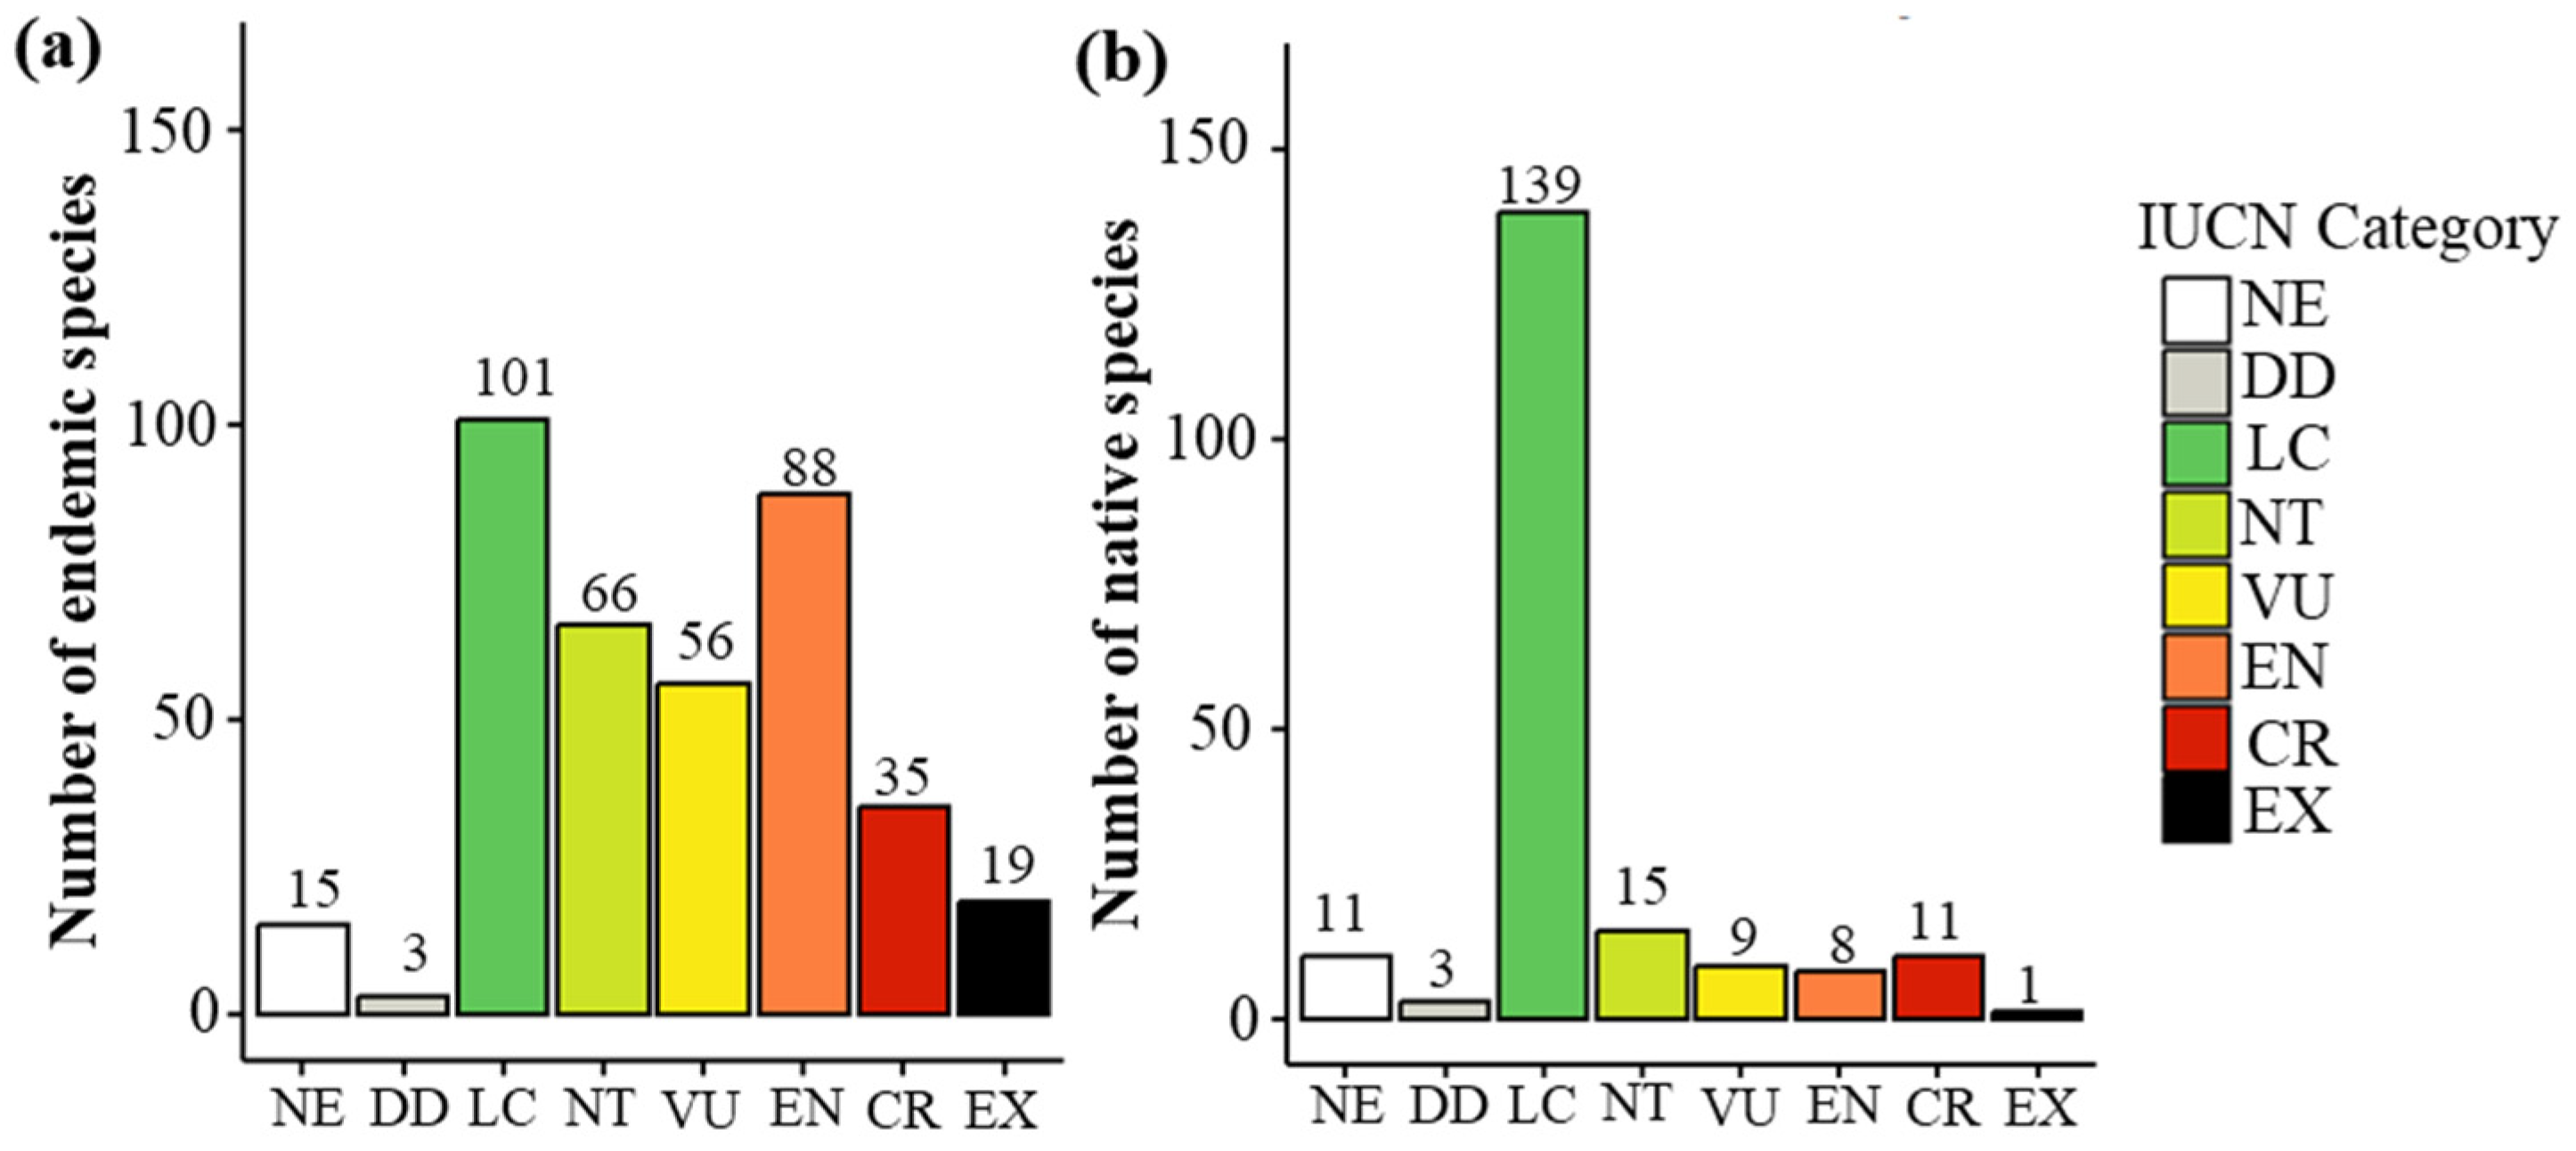
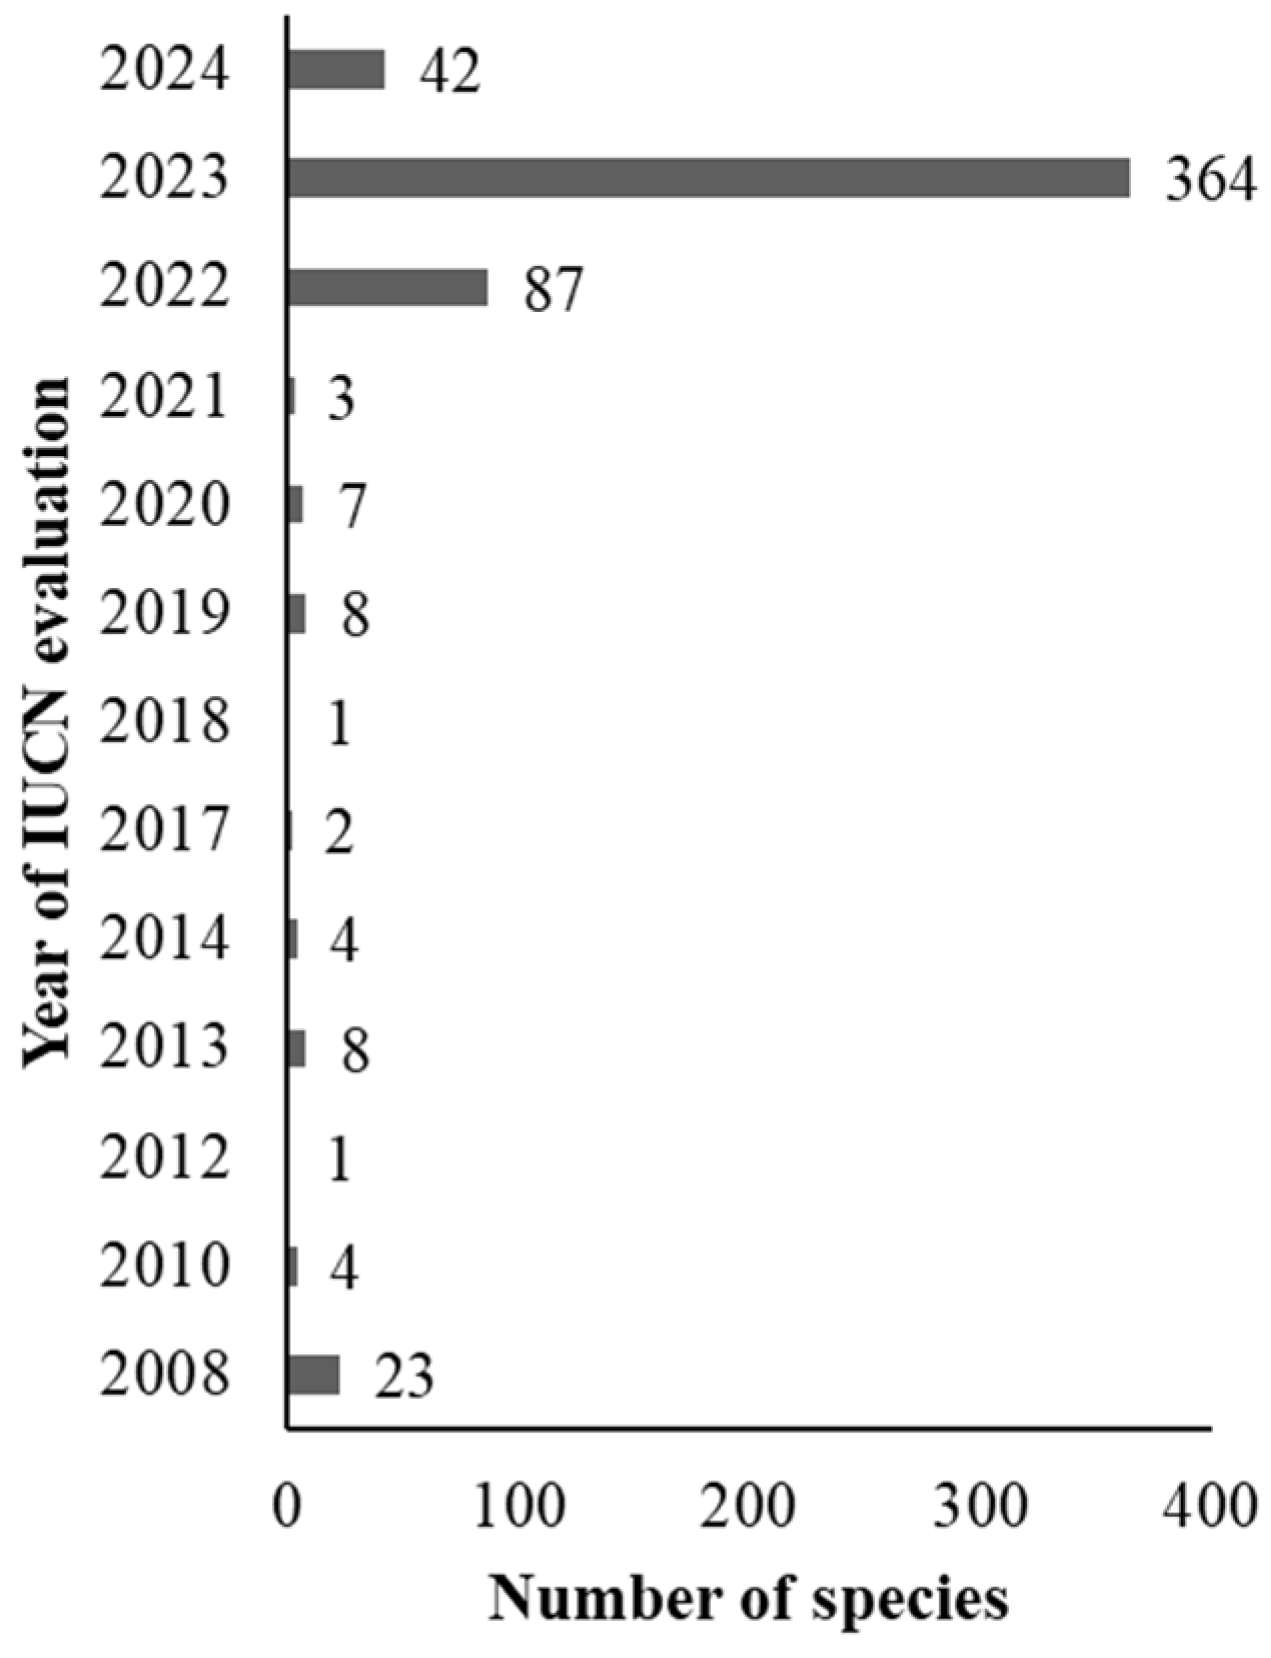
3.1. Threat Classification Across Families and Species Origin

In total, 580 autochthonous species (383 endemic and 197 native as defined by FishBase), belonging to 29 families, were extracted from FishBase, 554 of which were evaluated under the IUCN criteria (Figure 1 and Figure 2). The family with the most threatened species was Leuciscidae (109 species), followed by Salmonidae (78 species) (Figure 1).
In total, 26 species (4.48%) were not yet evaluated (NE), while for 6 (1.03%) species there was a deficiency of data for their evaluation (DD) (Figure 2). Lastly, 19 endemic and 1 native species are considered extinct (Figure 2).
The IUCN status for the majority of the European inland fish species was assessed in 2023 (Figure 3).

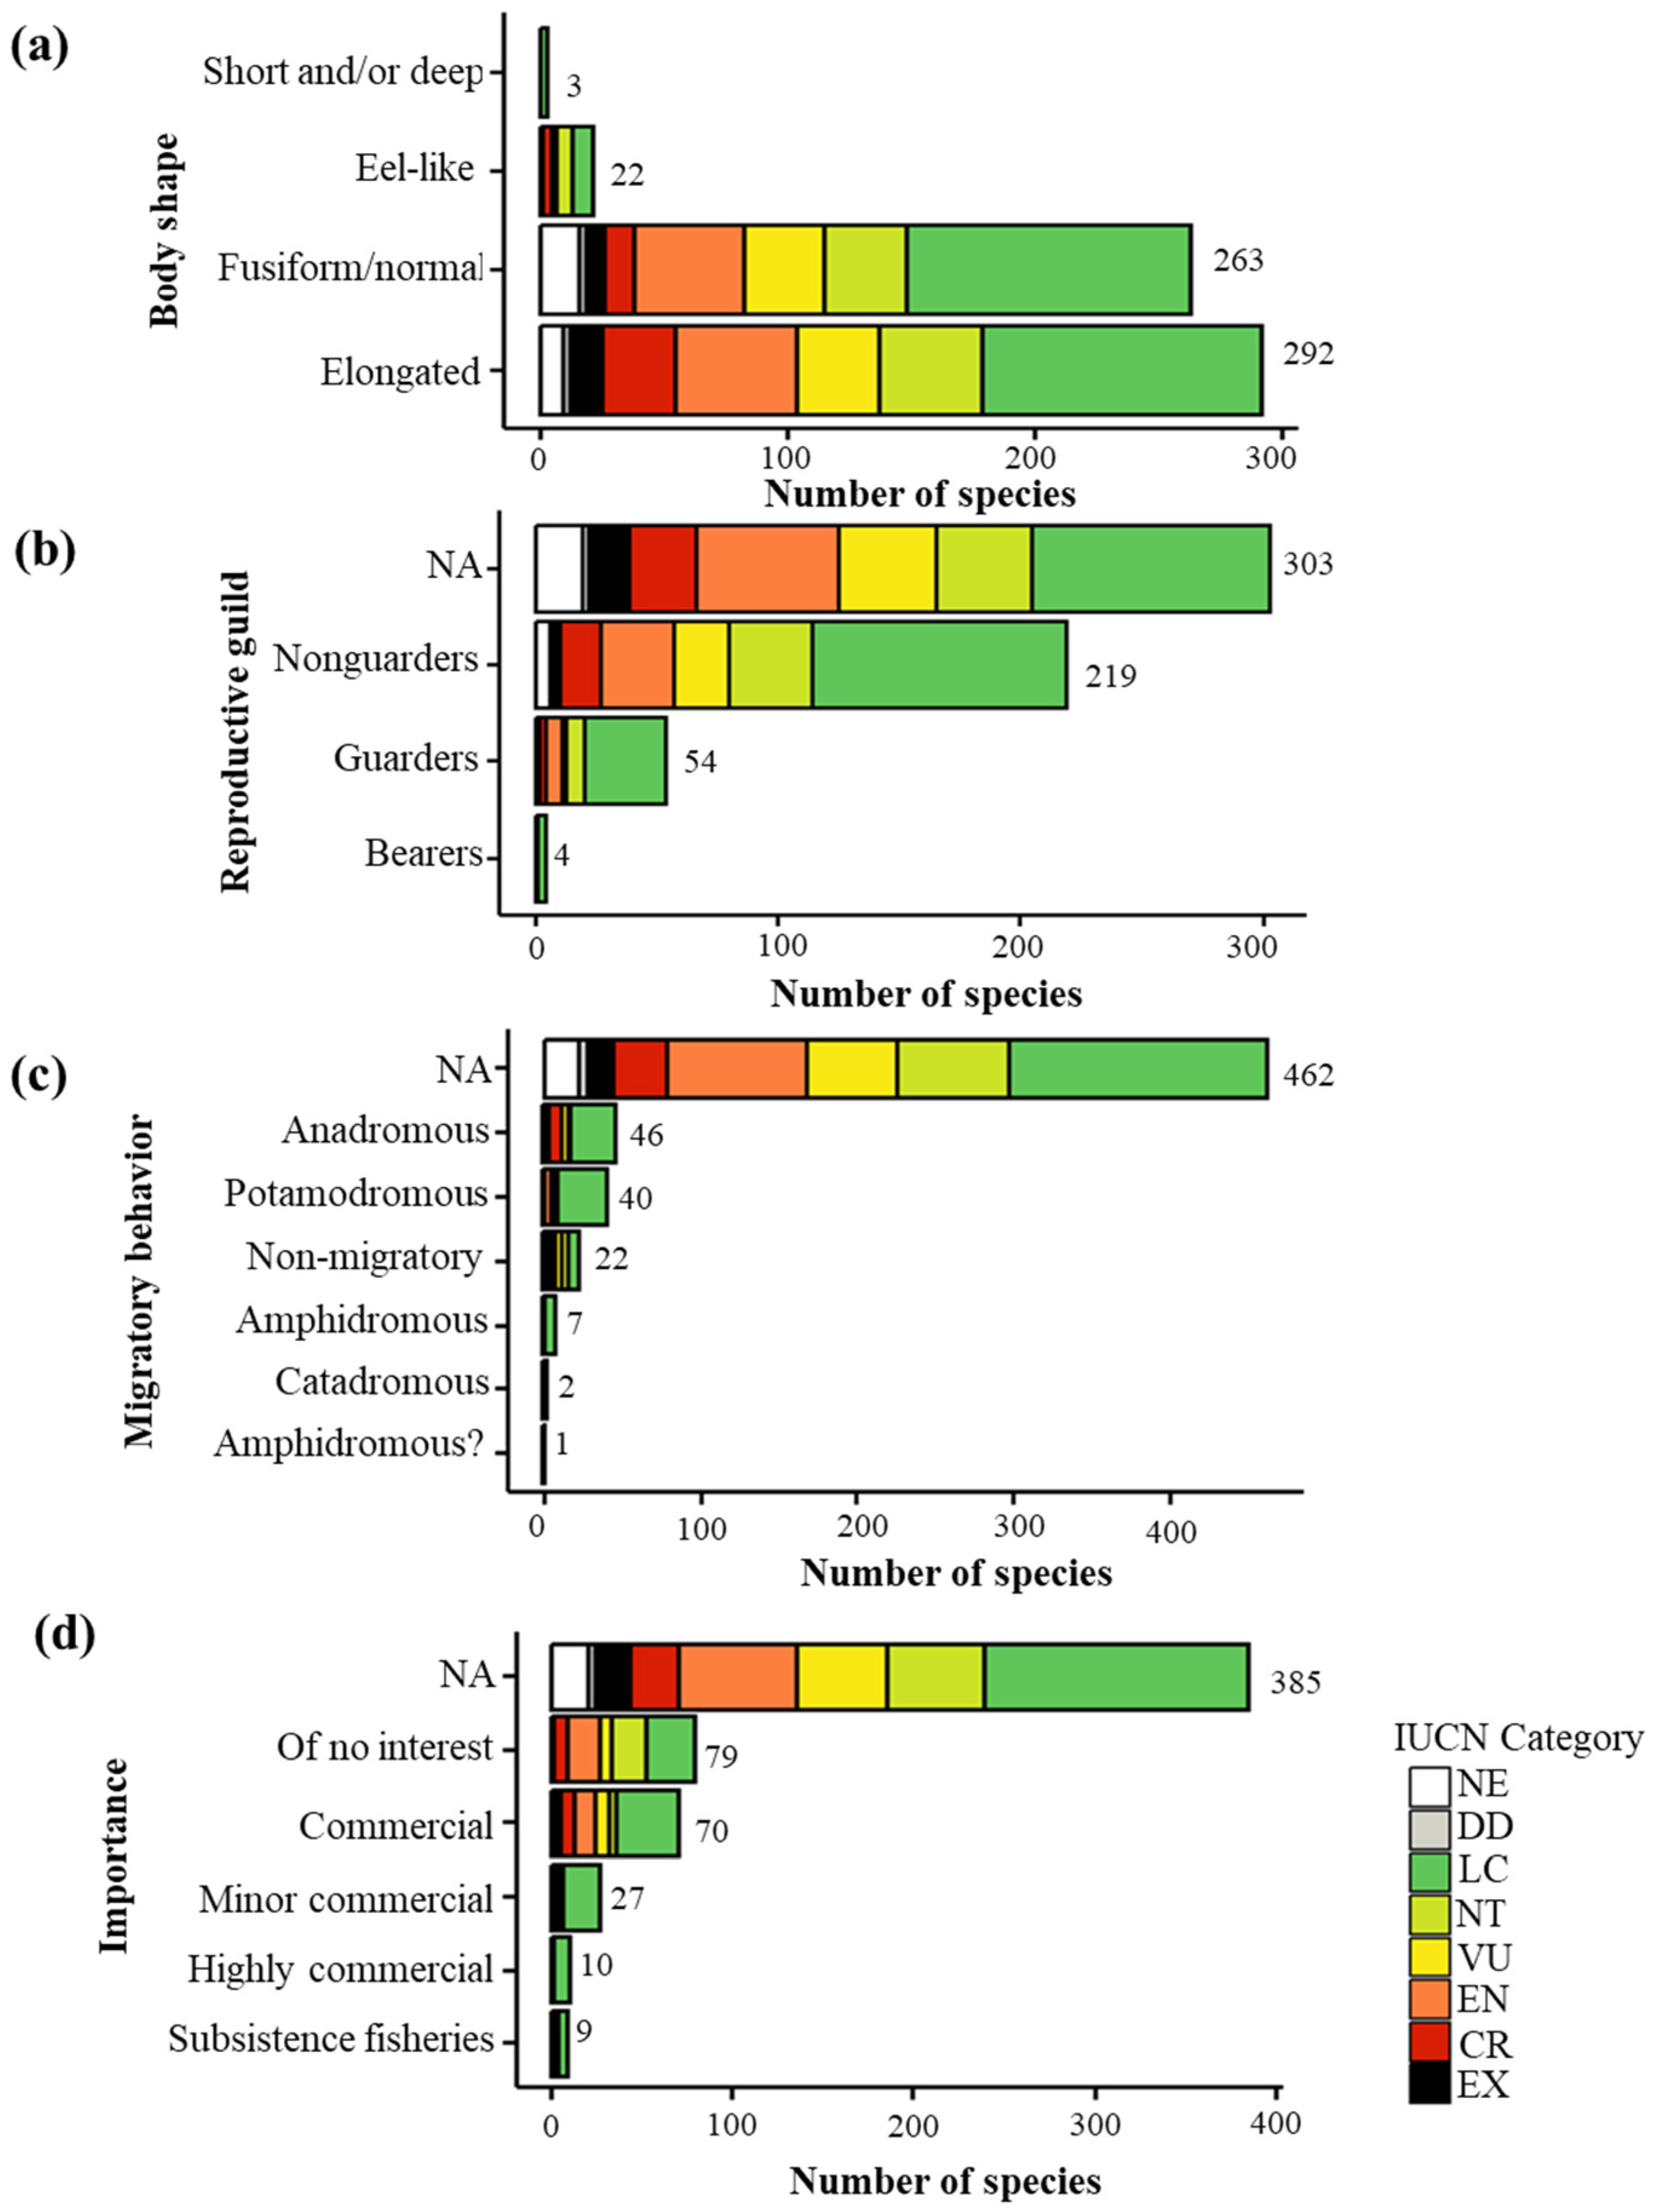
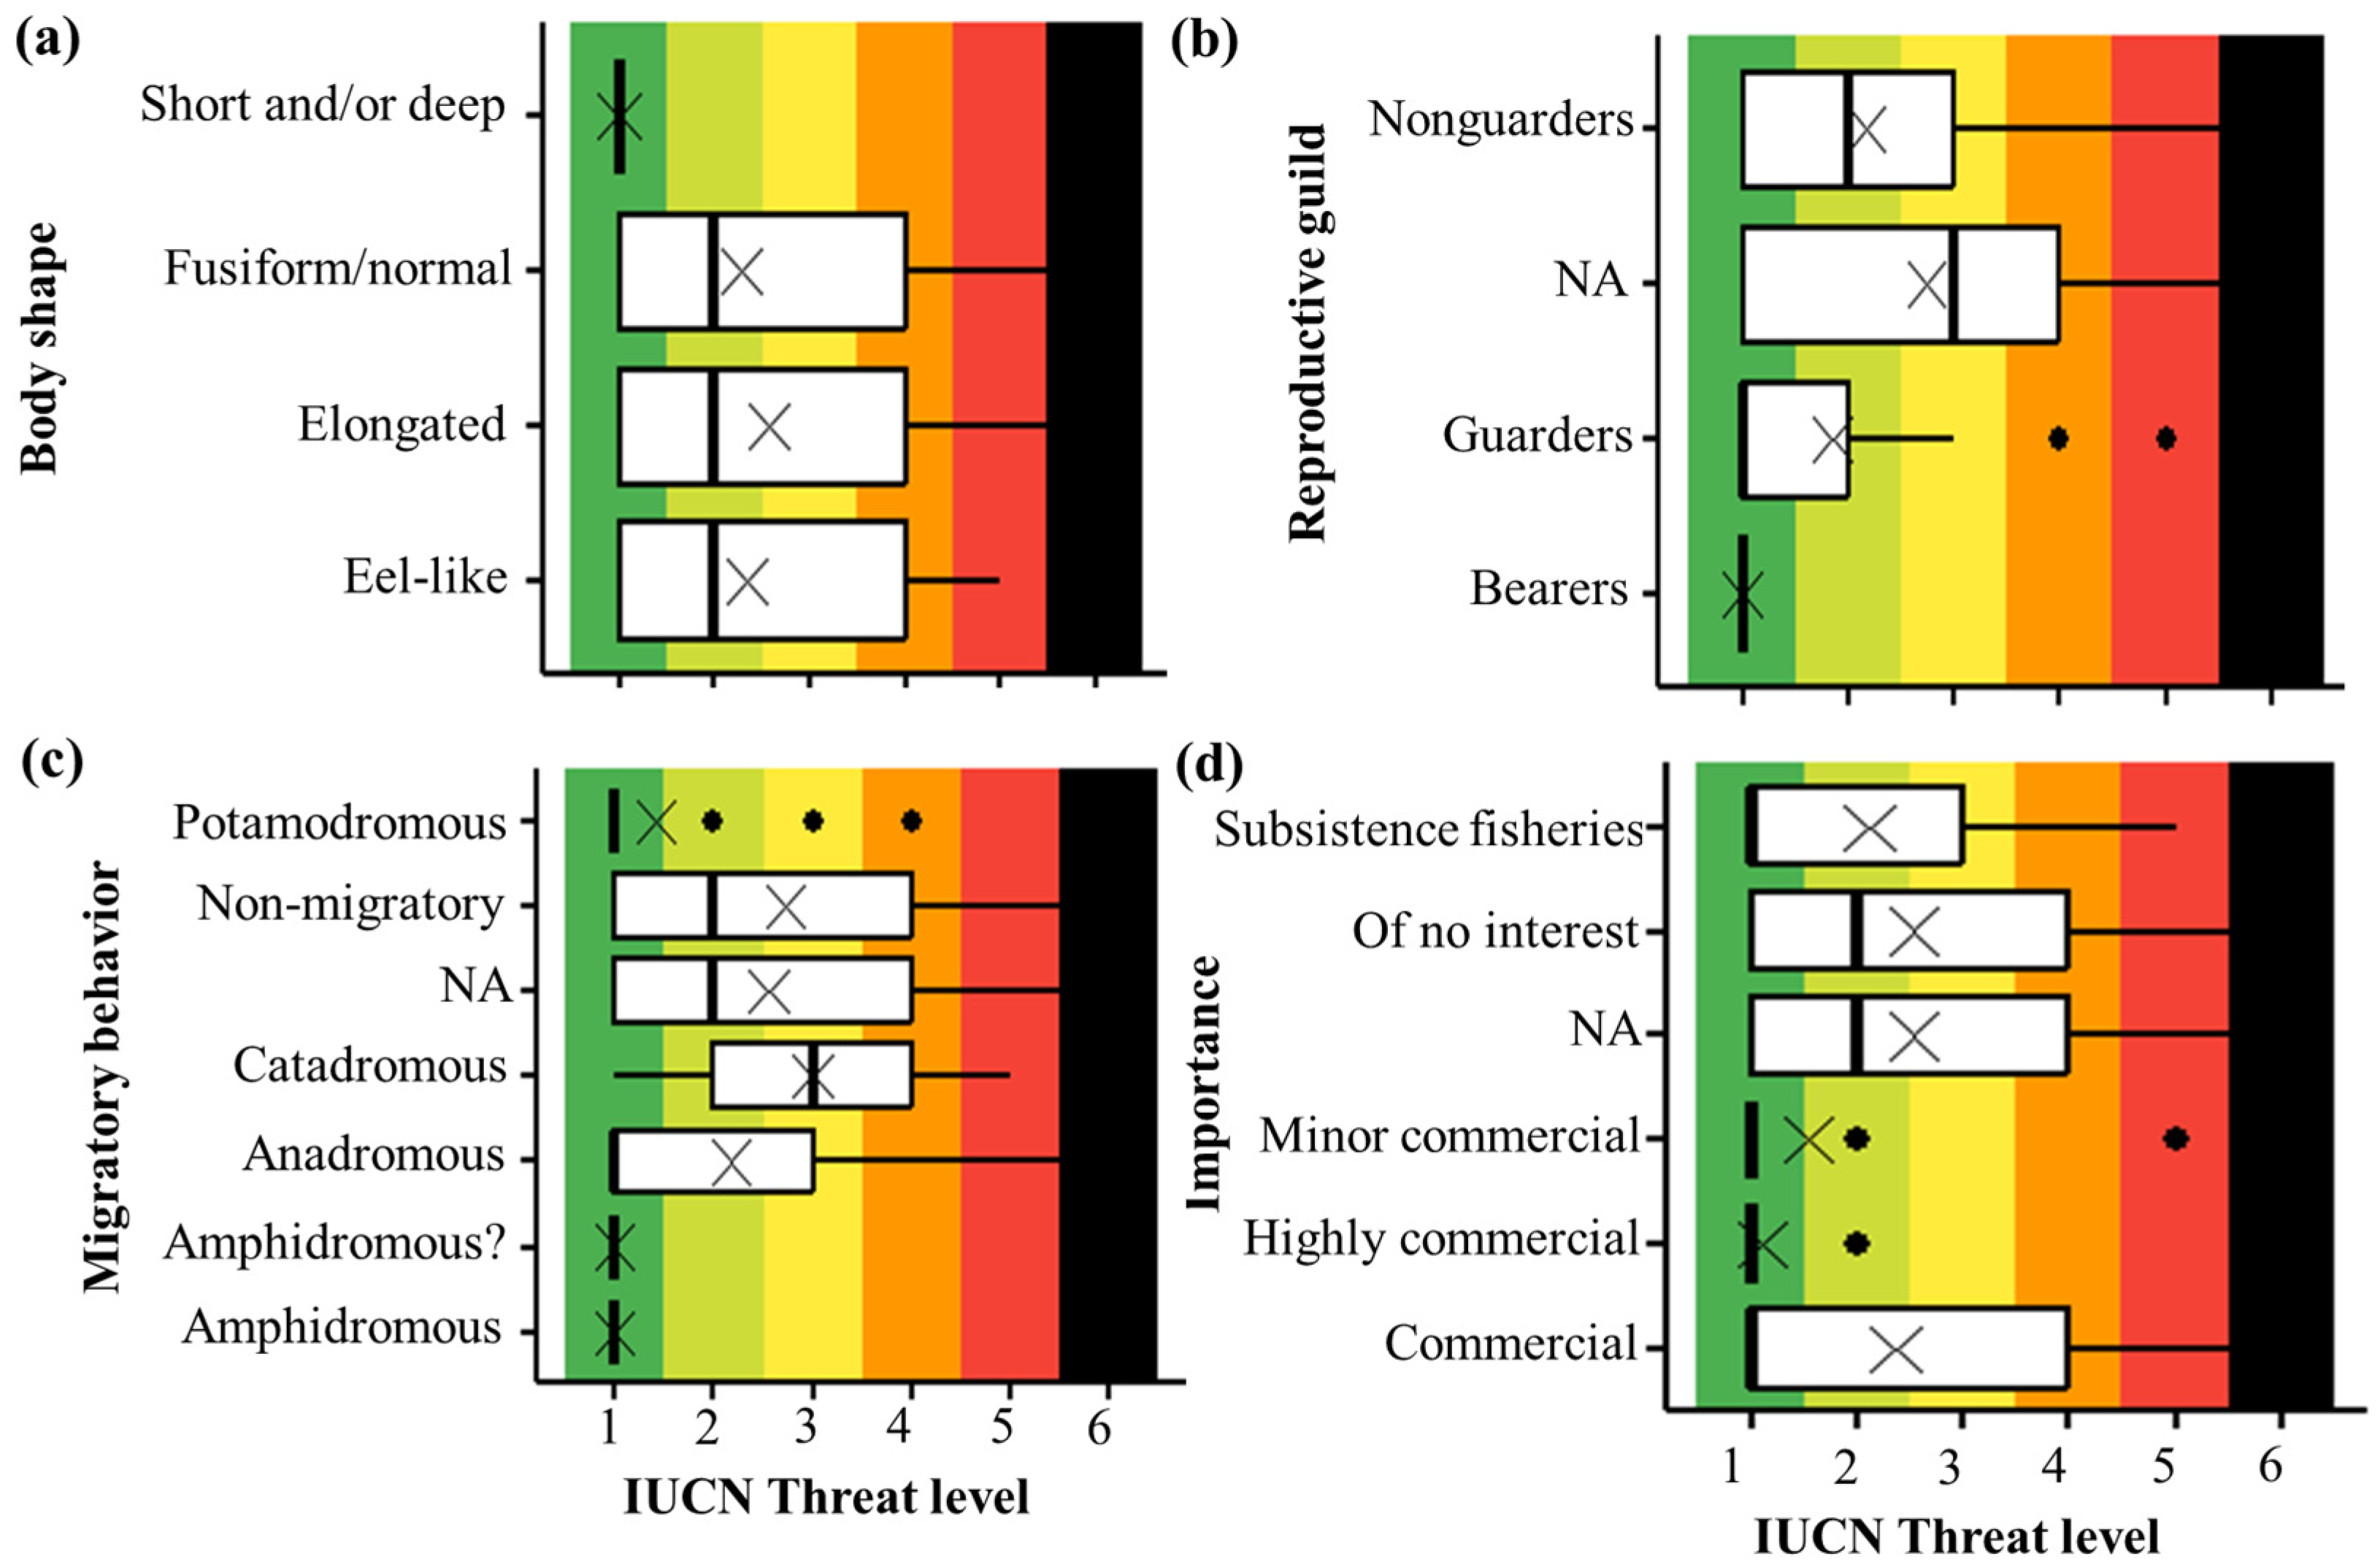
3.2. Categorical Traits and Threat Level

Most species exhibited either an elongated or fusiform/normal body shape, and these categories also contained the highest number of species listed in threatened IUCN categories (Figure 4a).
Concerning the reproductive guild (Figure 4b), nonguarders showed the highest species count among those with known reproductive guilds. Specifically, nonguarders had significant representation in the LC category, with 105 species, followed by NT (34 species) and EN (30 species). On the other hand, guarders were more limited in number, with a notable concentration in the LC (34 species) and EN (7 species) categories.
Migration behavior data was unavailable for the majority of species (Figure 4c). Among those with available data, anadromous species exhibited the highest number of species classified as CR, with eight out of forty-six species in this group falling into this category (Figure 4c).
Figure 4d shows the number of species based on their commercial importance per IUCN category. For the majority of species, commercial importance was not assessed. Among those assessed, commercial species included eight classified as CR, eleven as EN, and four as NT. Minor commercial species included three CR and two NT, while highly commercial species included one NT. Additionally, subsistence fisheries included one CR, one EN, and one NT species.
No statistically significant relationship was found between body shape and threat level (χ2 = 7.08, df = 3, p = 0.069; Figure 5c), although the comparison between elongated–fusiform and normal species yielded a p.adj = 0.029. However, the effect size was negligible (η2 = 0.0076), indicating that body shape explains little variation in threat status.
A statistically significant association was found between reproductive guild (RepGuild1) and threat level (Kruskal–Wallis χ2 = 27.88, df = 3, p < 0.001; Figure 5d), although the effect size was small (η2 = 0.046), indicating limited practical impact. Post hoc pairwise comparisons using Dunn’s test with Benjamini–Hochberg correction revealed that species with unclassified reproductive strategies (NA) differed significantly from both guarders and nonguarders (p.adj < 0.001), while the difference from bearers was marginal (p.adj > 0.05). No other comparisons were statistically significant.
A statistically significant association was found between migratory behavior and threat level (χ2 = 34.03, df = 6, p < 0.001; Figure 5b), although the effect size was small (η2 = 0.05). Potamodromous species had significantly lower threat levels compared to species with unclassified migratory status and non-migratory species (p.adj < 0.001). Additionally, comparisons between amphidromous and non-migratory species (p.adj = 0.071) and amphidromous and unclassified species (p.adj = 0.069) showed marginal trends toward significance, with amphidromous species tending to have lower threat levels in both cases.
The Kruskal–Wallis test revealed significant differences in threat level across commercial importance categories (χ2 = 21.45, df = 5, p < 0.001; Figure 5a). Post hoc comparisons showed that highly commercial and minor commercial species had significantly lower threat levels compared to species categorized as not assessed or of no interest (p.adj < 0.01). However, the overall effect size was small (η2 = 0.030), suggesting that while the relationship is statistically significant, commercial importance explains only a limited portion of the variation in extinction risk.

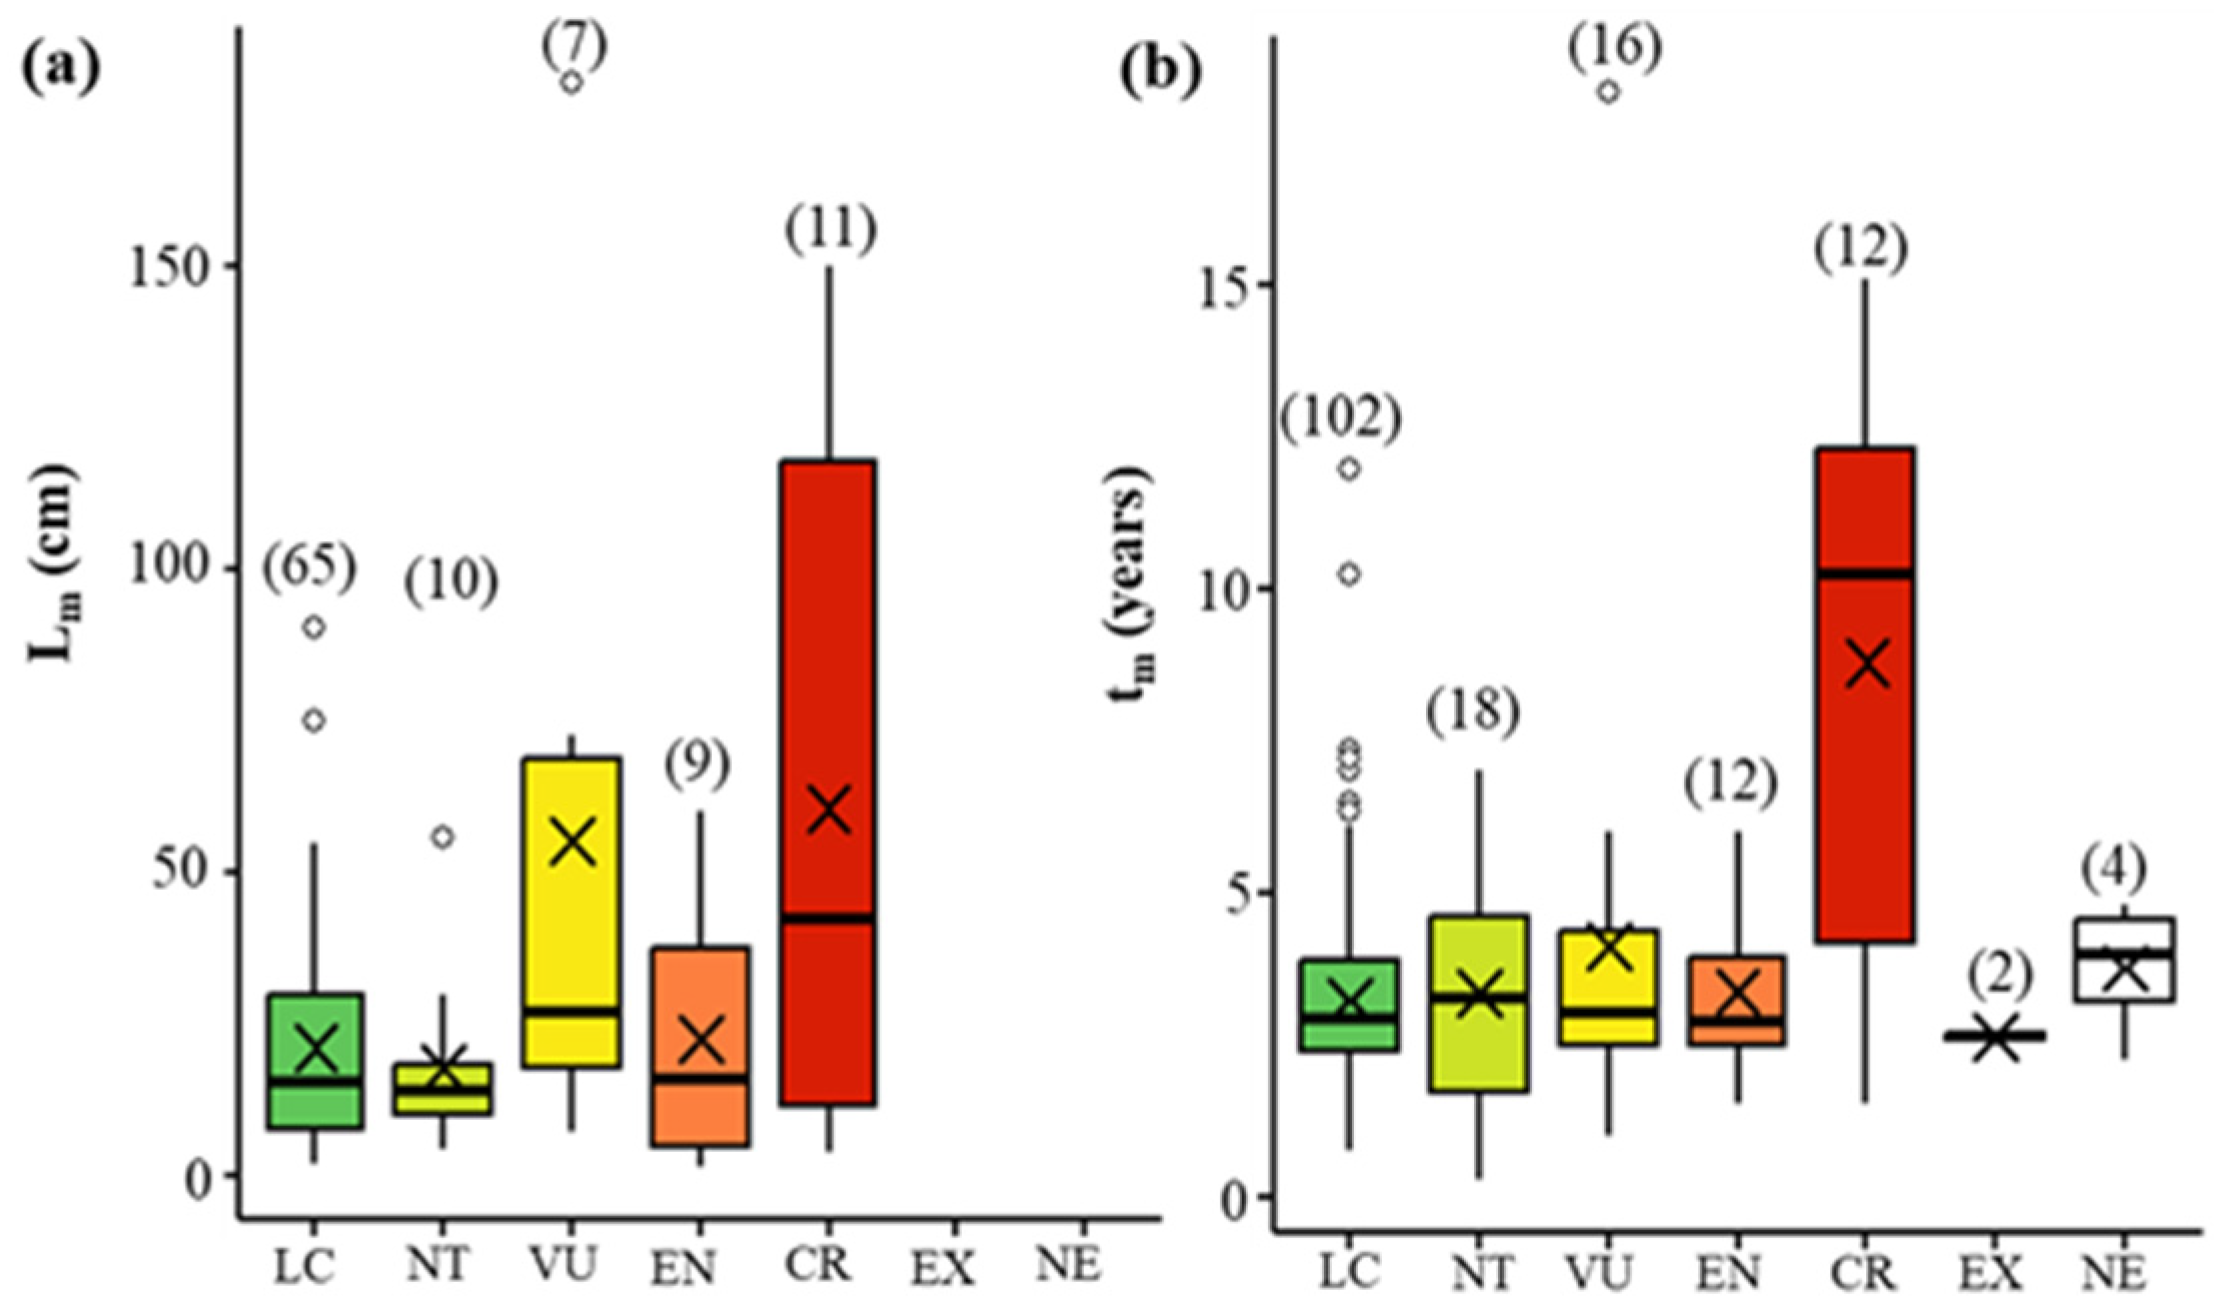
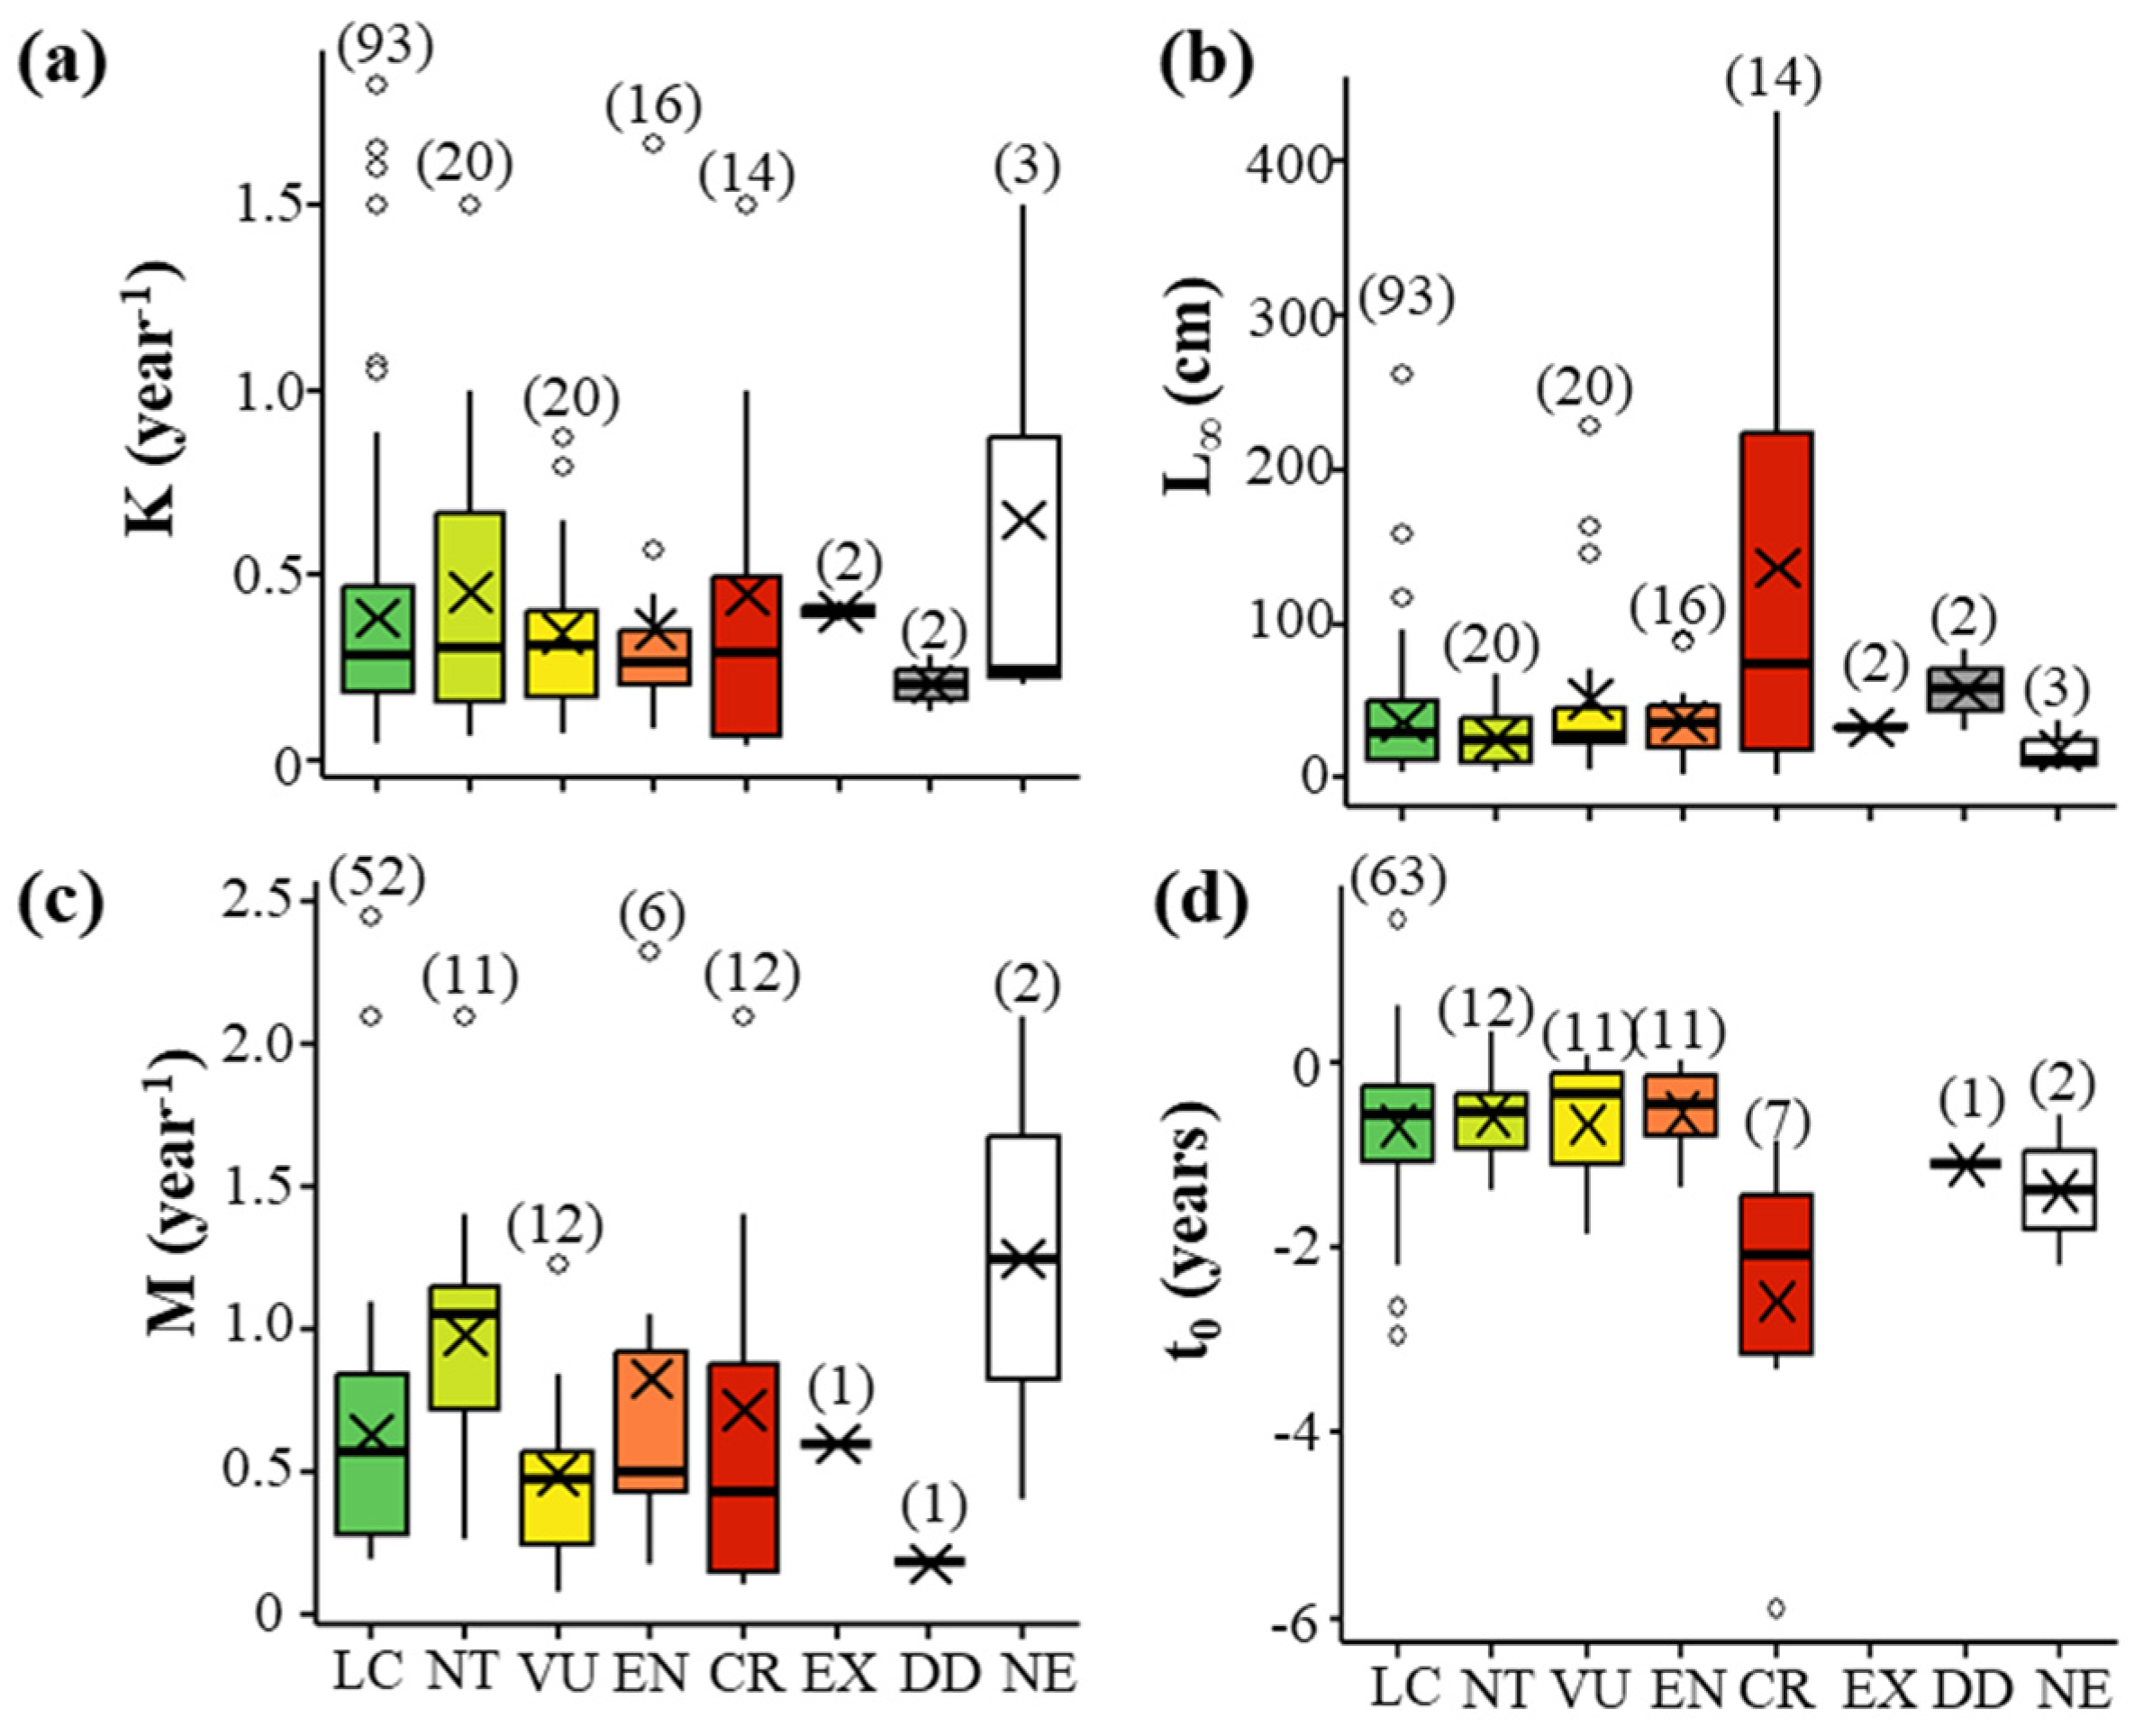
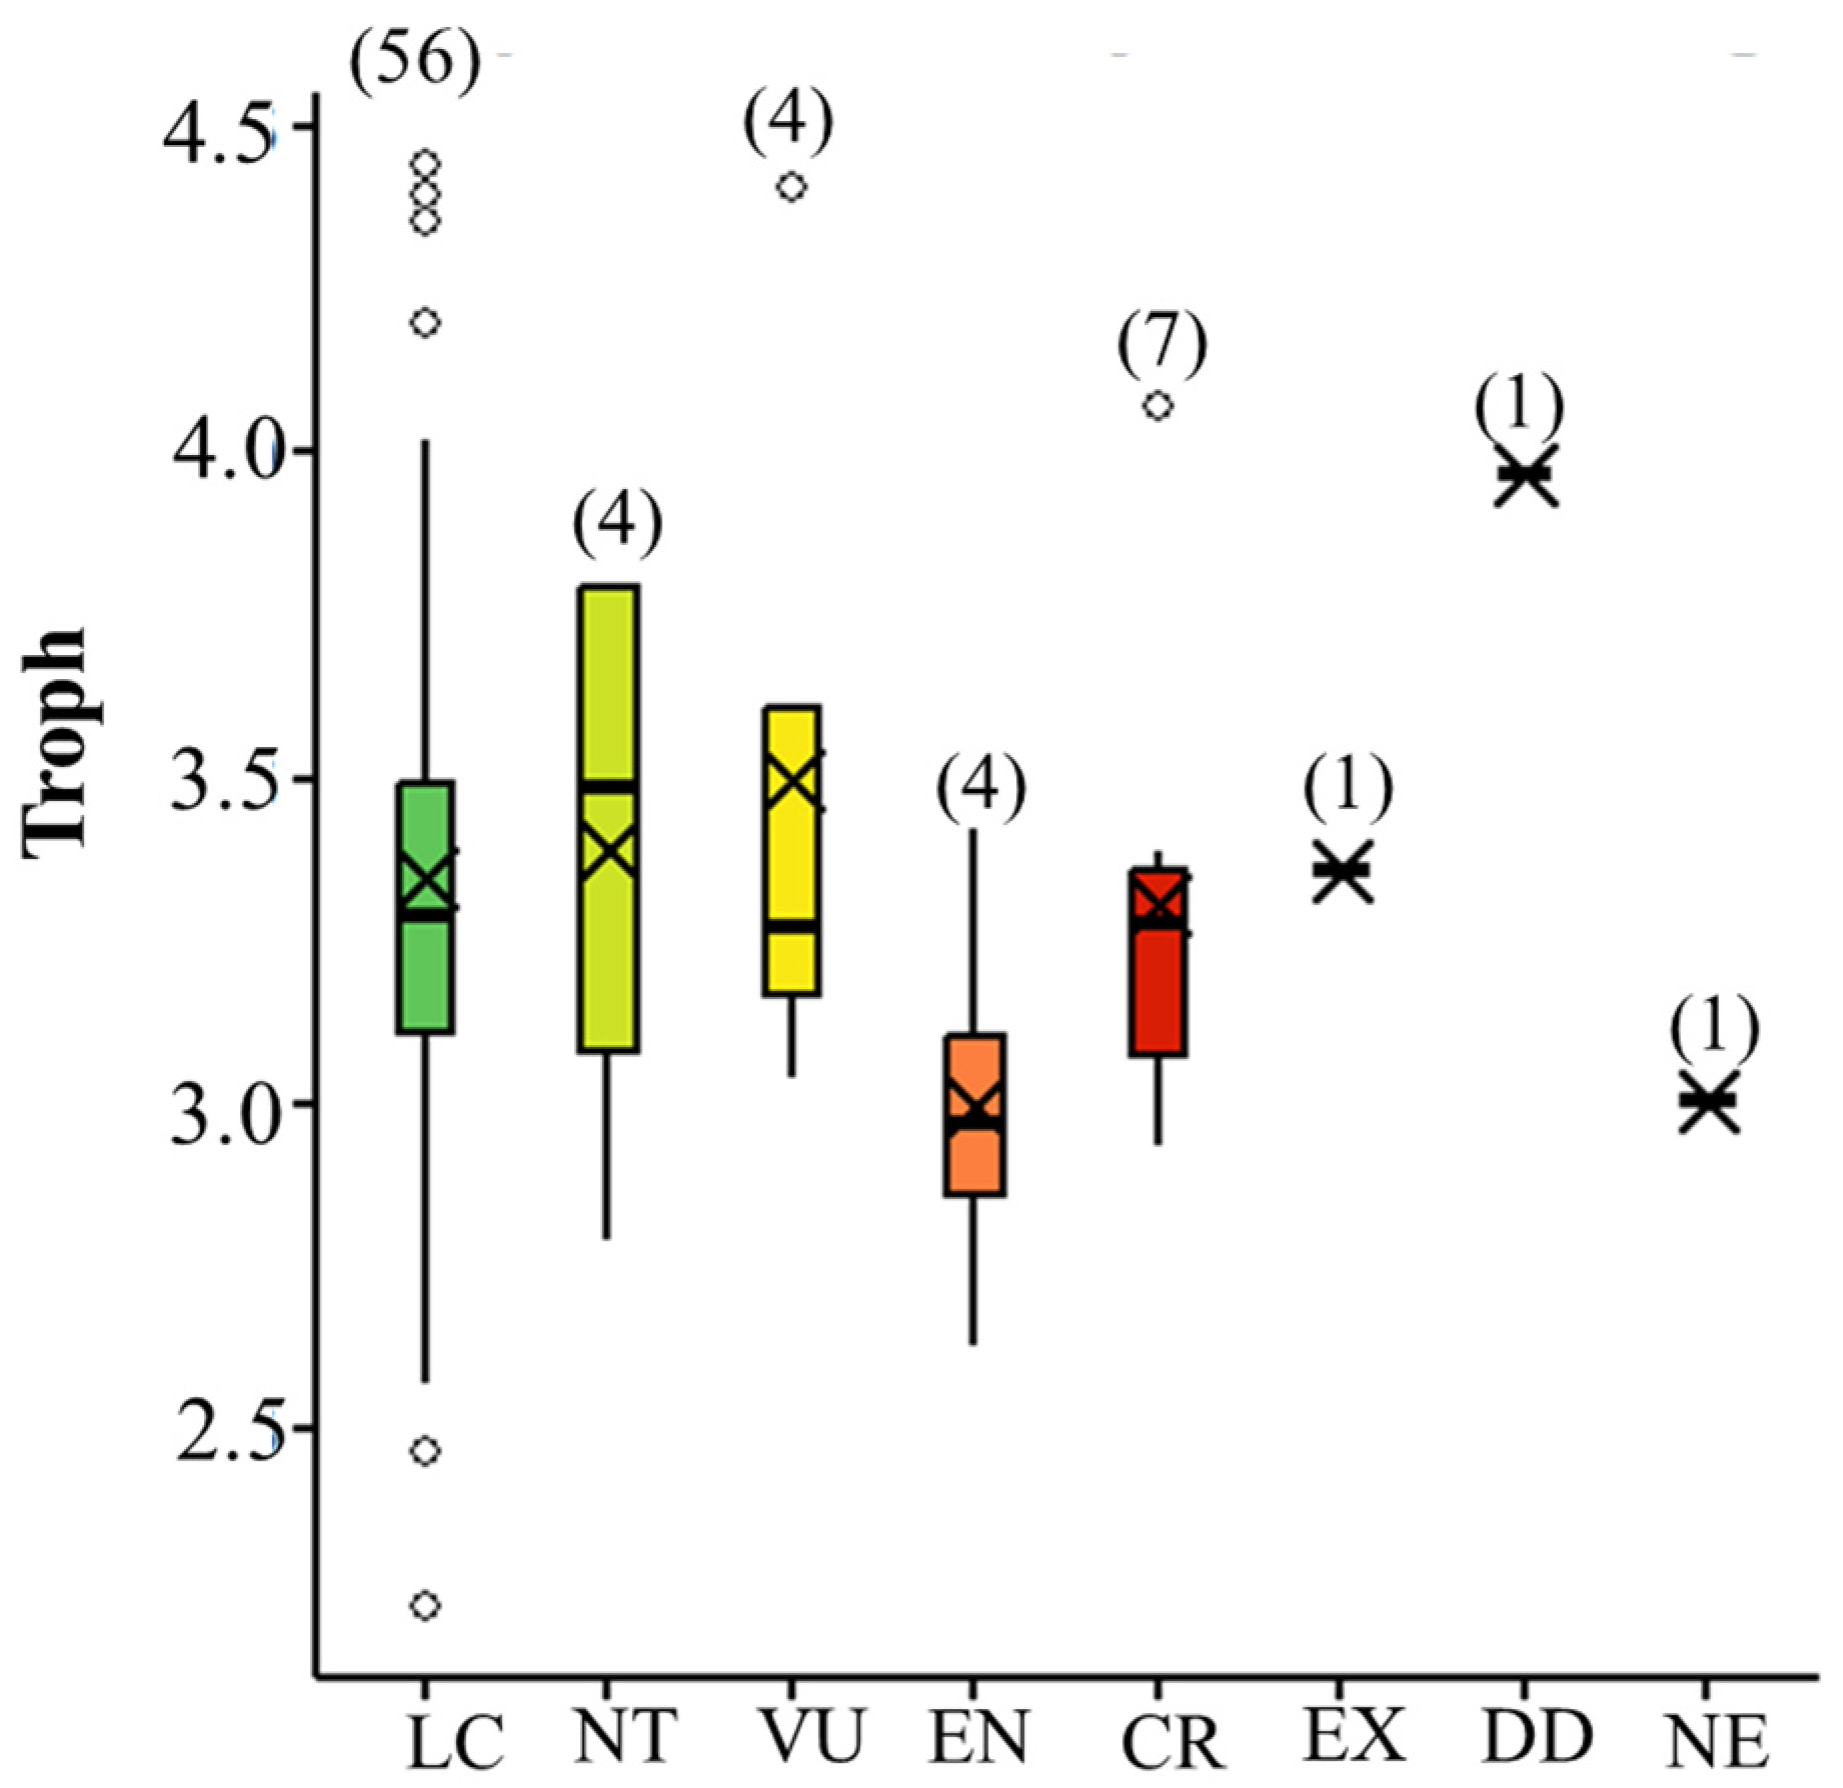
3.3. Numerical Life History Traits and Threat Level

Descriptive statistics indicated considerable variation in maximum body size, weight, and longevity across IUCN categories for autochthonous European freshwater fish species (Figure 6). CR species exhibited the highest average maximum age at 24.4 years, followed by VU (14.1 years), LC (12 years), NT (8.0 years), and EN (7.6 years) (Figure 6a). In terms of body length, CR species again showed the highest mean value at 79.1 cm (max = 800 cm), with VU species averaging 42.3 cm (max = 403 cm). Lower mean lengths were observed in LC (33.7 cm), NT (25.2 cm), and EN (23.6 cm) species (Figure 6b). A similar trend was evident for maximum body weight: CR species had an exceptionally high mean weight of 332,800 g (max = 3,200,000 g), followed by VU (29,352 g), while LC (8114 g), NT (5809 g), and EN (4247 g) had substantially lower mean weights (Figure 6c).
Kruskal–Wallis tests confirmed significant differences in Max Length (χ2 = 16.29, df = 7, p < 0.05) and Max Weight (χ2 = 16.84, df = 7, p < 0.05) across IUCN categories, though no significant differences were found for Max Age (χ2 = 4.66, p > 0.05). Effect size estimates for length indicated a small magnitude (η2 = 0.017). Post hoc Dunn’s tests with Benjamini–Hochberg correction identified no pairwise comparisons that remained statistically significant at p.adj < 0.05 for Max Length. Post hoc comparisons showed that CR species had significantly higher body weight than EN, LC, and NT species (p.adj < 0.05). However, no pairwise comparisons for maximum length remained statistically significant after adjustment. For Max Age, no significant pairwise differences were detected.
Descriptive statistics revealed clear differences in both length and age at maturity across IUCN categories (Figure 7). CR species had the highest Lm mean value at 60.5 cm (SD = 57.2), compared to 21.1 cm (SD = 17.3) in LC species (Figure 7a). CR species also exhibited the highest mean tm at 8.81 years (SD = 4.9), with a median of 10.2 years and a maximum of 15.1 years (Figure 7b). In contrast, LC species had a mean tm of 3.24 years (SD = 1.83). No significant differences were found for Lm across IUCN categories (p > 0.05). In contrast, Kruskal–Wallis tests revealed a significant difference in tm among IUCN categories (χ2 = 13.61, df = 6, p < 0.05), albeit with a small effect size (η2 = 0.048). Post hoc Dunn’s tests confirmed that CR species had significantly higher tm values than LC species (p.adj < 0.001). No other pairwise comparisons were statistically significant.
Descriptive statistics for life history traits across IUCN categories showed notable variation. The K ranged from a mean of 0.34 in VU species to 0.46 in NT species (Figure 8a). Asymptotic length (L∞) was greatest in CR species, with a mean of 137 cm and a maximum of 432 cm, compared to 36.3 cm (max = 262 cm) in LC species (Figure 8b). Natural mortality (M) values varied, with the lowest mean in VU species (0.49) and the highest in NT species (0.98) (Figure 8c). Kruskal–Wallis tests revealed no statistically significant differences among IUCN categories for the majority of the examined life history traits, L∞, K, and M. In contrast, a significant difference was found for the t0 (χ2 = 14.19, df = 4, p < 0.05) and a moderate effect size (η2 = 0.103), suggesting variation in t0 among IUCN categories.
The distribution of trophic levels across IUCN categories for native and endemic species is presented in Figure 9. Μean trophic levels were relatively consistent across categories, with values ranging from 3.00 in EN to 3.97 for DD. LC species had a mean Troph of 3.34 (SD = 0.45), while CR species showed a comparable mean of 3.31 (SD = 0.38). The highest individual trophic level was observed in an LC species (max = 4.44), and the lowest was also within LC (2.23).
Kruskal–Wallis test revealed no statistically significant differences in trophic level among IUCN categories (χ2 = 6.33, df = 7, p > 0.05), with a very small and negative effect size (η2 = −0.0096). Pairwise comparisons further confirmed that no IUCN category pairs differed significantly (p.adj ≥ 0.05). These results indicate no meaningful variation in trophic level associated with extinction risk categories in this dataset.
The Spearman correlation (Figure 10) revealed that the threat level showed positive but weak correlations with length at maturity (Lm, ρ = 0.36) and age at maturity (tm, ρ = 0.34), and a negative correlation with growth rate (K, ρ = −0.32). More pronounced relationships were observed among biological traits. Maximum length (Max Length) was strongly correlated with both Lm (ρ = 0.85) and tm (ρ = 0.65). Additionally, both Lm (ρ = −0.58) and tm (ρ = −0.73) were negatively correlated with the growth coefficient (K).

4. Discussion

This study provides evidence that life history and ecological traits are linked to threat level among European freshwater fish species. Although the statistical associations were generally modest, the biological significance of the observed patterns is consistent with established ecological theory and supports the findings of previous research e.g., refs. [5,8,9]. In a comprehensive trait-based assessment of 443 European freshwater fish species, Jarić et al. [8] reported that species with southern distributions, restricted ranges, low commercial value, smaller body sizes, and slower life history strategies—such as low growth rates and delayed maturity—were significantly more vulnerable to climate change. Their findings underscored the disproportionate impact of climate-related stressors on Mediterranean freshwater species, which are already under considerable anthropogenic pressure, and demonstrated the utility of life history traits in predicting species’ resilience or susceptibility to environmental change.
The observed associations between categorical traits and threat level offer important conservation insights. For instance, body shape did not show a strong link to threat level, suggesting that morphology alone—when disconnected from ecological or behavioral context—has limited predictive power. This underlines the need for integrated approaches that combine structural and functional traits in future risk models.
In contrast, reproductive guild was significantly associated with threat level. Species lacking reproductive trait data (unclassified guilds) were more frequently threatened, highlighting the conservation risks faced by understudied taxa. These may be species with narrow distributions or specialized life cycles—often overlooked in assessments but potentially more vulnerable. Improving trait coverage is essential, as missing data may signal both analytical limitations and real conservation concerns.
Migratory behavior also influenced the threat level. Past studies e.g., refs. [8,22] emphasized the vulnerability of long-distance migratory species to river fragmentation and hydrological alteration. Specifically, Jarić et al. [8] showed that migratory species are among the most affected by anthropogenic barriers—particularly in southern Europe, where river fragmentation, dam construction, and altered flow regimes are especially prevalent. These species depend heavily on habitat connectivity and natural hydrological cycles, making them vulnerable to such disruptions [22,23]. In contrast, our findings indicate that non-migratory species face significantly higher threat levels, likely due to their limited dispersal capacity and confinement to isolated or degraded habitats. Amphidromous species also showed a trend toward higher threat levels, although this was not statistically significant. These results suggest that both dependence on movement and constraints on movement can elevate extinction risk, underscoring the need for species-specific connectivity planning and conservation strategies that account for diverse migratory behaviors [5,24].
The observed association between commercial importance and lower threat levels suggests that species with recognized commercial or minor commercial value may benefit from increased monitoring, management, or data availability. This contrasts with species of no interest or those not assessed, which may face higher extinction risk due to limited attention or conservation oversight. This finding highlights the potential vulnerability of neglected species, particularly in systems already impacted by habitat degradation or overuse [24,25,26].
The analysis of numerical life history traits supports the association between elevated extinction risk and slow life history strategies. Species with delayed maturity, larger body size, and greater body weight were generally more threatened. In particular, Critically Endangered species tended to be the largest, heaviest, and latest-maturing, with significantly higher age at maturity and body weight compared to less threatened categories. These characteristics are consistent with reduced reproductive turnover and limited population resilience—classic indicators of high vulnerability.
These findings align with well-established ecological patterns across taxa: large-bodied, slow-growing species typically face greater extinction risk due to life history traits such as low fecundity and long generation times [27,28,29,30]. In fisheries, these species are often disproportionately targeted, further compounding their susceptibility [31,32]. From a management perspective, such species require cautious, long-term strategies, as they are less resilient to overexploitation and slower to recover, warranting more precautionary harvest limits [33,34].
Interestingly, while age at maturity and body weight showed significant associations with threat status, other traits such as maximum age and length at maturity (Lm) did not show significant differences across IUCN categories. This may reflect high within-category variability, limited sample sizes, or potential data quality issues. Despite the lack of significance for maximum age, CR species did exhibit the highest average values, suggesting a potential ecological trend worth further exploration.
Growth-related traits (e.g., von Bertalanffy parameters) offered additional insight. Although K and L∞ did not differ significantly between threat categories, the parameter t0 did show significant variation, with a moderate effect size. However, due to its theoretical nature and sensitivity to model fitting, t0 should be interpreted cautiously and not as a standalone biological indicator. Overall, these results reinforce the view that species with slower life history strategies—characterized by delayed maturation and reduced growth rates—may face elevated extinction risk. Yet, it’s important to note that small-bodied species, particularly those with restricted ranges or subject to localized pressures, can also be highly vulnerable, especially under increasing climatic and anthropogenic stressors [35,36].
Conversely, trophic level was not associated with threat level, diverging from patterns observed in marine fish, mammals, and birds, where top predators are often more threatened [30,37]. In freshwater fish, extinction risk appears more strongly tied to life history pace than to dietary position. This lack of association may reflect a genuinely weaker or more context-dependent relationship between trophic level and extinction risk in freshwater systems, where ecological roles are often more flexible and less hierarchically structured. Additionally, the available data may not adequately capture trophic dynamics due to variability in feeding strategies across species and limited resolution in trophic classifications. These factors could obscure any underlying patterns and suggest the need for more detailed dietary and ecological data in future analyses.
The Spearman correlation analysis, though limited to species with complete data, confirmed biologically meaningful patterns. Threatened species tended to mature later, at larger sizes, and exhibited slower growth—traits that are interrelated. For instance, maximum length correlated strongly with both length and age at maturity, while growth rate showed negative correlations with those same maturity traits. Even though the used subset for this analysis may not fully capture the diversity of the full dataset and may be biased toward well-studied species, these findings reflect classic life history trade-offs and validate the broader trends observed in the full dataset.
A key limitation of this study is the lack of phylogenetic control, which may influence trait–threat associations due to shared ancestry among closely related species. Without accounting for phylogenetic non-independence, there is a risk of overestimating the role of certain traits. Although a phylogenetically informed framework would strengthen the analysis, such data were unavailable for the full set of species included. We highlight this as an important direction for future work aiming to refine trait-based extinction risk assessments. Additionally, our analysis did not control for confounding variables such as geographic distribution, habitat type, and varying threat intensities across regions. These ecological and spatial factors likely play a significant role in shaping both species’ traits and their extinction risk. However, due to inconsistent data availability across the dataset, they could not be included in the present analysis. Future studies should aim to incorporate these dimensions to improve the accuracy and ecological relevance of trait–risk models. Finally, the IUCN Red List may contain geographical and taxonomic biases, with better-studied or commercially important species more likely to be assessed. In contrast, lesser-known taxa or those from under-surveyed regions are often underrepresented or listed as data deficient. These biases may affect the distribution of threat categories and the availability of trait data, potentially influencing the generalizability of our findings.
Collectively, our results highlight that threat level is rarely driven by a single trait. Instead, it emerges from complex interactions among ecological and biological characteristics, many of which are interdependent. Even within the constraints of data availability, consistent patterns suggest that life history traits are powerful indicators of conservation vulnerability. Trait-based approaches can enhance species risk assessment, particularly in data-poor systems, and help prioritize conservation actions in a more targeted and biologically grounded manner.

5. Conclusions

This study highlights the relevance of life history and ecological traits in understanding extinction risk among Europe’s autochthonous freshwater fish species. While effect sizes were generally modest, several traits exhibited consistent and biologically meaningful associations with IUCN threat levels. Particularly, elevated threat levels are observed in species that are non-migratory or have limited dispersal capacity, depending on fragmented freshwater systems. Species with missing reproductive trait data were disproportionately found in higher threat categories, indicating both conservation vulnerability and key data gaps. While not all growth traits show statistically significant differences across threat levels, consistent patterns support the link between slow life histories and increased threat. Trait-based assessments can enhance conservation prioritization, especially in data-deficient and under-monitored freshwater ecosystems. Improving trait datasets—particularly for reproduction and migration—is essential for refining threat evaluations and guiding proactive conservation strategies.

Author Contributions

Conceptualization: O.P. and D.C.B.; developing methods: O.P.; conducting the research: O.P.; data analysis: O.P.; data interpretation and reparation of figures and tables: O.P.; writing: O.P. and D.C.B.; editing: O.P. and D.C.B. All authors have read and agreed to the published version of the manuscript.

Funding

This research received no external funding.

Data Availability Statement

The data supporting the findings of this study are available within the paper. For additional information, please contact the corresponding author.

Conflicts of Interest

The authors declare no conflicts of interest.

References

  1. Strayer, D.L.; Dudgeon, D. Freshwater biodiversity conservation: Recent progress and future challenges. J. N. Am. Benthol. Soc. 2010, 29, 344–358. [Google Scholar] [CrossRef]
  2. Pelayo-Villamil, P.; Guisande, C.; Vari, R.P.; Manjarrés-Hernández, A.; García-Roselló, E.; González-Dacosta, J.; Heine, J.; Vilas, L.G.; Patti, B.; Quinci, E.M. Global diversity patterns of freshwater fishes—Potential victims of their own success. Divers. Distrib. 2015, 21, 345–356. [Google Scholar] [CrossRef]
  3. Tedesco, P.A.; Beauchard, O.; Bigorne, R.; Blanchet, S.; Buisson, L.; Conti, L.; Cornu, J.-F.; Dias, M.S.; Grenouillet, G.; Hugueny, B. A global database on freshwater fish species occurrence in drainage basins. Sci. Data 2017, 4, 170141. [Google Scholar] [CrossRef] [PubMed]
  4. Gozlan, R.E.; Karimov, B.K.; Zadereev, E.; Kuznetsova, D.; Brucet, S. Status, trends, and future dynamics of freshwater ecosystems in Europe and Central Asia. Inland Waters 2019, 9, 78–94. [Google Scholar] [CrossRef]
  5. Markovic, D.; Carrizo, S.F.; Kärcher, O.; Walz, A.; David, J.N. Vulnerability of European freshwater catchments to climate change. Glob. Change Biol. 2017, 23, 3567–3580. [Google Scholar] [CrossRef]
  6. Costa, M.J.; Duarte, G.; Segurado, P.; Branco, P. Major threats to European freshwater fish species. Sci. Total Environ. 2021, 797, 149105. [Google Scholar] [CrossRef] [PubMed]
  7. Xenopoulos, M.A.; Lodge, D.M.; Alcamo, J.; Märker, M.; Schulze, K.; Van Vuuren, D.P. Scenarios of freshwater fish extinctions from climate change and water withdrawal. Glob. Change Biol. 2005, 11, 1557–1564. [Google Scholar] [CrossRef]
  8. Jarić, I.; Lennox, R.J.; Kalinkat, G.; Cvijanović, G.; Radinger, J. Susceptibility of European freshwater fish to climate change: Species profiling based on life-history and environmental characteristics. Glob. Change Biol. 2019, 25, 448–458. [Google Scholar] [CrossRef]
  9. Comte, L.; Olden, J.D. Evolutionary and environmental determinants of freshwater fish thermal tolerance and plasticity. Glob. Change Biol. 2017, 23, 728–736. [Google Scholar] [CrossRef]
  10. Bender, M.G.; Floeter, S.R.; Mayer, F.P.; Vila-Nova, D.A.; Longo, G.O.; Hanazaki, N.; Carvalho-Filho, A.; Ferreira, C.E.L. Biological attributes and major threats as predictors of the vulnerability of species: A case study with Brazilian reef fishes. Oryx 2013, 47, 259–265. [Google Scholar] [CrossRef]
  11. MacLean, S.A.; Beissinger, S.R. Species’ traits as predictors of range shifts under contemporary climate change: A review and meta-analysis. Glob. Change Biol. 2017, 23, 4094–4105. [Google Scholar] [CrossRef]
  12. IUCN. The IUCN Red List of Threatened Species. Version 2025-1. Available online: https://www.iucnredlist.org (accessed on 10 January 2025).
  13. Froese, R.; Pauly, D. (Eds.) FishBase, version (02/2025); World Wide Web Electronic Publication. Available online: https://www.fishbase.org (accessed on 26 July 2025).
  14. Myers, G.S. Usage of anadromous, catadromous and allied terms for migratory fishes. Copeia 1949, 1949, 89–97. [Google Scholar] [CrossRef]
  15. McDowall, R.M. On amphidromy, a distinct form of diadromy in aquatic organisms. Fish Fish. 2007, 8, 1–13. [Google Scholar] [CrossRef]
  16. Northcote, T.G. Potamodromy in Salmonidae—Living and Moving in the Fast Lane. N. Am. J. Fish. Manag. 1997, 17, 1029–1045. [Google Scholar] [CrossRef]
  17. Boettiger, C.; Lang, D.T.; Wainwright, P.C. rfishbase: Exploring, manipulating and visualizing FishBase data from R. J. Fish Biol. 2012, 81, 2030–2039. [Google Scholar] [CrossRef] [PubMed]
  18. Wickham, H.; François, R.; Henry, L.; Müller, K.; Vaughan, D. dplyr: A Grammar of Data Manipulation. R Package Version 1.1.4. Available online: https://dplyr.tidyverse.org (accessed on 26 July 2025).
  19. Wickham, H. ggplot2: Elegant Graphics for Data Analysis; Springer: New York, NY, USA, 2016; ISBN 978-3-319-24277-4. Available online: https://ggplot2.tidyverse.org (accessed on 26 July 2025).
  20. Kassambara, A. R Package, version 0.1.4.1; ggcorrplot: Visualization of a Correlation Matrix Using ‘ggplot2’. Available online: https://CRAN.R-project.org/package=ggcorrplot (accessed on 26 July 2025).
  21. Kassambara, A. rstatix: Pipe-Friendly Framework for Basic Statistical Tests. R Package Version 0.7.2. Available online: https://cran.r-project.org/web/packages/rstatix/index.html (accessed on 26 July 2025).
  22. Liermann, C.R.; Nilsson, C.; Robertson, J.; Ng, R.Y. Implications of dam obstruction for global freshwater fish diversity. BioScience 2012, 62, 539–548. [Google Scholar] [CrossRef]
  23. Clavero, M.; Hermoso, V.; Levin, N.; Kark, S. Biodiversity research: Geographical linkages between threats and imperilment in freshwater fish in the Mediterranean Basin. Divers. Distrib. 2010, 16, 744–754. [Google Scholar] [CrossRef]
  24. Jonsson, B.; Waples, R.S.; Friedland, K.D. Extinction considerations for diadromous fishes. ICES J. Mar. Sci. 1999, 56, 405–409. [Google Scholar] [CrossRef]
  25. Navodaru, I.; Staras, M.; Cernisencu, I. The challenge of sustainable use of the Danube Delta Fisheries, Romania. Fish. Manag. Ecol. 2001, 8, 323–332. [Google Scholar] [CrossRef]
  26. Cowx, I.G.; Gerdeaux, D. The effects of fisheries management practises on freshwater ecosystems. Fish. Manag. Ecol. 2004, 11, 145–151. [Google Scholar] [CrossRef]
  27. Bennett, P.M.; Owens, I.P.F. Variation in extinction risk among birds: Chance or evolutionary predisposition? Proc. R. Soc. B Biol. Sci. 1997, 264, 401–408. [Google Scholar] [CrossRef]
  28. Jennings, S.; Reynolds, J.D.; Polunin, N.V.C. Predicting the vulnerability of tropical reef fishes to exploitation with phylogenies and life histories. Conserv. Biol. 1999, 13, 1466–1475. [Google Scholar] [CrossRef]
  29. Reynolds, J.D.; Jennings, S.; Dulvy, N.K. Life histories of fishes and population responses to exploitation. In Conservation of Exploited Species; Reynolds, J.D., Mace, G.M., Redford, K.H., Robinson, J.G., Eds.; Cambridge University Press: Cambridge, UK, 2001; pp. 147–168. [Google Scholar]
  30. Cardillo, M.; Mace, G.M.; Gittleman, J.L.; Purvis, A. Latent extinction risk and the future battlegrounds of mammal conservation. Proc. Natl. Acad. Sci. USA 2006, 103, 4157–4161. [Google Scholar] [CrossRef] [PubMed]
  31. Dulvy, N.K.; Ellis, J.R.; Goodwin, N.B.; Grant, A.; Reynolds, J.D.; Jennings, S. Methods of assessing extinction risk in marine fishes. Fish Fish. 2004, 5, 255–276. [Google Scholar] [CrossRef]
  32. Stevens, J.D.; Bonfil, R.; Dulvy, N.K.; Walker, P.A. The effects of fishing on sharks, rays, and chimaeras (chondrichthyans), and the implications for marine ecosystems. ICES J. Mar. Sci. 2000, 57, 476–494. [Google Scholar] [CrossRef]
  33. Musick, J.A. Criteria to define extinction risk in marine fishes: The American fisheries society initiative. Fisheries 1999, 24, 6–14. [Google Scholar] [CrossRef]
  34. Garcia, S.M.; Rice, J.; Charles, A. Balanced harvesting in fisheries: A preliminary analysis of management implications. ICES J. Mar. Sci. 2016, 73, 1668–1678. [Google Scholar] [CrossRef]
  35. Pinsky, M.L.; Jensen, O.P.; Ricard, D.; Palumbi, S.R. Unexpected patterns of fisheries collapse in the world’s oceans. Proc. Natl. Acad. Sci. USA 2011, 108, 8317–8322. [Google Scholar] [CrossRef]
  36. Graham, N.A.; Chabanet, P.; Evans, R.D.; Jennings, S.; Letourneur, Y.; MacNeil, M.A.; McClanahan, T.R.; Öhman, M.C.; Polunin, N.V.C.; Wilson, S.K. Extinction vulnerability of coral reef fishes. Ecol. Lett. 2011, 14, 341–348. [Google Scholar] [CrossRef]
  37. Myers, R.A.; Worm, B. Extinction, survival or recovery of large predatory fishes. Philos. Trans. R. Soc. B Biol. Sci. 2005, 360, 13–20. [Google Scholar] [CrossRef]
Figure 1. Number of autochthonous species (endemic and native) per family and IUCN status. NE: Not Εvaluated, DD: Data Deficient, LC: Least Concern, NT: Near Threatened, VU: Vulnerable, EN: Endangered, CR: Critically Endangered, EX: Extinct.
Water 17 02254 g001
Figure 2. Endemic (a) and native (b) species in European inland waters per IUCN category. Abbreviations are as defined in Figure 1.
Water 17 02254 g002
Figure 3. Number of autochthonous species evaluated per year under the IUCN Red List criteria.
Water 17 02254 g003
Figure 4. Number of autochthonous species categorized by (a) body shape, (b) reproductive guild, (c) migration behavior, and (d) commercial importance across IUCN threat categories. Abbreviations are as defined in Figure 1.
Water 17 02254 g004
Figure 5. Box plots showing the distribution of IUCN threat level (1 = Least Concern, to 6 = Extinct) across species categorized by: (a) body shape, (b) reproductive guild, (c) migration behavior, and (d) commercial importance. Each box represents the interquartile range (IQR), with the horizontal line indicating the median and whiskers extending to 1.5 × IQR. Mean threat levels are marked with x. The number of species per bar, as in Figure 4. Colors correspond to IUCN threat categories as abbreviated in Figure 1.
Water 17 02254 g005
Figure 6. Box plots showing the range of the (a) maximum reported length, (b) weight, and (c) age for the autochthonous European freshwater fish species for which information was available based on their IUCN classification. The horizontal black line indicates the median, the × represents the mean, and the dots outside the whiskers denote outliers. Numbers in parentheses represent the number of species. Abbreviations are as defined in Figure 1.
Water 17 02254 g006
Figure 7. Box plots showing the range of (a) Lm and (b) tm for the autochthonous European freshwater fish species, respectively, for which information was available based on their IUCN classification. The horizontal black line indicates the median, the × represents the mean, and the dots outside the whiskers denote outliers. Numbers in parentheses represent the number of species. Abbreviations are as defined in Figure 1.
Water 17 02254 g007
Figure 8. Box plots showing the range of von Bertalanffy growth parameters (a) K, (b) L∞, (c) M, and (d) t0 for the autochthonous European freshwater fish species for which information was available based on their IUCN classification. The horizontal black line indicates the median, the × represents the mean, and the dots outside the whiskers denote outliers. Numbers in parentheses represent the number of species. Abbreviations are as defined in Figure 1.
Water 17 02254 g008
Figure 9. Box plots showing the range of the trophic level for the autochthonous European freshwater fish species for which information was available based on their IUCN classification. The horizontal black line indicates the median, the × represents the mean, and the dots outside the whiskers denote outliers. Numbers in parentheses represent the number of species. Abbreviations are as defined in Figure 1.
Water 17 02254 g009
Figure 10. Spearman correlation heatmap among extinction risk and biological traits for 72 autochthonous fish species reported in European inland waters.
Water 17 02254 g010
Disclaimer/Publisher’s Note: The statements, opinions and data contained in all publications are solely those of the individual author(s) and contributor(s) and not of MDPI and/or the editor(s). MDPI and/or the editor(s) disclaim responsibility for any injury to people or property resulting from any ideas, methods, instructions or products referred to in the content.

